Article

Assessing the Combined Effect of Water Temperature and Complex Water Matrices on Xanthate Adsorption Using Multiple Linear Regression

1
Department of Bioproducts and Biosystems, School of Chemical Engineering, Aalto University, FIN-00076 Aalto, Finland
2
Centre for Minerals Research, Chemical Engineering Department, University of Cape Town, Rondebosch, Cape Town 7701, South Africa
3
VTT Technical Research Centre of Finland Ltd., FI-02044 Espoo, Finland
4
Department of Forest Biomaterials and Technology, Swedish University of Agricultural Sciences, Skogsmarksgränd, SE-90183 Umeå, Sweden
*
Author to whom correspondence should be addressed.
Minerals 2020, 10(9), 733; https://doi.org/10.3390/min10090733
Submission received: 10 July 2020 / Revised: 4 August 2020 / Accepted: 14 August 2020 / Published: 19 August 2020
(This article belongs to the Section Mineral Processing and Extractive Metallurgy)

Abstract

:
The combined effect of dissolved ions and water temperature on the adsorption of a xanthate collector on chalcopyrite and pentlandite was investigated using multiple linear regression. Cationic species improved the adsorption of the collector on sulphide minerals through xanthate adsorption activation. Thiosulphate ions generally had a negative effect on collector adsorption, and the interaction of thiosulphate ions and cations effectively reduced collector adsorption on the sulphide minerals. With regards to temperature variation caused by seasonal variation, this study suggests that temperature can influence the adsorption of collectors in the flotation process and this should be approached on a case by case basis as it seems to differ with the type of mineral under investigation. These fundamental results prompt a discussion on how complex water matrices can affect interactions of reagents and sulphide minerals at the solid–liquid interface and the possible effect on flotation performance.

1. Introduction

As the restrictions on water usage become prevalent throughout the world, mining operations have shifted focus to water recycling and mitigating the adverse effects of mining on the surrounding environment. The most prevalent inorganic ions in recycled plant waters are Ca2+, Mg2+, Na+, S2O32− and SO42−. These ions exist in plant water as a result of ore dissolution or they are introduced in the form of reagents such as those used to modify the operating pH in various units [1,2,3]. Recycled plant water constituents interact with and may change the properties of any of the three phases involved in flotation: mineral particles, air bubbles and aqueous solution. These changes could subsequently affect the efficiency of the three sub-processes occurring sequentially in a flotation cell: the mineral particle and bubble collision, attachment of minerals to the bubbles, and the subsequent formation of stable particle–bubble aggregates that rise to the froth zone [2].
Currently, there are a few studies on the impact of water temperature on interfaces in flotation and the actual influence of temperature on the interaction mechanisms occurring at the solid–liquid and liquid–gas interfaces are yet to be fully established. The effect of temperature on flotation has been reported to be important in mines operating in territories located in cold climates, e.g., in Sweden and Canada [4,5]. Temperature variations may be more evident and reflected in flotation rates and flotation reaction kinetics as a result of changes in ore dissolution rates, pulp viscosity and froth stability. Other parameters that may not be so evident but are of great importance are reagent dissolution, reagent adsorption on mineral surfaces and alterations in dissolved oxygen content in the process water [6,7].
One common limitation of studies on flotation water chemistry is that they approach the multifaceted topic on a case by case basis i.e., analysing the role of one water parameter (variable) at a time [2]. The current work will consider the design of experiments and multiple linear regression to quantify the effect of complex water matrices and temperature on reagent adsorption.

2. Materials and Methods

2.1. Materials

2.1.1. Mineral Sample Preparation

A relatively pure chalcopyrite sample sourced from Ward’s Natural Science Establishment (New York, NY, USA) and a pentlandite concentrate (enriched pentlandite) obtained from Boliden Kevitsa Mine, Finland were used in the study. The purity of the mineral samples was analysed using XRD and the results are presented in Table 1. As seen, the chalcopyrite was 80% pure with the major impurity being quartz. The enriched pentlandite (25% pentlandite) contained pyrrhotite as a sulphide gangue whilst the major silicate bearing minerals were talc and amphiboles. The remainder of the concentrate was made up of various pyroxene minerals. The chalcopyrite mineral sample was first pulverised using a ring mill. Both the chalcopyrite and the pentlandite concentrate were sieved to obtain particle sizes of less than 75 μm. The minerals were then split into representative 1 g quantities. The samples were placed in a bottle, purged with nitrogen and stored in the freezer at −15 °C. To regenerate the sulphide mineral surfaces on the pentlandite concentrate, washing with hydrochloric acid was employed [8]. 4 g of concentrate was added for 50 mL of boiling 6 M HCl for 15 min. A beaker containing the concentrate-acid mixture was placed in an ultra-sonicating water bath for 30 min to loosen the particles and allow further cleaning of the mineral samples. The samples were retrieved and filtered with repeated rinsing using 2 washes of 50 mL of boiling 6 M HCl, one wash with distilled water and a wash with 150 mL of warm acetone. The samples were dried in a vacuum oven at 20 °C for 5 h before immediate use in adsorption tests. Pentlandite is sensitive to oxidation [9], hence, the mineral samples were used immediately after drying. To test the effectiveness of cleaning, the qualitative cling test was used [10].

2.1.2. Plant Water

Synthetic plant water was used throughout as the complex water matrix. Synthetic plant waters were prepared by modifying distilled water through the addition of inorganic salts at the appropriate amounts to meet the experimental design parameters (see Table 2). This ensured the synthetic plant waters contained the right amount of ions typically found at the Boliden Kevitsa mine site in Finland. The inorganic salts used were namely, magnesium nitrate hexahydrate, calcium chloride dihydrate, sodium chloride and thiosulphate. Chloride and nitrate anions were chosen as counter ions since previous studies have not reported on the significance of these ions in influencing flotation performance. The concentration of ions at the Kevitsa plant according to a confidential 2017 plant water survey, ranged between 10 and 600 mg/L. In this study, it was decided to consider future waters where the concentration of ions would increase with water recycling. Therefore, for the 2 level factorial design of experiment, two ion concentration levels chosen namely, 200 mg/L (lower level) and 1000 mg/L (upper level). Water temperatures in Kevitsa can be as low as 5 °C in the winter and in the summer months, pulp temperatures can be as high as 35 °C. To expand the understanding of temperature effects at the solid-liquid interface, higher temperatures were factored in to capture temperatures in hot regions such as Australia were pulp temperatures can be as high at 50 °C [11], and the mill temperature can be as high as 50–60 °C. The design levels for the plant water temperatures were, therefore, 5 °C (lower level) and 65 °C (upper level).

2.2. Adsorption Experimental Procedure

One gram of the mineral sample was added to 25 mL of a chosen water matrix. The mixture was placed in a shaking water bath at the desired temperature, allowing for 2 min of conditioning. Sodium isobutyl xanthate (SIBX) provided by Senmin, Pty, Sasolburg, South Africa, was used as the thiol collector. The slurry was conditioned for 30 min at pH 8.5–9 with 1% SIBX at an initial xanthate concentration of 3.125 mg/L in solution. Adsorption tests were conducted at three temperatures namely, 5 °C, 35 °C and 65 °C. Ice was added to the water bath to maintain a temperature of 5 °C, whilst water matrix samples tested at the higher temperatures were heated on a heating plate to 35 and 65 °C, respectively, before being placed in the shaking water bath running at a corresponding temperature. The slurry was immediately filtered after 30 min of conditioning using 0.45 μm filters from Merck Millipore Ltd., Dublin, Ireland, and the filtrate was analysed for residual xanthate using the Shimadzu UV spectrophotometer at a wavelength of 301 nm.

2.3. Experimental Design

A 2k−1 half fractional factorial statistical design (where k = 5) was used to investigate the effect of five factors (Ca2+, Mg2+, Na+ and S2O32− concentrations and solution temperature [T]) on xanthate adsorption on the sulphide mineral surfaces. Two levels of temperature and ion concentration were investigated. These levels were (5 and 65 °C) and 200 and 1000 mg/L, respectively. The half fractional factorial design for k = 5 resulted in 16 experiments with 3 extra experiments added as centre points, making a total of 19 experiments as shown in Table 2. In most previous studies, each of these factors was investigated independently (one variable at a time (OVAT) method) or in binary ionic systems whilst the remaining factors were held constant or were absent. Investigating experimental factors in that way is inefficient as it disregards the possibility of interactions between factors [12,13,14]. By employing the fractional factorial design on the 5 aforementioned factors, the aim was to acquire as much information as possible regarding the influence of these factors on collector adsorption with a limited number of experiments. Since only half of the full factorial design is run, each of the 2k (k = 5) effects is confounded with one other effect. Confounding of variables occurs when the effects of factors in the design cannot be separated from each other i.e., if A, B, C and D are variables, then if A is confounded with BCD then the overall effect of A is the sum of factors A and BCD as presented in Table 3 [15].
The relationship between the independent variables and observed responses were evaluated using multiple linear regression in MODDE software version 8.0 (developed by UMetrics, Umea, Sweden). The software used coded variables in developing the model, where the lower value (200 mg/L and 5 °C) was represented by “−1”, the upper value (1000 mg/L and 65 °C) was represented by “+1” and the centre points were represented by “0”. The empirical first order model obtained through multiple linear regression analysis is of the form:
y   =   C 0   + i C i x i   +   j C i j x i x j
where y is the response (adsorption), C0 is a constant, Ci and Cij are coefficients of regression, xi and xixj are coded variables representing a single variable and interacting variables, respectively. The statistical significance of the terms Ci and Cij were obtained from the ANOVA analysis [16].

3. Results

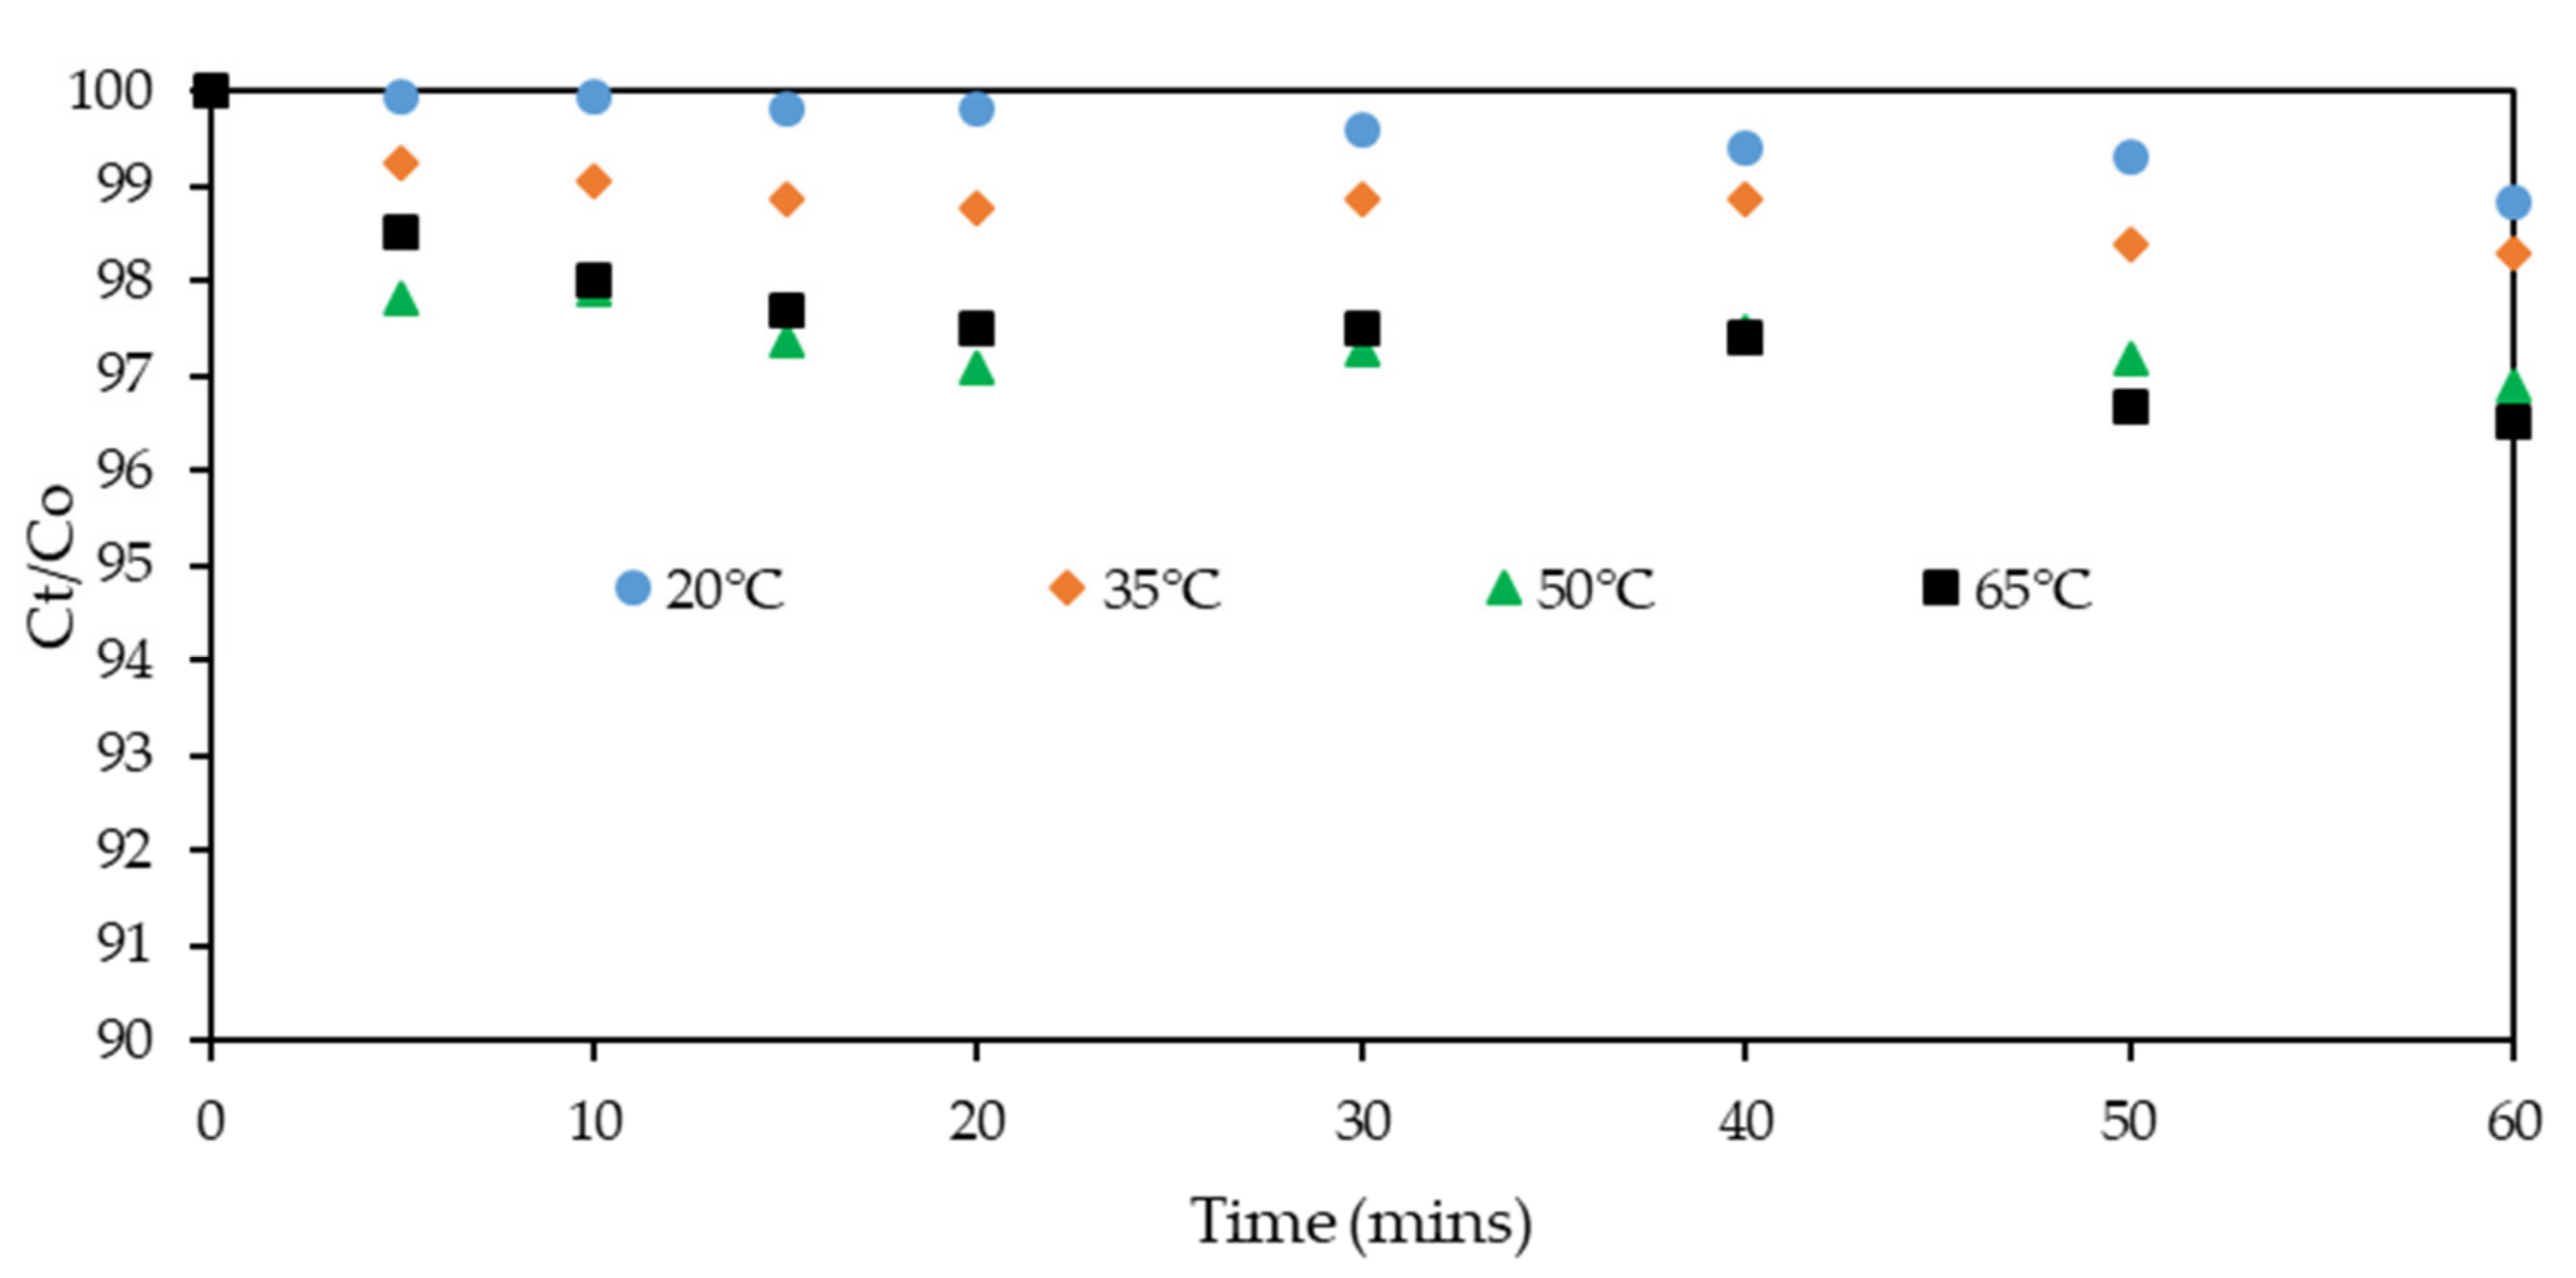
3.1. Effect of Temperature on Xanthate Solution Degradation

The results presented in Figure 1 were used to validate the (in)significance of temperature on xanthate degradation.Ct/C0 (SIBX concentration at any time (t)/Initial SIBX concentration) in distilled water, was monitored over 1 h. After 1 h of monitoring, it was observed that minimal xanthate degradation in distilled water had occurred at all 4 temperatures tested (20, 25, 50 and 65 °C). Two Way ANOVA was used to test the significance of the results. There was a statistically insignificant difference in average values of Ct/C0 as the time was changed, p value (0.37) > 0.05, but the differences in average values of Ct/C0 were statistically significant as the temperature changed, p value (6.35 × 10⁻⁷) < 0.05 (refer to Supplementary Materials for the ANOVA tables). Although there is a statistically significant difference in average Ct/C0 as temperature changes it must be remembered that the differences lie within a 2% range as seen in Figure 1. Based on these results. It was assumed that any change in xanthate concentration was a result of the collector adsorbing on the sulphide minerals and that the temperatures bear no effect on the decomposition of xanthate within the conditioning time.

3.2. Xanthate Adsorption on Chalcopyrite

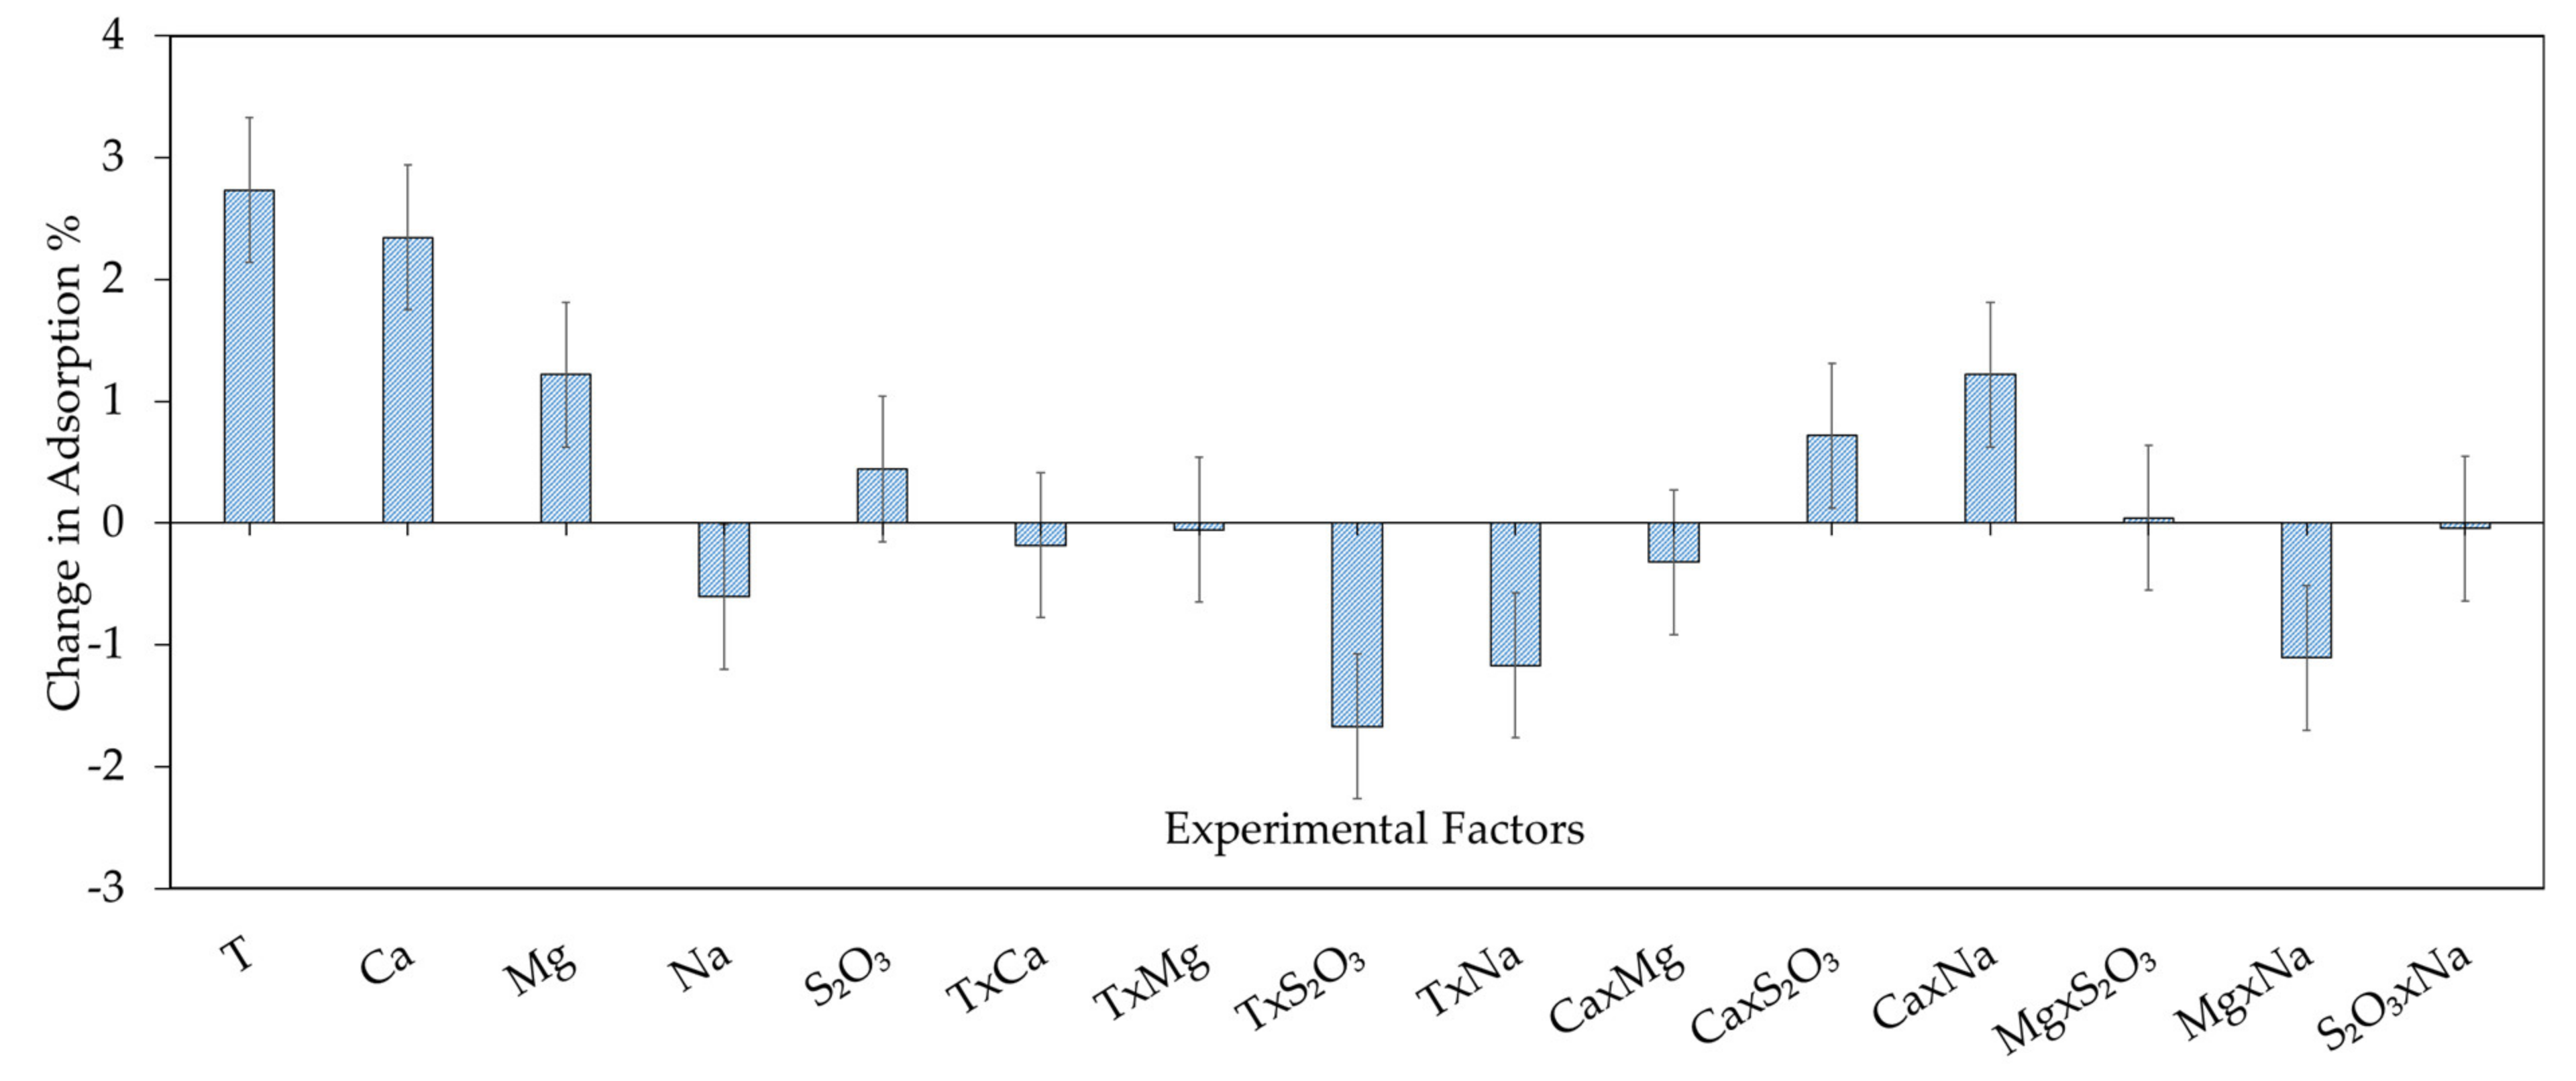
3.2.1. Xanthate Adsorption on Chalcopyrite—Model Development and Model Analysis

Table 2 summarizes the responses (extent of collector adsorption) at the different solution conditions. These results were used in generating the empirical equations modelling the influence of different ions and temperature on collector adsorption.
Figure 2 shows the generated linear regression coefficients for the adsorption runs conducted on chalcopyrite. As shown in the illustration, adsorption can be affected by single variable influences and interactions between water constituents in solution. The y-axis describes the average change in predicted values when the factor decreases/increases one coded unit i.e., from the design centre point to the lower or upper value. For example, if temperature alone is considered, the maximum change in absolute adsorption that can occur when the mineral slurry mixture temperature is raised from 5 to 65 °C is 2 × 2.7% units.
If the p-value is <0.05 there is a less than 5% chance that the effect describes noise. One could thus say that with >95% confidence the factor has a systematic effect on the extent of collector adsorption on the sulphide mineral. The confidence intervals statistically show which factors had a significant effect or lack thereof on the adsorption of collector molecules on the mineral surface under the given conditions. All the single factors i.e., T, Ca2+, Mg2+, S2O32− and Na+ have an influence on collector adsorption on chalcopyrite. However, some of the interactions between these variables have no statistically significant effect on collector adsorption and are characterized by p values greater than 0.05 (p > 0.05) e.g., the interaction between water temperature and Ca2+, (T × Ca2+) which has a p value of 0.4. Insignificant terms in Figure 2 are shown to have confidence intervals crossing over from positive to negative changes in percentage adsorption. This crossover includes zero (a point of no effect). These terms were removed from the final empirical model.
The refined empirical model coefficients obtained after removing insignificant terms are presented in Table 4. The table summarises the key variables and variable interactions that were found to be statistically significant with their respective P values which, when adjusted in the final model, lie within the 95% confidence level. The final empirical equation based on coded levels was created using statistically significant variables and is presented as:
Adsorption (%) = 88.1 + 2.73T + 2.34Ca2+ + 0.44S2O32− − 0.61Na+ + 1.22Mg2+ − 1.67(T × S2O32−) − 1.17(T × Na+) + 0.72(Ca2+ × S2O32−) + 1.22(Ca2+ × Na+) − 1.11(Mg2+ × Na+)
It is worth remembering that the empirical model is generated using “coded” factor levels. It is therefore not correct to calculate the predicted values of Adsorption (%) by multiplying the level values in Table 2 with the coefficients presented in Equation (2) as the values in Table 2 are based on a different “coordinate” system.
As seen in Table 2, the final model has an R2 value of 0.989 which suggests that the model can explain 99% of the variation in the original data set. The associated ANOVA table is presented in Table 5. The model can be said to be statistically significant with an insignificant lack of fit.
Model validation is important as it justifies the degree to which the modelling exercise can predictively mimic the xanthate adsorption process. Cross-validation of the trained model expands the robustness of the modelling exercise from a mere curve fitting to an actual predictive technique. Cross validation instead of external test parameters was used to evaluate the predictive power of the model. Subsets of the initial training set were used to generate subset calibrated models using the leave one out (LOO) technique. Taking the prominent LOO cross-validation as an example, M subsets containing M-1 compounds would be generated, and the target property of each compound could subsequently be predicted from the subset calibrated model, whose associated subset did not contain that specific compound [17,18]. The residuals between the experimental and observed extents of adsorption were used to calculate the correlation coefficient of LOO cross-validation i.e., R2 predicted (R2pred). The R2pred value obtained through cross- validation suggests that the chalcopyrite model could explain 93% of the variation when the model is reproduced whilst excluding arbitrary samples. Essentially the model works well in predicting the chalcopyrite system.

3.2.2. Eh Monitoring during SIBX Adsorption onto Chalcopyrite

Figure 3 shows that at lower temperatures (5 °C), the system is more oxidative than at higher temperatures (65 °C), which are comparatively, more reducing. This is in line with oxygen being more soluble in water at lower temperatures, thereby, increasing the dissolved oxygen content (DO) in cold water. It can allude to temperature playing a role similar to oxidising and reducing agents such as those used in literature by Chimonyo et al. [19] and Ekmeki et al. [20] in altering slurry Eh conditions. Figure 3 also shows that at the same temperature with varying ionic concentrations (experimental runs), there is no significant change in Eh.
Interestingly, the low temperature and oxygen rich environment did not inherently increase the overall adsorption extent of xanthate in the case of chalcopyrite. Theoretically, the cathodic oxygen reduction reaction facilitates the anodic oxidation of xanthate into decomposition products on the sulphide mineral surfaces, forming metal xanthates and in some cases dixanthogen according to Equations (3)–(6) [21,22,23].
Xads + e = X
M2+ + 2X = MX2
X2ads + 2e = 2X
O2 + 2H2O +4e = 4OH
Based on Equations (3)–(6) it could suggest that the increased oxygen content at lower temperatures results in a higher degree of xanthate adsorption (reaction of xanthate on the sulphide surface) due to the increase in DO in solution consumed by the cathodic reaction although the linear model and previous authors [24,25] also did not observe such phenomena. It is important to note that other parameters besides oxygen content have an effect on collector adsorption on the chalcopyrite surface. This leads to the idea that dissolved ions in solution and temperature both play a critical role in xanthate adsorption on mineral surfaces either through passivation or activation of sulphide mineral surfaces sites.

3.2.3. Xanthate Adsorption on Chalcopyrite—Discussion of Experimental Observations

Within the experimental design range, temperature, Ca2+ and Mg2+ ions had the most noteworthy influence on the extent of xanthate adsorption on chalcopyrite. Studies conducted by Dávila-Pulido et al. [26], showed that Ca2+ cations in solution at pH values below pH 10, had a positive effect on xanthate adsorption onto sphalerite, a sulphide mineral. The authors suggested a mechanism linked to the reduction of negative charge on the mineral surface which attracts xanthate collectors to the mineral surface for the oxidation of xanthate to occur. Bulut and Yenial [27], observed that zeta potentials of sphalerite and galena in alkaline solutions of Ca2+ and Mg2+ became more positive with an increase in cation concentration thus presenting a positively charged surface which promotes xanthate attraction to the mineral surface and improves floatability. Given that the chalcopyrite investigated in the current study is a sulphide mineral with a negatively charged surface, Ca2+ and Mg2+ cations may have acted on the surface of the mineral similarly to what was previously discussed. The cations neutralised the charge on the mineral surface and promoted xanthate collector anions’ attraction to the mineral surface before chemisorption occurred through the electron transfer oxidation–reduction reaction.
The current study successfully showed that the interactions between water constituents can potentially have an adverse or positive effect on the degree of collector adsorption on the sulphide surface. The results presented in Table 4 showed that the interaction between temperature and the S2O32− ions had a negative effect on adsorption. This is expected as S2O32− ions have been reported to negatively affect adsorption on sulphide minerals through competitively adsorbing on mineral surfaces and forming a copper thiosulphate complex thus preventing hydrophilic species from attaching on chalcopyrite [28]. Petrus et al. [29], confirmed the results of Eliseev and Kirbitova [28], proposing that the formation of the copper thiosulphate complex on the chalcopyrite surface according to Equation (7), resulted in a lower adsorption density of collector on chalcopyrite at alkaline conditions (pH 9), inherently depressing chalcopyrite.
2Cu2+ + 6S2O32− = 2[Cu(S2O3)2]3− + S4O62−
The empirical equation (Equation (2)), showed that the interaction between Ca2+ ions and S2O32− ions has a positive effect on adsorption, however, the positive effect is significantly diminished compared to when Ca2+ ions solely act on the surface without interaction from S2O32− ions i.e., Adsorption = +2.34Ca2+ to Adsorption = +0.74Ca2+ × S2O32−. A similar observation is made for the interaction between Ca2+ and Na+. The strength of S2O32− ions in reducing the adsorption effect of collectors in the presence of cations is noted in the model. Kirjavainen et al. [30], showed that Ca2+ ions had a positive effect on xanthate adsorption on a Cu-Ni ore, though, this was greatly reduced when S2O32− ions were added to the system creating a binary ion solution.
The model showed that temperature had a positive influence on xanthate adsorption on chalcopyrite i.e., as the water temperature increased so did the extent of collector adsorption on the chalcopyrite surface. Mustafa et al. [24], observed that the degree of adsorption of amyl xanthate on chalcopyrite increased with an increase in temperature from 278 to 293 K at pH 8 and 9. Strong et al. [31] observed low residual xanthate concentration in solution after flotation tests at elevated temperatures, which they attributed to the enhanced dixanthogen formation at the mineral surface at elevated temperatures. Although the authors [31] suggest an increase in mineral recovery was a result of temperature influencing the collector species forming on the mineral surface, flotation systems are much more complex. The temperature may influence collector adsorption mechanisms but simultaneously affect ore reactivity (dissolution) which may lead to depression of gangue minerals and consumption of xanthate by thiosalt compounds released into solution as the ore dissolves [11].
The individual significant parameters T and Na, respectively, had a positive and negative effect on collector adsorption, however, the interaction between T and Na had a negative effect on adsorption. It must be noted that confounding as described in Section 3.2, was used to generate the design. The confounding of the interaction between T and Na+ (T × Na+) with the interaction between the Ca2+, Mg2+ and S2O32– (Mg2+ × Ca2+ × S2O32−) gave an overall effect of T × Na+ = [(T × Na+) + (Ca2+ × Mg2+ × S2O32−)]. In this case, there was a contribution from both confounded terms to the collector adsorption. The modelled observation could be based on the (Ca2+ × Mg2+ × S2O32−) term being more dominant than the T × Na+ term and in the case of competitive adsorption of ions and xanthate on the mineral surface, this affects collector adsorption. As a result, what was captured in the model is the latter term’s effect on adsorption.

3.3. Xanthate Adsorption on Enriched Pentlandite

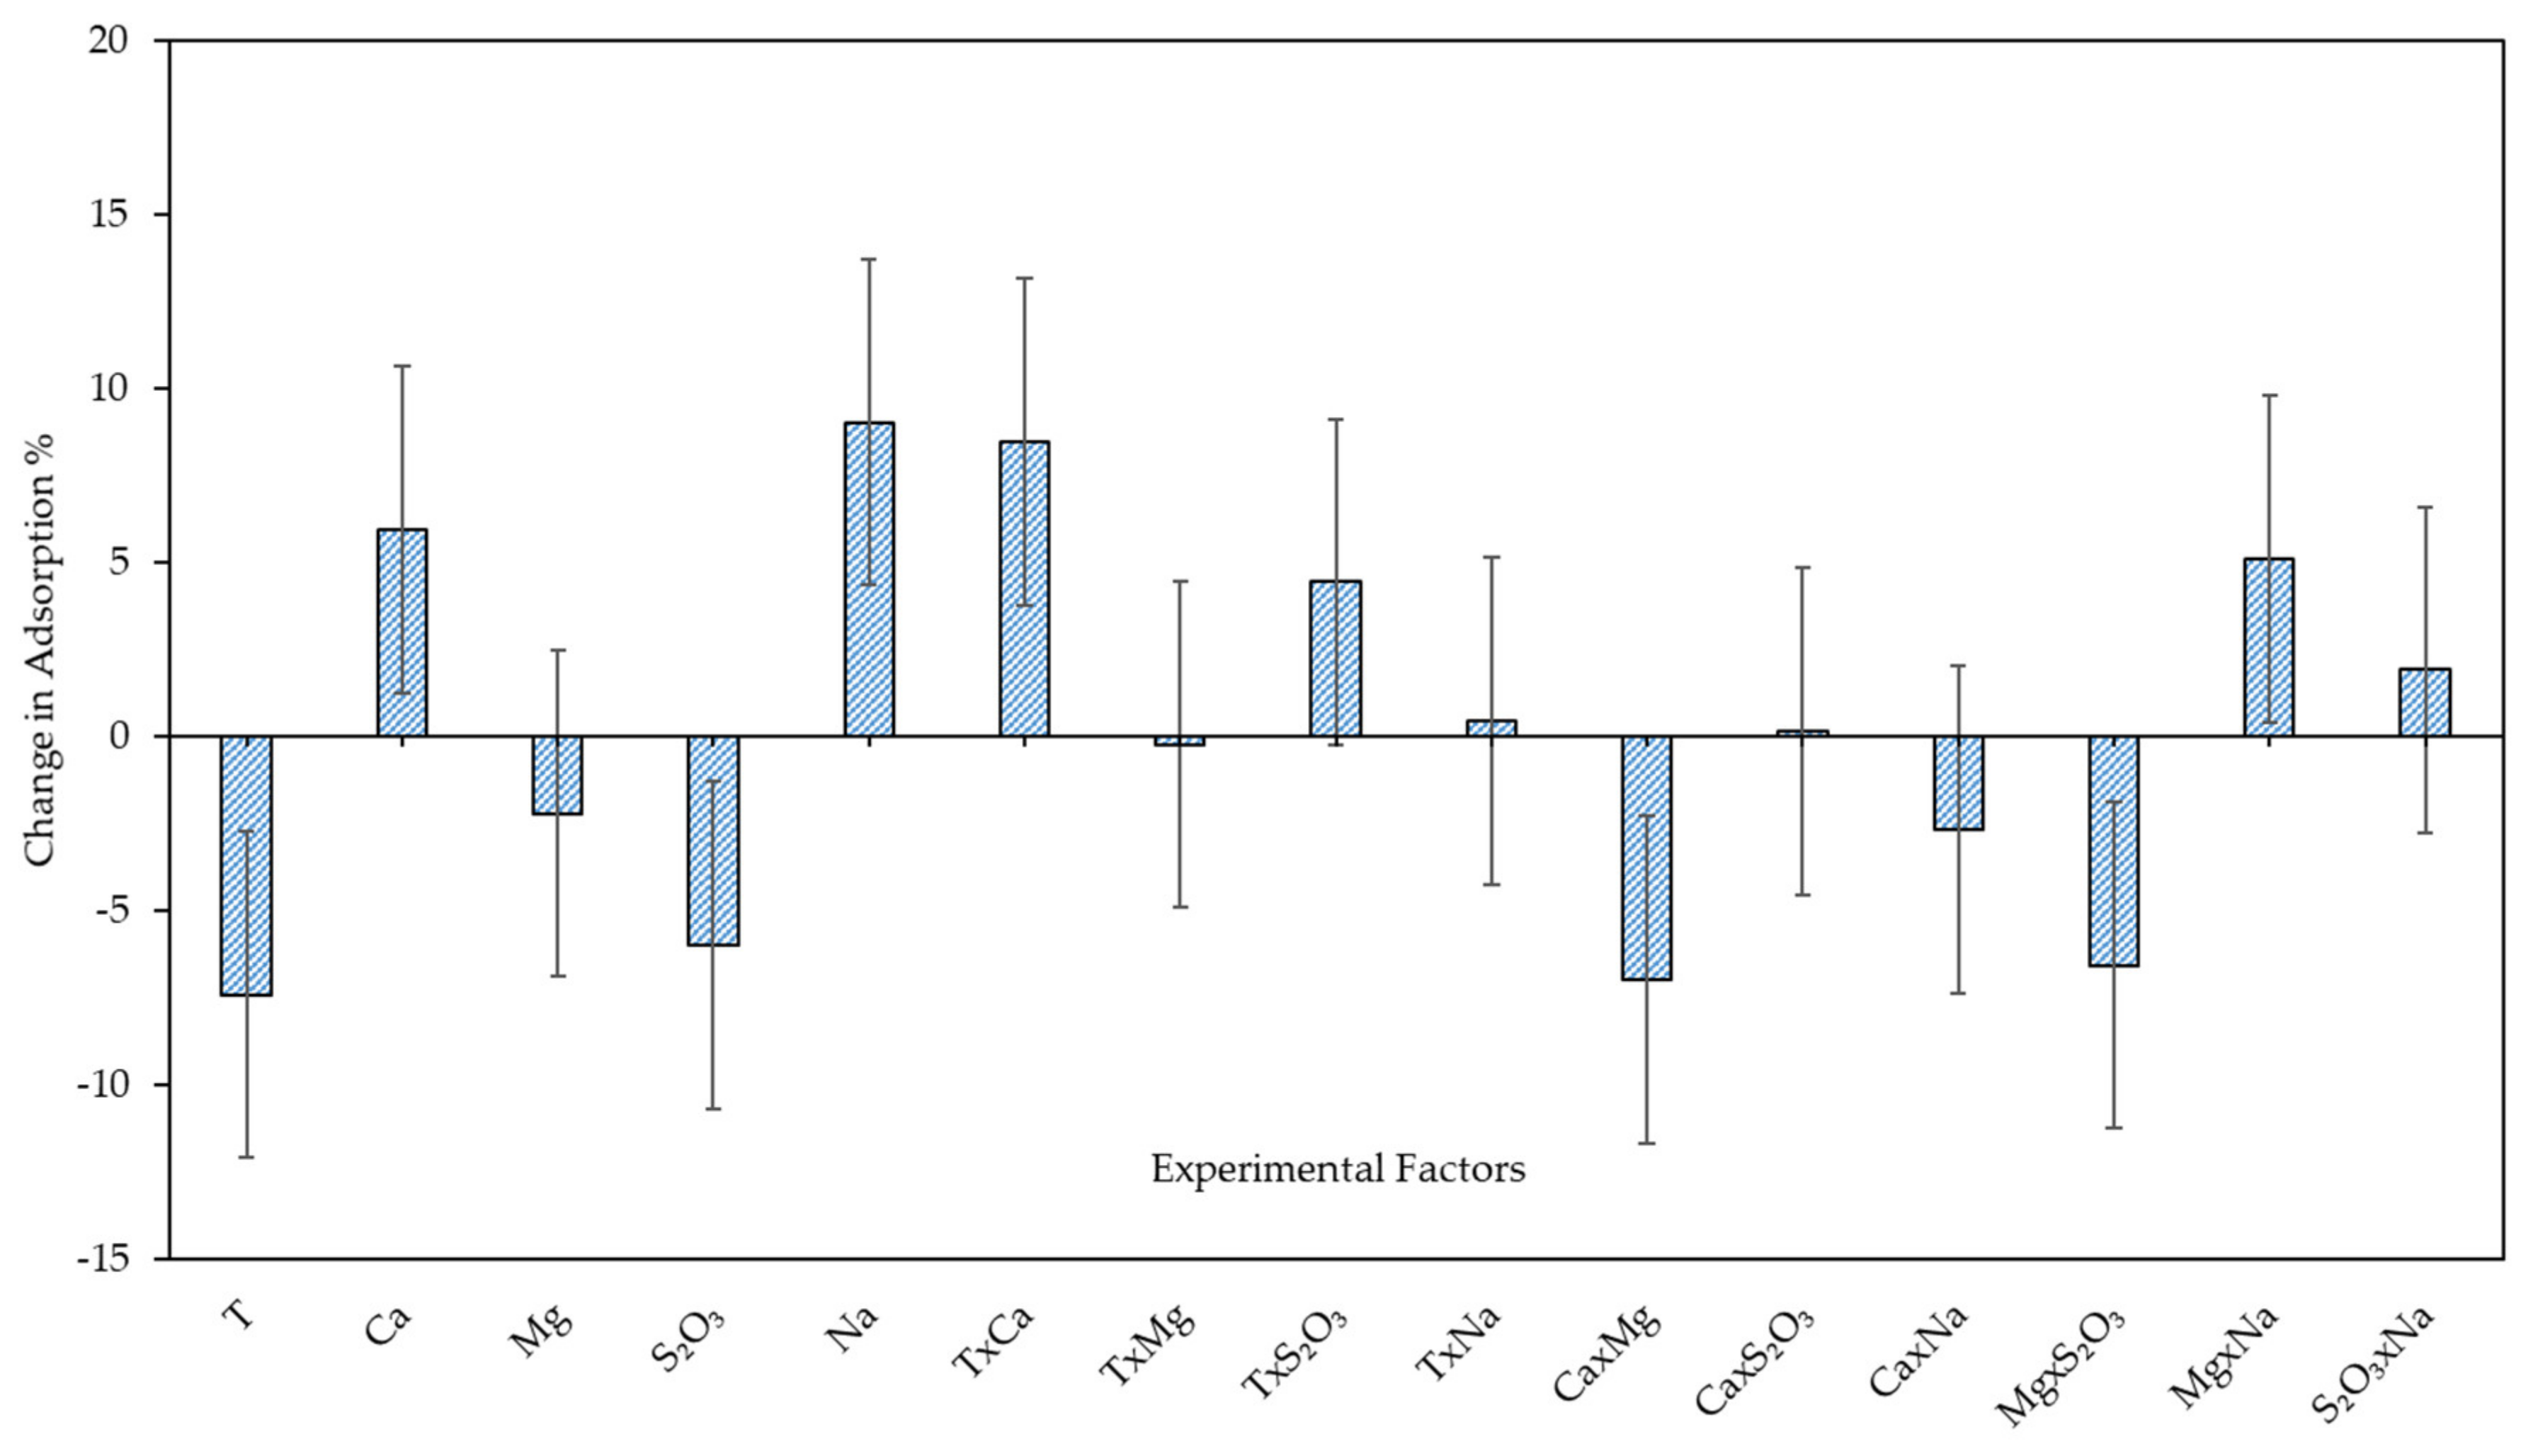
3.3.1. Xanthate Adsorption on Enriched Pentlandite—Model Development and Model Analysis

Figure 4 shows the raw empirical model coefficients that were obtained from multiple linear regression analysis. What is evident from the results is the significant difference in collector adsorption efficacy on chalcopyrite as presented in the previous section and enriched pentlandite at the same solution conditions. Collector adsorption on pentlandite concentrate surfaces appears to be more sensitive to the effect of various water parameters when compared to the adsorption responses observed when chalcopyrite was employed as the test mineral. For example, if temperature alone is considered, the maximum change in absolute adsorption when the mineral slurry temperature is raised from 5 to 65 °C is 2 × 7.4% units. In a similar method used in analysing adsorption results on chalcopyrite, the insignificant variables in the pentlandite concentrate adsorption model were removed. Although the Mg2+ term in Figure 4 seems insignificant, the interaction between Mg2+ ions and Ca2+ ions and the interaction between Mg2+ ions and S2O32− ions are significant hence the Mg2+ term was kept in the final model.
The final empirical model coefficients describing xanthate adsorption on the pentlandite surface are presented in Table 6. Both the single variables and interaction terms have a marked effect on adsorption. The first order empirical equation obtained from this data can be presented as:
Adsorption (%) = 75.4 − 7.4T + 5.95Ca2+ − 2.2Mg2+ − 5.98S2O32− + 9.03Na+ + 4.45T × S2O32− + 8.48T × Ca2+ − 6.98Ca2+ × Mg − 6.55Mg2+ × S2O32− + 5.1Mg2+ × Na+
The model has an R2 value of 0.96 thereby implying that the model was able to explain 96% of the variation in the observed data. The associated ANOVA table on the experimental design is presented as Table 7. The ANOVA analysis suggests that the model is statistically significant with the regression term having an overall p value less than 0.05.

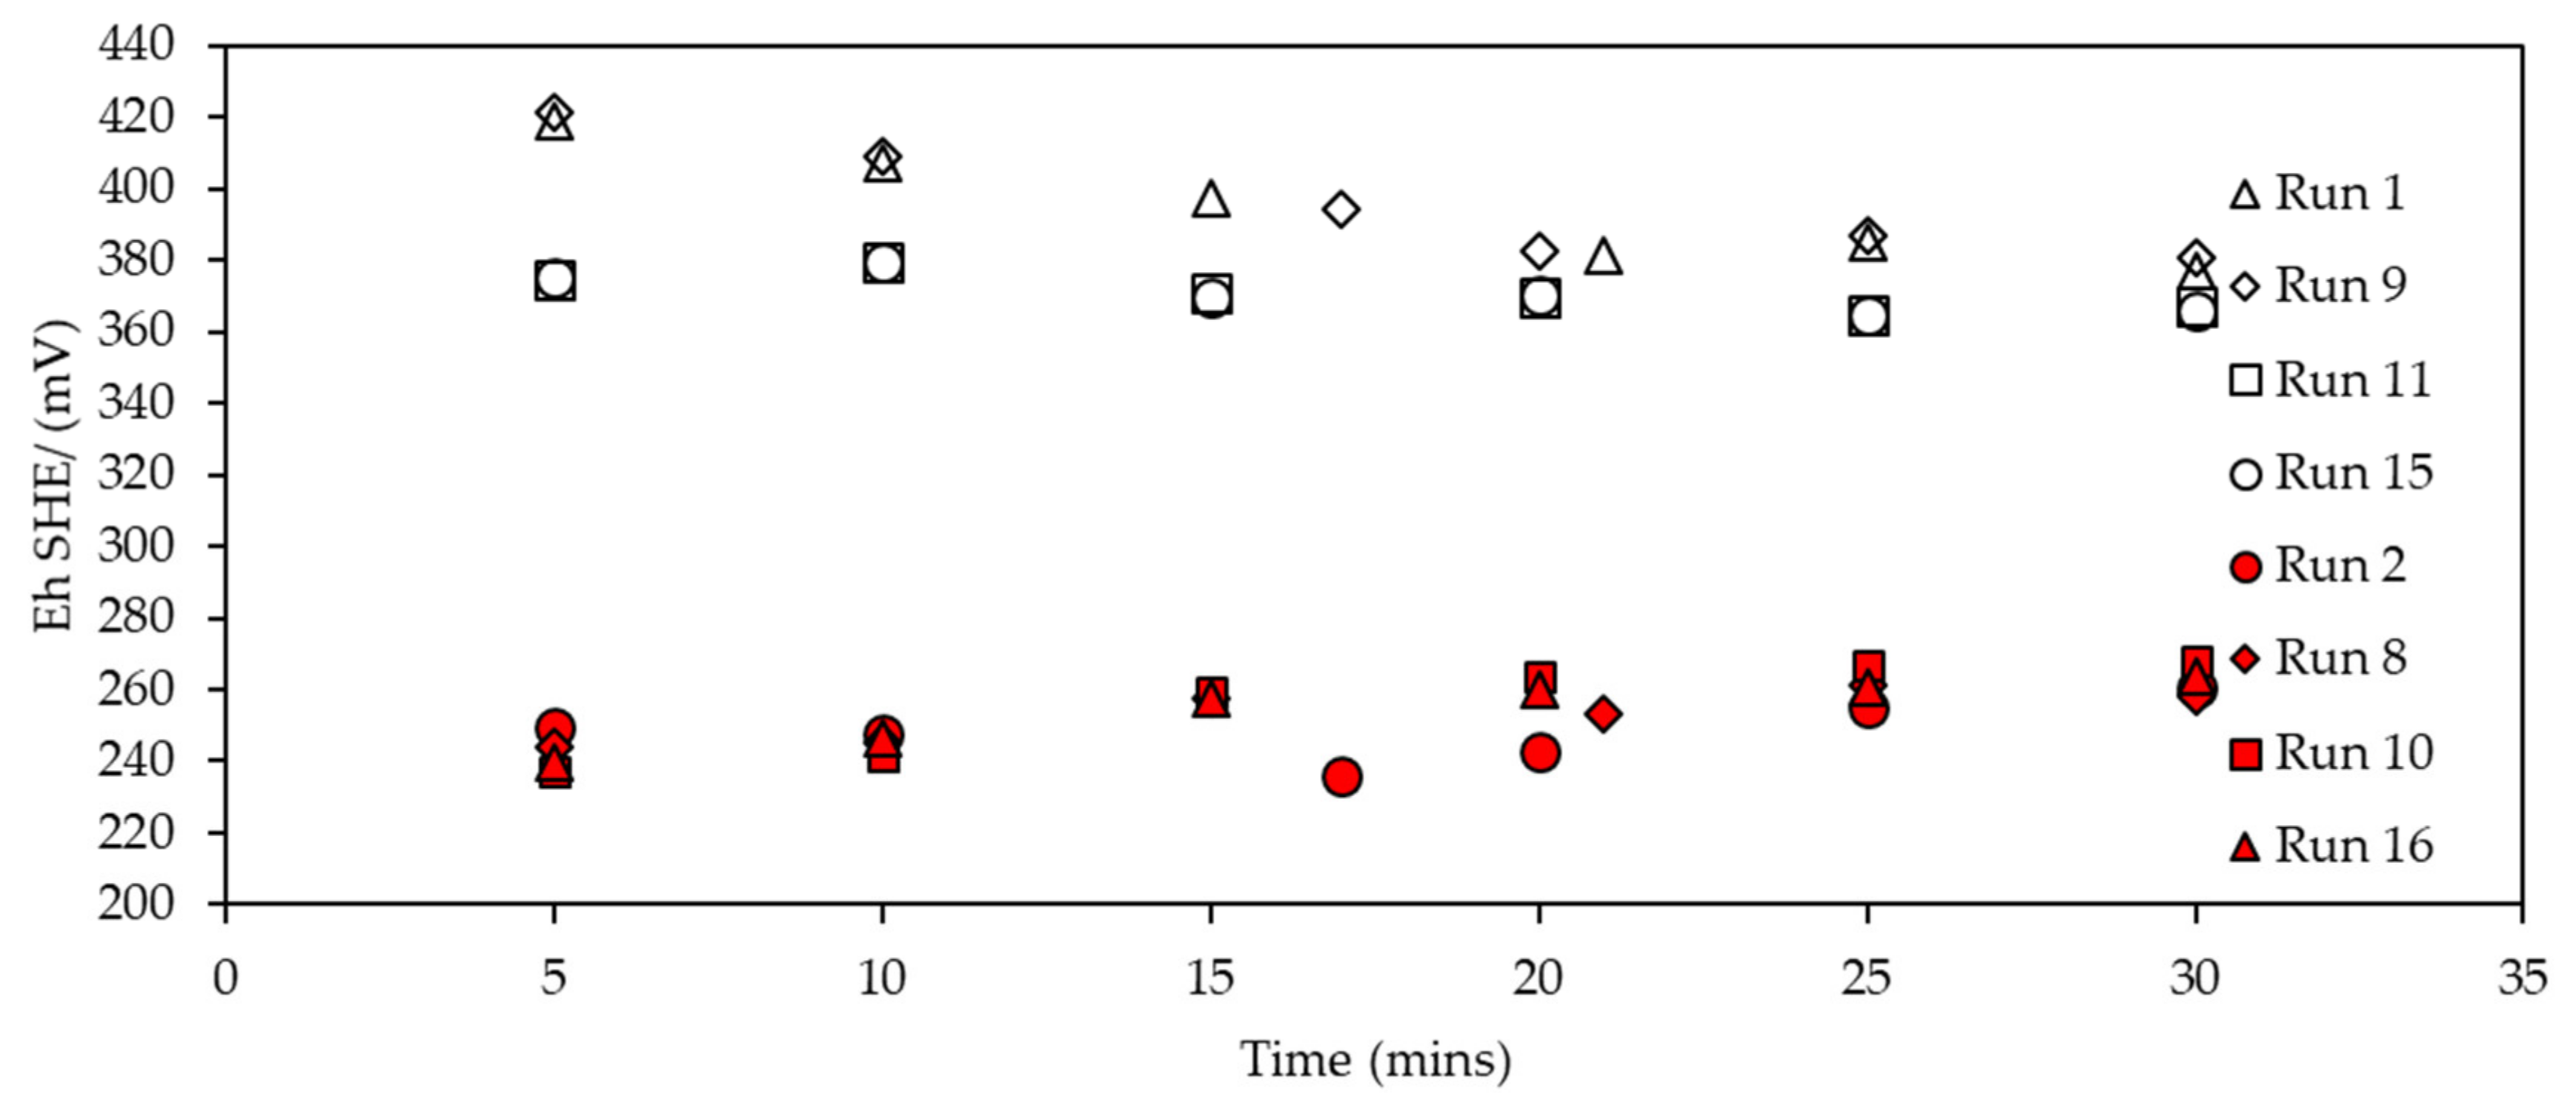
3.3.2. Eh Monitoring during Collector Adsorption on Enriched Pentlandite

Figure 5 shows that for the pentlandite system at the same temperature but in varying water matrices (experimental runs), there is no significant change in Eh. Water matrices at 65 °C start with different Eh values, however as the experiment progresses past the 20 min point, the Eh values converge to almost similar values. Low temperature runs have similar Eh values throughout the adsorption test. The low temperature conditions (5 °C) exhibit an oxidizing environment whilst the high temperature environments are more reducing. This is attributed to the lower DO in high temperature solutions. Of interest is the drop in Eh from +400 mV to +250 mV (Standard Hydrogen Electrode (SHE)), when the temperature was increased from 5 to 65 °C. Although the ionic concentration and ionic strength differ in the different water matrices (experimental runs), the temperature change has the strongest effect on the Eh of water matrices. Moreover, this drop in Eh is more pronounced in the pentlandite system compared to chalcopyrite as observed in Figure 3. It is alluded that the pentlandite mineral is more sensitive to variations in water temperatures.

3.3.3. Xanthate Adsorption on Enriched Pentlandite—Discussion of Experimental Observations

The results from XRD analysis showed that the pentlandite sample used in this study also contained pyrrhotite as a sulphide impurity. This was expected as pentlandite separation from pyrrhotite is not easy owing to the slow floatability of both minerals [32]. At pH 9, pyrrhotite flotation has been reported to be unsatisfactory due to the oxidation and the poor ability of the mineral to act as a catalyst for oxygen reduction, which is a requirement for the electrochemical adsorption of xanthate on sulphide minerals [33]. The results for this study were thus more inclined to the pentlandite fraction of the concentrate sample although bearing in mind that xanthate adsorption onto pyrrhotite was possible and the presence of ions in the water matrix could also affect collector adsorption on the pyrrhotite surfaces.
The presence of the positively charged Ca2+ ions in solution increased the amount of collector adsorbed on the enriched sulphide mineral surfaces (Adsorption % = +5.95Ca2+). The Na+ ions in solution also markedly improve the adsorption of the collector on the mineral surface. This could be a result of the activation of the pentlandite surface when both the xanthate anions and solution cations were acting on the surface sites. Kirjavainen et al. [30], observed that Ca2+ cations at flotation conditions favouring pH 9, activated nickel sulphides of a Cu-Ni ore with increased nickel recoveries as the calcium concentration increased. Nickel sulphide surface activation has been previously discussed in the literature. Kerr [34], reported on the importance of nickel activation through the addition of Cu2+ cations in copper sulphate to nickel concentrators processing nickel sulphides with extremely low copper content. The copper cations react with the nickel sulphide surface, generating copper sulphide sites which readily interact with xanthate collector ions. Interestingly Mg2+ ions had a negative effect on adsorption (Adsorption % = −2.19Mg2+) yet these cations usually have the same effect as Ca2+ ions on xanthate adsorption as shown by Bulut and Yenial [27]. Considering the operating pH employed, the most prevalent Mg2+ species in solution would be Mg2+ and MgOH+ ions with minimal MgOH precipitates. A feasible explanation for this anomaly would be an unusually high presence of MgOH precipitates at the test conditions which could have prevented collector molecules from adsorbing on the mineral. This would have to be confirmed with a thorough surface analysis technique. Thiosulphate ions were observed to reduce xanthate adsorption on the mineral surface (Adsorption % = −5.98S2O32−). The results obtained in this study supported results presented by Schreithofer [35], where the author demonstrated the surface adsorption impedance of S2O32− anions on xanthate collector molecules thereby confirming that S2O32− anions in solution adversely affect collector adsorption on pentlandite. Hodgson and Agar [36] reported on Ca2+ and S2O32− ions exhibiting surface activity on both pentlandite and pyrrhotite. This surface activity influenced xanthate adsorption on both minerals. The authors [36] further proposed that competitive adsorption of Ca2+, S2O32− and xanthate on pentlandite leads to poor xanthate adsorption whereas only Ca2+ resulted in the need to increase xanthate dosages to attain pyrrhotite hydrophobicity.
The current study showed that high temperatures negatively impact on xanthate adsorption on nickel sulphides. This is contradictory to the observations made in the series of experiments on chalcopyrite adsorption studies and observations made by Mustafa et al. [37] when studying temperature effects on collector adsorption on chalcopyrite surfaces. So far, it is not clear why the lower temperatures could favour more collector adsorption on pentlandite. One theory that could explain this observation lies in the higher amount of DO at cold temperatures. The higher DO favours the redox reaction (Equations (3)−(6)) on the sulphide surface thus promoting collector adsorption. In comparison to chalcopyrite, pentlandite is a slow floating and sensitive mineral, which weakly attaches to xanthate collector ions. A shift in electrochemical conditions brought about by the temperature differences could have affected the degree of xanthate adsorption.
The empirical model showed that the interaction between Mg2+ and S2O32 ions had a negative effect on adsorption (Adsorption % = −6.55Mg2+ × S2O32−) which can be alluded to the combined effect of the negative effect of S2O32− ions and in this case the Mg2+ ions on collector adsorption. Kirjavainen et al. [30] reported that the interaction between the cations and S2O32− anions would reduce the extent of adsorption from when there were no S2O32− anions in solution. It can, therefore, be suggested that even in the presence of Mg2+ and MgOH+ ions, the dominant effect of S2O32− ions still played a significant role in reducing the amount of collector adsorption on pentlandite. The interaction between the Ca2+ and Mg2+ also exhibited a negative effect on collector adsorption, however, because it was confounded with the effect between T, Na+ ions and S2O32− ions (Ca2+ × Mg2+ = Ca2+ × Mg2+ + T × Na+ × S2O32−), the negative effect could also have been largely influenced by the contribution of the T × Na+ × S2O32− which is made up of two out of three parameters that have a negative effect on adsorption in their singular form i.e., the temperature and S2O32− concentration. The interaction between the Mg2+ and Na+ ions had a positive influence which can be attributed to the strong positive effect of Na+ ions on collector adsorption on the pentlandite as previously discussed.

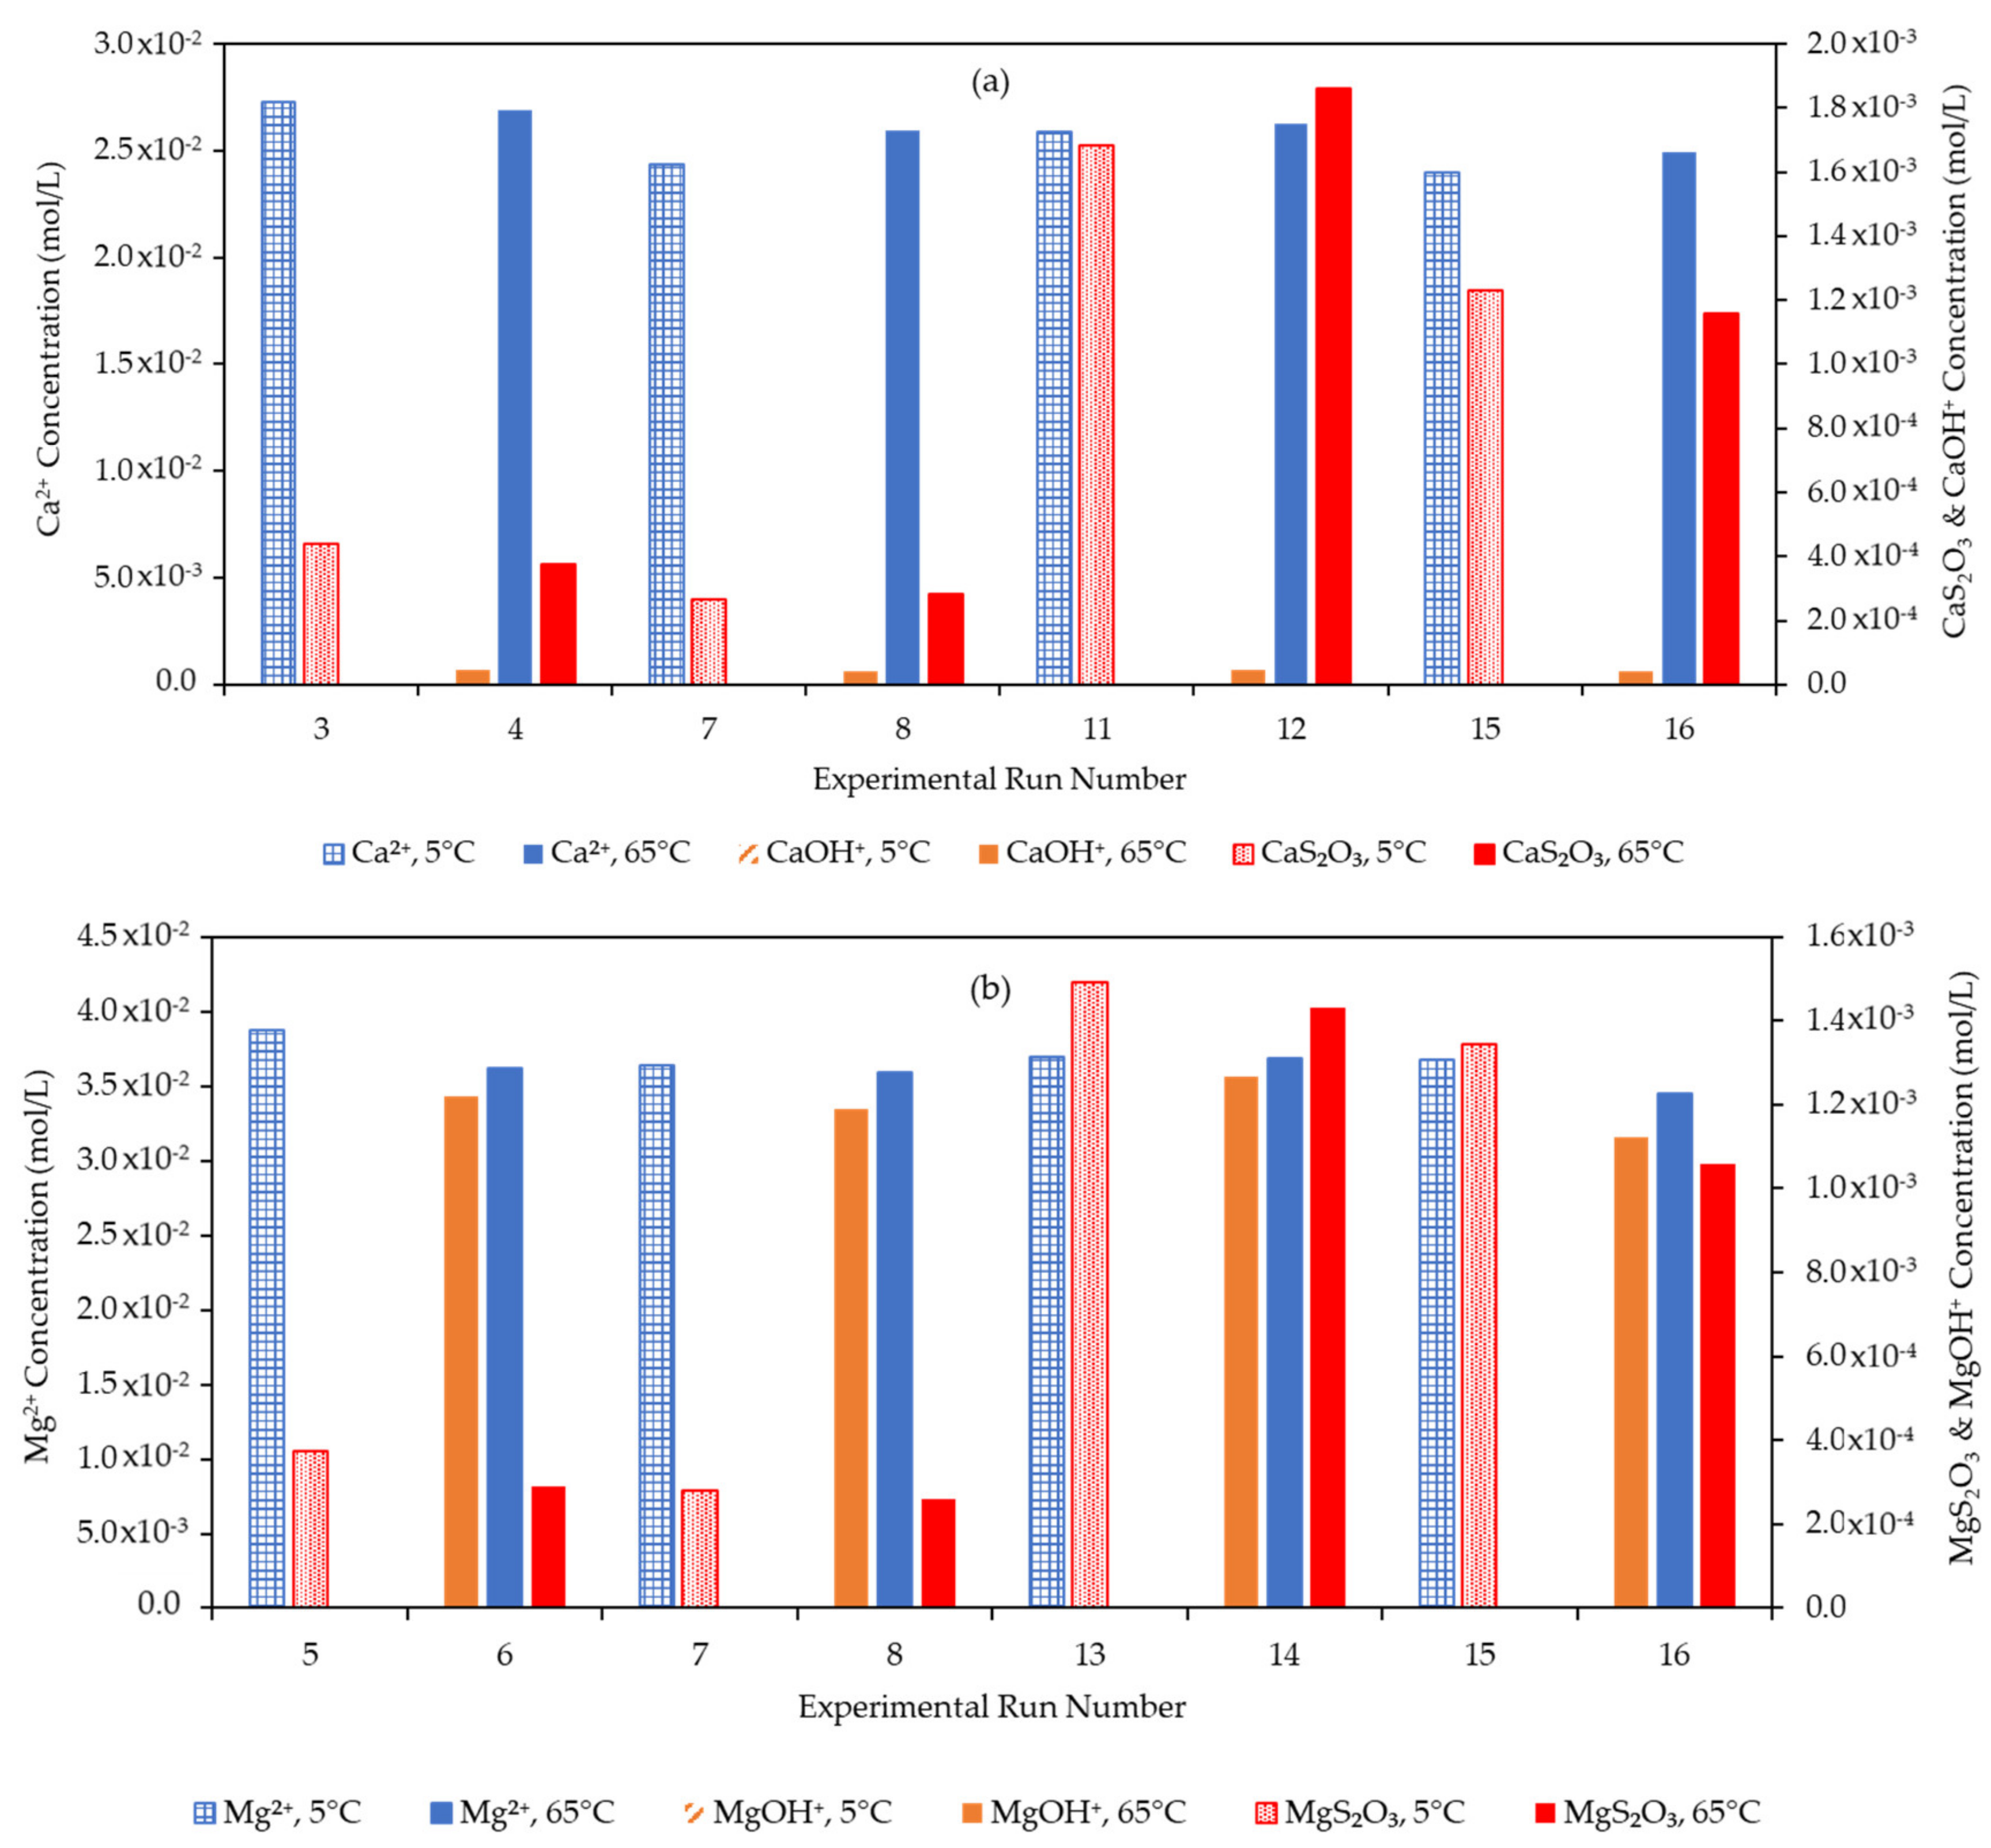
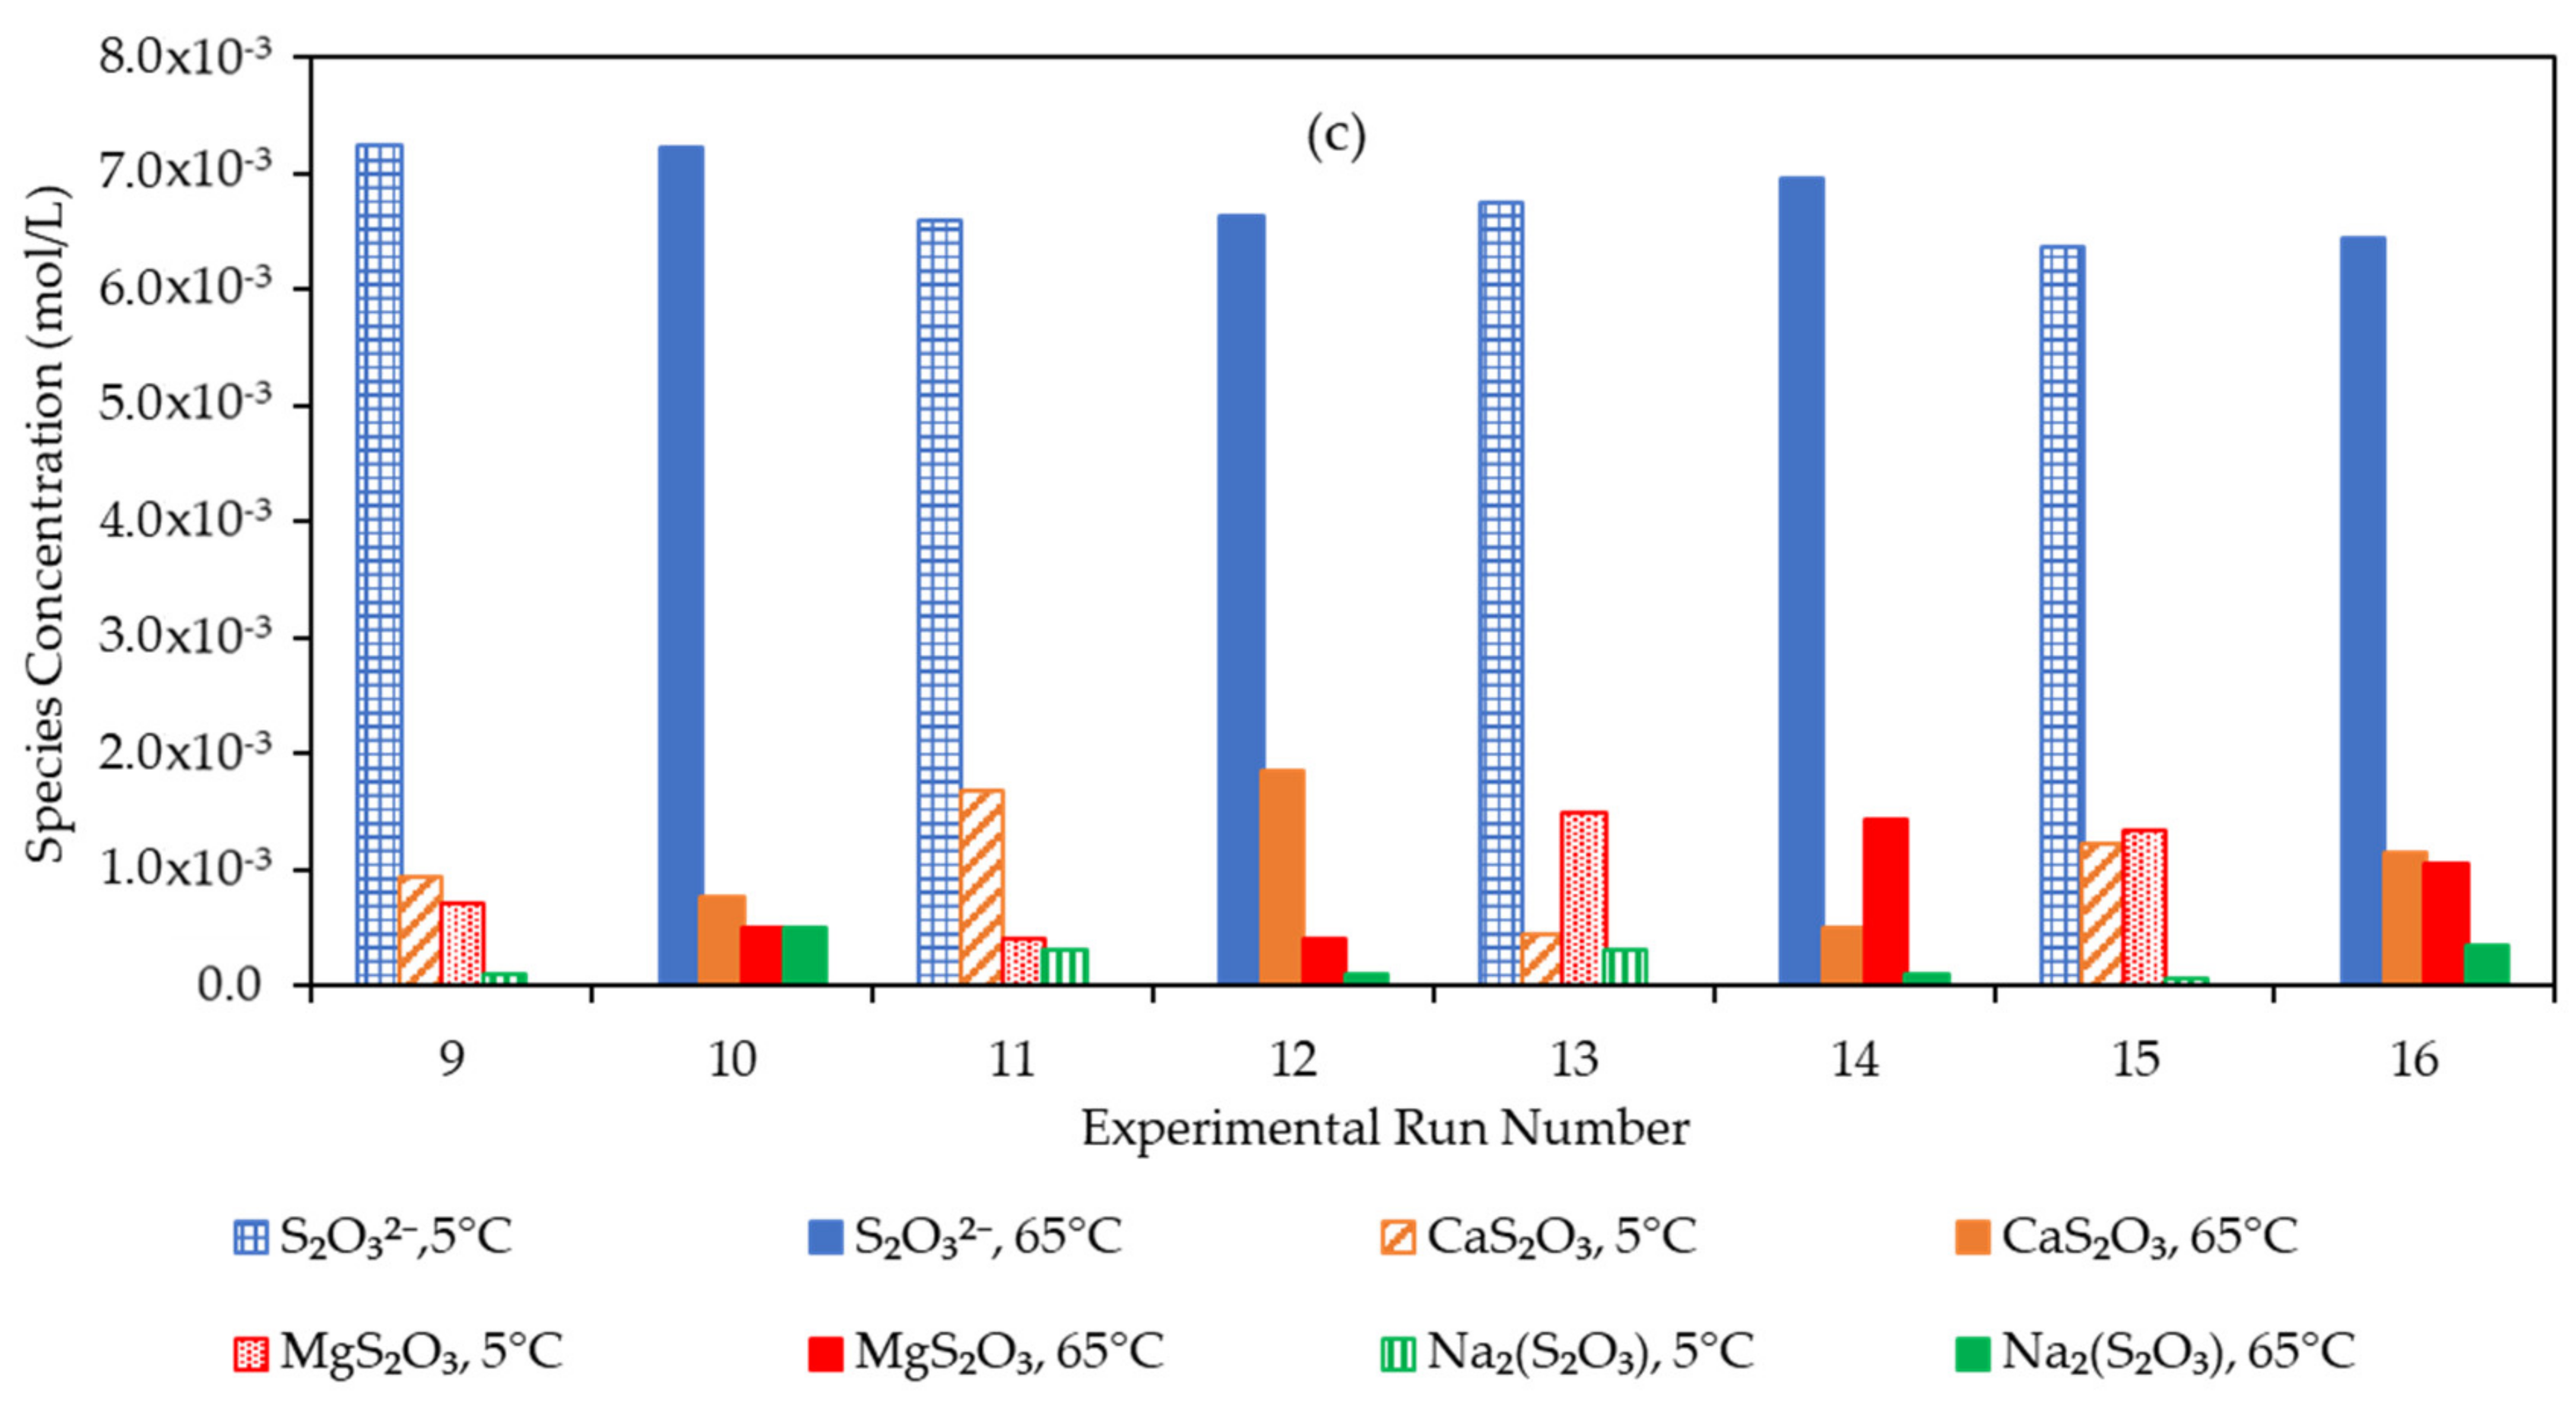
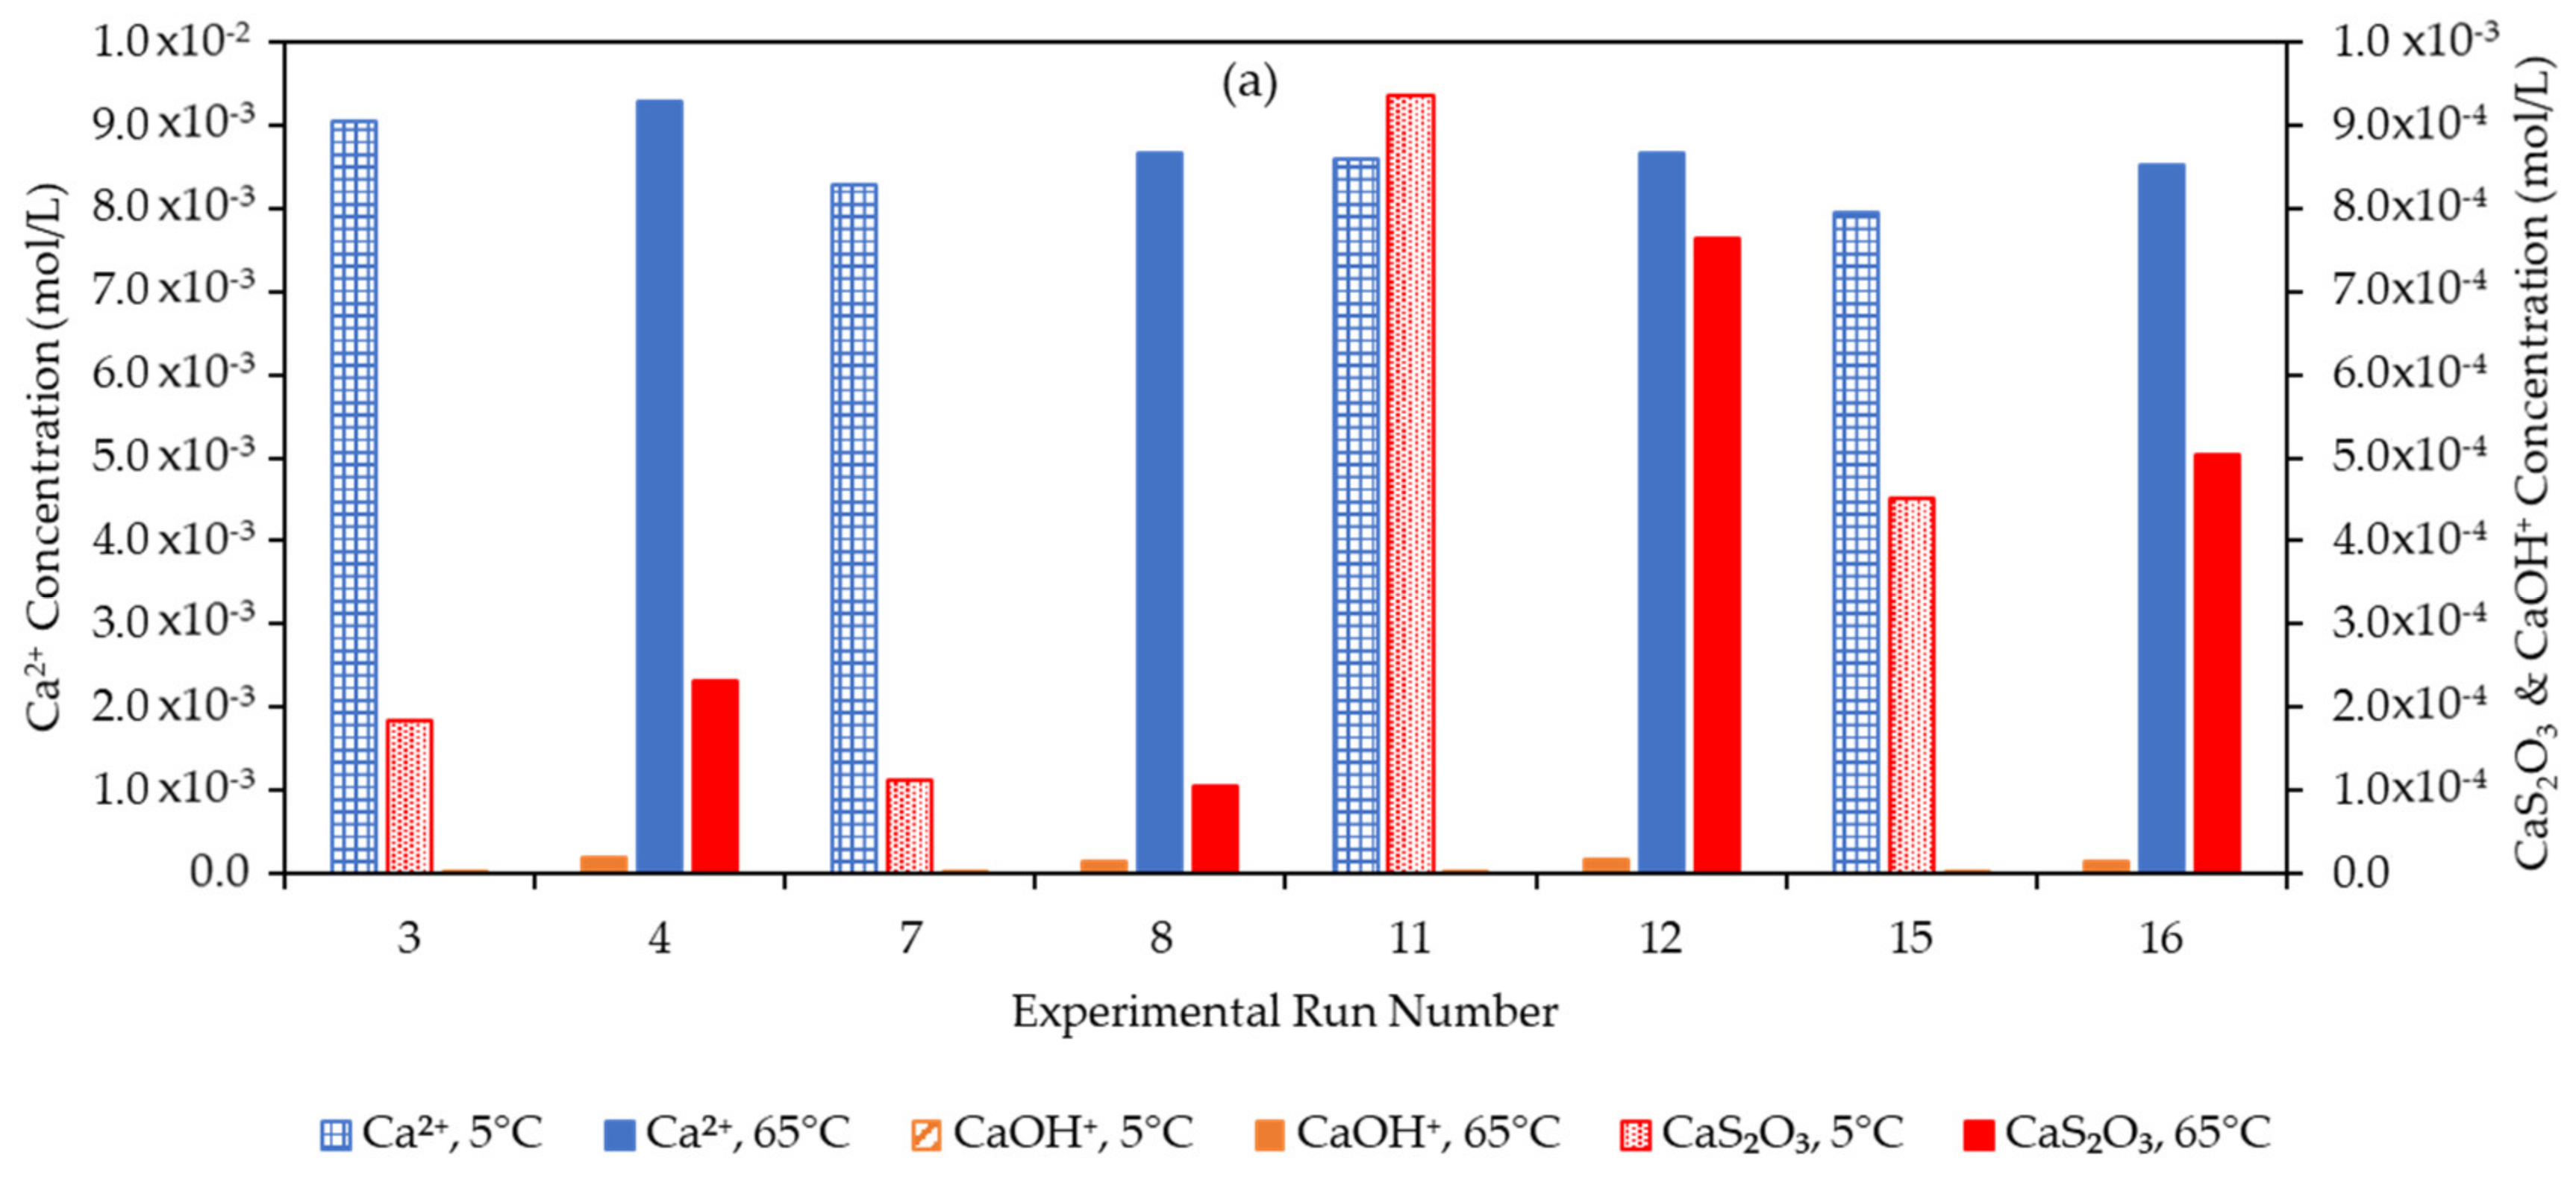
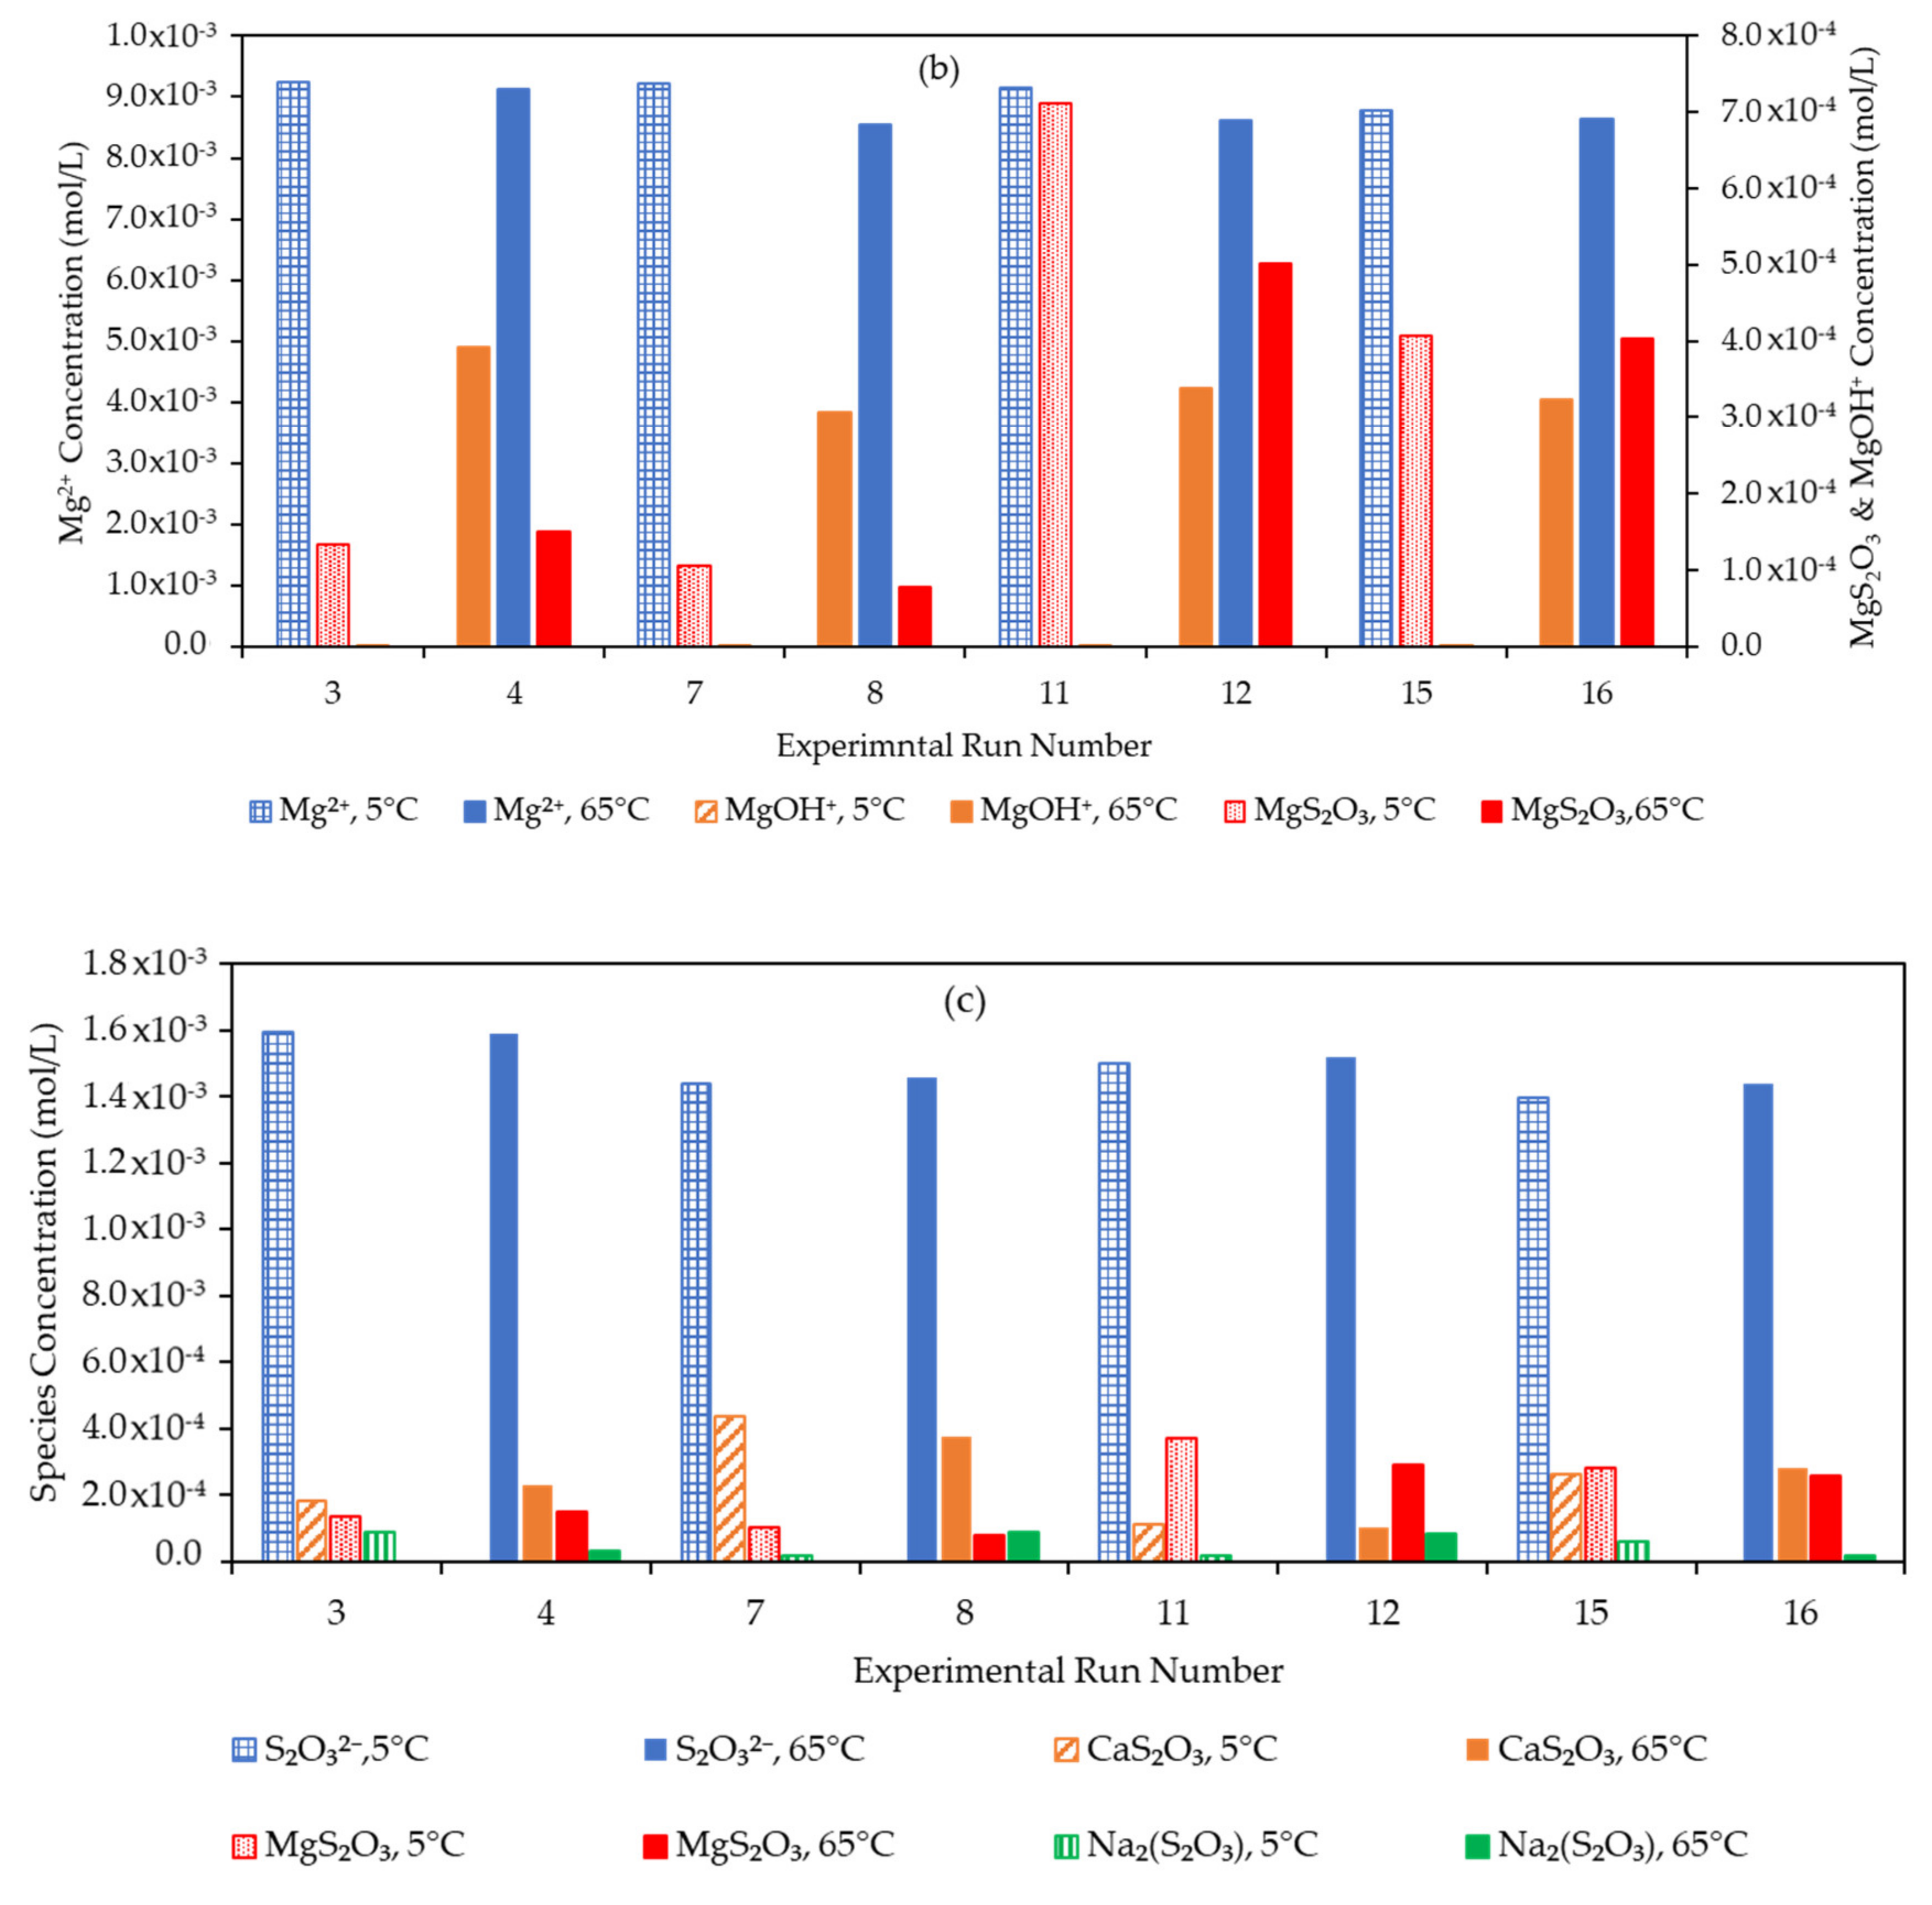
3.4. Effect of the Water Matrix on Electrolyte Speciation

Figure 6a–c illustrate the thermodynamically predicted concentrations of Ca2+. Mg2+ and S2O32− species present in solution at pH 9. These speciation concentrations were generated using experimental runs where the electrolyte concentration was highest in the design range i.e., 1000 mg/L. Visual MinteQ software (developed by Jon Petter Gustafsson, KTH, Stockholm, Sweden), was used to identify the speciation components and their corresponding equilibrium concentrations. From Figure 6a it can be seen that the CaOH+ species was present in solution, however, at small concentrations. As shown in Figure 6b, MgOH+ was mostly present in significant concentrations at high temperature conditions, i.e., where the water matrix solution was at 65 °C. These results show that at constant alkaline pH, the generation of CaOH+ and MgOH+ is significantly affected by temperature. The concentration of these cations is highest in high temperature conditions. Figure 6a–c also show that S2O32− ions interact with counter cations in solution producing CaS2O3, MgS2O3 and Na2S2O3. The thermodynamic prediction validates the suggestion made in Section 3.2.3 and Section 3.3.3, where the empirical model predicted interactions between divalent cations and S2O3 forming CaS2O3, MgS2O3 having an impact on collector adsorption on the mineral surface. Although S2O32− ions were introduced to the system in the form of a Na2S2O3 salt, the salt dissociated in solution. The free S2O32− ions have a propensity to interact with divalent ions over the monovalent Na+. As a result, the concentration of CaS2O32− and MgS2O32− electrolytes is higher than that of Na2S2O32− as illustrated by Figure 6c.
To investigate the speciation of Ca2+. Mg2+ and S2O32− electrolytes at the lowest concentration within the design range i.e., 200 mg/L, input parameters were changed within the thermodynamic software. Figure 7a–c show the concentrations of the speciation components as generated by the Visual MinteQ Software. Hardly any CaOH+ was present in solution as seen in Figure 7a–c show that although present at notable concentrations, the concentrations of MgOH+, CaS2O3 and MgS2O3 were present in much smaller concentration as compared to experimental runs where the Mg and Ca were at 1000 mg/L. Figure 7b also shows that significant MgOH+ concentrations were present at high temperature runs, i.e., at 65 °C.
From thermodynamic predictions presented in Figure 6 and Figure 7, S2O32− ions have a propensity to interact with divalent ions over monovalent ions. Moreover, the generation of S2O32− containing electrolytes is mostly affected by the abundance of S2O32− ions and counter cations in solution, and not directly by temperature variations. At these neutral-alkaline pH conditions tested, increasing the solution temperature subsequently increased the concentration of metal hydroxyl ions in solution. This could lead to an increase in the solubility limit of the metal hydroxyl ions in the neutral-alkaline conditions. MgOH+ ions were more prevalent at all conditions in comparison to CaOH+. The positively charged hydroxyl ions present at pH 9 may have contributed to reducing the negative charge on mineral surfaces as discussed in the previous Section 3.2.2. Flotation plant operations usually conduct flotation of Cu-Ni ores at pH 9, hence, the hydroxyl cation will prevail in solution over the MgOH precipitate. However, at higher alkaline pH values, this concentration of MgOH+ cations may decrease as the MgOH precipitate forms in solution. This precipitation of hydroxides may result in mineral passivation thus adversely impacting flotation performance.

4. Conclusions

The study showed that water quality plays a significant role in collector adsorption and interactions between water constituents must not be overlooked. Based on the centre points used in the experimental procedure, the experiments showed satisfactory reproducibility. Cationic species mostly increased adsorption which could be due to an activation mechanism allowing for more collector to be attracted to the mineral surface before chemisorption takes place. The S2O32− anions reduced collector adsorption on chalcopyrite and pentlandite respectively through competitive adsorption with the xanthate collector molecules.
The study established that pentlandite and chalcopyrite respond differently to water constituents with pentlandite exhibiting greater sensitivity. It was noted that water parameter interaction terms that have a positive effect or no effect at all on collector adsorption on chalcopyrite may impose an adverse effect on pentlandite and vice versa. As a result, it is necessary to ensure that during sequential flotation, where water recycling is employed, the recycled water is not mixed but instead is matched to the correct mineral flotation circuit. This minimises the risk of poor collector performance owing to the presence of detrimental ions.
Higher temperatures seemed to have a positive influence on collector adsorption on chalcopyrite minerals with the opposite true for pentlandite. It is, possible that temperature effects must be considered on a case by case basis (e.g., different ores) [25]. Temperature also affects the generation of hydroxyl species in solution. In summary, experimental design and multiple linear regression can be used to investigate the combined effects of water parameters on collector adsorption giving mostly consistent results with observations noted in the literature. Such a method could potentially be extended to assess other flotation performance metrics such as mineral recovery, grade and froth stability in flotation cells and even coupled with multivariate analysis when the number of variables increases. Furthermore, it can complement the analysis methods that are already in use to detect relationships between water parameters and their influence on flotation performance.

Supplementary Materials

The following are available online at https://www.mdpi.com/2075-163X/10/9/733/s1, Table S1: Raw Data (Concentration of SIBX at time t /Concentration of SIBX at t = 0) used in Two Way ANOVA test, Table S2: Two Way ANOVA table assessing the significance of temperature and time on average (Concentration of SIBX at t/Concentration of SIBX at t = 0).

Author Contributions

Conceptualization, N.M., N.S., K.C., and M.M.; methodology, N.M.; N.S., and M.M.; validation, N.M.; N.S., and K.C.; formal analysis, N.M.; investigation, N.M.; resources, N.S. and K.C.; data curation, N.M.; writing—original draft preparation, N.M.; writing—review and editing, N.M., N.S., M.M., and K.C.; supervision, N.S. and K.C.; project administration, K.C. and N.S.; funding acquisition, K.C. and N.S. All authors have read and agreed to the published version of the manuscript.

Funding

This research was funded by the European Union H2020 programme under grant agreement No. 730480, Academy of Finland Mineral Resources and Material Substitution MISU program (Finland)—Protocol development for evaluation of water-saving alternatives in minerals processing—“Bridging North to South” project and National Research Foundation of South Africa (NRF) [Grant number 103641].

Acknowledgments

The authors would like to acknowledge the Department of Bioproducts and Biosystems—Aalto University and the Centre for Minerals Research (CMR)—University of Cape Town for supporting this project.

Conflicts of Interest

The authors declare no conflict of interest.

References

  1. Schumann, R.; Levay, G.; Ametov, I. Impact of Recycling on Process Water Qauality in Mineral Processing. In Proceedings of the Water in Mining Conference, Perth, Australia, 15–17 September 2009; pp. 79–86. [Google Scholar]
  2. Liu, W.; Moran, C.J.; Vink, S. A Review of the Effect of Water Quality on Flotation. Miner. Eng. 2013, 53, 91–100. [Google Scholar] [CrossRef]
  3. Levay, G.; Smart, R.; Skinner, W. The Impact of Water Quality on Flotation Performance. J. S. Afr. Inst. Min. Metall. 2001, 1, 69–76. [Google Scholar]
  4. Albrecht, T.W.J.; Addai-Mensah, J.; Fornasiero, D. Critical Copper Concentration in Sphalerite Flotation: Effect of Temperature and Collector. Int. J. Miner. Process. 2016, 146, 15–22. [Google Scholar] [CrossRef]
  5. Bhattacharya, S.; Pascoe, R.D. Effect of Temperature on Coal Flotation Performance—A Review. Miner. Process. Extr. Metall. Rev. 2005, 26, 31–61. [Google Scholar] [CrossRef]
  6. Lin, I. The Effect of Seasonal Variations in Temperature on the Performance of Mineral Processing Plants. Miner. Eng. 1989, 2, 47–54. [Google Scholar] [CrossRef]
  7. O’Connor, C.T.; Dunne, R.C.; Botelho de Sousa, A.M.R. The Effect of Temperature on the Flotation of Pyrite. J. S. Afr. Inst. Min. Metall. 1984, 84, 389–394. [Google Scholar]
  8. Moses, C.O.; Nordstrom, K.D.; Herman, J.S.; Mills, A.L. Aqueous Pyrite Oxidation by Dissolved Oxygen and by Ferric Iron. Geochim. Cosmochim. Acta 1987, 51, 1561–1571. [Google Scholar] [CrossRef]
  9. Gibson, C.E.; Kelebek, S. International Journal of Mineral Processing Sensitivity of Pentlandite Fl Otation in Complex Sul Fi de Ores towards PH Control by Lime versus Soda Ash: Effect on Ore Type. Int. J. Miner. Process. 2014, 127, 44–51. [Google Scholar] [CrossRef]
  10. Jiang, L.; Krasowska, M.; Fornasiero, D.; Ralston, J.; Koh, P. Electrostatic Attraction between a Hydrophilic Solid and a Bubble. Phys. Chem. Chem. Phys. 2010, 12, 14527–14533. [Google Scholar] [CrossRef]
  11. Grano, S.R.; Prestidge, C.A.; Ralston, J. Solution Interaction of Ethyl Xanthate and Sulphite and Its Effect on Galena Flotation and Xanthate Adsorption. Int. J. Miner. Process. 1997, 52, 161–186. [Google Scholar] [CrossRef]
  12. Mäkelä, M. Experimental Design and Response Surface Methodology in Energy Applications: A Tutorial Review. Energy Convers. Manag. 2017, 151, 630–640. [Google Scholar] [CrossRef]
  13. Paulo, F.; Santos, L. Design of Experiments for Microencapsulation Applications: A Review. Mater. Sci. Eng. C 2017, 77, 1327–1340. [Google Scholar] [CrossRef] [PubMed]
  14. Kharia, A.A.; Singhai, A.K. Screening of Most Effective Variables for Development of Gastroretentive Mucoadhesive Nanoparticles by Taguchi Design. ISRN Nanomater. 2013, 2013, 1–8. [Google Scholar] [CrossRef] [Green Version]
  15. Brereton, R.G.; Araujo, P.W. Experimental Design I. Screening. TrAC Trends Anal. Chem. 1996, 15, 26–31. [Google Scholar] [CrossRef]
  16. Dauneau, P.; Perez-Martinez, G. Fractional Factorial Design and Multiple Linear Regression to Optimise Extraction of Volatiles from a Lactobacillus Plantarum Bacterial Suspension Using Purge and Trap. J. Chromatogr. A 1997, 775, 225–230. [Google Scholar] [CrossRef]
  17. Kiralj, R.; Ferreira, M. Basic Validation Procedures for Regression Models in QSAR and QSPR Studies: Theory and Application. J. Braz. Chem. Soc. 2009, 20, 770–787. [Google Scholar] [CrossRef] [Green Version]
  18. Ebert, R.-U.; Kühne, R.; Wang, B.; Schüürmann, G.; Chen, J. External Validation and Prediction Employing the Predictive Squared Correlation Coefficient—Test Set Activity Mean vs Training Set Activity Mean. J. Chem. Inf. Model. 2008, 48, 2140–2145. [Google Scholar] [CrossRef]
  19. Chimonyo, W.; Corin, K.C.; Wiese, J.G.; O’Connor, C.T. The Use of Oxidising Agents for Control of Electrochemical Potential in Flotation. Miner. Eng. 2017, 109, 135–143. [Google Scholar] [CrossRef]
  20. Ekmeki, Z.; Becker, M.; Tekes, E.B.; Bradshaw, D. The Relationship between the Electrochemical, Mineralogical and Flotation Characteristics of Pyrrhotite Samples from Different Ni Ores. J. Electroanal. Chem. 2010, 647, 133–143. [Google Scholar] [CrossRef]
  21. Woods, R. The Oxidation of Ethyl Xanthate on Platinum, Gold, Copper, and Galena Electrodes. Relation to the Mechanism of Mineral Flotation. J. Phys. Chem. 1971, 75, 354–362. [Google Scholar] [CrossRef]
  22. Trahar, W.J.; Guy, P.J. The Effects of Oxidation and Mineral Interaction of Sulphide Flotation. In Flotation of Sulphide Minerals; Forssberg, K.S., Ed.; Elsevier B.V.: Amsterdam, The Netherlands, 1985; pp. 91–110. [Google Scholar]
  23. Hu, Y.; Sun, W.; Wang, D. Electrochemistry of Flotation of Sulphide Minerals; Hu, Y., Wei, S., Dianzuo, W., Eds.; Tsinghua University Press: Beijing, China, 2009. [Google Scholar]
  24. Mustafa, S.; Hamid, A.; Naeem, A. Temperature Effect on Xanthate Sorption by Chalcopyrite. J. Colloid Interface Sci. 2004, 275, 368–375. [Google Scholar] [CrossRef] [PubMed]
  25. An, D.; Zhang, J. A Study of Temperature Effect on the Xanthate’s Performance during Chalcopyrite Flotation. Minerals 2020, 10, 426. [Google Scholar] [CrossRef]
  26. Dávila-Pulido, G.I.; Uribe-Salas, A.; Álvarez-Silva, M.; López-Saucedo, F. The Role of Calcium in Xanthate Adsorption onto Sphalerite. Miner. Eng. 2015, 71, 113–119. [Google Scholar] [CrossRef]
  27. Bulut, G.; Yenial, Ü. Effects of Major Ions in Recycled Water on Sulfide Minerals Flotation. Miner. Metall. Process. 2016, 33, 137–143. [Google Scholar] [CrossRef]
  28. Eliseev, N.I.; Kirbitova, N.V. Chalcopyrite and Pyrite Depression with a Mixture of Hyposulfite and Copper Sulfate. Sov. J. Non Ferr. Met. 1984, 1, 125–126. [Google Scholar]
  29. Petrus, H.T.B.M.; Hirajima, T.; Sasaki, K.; Okamoto, H. Effects of Sodium Thiosulphate on Chalcopyrite and Tennantite: An Insight for Alternative Separation Technique. Int. J. Miner. Process. 2012, 102–103, 116–123. [Google Scholar] [CrossRef]
  30. Kirjavainen, V.; Schreithofer, N.; Heiskanen, K. Effect of Calcium and Thiosulfate Ions on Flotation Selectivity of Nickel-Copper Ores. Miner. Eng. 2002, 15, 1–5. [Google Scholar] [CrossRef]
  31. Strong, A.; Yan, D.; Dunne, R. The Detection of Xanthate in Solution and on Sulfide Surfaces to Help Understand and Improve Mineral Separation on Industrial Plants. In Centenary of Flotation Symposium; Australasian Institute of Mining and Metallurgy: Brisbane, QLD, Australia, 2005; pp. 619–624. [Google Scholar]
  32. Miller, J.D.; Li, J.; Davidtz, J.C.; Vos, F. A Review of Pyrrhotite Flotation Chemistry in the Processing of PGM Ores. Miner. Eng. 2005, 18, 855–865. [Google Scholar] [CrossRef]
  33. Buswell, A.M.; Nicol, M.J. Some Aspects of the Electrochemistry of Pyrrhotite. J. Appl. Electrochem. 2002, 32, 1321–1329. [Google Scholar] [CrossRef]
  34. Kerr, A. An Overview of Recent Developments in Flotation Technology and Plant Practice for Nickel Ores. In Mineral Processing, Plant Design, Practice and Control Proceedings; Mular, A.L., Halbe, D.N., Barratt, D.J., Eds.; Society for Mining, Metallurgy and Exploration: Littleton, CO, USA, 2002; pp. 142–1158. [Google Scholar]
  35. Schreithofer, N. Effect of Calcium and Thiosulphate on Flotability and Xanthate Chemistry of Pentlandite Ion Real Ore System. Doctoral Dissertation, University of Miskolc, Miskolc, Hungary, 1998. [Google Scholar]
  36. Hodgson, M.; Agar, G.E. Electrochemical Investigations into the Flotation Chemistry of Pentlandite and Pyrrhotite: Process Water and Xanthate Interactions. Can. Metall. Q. 1989, 28, 189–198. [Google Scholar] [CrossRef]
  37. Mustafa, S.; Hamid, A.; Naeem, A. Xanthate Adsorption Studies on Chalcopyrite Ore. Int. J. Miner. Process. 2004, 74, 317–325. [Google Scholar] [CrossRef]
Figure 1. Average sodium isobutyl xanthate (SIBX) concentration with time at different temperature conditions. The diagram was rescaled to show differences in concentration. Two way ANOVA analysis was employed for testing the statistical significance of differences in concentration at a 95% confidence level.
Minerals 10 00733 g001
Figure 2. Effect of water constituents and the interaction on xanthate adsorption on a chalcopyrite surface. Error bars a calculated based on 95% confidence intervals. Insignificant terms with error bars spanning the positive and negative y axis are removed from the final regression model.
Minerals 10 00733 g002
Figure 3. Plot of Eh vs time for various conditions of collector adsorption on chalcopyrite. No Fill (5 °C); Fill (65 °C).
Minerals 10 00733 g003
Figure 4. The effect of water constituents and the interaction on xanthate adsorption on a pentlandite concentrate. Error bars a calculated based on 95% confidence intervals. Insignificant terms with error bars spanning the positive and negative y axis must be removed from the final regression model.
Minerals 10 00733 g004
Figure 5. Plot of Eh vs. time for various conditions of collector adsorption on enriched pentlandite. No Fill (5 °C); Fill (65 °C).
Minerals 10 00733 g005
Figure 6. (a) Distribution of Ca2+ after interaction in different water matrices at pH 9. Starting Ca2+ concentration = 1000 mg/L. Low equilibrium CaOH+ concentrations at 5 °C (3 × 10⁻⁷ mol/L –5 × 10⁻⁵ mol/L). (b) Distribution of Mg2+ after interaction in different water matrices at pH 9. Starting Mg2+ concentration = 1000 mg/L. Low equilibrium MgOH+ concentrations at 5 °C (<1 × 10⁻⁵ mol/L). (c) Distribution of S2O32− after interaction in different water matrices at pH 9. Starting S2O32− concentration = 1000 mg/L.
Minerals 10 00733 g006aMinerals 10 00733 g006b
Figure 7. (a) Distribution of Ca2+ after interaction in different water matrices at pH 9. Starting Ca2+ concentration = 200 mg/L. (b) Distribution of Mg2+ after interaction in different water matrices at pH 9. Starting Mg2+ concentration = 200 mg/L. (c) Distribution of S2O32− after interaction in different water matrices at pH 9. Starting S2O32− concentration = 200 mg/L.
Minerals 10 00733 g007aMinerals 10 00733 g007b
Table 1. XRD analysis of the mineral samples used in adsorption tests.
SampleMineral PhasesPurity (%)
ChalcopyriteChalcopyrite80
Quartz13
Sphalerite3
Other non-sulphide minerals4
Enriched PentlanditePentlandite25
Pyrrhotite11
Talc16
Amphiboles11
Other non-sulphide minerals37
Table 2. Summary of the 2 level half fractional design experimental results.
ExperimentActual Level of VariablesResponse
Run OrderT(°C)Ca2+ (mg/L)Mg2+ (mg/L)S2O32− (mg/L)Na+ (mg/L)Extent of Adsorption: Chalcopyrite
(%)
Extent of Adsorption: Pentlandite
(%)
15200200200100080.487.5
26520020020020090.738
35100020020020080.993
4651000200200100093.385.4
55200100020020084.492
6652001000200100088.080.7
7510001000200100086.796.2
8651000100020020095.669.9
95200200100020082.267.2
10652002001000100083.661.8
11510002001000100092.987.2
12651000200100020091.192.3
13520010001000100084.490.4
14652001000100020092.429.7
15510001000100020091.140.5
1665100010001000100092.078
173560060060060088.081.3
183560060060060089.380.9
193560060060060087.680.1
Table 3. Confounding of single factor and two factor interactions with their confounding patterns.
FactorConfounding Pattern
TCa2+ × Mg2+ × S2O32− × Na+
Ca2+T × Mg2+ × S2O32− × Na+
Mg2+T × Ca2+× S2O32− × Na+
Na+T × Ca2+ × Mg2+ × S2O32−
S2O32−T × Ca2+ × Mg2+ × Na+
T × Ca2+Mg2+ × S2O32− × Na+
T × Mg2+Ca2+ × S2O32− × Na+
T × S2O32−Ca2+ × Mg2+ × Na+
T × Na+Ca2+ × Mg2+ × S2O32−
Ca2+ × Mg2+T × Na+ × S2O32−
Ca2+ × S2O32−T × Na+ × Mg2+
Ca2+ × Na+T × S2O32− × Mg2+
Mg2+ × S2O32−T × Na+ × Ca2+
Mg2+ × Na+T × S2O32− × Ca2+
S2O32− × Na+T × Mg2+ × Ca2+
Table 4. Final regression coefficients for collector adsorption on chalcopyrite.
TermCoefficientsP Values
Constant88.141.39 × 10−19
T2.732.88 × 10−7
Ca2+2.349.41 × 10−7
Mg2+1.221.19 × 10−4
S2O32−−0.440.0086
Na+0.610.035
T × S2O32−−1.671.23 × 10−5
T × Na+−1.171.59 × 10−4
Ca2+ × S2O32−0.720.0033
Ca2+ × Na+1.221.19 × 10−4
Mg2+ × Na+−1.112.31 × 10−4
R2pred = 0.934R2 = 0.989R2Adj = 0.978
Table 5. ANOVA Summary for collector adsorption on chalcopyrite.
ANOVA TABLE: Chalcopyrite Adsorption Tests
ParameterDFSum of Squares (SS)Mean Square (Variance)F ValueP Value
Total Corrected1836220.1
Regression1035835.872.00
Residual83.940.49
Lack of Fit62.360.390.50.785
Pure Error21.580.79
Table 6. Final regression coefficients for collector adsorption on pentlandite.
TermCoefficientsP Value
Constant75.371.77 × 10−11
T−7.390.0055
Ca2+5.950.017
Mg2+−2.190.31
S2O32−−5.980.017
Na+9.040.0016
T × S2O32−4.450.017
T × Ca2+8.480.0025
Ca2+ × Mg2+−6.980.0076
Mg2+ × S2O32−−6.550.011
Mg2+ × Na+5.110.033
R2pred = 0.72R2 = 0.96R2Adj = 0.91
Table 7. ANOVA Summary for collector adsorption on pentlandite.
ANOVA TABLE: Chalcopyrite Adsorption Tests
ParametersDFSum of Squares (SS)Mean Square (Variance)F ValueP Value
Total Corrected187024390
Regression10674367419.220.001
Residual828035
Lack of Fit627946124.920.008
Pure Error20.750.37

