Rheology of Alkali-Activated Mortars: Influence of Particle Size and Nature of Aggregates


Abstract
1. Introduction
2. Experimental
2.1. Materials
2.2. Mortar Preparation and Test Conducted
- determination of the liquid/solid ratio required for plastic consistency as per the flow table test, determined on the grounds of a 150 ± 10 mm diameter spread pursuant to European standard EN 1015-3:2000 [37];
- stress growth test (SGT) conducted on a Viskomat NT mortar rheometer with a blade impeller operating at 1.5 rpm (0.025 s−1) as described in earlier studies [15];
- flow curve test (FCT) run on the same mortars as used for the stress growth test, subsequently subjected to preliminary shear at 30 rpm (0.5 s−1) for 25 s, and then ramped down by 4.5 rpm in 10 s steps, graphing the mean torque at each step against rotational speed and fitting to the respective rheological model to determine the dynamic yield stress and plastic viscosity. Viskomat NT rheometer was calibrated as described in the literature [41] to express the readings in fundamental units.
3. Results and Discussion
- (a)
- The nature of the precursor (BFS, FA) or binder (OPC) activated or hydrated in conditions specific to each as described above;
- (b)
- The particle size distribution of siliceous aggregate (S);
- (c)
- The nature of the aggregates: 100% siliceous (S), 100% limestone (L), or 100% recycled, referred to total aggregate mass. A constant and equal particle size distribution with a maximum diameter of 2 mm and a constant sand/binder ratio of 2/1 were used throughout
- (d)
- S replacement ratio by: 10 wt.%, 20 wt.%, or 50 wt.% of R, likewise referred to total aggregate mass.
3.1. Mortar Liquid/Solid Ratio Required for Plastic Consistency
- (a)
- With the maximum particle size (Dmax 2 mm), the packing density is slightly higher due to the greater particle size distribution, allowing particles of different sizes to present better compaction. This effect appears to be somewhat more pronounced in AAFA mortars. Therefore, the higher the packing density, the lower the void content and the greater the amount of available paste to lubricate the mortar [51,52,53]. This effect has been observed in both OPC and AAM mortars;
- (b)
- Generally speaking, and irrespective of the size and nature of the aggregate, AAM mortars had slightly higher packing densities than the OPC reference. A possible explanation for those findings may lie in the physical characteristics of the activator solutions (higher density and viscosity) and to a lesser extent in the surface characteristics of the precursors (the vitreous slag in particular);
- (c)
- Replacing siliceous with limestone aggregate always entailed a decline in packing density and a rise in the voids content in the mortars studied. The same observation was made by authors researching OPC concretes [47,49,54] and has been attributed to the fact that limestone aggregate is crushed, generating uneven particles with sharp edges (see morphological factors Table 4) that hinder compact packing and favor the formation of inter-particle voids;
- (d)
- The partial replacement of siliceous with recycled aggregate in AAM and OPC mortars apparently slightly lowered packing density and raised the voids content. Further to Table 7, at 20% replacement the voids values were quite similar to those observed for 100% siliceous aggregate-bearing mortar in AAM and OPC mortars both.
3.2. Mortar Rheological Parameters
- (a)
- Irrespective of particle size or nature aggregate used, the AAS-WG mortars had consistently lower τstatic and τdynamic values than the AAFA-10M and OPC materials. The inference is that such mortars call for less energy to begin to flow. Similar findings reported for AAS paste [15] have been associated essentially with the fluidizing characteristics of the waterglass activator. The AAS-WG mortars also exhibited the greatest plastic viscosity as a result of the high viscosity of the activator;
- (b)
- The highest τstatic and τdynamic values were found for the OPC mortars followed by the AAFA-10M materials, with the former exhibiting the lowest plastic viscosity. These observations are attributable to inter-particle interaction, especially in OPC mortars, and low initial binder reactivity in the AAFA-10M mortars;
- (c)
- Regardless of the precursor or binder used, rheological parameters increase when the maximum particle size decreases. This effect is mainly due to several reasons: i) the lower the Dmax, the higher surface area of the aggregates, which leads to an increase in the friction between the particles and the yield stress [32,53]. ii) As the surface area of the aggregates increases, the adsorption of liquid rises, leaving less water available for the paste to lubricate the aggregates, and iii) the smaller the maximum particle diameter of the aggregate has a lower grain size distribution that leads to a packing density [44,47,54] and higher volume of intergranular voids (See Table 7);
- (d)
- In both the AAM and OPC mortars replacing siliceous with limestone and recycled aggregate entailed rises in τstatic and τdynamic, a logical outcome inasmuch as siliceous aggregate particles are more spherical and limestone and recycled aggregates are more uneven (see the sphericity and convexity factor data in Table 3);
- (e)
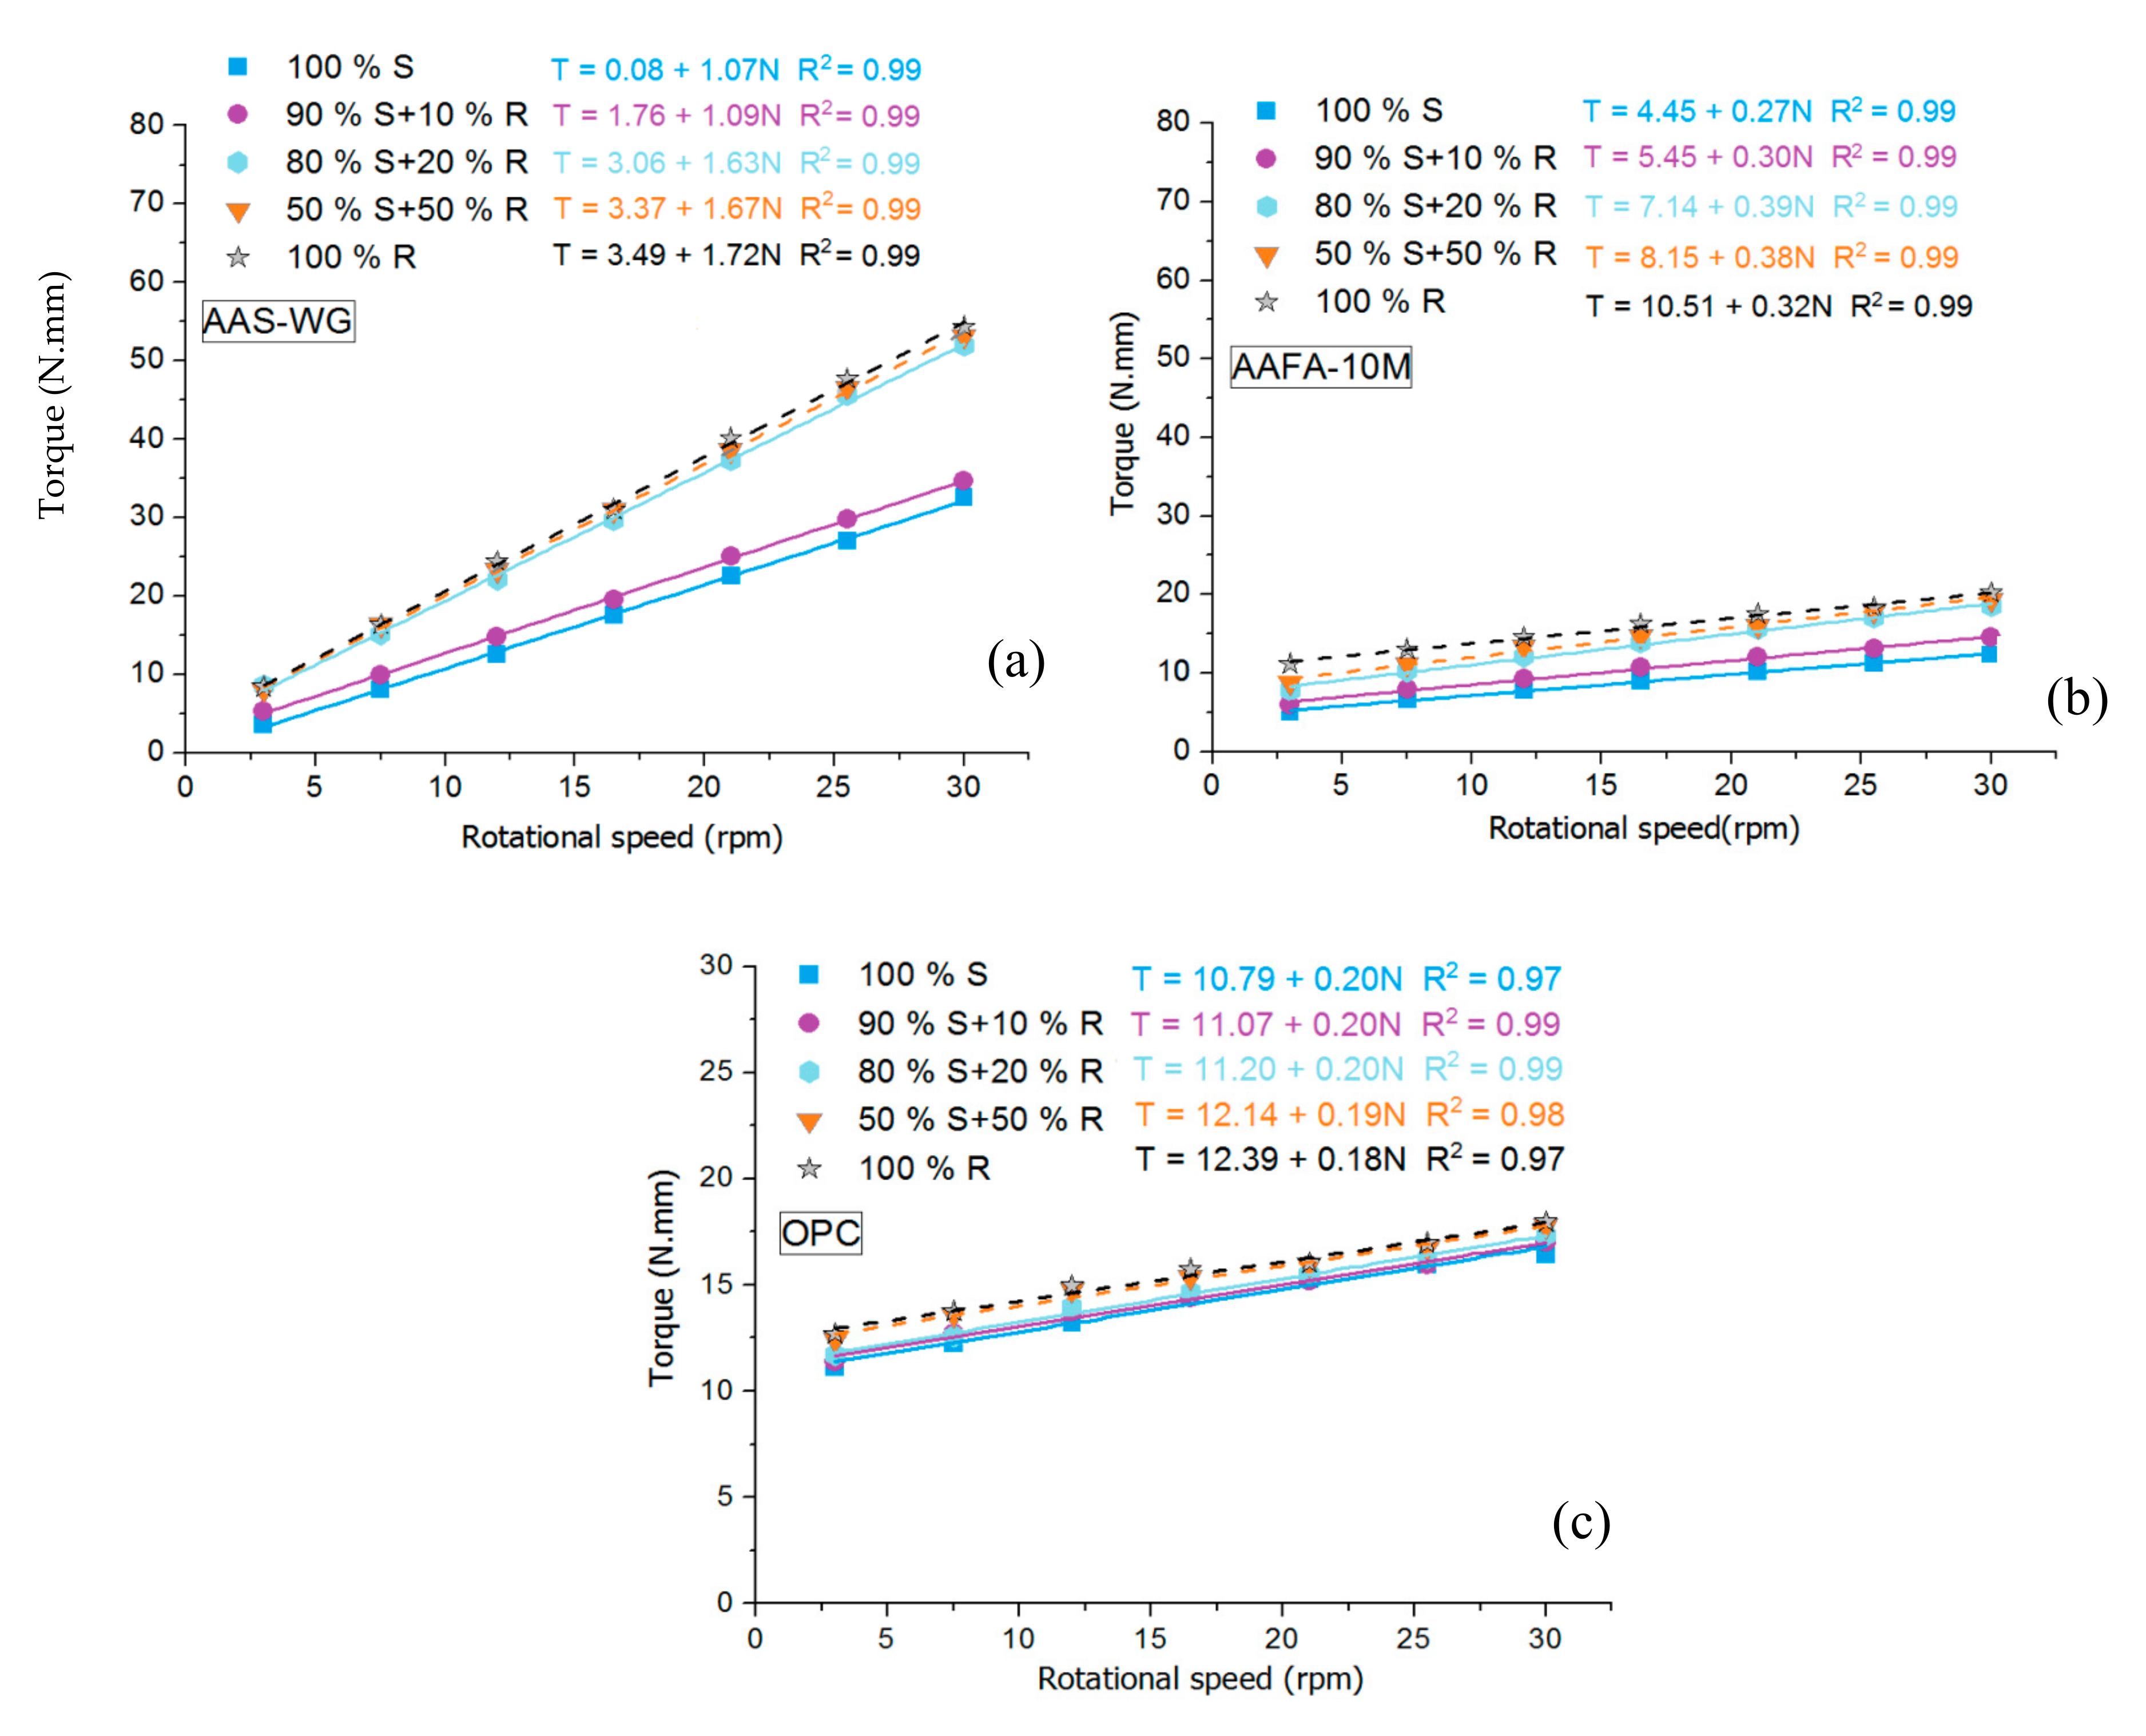
- Incrementally replacing siliceous by recycled aggregates from 10% to 100% also induced (practically linear) rises in τstatic and τdynamic.
4. Conclusions
- (a)
- In both OPC and AAM mortars, the smaller the aggregate size, the higher the liquid/solid ratio required to achieve a similar plastic consistency. Plastic viscosity as well as static and dynamic yield stress increase with the decrease in maximum particle size. This effect is due to the increase of the interparticle friction and the decrease of the packing density of the mortars due to the narrower size distribution of the aggregate with the smaller size (Dmax = 0.5);
- (b)
- The AAM mortars, particularly the AAFA-10M materials, required higher liquid/solid ratios than OPC mortars to attain plastic consistency, whereas the partial replacement of the siliceous aggregate with up to 20% of recycled aggregate induced no change in in mixing liquid uptake in either AAM or OPC mortars;
- (c)
- Aggregate nature affected mortar packing density and voids content slightly more intensely in waterglass-AAS mortars than in NaOH-AAFA and OPC mortars. Possibly the most visible effect was found for mortars prepared with limestone aggregate, which, under all the conditions studied, exhibited lower packing density and a higher voids content than siliceous aggregate-containing mortars, due to the uneven shape of limestone aggregate particles. Although less accentuated, the same effect was observed in the mortars with recycled concrete aggregate;
- (d)
- All of the AAS-WG, AAFA-10M, and OPC mortars studied conformed well to the Bingham plastic model;
- (e)
- AAM mortars were found to be more sensitive than OPC mortars to changes in aggregate nature. For as a rule, the values of the three rheological parameters studied (τstatic, τdynamic and µ) rose more substantially in the former and, consistently, more steeply in AAS-WG mortars when siliceous aggregate was replaced with recycled concrete or limestone aggregates. Aggregate texture and surface properties played an instrumental role in parameters τstatic and τdynamic in all the mortars, an effect especially visible when the mortars with limestone and recycled concrete aggregates were compared to the siliceous aggregate-bearing materials. The values of the three rheological parameters rose with rising replacement ratio (when recycled aggregates was substituted for siliceous one) in the AAM mortars, particularly AAS-WG. Rates of up to 10% induced no significant change in τstatic or µ in any of the mortars except AAS-WG.
Author Contributions
Funding
Conflicts of Interest
References
- Palomo, A.; Krivenko, P.; Garcia-Lodeiro, I.; Kavalerova, E.; Maltseva, O.; Fernández-Jiménez, A. A review on alkaline activation: New analytical perspectives. Mater. Constr. 2014, 64, e022. [Google Scholar] [CrossRef]
- Provis, J.L. Alkali-activated materials. Cem. Concr. Res. 2018, 114, 40–48. [Google Scholar] [CrossRef]
- Robayo-Salazar, R.A.; De Gutiérrez, R.M.; Puertas, F. Alkali-activated binary concrete based on a natural pozzolan: Physical, mechanical and microstructural characterization. Mater. Constr. 2019, 69, 191. [Google Scholar] [CrossRef]
- Pacheco-Torgal, F.; Labrincha, J.A.; Leonelli, C.; Palomo, A.; Chindaprasirt, P. Handbook of Alkali-Activated Cements, Mortars and Concretes; Series in Civil and Structural Engineering; Woodhead Publishing: Cambridge, UK, 2015. [Google Scholar] [CrossRef]
- Singh, N.B. Fly Ash-Based Geopolymer Binder: A Future Construction Material. Minerals 2018, 8, 299. [Google Scholar] [CrossRef]
- Provis, J.L.; Palomo, A.; Shi, C. Advances in understanding alkali-activated materials. Cem. Concr. Res. 2015, 78, 110–125. [Google Scholar] [CrossRef]
- Varga, C.; Alonso, M.D.M.; De Gutiérrez, R.M.; Mejía, J.; Puertas, F. Decalcification of alkali-activated slag pastes. Effect of the chemical composition of the slag. Mater. Struct. 2014, 48, 541–555. [Google Scholar] [CrossRef]
- Fernández-Jiménez, A.; Palomo, J.; Puertas, F. Alkali-activated slag mortars. Cem. Concr. Res. 1999, 29, 1313–1321. [Google Scholar] [CrossRef]
- Puertas, F.; Varga, C.; Alonso, M.D.M. Rheology of alkali-activated slag pastes. Effect of the nature and concentration of the activating solution. Cem. Concr. Compos. 2014, 53, 279–288. [Google Scholar] [CrossRef]
- Kashani, A.; Provis, J.L.; Qiao, G.G.; Van Deventer, J.S. The interrelationship between surface chemistry and rheology in alkali activated slag paste. Constr. Build. Mater. 2014, 65, 583–591. [Google Scholar] [CrossRef]
- Palacios, M.; Alonso, M.D.M.; Varga, C.; Puertas, F. Influence of the alkaline solution and temperature on the rheology and reactivity of alkali-activated fly ash pastes. Cem. Concr. Compos. 2019, 95, 277–284. [Google Scholar] [CrossRef]
- Xiang, J.; Liu, L.-P.; Cui, X.-M.; He, Y.; Zheng, G.; Shi, C. Effect of limestone on rheological, shrinkage and mechanical properties of alkali—Activated slag/fly ash grouting materials. Constr. Build. Mater. 2018, 191, 1285–1292. [Google Scholar] [CrossRef]
- Palacios, M.; Banfill, P.; Puertas, F. Rheology and Setting of Alkali-Activated Slag Pastes and Mortars: Effect of Organic Admixture. ACI Mater. J. 2008, 105, 140–148. [Google Scholar] [CrossRef]
- Puertas, F.; González-Fonteboa, B.; González-Taboada, I.; Alonso, M.D.M.; Torres-Carrasco, M.; Rojo, G.; Martínez-Abella, F. Alkali-activated slag concrete: Fresh and hardened behaviour. Cem. Concr. Compos. 2018, 85, 22–31. [Google Scholar] [CrossRef]
- Alonso, M.D.M.; Gismera, S.; Blanco, M.; Lanzón, M.; Puertas, F. Alkali-activated mortars: Workability and rheological behaviour. Constr. Build. Mater. 2017, 145, 576–587. [Google Scholar] [CrossRef]
- You, N.; Liu, Y.; Gu, D.; Ozbakkaloglu, T.; Pan, J.; Zhang, Y. Rheology, shrinkage and pore structure of alkali-activated slag-fly ash mortar incorporating copper slag as fine aggregate. Constr. Build. Mater. 2020, 242, 118029. [Google Scholar] [CrossRef]
- Wetzel, A.; Middendorf, B. Influence of silica fume on properties of fresh and hardened ultra-high performance concrete based on alkali-activated slag. Cem. Concr. Compos. 2019, 100, 53–59. [Google Scholar] [CrossRef]
- Kamani, M.; Ajalloeian, R. The effect of rock crusher and rock type on the aggregate shape. Constr. Build. Mater. 2020, 230. [Google Scholar] [CrossRef]
- Krieger, I.M.; Dougherty, T.J. A Mechanism for Non-Newtonian Flow in Suspensions of Rigid Spheres. Trans. Soc. Rheol. 1959, 3, 137–152. [Google Scholar] [CrossRef]
- Yahia, A.; Mantellato, S.; Flatt, R.J. Concrete rheology: A basis for understanding chemical admixtures. In Science and Technology of Concrete Admixtures; Elsevier BV: Woodhead Publishing (an imprint of Elsevier): Cambridge, UK, 2016; pp. 97–127. [Google Scholar]
- Wills, M.H., Jr. How aggregate particle shape influences concrete mixing water requirement and strength. J. Mat. 1967, 2, 843–865. [Google Scholar]
- Cepuritis, R.; Jacobsen, S.; Pedersen, B.; Mørtsell, E. Crushed sand in concrete—Effect of particle shape in different fractions and filler properties on rheology. Cem. Concr. Compos. 2016, 71, 26–41. [Google Scholar] [CrossRef]
- Mehdipour, I.; Khayat, K.H. Understanding the role of particle packing characteristics in rheo-physical properties of cementitious suspensions: A literature review. Constr. Build. Mater. 2018, 161, 340–353. [Google Scholar] [CrossRef]
- Kurda, R.; De Brito, J.; Silvestre, J. Influence of recycled aggregates and high contents of fly ash on concrete fresh properties. Cem. Concr. Compos. 2017, 84, 198–213. [Google Scholar] [CrossRef]
- Lavado, J.; Bogas, J.; De Brito, J.; Hawreen, A. Fresh properties of recycled aggregate concrete. Constr. Build. Mater. 2020, 233, 117322. [Google Scholar] [CrossRef]
- Carro-López, D.; González-Fonteboa, B.; De Brito, J.; Martínez-Abella, F.; Taboada, I.G.; Da Silva, P.R. Study of the rheology of self-compacting concrete with fine recycled concrete aggregates. Constr. Build. Mater. 2015, 96, 491–501. [Google Scholar] [CrossRef]
- Sánchez-Roldán, Z.; Valverde-Palacios, I.; Valverde-Espinosa, I.; Martín-Morales, M. Microstructural analysis of concretes manufactured with recycled coarse aggregates pre-soaked using different methods. Mater. Constr. 2020, 70, 228. [Google Scholar] [CrossRef]
- Ferraris, C.F.; De Larrard, F. Testing and modelling of fresh concrete rheology. Natl. Inst. Stand. Technol. Interag. Rep. 1998, 6094. [Google Scholar] [CrossRef]
- Alonso, M.D.M.; Rodríguez, A.; Puertas, F. Viability of the use of construction and demolition waste aggregates in alkali-activated mortars. Mater. Constr. 2018, 68, 164. [Google Scholar] [CrossRef]
- EN 1097-6. Tests for Mechanical and Physical Properties of Aggregates—Part 6: Determination of Particle Density and Water Absorption; Comite Europeen de Normalisation: Brussels, Belgium, 2013. [Google Scholar]
- EN 1097-3. Tests for Mechanical and Physical Properties of Aggregates—Part 3: Determination of Loose Bulk Density and Voids; Comite Europeen de Normalisation: Brussels, Belgium, 1999. [Google Scholar]
- Westerholm, M.; Lagerblad, B.; Silfwerbrand, J.; Forssberg, E. Influence of fine aggregate characteristics on the rheological properties of mortars. Cem. Concr. Compos. 2008, 30, 274–282. [Google Scholar] [CrossRef]
- Hafid, H.; Ovarlez, G.; Toussaint, F.; Jezequel, P.; Roussel, N. Effect of particle morphological parameters on sand grains packing properties and rheology of model mortars. Cem. Concr. Res. 2016, 80, 44–51. [Google Scholar] [CrossRef]
- Rietveld, H.M. A profile refinement method for nuclear and magnetic structures. J. Appl. Crystallogr. 1969, 2, 65–71. [Google Scholar] [CrossRef]
- UNE-EN. UNE-EN 196-2 Method of Testing Cement—Part 2: Chemical Analysis; Comite Europeen de Normalisation: Brussels, Belgium, 2014. [Google Scholar]
- EN 196-1. Methods of Testing Cement—Part 1: Determination of Strength; Comite Europeen de Normalisation: Brussels, Belgium, 2018. [Google Scholar]
- UNE-EN-1015-3. Methods of Test for Mortar for Masonry. Part 3: Determination of Consistence of Fresh Mortar (by Flow Table); Comite Europeen de Normalisation: Brussels, Belgium, 2000. [Google Scholar]
- Wong, H.H.C.; Kwan, A.K.H. Packing density of cementitious materials: Part 1—Measurement using a wet packing method. Mater. Struct. 2007, 41, 689–701. [Google Scholar] [CrossRef]
- Kwan, A.; Fung, W. Packing density measurement and modelling of fine aggregate and mortar. Cem. Concr. Compos. 2009, 31, 349–357. [Google Scholar] [CrossRef]
- Diederich, P.; Mouret, M.; De Ryck, A.; Ponchon, F.; Escadeillas, G. The nature of limestone filler and self-consolidating feasibility—Relationships between physical, chemical and mineralogical properties of fillers and the flow at different states, from powder to cement-based suspension. Powder Technol. 2012, 218, 90–101. [Google Scholar] [CrossRef]
- Flatt, R.J.; LaRosa, D.; Roussel, N. Linking yield stress measurements: Spread test versus Viskomat. Cem. Concr. Res. 2006, 36, 99–109. [Google Scholar] [CrossRef]
- Reddy, B.V.; Gupta, A. Influence of sand grading on the characteristics of mortars and soil–cement block masonry. Constr. Build. Mater. 2008, 22, 1614–1623. [Google Scholar] [CrossRef]
- Lim, S.K.; Tan, C.S.; Chen, K.P.; Lee, M.L.; Lee, W.P. Effect of different sand grading on strength properties of cement grout. Constr. Build. Mater. 2013, 38, 348–355. [Google Scholar] [CrossRef]
- Harini, M.; Shaalini, G.; Dhinakaran, G. Effect of size and type of fine aggregates on flowability of mortar. KSCE J. Civ. Eng. 2011, 16, 163–168. [Google Scholar] [CrossRef]
- Haach, V.G.; Vasconcelos, G.; Lourenço, P. Influence of aggregates grading and water/cement ratio in workability and hardened properties of mortars. Constr. Build. Mater. 2011, 25, 2980–2987. [Google Scholar] [CrossRef]
- Neno, C.; De Brito, J.; Veiga, R. Using fine recycled concrete aggregate for mortar production. Mater. Res. 2013, 17, 168–177. [Google Scholar] [CrossRef]
- Hu, J.; Wang, K. Effects of Size and Uncompacted Voids of Aggregate on Mortar Flow Ability. J. Adv. Concr. Technol. 2007, 5, 75–85. [Google Scholar] [CrossRef]
- Li, L.; Lin, C.; Chen, G.; Kwan, A.; Jiang, T. Effects of packing on compressive behaviour of recycled aggregate concrete. Constr. Build. Mater. 2017, 157, 757–777. [Google Scholar] [CrossRef]
- Taboada, I.G.; González-Fonteboa, B.; Martínez-Abella, F.; Seara-Paz, S. Analysis of rheological behaviour of self-compacting concrete made with recycled aggregates. Constr. Build. Mater. 2017, 157, 18–25. [Google Scholar] [CrossRef]
- Cortes, D.; Kim, H.-K.; Palomino, A.; Santamarina, J.C. Rheological and mechanical properties of mortars prepared with natural and manufactured sands. Cem. Concr. Res. 2008, 38, 1142–1147. [Google Scholar] [CrossRef]
- Powers, T.C. The Properties of Concrete; Wiley & Sons: New York, NY, USA, 1968. [Google Scholar]
- Kwan, A.; McKinley, M. Effects of limestone fines on water film thickness, paste film thickness and performance of mortar. Powder Technol. 2014, 261, 33–41. [Google Scholar] [CrossRef]
- Bager, D.; Mette, R.; Rune, M. Rheology of self-compacting mortars- Influence of particle grading. Nordic Concr. Res. 2004, 26, 2–16. [Google Scholar]
- Nel Quiroga, P.; Fowler, D.W. The Effects of Aggregate Characteristics on the Performance of Portland Cement Concrete. Ph.D. Thesis, The University of Texas, Austin, TX, USA, 2003. [Google Scholar]
- Gram, A. Modelling Bingham Suspensional Flow Influence of Viscosity and Particle Properties Applicable to Cementitious Materials. Ph.D. Thesis, KTH Royal Institute of Technology, Stockholm, Sweden, 2015. [Google Scholar]
- Rakhimov, R.; Rakhimova, N. XV International Congress on the Chemistry of Cement (ICCC 2019). Stroit. Mater. 2019, 12, 58–61. [Google Scholar] [CrossRef]


| Material | Component (wt.%) | |||||||||||
|---|---|---|---|---|---|---|---|---|---|---|---|---|
| SiO2 | Al2O3 | Fe2O3 | MnO | MgO | CaO | Na2O | K2O | TiO2 | P2O5 | SO3 | *LoI | |
| BFS | 38.73 | 11.23 | 1.09 | 0.27 | 8.57 | 38.56 | 0.56 | 0.47 | 0.40 | 0.06 | 1.02 | 0.00 |
| FA | 44.67 | 24.54 | 6.85 | 0.09 | 1.88 | 3.88 | 0.75 | 3.16 | 1.04 | 0.49 | 1.83 | 10.72 |
| OPC | 21.69 | 5.88 | 2.55 | 0.03 | 1.56 | 59.01 | 0.79 | 1.24 | 0.13 | 0.12 | 4.15 | 2.75 |
| Precursor/Binder | Dv10 (μm) | Dv50 (μm) | Dv90 (μm) | SSA Blaine (m2/Kg) |
|---|---|---|---|---|
| BFS | 1.60 | 10.42 | 29.81 | 346 |
| FA | 1.53 | 8.38 | 35.34 | 422 |
| OPC | 1.71 | 10.91 | 33.62 | 420 |
| % Retained | |||
|---|---|---|---|
| Sieve Size mm | Dmax 2 mm | Dmax 1 mm | Dmax 0.5 mm |
| 2.000 | - | - | - |
| 1.000 | 33.47 | - | - |
| 0.500 | 32.64 | 49.19 | - |
| 0.212 | 13.17 | 19.79 | 38.86 |
| 0.125 | 15.48 | 23.27 | 45.68 |
| 0.063 | 4.27 | 6.40 | 12.66 |
| 0.045 | 0.97 | 1.40 | 2.80 |
| Aggregates | Humidity (%) | Water Absorption (%) | Density (g/mL) | Loose Bulk Density (g/mL) | % Voids | faspect | fsphericity | fconvexity | Quartz | Microcline | Calcite | Dolomite | Moscovite |
|---|---|---|---|---|---|---|---|---|---|---|---|---|---|
| S | 0.07 | 0.08 | 2.64 | 1.68 | 36.36 | 0.79 | 0.82 | 1.22 | 98.30 | 1.70 | - | - | - |
| L | 0.02 | 0.13 | 2.70 | 1.69 | 37.40 | 0.61 | 0.72 | 3.51 | - | - | - | 100 | - |
| R | 0.05 | 4.81 | 2.71 | 1.50 | 44.65 | 0.48 | 0.63 | 1.83 | 2.70 | - | 16.10 | 79.90 | 1.30 |
| Mortars | Nature of Aggregate | Binder (g) | Liquid (g) | Aggregates (S, L) (g) | Recycled Aggregate (g) |
|---|---|---|---|---|---|
| OPC 2 S (Dmax 2 mm) | 100% S | 675 | 351.00 | 1350 | 0.00 |
| OPC 1 S (Dmax 1 mm | 100% S | 675 | 357.75 | 1350 | 0.00 |
| OPC 0.5 S (Dmax 0.5 mm) | 100% S | 675 | 391.50 | 1350 | 0.00 |
| OPC 2 L (Dmax 2mm) | 100% L | 675 | 351.00 | 1350 | 0.00 |
| OPC 2 R (Dmax 2mm) | 100% R | 675 | 506.25 | 0.00 | 1350 |
| OPC 90% S + 10% R (Dmax 2 mm) | 90% S + 10% R | 675 | 351.00 | 1215 | 135 |
| OPC 80% S + 20% R (Dmax 2 mm) | 80% S + 20% R | 675 | 351.00 | 1080 | 270 |
| OPC 50% S + 50% R (Dmax 2 mm) | 50% S + 50% R | 675 | 506.25 | 675 | 675 |
| AAS-WG 2 S (Dmax 2 mm) | 100% S | 675 | 378.00 | 1350 | 0.00 |
| AAS-WG 1 S (Dmax 1 mm | 100% S | 675 | 384.75 | 1350 | 0.00 |
| AAS-WG 0.5 S (Dmax 0.5 mm) | 100% S | 675 | 478.75 | 1350 | 0.00 |
| AAS-WG 2 L (Dmax 2 mm) | 100% L | 675 | 384.75 | 1350 | 0.00 |
| AAS-WG 2 R (Dmax 2 mm) | 100% R | 675 | 513.00 | 0.00 | 1350 |
| AAS-WG 90% S + 10% R (Dmax 2 mm) | 90% S + 10% R | 675 | 378.00 | 1215 | 135 |
| AAS-WG 80% S + 20% R (Dmax 2 mm) | 80% S + 20% R | 675 | 384.00 | 1080 | 270 |
| AAS-WG 50% S + 50% R (Dmax 2 mm) | 50% S + 50% R | 675 | 513.00 | 675 | 675 |
| AAFM 2 S (Dmax 2 mm) | 100% S | 675 | 405.00 | 1350 | 0.00 |
| AAFM 1 S (Dmax 1 mm) | 100% S | 675 | 418.50 | 1350 | 0.00 |
| AAFM 0.5 S (Dmax 0.5 mm) | 100% S | 675 | 479.25 | 1350 | 0.00 |
| AAFM 2 L (Dmax 2 mm) | 100% L | 675 | 405.00 | 1350 | 0.00 |
| AAFM 2 R (Dmax 2 mm) | 100% R | 675 | 546.75 | 0.00 | 1350 |
| AAFM 90% S+10% R (Dmax 2 mm) | 90% S + 10% R | 675 | 405.00 | 1215 | 135 |
| AAFM 80% S + 20% R (Dmax 2 mm) | 80% S + 20% R | 675 | 405.00 | 1080 | 270 |
| AAFM 50% S + 50% R (Dmax 2 mm) | 50% S + 50% R | 675 | 546.75 | 675 | 675 |
| Aggregates | AAS-WG | AAFA-10M | OPC | ||||||
|---|---|---|---|---|---|---|---|---|---|
| Aggregates | l/s | Spread flow (mm) | Density (Kg/m3) | l/s | Spread Flow (mm) | Density (Kg/m3) | l/s | Spread Flow (mm) | Density (Kg/m3) |
| S Dmax 2 mm | 0.56 | 151 | 2242 | 0.60 | 151 | 2184 | 0.52 | 150 | 2192 |
| S Dmax 1 mm | 0.57 | 155 | 2195 | 0.62 | 149 | 2174 | 0.53 | 152 | 2181 |
| S Dmax 0.5 mm | 0.65 | 157 | 2182 | 0.71 | 151 | 2122 | 0.58 | 150 | 2118 |
| 100% S | 0.56 | 151 | 2242 | 0.60 | 151 | 2184 | 0.52 | 150 | 2192 |
| 100% L | 0.57 | 155 | 2189 | 0.60 | 148 | 2162 | 0.52 | 148 | 2180 |
| 100% R | 0.76 | 155 | 2032 | 0.81 | 147 | 1975 | 0.75 | 155 | 2018 |
| 90% S + 10% R | 0.57 | 158 | 2239 | 0.61 | 147 | 2176 | 0.53 | 147 | 2189 |
| 80% S + 20% R | 0.57 | 150 | 2216 | 0.62 | 144 | 2119 | 0.54 | 146 | 2159 |
| 50% S + 50% R | 0.65 | 151 | 2183 | 0.73 | 151 | 2064 | 0.64 | 157 | 2124 |
| Aggregates | AAS WG | AAFA 10M | OPC | |||
|---|---|---|---|---|---|---|
| ϕ | Voids Ratio | ϕ | Voids Ratio | ϕ | Voids Ratio | |
| S Dmax 2 mm | 0.69 | 0.44 | 0.71 | 0.41 | 0.67 | 0.48 |
| S Dmax 1 mm | 0.68 | 0.47 | 0.70 | 0.42 | 0.67 | 0.49 |
| S Dmax 0.5 mm | 0.67 | 0.50 | 0.58 | 0.48 | 0.65 | 0.54 |
| 100% S | 0.69 | 0.44 | 0.71 | 0.41 | 0.67 | 0.48 |
| 100% L | 0.66 | 0.51 | 0.70 | 0.44 | 0.66 | 0.52 |
| 100% R | 0.68 | 0.47 | 0.70 | 0.45 | 0.67 | 0.50 |
| 90% S + 10% R | 0.70 | 0.43 | 0.71 | 0.40 | 0.68 | 0.47 |
| 80% S + 20% R | 0.70 | 0.43 | 0.70 | 0.43 | 0.67 | 0.48 |
| 50% S + 50% R | 0.70 | 0.43 | 0.69 | 0.45 | 0.67 | 0.49 |
| Aggregates | AAS WG | AAFA 10M | OPC | ||||||
|---|---|---|---|---|---|---|---|---|---|
| Aggregates | τstatic (Pa) | τdynamic (Pa) | µ (Pa·s) | τstatic (Pa) | τdynamic (Pa) | µ (Pa·s) | τstatic (Pa) | τdynamic (Pa) | µ (Pa·s) |
| S Dmax 2 mm | 28.4 | 0.7 | 26.2 | 51.0 | 40.2 | 6.6 | 120.0 | 97.4 | 4.9 |
| S Dmax 1 mm | 50.3 | 15.5 | 32.0 | 57.9 | 42.67 | 6.9 | 122.3 | 129.4 | 4.7 |
| S Dmax 0.5 mm | 153.5 | 24.5 | 33.7 | 103.5 | 69.4 | 11.7 | 337.6 | 325.2 | 7.1 |
| 100% S | 28.4 | 0.7 | 26.2 | 51.0 | 40.2 | 6.6 | 120.0 | 97.4 | 4.9 |
| 100% L | 62.5 | 1.8 | 56.0 | 106.6 | 95.0 | 12.7 | 142.8 | 110.6 | 4.9 |
| 100% R | 75.8 | 31.5 | 42.0 | 127.0 | 94.8 | 7.8 | 225.0 | 111.8 | 4.4 |
| 90% S + 10% R | 38.2 | 15.9 | 26.7 | 59.6 | 49.2 | 7.3 | 124.0 | 99.9 | 4.9 |
| 80% S + 20% R | 48.3 | 27.6 | 39.9 | 76.4 | 64.4 | 9.5 | 123.1 | 101.0 | 4.9 |
| 50% S + 50% R | 54.8 | 30.4 | 40.8 | 86.2 | 73.5 | 9.29 | 174.6 | 109.5 | 4.7 |
© 2020 by the authors. Licensee MDPI, Basel, Switzerland. This article is an open access article distributed under the terms and conditions of the Creative Commons Attribution (CC BY) license (http://creativecommons.org/licenses/by/4.0/).
Share and Cite
Gismera, S.; Alonso, M.d.M.; Palacios, M.; Puertas, F. Rheology of Alkali-Activated Mortars: Influence of Particle Size and Nature of Aggregates. Minerals 2020, 10, 726. https://doi.org/10.3390/min10080726
Gismera S, Alonso MdM, Palacios M, Puertas F. Rheology of Alkali-Activated Mortars: Influence of Particle Size and Nature of Aggregates. Minerals. 2020; 10(8):726. https://doi.org/10.3390/min10080726
Chicago/Turabian StyleGismera, Sara, María del Mar Alonso, Marta Palacios, and Francisca Puertas. 2020. "Rheology of Alkali-Activated Mortars: Influence of Particle Size and Nature of Aggregates" Minerals 10, no. 8: 726. https://doi.org/10.3390/min10080726
APA StyleGismera, S., Alonso, M. d. M., Palacios, M., & Puertas, F. (2020). Rheology of Alkali-Activated Mortars: Influence of Particle Size and Nature of Aggregates. Minerals, 10(8), 726. https://doi.org/10.3390/min10080726