Development of a More Descriptive Particle Breakage Probability Model


Abstract
1. Introduction
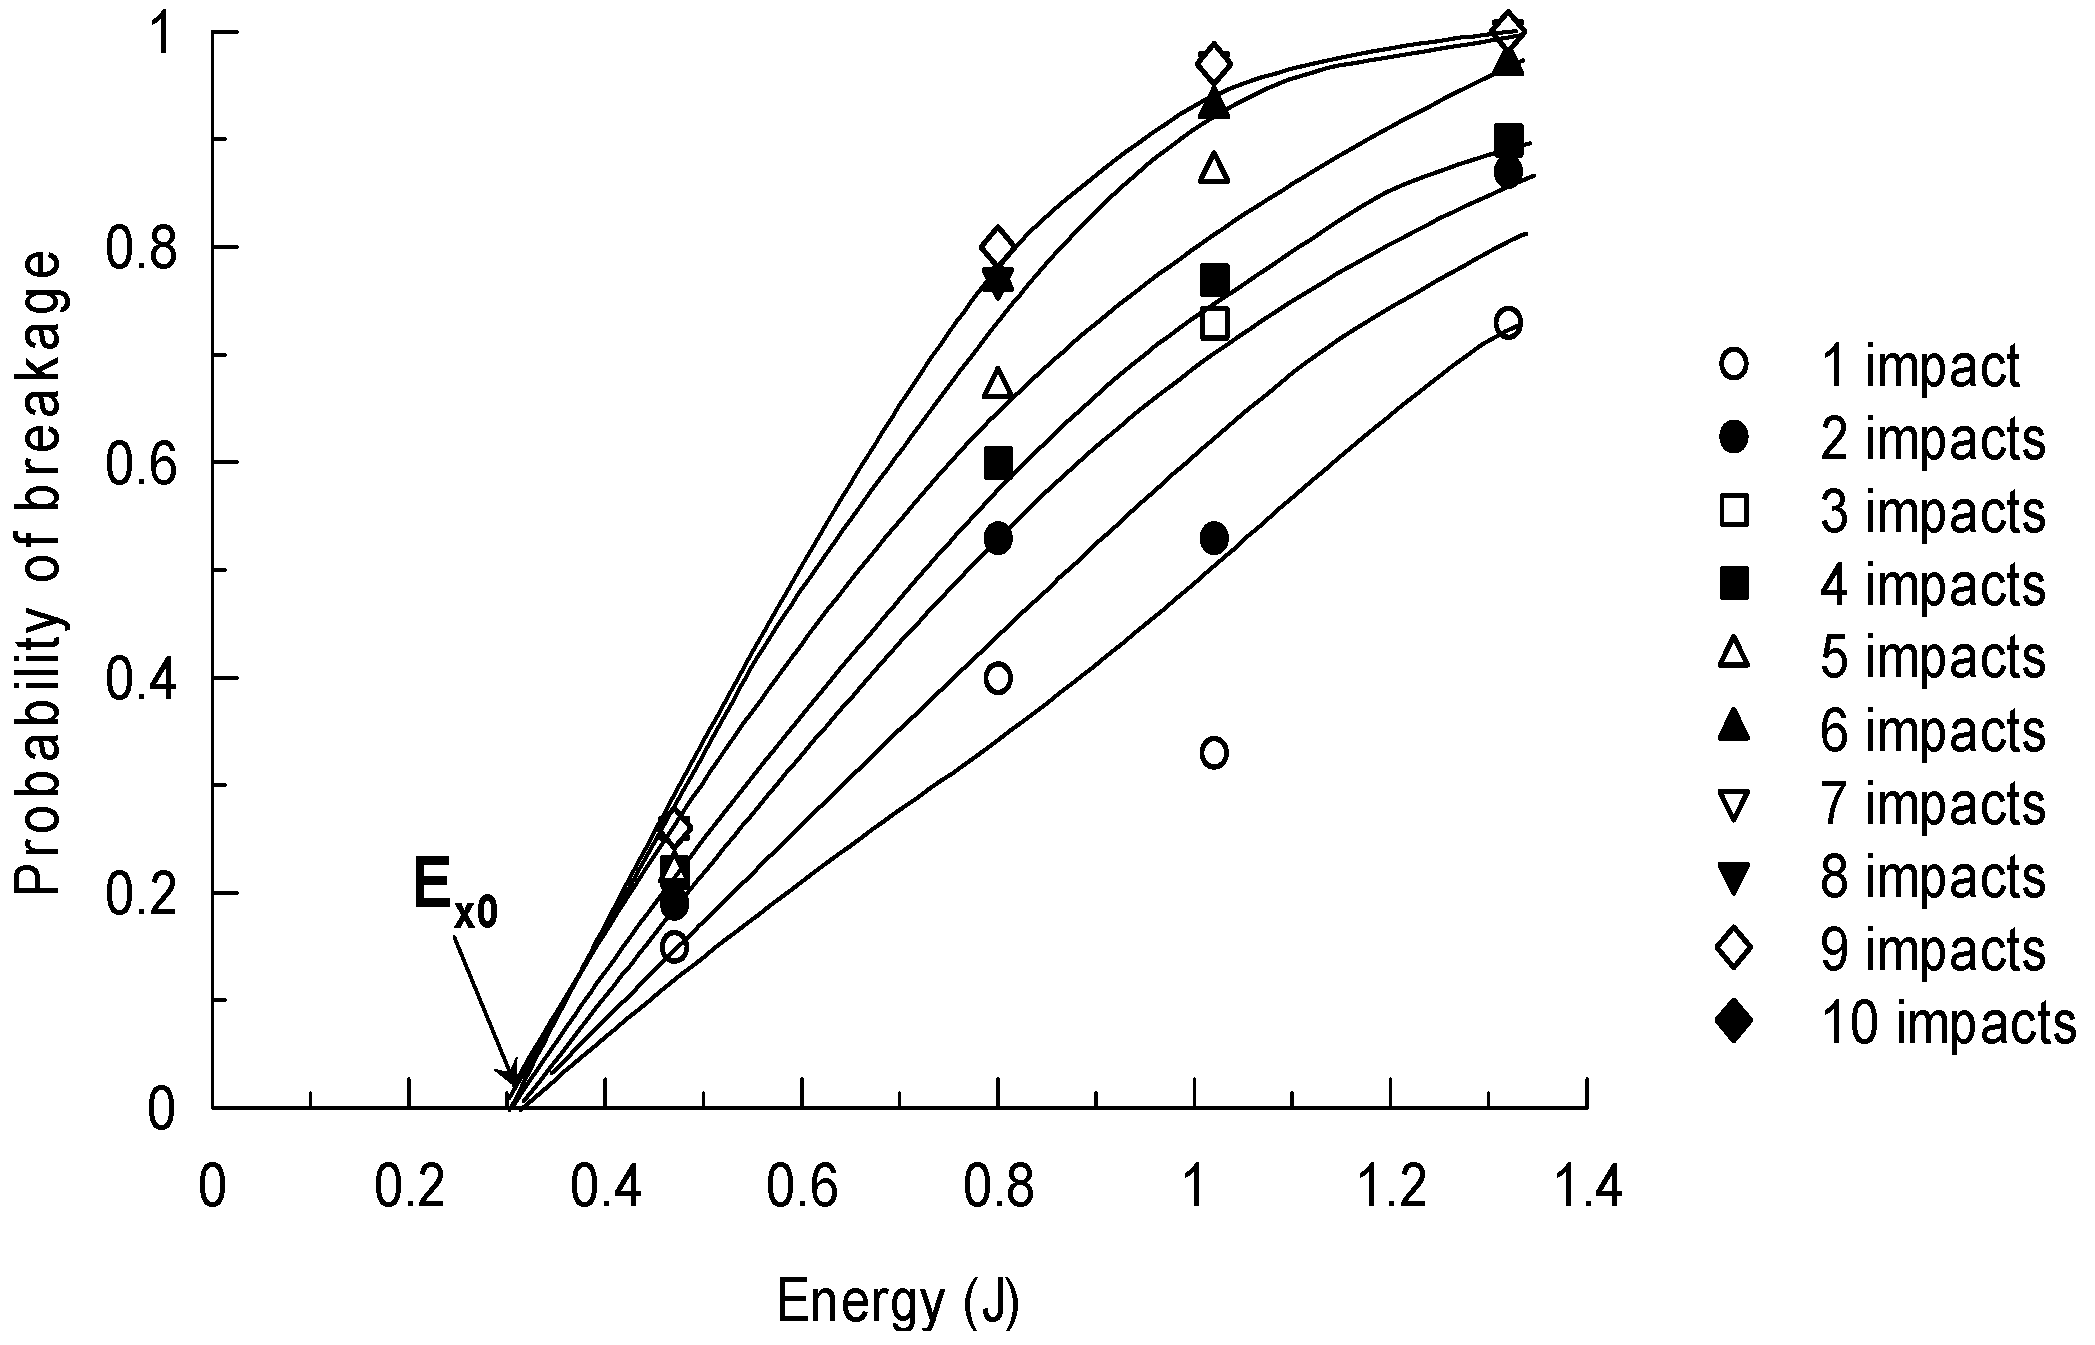
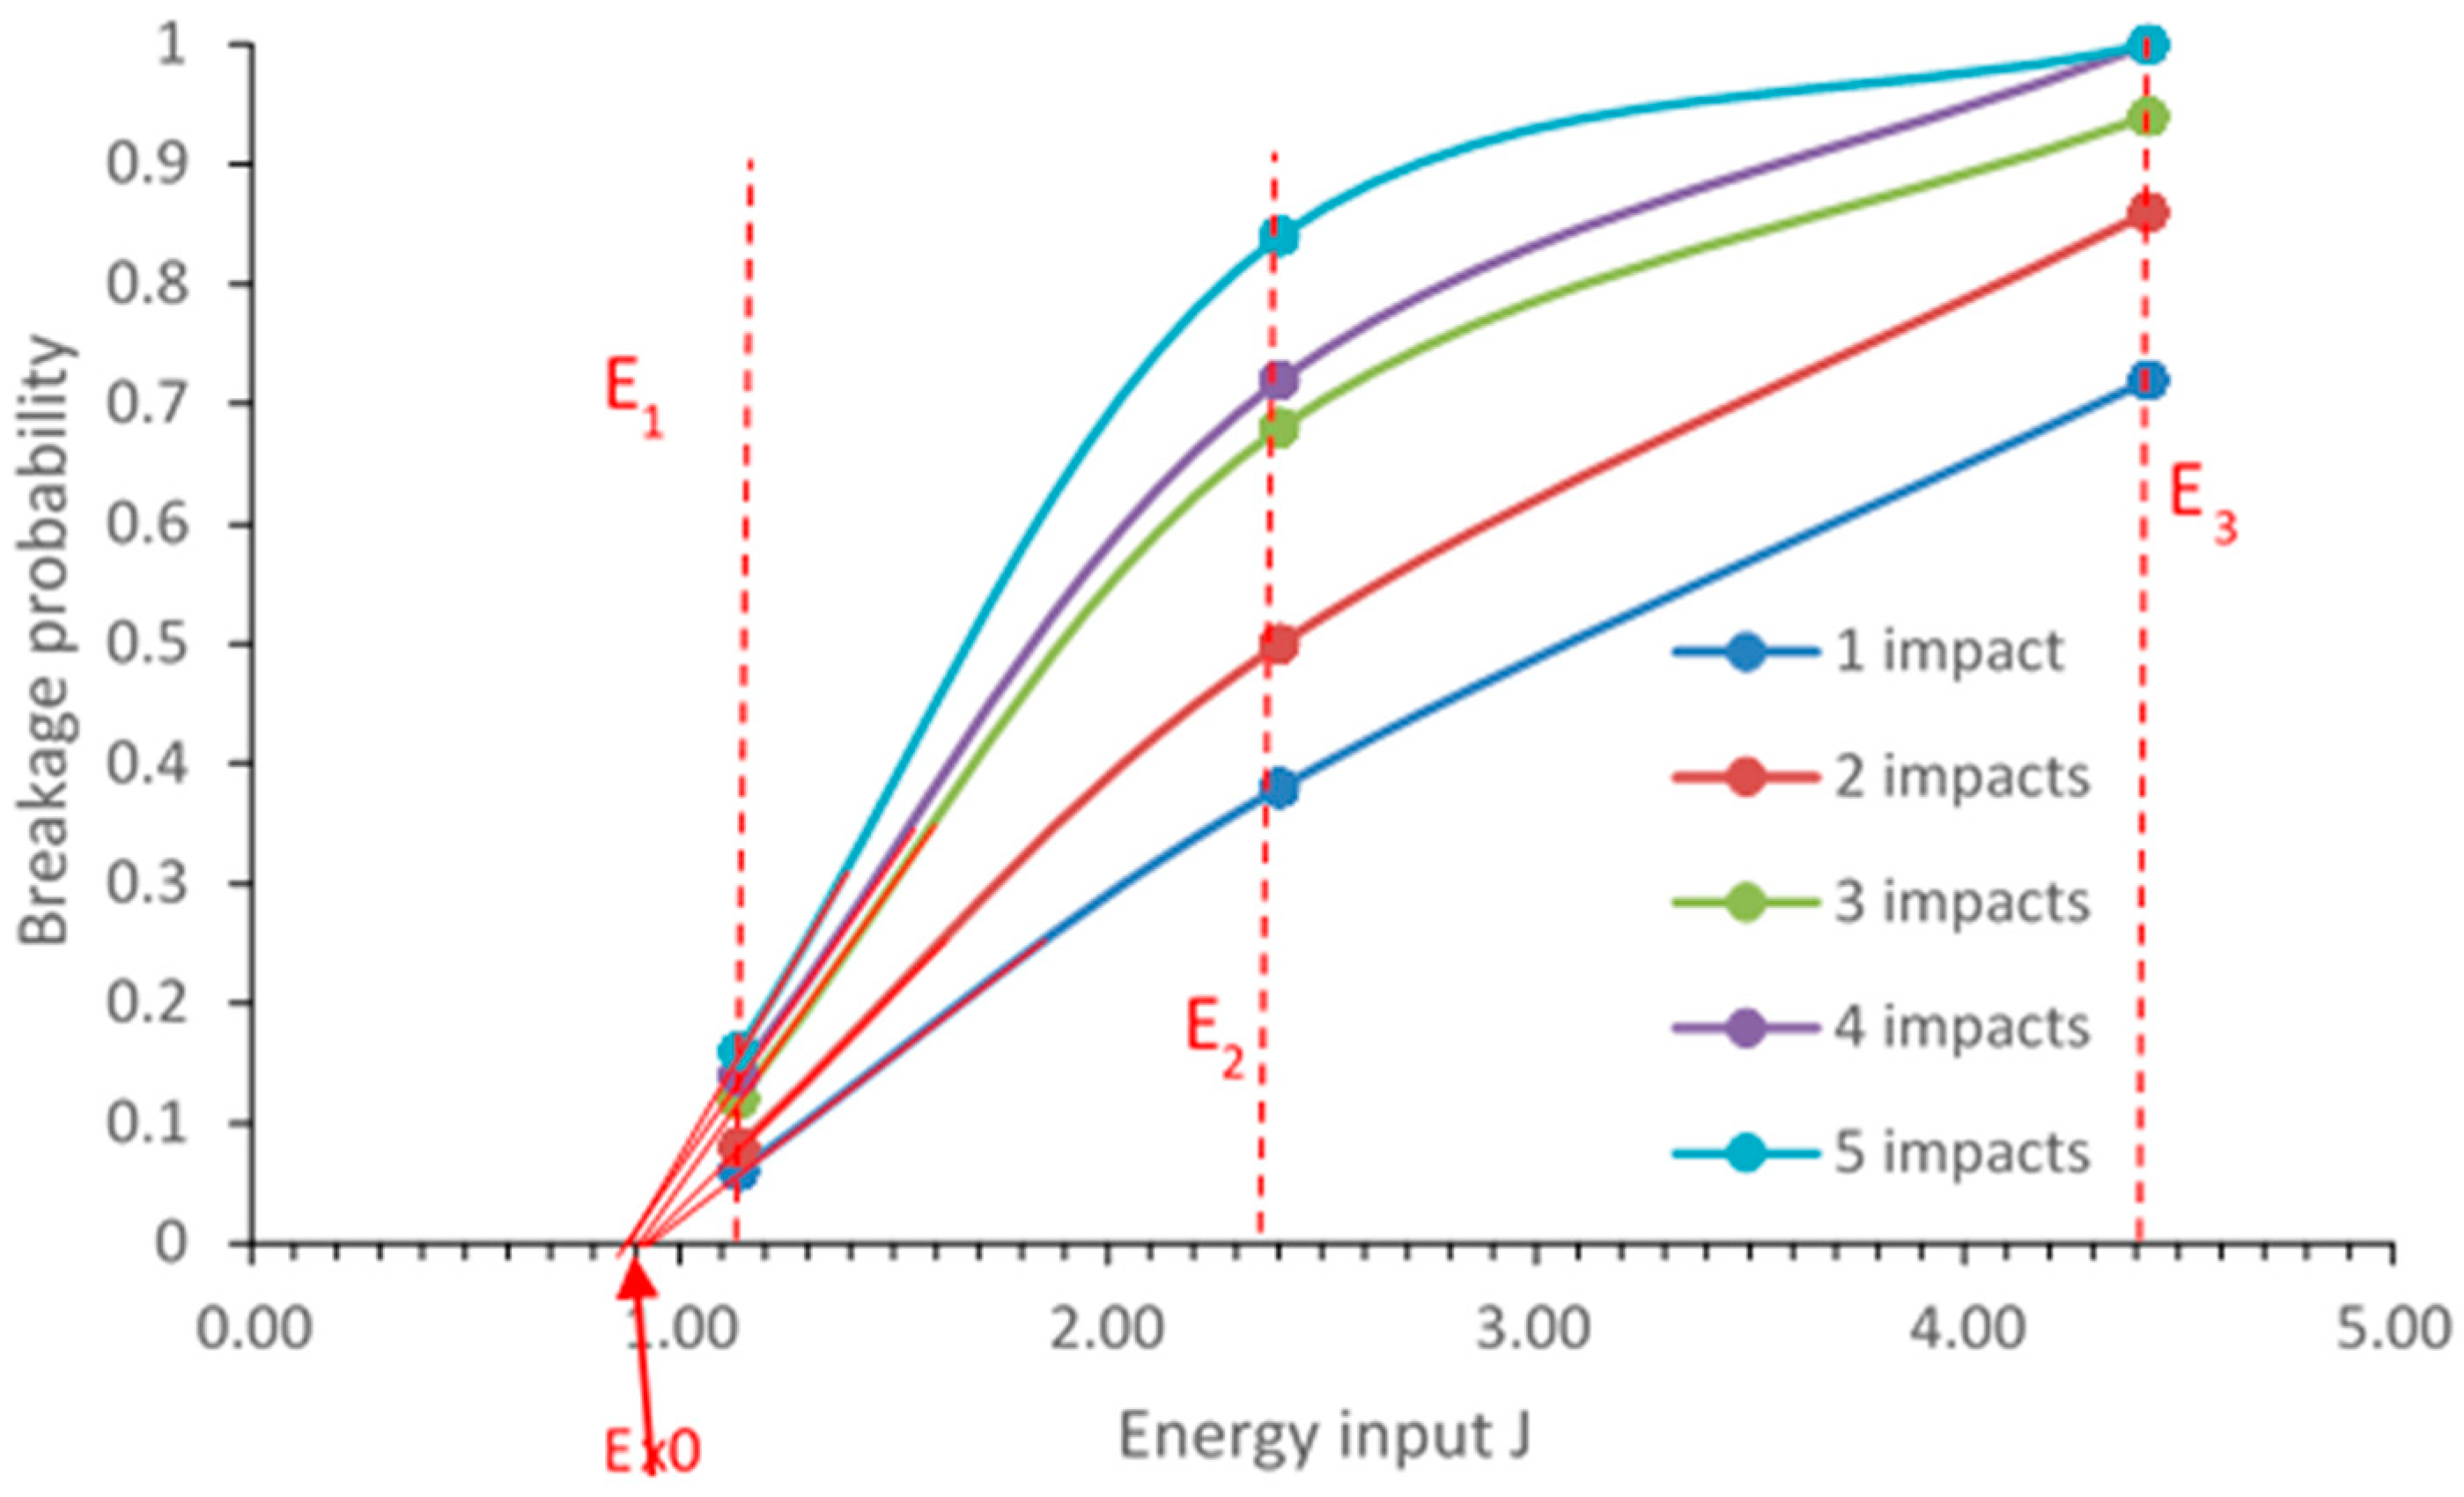
- Threshold energy
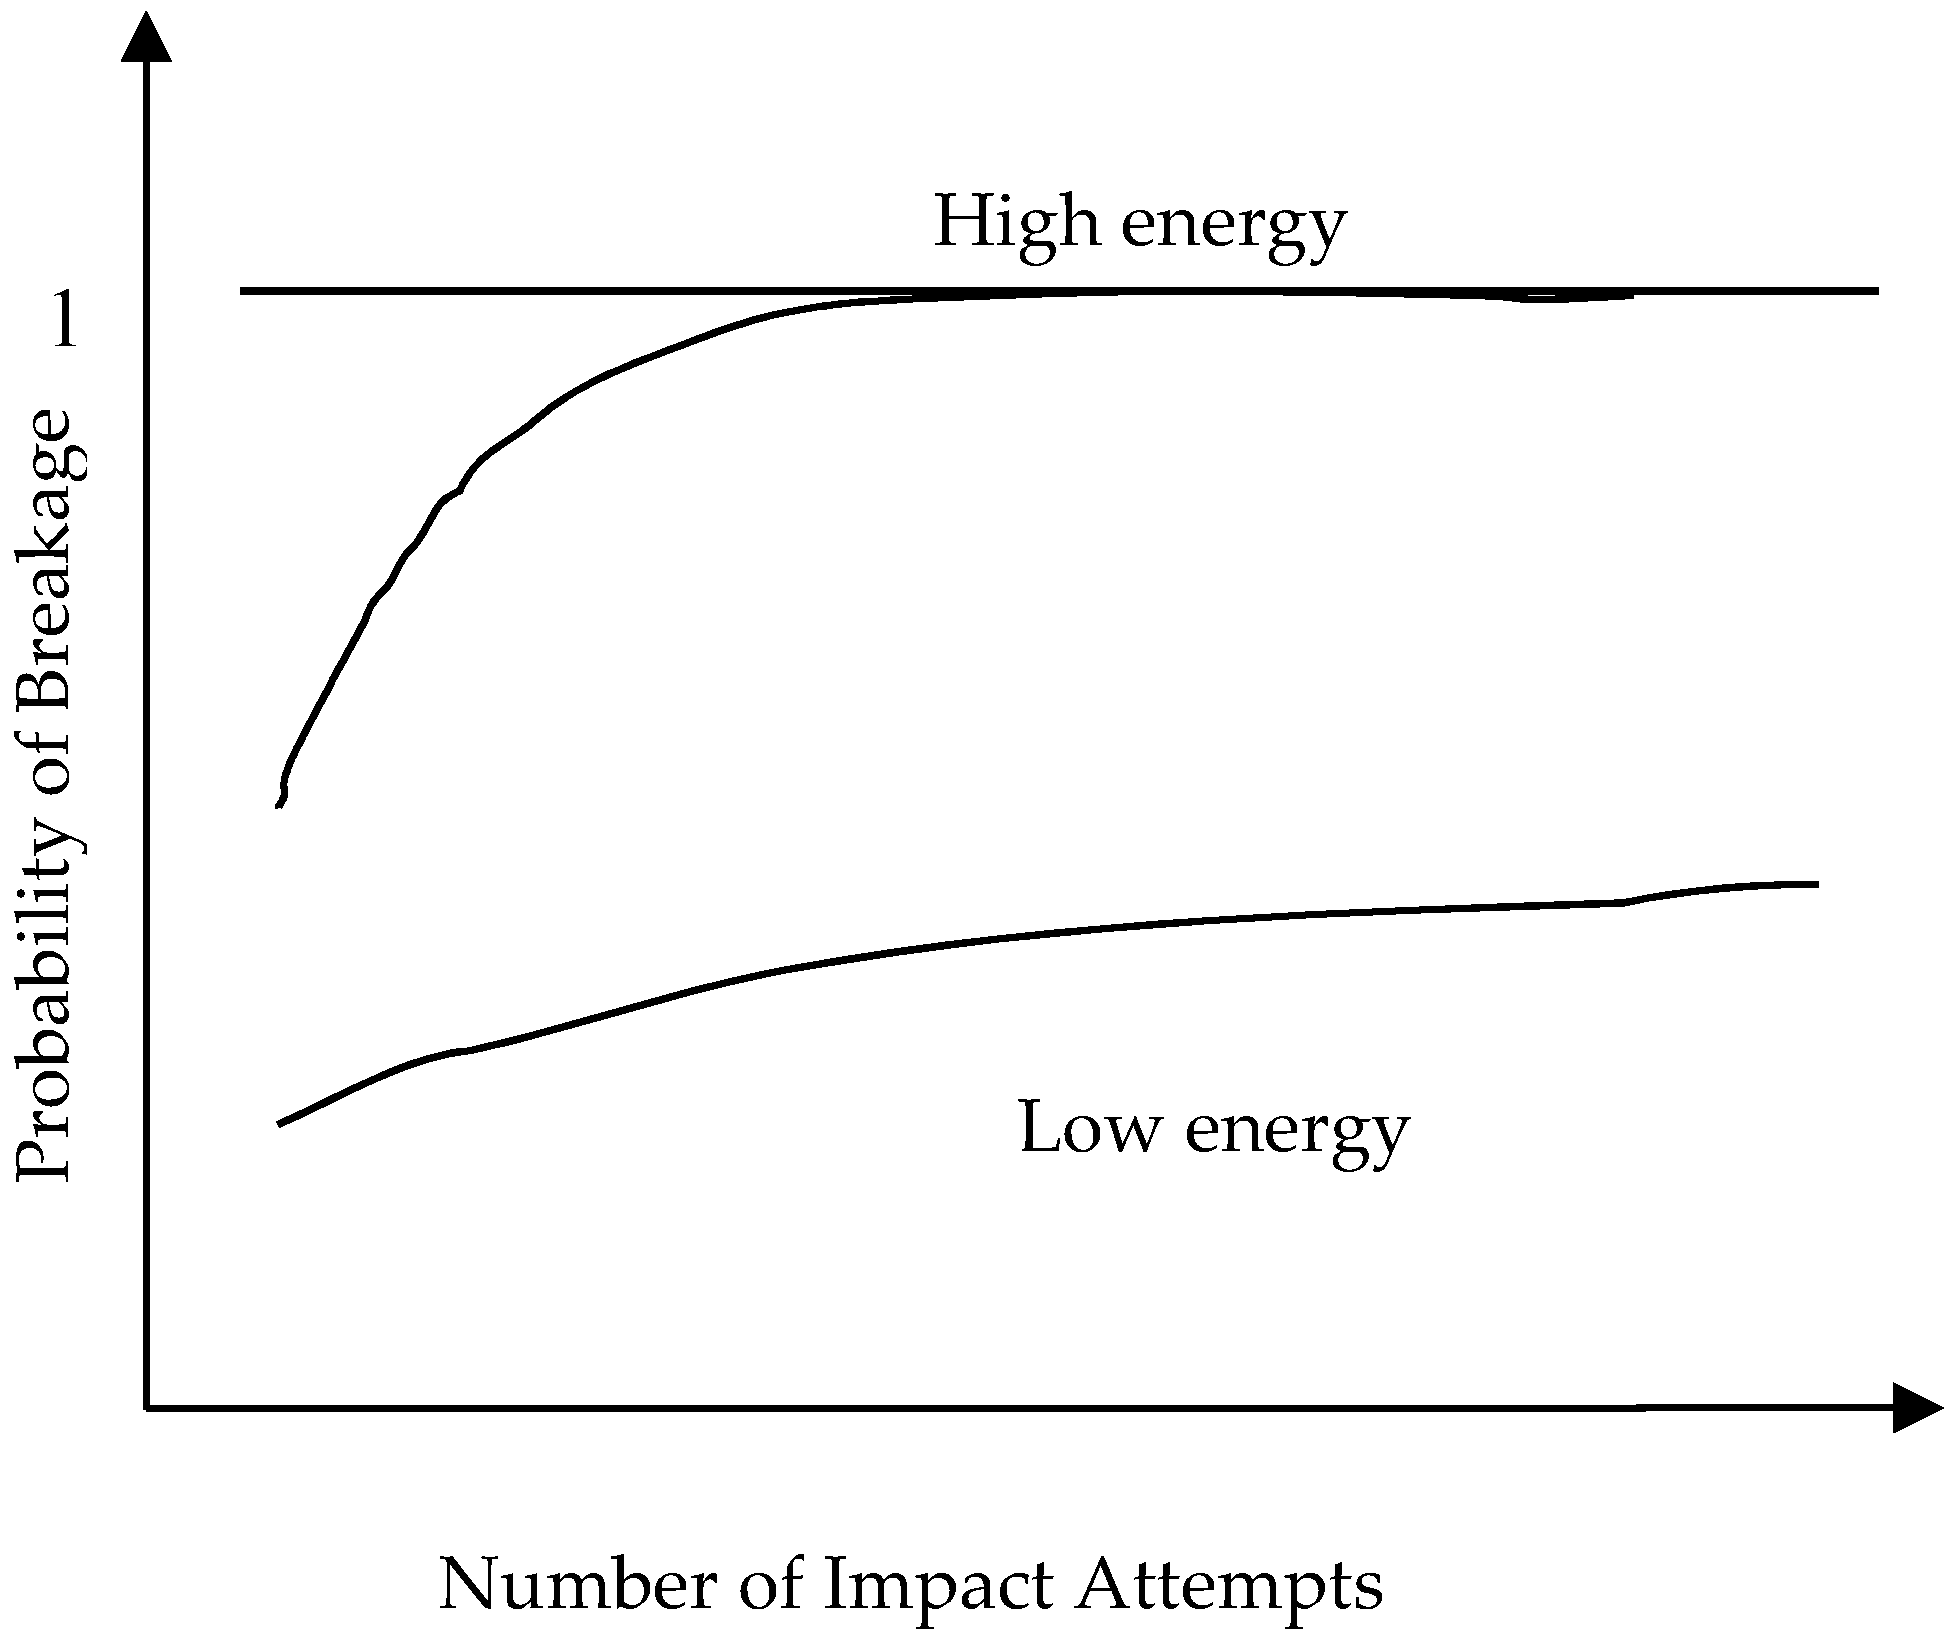
- Rate of deterioration with each impact
- Energy relationship with size
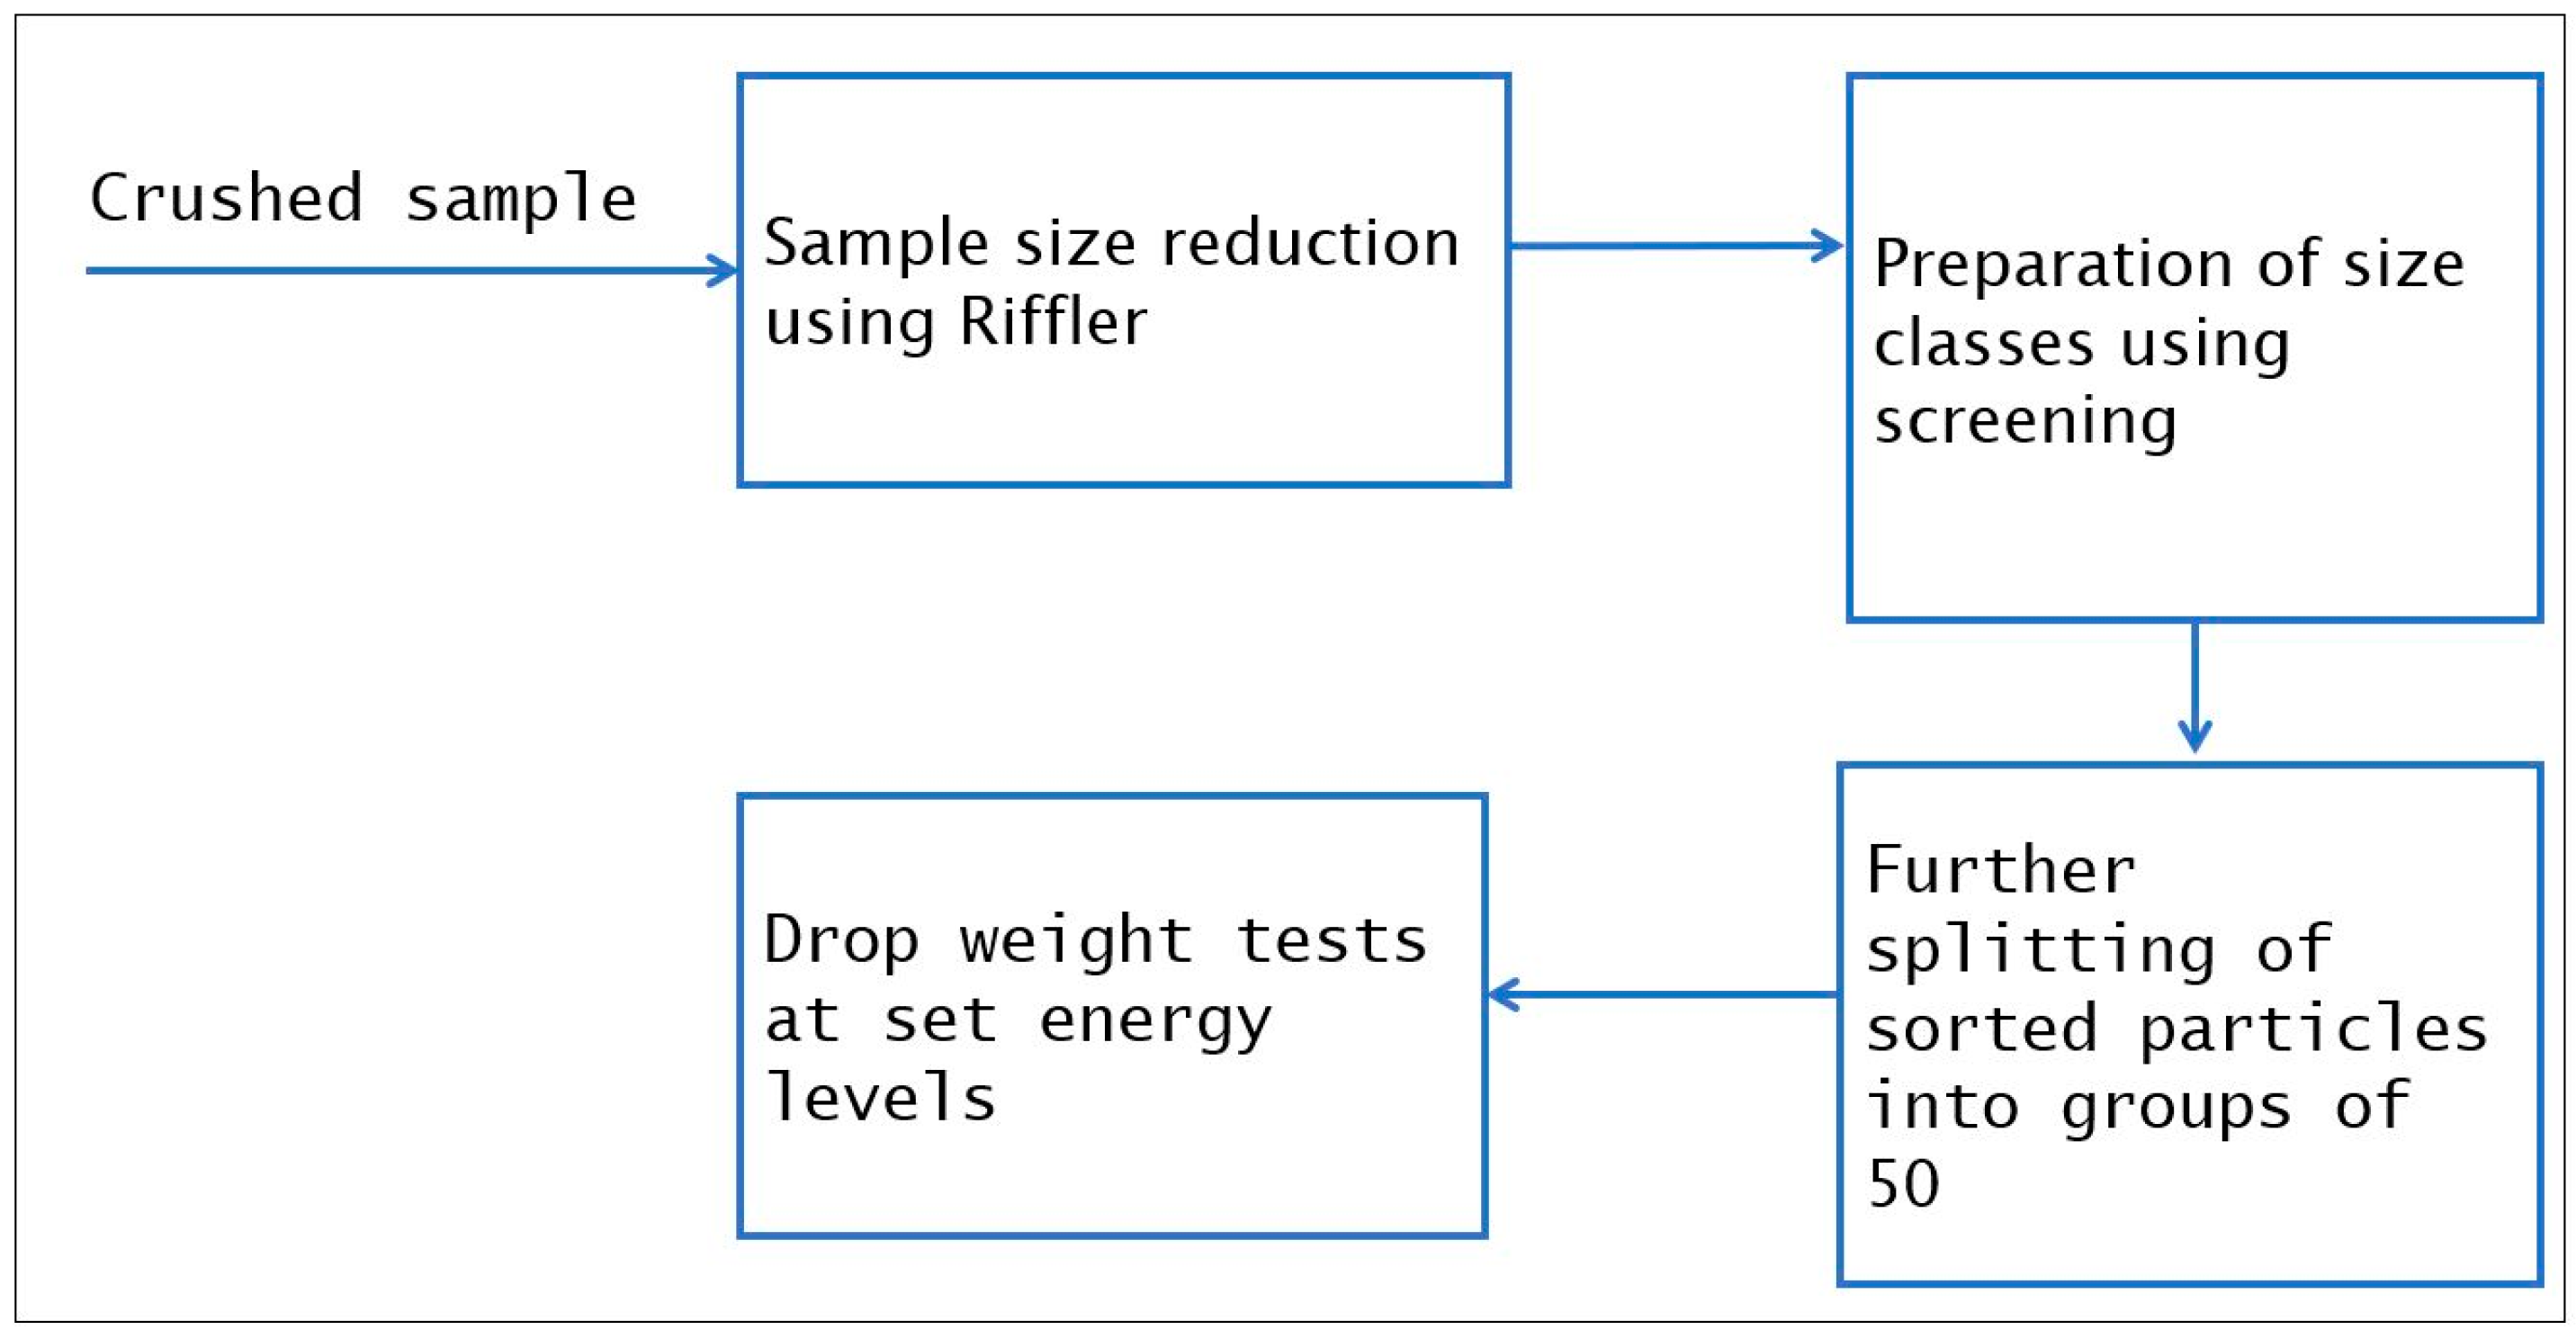
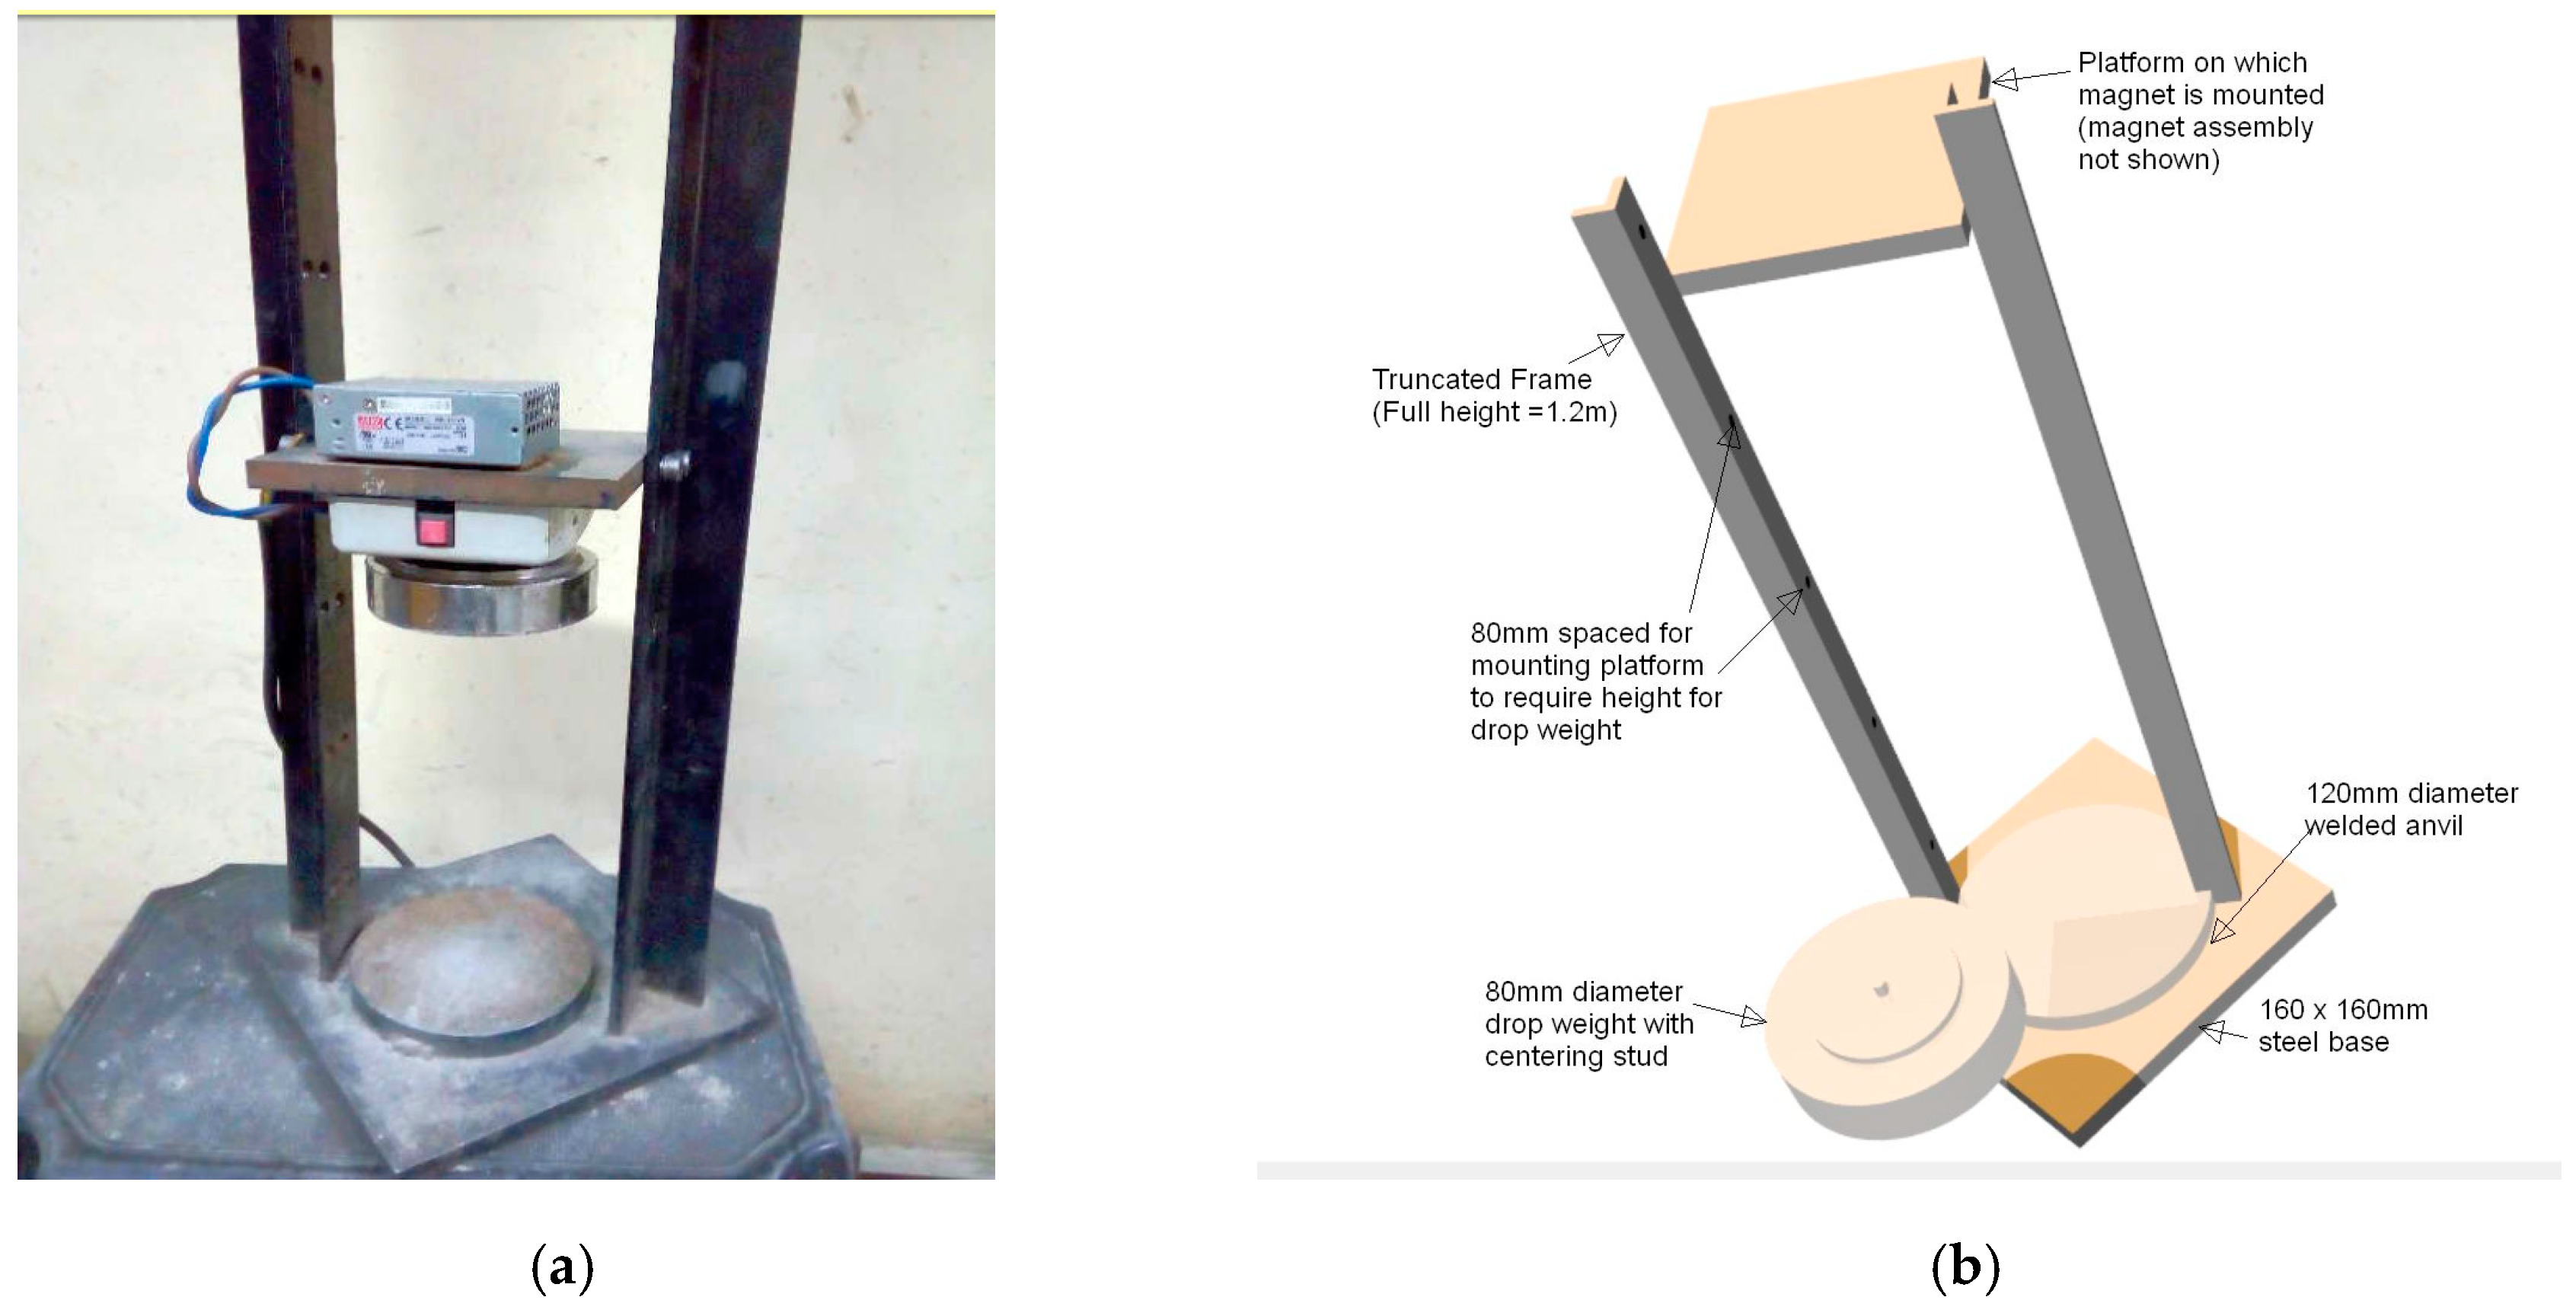
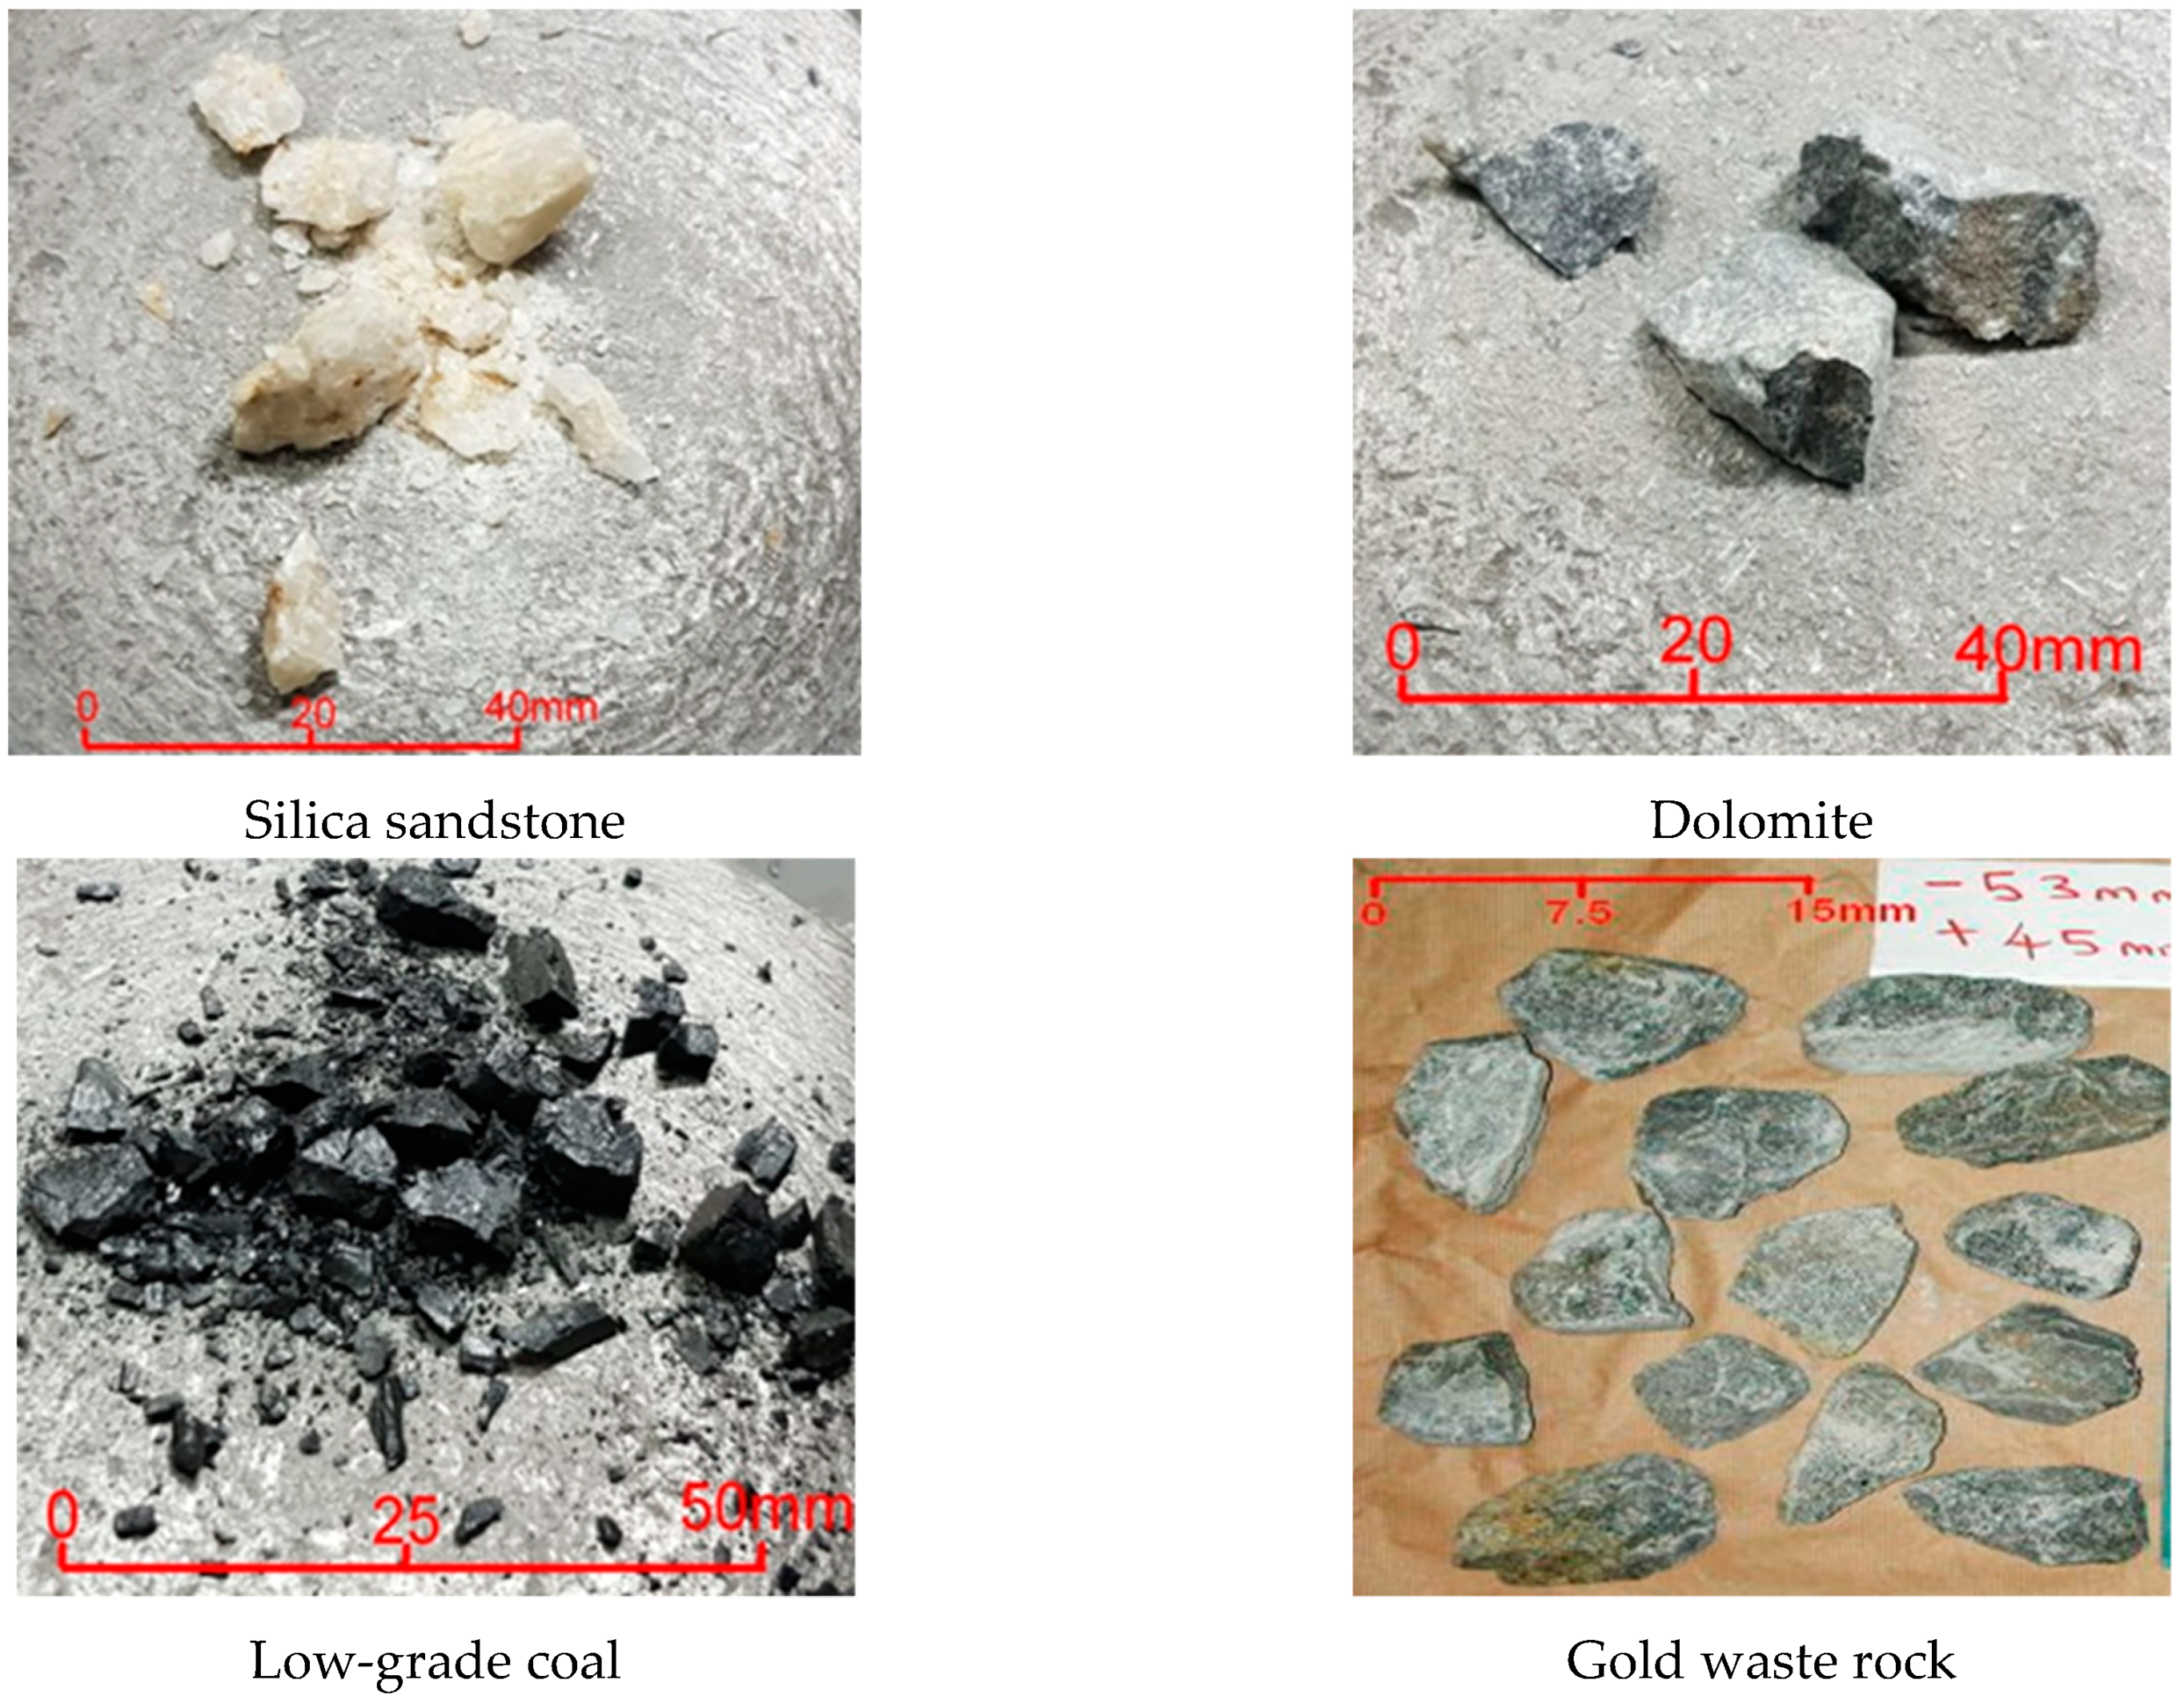
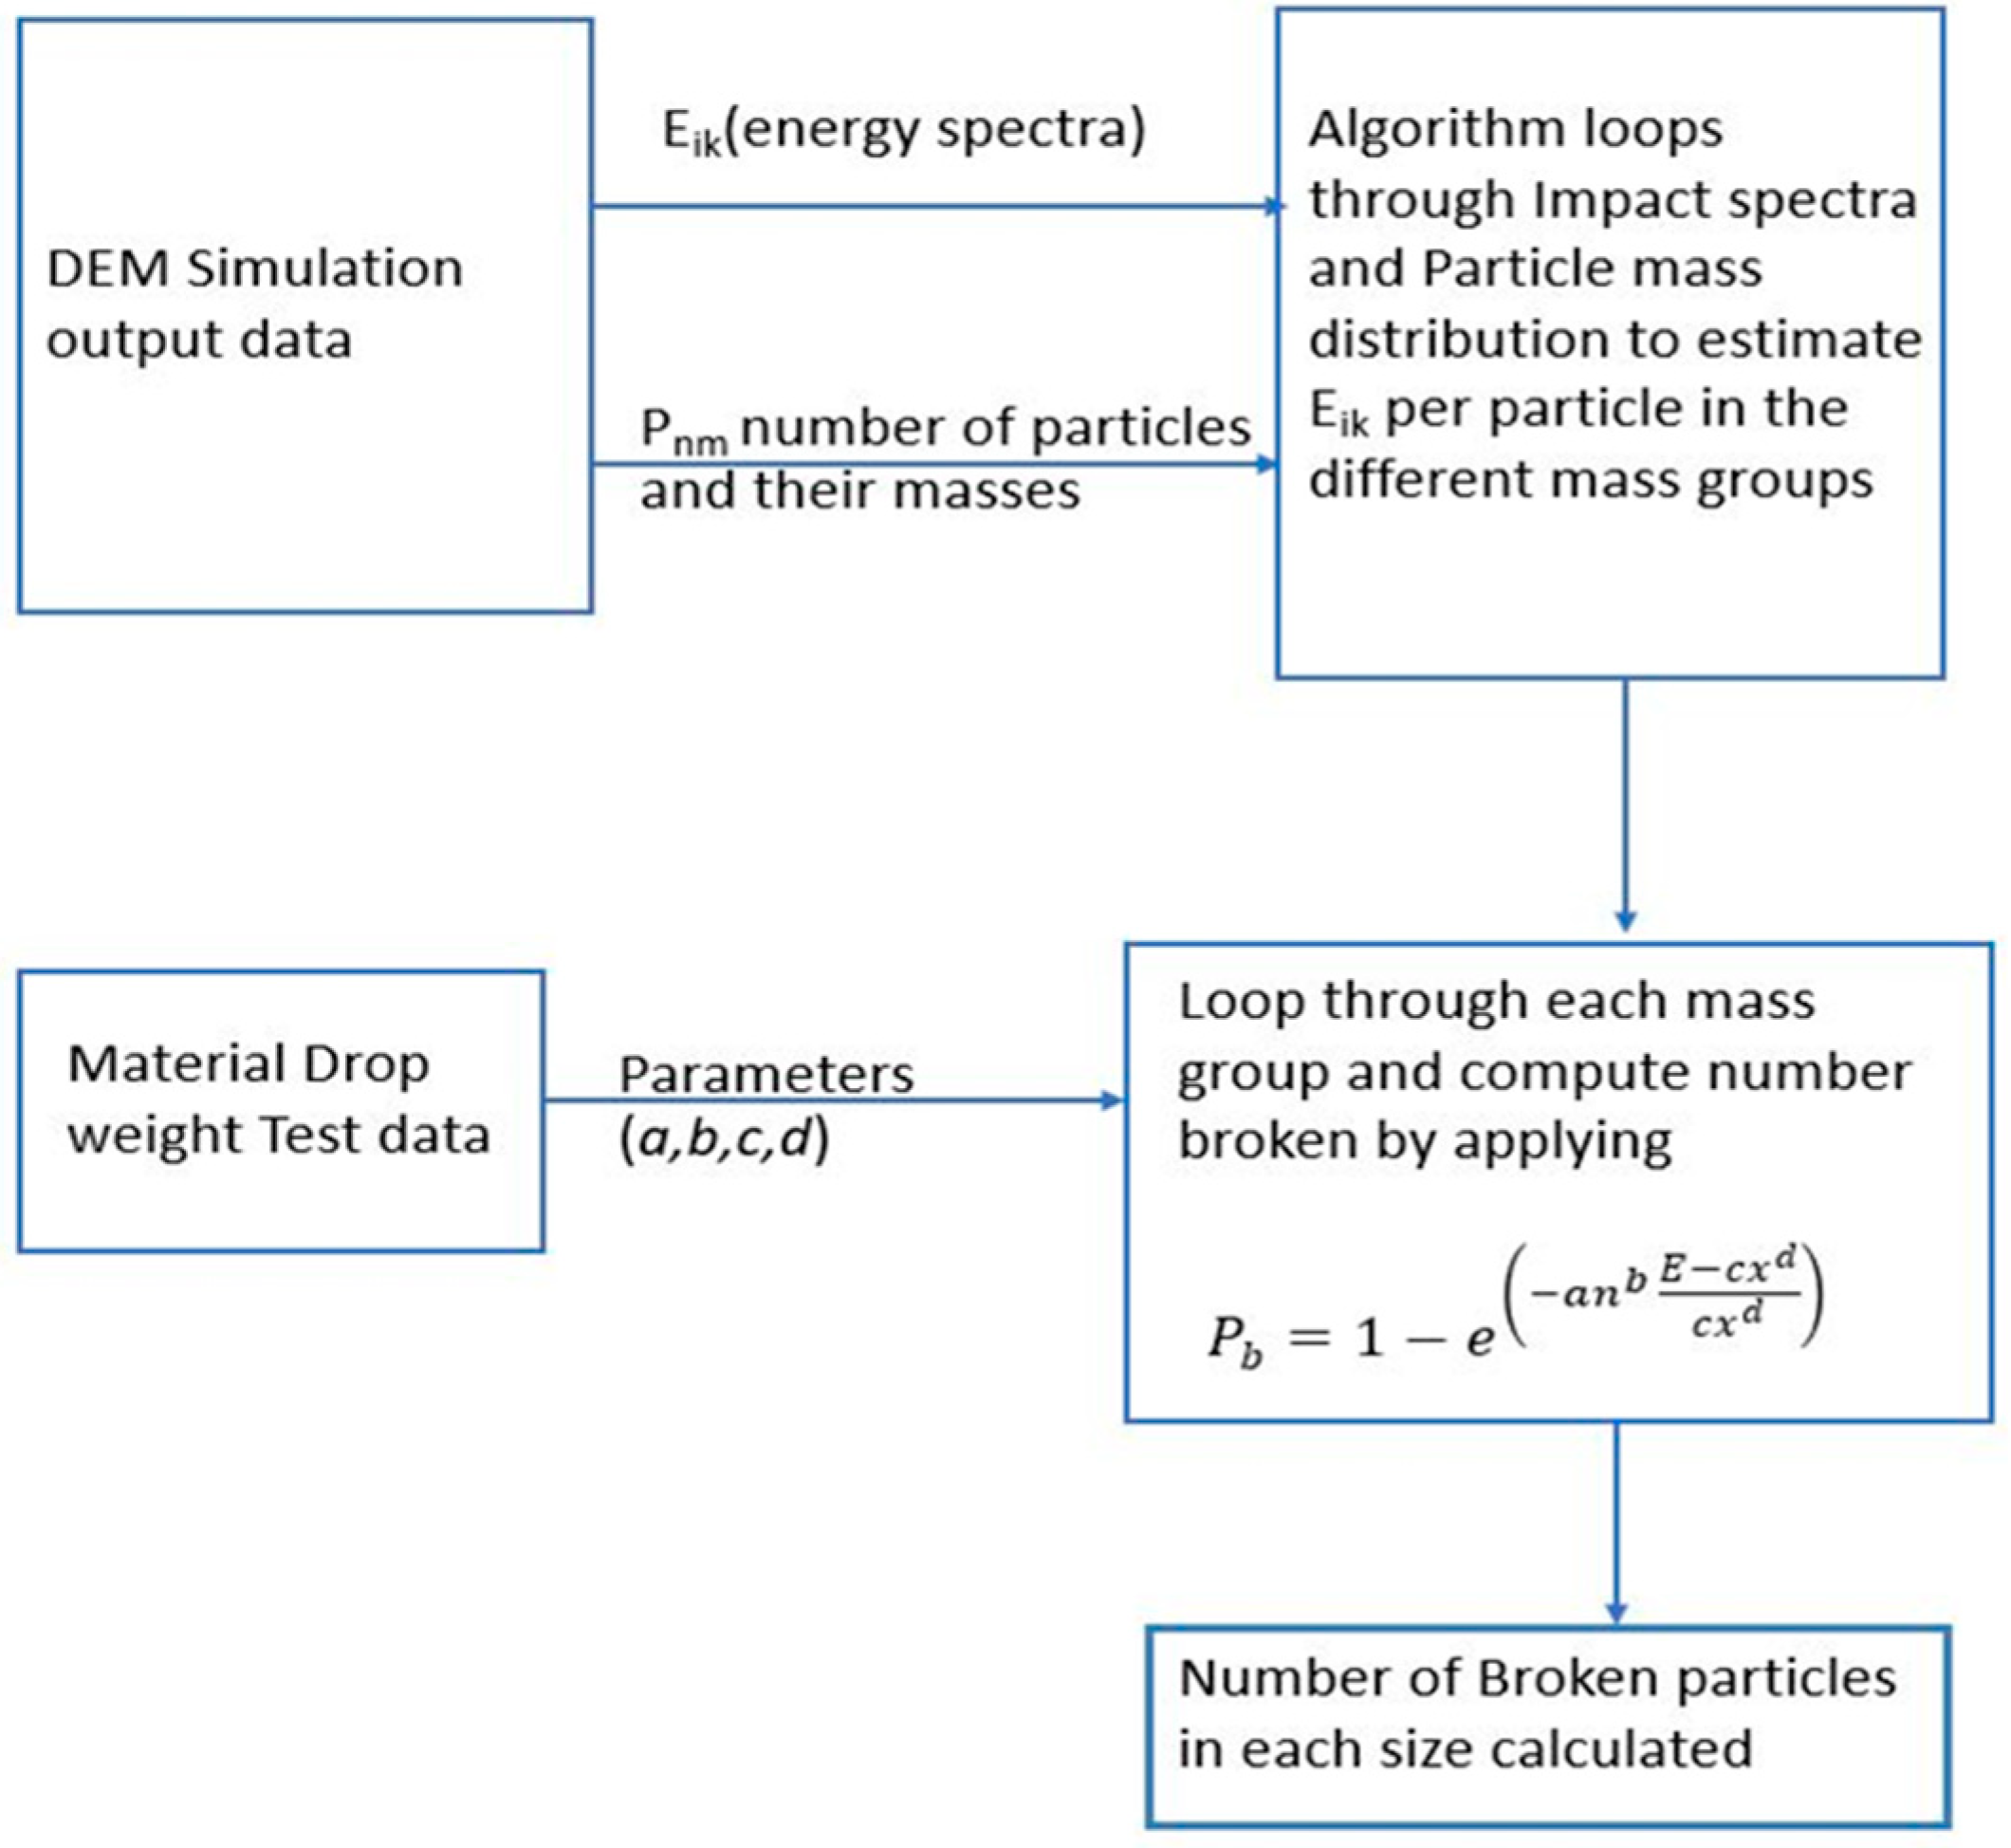
2. Materials and Methods
3. Results
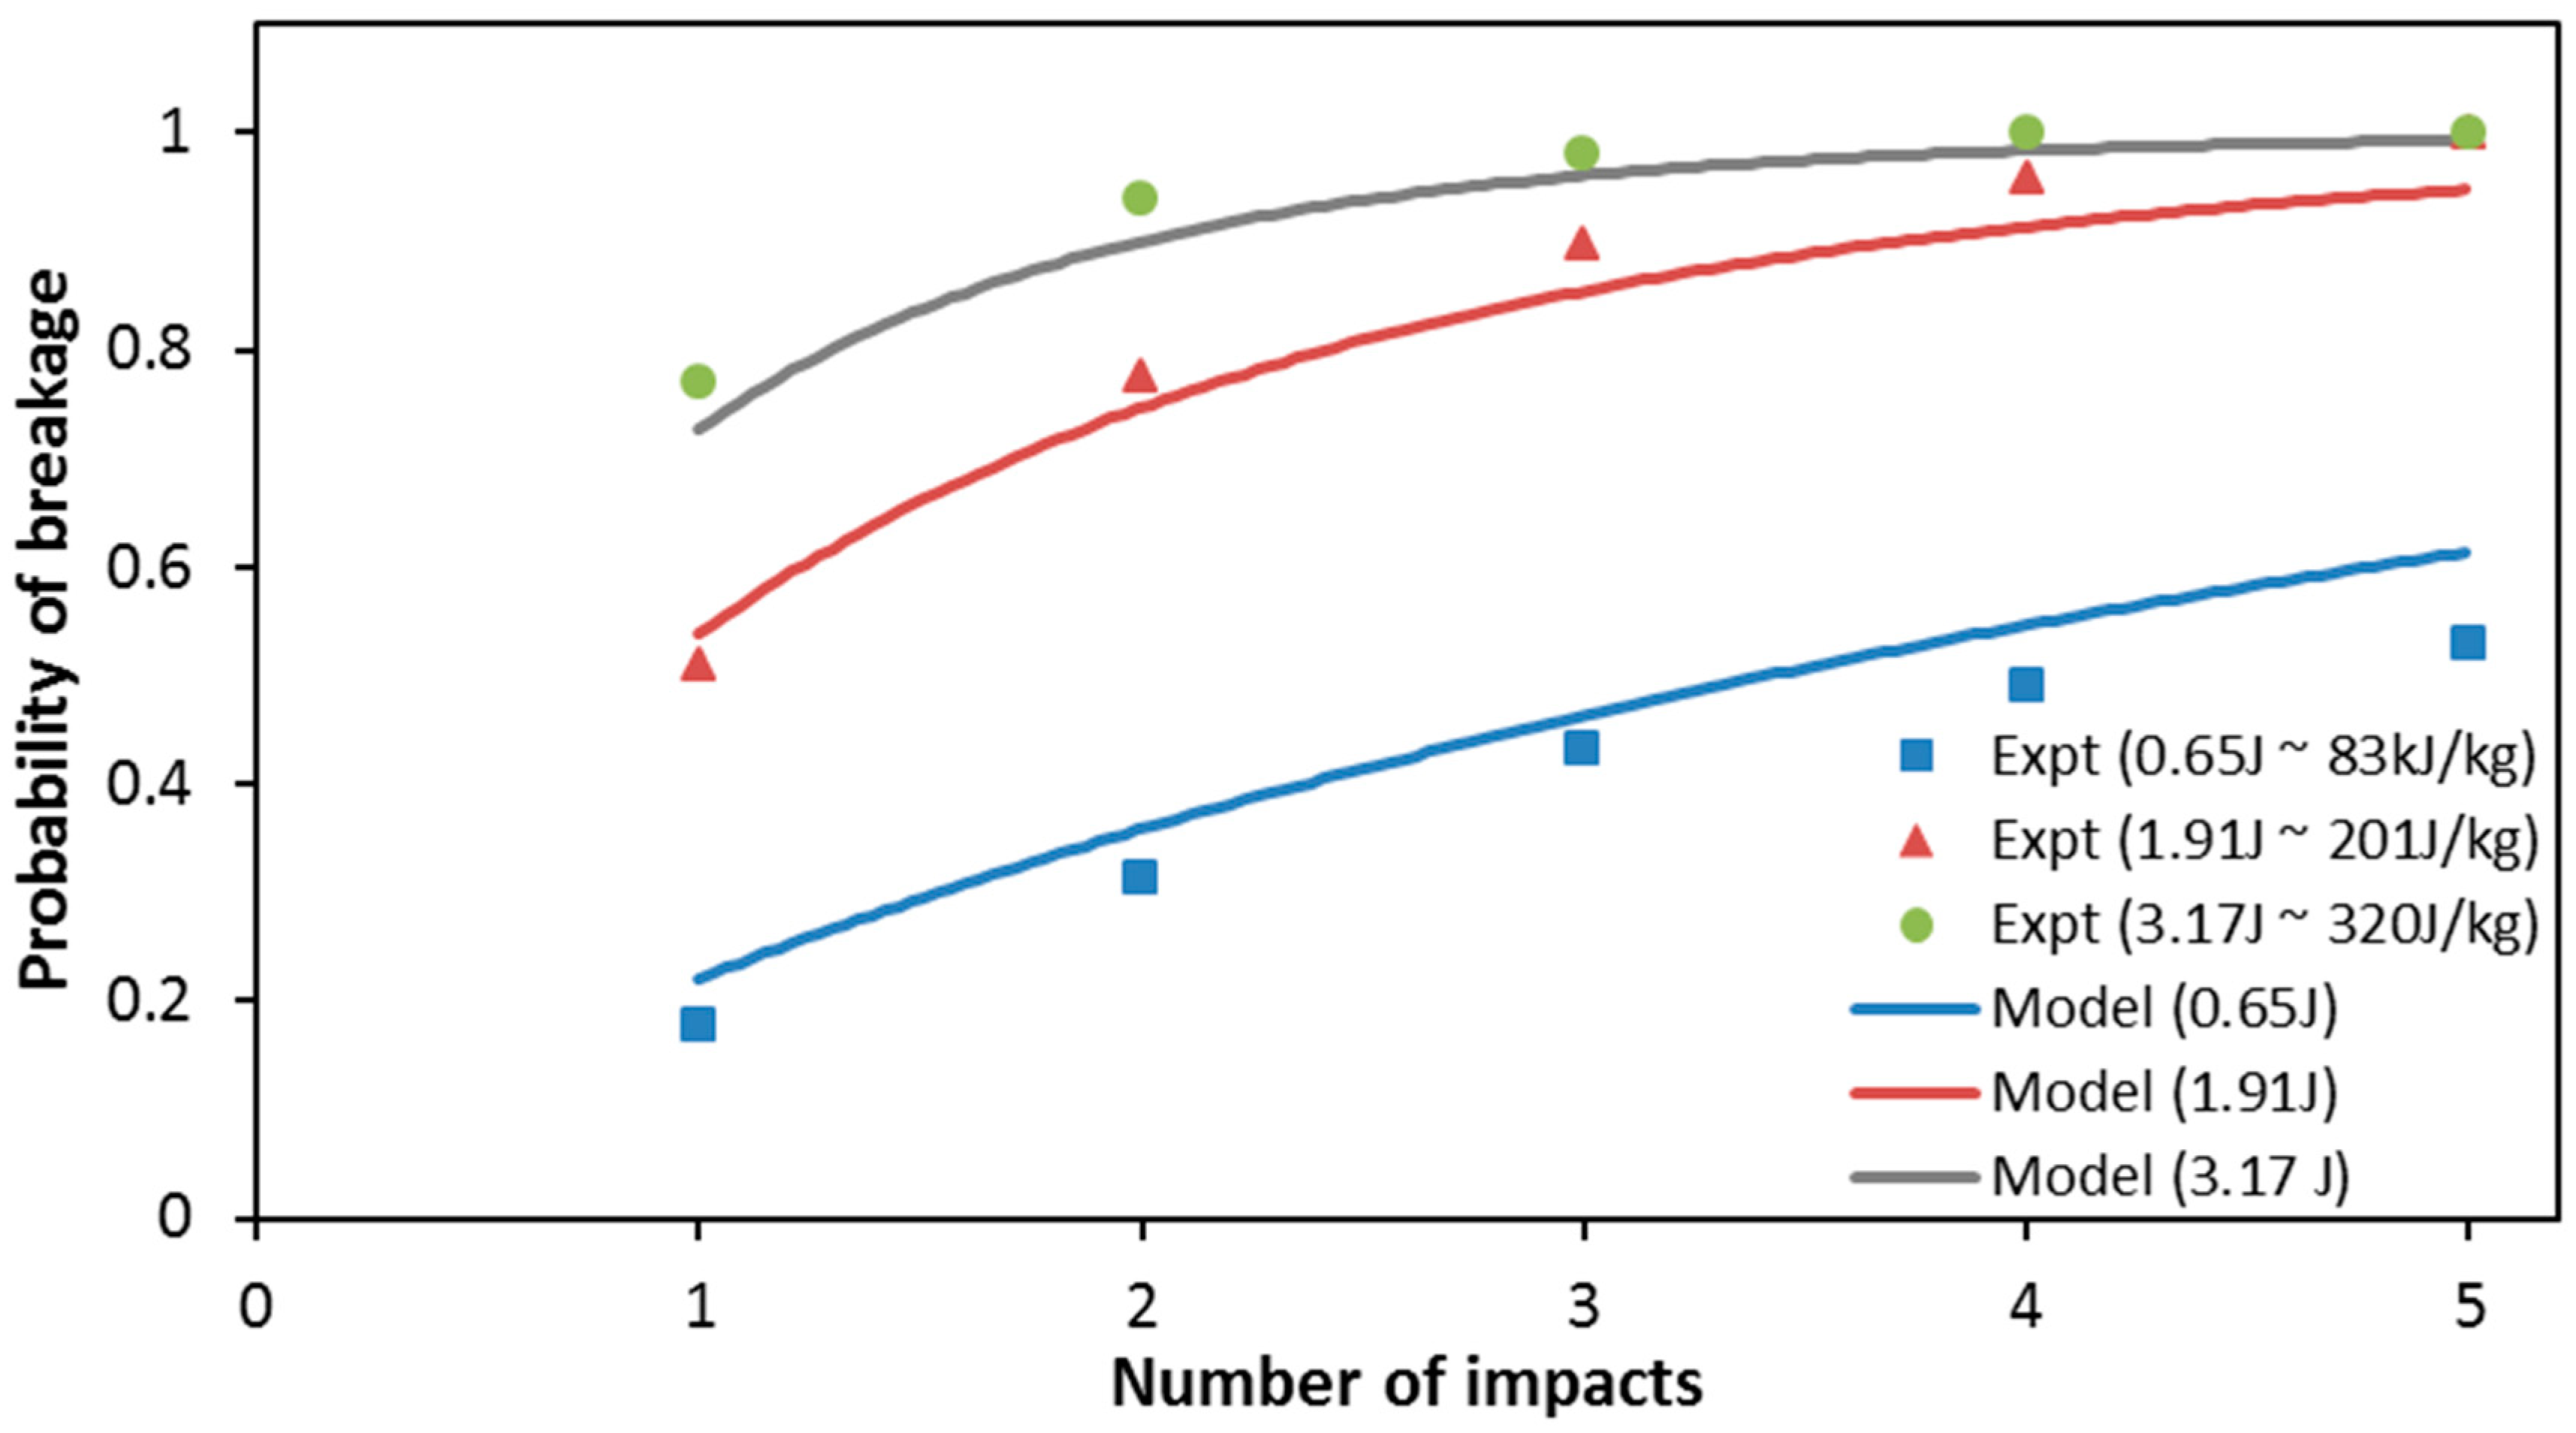
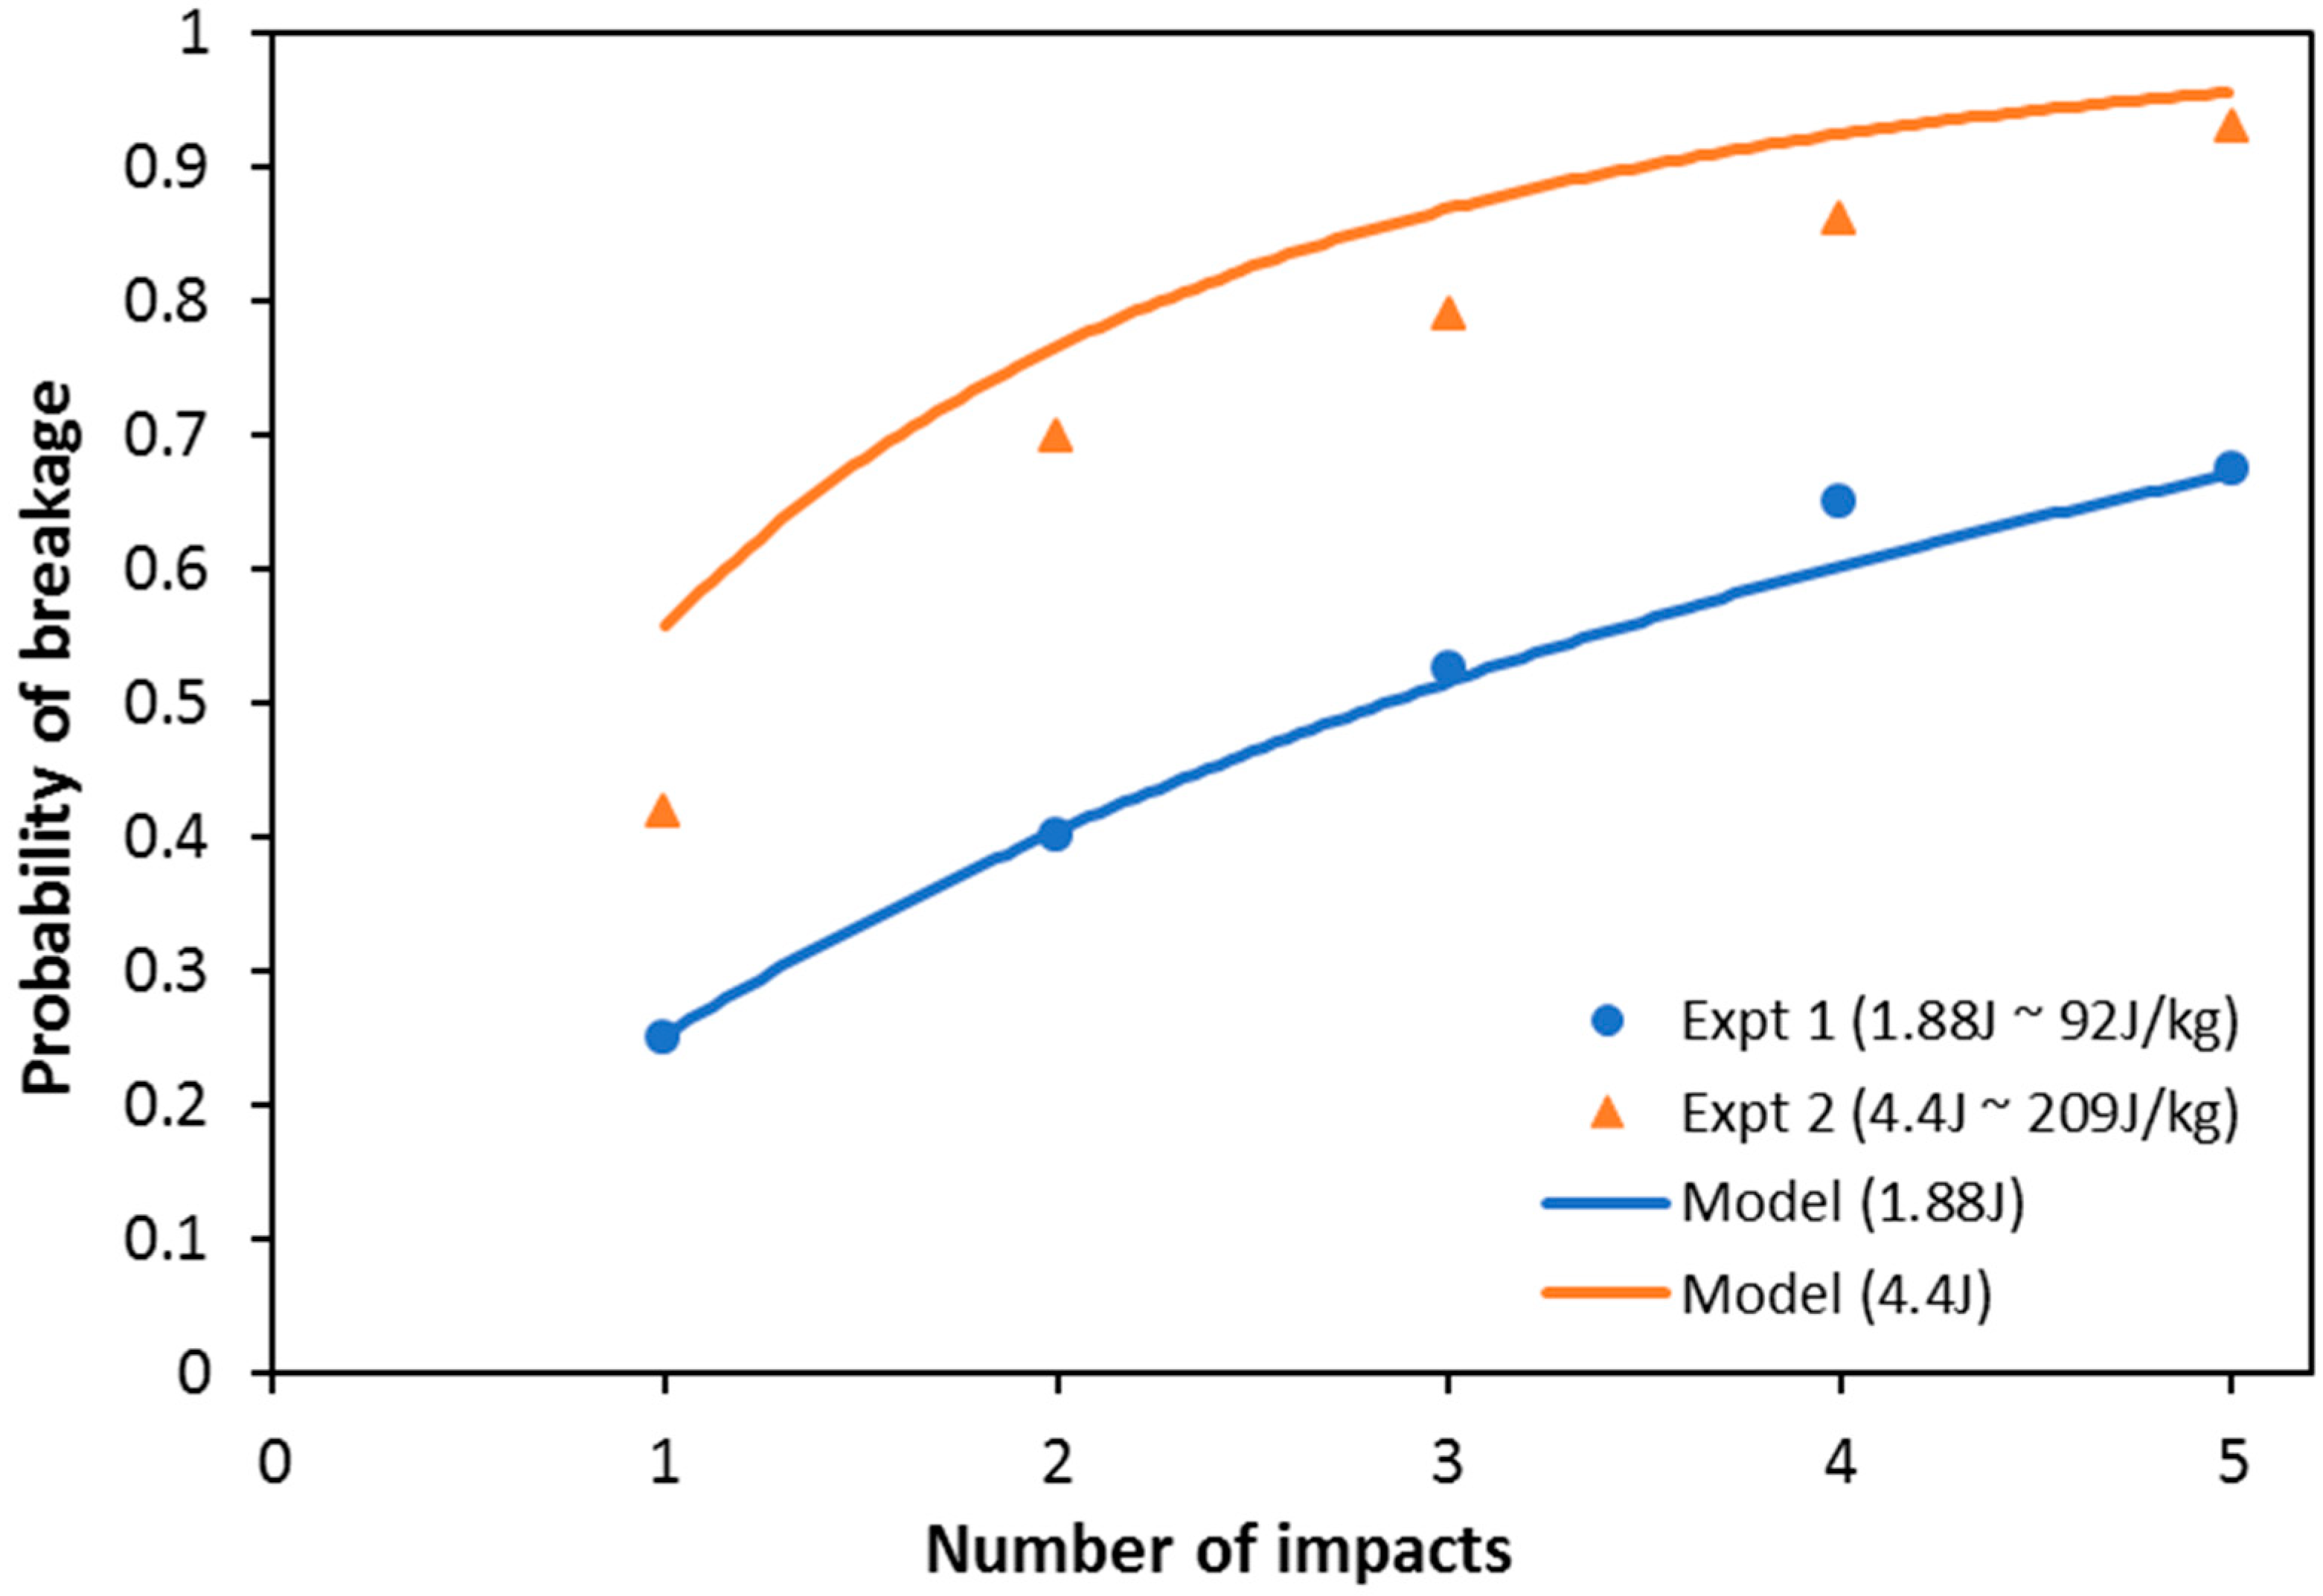
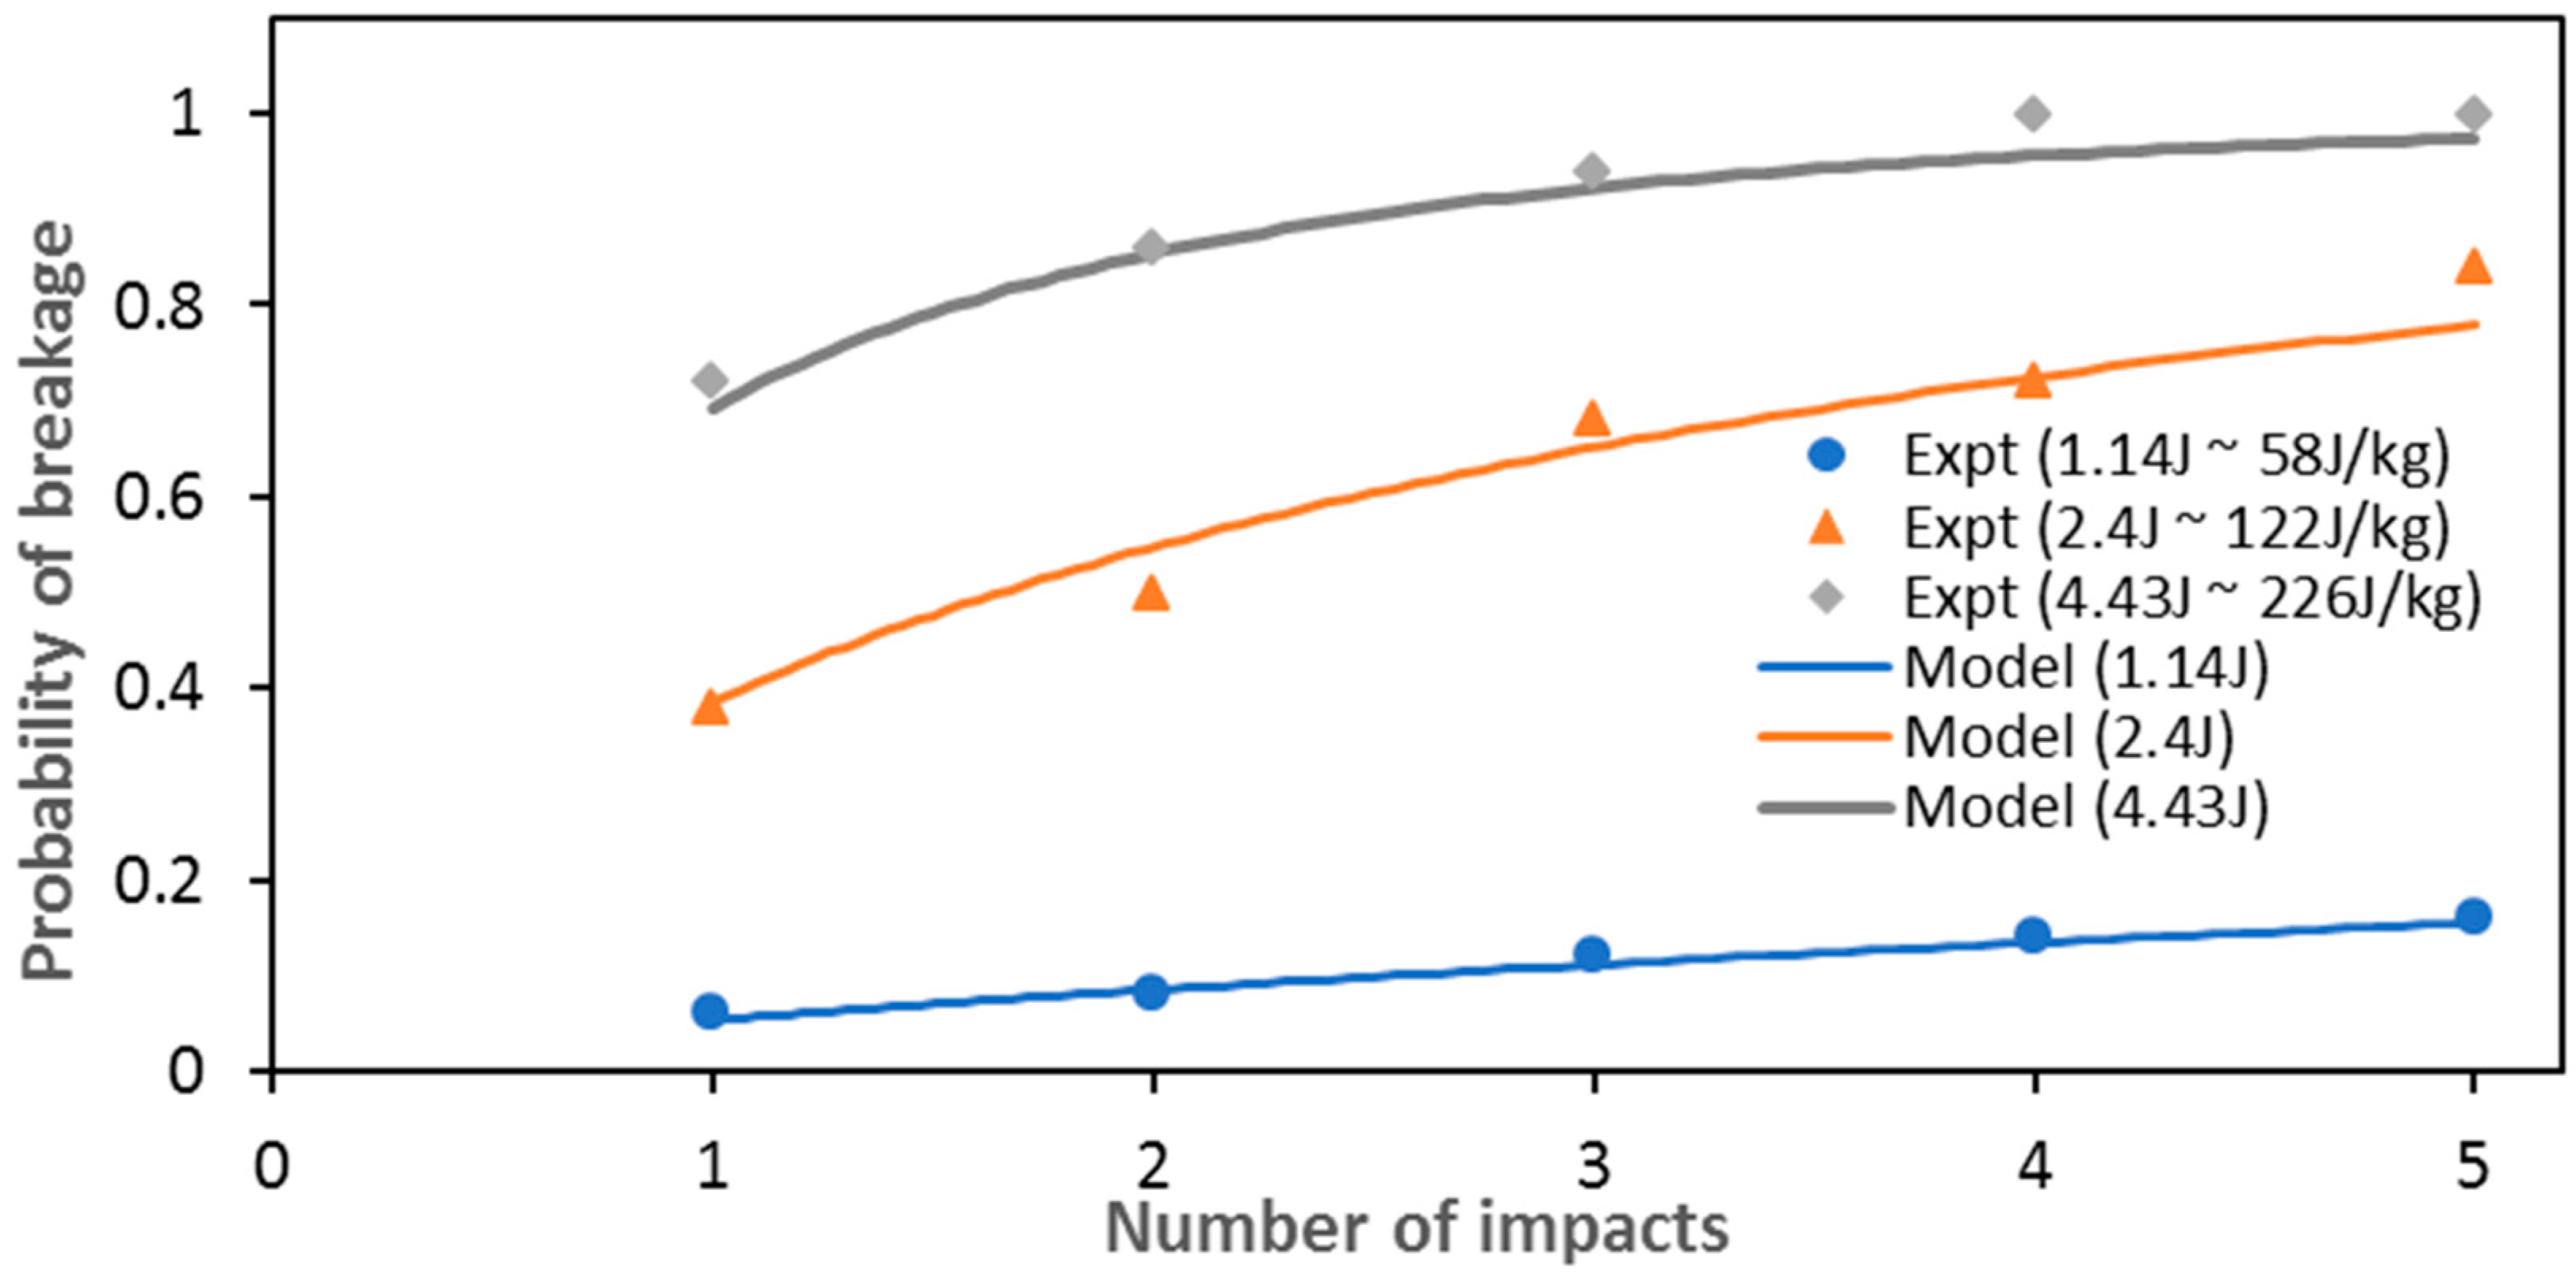
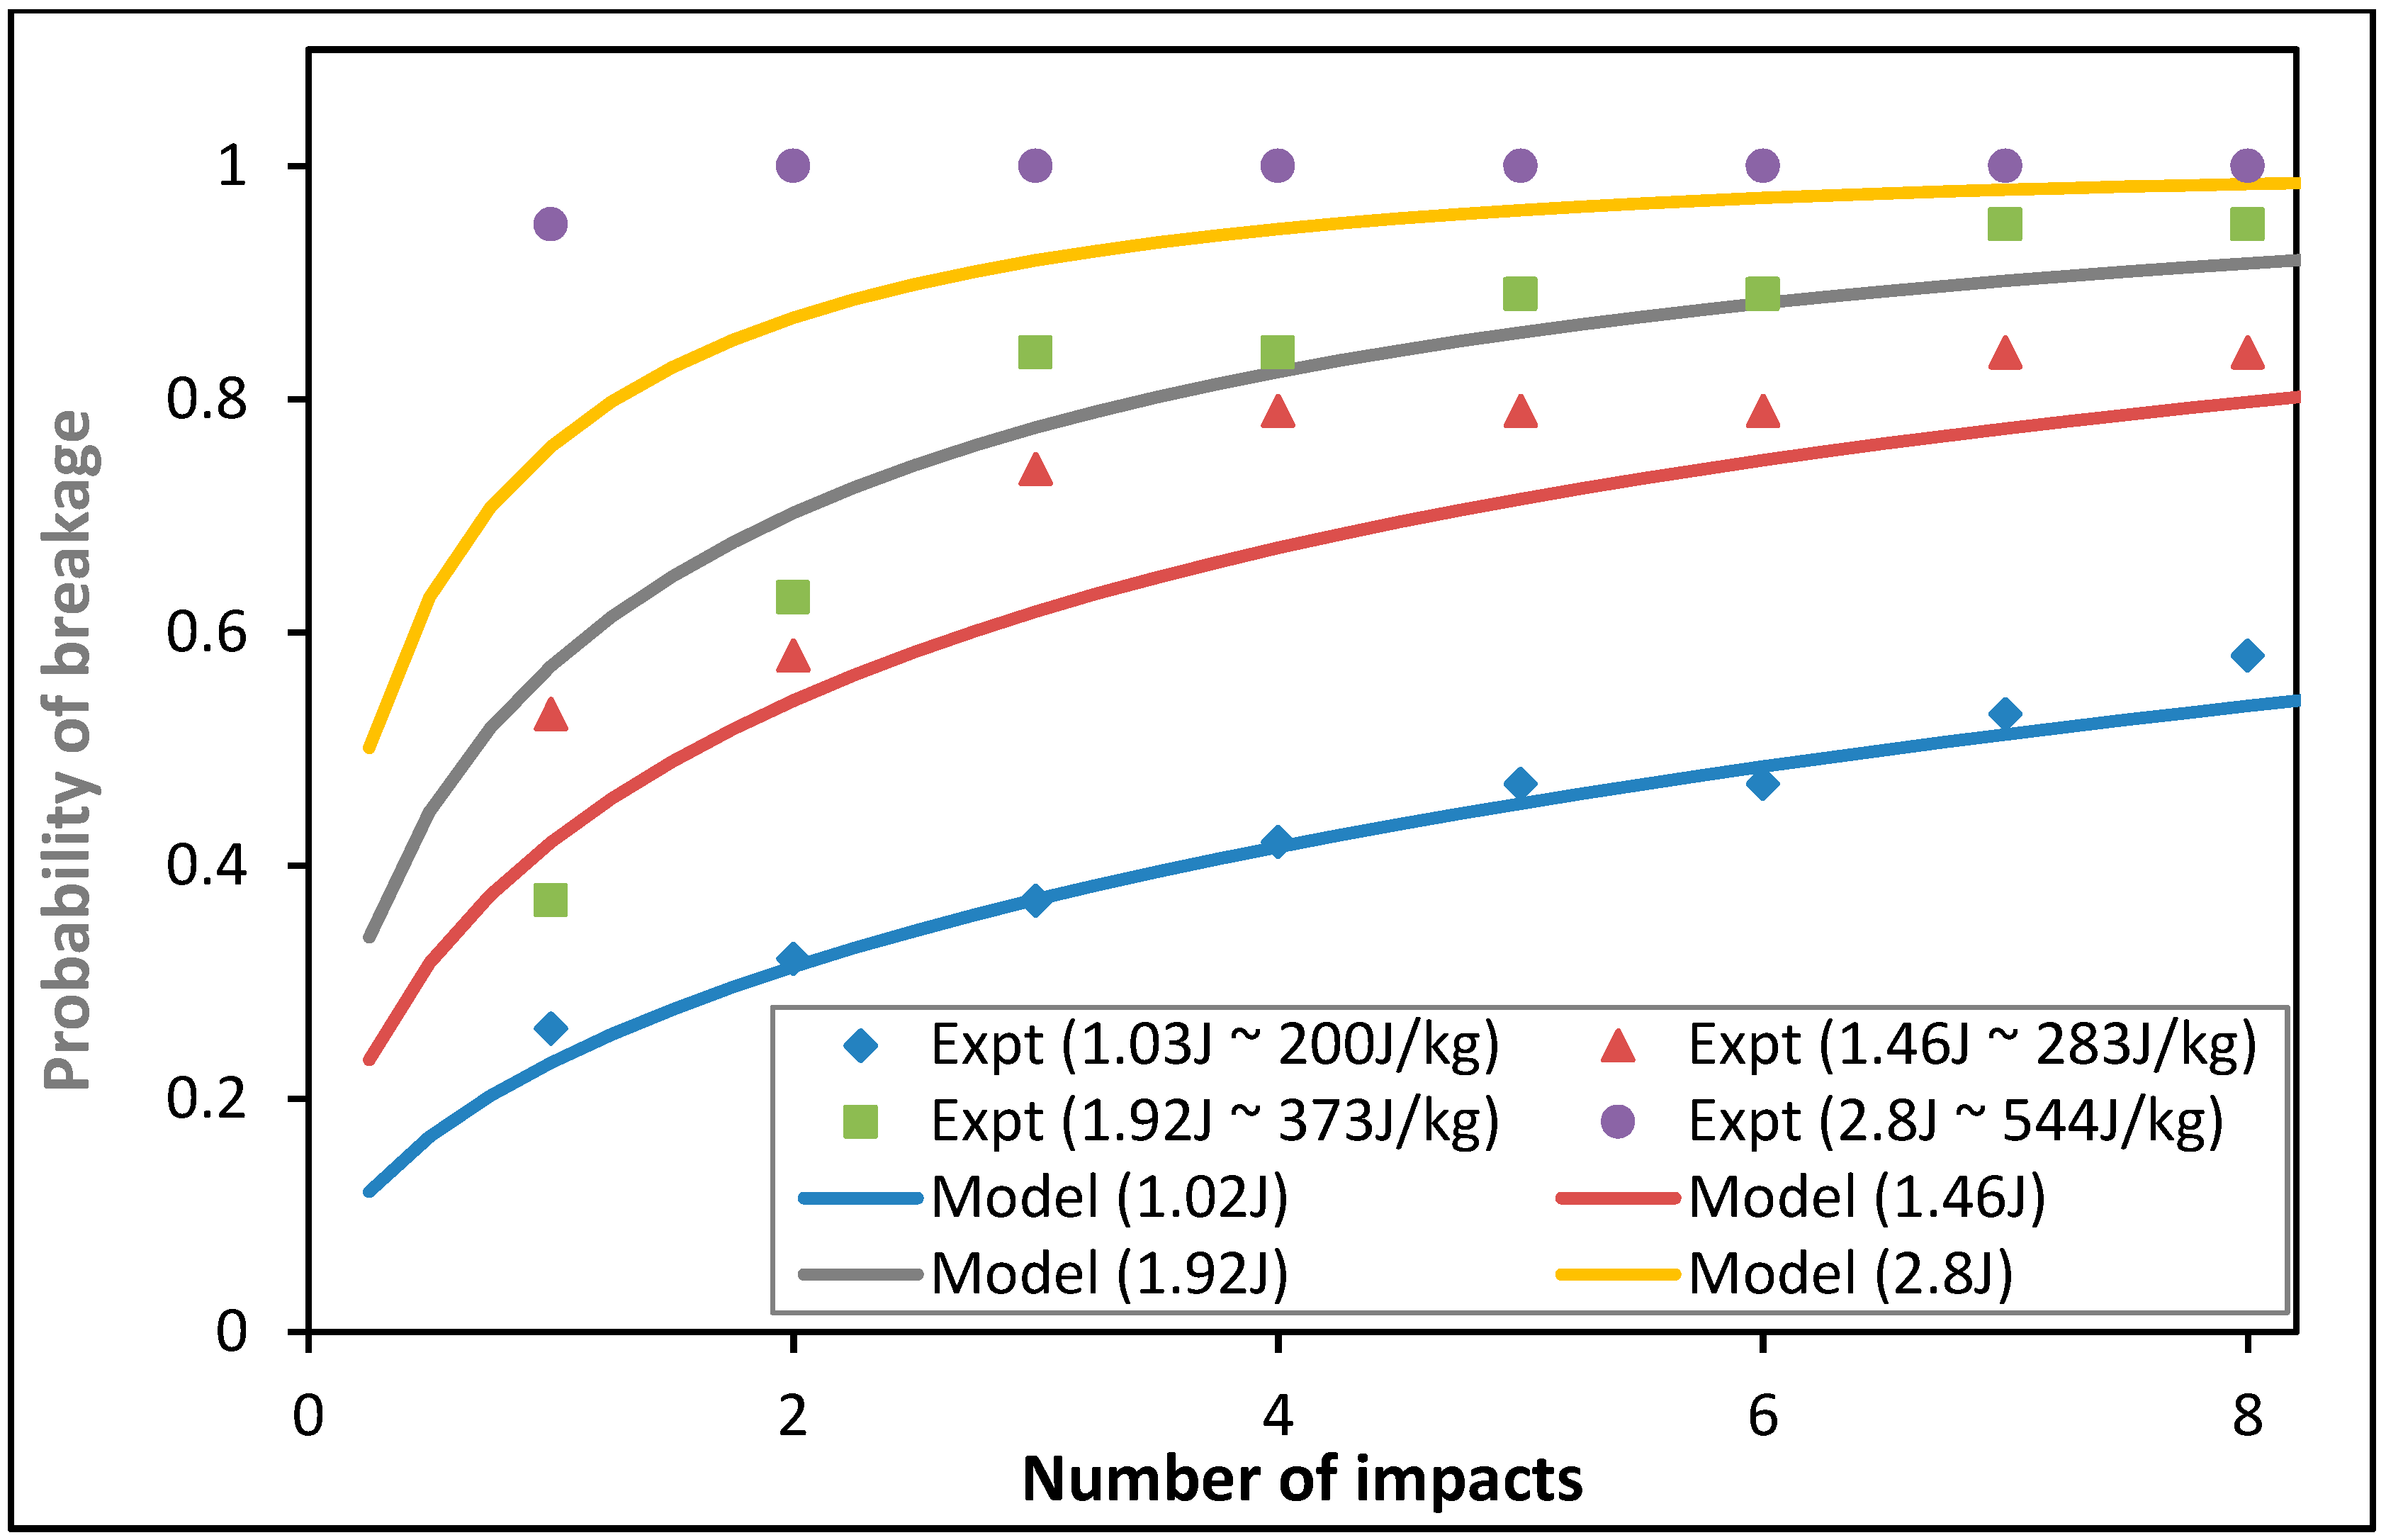
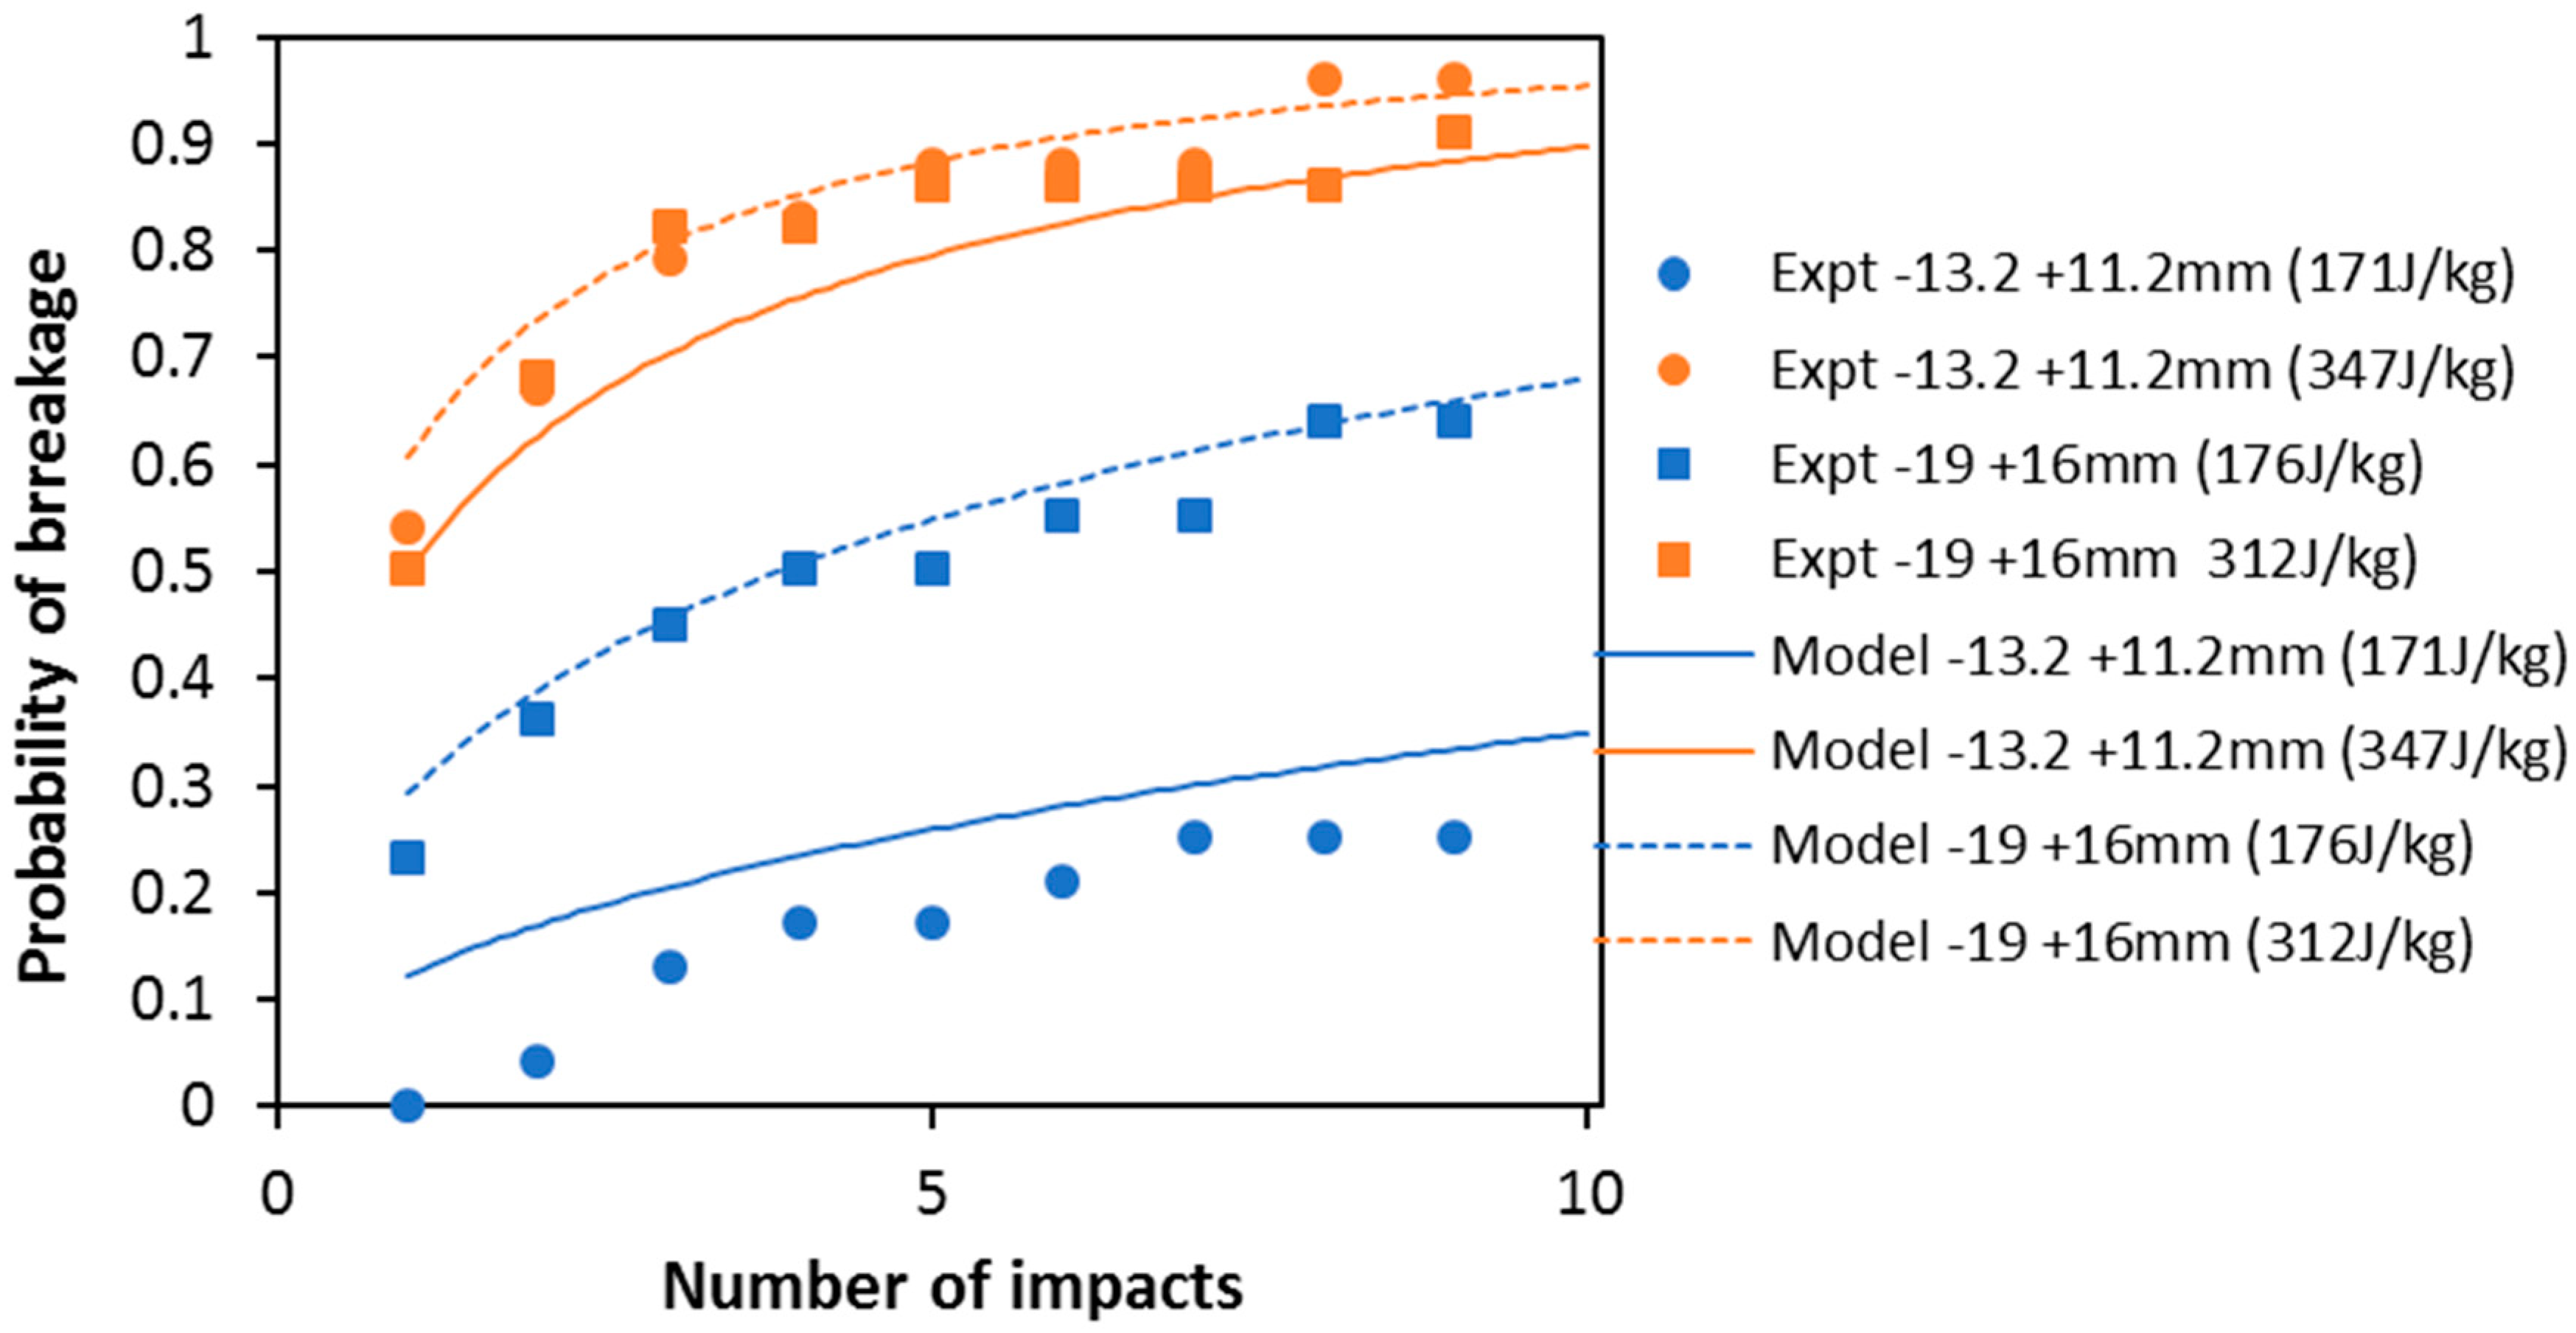
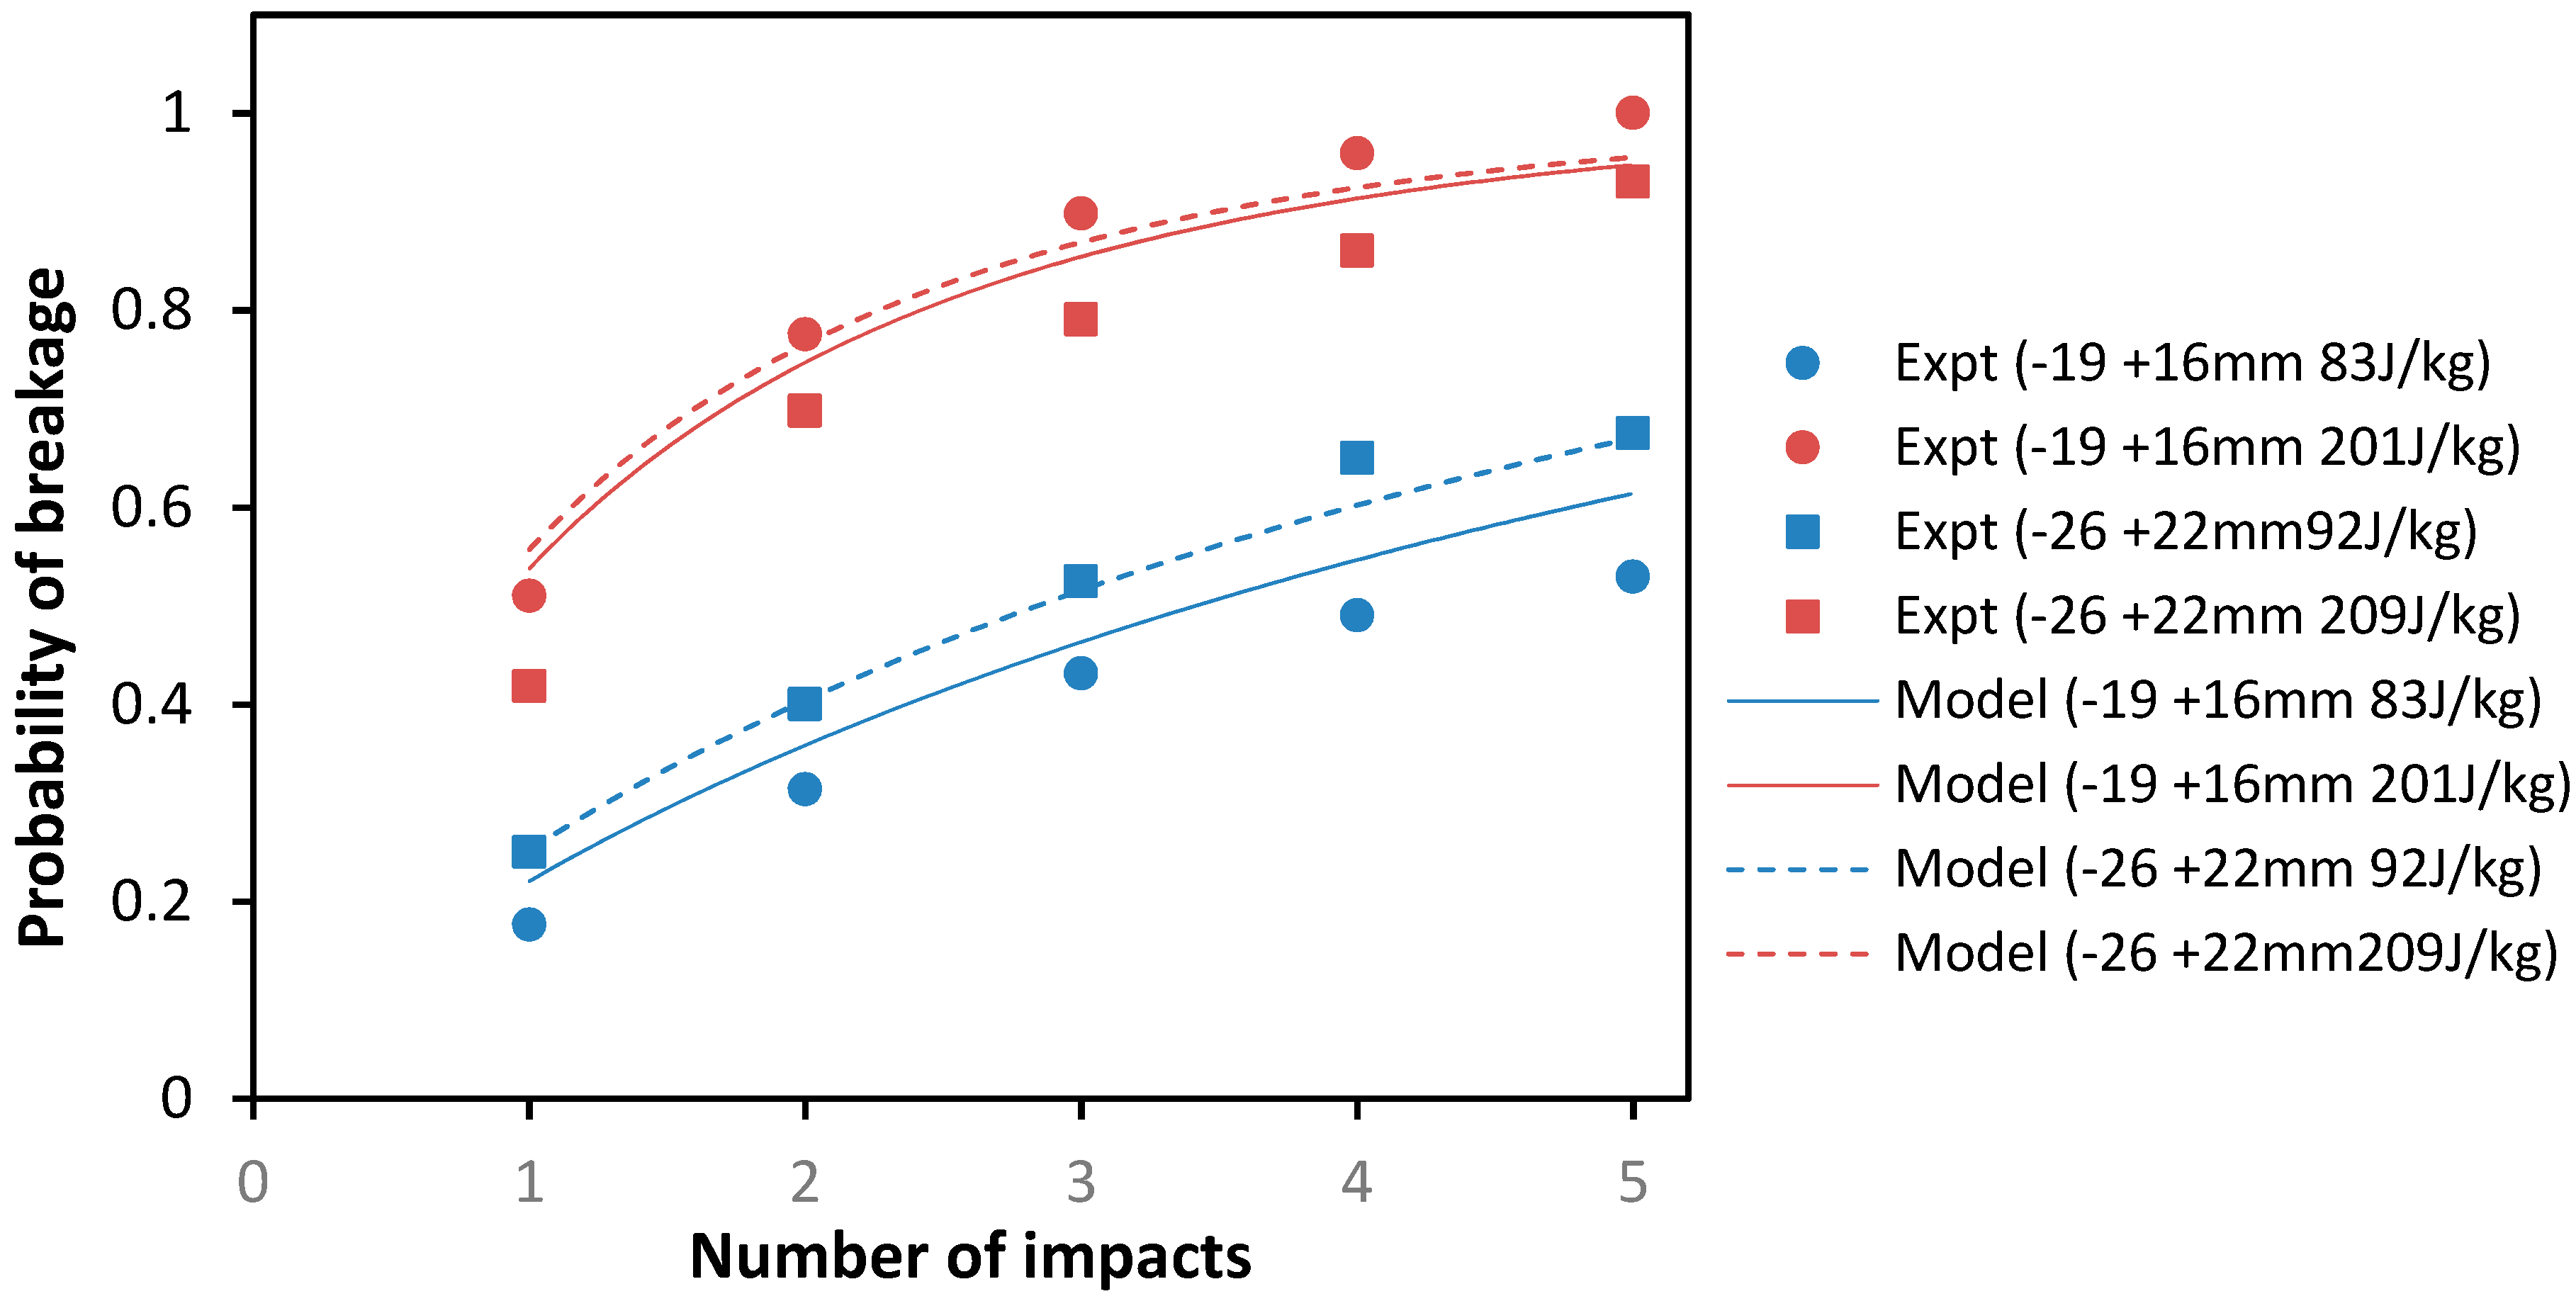
3.1. Modelling Results
3.2. Discussion
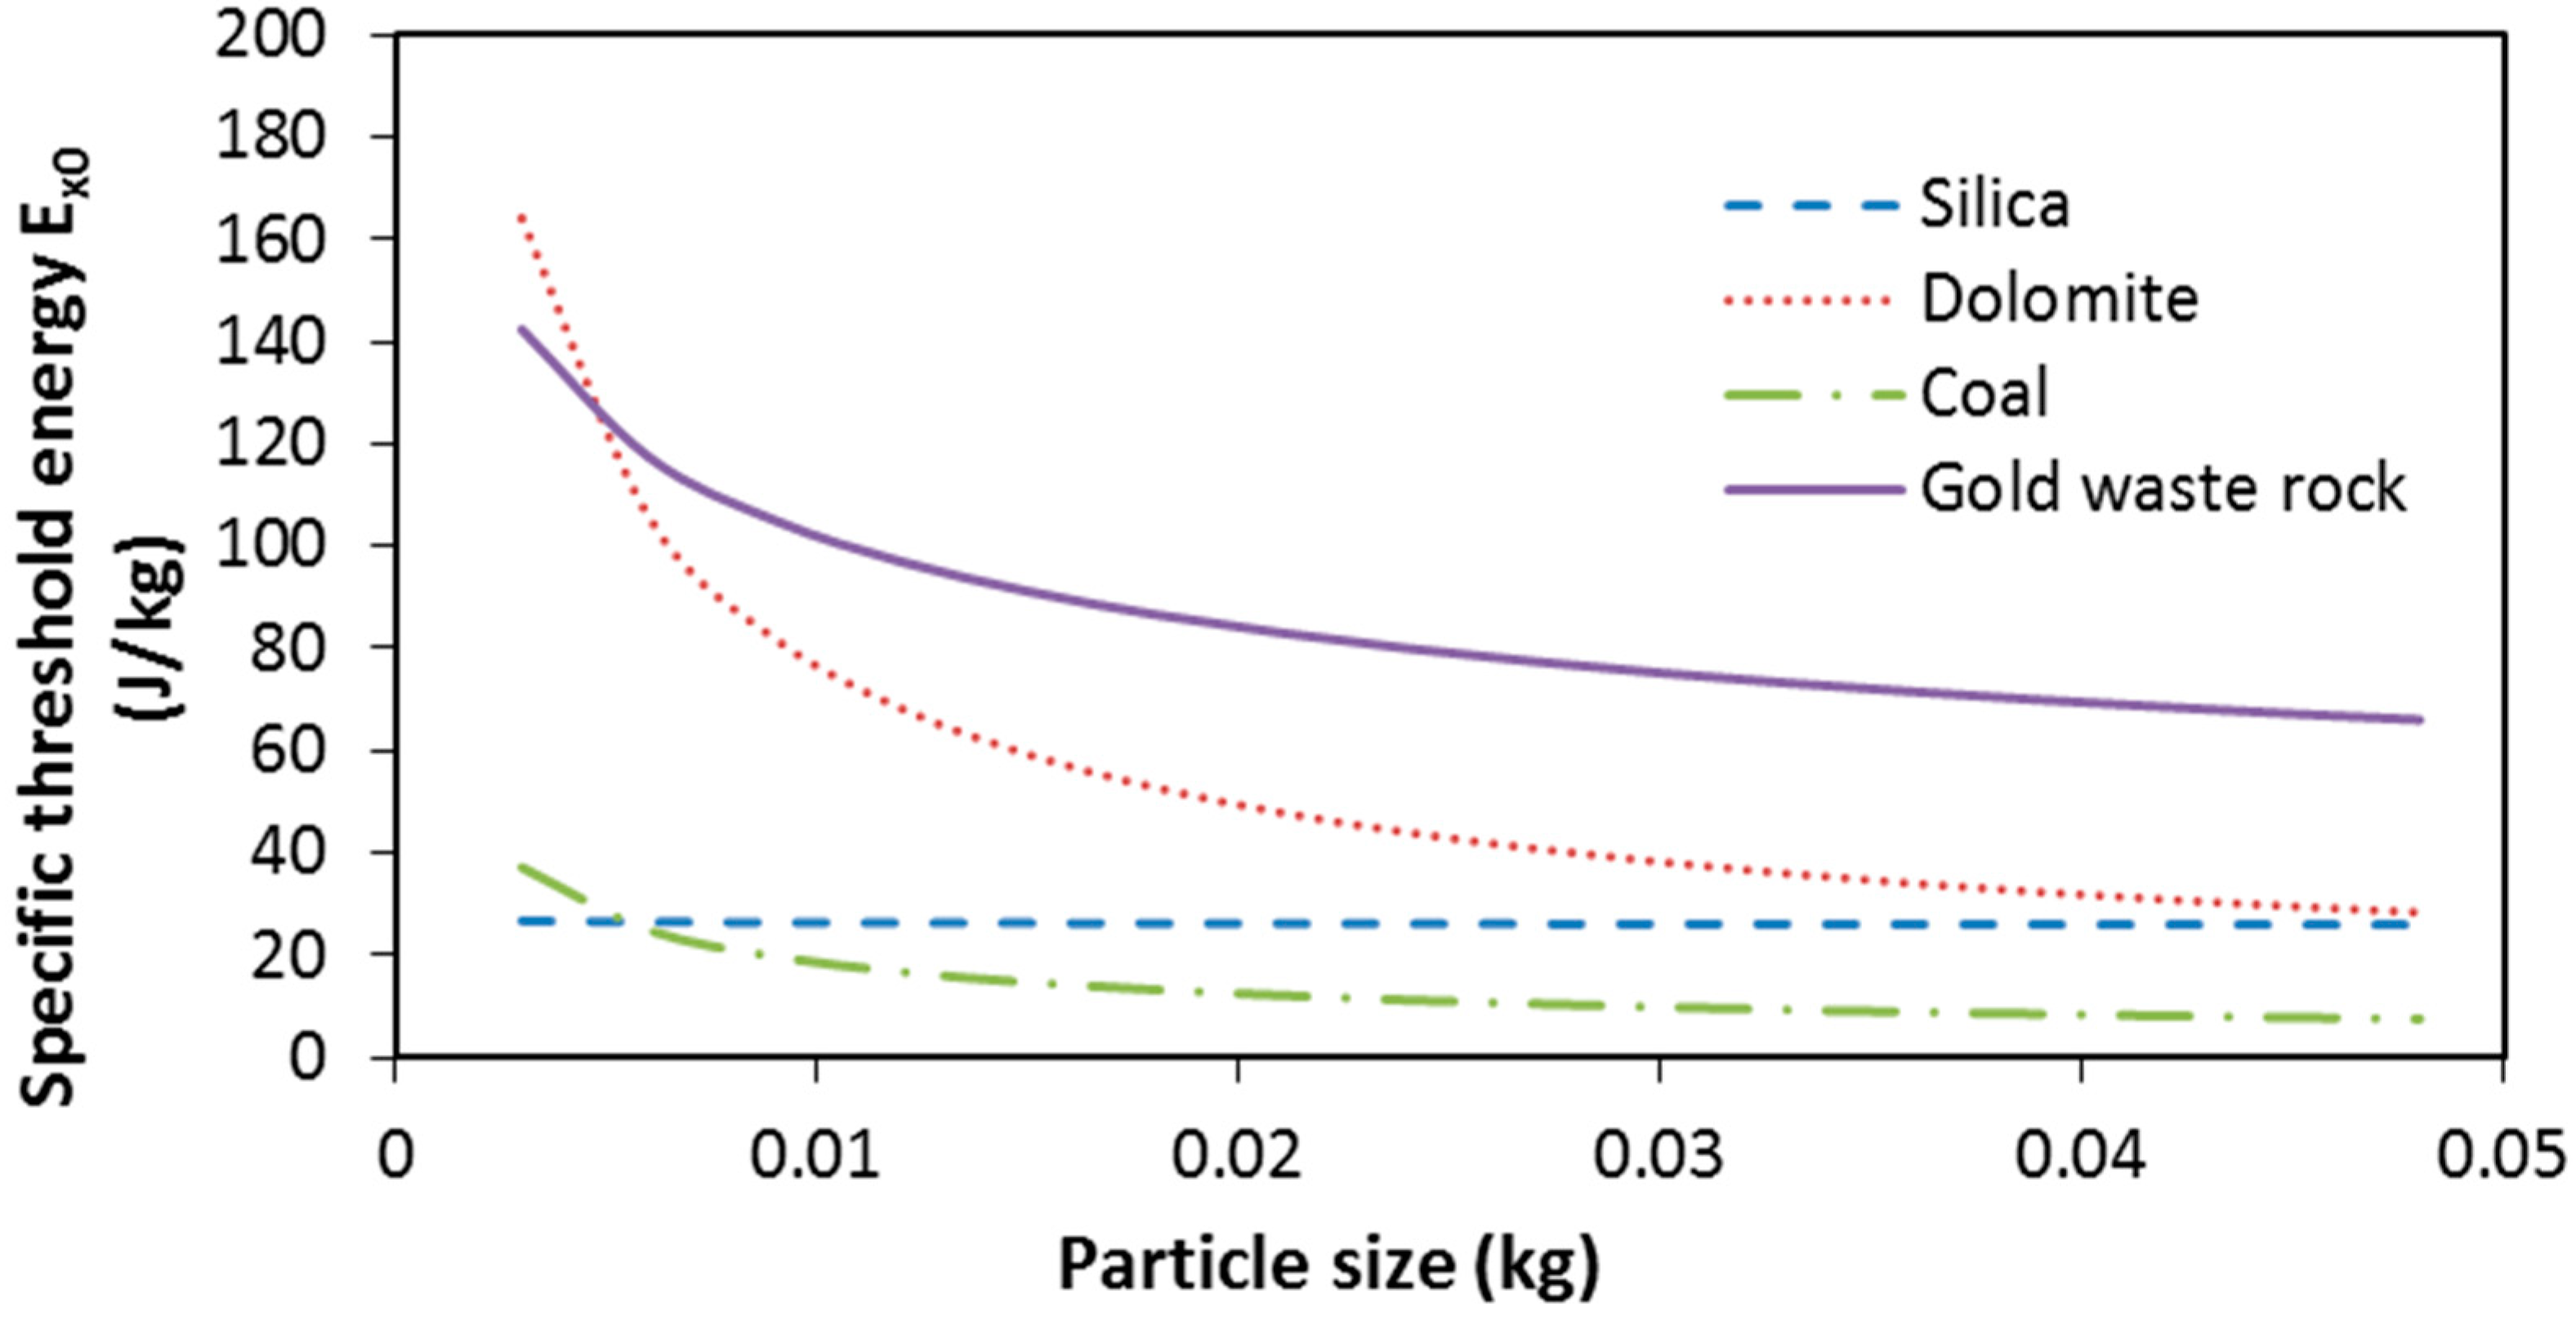
3.2.1. Effect of Size on Particle Strength
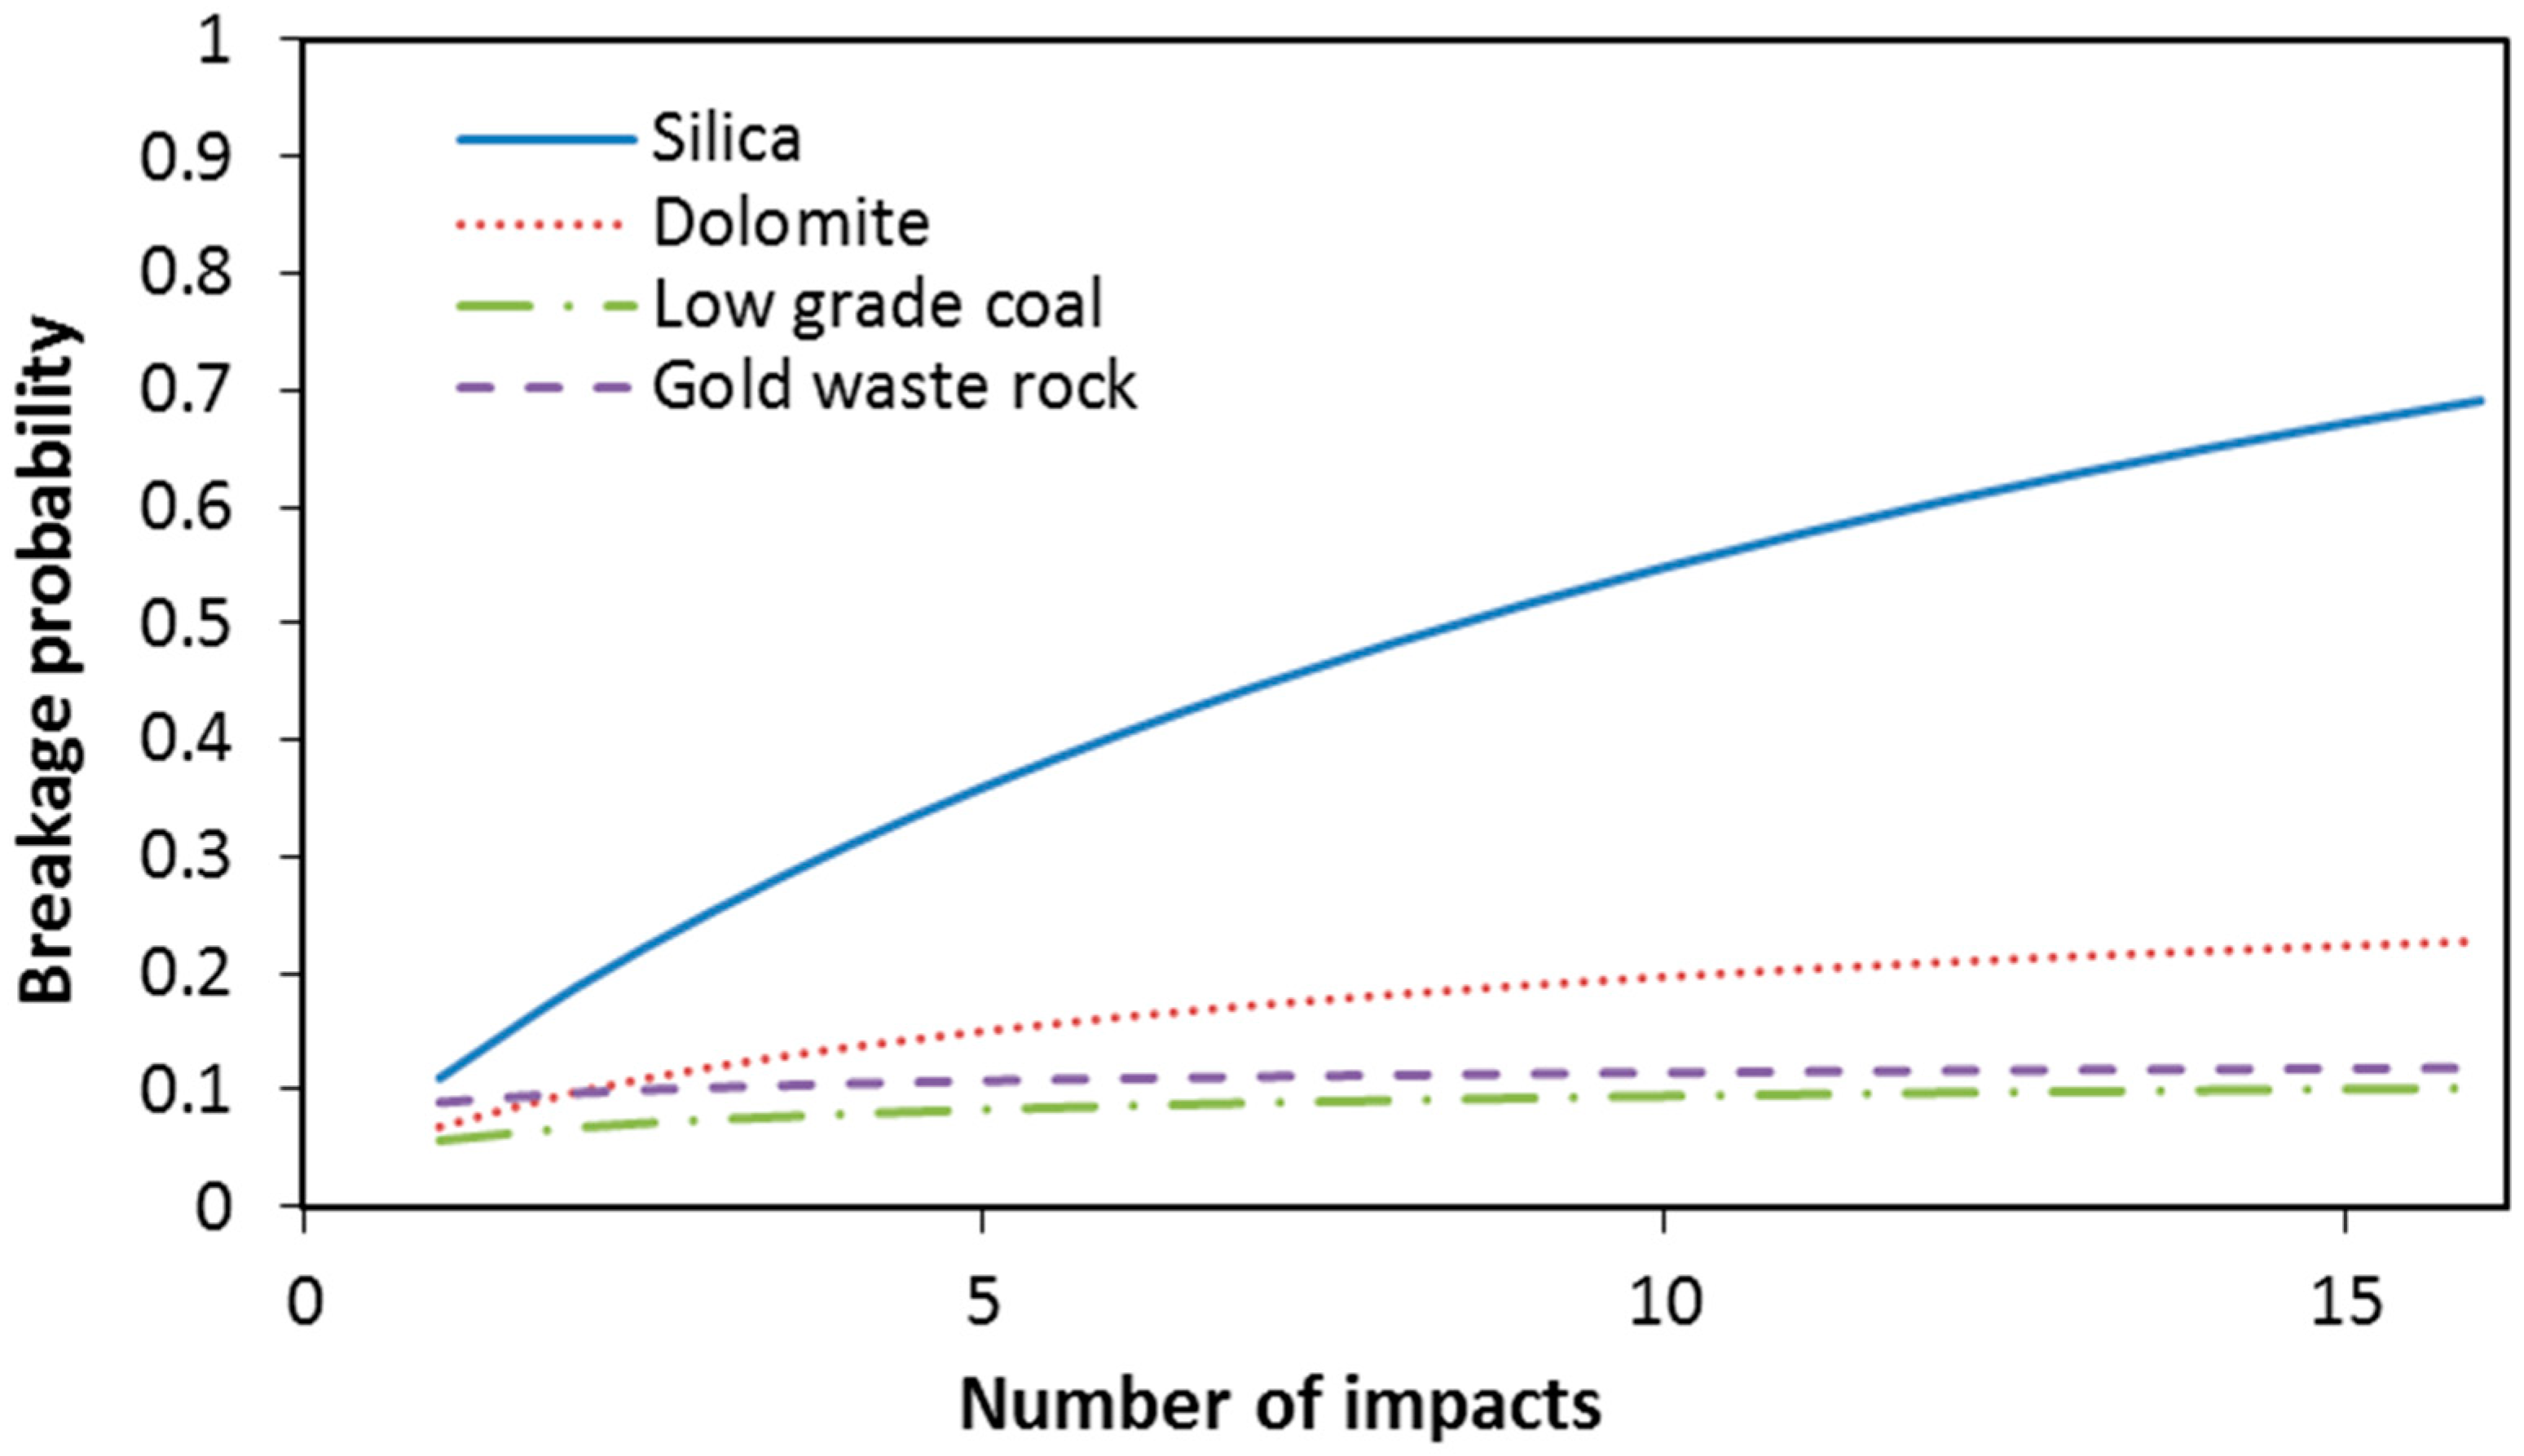
3.2.2. Difference in Damage Accumulation in Materials
4. Conclusions
Author Contributions
Funding
Acknowledgments
Conflicts of Interest
Nomenclature
| a | dimensionless material parameter that is related to material resistance to damage |
| b | dimensionless material parameter that is related to material brittleness |
| c | parameter that models particle size effect on breakage |
| d | second parameter that models particle size effect on breakage |
| E | energy (J) |
| Ex0 | minimum energy (J) required to initiate any form of particle damage |
| g | gravitational acceleration (m/s2) |
| h | height (m) applies to all subscripts |
| M | mass (kg) |
| n | number of breakage attempts made on a particle |
| Pb | probability of breaking a particle (in our case by at least 20%) |
| X | particle mass (g) |
| Xm | particle mass (kg) |
Appendix A

Appendix B

References
- Delboni, H.; Morell, S. A Load-Interactive Model for predicting the performance of autogenous and semi-autogenous mills. Kona Powder Technol. 2002, 20, 208–220. [Google Scholar] [CrossRef]
- Von Rittinger, P.R. Lehrbuch der Aufbereitungs Kunde; Ernst and Korn: Berlin, Germany, 1867. [Google Scholar]
- Kick, F. Des Gesetz der Proportionalem Widerstnad und Seine Anwendung; Felix: Leipzig, Germany, 1885. [Google Scholar]
- Bond, F.C. The third theory of comminution. Trans. AIME 1952, 193, 484–494. [Google Scholar]
- Griffith, A. The phenomena of rupture and flow in solids. Phil. Trans. R. Soc. 1921, 221, 163. [Google Scholar]
- Rumpf, H. Physical aspect of comminution and a new formulation of a law of comminution. Powder Technol. 1973, 7, 145–159. [Google Scholar] [CrossRef]
- Narayanan, S.S. Single particle breakage tests: A review of principles and applications to comminution modelling. Bull Proc. Austr. Inst. Min. Metall. 1986, 291, 49–58. [Google Scholar]
- Leung, K. An Energy Based Ore Specific Model for Autogeneous and Semiautogenous Grinding. Ph.D. Thesis, University of Queensland, St Lucia, Australia, 1987. [Google Scholar]
- Shi, F.; Kojovic, T.; Larbi-Bram, S.; Manlapig, E. Development of a rapid particle breakage characterisation device—The JKRBT. Miner. Eng. 2009, 22, 602–612. [Google Scholar] [CrossRef]
- Bwalya, M.M.; Moys, M.H.; Hinde, A. The use of the DEM and fracture mechanics to improve grinding rate prediction. Miner. Eng. 2001, 14, 565–573. [Google Scholar] [CrossRef]
- Weichert, R. Fracture physics in comminution. In Proceedings of the 7th European Symposium Comminution, Ljubljana, Slovenia, 12–14 June 1990; pp. 3–20. [Google Scholar]
- Peukert, W.; Vogel, L. Breakage behaviour of different materials—Construction of a master curve for the breakage probability. Powder Technol. 2003, 129, 101–110. [Google Scholar]
- Vogel, L.; Peukert, W. Determination of material properties relevant to grinding by practicable labscale milling tests. Int. J. Miner. Process. 2004, 74S, S329–S338. [Google Scholar] [CrossRef]
- Morrison, R.D.; Shi, F.N.; Whyte, R. Modelling of incremental rock breakage by impact: For use in DEM models. Miner. Eng. 2007, 20, 303–309. [Google Scholar] [CrossRef]
- Bwalya, M.M. Using the Discrete Element Method to Guide the Modelling of Semi and Fully Autogenous Milling. Ph.D. Thesis, University of Witwatersrand, Johannesburg, South Africa, 2005. [Google Scholar]
- Bwalya, M.M.; Moys, M.H. The Use of DEM in Predicting Grinding Rate. In Proceedings of the XXII International Mineral Processing Congress, Cape Town, South Africa, 29 September–3 October 2003; pp. 1612–1617. [Google Scholar]
- King, R.P.; Bourgeois, F. Measurement of fracture energy during single-particle fracture. Miner. Eng. 1993, 6, 353–367. [Google Scholar] [CrossRef]
- Tavares, L.M.; King, R.P. Modeling of particle fracture by repeated impacts using continuum damage mechanics. Powder Technol. 2002, 123, 138–146. [Google Scholar] [CrossRef]
- Tavares, L.M.; Carvalho, R. Modelling breakage rates of coarse materials in ball mills. Miner. Eng. 2009, 22, 650–659. [Google Scholar] [CrossRef]
- Genc, O.; Ergun, L.; Benzer, H. Single particle impact breakage characterization of materials by drop-weight testing. Physicochem. Probl. Miner. Process. 2004, 38, 241–255. [Google Scholar]
- Shi, F. A review of the applications of the JK size-dependent breakage model Part 1: Ore and coal breakage characterization. Int. J. Miner. Process. 2016, 155, 118–129. [Google Scholar] [CrossRef]
- Chandramohan, R.; Lane, G.S.; Foggiatto, B.; Bueno, M.P. Reliability of Some Ore Characterization Tests—Ausenco. In Proceedings of the SAG mill conference, Vancouver, BC, Canada, 20–24 September 2015. [Google Scholar]
- Hosseinzadeh, H.; Ergun, L. Determination of Breakage Distribution Function of fine chromite ores with Bed Breakage Method. In Proceedings of the XIII International Mineral Processing Symposium, Bodrum, Turkey, 10–12 October 2012. [Google Scholar]
- Bonfils, B.; Ballantyne, G.R.; Powell, M.S. Developments in incremental rock breakage testing methodologies and modeling. Int. J. Miner. Process. 2016, 152, 16–25. [Google Scholar] [CrossRef]
- Tavares, L.M.; King, R.P. Single-particle fracture during impact loading. Int. J. Miner. Process. 1998, 54, 1–28. [Google Scholar] [CrossRef]
- Baumgardt, S.; Buss, B.; May, P.; Schubert, H. On the Comparison of Results in Single Grain Crushing under Different Kinds of Load; XI. IMPC: Cagliari, Italy, 1975. [Google Scholar]


| Material | Size Class in mm | Approximate Density (g/cm3) |
|---|---|---|
| Silica Sandstone | −26.5 + 22.4, −19 +16, −11.2 + 9.5 | 2.65 |
| Dolomite | −31.5 + 26.5, −26.5 + 22.4, −19 + 16, −11.2 + 9.5 | 2.84 |
| Low-Grade Coal | −31.5 + 26.5, −26.5 + 22.4, −19 + 16, −11.2 + 9.5 | 1.7 |
| Gold Waste Rock | −75 +63, −45 + 37.5, −37.5 + 31.5, −19 + 16, −16 + 13.2, −13.2 + 11.2, −11.2 + 9.5 | 2.75 |
| Parameters | Silica | Dolomite | Low-Grade Coal | Gold Waste Rock |
|---|---|---|---|---|
| c | 0.03 | 0.33 | 0.07 | 0.19 |
| d | 0.99 | 0.37 | 0.42 | 0.72 |
| a | 0.12 | 0.34 | 0.23 | 0.41 |
| b | 0.83 | 0.70 | 0.50 | 0.52 |
© 2020 by the authors. Licensee MDPI, Basel, Switzerland. This article is an open access article distributed under the terms and conditions of the Creative Commons Attribution (CC BY) license (http://creativecommons.org/licenses/by/4.0/).
Share and Cite
Bwalya, M.M.; Chimwani, N. Development of a More Descriptive Particle Breakage Probability Model. Minerals 2020, 10, 710. https://doi.org/10.3390/min10080710
Bwalya MM, Chimwani N. Development of a More Descriptive Particle Breakage Probability Model. Minerals. 2020; 10(8):710. https://doi.org/10.3390/min10080710
Chicago/Turabian StyleBwalya, Murray M., and Ngonidzashe Chimwani. 2020. "Development of a More Descriptive Particle Breakage Probability Model" Minerals 10, no. 8: 710. https://doi.org/10.3390/min10080710
APA StyleBwalya, M. M., & Chimwani, N. (2020). Development of a More Descriptive Particle Breakage Probability Model. Minerals, 10(8), 710. https://doi.org/10.3390/min10080710