Article

Fedorite from Murun Alkaline Complex (Russia): Spectroscopy and Crystal Chemical Features

by
Ekaterina V. Kaneva
*,
Roman Yu. Shendrik
,
Tatiana A. Radomskaya
and
Ludmila F. Suvorova
Vinogradov Institute of Geochemistry, Siberian Branch of Russian Academy of Sciences, 1A Favorsky Street, Irkutsk 664033, Russia
*
Author to whom correspondence should be addressed.
Minerals 2020, 10(8), 702; https://doi.org/10.3390/min10080702
Submission received: 20 July 2020 / Revised: 5 August 2020 / Accepted: 6 August 2020 / Published: 7 August 2020

Abstract

:
Fedorite is a rare phyllosilicate, having a crystal structure characterized by SiO4-tetrahedral double layers located between continuous layers formed by edge-sharing (Ca,Na)-octahedra, and containing interlayer K, Na atoms and H2O molecules. A mineralogical-petrographic and detailed crystal-chemical study of fedorite specimens from three districts of the Murun alkaline complex was performed. The sequence of the crystallization of minerals in association with fedorite was established. The studied fedorite samples differ in the content of interlayer potassium and water molecules. A comparative analysis based on polyhedral characteristics and deformation parameters was carried out. For the first time, EPR, optical absorption and emission spectra were obtained for fedorite. The raspberry-red coloration of the mineral specimens could be attributed to the presence of Mn4+ ions.

Graphical Abstract

1. Introduction

Fedorite is a rare and complex silicate, first discovered in fenitized rocks of the Turiy alkaline complex of the Kola Peninsula, Russia [1]. In 1968, the mineral was approved by IMA and named after the Russian mathematician, crystallographer and mineralogist Evgraf Stepanovich Fedorov. Mineralogical description and chemical analysis were published in 1979 [2].
The structure of fedorite was solved for the first time in space group C ¯ by photographic method [3], but with a relatively high value of the discrepancy index (R = 9.5%).
Later, authors in [4] carried out structure refinements using an X-ray single-crystal diffractometer and a neutron single-crystal diffractometer which converged to R = 4.0% and 6.9%, respectively.
Subsequently, a second occurrence of the mineral was reported from charoite rocks of the Murun complex [5,6].
Finally, the crystal structure of the fedorite in the space group P ¯ was refined [7] and remaining uncertainties in some atom positions and ordering of cations were clarified. Samples from the Turiy and the Murun complexes were used for the study.
The ideal formula for the fedorite group was derived: A2-3M7T16O38 × 2·nH2O (A = Na, K, Ba, Ca; M = Ca, Na, Mn2+, Fe2+; T = Si, Al, Ti; X = F, Cl, OH). However, all previous studies of fedorite have been incomplete in terms of comprehensive mineral characterization, taking into account the modern methodology for the study of complex natural objects using mineralogical-petrographic, crystal-chemical and physical methods.
According to the silicate minerals hierarchy of [8], fedorite is a sheet silicate with a two-dimensional infinite tetrahedral polymerization. The tetrahedral double layer in fedorite can be considered as a 3-connected net with the designation 63 (Figure S1 of Supplementary Materials). The [Si16O38]12– sheets extend perpendicular to [1] and consist of two types of six-membered rings: (1) consisting of six upward-pointing tetrahedra (u) and (2) consisting of four upward-pointing (u) and two downward-pointing tetrahedra (d). The u-d arrangement in the fedorite tetrahedra sheet is (d6)1(d2ud2u)3 (see Table 7 in [8]). Adjoining single layers are interconnected by two downward-pointing tetrahedra. The tetrahedral double layers are connected with sheets of ((Ca,Na)(O,F))-octahedra. K, Na atoms and H2O molecules occupy interlayer space.
Generally speaking, fedorite belongs to the reyerite–gyrolite group [9] and has a modular structure [10,11], since it consists of packed modules of tetrahedral (T) and octahedra (O) sheets sharing according to the schematic sequence OT2 T ¯ 2O. Combined [T O T ] modules in the crystal structure of fedorite were also discussed in [12].
In the present work, a mineralogical-petrographic, chemical, spectroscopic and structural study was carried out on fedorite specimens from several districts of the Murun complex.

2. Sample Description

The studied fedorite samples were taken from three districts of the Murun alkaline complex. Geologically, Murun syenite massif, formed at about 137–128 Ma (Malyy Murun, [13]), is located in the NW Aldan Shield, Siberia, Russia.
Fedorite sample Gav-43 was found in brookite–anatase–quartz–feldspar rock outcrop of the Gavrilovskaya zone of the Murun syenite massif. The zone is located at the watershed of the Davan and Atbastakh rivers (58°19’50” N 119°5’45” E). Irk-53 and Yak-5 samples were found in charoite rock quarries of the Irkutskiy and Yakutskiy districts, respectively. The Irkutskiy district (58°20’50” N, 119°3’35” E) is located at the watershed of the Davan and Ingarigda rivers, and the Yakutskiy district is located in the upper reaches of the Davan River (58°20’20” N, 119°5’00” E).
Polished samples and polished thin sections with a thickness of ~40 μm were studied by optical petrographic and mineralographic methods in transmitted and reflected light using an OLYMPUS BX-51 polarizing microscope. The morphogenetic features of fedorite and its paragenetic associations were investigated in order to reveal the mineral relationships and determine the sequence of mineral formation processes.
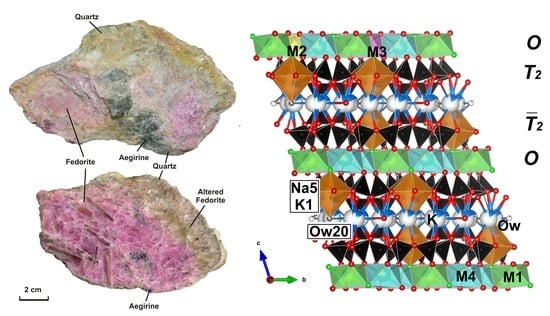
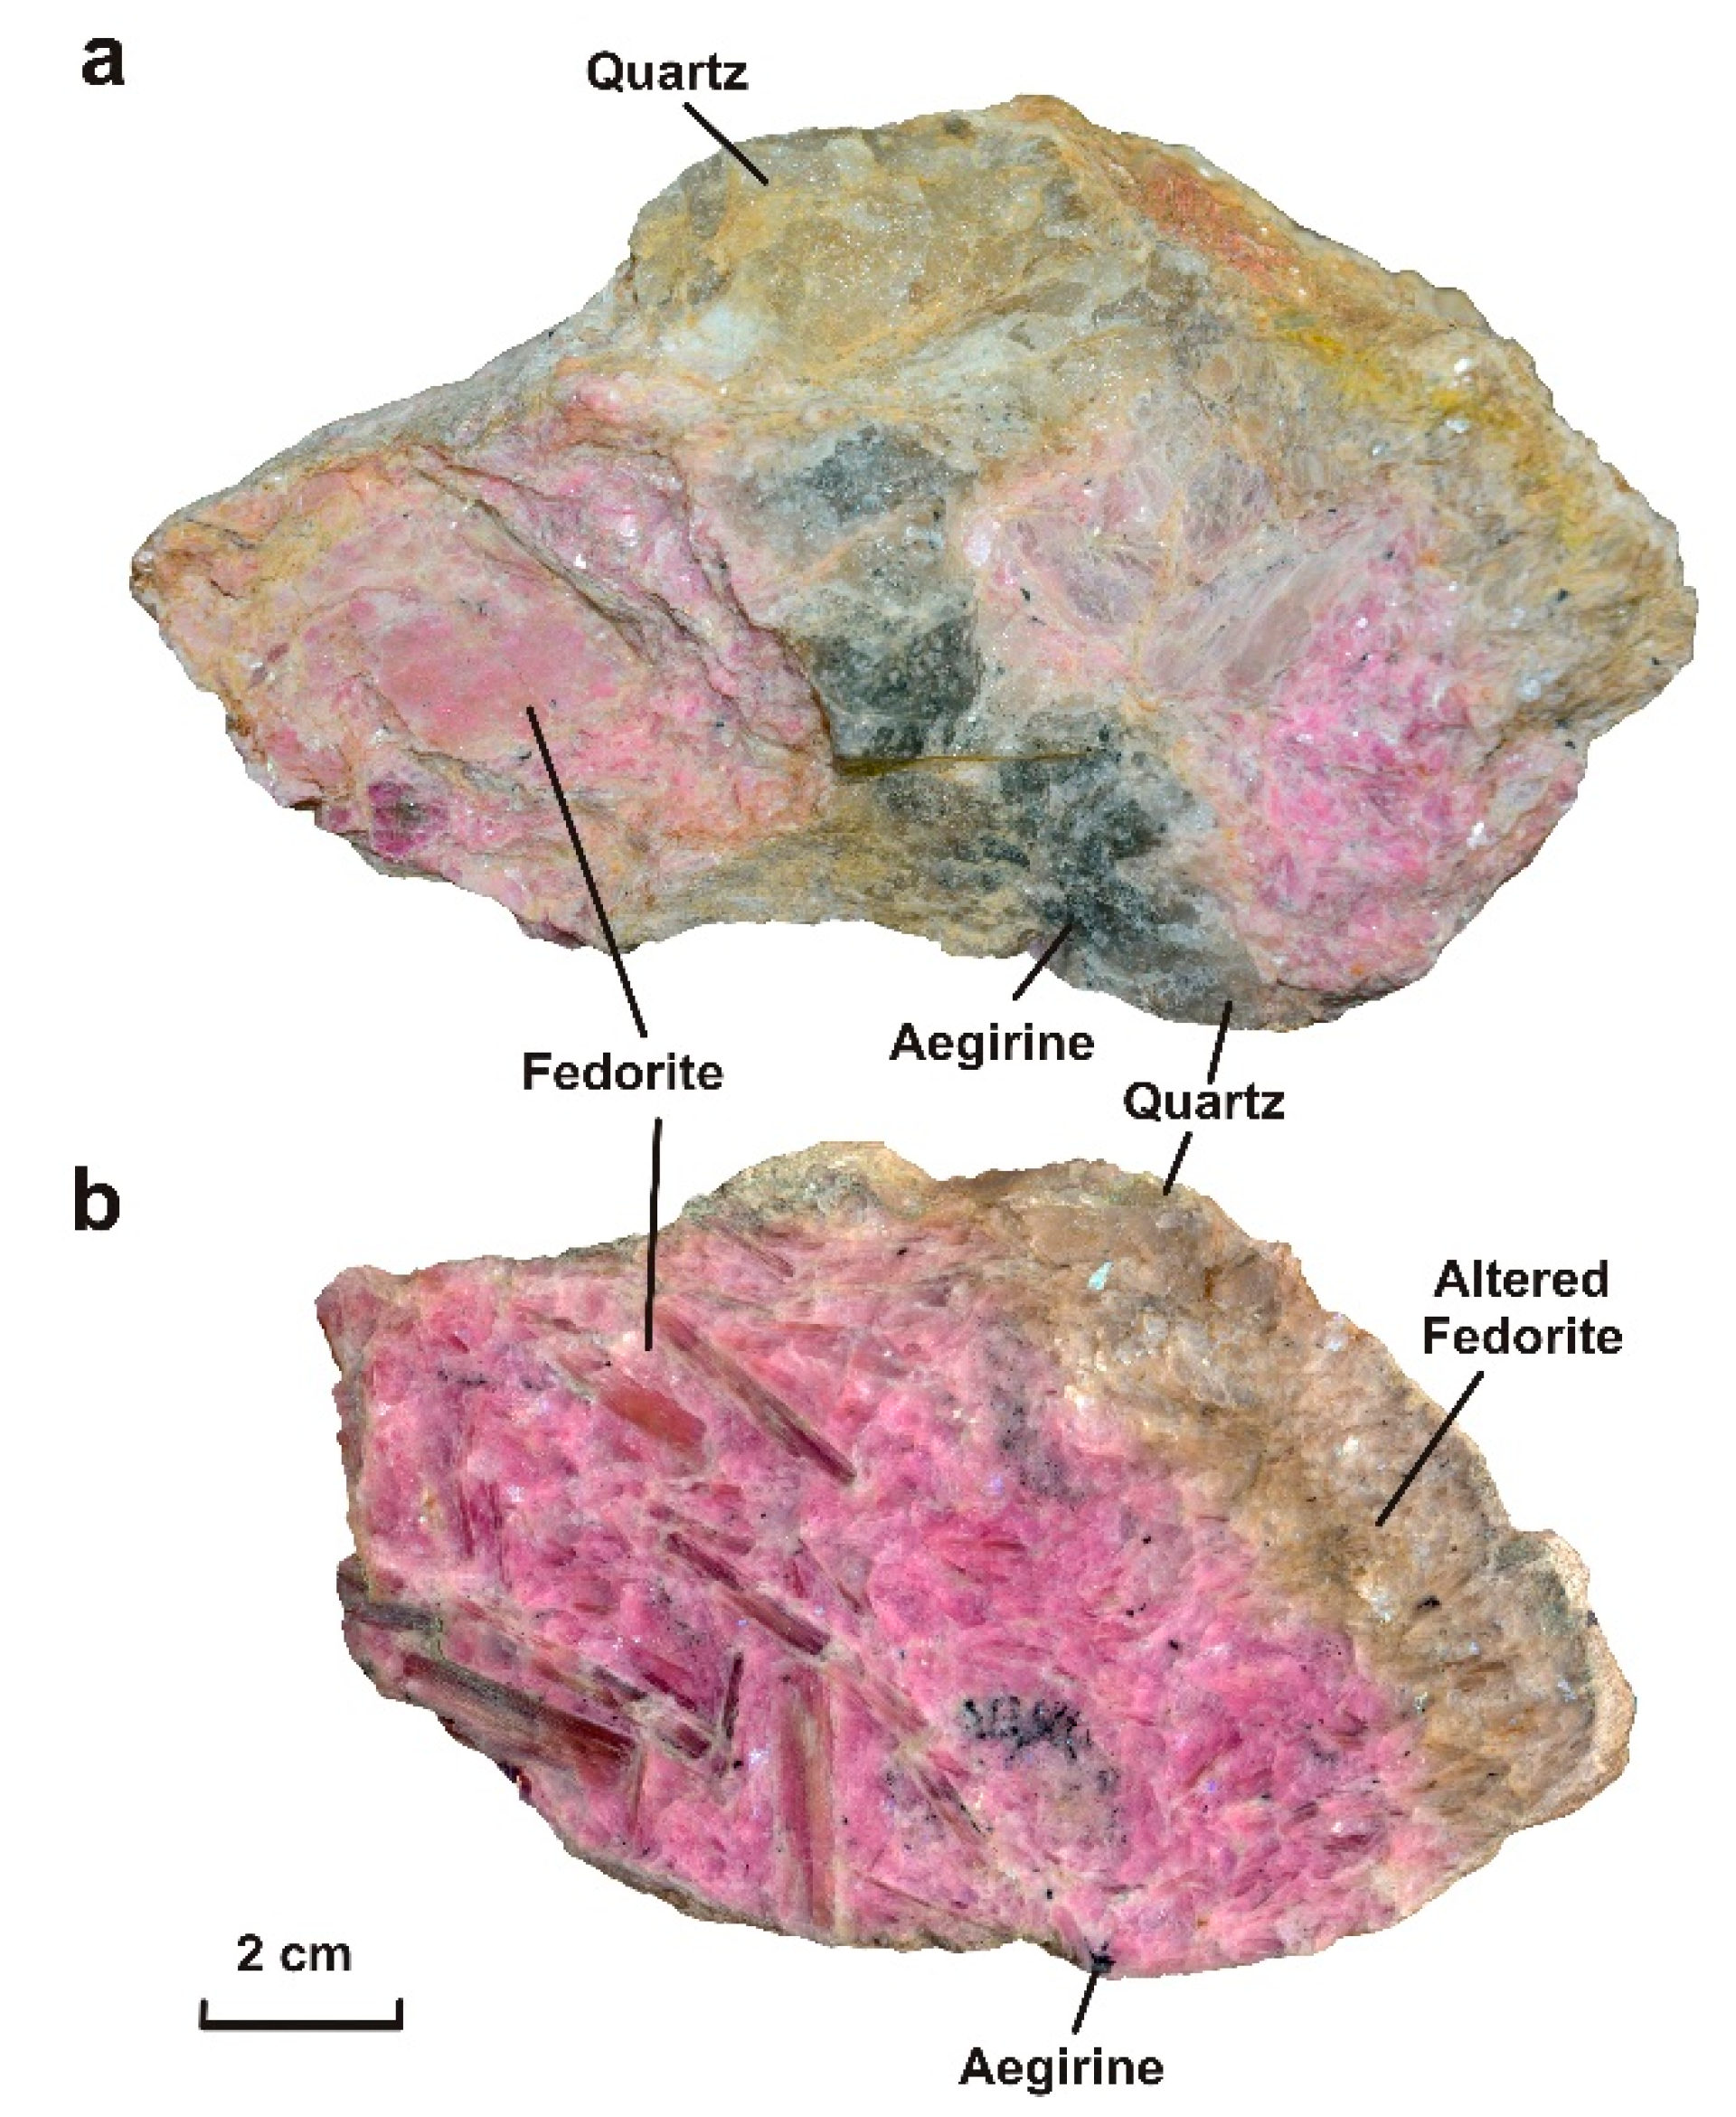
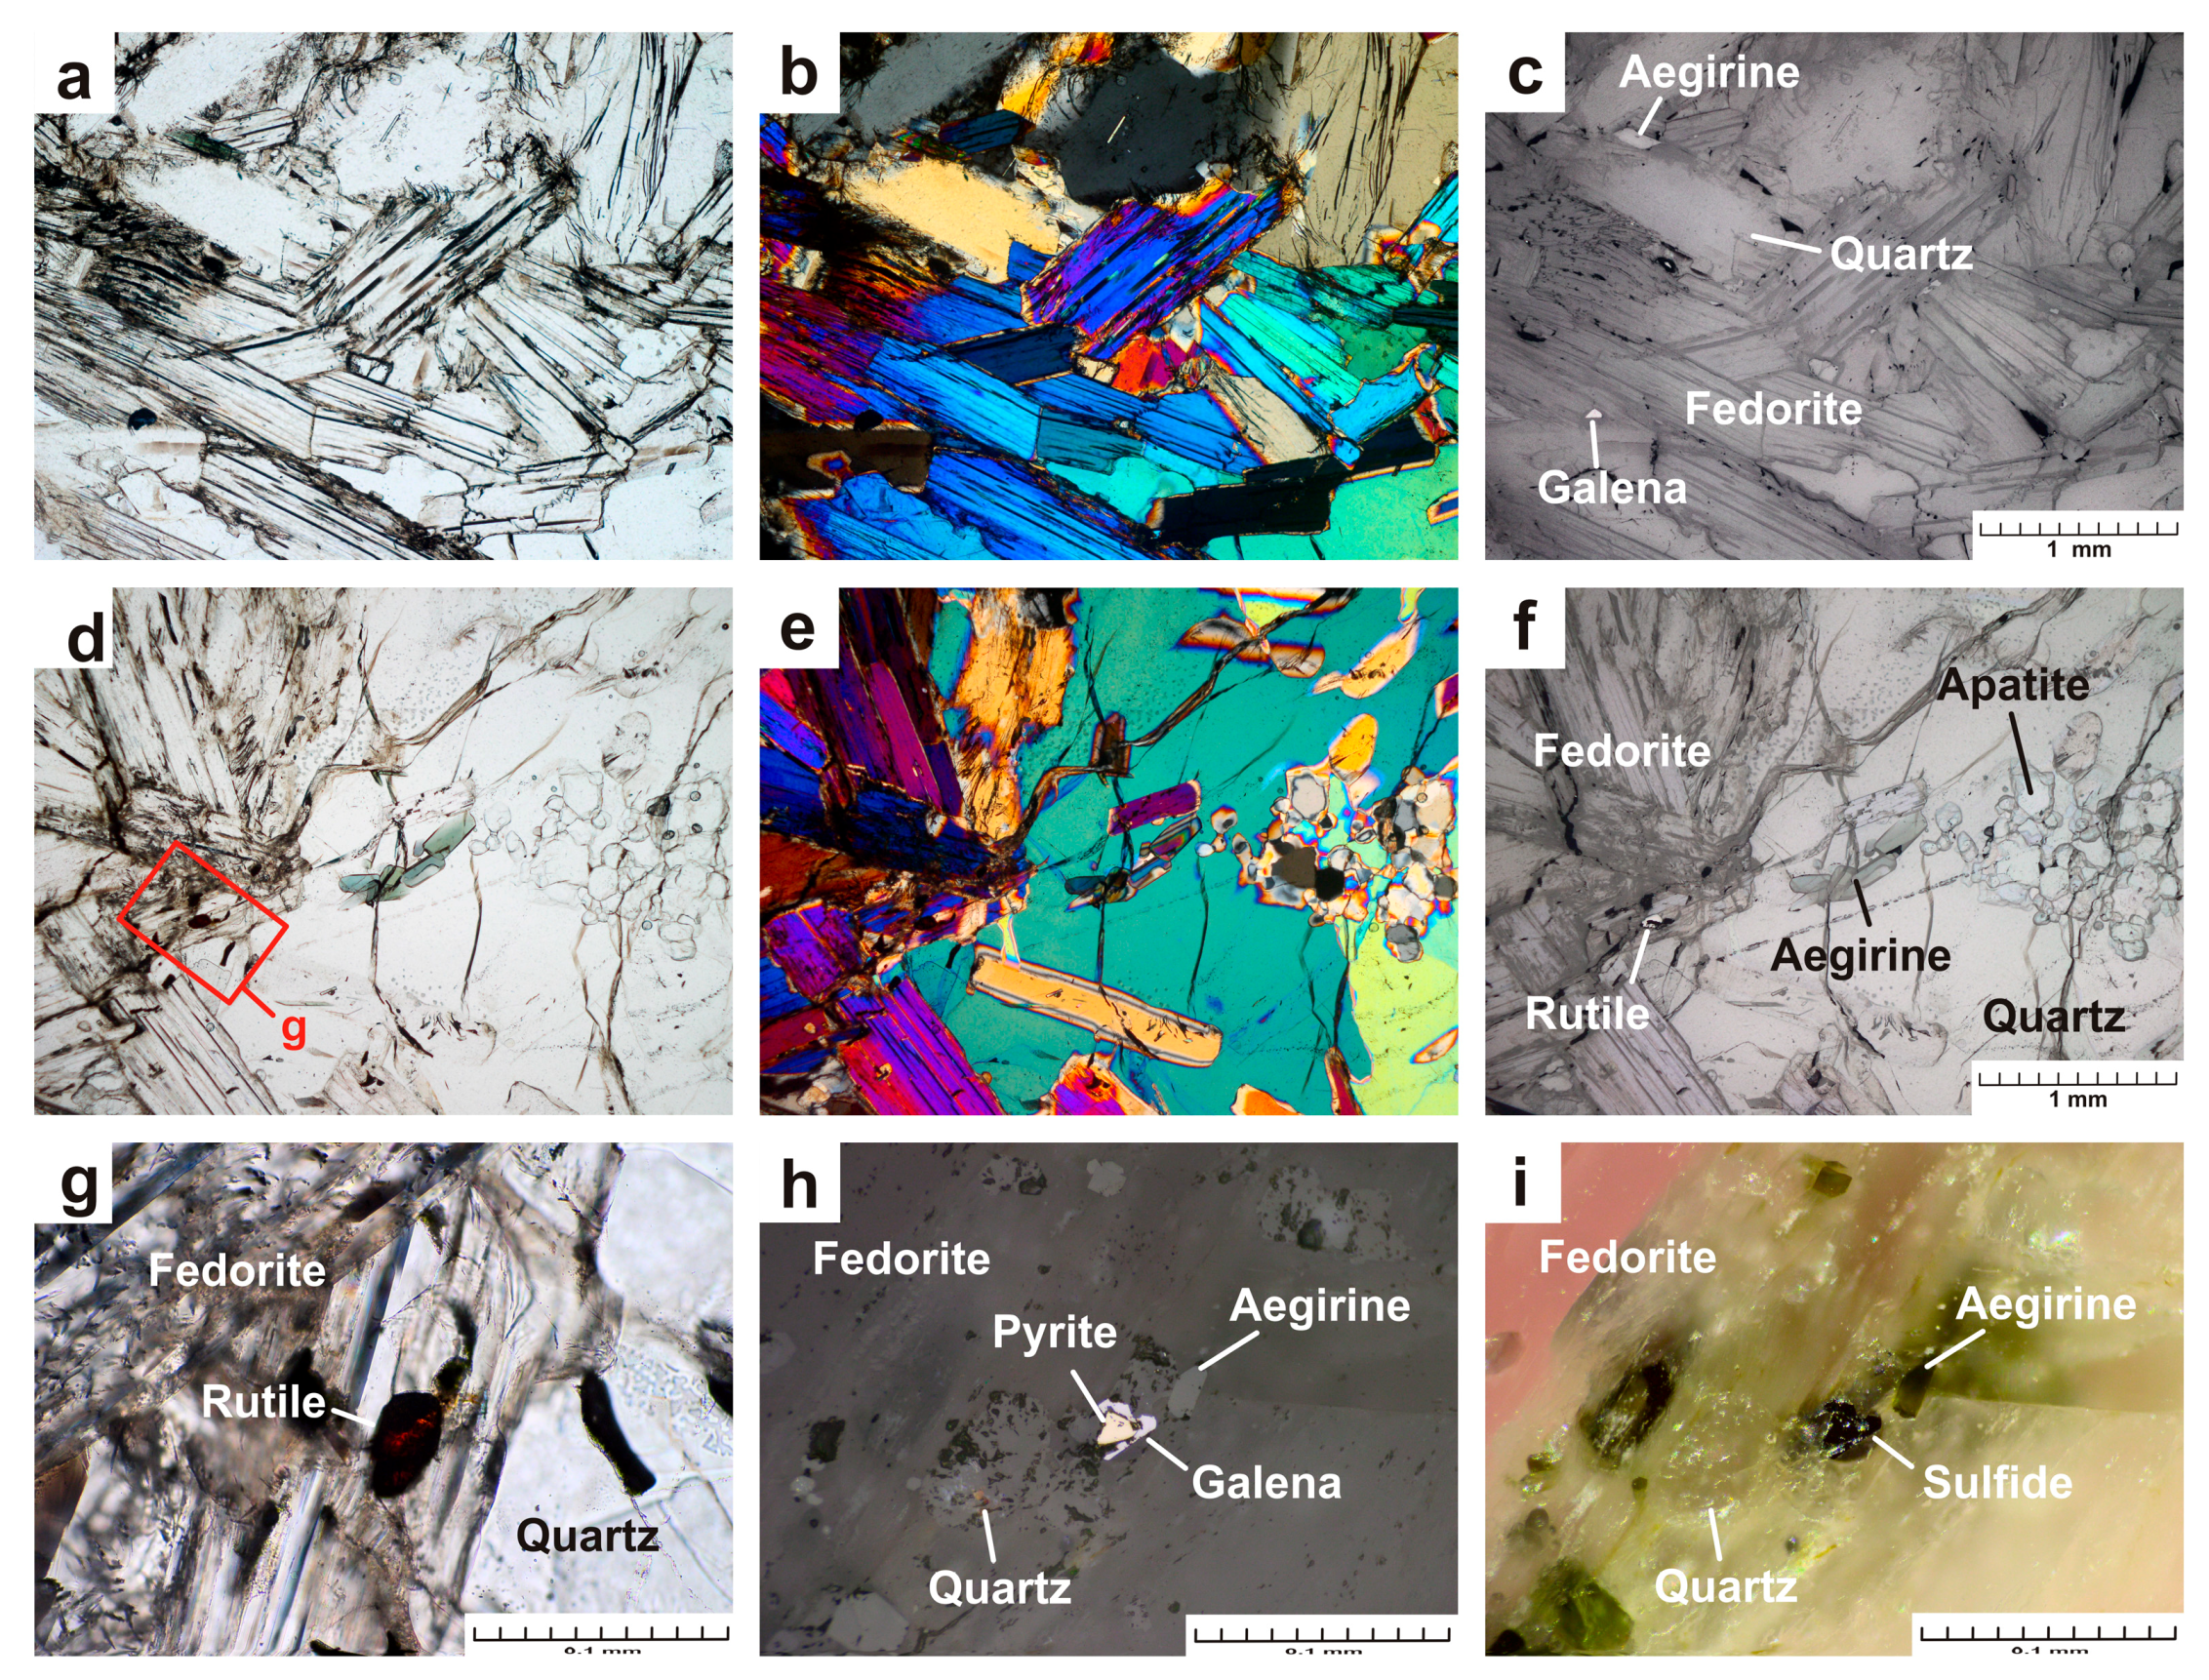
  • The sample Gav-43 (Gavrilovskaya zone of Murun complex) is a lenticular fragment (18 × 12 × 9 cm) composed mainly of well-formed large pale raspberry-red to bright mauve crystals of fedorite (70 vol.%), transparent grains of quartz (25 vol.%) and small grains of aegirine (5 vol.%) (Figure 1a,b). Fluorapatite, rutile, galena, pyrite are found in small amounts. Fedorite forms large tabular euhedral and subhedral crystals up to 4.0 × 4.0 × 0.5 cm in size. The mineral exhibits a pearly luster, it is translucent to transparent, with perfect cleavage on {001}. Small inclusions of euhedral crystals of dark green aegirine (up to 0.2 × 0.2 × 0.6 mm in size), fluorapatite (up to 0.07 × 0.07 × 0.15 mm) and rutile (0.02 × 0.02 × 0.03 mm) are found in fedorite (Figure 2 a–g). The single elongated euhedral crystals of aegirine (up to 0.2 × 0.2 × 5 mm in size) are concentrated in transparent quartz grains in the central part of the polished sample. Less commonly, aegirine forms aggregates. (Figure 2 a–c). Quartz is xenomorphic with respect to fedorite. Anhedral quartz grains are transparent. They contain numerous small crystals of aegirine (0.3 × 0.3 × 0.7 mm in size) and fluorapatite (up to 0.1 × 0.1 × 0.25 mm in size). Rarely, sulfide grains (galena and pyrite up to 0.02 mm in size) can be found in quartz (Figure 2h,i).
  • The sample Yak-5 (Yakutskiy district) is a lenticular fragment (8 × 6 × 3 cm) consisting of fedorite in the central part (60 vol.%) and quartz (20 vol.%), charoite (20 vol.%) and microcline (single grains) on the periphery (Figure 3a,b). A thin layer of charoite covers the microcline–quartz–fedorite aggregate. At the same time, thin veins of charoite are also found in the central part. Steacyite and fluorapatite are present in the sample in small amounts. Fedorite forms tabular subhedral and anhedral crystals (up to 5.0 × 4.5 mm in size) of a pale raspberry to pale brown color with a pearly luster. The mineral is translucent to transparent, cleavage is perfect on {001}. Small inclusions of euhedral fluorapatite crystals (up to 0.3 × 0.3 × 0.8 mm) are found in fedorite. Fedorite is partially altered and replaced by secondary minerals (Figure 4a–c). The microcline is found in the form of single tabular white anhedral grains (up to 1 mm in size). Quartz is observed in the form of transparent lenticular or anhedral grains (up to 10 mm in size). These grains form a rim (wide of 4–10 mm) around fedorite, interrupted by thin veins of charoite (Figure 4a–i). Quartz is xenomorphic with respect to fedorite. Thin fibrous crystals of charoite and euhedral grains of steacyite (up to 0.2 × 0.2 × 0.5 mm in size) were found in quartz. Radial fractures are observed in quartz around the steacyite grains, which were formed as a result of radiation damage (Figure 4g–i). Charoite is a cryptocrystalline aggregate of lilac color with a pinkish tint and a silky luster. The elongated fibrous crystals form a shell that surrounds the quartz-fedorite lens and individual quartz grains. Hypoidiomorphic steacyite grains (up to 0.1 × 0.1 × 0.3 mm in size) are elongated along charoite veins (Figure 4a–f).
  • The sample Irk-53 (Irkutskiy district) is characterized by the greatest mineral diversity. It is a lenticular fragment (10 × 6 × 3.5 cm) consisting of the following minerals (in vol.%): aegirine (25), tinaksite (15), fedorite (10), microcline (2), quartz (33), charoite (15) (Figure 5a,b). Steacyite, galena and native copper are present in the sample in small amounts. Aegirine is represented by dark green elongated euhedral and subhedral crystals (up to 0.2 × 2.5 mm in size) with vitreous luster (Figure 5a–c). The crystals form sheaf-like and radially radiant aggregates with a diameter of up to 5 mm. Tinaksite is represented by elongated euhedral and subhedral light brown crystals (up to 0.3 × 15 mm) with a vitreous luster (Figure 6a–f). Crystals form sheaf-like aggregates up to 15 mm in length. Fedorite forms tabular subhedral pale raspberry-red crystals (up to 0.8 × 1.5 mm) with a pearly luster (Figure 6a–f). The mineral is translucent to transparent with perfect cleavage on {001}. The microcline is found in the form of single tabular anhedral greenish grains (up to 5 mm in size). Quartz is observed in the form of transparent lenticular or anhedral grains (up to 10 mm in size) with a greasy luster. Quartz is xenomorphic with respect to aegirine, tinaksite and fedorite. Charoite is a cryptocrystalline aggregate of lilac color with a silky luster. Elongated fibrous crystals (less than 1 μm thick) form aggregates that surround earlier minerals (Figure 5a,b and Figure 6a–c). Separate charoite fibers were found in quartz in the form of inclusions that indicates a close crystallization time of these minerals. Steacyite is found in paragenesis with charoite and quartz. Euhedral transparent tetragonal yellowish-brownish crystals of steacyite reach 0.5 × 0.5 × 12 mm in size. Moreover, its grains observed in quartz are larger and have a higher degree of euhedrality than steacyite grains in charoite. Galena is found in the form of elongated subhedral and euhedral grains (up to 1.2 × 0.6 mm) in fedorite and quartz (Figure 6d–h). Small grains of native copper (up to 0.01 mm in size) were also found in quartz (Figure 6h).

3. Materials and Methods

3.1. Chemical Analysis

Chemical data of fedorite samples were obtained by means of a Jeol JXA-8200 electron microprobe (JEOL, Tokyo, Japan) equipped with a high-resolution scanning microscope, an energy-dispersive spectrometer with the Si(Li) detector (resolution—133 eV) and five wavelength-dispersive spectrometers (WDSs). The analyzed samples were polished sections of fedorite-containing rock. The conditions for the excitation and recording of analytical signals were as follows: accelerating voltage = 20 kV; probe current = 5 nA; beam diameter = 5 μm; counting time on peak = 10 s; and counting time on background = 5 s. The following standards were used: albite (Na), diopside (Mg, Ca, Si), orthoclase (K), ilmenite (Ti), Mn-garnet (Mn), pyrope (Al, Fe), celestine (Sr), barite (Ba), Nb pure (Nb), Cl-apatite (Cl) and phlogopite (F). A conversion from X-ray counts to oxide weight percentages was obtained with the ZAF data reduction system.
Table 1 represents the average composition of the studied fedorite samples (Gav-43, Yak-5, Irk-53) compared with those of fedorite compositions found in the literature.

3.2. Single-Crystal X-ray Diffraction Study

Structure analyses of fedorite single crystals (samples Gav-43, Yak-5 and Irk-53) were carried out using a Bruker AXS D8 VENTURE dual-source automated diffractometer (Bruker, Berlin, Germany) equipped with a Photon 100 detector. Intensities were collected at room temperature using graphite-monochromated MoKα radiation (operating conditions—50 kV and 1 mA, crystal-to-detector distance—40 mm). Two sets of 12 frames were used for initial cell determination, whereas the entire Ewald sphere (±h, ±k, ±l) up to θmax ~ 40° was recorded by a combination of several φ and ω rotation sets, with 0.5° scan width and 1–5 s exposure time per frame. The data collection strategies were optimized by the APEX2 program suite [14] and the reflection intensities were extracted and corrected for Lorentz-polarization by the SAINT package [15]. The CrysAlis PRO program was also used for data processing [16]. A semi-empirical absorption correction was applied by means of the SADABS software (Version 2014/4) [17]. Finally, least-squares refinements were performed using the program CRYSTALS [18]. Information concerning the data collection and refinement is listed in Table 2. The refined parameters included scale factors, atom coordinates, atomic displacement parameters and occupancies (for alkaline and alkaline earth sites and Ow positions). Occupancies for Si, O and F atoms were constrained to 1. For the refinement of the Ca and Na occupancies in the M-octahedra the restrain Ca + Na = 1 ± 0.01 was imposed. However, the authors experienced considerable difficulties in localizing interlayer anions. In contrast to the refinement carried out by [7], the occupancy of the Ow20 position was not constrained. The distribution of K atoms and oxygens of the water molecules between the identified disordered positions was guided by the results of microprobe analysis (calculation of K atoms per formula unit). The refinements reveal large displacement parameters for some K and Ow ions indicating, possibly, mixed cationic-anionic occupancy of the same structural sites.
The results of X-ray diffraction studies of the fedorite samples cannot be used to locate H atoms of water molecules in the structure due to low occupancy and disordering of the H2O positions.
The CIFs are deposited with the Cambridge Crystallographic Data Centre (CCDC 2016399, 2,016,400 and 2016401). Final atomic coordinates, site occupancies, equivalent/isotropic and anisotropic displacement parameters for the studied fedorite samples are reported in Tables S1–S6 of Supplementary Materials. Relevant cation-anion bond lengths are given in Tables S7 and S8 of Supplementary Materials.
Crystal structures were visualized using the Vesta (Version 3.4.4) program [19].

3.3. Polyhedra Characteristics Calculation

The calculation of the characteristics of coordination polyhedra was performed to carry out a statistical analysis of structural data.
Bond-valence sum (BVS) was calculated as ΣSij = Σjexp[(RORij)/B], where Rij is the bond represent length between ions I and j, Sij is the bond valence, and RO and B are the bond-valence parameters [20]. The values RO and B for ion pairs involving oxygen were obtained in [21], whereas to calculate Sij of the cation-fluorine bonds, RO and B given in [22] were used.
An effective coordination number (ECoN) was calculated using VESTA 3.4.4. [19], which adopts ECoN defined as Σiωi The ωi is called “bond weight” of the ith bond and is determined as ωi = exp [1 – (li/lav)6], where li is a bond length and lav is a weighted average bond length. See [23,24,25] et al. for details on ECoN.
The coordination numbers (CN) of polyhedral were derived from the ECoN determination as well as using the suggestion of [26] to consider solely the bonds, which have a significant contribution (>0.05 vu) to BVS of a central cation.
The volume of the coordination polyhedron (Vp) is the sum of the volumes of general tetrahedral with three of the vertices in ligands and the fourth one in the volume center of the polyhedron. The volume center is the point with coordinates which considered as the simple arithmetic averages of the coordinates of all the ligands, three of which lie on the same face of the coordination polyhedron. The centroid of a polyhedron is defined as the point having the smallest deviation of distances to the polyhedron’s vertices [27].
With the introduction of these concepts, for further analysis, the following parameters are calculated:
The average distance from the volume center to the ligands (rv);
The distance of the central atom to the volume center (Δv);
The average distance from the centroid to the ligands (rs);
The distance of the central atom to the centroid (Δ);
The volume of the sphere fitted to the positions of ligands (Vs);
The volume eccentricity calculated as ECCv = 1 – [(rs – Δ)/rs]3;
The volume sphericity calculated as SPHv = 1– 3σrs/rs, where σrs is a standard deviation of distances from ligands to the centroid.
The eccentricity is a numerical characteristic of a conical section, pointing out the degree of its deviation from the circle. The circle has zero eccentricity, ellipses have an eccentricity of less than 1. The sphericity is a measure of how spherical a fitted sphere is. It is less than 1 for nonspherical objects.
A computer program (IVTON) which calculates these parameters is available [28].
To better understand interrelations involved in polyhedral distortion, it is necessary to describe it quantitatively. The used distortion parameters are the following:
The volume distortion (υ) [29] is calculated relative to an ideal polyhedron with the same coordination number and inscribed inside the sphere with the radius rs. υ = (Vi – Vp)/Vi where Vi is the volume of the ideal polyhedron, and Vp the volume of the coordination polyhedron. The calculation was performed in IVTON [28].
Bond length distortion was calculated as BLD = 100/n· i = 1 n | ( M O ) i M O i   | / M O (%), where n is the number of bonds and (M–O) is the central cation-oxygen length [30];
Edge length distortion was calculated as ELD = 100/n i = 1 n | ( O O ) i O O i   | / O O (%), where n is the number of bonds and (O–O) is the oxygen-oxygen edge (or, in our case, oxygen-fluorine and fluorine-fluorine) length [30];
Tetrahedral angle variance was calculated as TAV = i = 1 6 ( θ i     109.47 ) 2 / 5 , where θ is individual bond angle [31];
Tetrahedral quadratic elongation was calculated as TQE =   i = 1 4 ( I i / I o ) 2 / 4 , where Io is the center to vertex distance for an undistorted tetrahedron whose volume is equal to that of the distorted tetrahedron with bond length Ii [31];
Octahedral angle variance was calculated as OAV = i = 1 12 ( θ i 90 ) 2 / 11 , where θ is individual bond angle [31];
Octahedral quadratic elongation was calculated as OQE = i = 1 6 ( I i / I o ) 2 / 6 , where Io is the center to vertex distance for an undistorted octahedron whose volume is equal to that of the distorted octahedron with bond length Ii [31].
Bond length and edge length distortion (BLD and ELD) are a measure of the dispersion of the individual bond lengths and edge length, i.e., a large value indicates dispersed bonds, while low ones indicate that the bonds are closely grouped around an average value. The bond angle variance (TAV and OAV) is equal to 0 for a regular polyhedron and is >0 for a distorted polyhedron. The quadratic elongation (TQE and OQE) is dimensionless and equal to 1 for a regular polyhedron while it is >1 for a distorted polyhedron.
The polyhedral geometry characteristics and distortion parameters were calculated for studied fedorite from Murun massif and compared with those calculated for fedorite and structurally related minerals from the literature (Tables S9–S13 of Supplementary Materials). Further details are given in the “Structural features” section below.

3.4. Spectroscopy Study

The infrared (IR) absorption spectra of fedorite (Gav-43 and Irk-53 samples) were measured by the Fourier-Transform Infrared method (FTIR) using an FT-801 (Simex, Novosibirsk, Russia) spectrometer. Powdered samples were mixed with preliminary dried KBr, pelletized, and measured with a resolution of 1 cm–1. A total of 32 scans were collected in the wavenumber range 480 to 4000 cm–1. The FTIR spectrum of an analogous pellet of the pure KBr was used as a reference.
The electron paramagnetic resonance (EPR) spectra were registered using an X-band spectrometer RE1306 (KBST, Yartsevo, Russia) operated at a microwave frequency of 9380 MHz. The spectrometer was equipped with a quartz cryostat suitable for temperatures of 77 and 295 K.
Diffuse optical absorption spectra of both samples were obtained by a Perkin-Elmer Lambda 950 UV/VIS/NIR spectrophotometer at 300 K using an integrated sphere as proposed in [32,33].
The sample Gav-43 has relatively large grains that are cleaved to a thin plate with a thickness of 0.1 mm. The transmittance of the single crystal plate was measured.
The Ce3+ related photoluminescence excitation (PLE) spectra were measured with a Perkin-Elmer LS-55. The PLE spectra were corrected for the varying intensity of exciting light due. Luminescence corresponding manganese ions was excited with a 405 nm solid-state laser having 50 mW power. The samples were placed in vacuum cryostat at 77 K. Luminescence was registered using a grating monochromator MDR-2 and a photomodule Hamamatsu H6780-04.
It was not possible to obtain the spectroscopy data for the sample Yak-5 since the mineral grains contain intergrowths with associating minerals and are not suitable for analysis.

4. Results and Discussion

4.1. Chemical Composition

The crystal-chemical formulas were calculated on the basis of (Si + Al) = 16 atoms per formula unit (apfu) and assuming H2O content consistent with the refined occupancies of the Ow sites at the interlayer level (Tables S1, S3, S5 of the Supplementary Materials). As noted earlier in [7], in fedorite some of the F ions may be substituted by Cl. Some of the analyzed samples contain a slightly reduced amount of fluorine and chlorine (Yak-5 and Irk-53 sample). Accordingly, the calculated atomic proportion of OH group, substituting F and Cl in the crystal structure, for the studied fedorite samples ranges from 0.01 to 0.45 apfu. The presence of OH groups and H2O molecules was confirmed by infrared (IR) spectroscopy. The crystal-chemical formulas of the studied samples of fedorite and those from literature are represented in Table 3. All Ca was located at the M site followed by Mn, Fe, Mg and Na atoms until full occupancy. Remaining Na, as well as K, Sr, Ba, having large ionic radii, were assigned to interlayer A site. Considering that the total negative charge in the ideal formula is 78 valence units (v.u.) it can be noted that our samples have a deficiency of positive charge, which is compensated by the substitution of part of the bridging oxygen atoms (Ounsh) of the Si-tetrahedral layers by OH groups. It should be noted that the manganese content is given by assuming it in the form of Mn2+; however, we discuss the state of manganese in the “Spectroscopy” section, below.
Electron microprobe analysis of fedorite revealed that individual crystals have different potassium content and it is higher with respect to those published early (from 5.2 to 7.4 wt.% vs. 1.58 and 3.01 wt.% in the fedorite from Murun and Turiy complexes [7]. While the content of sodium in the samples analyzed in [7] is higher (Table 1). It is noteworthy that aluminum and chlorine concentrations in the studied sample are low in comparison with the fedorite from the Turiy complex, whereas fluorine content is reduced in comparison with the Murun sample analyzed by [7]. In addition, our samples taken from different districts of massif slightly differ in their content of manganese, chlorine and strontium (Table 1).

4.2. Structural Features

The three fedorite crystals studied have similar values of refined cell constants (∆a ~ 0.01 Å, ∆b ~ 0.016 Å, ∆c ~ 0.004 Å, ∆α, ∆β, ∆γ ~ 0.03º; see Table 1 and Table S9 of the Supplementary Materials). In addition, the lattice constants of studied fedorite samples closely approach those of the Murun and Turiy fedorite of [7] (see S8 of the Supplementary Materials).
Structure refinements of fedorite crystals converged to good values of the agreement factors (2.34 ≤ R ≤ 3.10% and 2.92 ≤ wR ≤ 3.52%, Table 2). Our structural models are generally consistent with those proposed by [7]. Small differences can be observed in bond lengths and angles when comparing the tetrahedra and octahedra in the three structures (Tables S7 and S8 of the Supplementary Materials). However, refinement results here provide some geometric details including modelling of the interlayer ions site disorder, speciation and occupancies.
To describe the fedorite crystal structure (Figure 7) it is more convenient to consider tetrahedral and octahedral sheets and interlayer contents separately.

4.2.1. Si-Tetrahedra (T-Sheets)

The sheets of tetrahedra (T2) have six tetrahedra whose vertices point in one direction toward a sheet of octahedra (O), and two (Si1 and Si6) whose vertices point in the other direction. The T2 is related to the T ¯ 2 layer by the center of symmetry via the bridging oxygen. Projections along the a, b and c axes of the single and double layers are shown in Figure S2a–c of Supplementary Materials, respectively. The size of the six-membered rings, which formed a single layer, is about 6.34 × 3.24 and 5.16 × 5.08 Å (as viewed along the c axis, Figure S2c of Supplementary Materials). As a result of the condensation of the two T-layers, 8-membered rings of 5.66 × 5.57 Å in size are created (as viewed along the b axis, Figure S2b of Supplementary Materials). There are further six- and eight-membered rings with a size of ~5.49 × 5.34 and ~5.80 × 5.66 Å, respectively. These values are quite close to those found in other silicates from the Murun charoite-bearing rocks (see, for example, [32,34,35,36]).
In the fedorite crystal structure, there are eight tetrahedrally coordinated symmetrically independent Si sites. Tetrahedral distances are quite similar in studied samples: the measured Si-O individual distances range from 1.578(1) to 1.636(1) Å. All tetrahedra evidence a notable shortening of unshared Si-O bond lengths (<Si-Ounsh> ~1.587 Å) with respect to shared ones (<Si–Osh> ~ 1.621 Å). This feature is pronounced in the crystal structure of the structurally and chemically related silicate minerals from Murun massif (for instance, miserite [34], frankamenite [37], tinaksite and tokkoite [35], fluorcarletonite [36], agrellitte [32].

4.2.2. M-Octahedra (O-Sheets)

The O layers are effectively sandwiched between two symmetrically equivalent T2 layers (T2 T ¯ 2). The O sheets are joint to the T2 layers through apical atoms of oxygen from the SiO4 tetrahedra of the 6-membered rings. In the octahedral sheet of the fedorite crystal structure, the symmetrically independent crystallographic cation sites are four positions containing different amounts of Ca and Na (Figure S3 of Supplementary Materials). The mean atomic number (m.a.n.) varies from about 13.63 to 18.84 e.
In all of the three analyzed crystals, the <M–O> bond lengths and the octahedral volumes are very close. This similarity most possible is due to the very similar composition of the octahedral sites and closed values of Na and Ca ionic radii (1.02 Å and 1.00 Å for Na and Ca with CN = 6; [38]).

4.2.3. Interlayer Cations (A) and H2O Molecules

The interlayer cavities are occupied by alkaline (K and Na) and minor alkali-earth (Sr and Ba) cations and water molecules. The six-membered Si-O rings host alkaline ions which are split over two different positions; here they are labelled Na5 and K1 (Na5-K1 ~ 0.57–0.89 Å, Table S8 and Figure S4 of Supplementary Materials). According to the refinement, the occupancies are ~47–52% (Na5) and 24–27% (K1) in different samples.
Another common feature for the three samples under study is the presence of a water molecule at Ow20 position. In contrast to the structural models of [7], where the occupancy of this position was initially set equal to 1, in our models its occupancies were refined. They are equal to 53%, 85% and 0.52% in the crystal structural model of Gav-43, Yak-5 and Irk-53 samples, respectively. The Ow20 atom is bonded strongly to the Na5 cation. On the opposite side Na5 is bonded to F atom, and with six oxygens of tetrahedral ring it forms an eight-vertex coordination polyhedron with <Na5–O,F> ~ 2.544–2.552 Å (Table S8 of Supplementary Materials).
In the structural model of the sample Gav-43, K atoms are placed at positions K2, K3, K4, while position K2 is split into K21 and K22, having an occupancy up to 0.17 and distances to oxygen atoms in the range 2.79–3.14 Å (Tables S1 and S8 of Supplementary Materials). Four water molecules (Ow21–Ow24) have occupancies equal to 0.20–0.32. The short distances between some of these positions (1–2.5 Å, Table S8 of Supplementary Materials) ensure the statistical distribution of corresponding oxygen atoms.
In the structure of the sample Yak-5, a large degree of disordering of the structural sites assigned to the positions of K is noted. Six K sites (split K2, K3 and K4) are occupied by 14–21%. While the oxygen of the water molecule has a Ow21 position with an occupancy of 11%.
Finally, in the sample Irk-53, all interlayer positions, except for the aforementioned Ow20, are filled with cations according to the results of the microprobe analysis. Seven positions of cations (other than those Na5 and K1 mentioned yet) are populated by potassium by 8-17% (Tables S5 and S8 of the Supplementary Materials).

4.3. Structural Relationship between Fedorite, Lalondeite, Martinite and Ellingsenite, Comparison of Polyhedral Characteristics and Deformation of Coordination Polyhedra
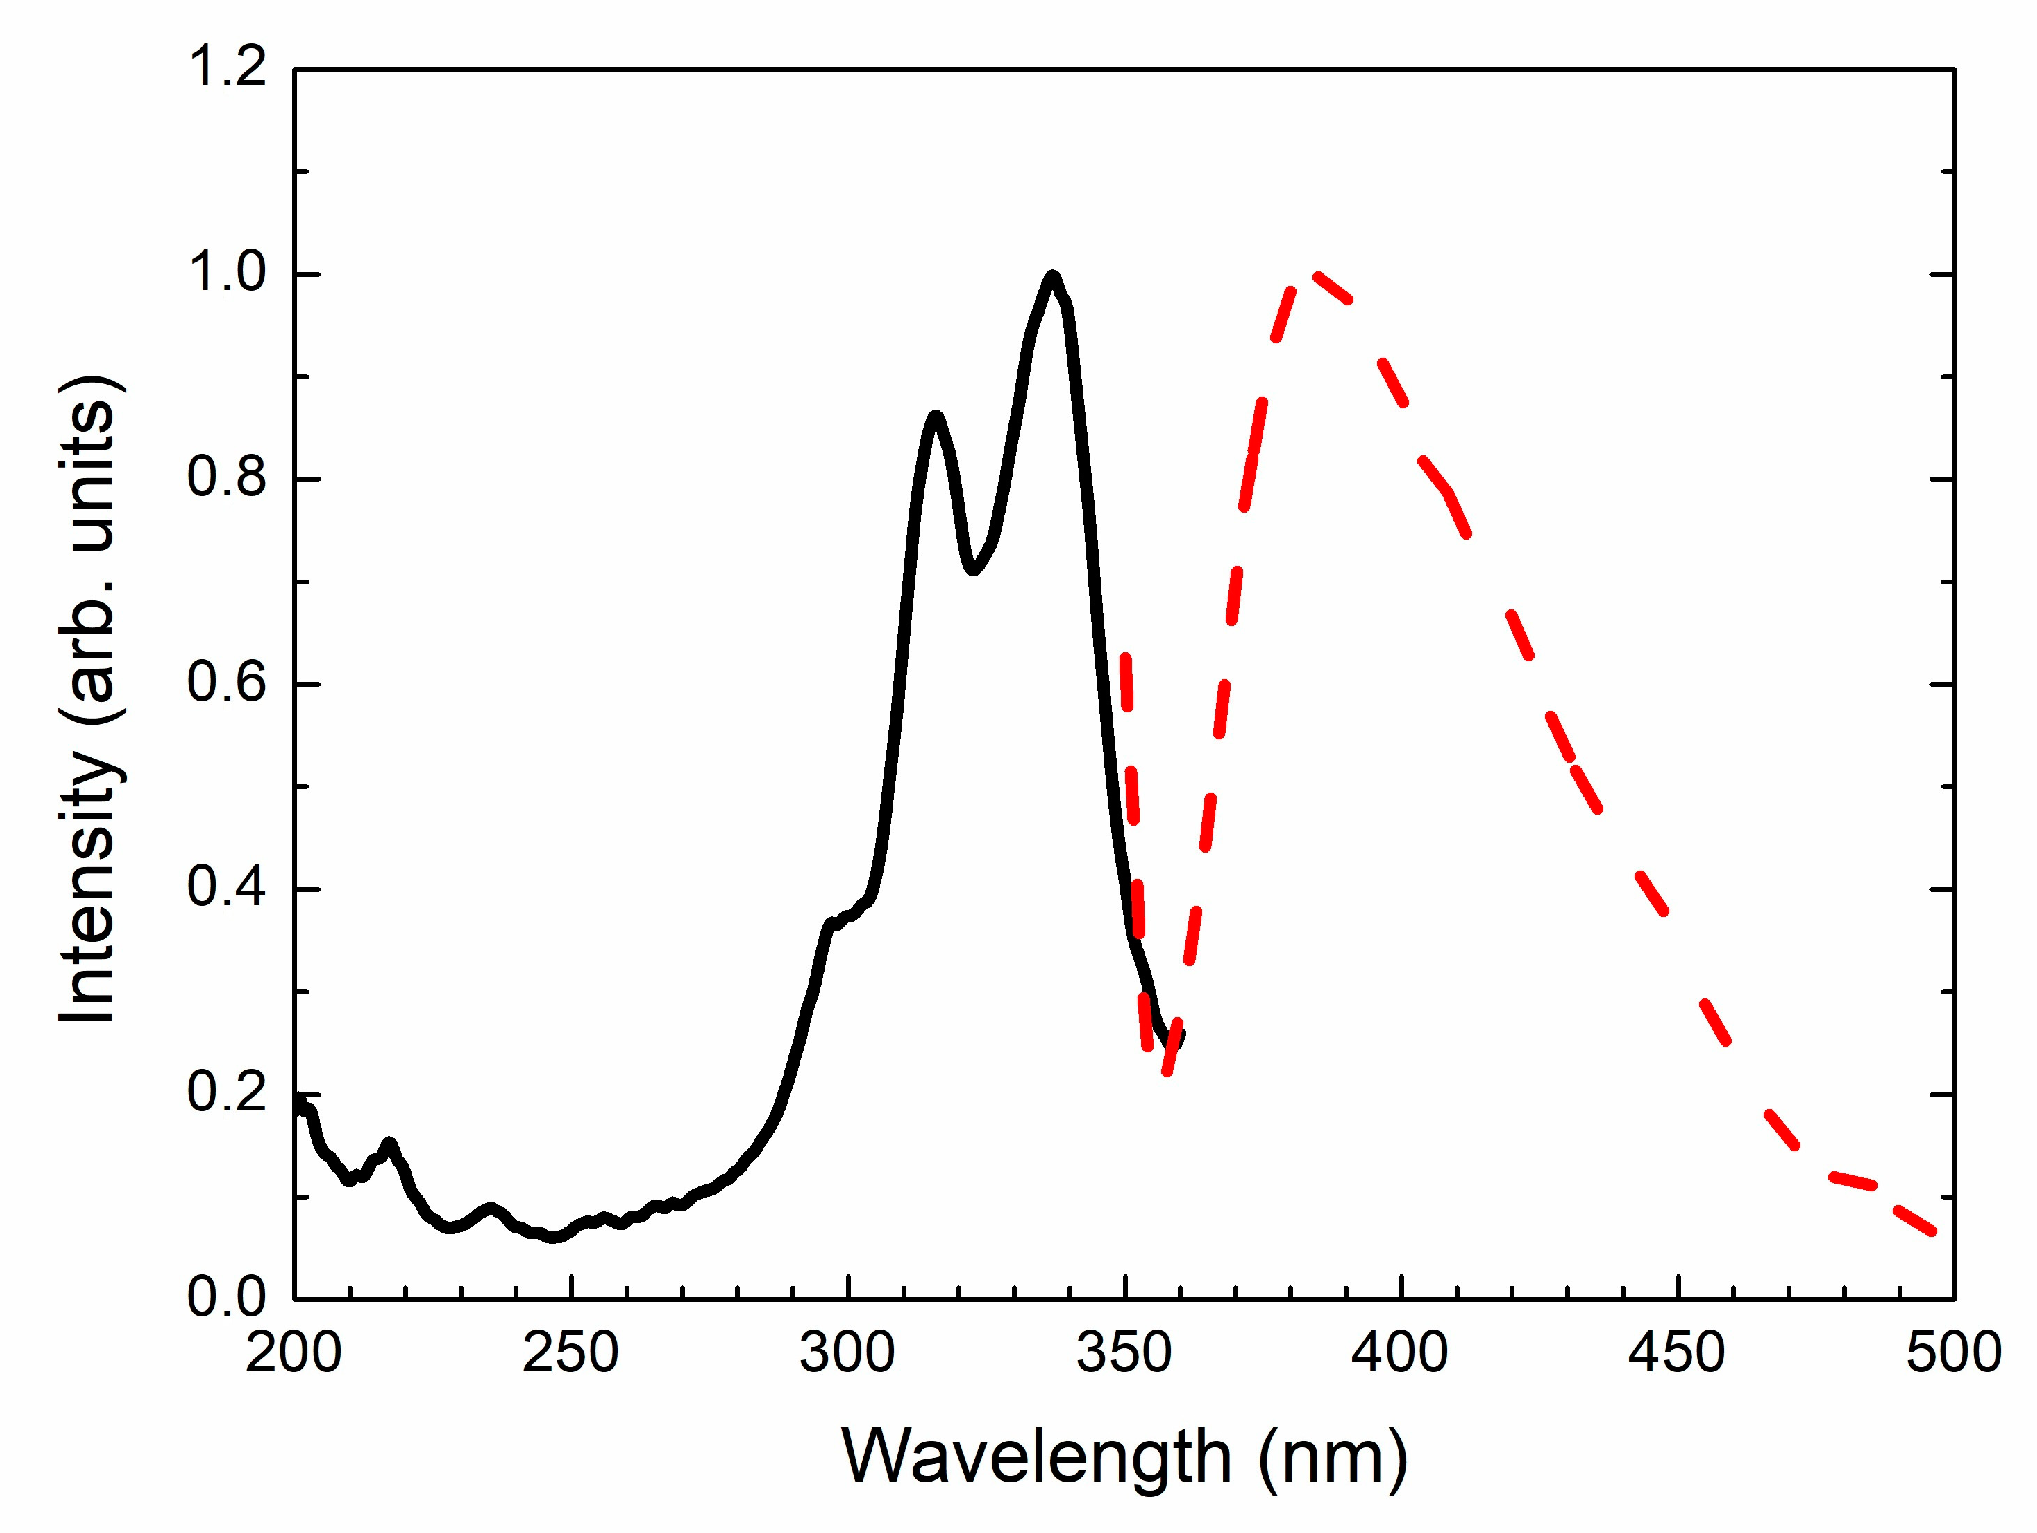
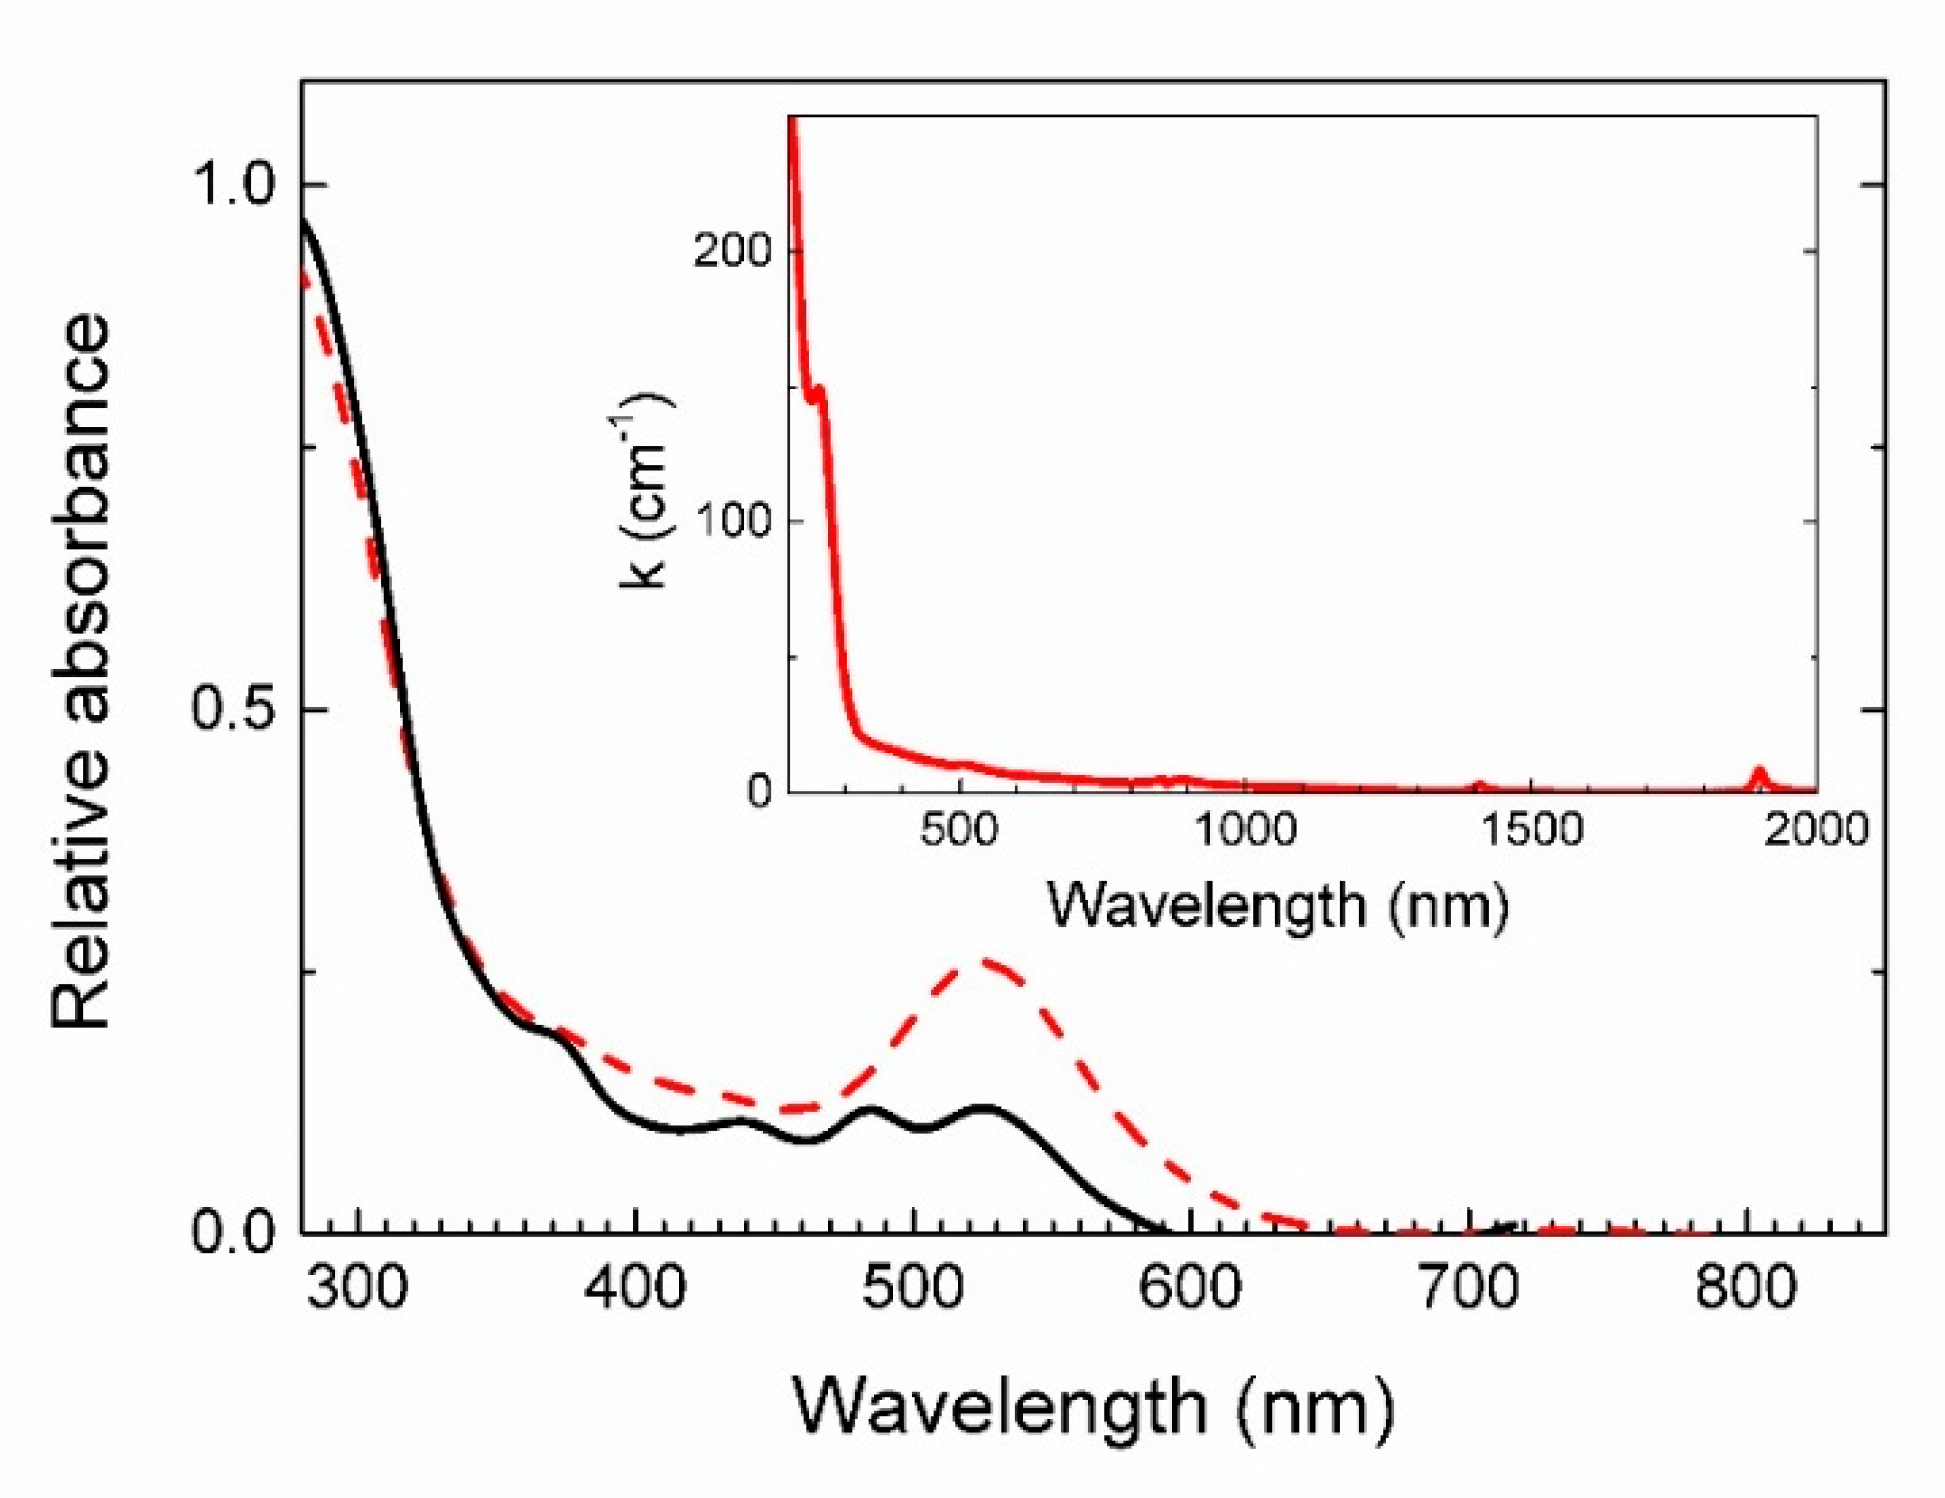
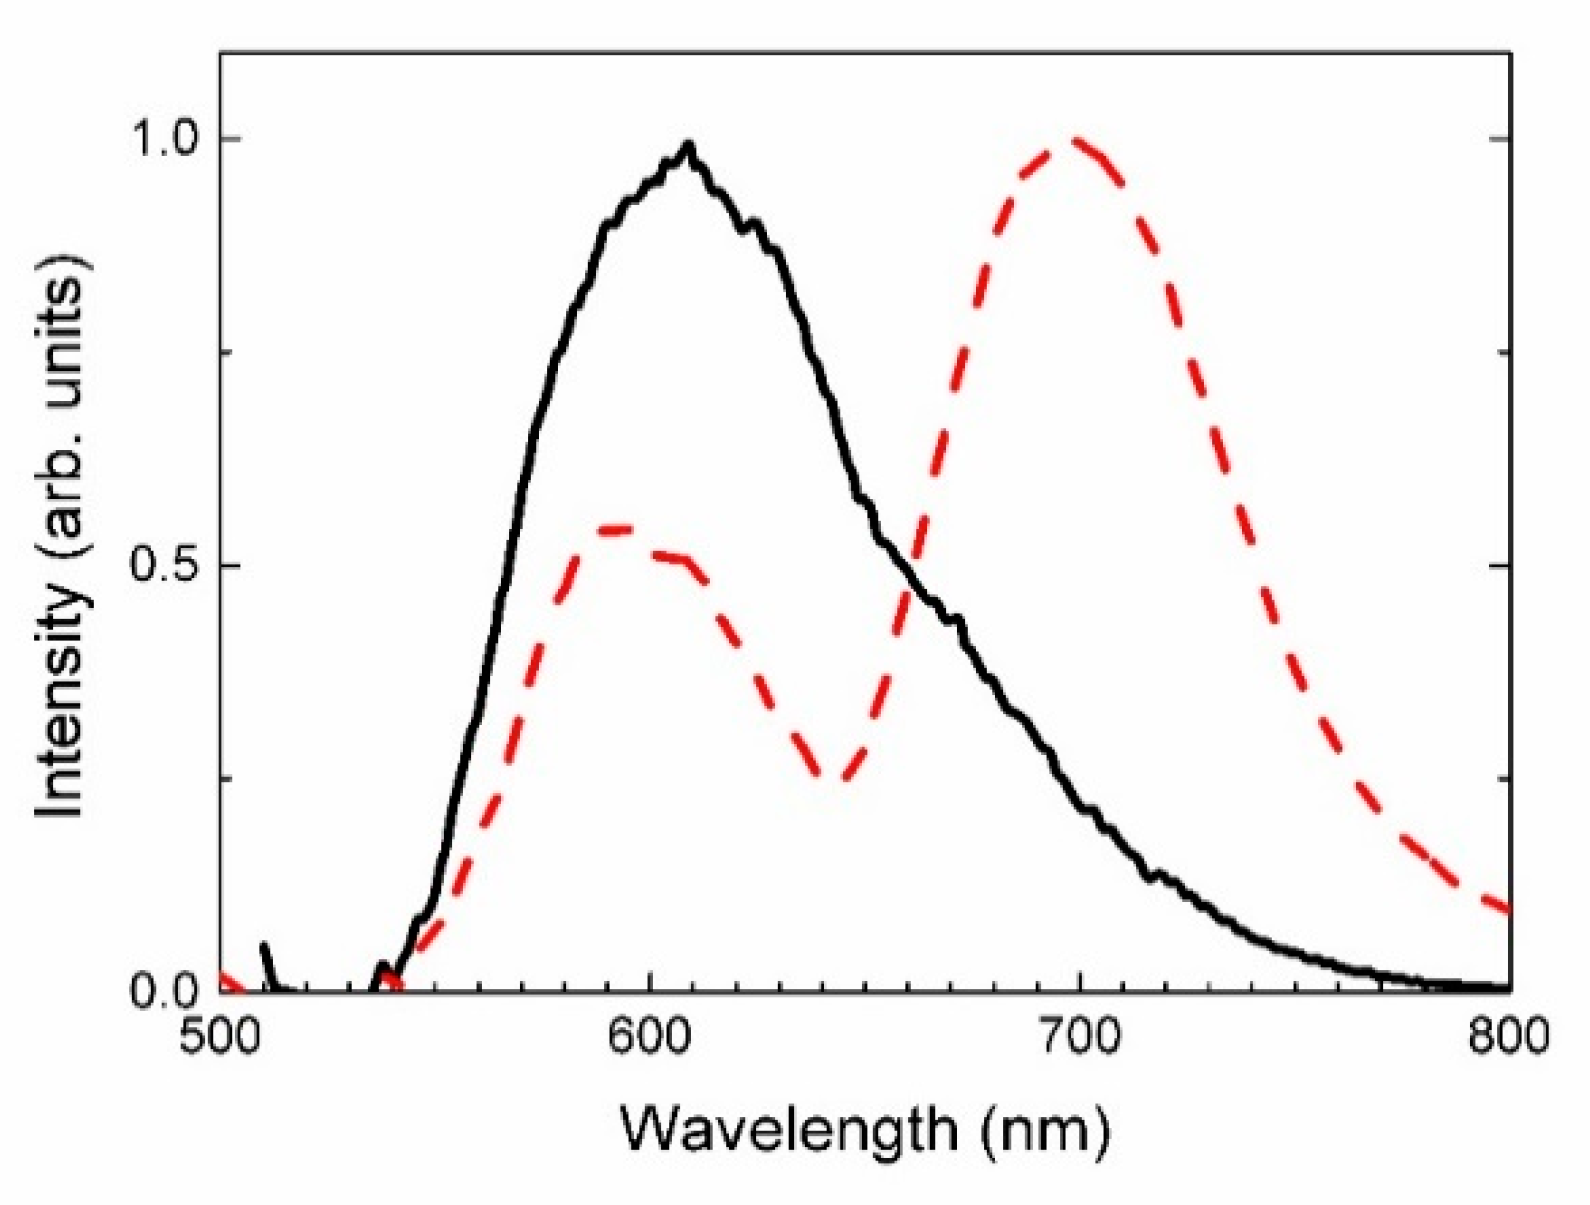
Lalondeite, (Na,Ca)6(Ca,Na)3Si16O38(F,OH)2·3H2O, having a OT2 T ¯ 2O module, similar to fedorite, has been found at Mont Saint-Hilaire (Quebec, Canada) [39]. In the M-sheet of the structure of the lalondeite one site is occupied by Na+, two positions are filled by Ca2+, and the fourth site is mixed. In the cavities of the structure, two disordered Na and three H2O molecules are accommodated.
Martinite, (Na,□,Ca)12Ca4(Si,S,B)14B2O38(OH,Cl)2F2·4H2O, from Mont Saint-Hilaire (Montreal, QC, Canada) was described by [40] as the first mineral recognized to have a OT2X T ¯ 2O module. The second one is ellingsenite, Na5Ca6[Si18O38(OH)13]·6H2O, from Aris complex (Namibia), described by [41]. In martinite and ellingsenite crystal structures, T2-layers are not condensed, allowing the X layer to form. Figure S5 of the Supplementary Materials shows the crystal structure of martinite. The martinite T layers are composed of six-membered rings of SiO4 tetrahedra that are linked by BO4, (Si,B)O4 and BO3(OH) tetrahedra to complete the sheet. The presence of the additional layer (X) increases the value of the martinite c parameter by 1.4 with respect to fedorite, and 1.9 Å with respect to lalondeite (Table S9 of Supplementary Materials). In the martinite crystal structure, there are two [6]-coordinated Ca2+ ions and two [6]-coordinated Na+ ions. In ellingsenite, the O layer is composed of Na-, two Ca-octahedrally coordinated sites and one cation site that is occupied by 50% Ca2+ and 50% Na+. The interlayer component (X) in martinite houses poorly ordered Na polyhedra and H2O molecules. The bonding between polyhedra in the X component and the adjacent T2 sheets is weak. It confirms the lower-than-ideal bond-valence sums of X-atoms. The spacing between the T layers in ellingsenite is about 2.3 Å larger than that in martinite. According to [41], a part of the silica is located within the Na-H2O interlayers. However, this is an assumption that requires verification.
Despite the fact that there are large and low-valence cations (K and Na) and H2O molecules in the large cavities between the T2 sheets of fedorite and lalondeite, their tetrahedral layers remain condensed. Presumably, that can be explained by the presence of Na polyhedral of low coordination in the X layers of martinite and ellingsenite.
In Tables S10 and S12 of Supplementary Materials, selected calculated geometrical parameters related to the coordination polyhedra of the three structures under study and structurally related minerals are listed. The polyhedral and the sphere volumes (Vp and Vs) illustrate the space demand of the various cations. Vp and vs. for Si are very similar in all structures (2.10–2.17 Å3 and 17.00–17.81 Å3, respectively). Depending on the amount of B in tetrahedral sites of martinite, a steady decrease in Vp and vs. (up to 1.66 and 13.57 Å3, respectively) with a decreasing of bond valence sum (BVS) and average distance from the central atom to the ligands (up to 2.96 vu, 1.480 Å, respectively, for “Si1” position) are observed (see Table S10 of supplementary material). The average distance from the central atom to the ligands of two Si sites whose vertices point in the direction opposite to the O-sheets—”Si1” and “Si6”—are slightly shorter and bond valence sums (BVS) are slightly higher (Table S10 of supplementary material). The Vp and volume eccentricity (ECCv) also increases compared to ECCvs calculated for other Si tetrahedra.
The volume distortion (υ) of two Si sites whose vertices point in the direction opposite to the O-sheets (“Si1” and “Si6”) is lower than the ones for Si, whose vertices point in one direction toward a sheet of octahedra (O). The same is valid for TAV, BLD and ELD parameters (Table S11 of supplementary material). Figure 8a,b and Figure S6 in the Supplementary Materials show a relationship between the distortion parameters for the T1–T8 tetrahedral site of the minerals listed in Table S11 of Supplementary Material.
Vp and vs. for M sites show the variations. Vp and vs. for M1 are larger than Vp and vs. for M2, M3 and M4. ECCv varies greatly, amounting to 0 for M1, and reaching 0.18. The M1 has the lowest value of volume sphericity (SPHv), and SPHvs of M2, M3 and M4 do not differ significantly. In particular, Figure 9a,b shows a good correlation between the volume sphericity (SPHv) vs. sphere volume (Vs) and polyhedral volume (Vp). The Vp and vs. of Na5 in fedorite and related polyhedra positions in fedorite models of [7], martinite and ellingsenite are much larger (Table S12 of Supplementary Materials, Figure 9b). An exception is lalondeite, in which a different geometry of the arrangement of the M-octahedra and the absence of 8-coordinated Na-polyhedron in the cavity are noted.
The octahedra volume distortion in fedorite follows the trend υ(M1) > υ(M2) > υ(M4) > υ(M3).
We observe that the investigated fedorite samples have the same trend in terms of BLD, ELD, OAV and OQE parameters (Figure 10 and Figure S7 of Supplementary Materials).
Comparison of distortion parameters for M1-M4 in fedorite with those in lalondeite, martinite and ellingsenite shows significantly larger differences than those in the T-sheet.
The calculated quantities point out higher irregularity in the coordination polyhedra of lalondeite, martinite and ellingsenite with respect to the fedorite structure.

4.4. Spectroscopy

The infrared spectra of the fedorite samples Gav-43 and Irk-53 are given in Figure 11. The group of peaks observed at 1119, 1030, 792, 615 cm–1 may be assigned to the asymmetric and symmetric Si–O stretching modes of the SiO4 tetrahedra. The relationship between the peaks at 1119 and 1030 cm–1 is different in the Gav-43 and Irk-53 samples. This difference could be explained by the inequality of disordering of the interlayer ions and the partitioning of cations between the octahedral positions in the Gav-43 and Irk-53 samples. The absorption band at 1627 cm–1 is assigned to O–H bending. The spectra of the samples Gav-43 and Irk-53 differ in the 2800–4000 cm–1 spectral region (see the inset of Figure 11). In both samples, peaks at 3177 and 3428 cm−1 are attributed to stretching modes of H2O in different structural positions. However, intensities of these peaks in the samples Gav-43 and Irk-53 are different. It means that the distribution of H2O molecules on interlayer positions is different. The sharp lines at 3551, 3635, 3656 cm–1 could be assigned to OH- modes. The intensities are also different in the Gav-43 and Irk-53 samples. The Irk-53 sample contains a higher concentration of OH- ions than the Gav-43.
The infrared spectra features found in this study are in agreement with the previous ones reported for structurally related minerals of similar chemical composition. The positions of the bands (cm–1) in the IR spectra of studied fedorite samples, lalondeite, martinite and ellingsenite are summarized in Table S14 of Supplementary Materials.
In both fedorite samples, EPR signals were observed at room and 77 K temperatures (Figure 12). The EPR spectra exist in a sextet structure with 90 Gauss splitting with g-factor of 2.001. These bands correspond to Mn2+ ions (I = 5/2). Manganese ion substitutes a cation of calcium and surrounded by two or one fluorine ions. The intensity of the EPR signal of the sample Irk-53 is about three times higher than in the sample Gav-43. This is in good agreement with the average chemical composition shown in Table 1. Electron microprobe analysis revealed that the concentration of Mn in the sample Irk-53 is higher than in the sample Gav-43.
The sample Gav-43 demonstrates a wide photoluminescence peak at about 390 nm under 337 nm excitation (Figure 13). This luminescence has 70 ns decay time constant. The excitation spectrum monitored at 390 nm is given by a black solid curve. In the spectrum, five bands peaked at 217, 235, 300, 316, 337 nm appear. Luminescence having a close peak at 410 nm under laser or X-ray excitation was observed by Yarovoy et al. [42]. The authors assumed, based on alkali-earth fluoride emission data, that this luminescence was due to 5d–4f transitions in Eu2+ ions substituting Ca2+ ions. However, analysis of the excitation spectrum was not performed by [42]. The excitation spectrum in Figure 13 does not contain a europium typical “staircase” structure. Eu2+ related emission decay time constant is usually about 400–1000 ns that is longer than the one observed in the fedorite. Furthermore, Eu2+ centers have strong EPR signal, but it is not found in the studied samples. Therefore, the observed in our samples UV luminescence peaked at 390 nm cannot be related to Eu2+ ions. However, this luminescence is attributed to 5d–4f transition in Ce3+ ion, where Ce3+ ion substitutes Ca2+ ion. The charge compensation mechanism is discussed below. A similar band was observed in agrellite having almost equivalent ligand field [32,43]. Contrary to the information in the [42], the luminescence of Eu2+ peaked at 410 nm was not been observed in agrellite by [43]. Five peaks in the excitation spectrum correspond to transitions from the ground 4f state of the Ce3+ ion to the crystal field split 5d state. Ce3+ ions have a low symmetry point group, therefore, the 5d state is split into five levels [32,44]. In the sample Irk-53 Ce3+ related luminescence is absent.
Optical absorption spectra in near-infrared, visible and ultraviolet spectral regions are given in Figure 14. The full range spectrum of a thin crystal plate is given in the inset of Figure 14. The strong intense peak at 255 nm and the fundamental absorption edge at 230 nm are found.
The absorption band peak at 535 nm causes the sample Gav-43 to be a pale raspberry-red to bright mauve. In the sample Irk-53, this band has a lower intensity and it has not pure color. Under 405 nm excitation, both samples demonstrate a luminescence peak at 600 nm at room temperature (Figure 15). This luminescence could be attributed Mn2+ emission due to spin-forbidden transition 4T16A1, where Mn2+ is located in the octahedral crystal field [45]. Yarovoy et al. [42] observed an emission peak at 530 nm. This luminescence band was attributed to Mn2+ centers. However, in the later research of this group [46,47,48], other emission peaks at 570 and 600 nm related to Mn2+ emission were observed. Such inconsistent results may be due to a lack of photomultiplier sensitivity correction in the earlier article [42]. A wide luminescence peak at 700 nm with long decay time about 600 μs appears in the sample Gav-43 at 77 K, but this luminescence is quenched at room temperature. The excitation spectrum of this emission coincides with the optical absorption spectrum. It has a peak at 535 nm and wide structureless plateau from 300 to 410 nm. Therefore, we can conclude that the absorption band at 535 nm and luminescence at 700 nm are related to one center. This corresponds to the luminescence of Mn4+ centers in silicates and fluoride-containing materials [49,50,51]. According to the Tanabe–Sugano diagram [52], Mn4+ could demonstrate broad absorption bands in blue and green spectral range in the octahedral crystal field. The emission is attributed to spin-forbidden 2E → 4A2 transition and the spin-allowed 4T24A2 transition. A nonhomogeneous broadening of the spectrum can be expected due to positional disordering in the fedorite crystal structure.
On the other hand, the absorption band at 535 nm could be attributed to Mn3+ centers [53]. However, Mn3+ ions have not luminescence at 700 nm region. Therefore, the pale raspberry-red coloration of the sample Gav-43 could be due to the oxidation of Mn2+ ions to Mn4+.
Mn4+ ions can be stabilized in the crystal structure only in the octahedral coordination [45]. Therefore, the charge compensation may be reached as a result of heterovalent substitution Ce3++Ca2+ → Na++Mn4+.
In [42,46,47], far-red emission peaks at 740 and 800 nm due to Fe3+ centers were observed. The samples studied in our work do not contain trivalent iron ions. All iron ions in the studied fedorite samples are divalent and they have not emission. That fact is confirmed by the absence of a Fe3+-related EPR signal. Therefore, no emission from Fe3+ centers is found in our samples.

5. Conclusion

Three different mineral associations with fedorite found out on the Murun massif were considered in the article.
(1) aegirine–apatite–rutile–fedorite–pyrite–galena–quartz (Gavrilovskaya zone);
(2) apatite–fedorite–microcline–steacyite–quartz–charoite (Yakutskiy district);
(3) aegirine–tinaksite–galena–copper–fedorite–microcline–steacyite–quartz–charoite (Irkutskiy district).
The (1) is associated with brookite–anatase–feldspar–quartz rocks, while the (2) and (3) are joined with charoite mineralization. The mineral relationships and the form of their occurrences allowed us to determine the following sequence of the crystallization: aegirine–apatite–tinaksite–fedorite–microcline–steacyite–quartz–charoite.
The study of melt and fluid inclusions in the minerals of charoite rocks, carried out by [54,55], showed that the crystallization of the studied associations occurred in a heterophasic system with the participation of carbonate-silicate and carbonate melts, gaseous and water–salt fluids. Moreover, early rock-forming minerals were formed at high temperatures (more than 800 °C), and the final stages of crystallization took place at lower temperatures (600–450 °C). For brookite–anatase–quartz veins of the Murun massif, it has been proven that mineral associations with brookite, rutile, and sulfides crystallized at temperatures of 280–210 °C, while mineral parageneses of pyrite and galena formed within 255 and 210 °C [55]. Taking into account these data, we can conclude that fedorite from brookite-anatase-feldspar-quartz rocks of the Gavrilovskaya zone crystallized at lower temperatures compared to the fedorite from charoite rocks. This assumption is confirmed by low-temperature mineral paragenesis with rutile and sulfides, as well as the presence of a larger amount of water in the crystal structure of fedorite from the Gavrilovskaya zone. Previously, the conclusion about the low-temperature formation was made for other minerals of the reyerite–gyrolite group (e.g., [56]), and, specifically, for structurally close to fedorite phases, considered in this paper: lalondeite [39], martinite [40] and ellingsenite [41].
The crystal structure of fedorite is characterized by a higher regularity in the geometry of coordination polyhedra, but also by a higher disordering of interlayer ions. Finally, for the first time, EPR, optical absorption and emission spectra of Mn2+ ions are obtained for fedorite. Some samples containing Mn and Ce have pale raspberry-red color due to presence of Mn4+ ions.

Supplementary Materials

The following are available online at https://www.mdpi.com/2075-163X/10/8/702/s1, Figure S1: The fedorite 63 net with its unit cell, Figure S2: The fedorite tetrahedral sheet (T-layer), Figure S3: The fedorite octahedral sheet (O-layer), Figure S4: Fedorite structure fragment, showing the linkages between the O and T2 sheets, T2 and T ¯ 2 sheets and interlayer Na5, K1 and Ow20 positions, Figure S5: Crystal structures of fedorite (sample Gav-43) and martinite projected along a axis, Figure S6: Volume distortion (υ) plotted against volume eccentricity (ECCv) for tetrahedral, Figure S7: Volume distortion (υ) plotted against octahedral quadratic elongation (OQE) for M1-M4octahedra. Table S1: Crystallographic coordinates, occupancies and equivalent/isotropic atomic displacement parameters (Å2) of fedorite sample Gav-43, Table S2: Anisotropic atomic displacement parameters (Å2) of fedorite sample Gav-43, Table S3: Crystallographic coordinates, occupancies and equivalent/isotropic atomic displacement parameters (Å2) of fedorite sample Yak-5, Table S4: Anisotropic atomic displacement parameters (Å2) of fedorite sample Yak-5, Table S5: Crystallographic coordinates, occupancies and equivalent/isotropic atomic displacement parameters (Å2) of fedorite sample Irk-53, Table S6: Anisotropic atomic displacement parameters (Å2) of fedorite sample Irk-53, Table S7: Selected bond distances (Å) for tetrahedra and polyhedral of the studied fedorite samples, Table S8: Selected bond distances (Å) for interlayer atoms of the studied fedorite samples, Table S9: Unit cell parameters of the studied fedorite samples compared with literature data on fedorite, lalondeite, martinite and ellingsenite, Table S10: Calculated geometrical parameters for tetrahedra in the crystal structures of studied fedorite samples, fedorite, lalondeite, martinite and ellingsenite, Table S11: Calculated distortion parameters for tetrahedra in the crystal structures of studied fedorite samples and fedorite, lalondeite, martinite and ellingsenite from literature, Table S12: Calculated geometrical parameters for coordination polyhedra (M1, M2, M3, M4) in the crystal structures of fedorite, lalondeite, martinite and ellingsenite, Table S13: Calculated distortion parameters for coordination polyhedra (M1, M2, M3, M4) in the crystal structures of fedorite, lalondeite, martinite and ellingsenite, Table S14: The positions of the bands (cm−1) in the IR spectra of the studied fedorite and structurally related minerals.

Author Contributions

Conceptualization, E.V.K.; Methodology, R.Y.S., E.V.K.; Investigation, E.V.K., R.Y.S., T.A.R. and L.F.S.; Writing—Original Draft Preparation, E.V.K., R.Y.S. and T.A.R.; Writing—Review and Editing, E.V.K.; Visualization, T.A.R., R.Y.S. and E.V.K. All authors have read and agreed to the published version of the manuscript.

Funding

The study was supported by the grant of the President of the Russian Federation MK-936.2019.5 (for E.V.K.).

Acknowledgments

The study was carried out using facilities of the Center for Collective Use (“Center for isotopic-geochemical investigations” at the Vinogradov Institute of Geochemistry SB RAS and “Baikal analytical center for collective use” at the Favorsky Irkutsk Institute of Chemistry SB RAS) of the Irkutsk Scientific Center, Siberian Branch of the Russian Academy of Sciences. The authors thank Vasiliy Y. Sychev for the samples provided for the study. Thanks are due to Mikhail A. Mitichkin for sample polishing and thin section preparation. We are grateful to reviewers for their valuable comments.

Conflicts of Interest

The authors declare no conflict of interest.

References

  1. Kukharenko, A.A.; Orlova, M.P.; Bulakh, A.G.; Bagdasarov, E.A.; Rimskaya-Korsakova, O.M.; Nefedov, E.I.; Il’inskii, G.A.; Sergeev, A.S.; Abakumova, N.B. Caledonian Complex of Ultrabasic, Alkaline Rocks and Carbonatites of the Kola Peninsula and North Karelia; Nedra: Moscow, Russia, 1965. [Google Scholar]
  2. Khomyakov, A.P.; Lapin, A.V.; Kazakov, M.E. New Data on Mineralogy of Deposits of Alkaline Formations; IMGRE: Moscow, Russia, 1979; pp. 3–7. [Google Scholar]
  3. Sokolova, G.V.; Kashaev, A.A.; Drits, V.A.; Ilyukhin, V.V. The crystal structure of fedorite. Sov. Phys. Cryst. 1983, 28, 95–97. [Google Scholar]
  4. Joswig, W.; Drits, V.A.; Sokolova, G.V. Refinement of the structure of fedorite. Sov. Phys. Cryst. 1988, 33, 763–765. [Google Scholar]
  5. Konev, A.A.; Vorobyev, Y.I.; Bulakh, A.G. Charoit–der Schmuckstein aus Sibirien und seine seltenen Begleit-minerale. Lapis 1993, 18, 13–20. [Google Scholar]
  6. Konev, A.A.; Vorob’ev, E.I.; Lazebnik, K.A. Mineralogy of Murun massif. Sib. Branch Russ. Acad. Sci. 1996, 111–113. [Google Scholar]
  7. Mitchell, R.H.; Burns, P.C. The structure of fedorite: A re-appraisal. Can. Mineral. 2001, 39, 769–777. [Google Scholar] [CrossRef] [Green Version]
  8. Hawthorne, F.C.; Uvarova, Y.A.; Sokolova, E. A structure hierarchy for silicate minerals: Sheet silicates. Mineral. Mag. 2019, 83, 3–55. [Google Scholar] [CrossRef]
  9. Bonaccorsi, E.; Merlino, S. Modular microporous minerals: Cancrinite-davine group and C-S-H phases. Rev. Mineral. Geochem. 2005, 57, 241–290. [Google Scholar] [CrossRef]
  10. Ferraris, G. Polysomatism as a tool for correlating properties and structure. In Modular Aspects of Minerals; Merlino, S., Ed.; Eotvos University Press: Budapest, Hungary, 1997. [Google Scholar]
  11. Ferraris, G.; Gula, A. Polysomatic aspects of microporous minerals—Heterophyllosilicates, palysepioles and rhodesite-related structures. Rev. Mineral. Geochem. 2005, 57, 69–104. [Google Scholar] [CrossRef]
  12. Rastsvetaeva, R.K.; Aksenov, S.M. Crystal chemistry of silicates with three-layer TOT and HOH modules of layered, chainlike, and mixed types. Cryst. Rep. 2011, 56, 910–934. [Google Scholar] [CrossRef]
  13. Ivanov, A.V.; Vladykin, N.V.; Demonterova, E.I.; Gorovoy, V.A.; Dokuchits, E.Y. 40Ar/39Ar geochronology of the Malyy (Little) Murun massif, Aldan shield of the Siberian craton: A simple story for an intricate igneous complex. Minerals 2018, 8, 602. [Google Scholar] [CrossRef] [Green Version]
  14. Bruker APEX2; Version 2014.11-0; Bruker AXS Inc.: Madison, WI, USA, 2014.
  15. Bruker SAINT; Version V8.34; Bruker AXS Inc.: Madison, WI, USA, 2013.
  16. CrysAlis, PRO.; Version 1.171.35.21; Agilent Technologies Ltd.: Yarnton, UK, 2018.
  17. Sheldrick, G.M. SADABS, Program for Empirical Absorption Correction of Area Detector Data; University of Göttingen: Göttingen, Germany, 2003. [Google Scholar]
  18. Betteridge, P.W.; Carruthers, J.R.; Cooper, R.I.; Prout, K.; Watkin, D.J. Crystals version 12: Software for guided crystal structure analysis. J. App. Cryst. 2003, 36, 1487. [Google Scholar] [CrossRef]
  19. Momma, K.; Izumi, F. VESTA 3 for three-dimensional visualization of crystal, volumetric and morphology data. J. Appl. Cryst. 2011, 44, 1272–1276. [Google Scholar] [CrossRef]
  20. Brown, I.D.; Altermatt, D. Bond-valence parameters obtained from a systematic analysis of the inorganic crystal structure database. Acta Cryst. 1985, B41, 244–247. [Google Scholar] [CrossRef] [Green Version]
  21. Gagnè, O.C.; Hawthorne, F.C. Comprehensive derivation of bond-valence parameters for ion pairs involving oxygen. Acta Cryst. 2015, B71, 562–578. [Google Scholar] [CrossRef] [Green Version]
  22. Breese, N.E.; O’Keeffe, M. Bond-valence parameters for solid. Acta Cryst. 1991, B47, 192–197. [Google Scholar] [CrossRef]
  23. Hoppe, R. Effective coordination numbers (ECoN) and mean fictive ionic radii (MEFIR). Z. Krist. Cryst. Mater. 1979, 150, 23–52. [Google Scholar] [CrossRef]
  24. Hoppe, R.; Voigt, S.; Glaum, H.; Kissel, J.; Müller, H.P.; Bernet, K. A new route to charge distributions in ionic solids. J. Less Common. Met. 1989, 156, 105–122. [Google Scholar] [CrossRef]
  25. Nespolo, M.; Ferraris, G.; Ohashi, H. Charge distribution as a tool to investigate structural details: Meaning and application to pyroxenes. Acta Cryst. 1999, B55, 902–916. [Google Scholar] [CrossRef] [Green Version]
  26. Brown, I.D. The Chemical Bond in Inorganic Chemistry: The Bond Valence Model; Oxford University Press: Oxford, UK, 2006. [Google Scholar]
  27. Balić-Žunić, T.; Makovicky, E. Determination of the centroid or ‘the best centre’ of a coordination polyhedron. Acta Cryst. 1996, B52, 78–81. [Google Scholar] [CrossRef]
  28. Balić-Žunić, T.; Vicković, I. IVTON—Program for the calculation of geometrical aspects of crystal structures and some crystal chemical applications. J. Appl. Cryst. 1996, 29, 305–306. [Google Scholar] [CrossRef]
  29. Makovicky, E.; Balić-Žunić, T. New measure of distortion for coordination polyhedral. Acta Cryst. 1998, B54, 766–773. [Google Scholar] [CrossRef] [Green Version]
  30. Renner, B.; Lehmann, G. Correlation of angular and bond length distortions in TO4 units in crystals. Z. für Kristallogr. 1986, 175, 43–59. [Google Scholar]
  31. Robinson, K.; Gibbs, G.V.; Ribbe, P.H. Quadratic elongation: A quantitative measure of distortion in coordination polyhedra. Science 1971, 172, 567–570. [Google Scholar] [CrossRef]
  32. Kaneva, E.; Shendrik, R.; Mesto, E.; Bogdanov, A.; Vladykin, N. Spectroscopy and crystal chemical properties of NaCa2[Si4O10]F natural agrellite with tubular structure. Chem. Phys. Lett. 2020, 136868. [Google Scholar] [CrossRef]
  33. Sofich, D.; Tushinova, Y.L.; Shendrik, R.; Bazarov, B.G.; Dorzhieva, S.G.; Chimitova, O.D.; Bazarova, J.G. Optical spectroscopy of molybdates with composition Ln2Zr3(MoO4)9 (Ln: Eu, Tb). Opt. Mater. 2018, 81, 71–77. [Google Scholar] [CrossRef]
  34. Kaneva, E.; Lacalamita, M.; Mesto, E.; Schingaro, E.; Scordari, F.; Vladykin, N. Structure and modeling of disorder in miserite from the Murun (Russia) and Dara-i-Pioz (Tajikistan) massifs. Phys. Chem. Miner. 2014, 41, 49–63. [Google Scholar] [CrossRef]
  35. Lacalamita, M.; Mesto, E.; Kaneva, E.; Scordari, F.; Pedrazzi, G.; Vladykin, N.; Schingaro, E. Structure refinement and crystal chemistry of tokkoite and tinaksite from the Murun massif (Russia). Mineral. Mag. 2017, 81, 251–272. [Google Scholar] [CrossRef]
  36. Kaneva, E.; Radomskaya, T.; Suvorova, L.; Sterkhova, I.; Mitichkin, M. Crystal chemistry of fluorcarletonite, a new mineral from the Murun alkaline complex (Russia). Eur. J. Miner. 2020, 32, 137–146. [Google Scholar] [CrossRef] [Green Version]
  37. Rozhdestvenskaya, I.V.; Nikishova, L.V.; Lazebnik, K.A. The crystal structure of frankamenite. Mineral. Mag. 1996, 60, 897–905. [Google Scholar] [CrossRef]
  38. Shannon, R.D. Revised effective ionic radii and systematic studies of interatomic distances in halides and chalcogenides. Acta Cryst. 1976, A32, 751–767. [Google Scholar] [CrossRef]
  39. McDonald, A.M.; Chao, G.Y. Lalondeite, a new hydrated Na-Ca fluorosilicate species from Mont Saint-Hilaire, Quebec: Description and crystal structure. Can. Mineral. 2009, 47, 181–191. [Google Scholar] [CrossRef]
  40. McDonald, A.M.; Chao, G.Y. Martinite, a new hydrated sodium calcium fluorborosilicate species from Mont Saint-Hilaire, Quebec: Description, structure determination and genetic implication. Can. Mineral. 2007, 45, 1281–1292. [Google Scholar] [CrossRef]
  41. Yakovenchuk, V.N.; Ivanyuk, G.Y.; Pakhomovsky, Y.A.; Selivanova, E.A.; Mikhailova, J.A.; Krivovichev, S.V.; Zolotarev, A.A.; Zalkind, O.A. Ellingsenite, Na5Ca6Si18O38(OH)13·6H2O, a new martinite-related mineral species from phonolite of the Aris alkaline complex, Namibia. Can. Mineral. 2011, 49, 1099–1107. [Google Scholar] [CrossRef]
  42. Yarovoy, P.N.; Konev, A.A.; Serykh, S.V. Nature of the luminescence of certain minerals from the Murun alkalic massif. Dokl. Earth Sci. 1989, 304, 226–229. [Google Scholar]
  43. Czaja, M.; Lisiecki, R. Luminescence of agrellite specimen from Kipawa River locality. Minerals 2019, 9, 752. [Google Scholar] [CrossRef] [Green Version]
  44. Shendrik, R.Y.; Kovalev, I.I.; Rusakov, A.I.; Solol’nikova, Y.V.; Shalaev, A.A. Luminescence of BaBrI crystals doped with Ce3+ ions. Phys. Solid State 2019, 61, 830–834. [Google Scholar] [CrossRef]
  45. Zhou, O.; Dolgov, L.; Srivastava, A.M.; Zhou, L.; Wang, Z.; Shi, J.; Dramićanin, M.D.; Brik, M.G.; Wu, M. Mn2+ and Mn4+ red phosphors: Synthesis, luminescence and applications in WLEDs. A review. J. Mater. Chem. C 2018, 11, 2652–2671. [Google Scholar] [CrossRef]
  46. Yarovoy, P.N. Laser-induced Luminescence Identification of Materials. 1996. Available online: https://luminescence.csiro.au/ (accessed on 4 August 2020).
  47. Yarovoy, P.N.; Badenikov, V.Y. Luminescence and Interaction of Laser Irradiation with Dielectrics; Irkutsk State Technical University: Irkutsk, Russia, 2004. [Google Scholar]
  48. Yarovoy, P.N. Luminescence and energy conversion in minerals, ceramics and catalysts under laser and X-ray excitation. Doctoral Thesis, Tomsk Polytechnic University, Tomsk, Russia, 2000. [Google Scholar]
  49. Hasegawa, T.; Nishiwaki, Y.; Fujishiro, F.; Kamei, S.; Ueda, T. Quantitative determination of the effective Mn4+ concentration in a Li2TiO3:Mn4+ phosphor and its effect on the photoluminescence efficiency of deep red emission. ACS Omega 2019, 4, 19856–19862. [Google Scholar] [CrossRef] [Green Version]
  50. Khaidukov, N.M.; Brekhovskikh, M.N.; Kirikova, N.Y.; Kondratyuk, V.A.; Makhov, V.N. Luminescence of MgAl2O4 and ZnAl2O4 spinel ceramics containing some 3d ions. Ceram. Int. 2020. [Google Scholar] [CrossRef]
  51. Zhang, Y.; Liu, Y.; Yang, L.; Hu, S.; Wang, Z.; Jing, Z.; Nian, H.; Liu, B.; Zhou, G.; Wang, S. Preparation and luminescence properties of thermally stable Mn4+ doped spinel red-emitted ceramic phosphors. J. Lumin. 2020, 220, 117016. [Google Scholar] [CrossRef]
  52. Tanabe, Y.; Sugano, S. On the absorption spectra of complex ions II. J. Phys. Soc. Jpn. 1954, 9, 766–779. [Google Scholar] [CrossRef]
  53. Gaft, M.; Nagli, L.; Panczer, G.; Rossman, G.R.; Reisfeld, R. Laser-induced time-resolved luminescence of orange kyanite Al2SiO5. Opt. Mater. 2011, 33, 1476–1480. [Google Scholar] [CrossRef]
  54. Vladykin, N.V.; Borokovikov, A.A.; Dokuchits, E.Y.; Thomas, V.G. Genesis of charoite rocks in the Murun massif, Aldan shield, Russia. Geochem. Int. 2018, 56, 1135–1147. [Google Scholar] [CrossRef]
  55. Borovikov, A.A.; Vladykin, N.V.; Tretiakova, I.G.; Dokuchits, E.Y. Physicochemical conditions of formation of hydrothermal titanium mineralization on the Murunskiy alkaline massif, western Aldan (Russia). Ore Geol. Rev. 2018, 95, 1066–1075. [Google Scholar] [CrossRef]
  56. Shaw, S.; Henderson, M.B.; Clark, S. In-situ synchrotron study of the kinetics, thermodynamics, and reaction mechanisms of the hydrothermal crystallization of gyrolite, Ca16Si24O60(OH)8·14H2O. Am. Mineral. 2002, 87, 533–541. [Google Scholar] [CrossRef]
Figure 1. Sample Gav-43 with fedorite from the Gavrilovskaya zone: (a) unpolished sample, (b) polished sample.
Minerals 10 00702 g001
Figure 2. Polished thin section image of sample Gav-43 in transmitted (a,b,d,e,g) and reflected (c,f) light and polished sample Gav-43 in reflected light (h) and under side lighting (i); (a,c,d,f,g,h,i)—polarizers are parallel, (b,e)—polarizers are crossed. The interference color corresponds to a thickness of thin section (~40 μm).
Minerals 10 00702 g002
Figure 3. Sample Yak-5 with fedorite from the Yakutskiy district: (a) unpolished sample, (b) polished sample.
Minerals 10 00702 g003
Figure 4. Polished thin section image of sample Yak-5 in transmitted (a,b,d,e,g,h) and reflected (c,f) light, and with ultraviolet radiation of 254 nm (i); (a,c,d,f,g,i)—polarizers are parallel, (b,e,h)—polarizers are crossed. The interference color corresponds to a thickness of thin section (~40 μm).
Minerals 10 00702 g004
Figure 5. Sample Irk-53 with fedorite from the Irkutskiy district: (a) unpolished sample, (b) polished sample.
Minerals 10 00702 g005
Figure 6. Polished thin section image of the sample Irk-53 in transmitted (a,b,d,e) and reflected (c,f,g,h) light, and with ultraviolet radiation of 254 nm (i); (a,c,d,f,g,h,i)—polarizers are parallel, (b,e)—polarizers are crossed. The interference color corresponds to a thickness of thin section (~40 μm).
Minerals 10 00702 g006
Figure 7. Crystal structure of fedorite (sample Yak-5) projected along the a axis. Oxygen and fluorine atoms are drawn in red and green, respectively. Si-tetrahedra are black. M1 (Na1Ca1)—light green, M2 (Ca2Na2)—yellow, M3 (Ca3Na3)—lilac, M4 (Ca4Na4)—cyan octahedra, Na5 polyhedra are shown (orange). Interlayer potassium atoms are designated as blue spheres. Ow atoms (oxygen of H2O molecule) are drawn in grey. The partially white coloring of the spheres indicates a vacancy. The figure shows the linkages between the O and T2 sheets, T2 and T ¯ 2 sheets.
Minerals 10 00702 g007
Figure 8. Relations between TAV (tetrahedral angle variance) and BLD (bond length distortion) (a) and ELD (edge length distortion) (b) for tetrahedral in fedorite under study (sample Gav-43, Yak-5, Irk-53, Murun complex), fedorite from Murun and Turiy complexes [7], lalondeite [39], martinite [40] and ellingsenite [41]. Data were taken from Table S11 in the Supplementary Materials.
Minerals 10 00702 g008
Figure 9. Relations between SPHv (volume sphericity) and vs. (volume of the sphere) (a) and Vp (volume of the coordination polyhedron) (b) for M1-M4 (a,b) octahedra and Na5 polyhedron (b) in the fedorite under study (sample Gav-43, Yak-5, Irk-53, Murun complex), fedorite from Murun (Fed-Mur) and Turiy complexes (Fed-Tur) [7], lalondeite (Lal) [39], martinite (Mar) [40] and ellingsenite (Ell) [41]. Data were taken from Table S12 of Supplementary Materials.
Minerals 10 00702 g009
Figure 10. Relations between OAV (octahedral angle variance) and BLD (bond length distortion) (a) and ELD (edge length distortion) (b) for M1-M4 octahedra in the fedorite under study (sample Gav-43, Yak-5, Irk-53, Murun complex), fedorite from Murun (Fed-Mur) and Turiy complexes (Fed-Tur) [7], lalondeite (Lal) [39], martinite (Mar) [40] and ellingsenite (Ell) [41]. Data were taken from Table S13 of Supplementary Materials.
Minerals 10 00702 g010
Figure 11. Infrared absorption spectra of fedorite; red dashed curve—sample Gav-43, black solid curve—sample Irk-53.
Minerals 10 00702 g011
Figure 12. EPR spectra of the fedorite samples Gav-43 (dashed red curve) and Irk-53 (solid black curve) and measured at 77 K.
Minerals 10 00702 g012
Figure 13. Photoluminescence (red dashed curve) of the fedorite sample Gav-43 under 337 nm excitation and excitation (black solid curve) spectra monitored at 390 nm measured at 77 K.
Minerals 10 00702 g013
Figure 14. Diffuse optical absorption spectra of the fedorite samples Gav-43 (dashed red curve) and Irk-53 (solid black curve). In the inset, the absorption spectrum of the crystal plate of the sample Gav-43 measured in the transmission regime is given.
Minerals 10 00702 g014
Figure 15. Photoluminescence spectrum of the fedorite samples Gav-43 (dashed red curve) and Irk-53 (solid black curve) under 405 nm excitation at 77 K.
Minerals 10 00702 g015
Table 1. Average chemical composition (wt.%) and atomic proportions (apfu) calculated on the basis of 16(Si + Al) for the studied fedorite samples (averaged for 8–12 analyses) compared with fedorite from the Malyy (Little) Murun and Turiy complexes, obtained by [7].
ConstituentGav-43Yak-5Irk-53Fedorite, Murun [7]Fedorite, Turiy [7]
SiO266.9(6)67.1(4)67.4(9)66.60(28)67.02(63)
Al2O30.07(4)0.08(4)0.07(5)0.10(2)0.32(6)
Na2O6.2(7)5.9(3)5.9(3)9.08(17)8.91(22)
MgO0.02(2)b.d.l.b.d.l.b.d.l.0.01(1)
K2O5.8(5)7.4(4)6.9(5)1.58(8)3.01(5)
CaO16.8(5)16.8(3)17.0(2)17.19(7)15.85(21)
TiO2b.d.l.b.d.l.b.d.l.0.01(2)0.02(4)
MnO0.11(2)0.34(2)0.35(4)0.19(2)0.32(3)
FeO0.07(4)0.05(5)0.05(4)0.02(2)0.11(4)
SrO0.7(2)b.d.l.b.d.l.n.d.n.d.
Nb2O5b.d.l.b.d.l.b.d.l.n.d.n.d.
BaO0.1(1)b.d.l.0.2(2)n.d.0.27(9)
F2.4(3)2.1(5)2.0(2)3.19(16)2.69(15)
Cl0.24(4)0.06(1)0.05(2)0.14(1)0.61(1)
99.4199.7599.9298.1099.28
O=F1.010.880.841.341.13
O=Cl0.060.010.010.030.13
Sum98.3498.8699.0796.7398.02
Atoms Per Formula Unit
ConstituentGav-43Yak-5Irk-53Fedorite, Murun [7]*Fedorite, Turiy [7]*
Si15.9815.9815.9815.9616.01
Al0.020.020.020.030.09
Na2.882.732.724.224.12
Mg0.01----
K1.782.252.080.480.92
Ca4.314.294.334.414.06
Ti-----
Mn0.020.070.070.040.07
Fe0.010.010.01-0.02
Sr0.09----
Nb-----
Ba0.01-0.03-0.03
F1.791.601.53} 2.47} 2.27
Cl0.100.030.02
n.d.—not determined, b.d.l.—below detection limit, * calculated on the basis of 40(O + F + Cl).
Table 2. Selected data on single crystals, data collection and structure refinement parameters of the studied fedorite samples.
Gav-43Yak-5Irk-53
Crystal Data
a (Å)9.6463(5)9.6355(3)9.6446(1
b (Å)9.6485(5)9.6364(3)9.6519(1)
c (Å)12.6189(5)12.6153(3)12.6177(2)
α (°)102.448(4)102.482(2)102.459(1)
β (°)96.235(4)96.237(2)96.207(1)
γ (°)119.927(5)119.926(3)119.900(2)
V3)960.96(4)958.20(2)961.44(1)
Z222
Crystal dimensions (mm)0.005 × 0.021 × 0.0380.006 × 0.023 × 0.0340.006 × 0.022 × 0.026
Data Collection
Independent reflections467574614059565
Rmerging [R(int)] (%)6.62.93.3
hmin, hmax–14, 13–14, 14–16, 16
kmin, kmax–14, 14–14, 14–16, 16
lmin, lmax–19, 19–18, 19–21, 21
Refinement
Space groupP 1 ¯ P 1 ¯ P 1 ¯
Reflections used in the refinement (I > 3σ(I))468756938075
N. of refined parameters437427427
Ra [on F] (%)3.102.402.34
Rwb [on F] (%)3.522.922.92
Goofc1.04371.05491.0109
Δρmin/Δρmax (e3)–0.70/0.53–0.66/0.45–1.05/0.71
aR = Σ[|Fo| – |Fc|]/Σ|Fo|. bRw = [Σ[w(Fo2-Fc2)2]/Σ[w(Fo2)2]]1/2; w = Chebyshev optimized weights. c Goodness-of-fit = [Σ[w(Fo2-Fc2)2]/(N-p]1/2, where N and p are the number of reflections and parameters, respectively.
Table 3. Crystal chemical formulas of the studied and literature fedorite.
This Study (Murun Complex)
Gav-43:
(K1.78Na0.23Sr0.09Ba0.01)Σ = 2.11(Ca4.31Na2.65Mn0.02Fe0.01Mg0.01)Σ = 7.0(Si15.98Al0.02)Σ = 16.0(O37.54OH0.46)Σ = 38.0
(F1.79Cl0.10OH0. 11) Σ = 2.0·2.5H2O
Yak-5:
(K2.25Na0.10)Σ = 2.35(Ca4.29Na2.63Mn0.07Fe0.01)Σ = 7.0(Si15.98Al0.02)Σ = 16.0(O37.70OH0.30)Σ = 38.0
(F1.60Cl0.03OH0.37) Σ = 2.0·0.8H2O
Irk-53:
(K2.08Na0.22Ba0.03)Σ = 2.33(Ca4.33Na2.50Mn0.07Fe0.01)Σ = 7.0(Si15.98Al0.02)Σ = 16.0(O37.66OH0.34)Σ = 38.0
(F1.53Cl0.02OH0.45) Σ = 2.0·0.6H2O
Fedorite from Murun complex [7]:
(Na1.68K0.48)Σ = 2.16(Ca4.41Na2.54Mn0.04)Σ = 6.99(Si15.96Al0.03)Σ = 15.98O38(F,Cl)2.47·3.47H2O
Fedorite from Turiy complex [7]:
(Na1.27K0.92Ba0.03)Σ = 2.22(Ca4.06Na2.85Mn0.07Fe0.02)Σ = 7.0(Si16.01Al0.09)Σ = 16.10O38(F,Cl)2.27·3.69H2O
Fedorite from Turiy complex [3]:
(K1.65Na0.83)Σ = 2.48(Ca4.52Na2.48)Σ = 7.0Si16O38(OH,F)2·H2O

