Article

Geochemical Evaluation of the Cretaceous Mudrocks and Sandstones (Wackes) in the Southern Bredasdorp Basin, Offshore South Africa: Implications for Hydrocarbon Potential

1
Department of Geology, University of Fort Hare, Private Bag X1314, Alice 5700, Eastern Cape Province, South Africa
2
DSI-NRF CIMERA, Department of Geology, University of Johannesburg, P.O. Box 524, Auckland Park, Johannesburg 2006, South Africa
3
Department of Geology and Mining, University of Limpopo, Private Bag X1106, Sovenga 0727, Limpopo Province, South Africa
*
Author to whom correspondence should be addressed.
Minerals 2020, 10(7), 595; https://doi.org/10.3390/min10070595
Submission received: 15 May 2020 / Revised: 24 June 2020 / Accepted: 26 June 2020 / Published: 30 June 2020

Abstract

:
The southern Bredasdorp Basin, off the south coast of South Africa, is only partly understood in terms of its hydrocarbon potential when compared to the central and northern parts of the basin. Hydrocarbon potential assessments in this part of the basin have been limited, perhaps because the few drilled exploration wells were unproductive for hydrocarbons, yielding trivial oil and gas. The partial integration of data in the southern Bredasdorp Basin provides another reason for the unsuccessful oil and gas exploration. In this study, selected Cretaceous mudrocks and sandstones (wacke) from exploration wells E-AH1, E-AJ1, E-BA1, E-BB1 and E-D3 drilled in the southern part of the Bredasdorp Basin were examined to assess their total organic carbon (TOC), thermal maturity, organic matter type and hydrocarbon generation potential. The organic geochemical results show that these rocks have TOC contents ranging from 0.14 to 7.03 wt.%. The hydrogen index (HI), oxygen index (OI), and hydrocarbon index (S2/S3) values vary between 24–263 mg HC/g TOC, 4–78 mg CO2/g TOC, and 0.01–18 mgHC/mgCO2 TOC, respectively, indicating predominantly Type III and IV kerogen with a minor amount of mixed Type II/III kerogen. The mean vitrinite reflectance values vary from 0.60–1.20%, indicating that the samples are in the oil-generation window. The Tmax and PI values are consistent with the mean vitrinite reflectance values, indicating that the Bredasdorp source rocks have entered the oil window and are considered as effective source rocks in the Bredasdorp Basin. The hydrocarbon genetic potential (SP), normalized oil content (NOC) and production index (PI) values all indicate poor to fair hydrocarbon generative potential. Based on the geochemical data, it can be inferred that most of the mudrocks and sandstones (wackes) in the southern part of the Bredasdorp Basin have attained sufficient burial depth and thermal maturity for oil and gas generation potential.

1. Introduction

South Africa’s energy policy is going through a rethink in the corridors of power. The government has a fading interest in coal and is reconsidering the integrated resource plan to focus on nuclear and renewable energy, with renewed interest in the petroleum deposits in offshore areas of South Africa. Oil and gas exploration in these offshore areas has only found small oil and gas fields, although South Africa has very large offshore hydrocarbon potential. Exploration and drilling in the offshore Bredasdorp Basin revealed the occurrence of active petroleum systems (i.e., mature source rocks and effective reservoir sandstones and traps), which led to the commercial exploitation of oil and gas in the northern and central flanks of the basin [1]. The Bredasdorp Basin is a sub-basin of the greater Outeniqua Basin and it lies beneath the Indian Ocean, extending almost 18,000 km2 offshore along the southern coast of South Africa [2] (Figure 1). The basin formed in relation to the extensional periods during the early stages rifting in the Jurassic, serving as a depocentre predominantly infilled with late Jurassic and early Cretaceous marine and continental sediments [3]. Hydrocarbon exploration in the Bredasdorp Basin started over 20 years ago, when the Southern Oil Exploration Corporation and several oil companies began to search for structural traps and late Jurassic to early Cretaceous synrift sandstones. Although there were some promising oil and gas shows as well as mature source beds in the younger Cretaceous post-rift sequences, early exploration mainly concentrated on the synrift mudrocks and sandstones [4].
The main targeted source rocks in the basin are the mudrocks in the syn-rift and transitional rift- drift sequence (early Valanginian to mid–Aptian; 1At1 to 13At1 sequences), while the main reservoir rocks are the continental shelf sandstones of the syn-rift sequence, and deep marine turbidite sandstones of the drift sequence [1,5]. The encountered hydrocarbons in these synrift reservoir rocks are alleged to have been primarily sourced from the deeply buried carbon-rich syn-rift and transitional rift-drift mudrocks. These hydrocarbons are liquid oils and traces of high molecular weight hydrocarbons, which are thought to remain after earlier oil charges, and wet gas with condensate [6]. Hydrocarbons are abundant in the Bredasdorp Basin and are currently being exploited in the central and northern flanks of the basin (Figure 1) [5]. There is a possibility that the carbonaceous source rocks are within the limits of the Bredasdorp Basin, or perhaps they are primarily hosted in the western and eastern part of the basin. As reported by [7], before the commencement of oil and gas exploration in the offshore areas of South Africa in the late 1960s, no geological studies had been carried out on the continental shelf of South Africa. After several regional and local studies, the geological structure of the basin has grown well understood in the last ten years, greatly improving the success rate of hydrocarbon exploration in the basin. Most of the regional geological studies in the offshore areas were carried out by the Southern Oil Exploration Corporation (PetroSA) and very little of their findings are published to date.
South Africa’s petroleum industry has played a minimal role in the evolution of the South African oil industry. The Bredasdorp Basin has become the centre of focus for seismic activity and drilling since the discovery of gas-condensate and oil reservoirs. Extensive exploration for more than 30 years has revealed small oil and gas fields in the Bredasdorp Basin [4]. This basin has proven hydrocarbon reserves and potential for future discoveries. However, uncertainty about the depth and maturity of the source rocks has hindered further exploration, particularly in the southern part of the basin. To date, this part of the basin remains unexplored and partially understood with respect to petroleum systems evolution when compared to the central and northern parts of the basin. To fill the gaps created, selected mudrocks and sandstones from exploration wells E-AH1, E-AJ1, E-BA1, E-BB1 and E-D3 (Figure 1) were geochemically investigated in order to identify characteristics that would classify them as potential conventional hydrocarbon reservoirs. By doing so, the research will add new information to the total organic carbon (TOC) content, thermal maturity, kerogen type and hydrocarbon generating potential of the Bredasdorp Basin in this extensive and widely underexplored area.

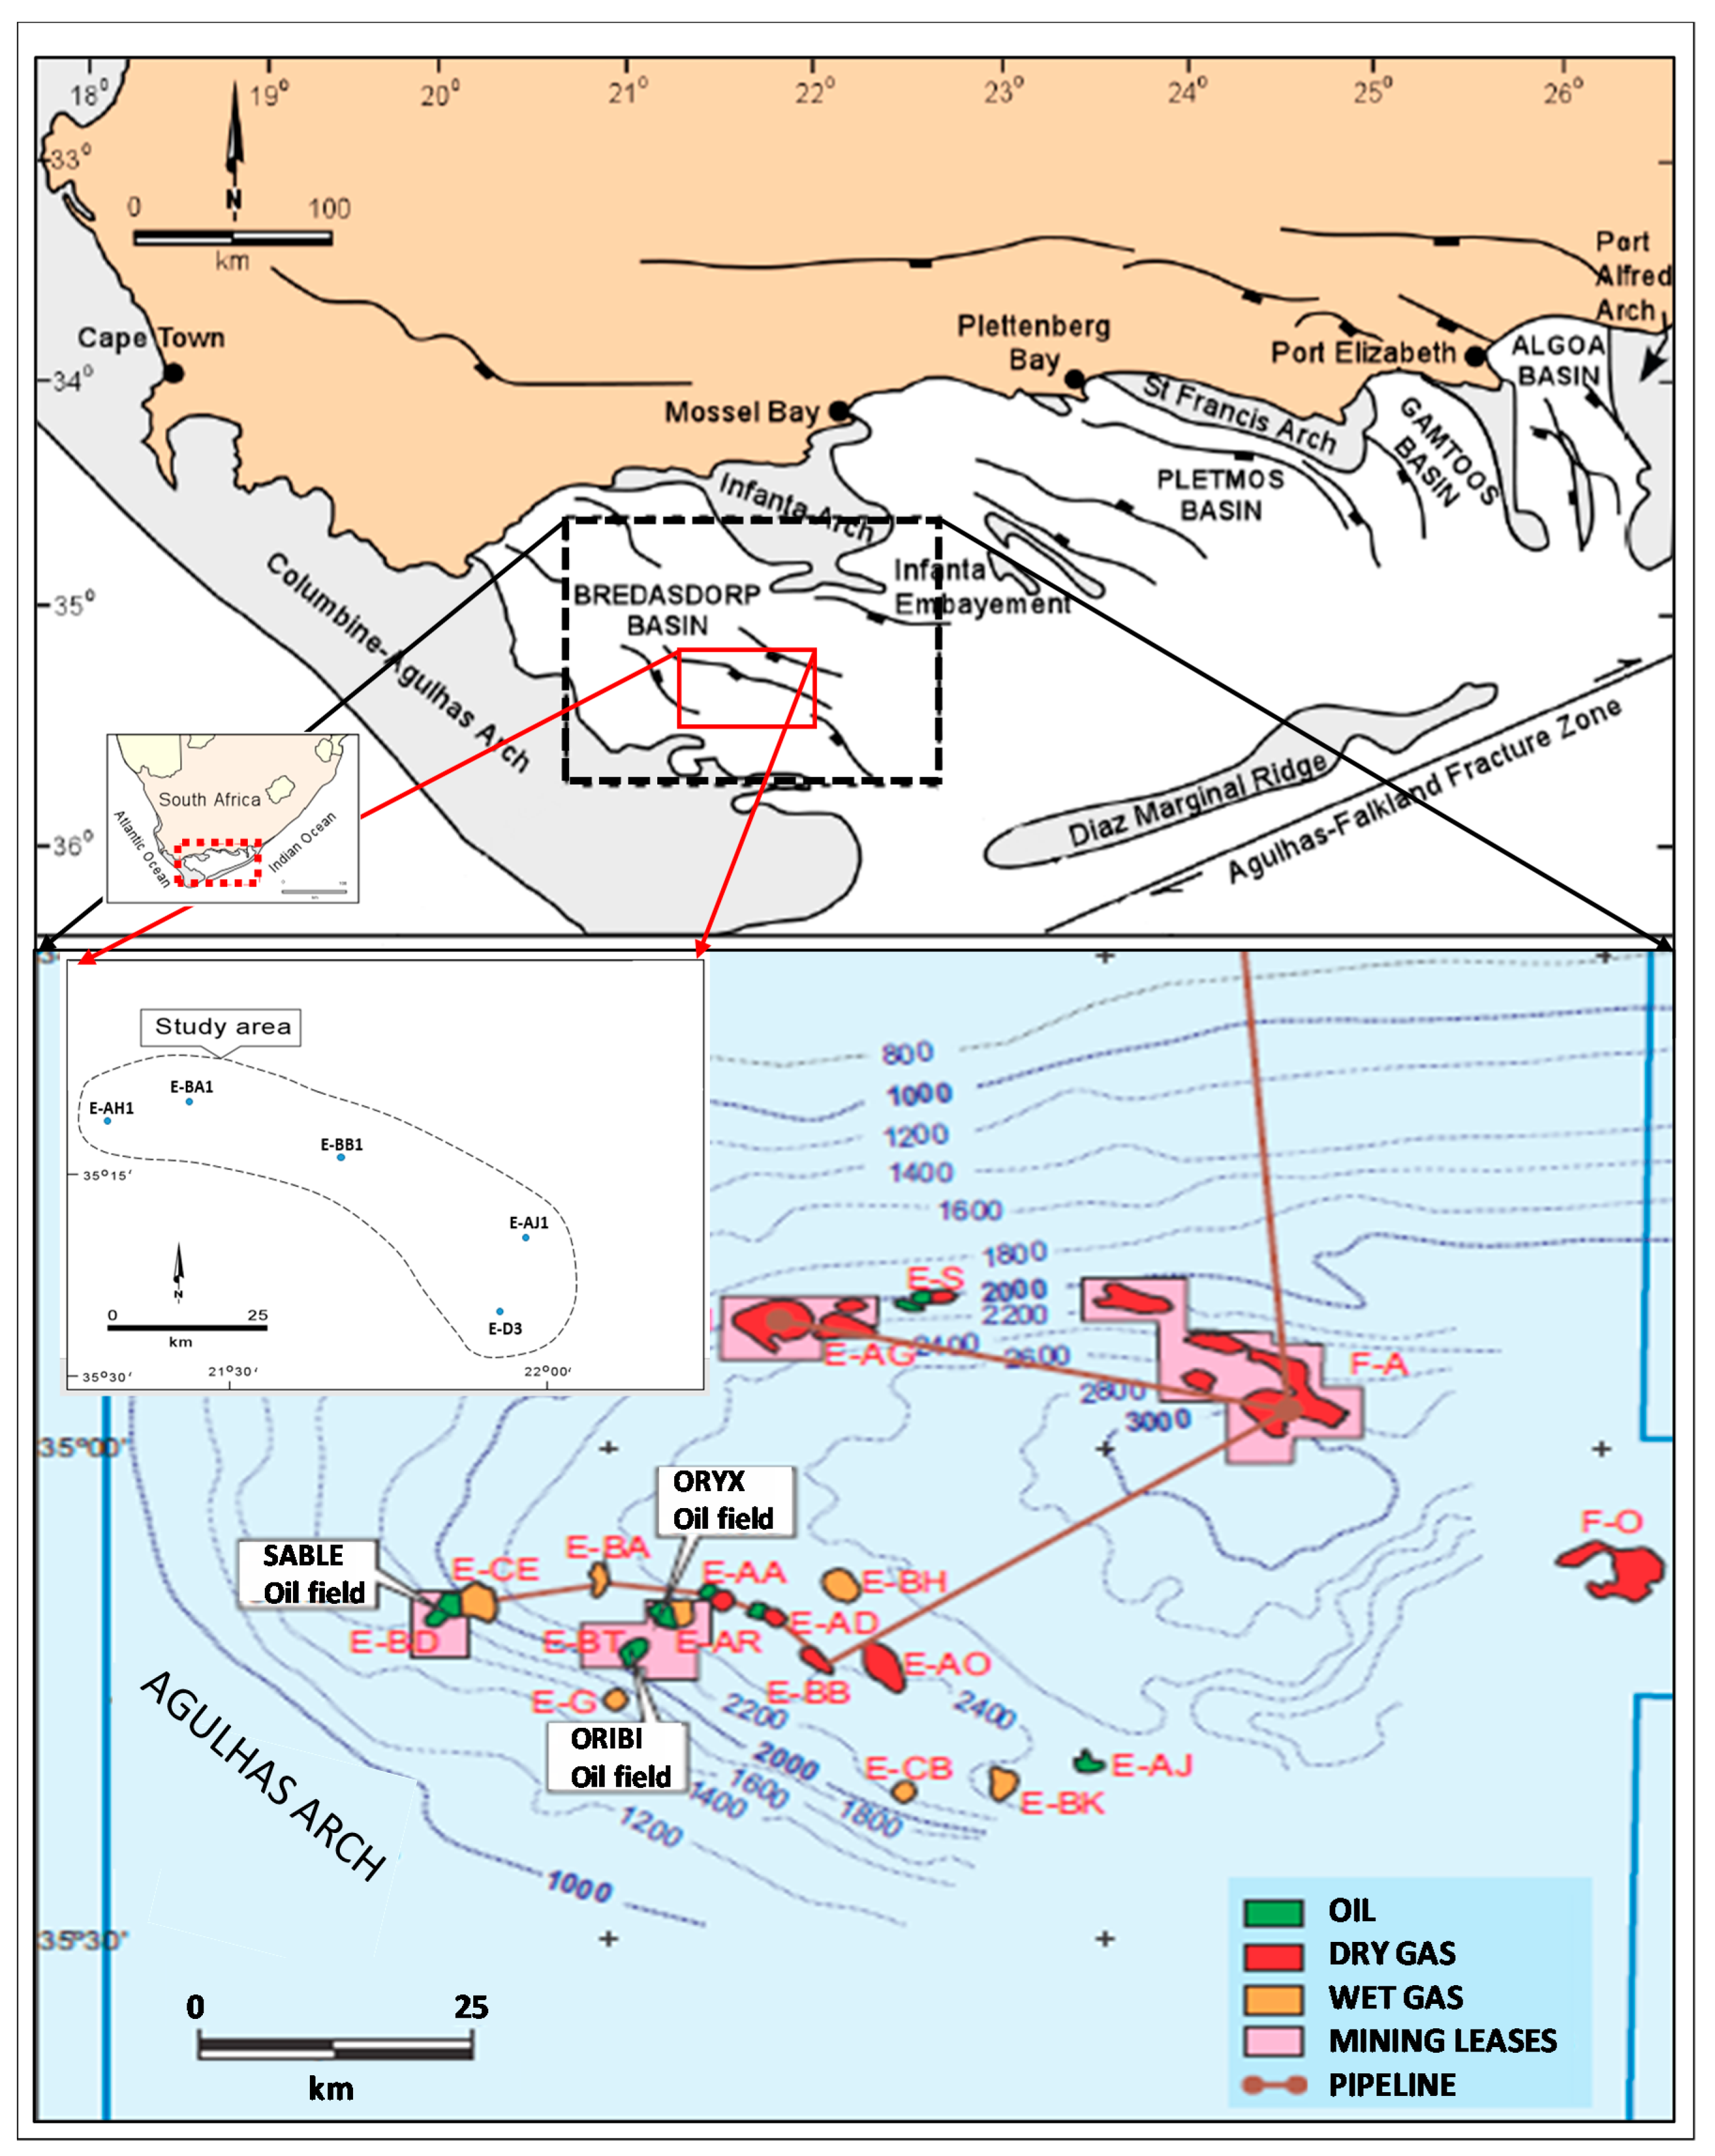
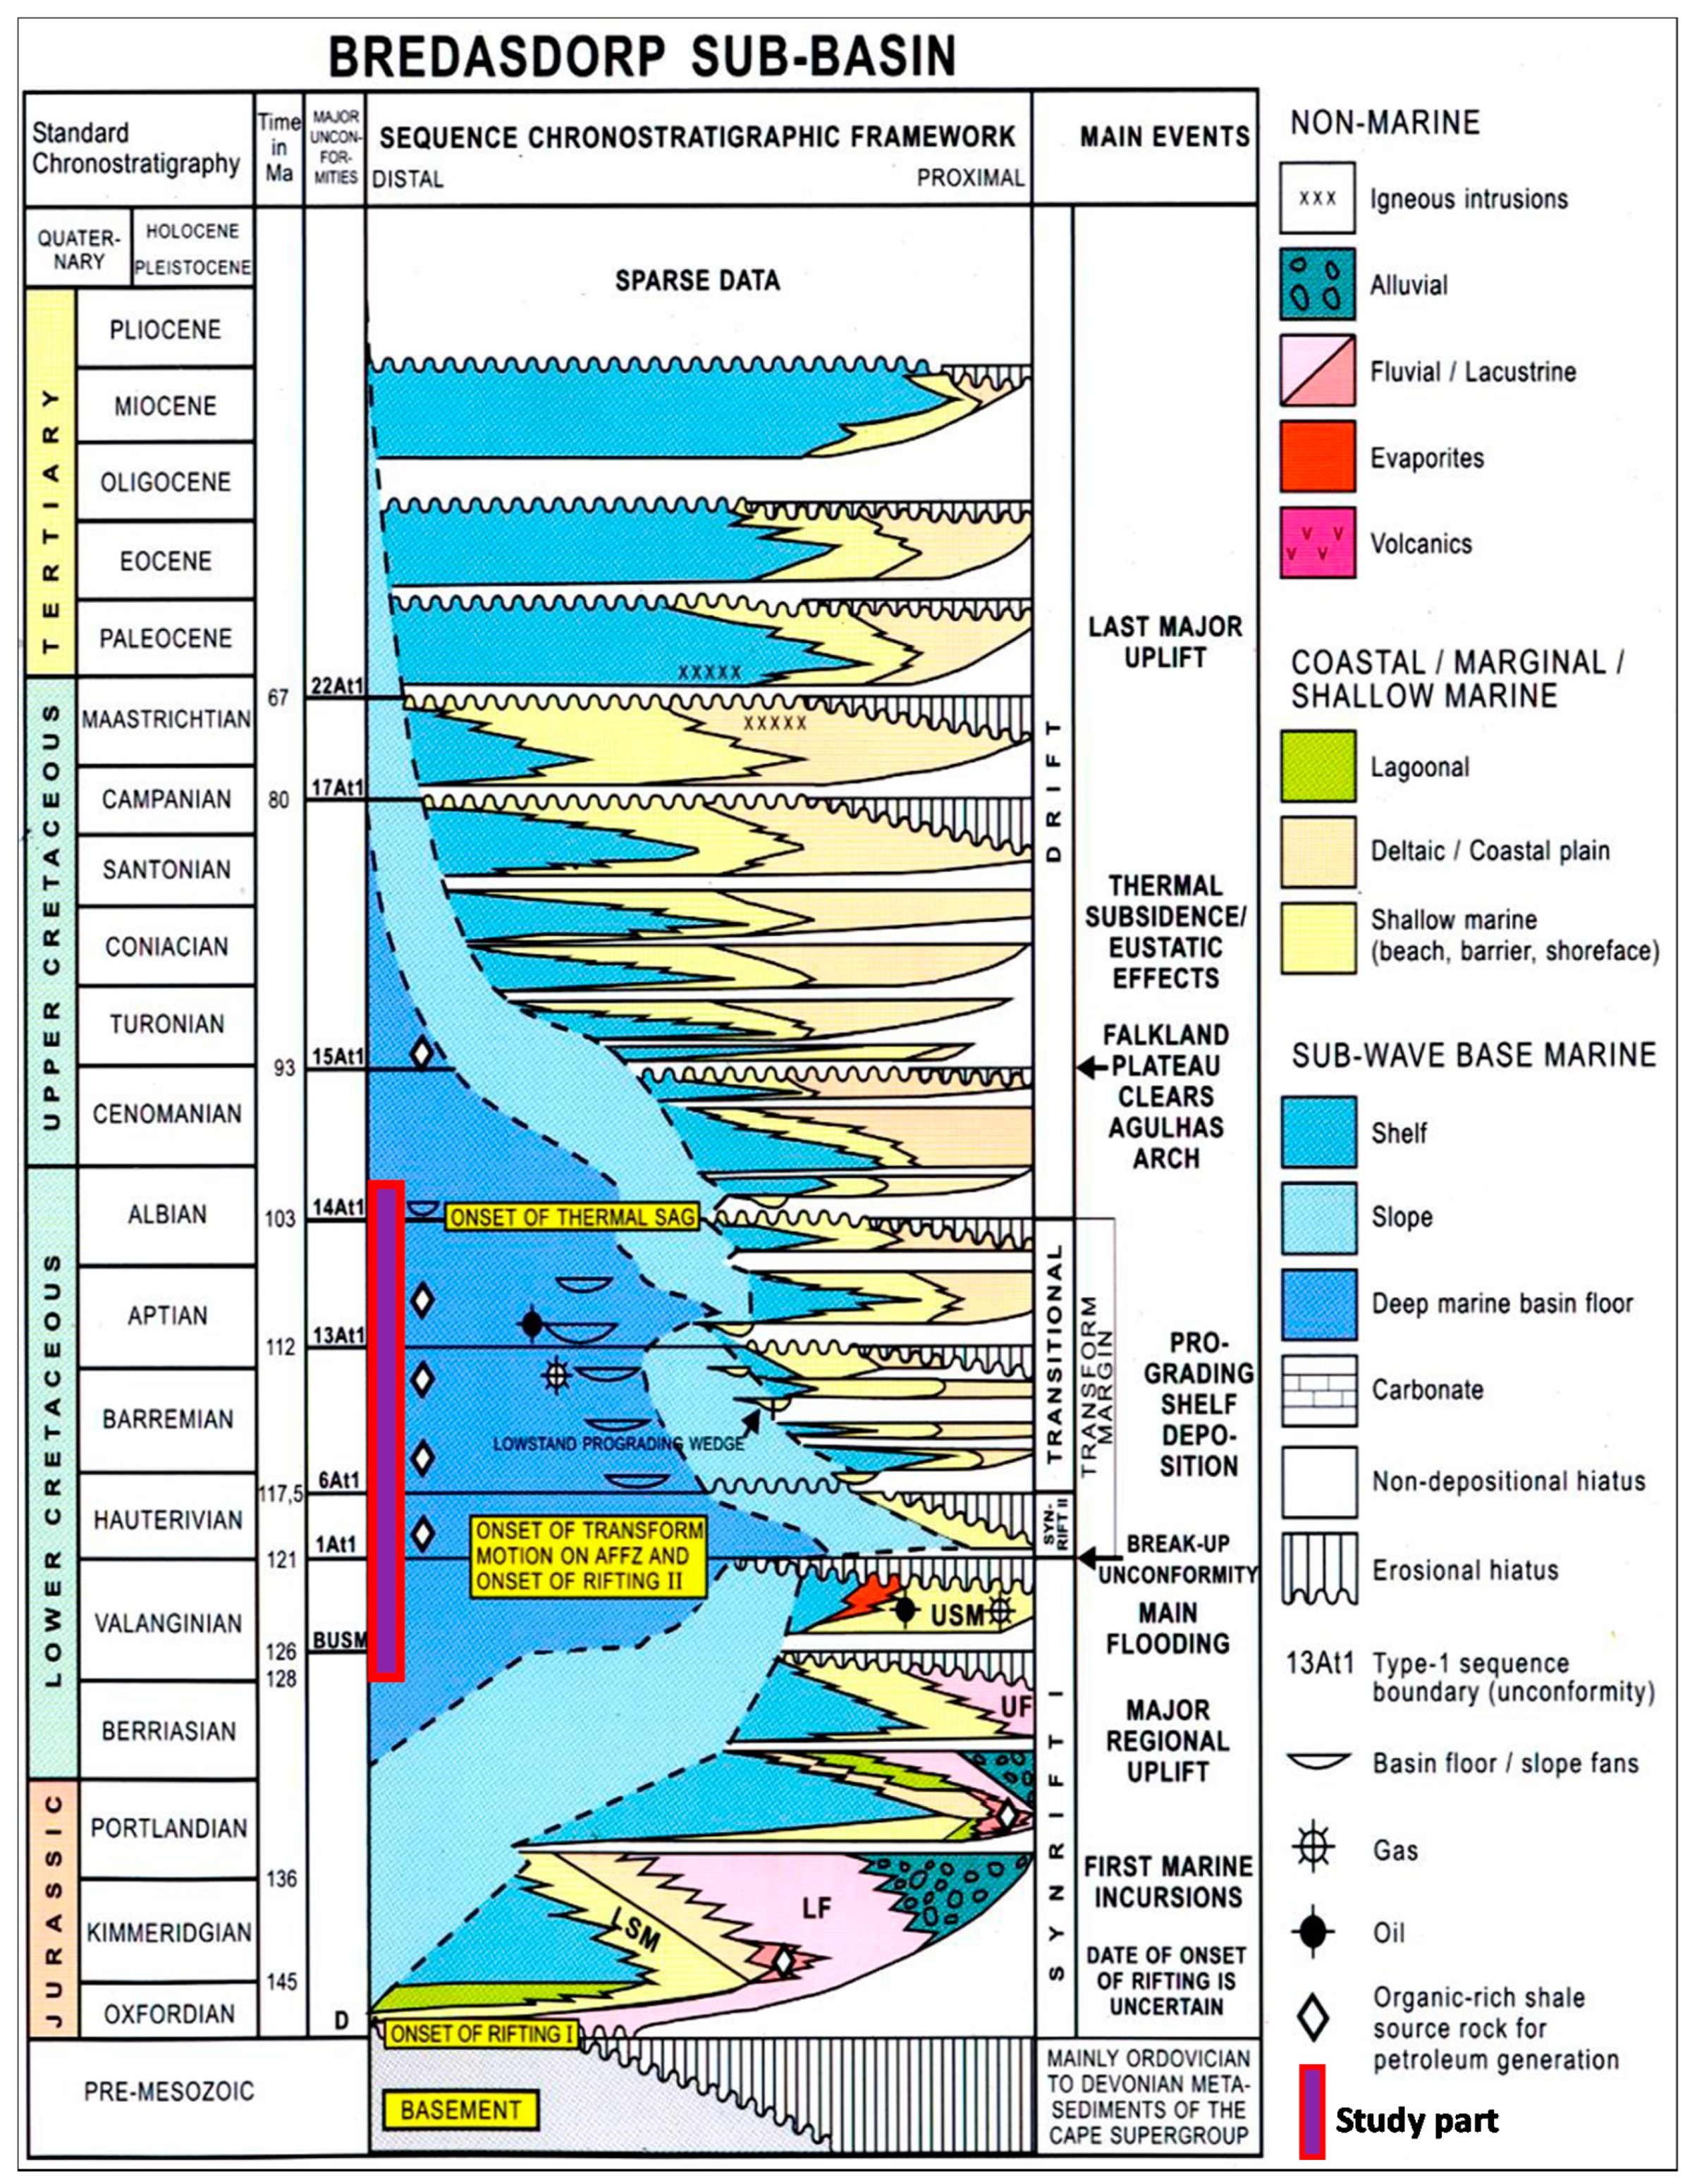
2. Geological Setting

The Bredasdorp Basin is the westernmost sub-basin of the greater Outeniqua Basin and it covers an area of approximately 18,000 km2 underneath the Indian Ocean along the southern coast of South Africa [2]. The western and eastern sides are bounded by the Columbine-Agulhas Arch and Infanta Arch, respectively [8,9]. These arches are extended basement highs, comprised of Cape Supergroup metasediments as well as the Precambrian (basement) igneous and metamorphic rocks. The Bredasdorp Basin developed along the South African continental margin, underneath the Indian Ocean due to extensional episodes during the initial stage of rifting in the late Jurassic–early Cretaceous [3]. As documented by [10], the basin underwent a succession of structural deformation during the break-up of Gondwanaland. According to [11], the dextral trans-tensional stress or right-lateral shear movement that was produced along the Falkland–Agulhas Fracture Zone occurred as a result of the separation of the Falkland Plateau from the Mozambique Ridge as well as the break-up of west Gondwana. The tectonic events initiated the development of normal faulting north of the Agulhas–Falkland fracture Zone (AFFZ), resulting in the creation of graben and half-graben sub-basins including the Bredasdorp Basin [8]. The basin is principally filled-up with the upper Jurassic and lower Cretaceous syn-rift continental and marine sediments as well as the post Cretaceous and Cenozoic divergent rocks, in slanting or inclined half-graben structures.
The summary of the structural development of the Bredasdorp Basin is depicted in Table 1, and the stratigraphy and lithologies are presented in Figure 2. Stratigraphically, the basin hosts an Oxfordian–Recent stratigraphic column [1] overlying the mudrocks and subordinated quartzites of the Cape Supergroup [12]. The stratigraphic column shows the occurrence of a syn-rift phase (late Jurassic to early Cretaceous) followed by a post-rift or drift phase (early Cretaceous–Tertiary) [1,13]. The syn-rift phase can be subdivided into the syn-rift I and syn-rift II sedimentation [13]. The syn-rift I sedimentation took place during middle Jurassic-late Valanginian (Basement to 1At1), whereas the syn-rift II sedimentation occurred from the late Valanginian up to the Hauterivian (1At1 to 6At1) (Figure 2) [1]. In the northern part of the basin, the basal syn-rift deposits that occurred during the Kimmeridgian– late Valanginian are divided into four intervals (from base to top), namely the Lower Fluvial (LF), Lower Shallow Marine (LSM), Upper Fluvial (UF) and Upper Shallow Marine (USM) intervals. The above-mentioned intervals underlie the late Valanginian 1At1 regional unconformity (Figure 2 and Figure 3) [9]. According to [9], the Lower Fluvial interval is made up of claystones, sandstones and conglomerates deposited in alluvial fan and fluvial environments, representing an early graben fill. The overlying Lower Shallow Marine interval consists of glauconitic fossiliferous sandstones and it indicates progradational beach deposits of “Portlandian” (Kimmeridgian) age, signifying the first marine incursion into the basin. The Upper Fluvial interval is made up of alluvial floodplain and meandering fluvial deposits, whereas the overlying Upper Shallow Marine interval is marked by the occurrence of massive glauconitic fossiliferous sandstones of the late Valanginian age. It was reported in [9] that these massive glauconitic fossiliferous sandstones were deposited as transgressive beach facies along the northern and southern edges of the basin, extending into the adjacent sub-basins.
The syn-rift I succession is terminated by a regional 1At1 unconformity, separating the deep-marine sediments from the underlying Upper Shallow Marine sediments. This 1At1 unconformity signifies the beginning of a renewed rifting (synrift II) phase initiated due to early movement along the AFFZ at approximately 121 Ma (Valanginian–Hauterivian boundary) [13]. The syn-rift II was later followed by the Transitional (early Drift) phase, which occurred during the Hauterivian–early Aptian (6At1 to 13At1) (Figure 2). The Transitional (early Drift) phase was characterized by repeated episodes of progradation and aggradation and it was mostly affected by tectonic events and eustatic sea-level changes [9]. This phase was considered as the first deep water deposits in the Bredasdorp Basin, deposited due to major subsidence of the basin as well as the increase in water depth. The late drift phase trailed a major marine regression in the Bredasdorp Basin during the early Aptian. This regression event resulted in a major erosion, which is marked by the 13At1 unconformity. The erosion period was followed by a marine transgression, which deposited organic-rich claystone in the basin under an anoxic condition [12]. The onset of the late drift-phase is manifested or noted by the 14At1 mid-Albian unconformity (Figure 2), which marks the beginning of the active thermally driven subsidence when the Columbine–Agulhas Arch was cleared by the trailing edge of the Falkland Plateau in the late Albian [9,14].

3. Methodology

3.1. Materials

A total of 83 core samples of black mudrock and wacke (matrix-supported sandstones) alleged to be rich in organic carbon were collected from exploration wells E-AH1, E-AJ1, E-BA1, E-BB1 and E-D3 (Figure 1). Total organic carbon (TOC), Rock–Eval pyrolysis and vitrinite reflectance analyses were conducted. The samples were first screened using TOC content, and thereafter samples that met the required TOC value (above 0.5 wt.%) were sent to GeoMark research laboratory in the United States of America, and the University of Johannesburg Department of Geology for Rock-Eval pyrolysis and vitrinite reflectance analysis, respectively.

3.2. Total Organic Carbon Content (TOC)

Eighty-three core samples of mudrocks and wackes were cleaned, crushed and milled to pass through the 250 μm sieve. A total of 30 g of each sample was weighed into clean LECO crucibles and demineralized by adding hot 10% hydrochloric acid. Thereafter, distilled water was added to halt the chemical reaction and the acid was separated from the sample using a glass microfiber filter. The separated samples were oven-dried at a temperature of 60 °C for 24 h. The oven-dried samples were re-weighed and placed in the muffle furnace with a programmed temperature of 650 °C for 24 h. Afterward, the samples were removed, allowed to cool down and re-weighed to determine their TOC content. Based on the source rocks classification scheme of [15], samples with a TOC value below or less than 0.5 wt.% are considered to be inadequate, whereas those that have TOC values above 0.5 wt.% are termed adequate. The adequate samples were analysed for both Rock–Eval pyrolysis and vitrinite reflectance analysis [16,17].

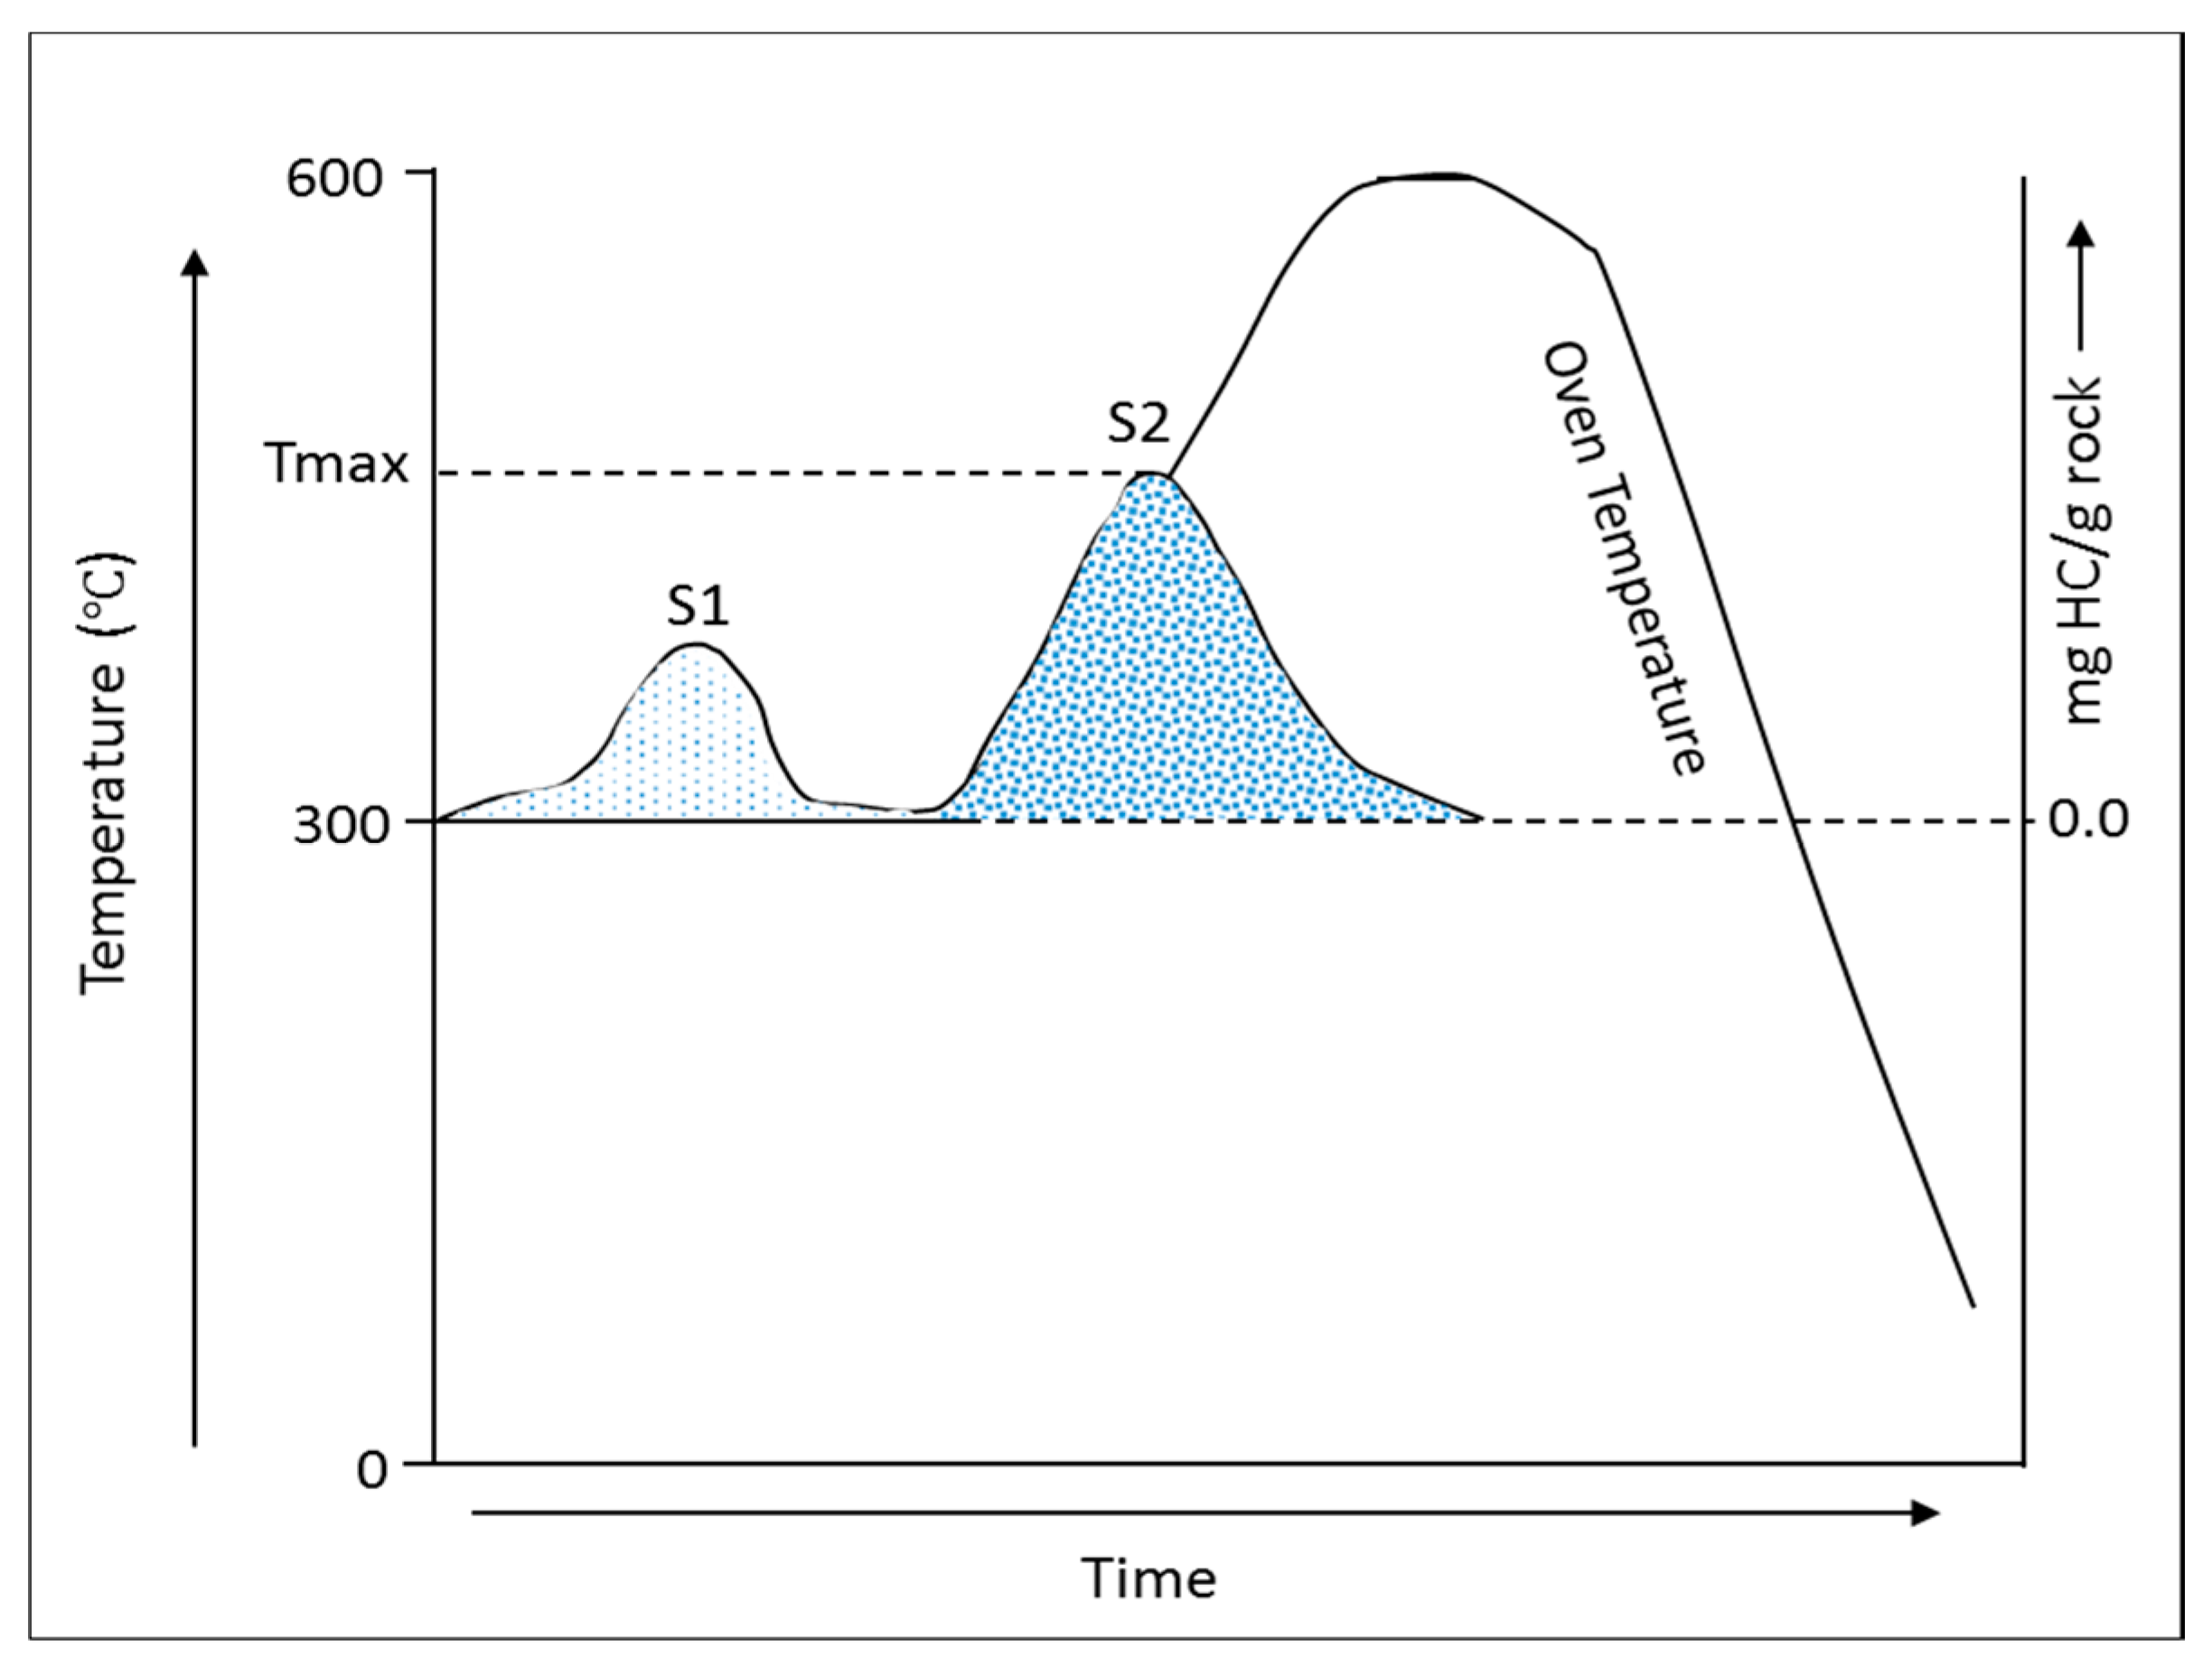
3.3. Rock-Eval Pyrolysis

The twenty-four samples with TOC value above 0.5 wt.% were analysed using a Rock-Eval-6 pyrolyser at GeoMark Research Laboratory in the United States to characterize the source rock potential in terms of kerogen type, maturity and hydrocarbon generation potential. The samples were cleaned, crushed, weighed in a sample holder and heated in an inert atmosphere to 600 °C using a controlled temperature programme (Figure 3). Each sample was first heated at 300 °C for 3 min to generate the first peak (S1), representing the free and adsorptive hydrocarbon in the sample. This was immediately followed by programmed pyrolysis as the oven temperature was ramped up rapidly to 600 °C at the rate of 25 °C/min to give the S2 peak. This S2 peak denotes hydrocarbon that was liberated during thermal cracking of kerogen. Concurrently, the CO2 produced during a temperature interval was recorded as the S3 peak. Both the S1 and S2 hydrocarbon peaks were measured by the flame ionization detector (FID). The splitting arrangement allows the measurement of S3 peak (carbon dioxide) using a thermal conductivity detector (TCD). Tmax, which is the temperature that corresponds to the maximum S2 peak, was obtained as shown in Figure 3. Additional parameters such as hydrocarbon potential (SP), production index (PI), hydrogen index (HI) and oxygen index (OI) were calculated using the formulas presented in Table 1. The Rock–Eval data were interpreted based on guidelines reported by [17,18,19,20].

3.4. Vitrinite Reflectance (RO)

The twenty-four organic-rich samples were analysed for vitrinite reflectance to determine the thermal maturity of the samples. Sample lumps, approximately 15 × 20 mm in size, were cut and placed in 30 mm cups, set in epoxy resin, and place under vacuum for 24 h. The hardened blocks were polished on a Struers Tegraforce polisher, following ISO 7404 (part 2) guideline [23], with a final stage polish using a 0.05 µm OPS lubricant. The polished blocks were examined using a Zeiss AxioImager M2M reflected light petrographic microscope fitted with a Diskus Fossil (Hilgers) system for vitrinite reflectance determination, at a magnification of × 500 under oil immersion, following ASTM D7708-14 [24]. The system was calibrated using a YAG 0.902 Klein and Bekker standard, and 100 points were determined per sample. Each sample was analysed across the bedding plane, and at least 20 transects occurred. To accurately determine the organic matter, the samples were viewed under white light (monochromatic and colour cameras), fluorescent mode (to determine the degree of fluorescence), and under × -polars (to determine the degree of anisotropy). Due to the limited amount of vitrinite in some samples, it is possible that some reflectance readings were taken on solid bitumen. Each sample was photographed at × 100 (air lens) and × 500 (oil immersion lens).

4. Results and Discussion

4.1. Total Organic Carbon (TOC) Content

The selected Bredasdorp Basin mudrocks and sandstones (wacke) have TOC values varying from 0.14 to 7.03 wt.% (Table 2), indicating a poor to good source rock. The data show that the TOC values range between 0.22 and 1.60 wt.%, 0.21 and 7.03 wt.%, 0.14 and 1.66 wt.%, 0.27 and 6.54 wt.%, and 0.38 and 1.04 wt.% for E-AH1, E-AJ1, E-BA1, E-BB1 and E-D3 wells, respectively. Few samples from exploration wells E-AJ1 and E-BB1 have a TOC value of greater than 2.00 wt.% and such levels of organic carbon enrichment are thought to be good source rocks for hydrocarbon generation [16].

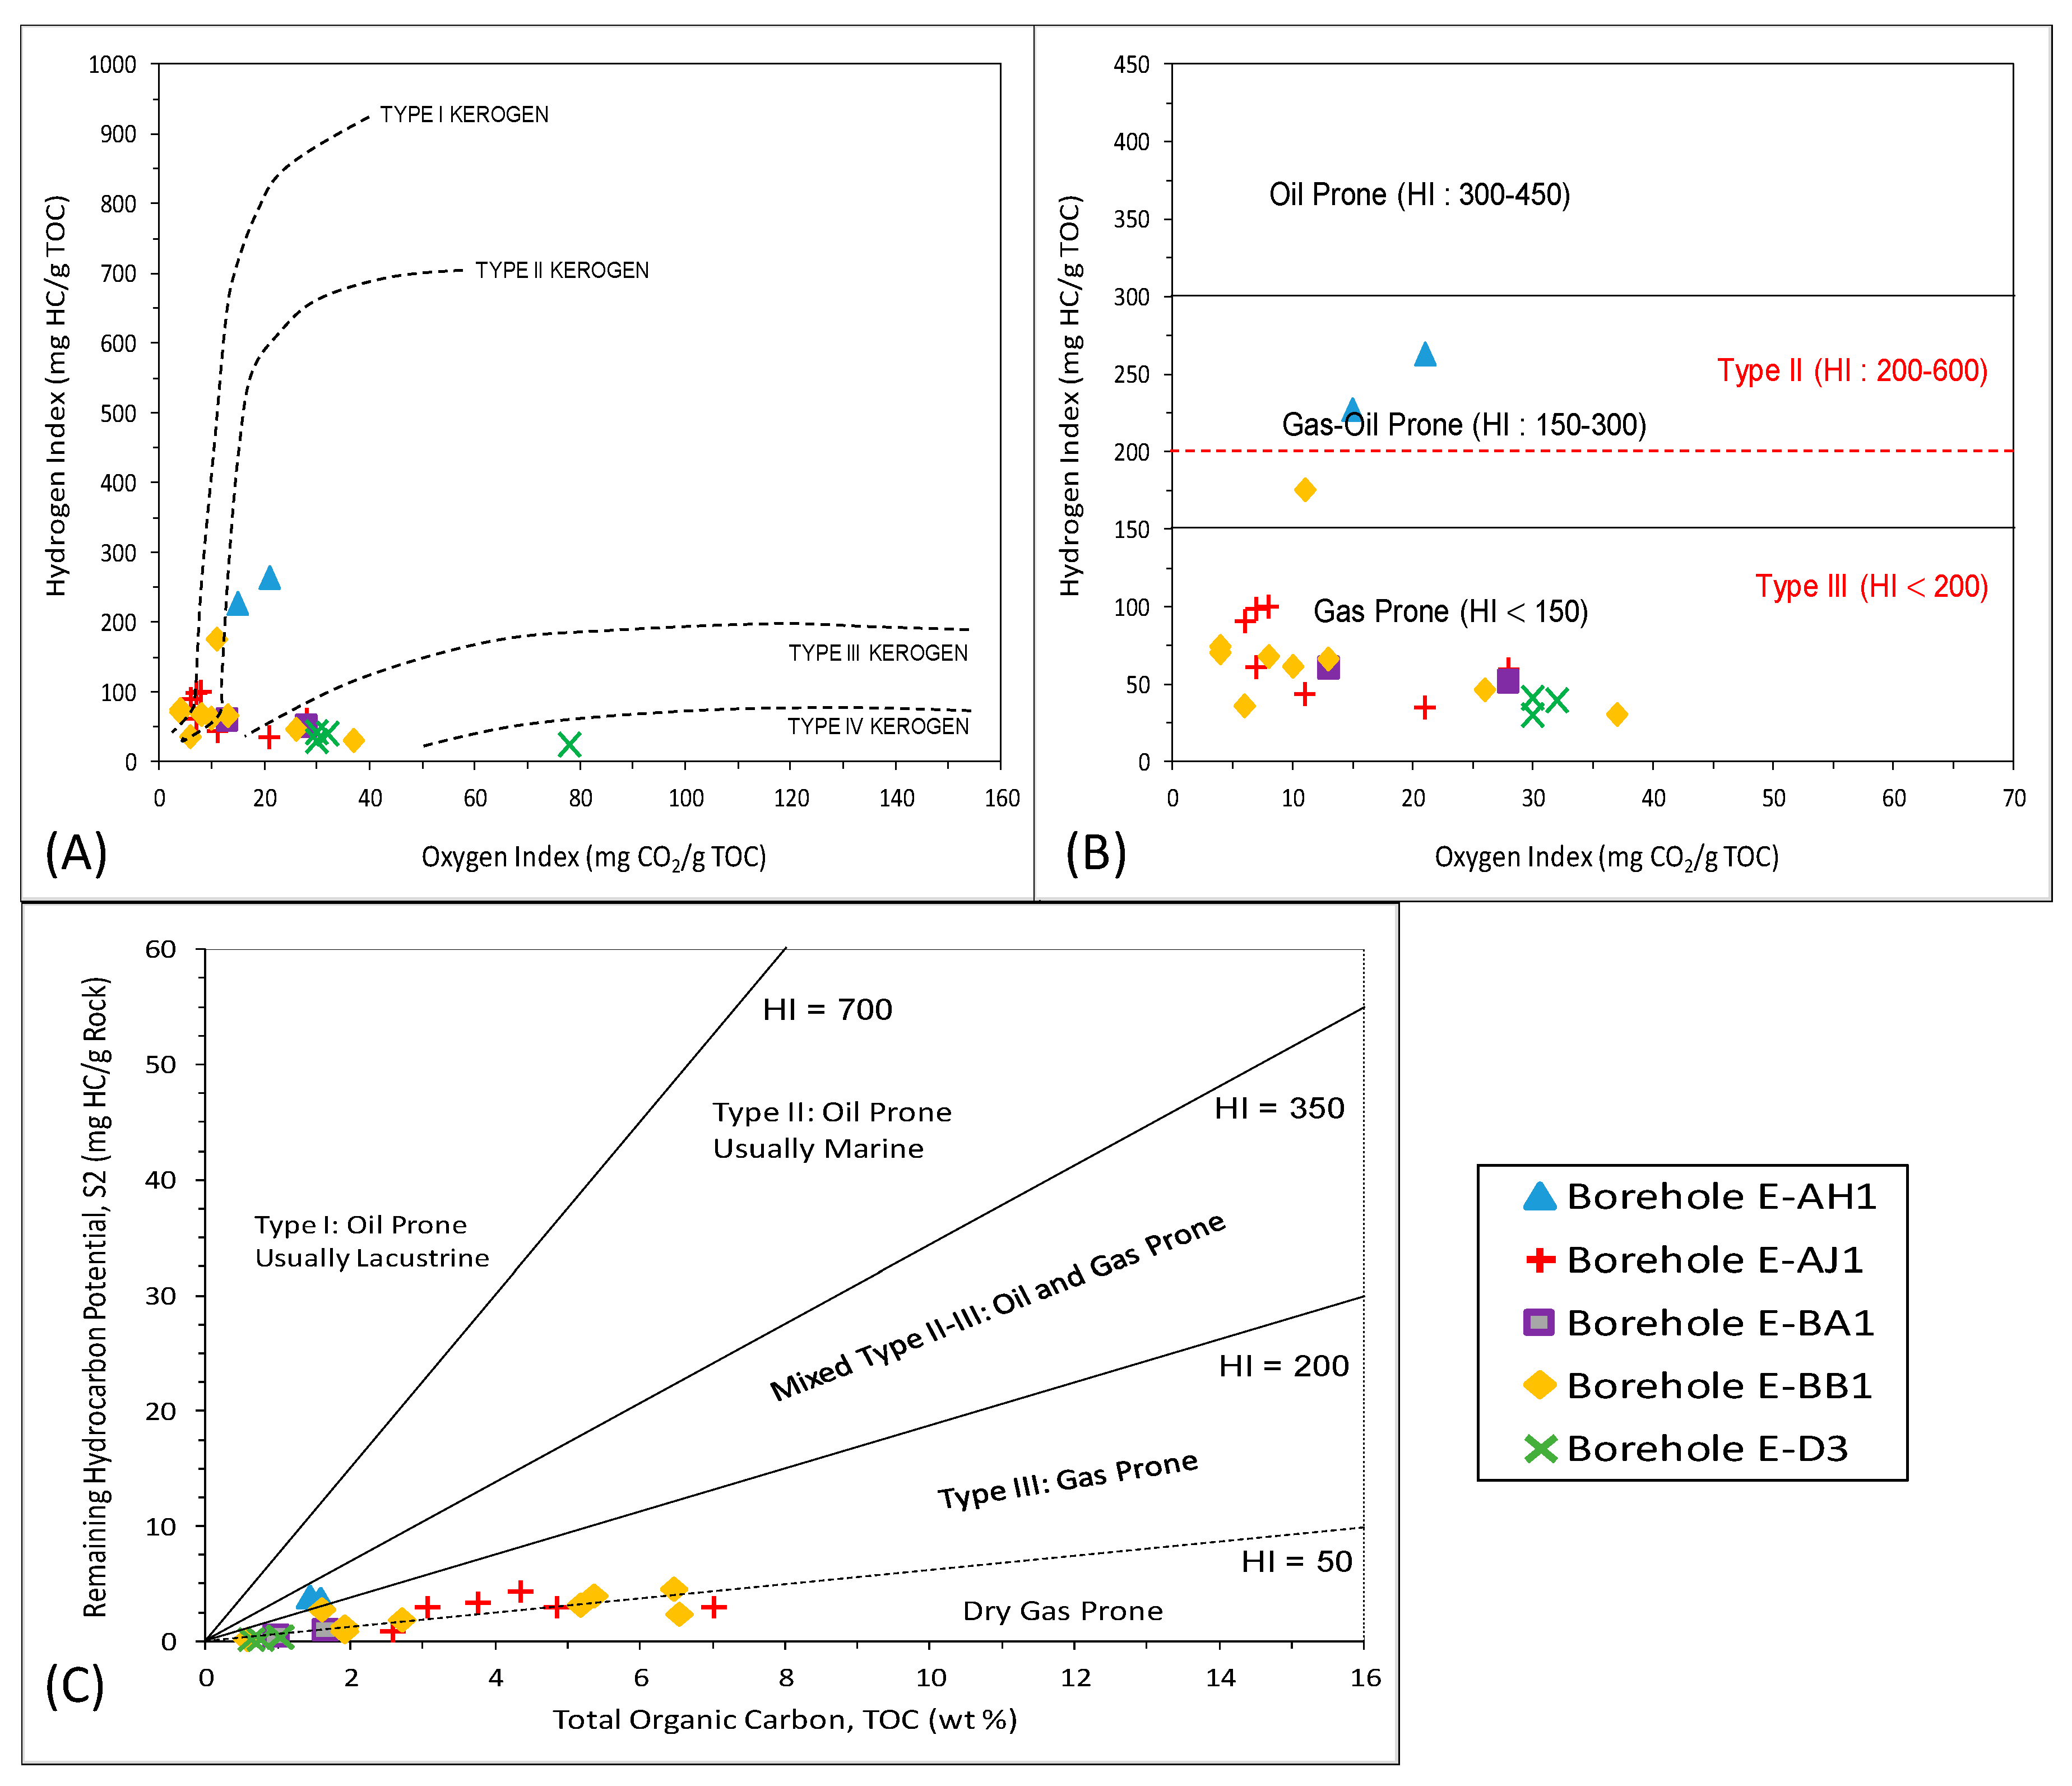
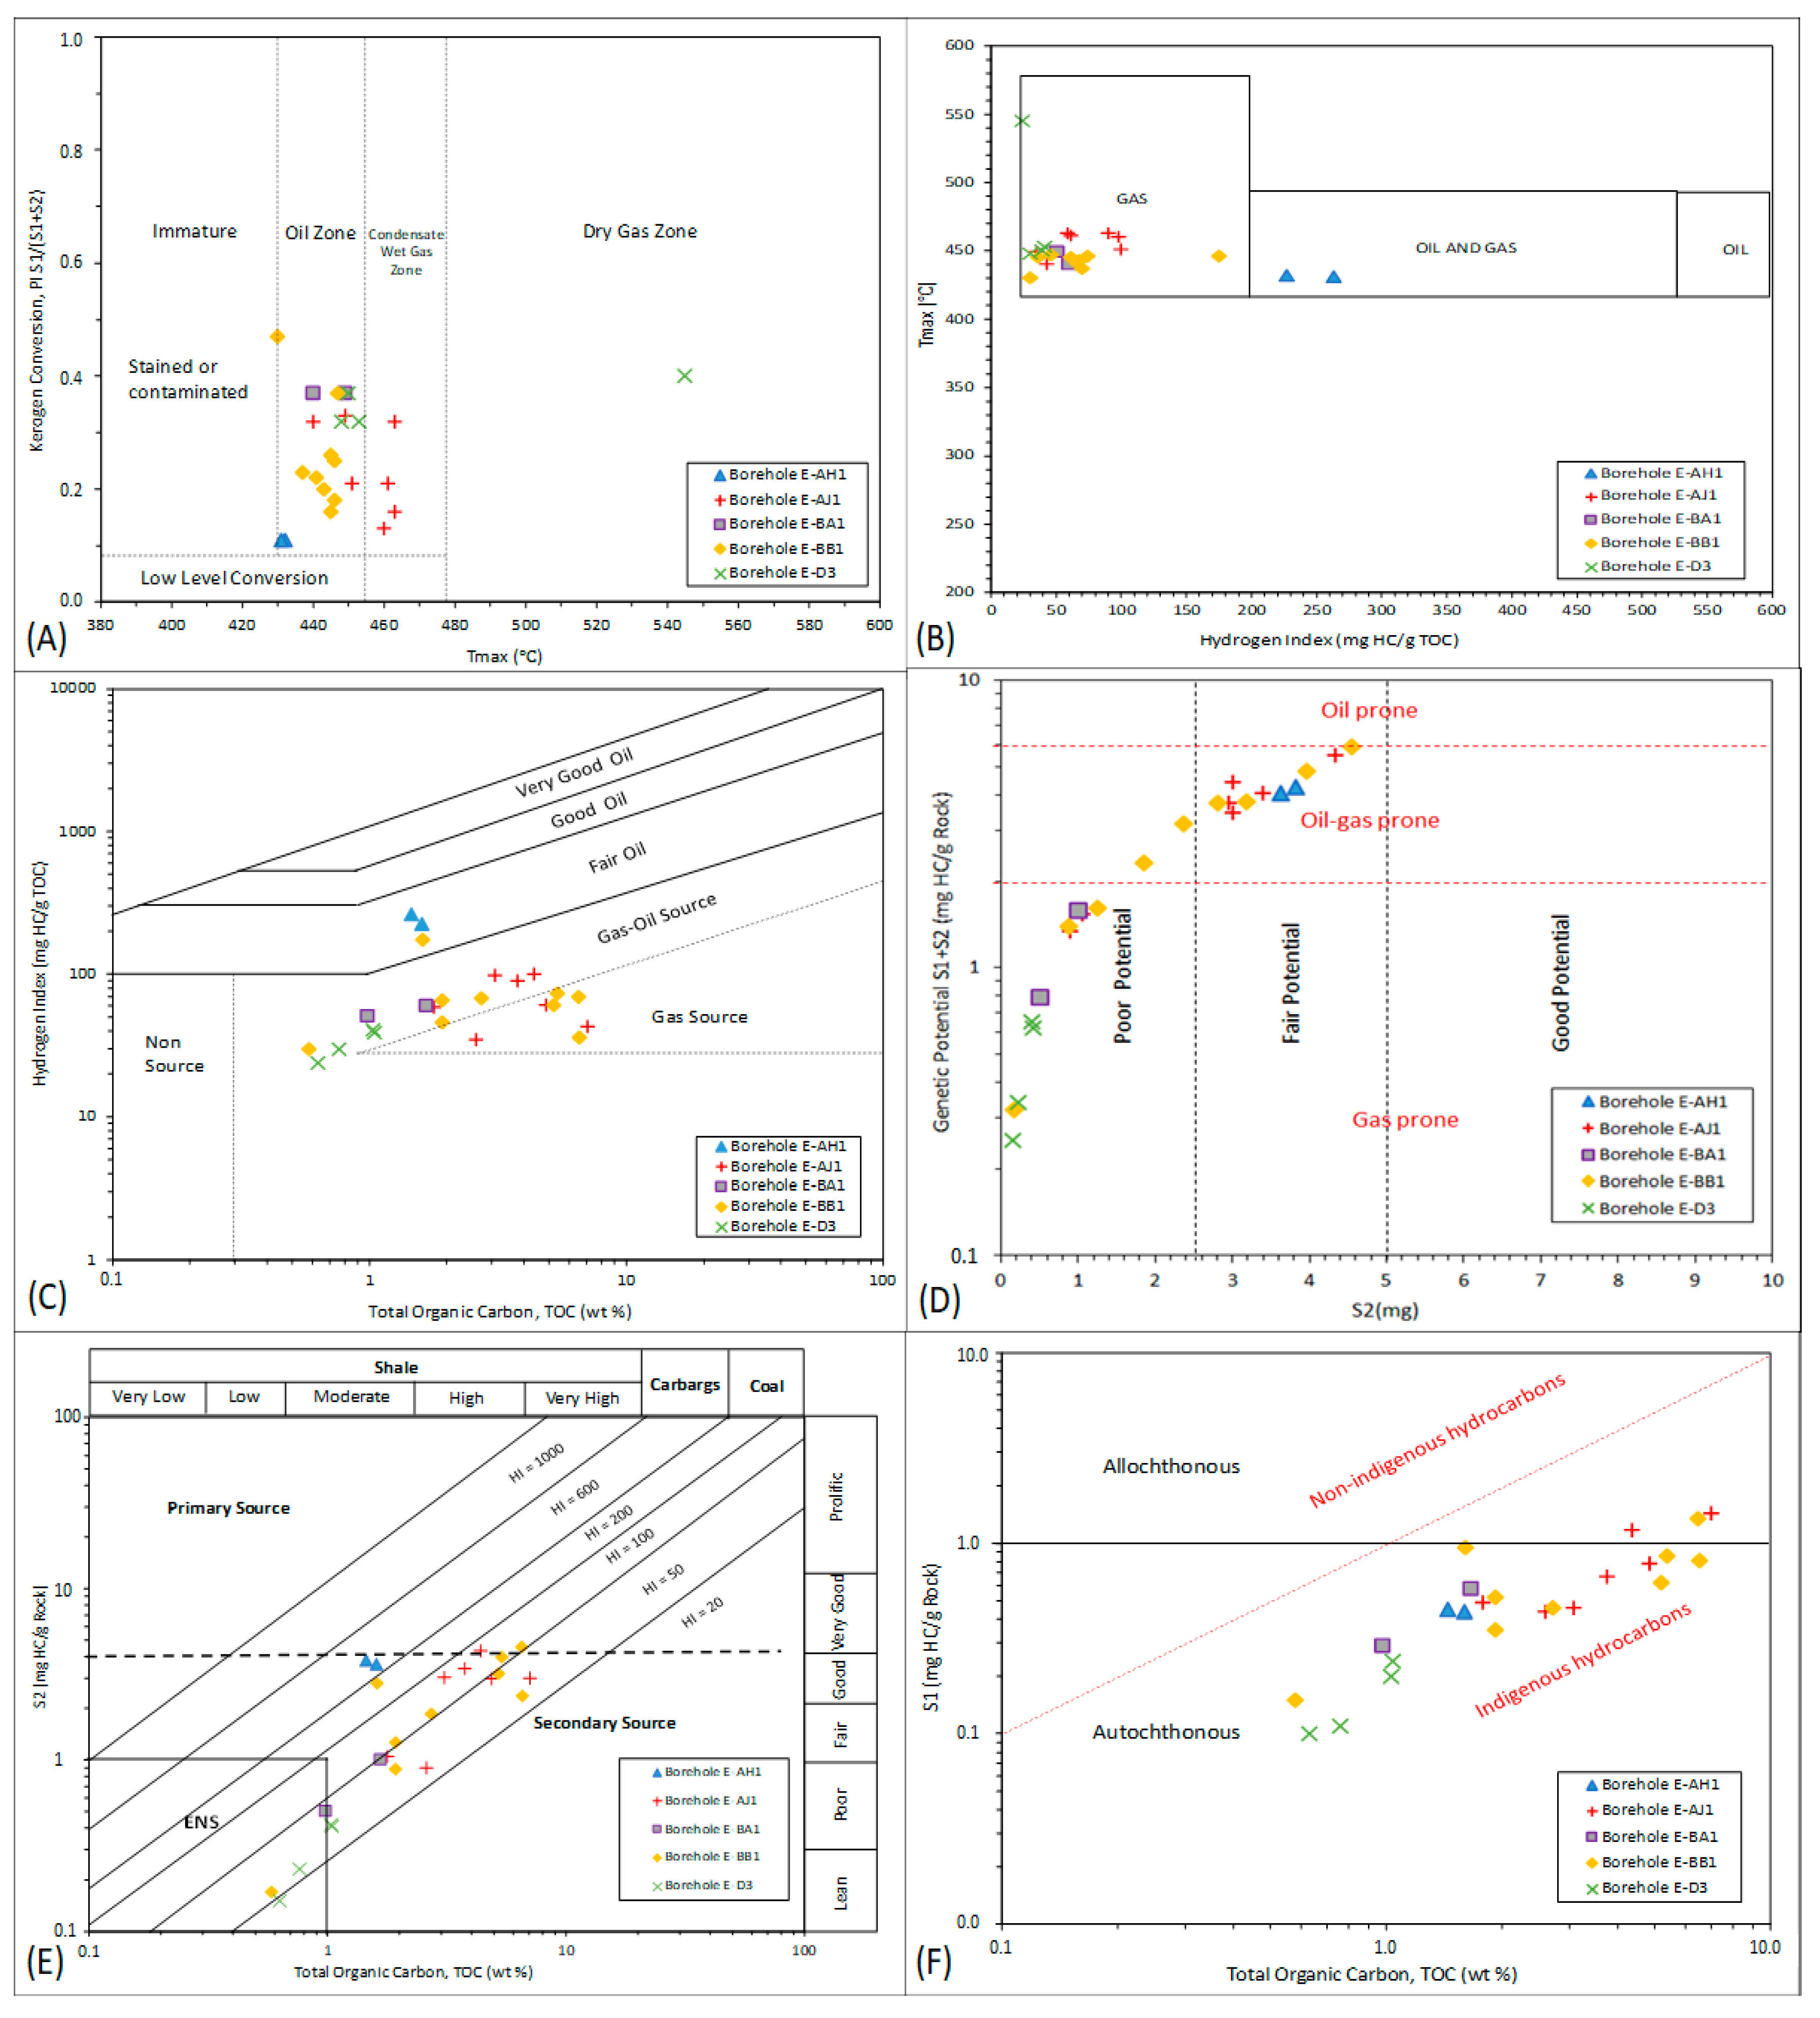
4.2. Quality and Type of Kerogen

The quality and type of organic matter (kerogen) are very important parameters when assessing source rock potential, as they considerably affect the nature of hydrocarbon products [21]. They also provide valuable information about the depositional environment of the source rock as well as assist in determining the hydrocarbon generative potential. Based on the binary plots of hydrogen index versus oxygen index (van Krevelen diagram) and remaining hydrocarbon potential (S2) against total organic carbon (TOC) content, the kerogen types can be classified into Type I, II, III and IV kerogen. In the van Krevelen diagram, the source rocks are analysed for kerogen using well-known evolution paths for diverse kerogen types [17]. As documented by [16], HI value exceeding 600 mg HC/g TOC shows the dominance of Type I kerogen and it has the potential to produce oil. HI values varying between 300 and 600 mg HC/g TOC signify Type II kerogen and are associated with the production of oil. Both Type I and II can produce gas as well if mature enough. HI changes (decreases) with increased maturation. HI values ranging from 200 to 300 mg HC/g TOC indicate a mix of Type II and III kerogens and they are expected to produce a mix of oil and gas. HI values varying between 50 and 200 mg HC/g TOC are often allied with Type III kerogen and can produce gas when matured, while HI values of less than 50 mg HC/g TOC suggest the Type IV kerogen which has with little or no potential for hydrocarbon generation. In terms of the source area, [22] reported that the Type-I kerogen is mostly derived from algae and associated with lacustrine depositional settings, but in a few instances, they are related to marine environment. The Type II kerogen is chiefly derived from plankton, with some contribution from algal material, hence indicating a marine depositional setting. Furthermore, marine and lacustrine environments with substantial terrestrial input are alleged to be the depositional environments for the Type III kerogen, whereas the Type IV kerogen is mostly derived from reworked organic matter (mainly dead carbon). The geochemical parameters for describing kerogen type, hydrocarbon type and organic carbon richness are presented in Table 3 and Table 4.
The Rock–Eval pyrolysis result for the studied Bredasdorp mudrocks and sandstones samples are presented in Table 5. Based on the classification schemes of [16] and [22], shale samples from exploration well E-AH1 have HI values ranging between 227 and 263 mgHC/g TOC, indicating mixed Type II-III kerogen and they have the potential to produce both oil and gas. The mudstones from exploration well E-BA1 have HI values varying between 51 and 61 mgHC/g TOC, suggesting Type III kerogen, which has the potential to produces gas when matured. The mudstones from exploration well E-D3 have HI values ranging between 24 and 41 mgHC/g TOC, suggesting Type IV kerogen and are mostly derived from reworked organic matter (mainly dead carbon) with little or no potential for hydrocarbon (dry gas) generation. The mudrocks and sandstones from exploration wells E-AJ1 and E-BB1 have HI values varying between 30 and 175 mg HC/g TOC, signifying both Type III and Type IV kerogens. There is a possibility that the original or initial HI values in the Bredasdorp samples are higher than the present-day HI values. These values could have been considerably reduced as a result of the increasing thermal maturity. Hence, for example, for samples that are presently mature Type II kerogen with an HI between 300 and 650 mgHC/g TOC, at greater depth, the same kerogen could have expelled hydrocarbons and, in so doing, reduced the HI value down to about 50 mgHC/g TOC. Based on the S2/S3 classification scheme of [16], the studied samples have S2/S3 values ranging from 0.1 to 15 mg HC/mg CO2, indicating mixed Type II/III, III, and IV kerogens and are expected to produce mixed oil and gas, and dry gas (Table 5).
In terms of the kerogen quality, based on the classification scheme of [17], samples from exploration well E-AH1 have S1 values of less than 0.50 mg and S2 values ranging between 3.63 mg and 3.82 mg, indicating poor and fair qualities, respectively. The mudrocks and sandstones from exploration wells E-AJ1 and E-BB1 have S1 values varying from 0.15 to 1.44 mg, and S2 values varying between 0.17 and 4.55 mg, poor to fair kerogen quality. The mudstones from exploration well E-BA1 have S1 values ranging from 0.50 to 0.58 mg, and S2 values ranging between 0.50 and 1.00 mg, indicating fair and poor qualities, respectively. The mudstones from exploration well E-D3 have S1 values of less than 0.5 mg and S2 values ranging between 0.15 and 0.42 mg, both indicating poor quality. The binary plot of HI against OI and S2 versus TOC shows that the samples are of mixed Type II/III, III, and IV kerogens, which are capable of generating wet gas and dry gas with little oil (Figure 4). Generally, these results are comparable with the findings of [7,25,26] where the Bredasdorp mudrocks and sandstones are found to have Type-II/III, III and IV kerogen.

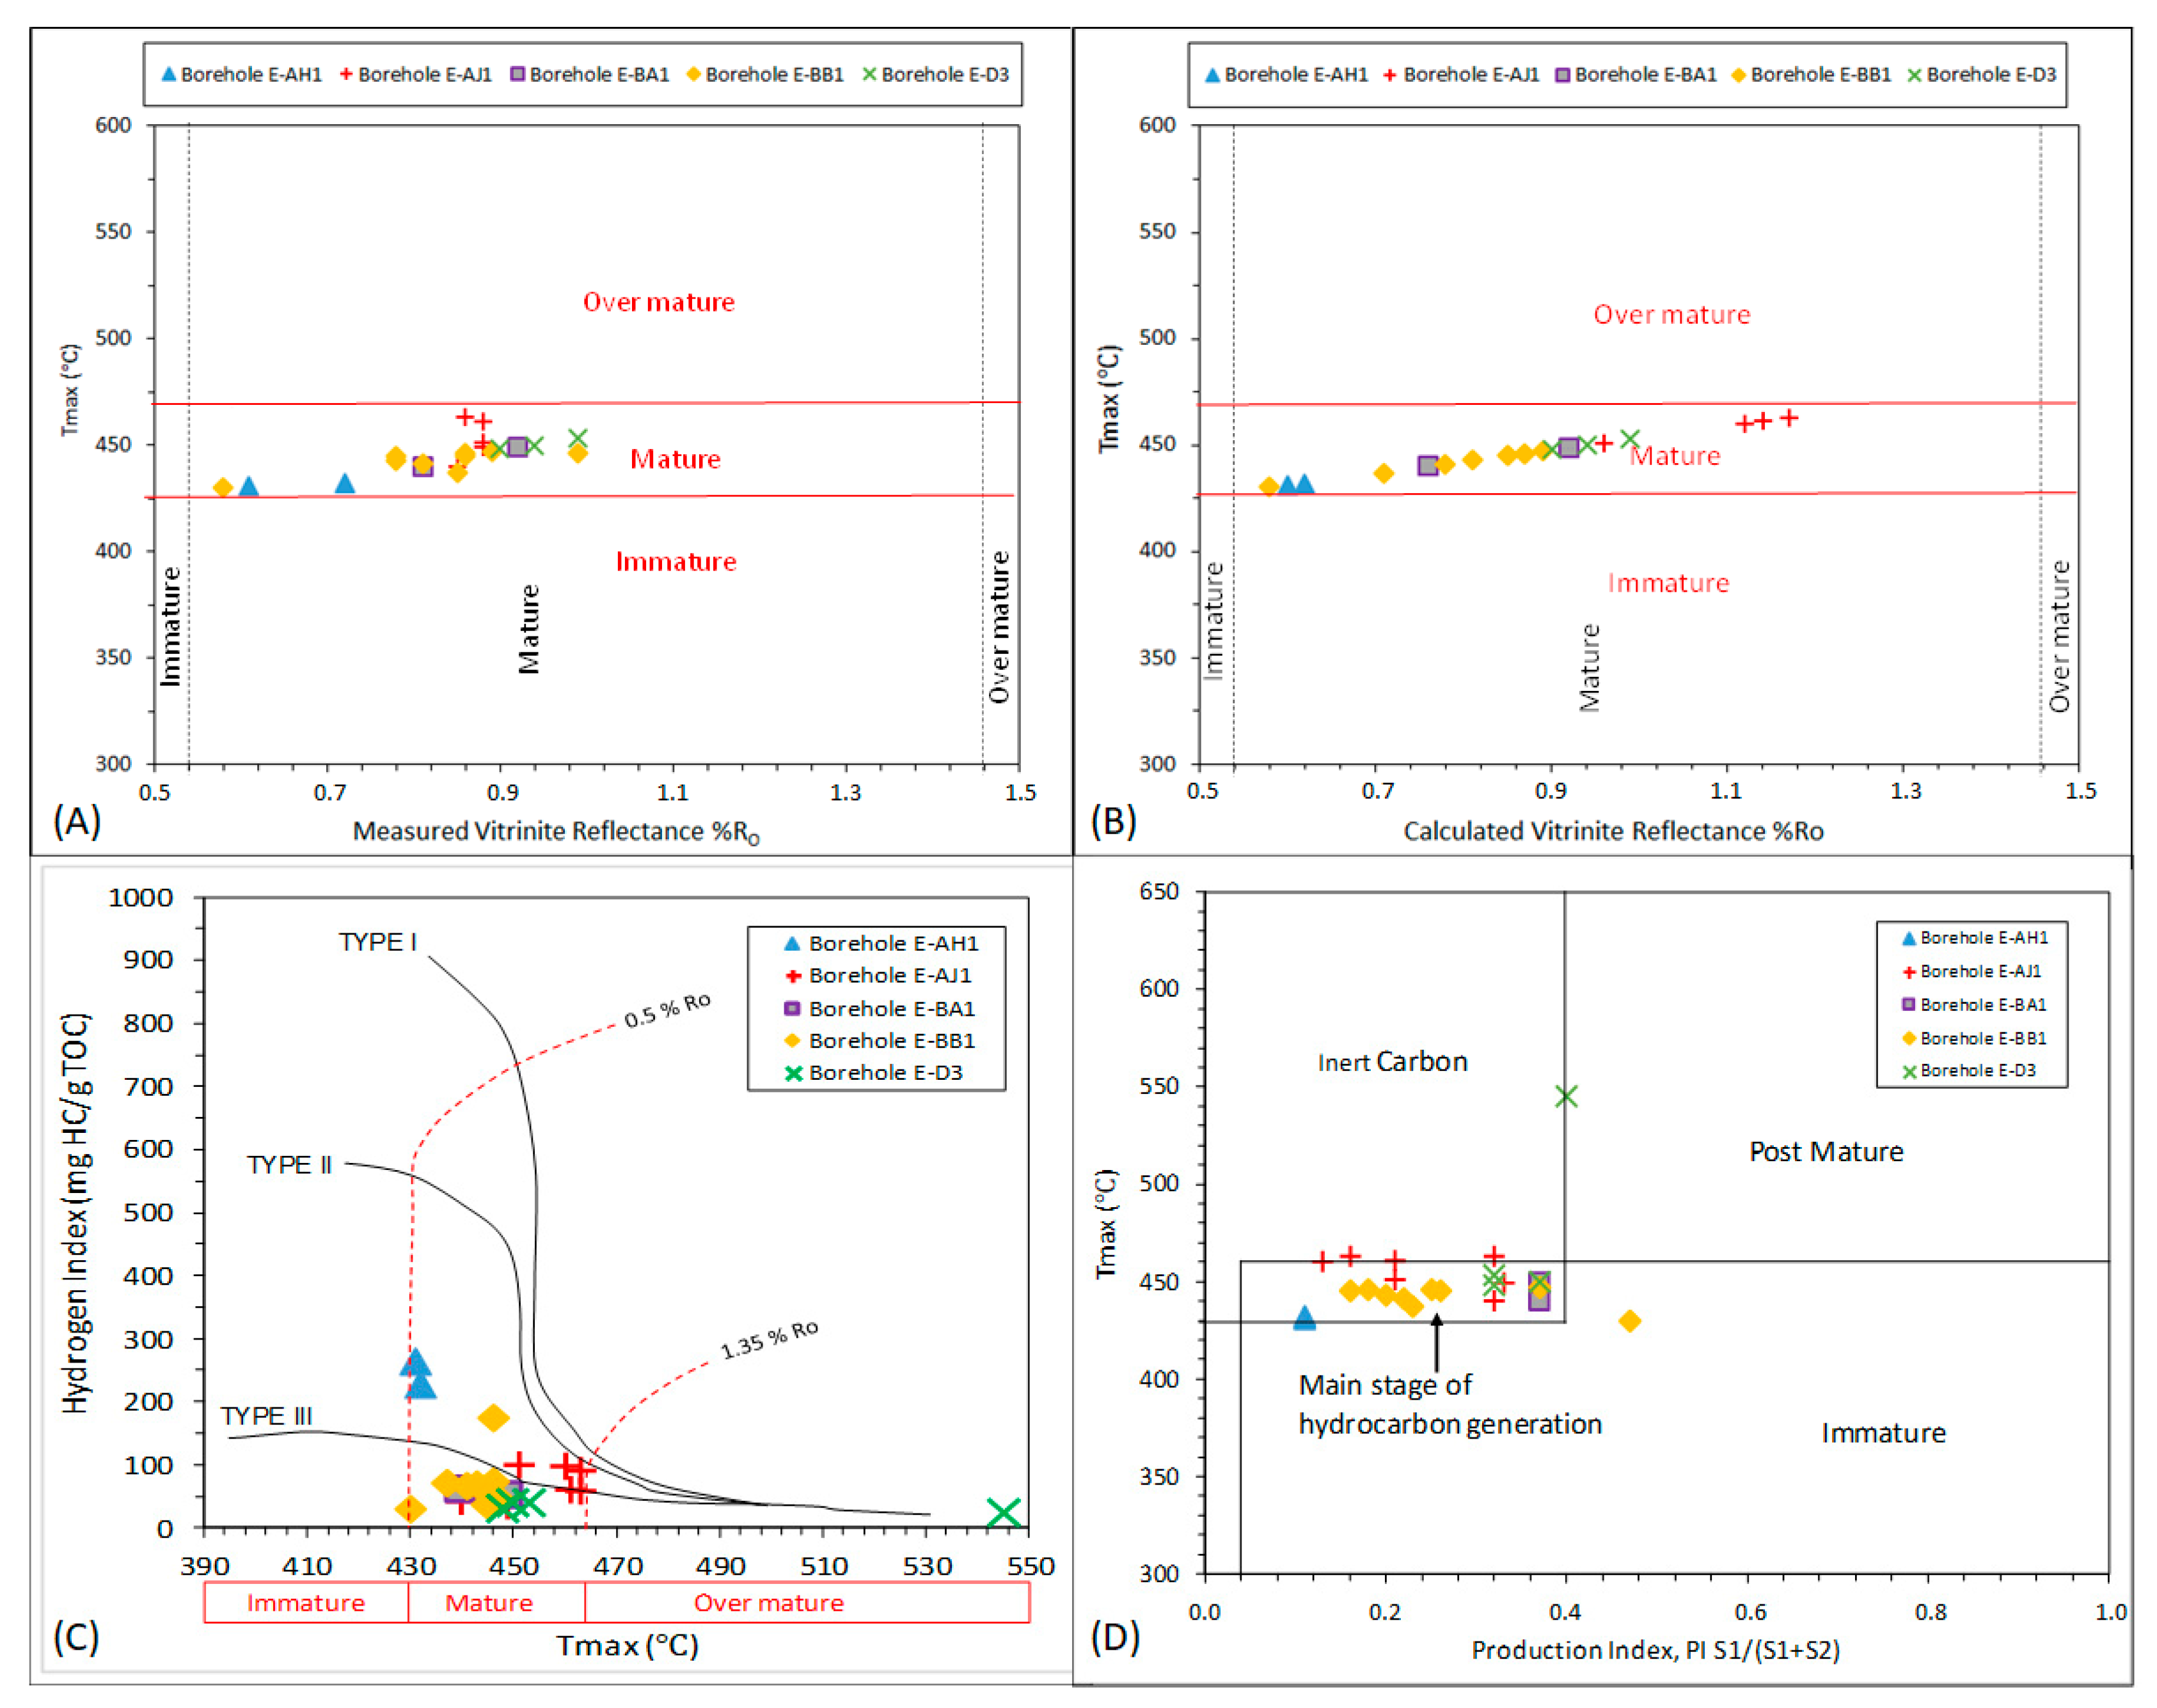
4.3. Thermal Maturity Level

The thermal maturity of dispersed organic matter partly controls the behaviour of the organic matter, and consequently may influence the interpretation of hydrocarbon generation. Therefore, when assessing or evaluating hydrocarbon generation, it is very important to be mindful of the effects of maturation on the organic matter and to take this effect into consideration. The evaluation of thermal maturity of organic matter in Bredasdorp source rocks was carried out using pyrolysis Tmax, production index (PI) and vitrinite reflectance (%Ro) values (Table 5). During pyrolysis, the acquired maximum temperature (Tmax) reveals the thermal energy required to break the most abundant chemical bonds in kerogen that is associated with the generation of hydrocarbons [18,19,29]. The production of these hydrocarbons is related to the amount of hydrogen that is present in the rock, and consequently, to its level of maturation [18,30]. This is because the more mature the rock is, the less hydrogen it contains, and a higher amount of energy is required to liberate the hydrocarbons. Source rock maturity assessment via Tmax is kerogen-type-dependent. According to [20], Tmax values of less than 435 signifies immature organic matter, Tmax values between 435 and 470   indicate mature organic matter, whereas Tmax values above 470   suggests over-maturation of the organic matter. Herein, thermal maturation level was inferred from the values of Tmax, vitrinite reflectance and production index (PI), at least where the TOC reached the least threshold of 0.50 wt.% expected for clastic source rocks [31]. Furthermore, thermogenic oil is generated from source rocks at vitrinite reflectance values from 0.60% to 1.35%, suggesting an oil-generation window [16].
Based on the above-mentioned parameters, conflicting levels of maturity were attained in the Bredasdorp mudrocks and sandstones. The Tmax values range between 431–432 °C, 440–461 °C, 440–449 °C, 430–447 °C, and 448–545 °C in E-AH1, E-AJ1, E-BA1, E-BB1 and E-D3 wells, respectively. These values show that the samples are immature in well E-AH1, immature to mature in well E-BB1, mature in wells E-AJ1 and E-BA1, and predominantly mature in exploration well E-D3 (one sample shows over-maturity with Tmax value of 545 °C). The high Tmax value or over maturity of one sample (depth of 3527.66 m) from Borehole E-D3 is perhaps due to the combined action of burial depth (heat) and an oxidant (warm and oxidizing fluids).
Vitrinite reflectance is the most suitable, and widely accepted by several researchers and exploration geologists as a method for measuring the thermal maturity of source rocks. The results of the vitrinite reflectance analysis are presented in Table 6, along with some organic photomicrographs. The vitrinite histograms are presented in the Supplementary Materials. All samples contained vitrinite and inertinite, as well as pyrite (abundant in some samples) and quartz, and other minerals. Some samples contained liptinite that fluoresced. The number of measurements was limited by the amount of suitable vitrinite particles in a few samples. The average vitrinite reflectance values for all the samples range from 0.60–1.20%, indicating that the samples are mature and fall into the oil window. The binary plots of Tmax against vitrinite reflectance and kerogen conversion (PI) against Tmax revealed that the samples are mostly matured and are in the main stage of the oil-generation window (Figure 5). The Tmax and PI values support the vitrinite reflectance values, signifying that the southern Bredasdorp Basin rocks have entered the mature oil window and are considered as effective source rocks in the Bredasdorp Basin. The distribution of the organic matter in a sample may impact the TOC value. In some samples, the organic matter is evenly distributed throughout the sample (typically as fragments); in other samples, the organic matter is highly concentrated in narrow bands/distinct layer. For example, the mudstone taken from well E-AJ1 at a depth of 2700 m has a lower TOC value than the sandstone from well E-AJ1 at a depth of 2728 m, yet it appears to contain far more organic matter (Table 6). Generally, the measured vitrinite reflectance values and the calculated values are comparable and they increase as the burial depth increases. Although some samples have a lot more organic matter than others, the TOC is far lower, which could be related to the actual sample analysed. In most of the samples, the organic matter occurs only in discrete bands, so if the selected sample has several bands, the TOC is likely to be higher than samples where there is more organic matter, but not confined to specific bands.

4.4. Hydrocarbon Generation Potential

The TOC content alone cannot be used to confirm the potential and/or effective petroleum source/reservoir rocks. This is a result of different kerogen types having different hydrocarbon yields for the same TOC [20]. Therefore, a more direct measure of source rock hydrocarbon generative potential is vital for a thorough assessment. For the classification of source rocks, [34] suggested a genetic potential (SP = S1 + S2). According to their classification scheme, rocks with an SP of less than 2 mg HC/g are gas-prone, rocks with SP between 2 and 6 mg HC/g are oil-gas prone, and those with SP greater than 6 mg HC/g are good source rocks for oil. Generally, the SP values for the studied samples indicate both gas- and oil-gas-prone rocks (Table 6). Shale samples from exploration well E-AH1 have SP values ranging between 4.07 and 4.27 mg HC/g, indicating the potential to generate both oil and gas. The mudstones from exploration wells E-AJ1 and E-D3 have SP values ranging from 0.90 to 4.34 mg HC/g, and 0.32 to 5.90 mg HC/g, respectively, indicating that they are gas- and oil-gas prone. The mudstones from exploration wells E-BA1 and E-D3 have SP values varying between 0.25 and 0.65 mg HC/g, suggesting the potential to produces gas.
The binary plots of kerogen conversion (PI) versus Tmax and Tmax against HI indicate that the Bredasdorp rocks have the potential to generate oil and gas (Figure 6A–B). The plot of HI versus TOC shows that the analysed samples have fair potential to generate oil and gas (Figure 6C). Furthermore, the binary plots of generative potential (SP) versus S2 indicates that the Bredasdorp rocks have poor –fair potential to generate oil and gas (Figure 6D). In [35], it was envisaged that effective primary source rocks should have an S2 value of greater than 5 mg HC/g and an S2 value of less than 1 mg HC/g for effective non-source rocks (ENS). The S2 values for the studied samples vary from 0.15 to 4.34 mg HC/g, indicating both a secondary source field and effective non-source rocks (ENS) (Figure 6E). Nevertheless, half of the analysed samples have an S2 value of less than 2 mg HC/g, indicating poor potential, and the other half are between 2–5 mg HC/g, suggesting fair source potential. The binary plot of S1 versus TOC was used to discriminate between non-indigenous (allochthonous) and indigenous hydrocarbons (autochthonous) and the plot revealed that the Bredasdorp rocks are characterized by autochthonous or indigenous hydrocarbons (Figure 6F).
The hydrocarbon prospectivity is considered high in the Bredasdorp Basin, hosting a significant amount of South Africa’s proven hydrocarbons. Several small oil and gas accumulations have been discovered in the basin and some are currently under appraisal. The studied boreholes are located in a relatively similar basinal setting with the Oribi and Oryx oil fields, and they are drilled to test for hydrocarbons within domal structural and stratigraphic closure at various target levels. The primary target is the stratigraphically trapped sandstones within the 13At1 to 14At1 (mid-Aptian) interval. These sandstones are stacked mass-flows deposited within a lowstand wedge. The secondary targets are the turbiditic sandstones below horizon 9At1. The TOC, vitrinite reflectance and Tmax values for the studied samples are relatively variable but still comparable with those obtained for boreholes within the Oribi and Oryx oil fields, perhaps indicating the different source rocks in the basinal setting. The research findings suggest that wells E-AH1, E-AJ1 and E-BB1 are stratigraphically situated in the organic-rich mudstone/shale source rocks, thus there was the formation and accumulation of hydrocarbons. On the other hand, wells E-BA1 and E-D3 are stratigraphically located relatively further away from the organic-rich mudstone/shale source rocks, and as a result show low hydrocarbons potential. The fault-control of sedimentation may also have affected the capacity of the boreholes to retain a significant amount of the generated hydrocarbons. Likewise, the age, transportation, deposition and thermal history of sediment in the basin, may have contributed to or influenced the potential and type of hydrocarbon formation. 2D seismic data acquired by Canadian Natural Resources (formerly Ranger Oil) in 2001 and 2005 have confirmed the presence of major structures in the study area. Domally closed synrift structures are generally within the oil window and expected to contain gas, which is in agreement with the results presented in this study. In addition, the recent seismic interpretation of the 2D seismic data indicates the possibility of a gigantic basin floor fan complex (named “Paddavissie”) with an upside potential of billions of barrels of oil, also confirmed by the latest infill seismic data [7,13,14,26]. The Southern Outeniqua Basin is highly rated for oil in the central part of the basin, and more gas-prone towards the southern and northern periphery with its thicker overburden. Regional studies suggest the presence of multiple source rocks, shallow marine and turbidite sandstones and large structural and stratigraphic traps. In general, major economic discoveries are restricted to the western part of the Bredasdorp sub-basin. There have been only minor discoveries and shows in the eastern part of the basin.

5. Conclusions

The organic geochemical investigation of the southern Bredasdorp mudrocks and sandstones (wackes) revealed the presence of predominantly oil and gas-prone potential source/reservoir rocks with poor to fair source generative potential. The analysed samples have S1 values of 0.10–1.44 mg HC/g, S2 values of 0.15–4.55 mg HC/g, normalized oil content (S1/TOC) of 12.00–59.00 mg HC/g TOC and hydrocarbon genetic potential 0.25–5.90 mg HC/g, all signifying poor to fair hydrocarbon generative potential. The HI values range from 24 to 263 mg HC/g TOC and OI varies from 4 to 78 mg CO2/g TOC, indicating predominantly Type III and IV kerogen with possible minor amounts of mixed Type II/III kerogen. Similarly, the binary plot of HI against OI, HI versus Tmax, and S2 against TOC shows that the samples are of mainly Type III and IV kerogens and are capable of generating wet gas and dry gas with little oil (Mixed Type II/III are capable of generating oil and gas, Type III are capable of generating wet gas, Type IV kerogens will give dry gas or nothing). In terms of the maturity of the samples, about 97% of the samples have pyrolysis Tmax values between 43 and 461 , indicating that the samples are thermally matured. The average measured and calculated vitrinite values (Ro) range from 0.60–1.20%, indicating that the samples are mature and fall into the oil window, which is consistent with the Tmax and PI data for these samples. This research study has revealed that the southern Bredasdorp Basin are primarily Type III and IV kerogen, and are in the main stage of the oil-generation window.

Supplementary Materials

The following are available online at https://www.mdpi.com/2075-163X/10/7/595/s1.

Author Contributions

Conceptualization, T.L.B. and K.L.; methodology, T.L.B., K.L., N.W. and C.B.; software, O.G. and C.B.; validation, T.L.B., K.L., O.G. and C.B.; formal analysis, T.L.B., K.L., N.W. and C.B.; investigation, T.L.B., K.L., O.G. and C.B.; resources, K.L., O.G. and N.W.; data curation, T.L.B., K.L. and C.B.; writing—original draft preparation, T.L.B.; writing—review and editing, T.L.B., K.L., O.G., N.W. and C.B.; visualization, T.L.B., K.L., O.G., and C.B; supervision, K.L. and O.G.; project administration, K.L. and O.G.; funding acquisition, K.L. All authors have read and agreed to the published version of the manuscript.

Funding

The authors are grateful to the National Research Foundation-Southern African Systems Analysis Centre (NRF-SASAC; UID: 118768) and DSI-NRF Centre of Excellence (CoE) for Integrated Mineral and Energy Resource Analysis (CIMERA) for financial support.

Acknowledgments

The Petroleum Agency of South Africa (PASA) and the Govan Mbeki Research and Development Centre (GMRDC) of the University of Fort Hare are appreciated for granting access to the cores and logistic supports, respectively.

Conflicts of Interest

The authors declare no conflict of interest.

References

  1. Petroleum Agency South Africa, PASA. Petroleum Exploration in South Africa, Information and Opportunities; Online Report; PASA: Cape Town, South Africa, 2012; pp. 25–29. Available online: http://www.petroleumagencysa.com/images/pdfs/pet_expl_opp_2012fw.pdf (accessed on 17 November 2019).
  2. Petroleum Agency South Africa. Petroleum Exploration Information and Opportunities: Petroleum Agency of South Africa Brochure; Petroleum Agency South Africa: Cape Town, South Africa, 2003; pp. 12–15. [Google Scholar]
  3. Burden, P.L.A.; Davies, C.P.N. Exploration to first production on block 9 off South Africa. Oil Gas J. 1997, 1, 92–98. [Google Scholar]
  4. Petroleum Agency South Africa. Petroleum Exploration Information and Opportunities: Petroleum Agency South Africa Brochure; Petroleum Agency South Africa: Cape Town, South Africa, 2005; pp. 16–18. [Google Scholar]
  5. Opuwari, M. Petrophysical Evaluation of the Albian Age Gas Bearing Sandstone Reservoirs of the O-M Field, Orange Basin, South Africa. Ph.D. Thesis, University of the Western Cape, Cape Town, South Africa, 2010; pp. 10–20. [Google Scholar]
  6. Burden, P.L.A. Soekor, partners explore possibilities in Bredasdorp Basin off South Africa. Oil Gas J. 1992, 90, 109–112. [Google Scholar]
  7. Davies, C.P.N. Hydrocarbon Evolution of the Bredasdorp Basin, Offshore South Africa—From Source to Reservoir. Ph.D. Thesis, University of Stellenbosch, Stellenbosch, South Africa, 1997; pp. 11–33. [Google Scholar]
  8. Brown, L.F.; Brink, G.J.; Doherty, S.; Jollands, A.; Jungslager, E.H.A.; Keenan, J.H.G.; Muntigh, A.; van Wyk, N.J.S. Sequence Stratigraphy in Offshore South African Divergent Basins: An Atlas on Exploration for Cretaceous Lowstand Traps; Studies in Geology; American Association of Petroleum Geologists: Tulsa, OK, USA, 1995; Volume 41, pp. 131–184. [Google Scholar]
  9. Broad, D.S.; Jungslager, E.H.A.; McLachlan, I.R.; Roux, J. Offshore Mesozoic Basins. In The Geology of South Africa; Johnson, M.R., Anhaeusser, C.R., Thomas, R.J., Eds.; Geological Society of South Africa, Johannesburg/Council for Geoscience: Pretoria, South Africa, 2006; pp. 553–571. [Google Scholar]
  10. Akinlua, A.; Sigedle, A.; Buthelezi, T.; Fadipe, O.A. Trace element geochemistry of crude oils and condensates from South African Basins. Mar. Pet. Geol. 2015, 59, 286–293. [Google Scholar] [CrossRef]
  11. Tinker, J.; de Wit, M.; Brown, R. Linking source and sink: Evaluating the balance between onshore erosion and offshore sediment accumulation since Gondwana break-up, South Africa. Tectonophysics 2008, 455, 94–103. [Google Scholar] [CrossRef]
  12. McMillan, I.K.; Brink, G.J.; Broad, D.S.; Maier, J.J. Late Mesozoic sedimentary basins off the south coast of South Africa. In Sedimentary Basins of the World—African Basins; Selley, R.C., Ed.; Elsevier Science B.V.: Amsterdam, The Netherlands, 1997; pp. 319–376. [Google Scholar]
  13. Jungslager, E.H.A. Geological Evaluation of the Remaining Prospectivity for Oil and Gas of the Pre-1At1 “Synrift” Succession in Block 9, Republic of South Africa; Unpublished Soekor Technical Report SOE-EXP-RPT-0380; Soekor: Cape Town, South Africa, 1996; 63p. [Google Scholar]
  14. PGS. Re-Evaluation of the F-A Field and Satellite. Unpublished work. 1999; 57p. [Google Scholar]
  15. Tissot, B.P.; Welte, D.H. Petroleum Formation and Occurrence, 1st ed.; Springer: New York, NY, USA, 1978; 538p. [Google Scholar]
  16. Peters, K.E.; Cassa, M.R. Applied source rock geochemistry. In The Petroleum System—From Source to Trap; Magoon, L.B., Dow, W.G., Eds.; American Association of Petroleum Geologists: Tulsa, OK, USA, 1994; Volume 60, pp. 93–120. [Google Scholar]
  17. Peters, K.E. Guidelines for evaluating petroleum source rock using programmed analysis. Am. Assoc. Pet. Geol. Bull. 1986, 70, 318–329. [Google Scholar]
  18. Baiyegunhi, C.; Liu, K.; Wagner, N.; Gwavava, O.; Baiyegunhi, T.L. Geochemical evaluation of the Permian Ecca shale in Eastern Cape Province, South Africa: Implications for shale gas potential. Acta Geol. Sin. (Engl. Ed.) 2018, 92, 1193–1217. [Google Scholar] [CrossRef]
  19. Liu, B.; Yang, Y.; Li, J.; Chi, Y.; Li, J.; Fu, X. Stress sensitivity of tight reservoirs and its effect on oil saturation: A case study of Lower Cretaceous tight clastic reservoirs in the Hailar Basin, Northeast China. J. Pet. Sci. Eng. 2020, 184, 106484. [Google Scholar] [CrossRef]
  20. Katz, B.J. Significance of ODP results on deep-water hydrocarbon exploration–eastern equatorial Atlantic region. J. Afr. Earth Sci. 2006, 46, 331–345. [Google Scholar] [CrossRef]
  21. Barker, C. Thermal Modelling of Petroleum Generation: Theory and Applications; Elsevier: New York, NY, USA, 1996; 62p. [Google Scholar]
  22. McCarthy, K.; Rojas, K.; Niemann, M.; Palmowski, D.; Peters, K.; Stankiewicz, A. Basic petroleum geochemistry for source rock evaluation. Oil Field Rev. 2011, 23, 32–43. [Google Scholar]
  23. International Organization for Standardization (ISO) 7404-2. Methods for the Petrographic Analysis of Coals—Part 2: Methods of Preparing Coal Samples; International Organization for Standardization: Geneva, Switzerland, 2009; pp. 1–12. [Google Scholar]
  24. American Society for Testing and Materials, ASTM D7708-14. Standard Test Method for Microscopical Determination of the Reflectance of Vitrinite Dispersed in Sedimentary Rocks; ASTM International: West Conshohocken, PA, USA, 2014; pp. 1–14. [Google Scholar]
  25. Brownfield, M.E. Assessment of undiscovered oil and gas resources of the South Africa coastal province, Africa. World Petroleum Resources Project. U.S. Geol. Surv. Bull. 2012, 1–2. [Google Scholar] [CrossRef]
  26. Sonibare, W.A. Structure and evolution of basin and petroleum systems within a transform-related passive margin setting: Data-based insights from crust-scale 3D modelling of the Western Bredasdorp Basin, offshore South Africa. Ph.D. Thesis, University of Stellenbosch, Stellenbosch, South Africa, 2015; pp. 16–44. [Google Scholar]
  27. Van Krevelen, D.W. Coal: Typology—Chemistry—Physics—Constitution, 1st ed.; Elsevier: Amsterdam, The Netherlands, 1961; 514p. [Google Scholar]
  28. Hartwig, A.; Schulz, H. Applying classical shale gas evaluation concepts to Germany-Part l: The basin and slope deposits of the Stassfurt Carbonate (Ca2, Zechstein, Upper Permian) in Brandenburg. Chermie De Erde 2009, 70, 77–91. [Google Scholar] [CrossRef]
  29. Mahlstedt, N.; Horsfield, B. Metagenetic methane generation in gas shales I. screening protocols using immature samples. Mar. Pet. Geol. 2012, 31, 27–42. [Google Scholar]
  30. Nuñez-Betelu, L.; Baceta, J.I. Basics and application of Rock-Eval/TOC Pyrolysis: An example from the uppermost Paleocene/lowermost Eocene in the Basque Basin, Western Pyrenees. Munibe Nat. Sci.—Nat. Zient. 1994, 46, 43–62. [Google Scholar]
  31. Hedberg, H.D.; Moody, J.O. Petroleum prospects of deep offshore. AAPG Bull. 1979, 63, 286–300. [Google Scholar]
  32. Bordenave, M.L. Applied Petroleum Geochemistry; Editions Technip: Paris, France, 1993; 142p. [Google Scholar]
  33. Hakimi, M.H.; Abdullah, W.H.; Shalaby, M.R.; Laby, M.R. Organic Geochemistry, burial history and hydrocarbon generation modeling of the Upper Jurassic Madbi Formation, Masila Basin, Yemen. J. Pet. Geol. 2010, 33, 299–318. [Google Scholar] [CrossRef]
  34. Tissot, B.; Welte, D.H. Petroleum Formation and Occurrence; Springer: Berlin, Germany, 1984; 699p. [Google Scholar]
  35. Burwood, R.; De Witte, S.M.; Mycke, B.; Paulet, J. Petroleum geochemical characterisation of the lower Congo coastal Basin Bucomazi Formation. In Petroleum Source Rocks; Katz, B.J., Ed.; Springer: Berlin, Germany, 1995; pp. 235–263. [Google Scholar]
  36. Jackson, K.S.; Hawkins, P.J.; Bennett, A.J.R. Regional facies and geochemical evaluation of Southern Denison Trough. Aust. Pet. Explor. Assoc. (APEA) J. 1985, 20, 143–158. [Google Scholar] [CrossRef]
  37. Maravelis, A.; Zelilidis, A. Organic geochemical characteristics of the Late Eocene-Early Oligocene submarine fan and shelf deposits on Lemons Island, NE Greece. J. Pet. Sci. Eng. 2010, 9, 25–40. [Google Scholar]
Figure 1. Map of the study area showing distribution of the exploration wells across the Bredasdorp Basin (modified from [3]).
Minerals 10 00595 g001
Figure 2. Stratigraphic chart of the Bredasdorp Basin (after [6]).
Minerals 10 00595 g002
Figure 3. Schematic representation of Rock–Eval pyrolysis showing the reaction of organic matter to programmed heating in the course of pyrolysis [21].
Minerals 10 00595 g003
Figure 4. (A) Binary plot of hydrogen index versus oxygen index (modified van Krevelen diagram) for the selected Bredasdorp Basin mudrocks and wackes showing kerogen type (after [27]); (B) Binary plot of hydrogen index versus oxygen index for the selected Bredasdorp Basin mudrocks and wackes showing the organic matter types (after [27]); (C) Binary plot of pyrolysis S2 against total organic carbon (TOC) showing organic matter (kerogen) type and potential hydrocarbon for the Bredasdorp mudrocks and wackes (after [28]).
Minerals 10 00595 g004
Figure 5. (A) Binary plot of Tmax versus measured vitrinite reflectance showing maturity of the Bredasdorp mudrocks and sandstones (wackes) (after [16]); (B) Binary plot of Tmax versus measured vitrinite reflectance showing maturity of the Bredasdorp mudrocks and sandstones (wackes) (after [16]); (C) Binary plot of hydrogen index versus Tmax (modified van Krevelen diagram) for the selected Bredasdorp Basin mudrocks and wackes showing kerogen type and maturity (after [32]); (D) Plot of pyrolysis Tmax against production index (PI) showing the maturity level and nature of the hydrocarbon products of the Bredasdorp mudrocks and wackes (after [33]).
Minerals 10 00595 g005
Figure 6. (A) Plot of production index (PI) against Tmax showing hydrocarbon production for the mudrocks and sandstones (wackes) of the Bredasdorp Basin (after [34]); (B) Plot of Tmax versus hydrogen index (HI) showing hydrocarbon generating potential for the of the Bredasdorp mudrocks and sandstones (modified after [34]); (C) Binary plot of HI versus total organic carbon (TOC) showing source rock richness for the Bredasdorp mudrocks and sandstones (after [36]); (D) Binary plot of genetic potential versus S2 for the Bredasdorp mudrocks and sandstones showing generative potential (after [37]); (E) Binary plot of S2 versus TOC plot for source rock quality of the Bredasdorp mudrocks and sandstones (wackes) (after [35]); (F) Binary plot of S1 versus TOC for the Bredasdorp samples showing generated hydrocarbon (after [35]).
Minerals 10 00595 g006
Table 1. Summary of the measured and calculated parameters from the Rock–Eval pyrolysis [22].
Measured Parameters
Tmax is the maximum generation of hydrocarbons during pyrolysis and is much higher than the temperature governing the formation of hydrocarbons in nature
S1 = amount of hydrocarbon that is thermally distilled from the whole rock at temperature < 300 °C. Units: mg of hydrocarbon/gram of rock
S2 = amount of hydrocarbons liberated through pyrolytic degradation of kerogen between 300 °C and 650 °C. Units: mg of hydrocarbon/gram of rock
S3 = amount of organic CO2 liberated between 300 °C and 390 °C. Units: mg of CO2/gram of rock
Calculated Parameters
SP (hydrocarbon potential) = S 1 +   S 2
SP correspond to the total amount of hydrocarbons that the source rock can generate at matured level.
PI (production index) = S 1 ( S 1 +   S 2 )
PI is used to characterise the evolution of the organic matter, as PI increases with depth in very fine-grained rocks, also with source rock maturation before hydrocarbon are expelled.
HI (hydrogen index) = ( S 2 TOC ) × 100
HI is the amount of hydrogen contained within the kerogen, with higher HI indicating a potential for oil production.
OI (oxygen index) = ( S 3 TOC ) × 100
OI is the amount of oxygen in the kerogen and is useful in tracking the maturation path of the kerogen.
Table 2. Results of total organic carbon (TOC) analysis of mudrocks and sandstones from the Bredasdorp Basin.
S/NBoreholeDepthLithologyTOC (wt.%) S/NBoreholeDepthLithologyTOC (wt.%)
1E-AH12478.80Shale0.22 43E-BA12843.80Sandstone0.14
2E-AH12479.50Shale0.3144E-BA12848.60Mudstone0.98
3E-AH12480.00Shale1.4545E-BA12849.80Mudstone0.44
4E-AH12480.40Shale0.2646E-BB12541.06Mudstone0.58
5E-AH12480.80Shale0.4147E-BB12543.00Sandstone0.39
6E-AH12484.00Shale1.6048E-BB12549.90Mudstone6.48
7E-AH12485.00Shale0.3749E-BB12550.00Shale0.49
8E-AJ12692.20Sandstone0.3450E-BB12550.60Shale0.47
9E-AJ12693.00Sandstone0.3051E-BB12553.00Sandstone0.42
10E-AJ12693,60Sandstone0.4452E-BB12556.00Sandstone0.30
11E-AJ12694.07Sandstone1.7853E-BB12662.46Sandstone1.92
12E-AJ12695.80Sandstone0.2154E-BB12665.00Sandstone0.47
13E-AJ12700.10Mudstone3.0755E-BB12667.00Mudstone2.72
14E-AJ12707.00Mudstone3.7656E-BB12720.90Sandstone6.54
15E-AJ12707.30Sandstone0.4757E-BB12722.93Mudstone5.19
16E-AJ12707.60Sandstone0.4258E-BB12855.00Sandstone0.27
17E-AJ12708.00Sandstone0.4859E-BB12872.85Mudstone5.37
18E-AJ12727.40Sandstone0.4460E-BB12873.60Mudstone0.38
19E-AJ12728.00Sandstone2.5961E-BB12874.30Mudstone0.44
20E-AJ12728.50Sandstone0.4062E-BB12875.00Mudstone0.43
21E-AJ12729.10Sandstone0.2963E-BB12876.80Mudstone0.46
22E-AJ12729.60Sandstone0.4364E-BB13281.15Mudstone0.45
23E-AJ12730.00Sandstone0.3465E-BB13283.53Mudstone1.61
24E-AJ12730.20Sandstone0.4466E-BB13285.00Sandstone0.44
25E-AJ12967.40Shale0.3967E-BB13286.20Sandstone0.44
26E-AJ12968.20Sandstone0.3068E-BB13287.00Sandstone0.41
27E-AJ12976.29Sandstone7.0369E-BB13288.00Sandstone0.48
28E-AJ12978.00Sandstone0.3370E-BB13289.00Sandstone0.40
29E-AJ12979.50Sandstone0.3871E-BB13290.00Sandstone0.43
30E-AJ12981.00Mudstone4.8572E-BB13291.86Mudstone1.92
31E-AJ12983.80Shale0.4873E-D33260.90Mudstone1.03
32E-AJ12984.00Sandstone0.4174E-D33262.00Shale0.49
33E-AJ13039.10Shale4.3675E-D33263.60Mudstone1.04
34E-BA12828.05Mudstone1.6676E-D33265.50Mudstone0.76
35E-BA12830.30Shale0.3077E-D33266.00Shale0.43
36E-BA12830.70Shale0.3278E-D33267.00Sandstone0.48
37E-BA12831.20Shale0.2979E-D33268.00Sandstone0.41
38E-BA12831.90Shale0.4180E-D33269.00Sandstone0.38
39E-BA12832.80Shale0.3081E-D33270,00Shale0.40
40E-BA12833.20Shale0.3182E-D33527,66Mudstone0.63
41E-BA12837.90Sandstone0.2483E-D33740,10Shale0.39
42E-BA12842.30Sandstone0.17
Table 3. Geochemical parameters for describing the kerogen type and hydrocarbon type generated [16].
Kerogen TypeHI
(mgHC/g TOC)
S2/S3 (mg)Atomic H/CMain Expelled at Peak Maturity
I > 600 > 15 > 1.5Oil
II300–60010–151.2–1.5Oil
II/III200–3005–101.0–1.2Mixed oil and gas
III50–2001–50.7–1.0Gas
IV < 50 < 1 < 0.7Dry Gas
Table 4. Organic carbon richness based on TOC data [16].
QualityTOC (wt.%)S1 (mg)S2 (mg)
Poor0.0–0.50.0–0.5 0.0–2.5
Fair0.5–1.00.5–1.02.5–5.0
Good1.0–2.01.0–2.05.0–10.0
Very good>2.0>2.0>100.0
Table 5. Results of Rock-Eval analysis of the mudrock and sandstone samples from the Bredasdorp Basin.
Sample IDBoreholeLithologyDepth (m)LECO
TOC
(w%)
S1
(mgHC/g)
S2
(mgHC/g)
SP = S1+ S2
(mgHC/g)
S3(mgCO2/g) Tmax   ( ) Calculated
% R
(RE Tmax)
HI
(S2 × 100/TOC)
OI
(S3 × 100/TOC)
S2/S3 Conc.
(mg HC/mg CO2)
S1/TOC
Norm. Oil Content
Production Index
(S1/(S1 + S2))
3E-AH1Shale2480.001.450.453.824.270.304310.602632113310.11
6E-AH1Shale2484.001.600.443.634.070.244320.622271515280.11
11E-AJ1Sandstone2694.071.780.491.051.540.504630.7159282280.32
13E-AJ1Mudstone2700.103.070.463.013.470.234601.1298713150.13
14E-AJ1Mudstone2707.003.760.573.403.970.234631.1790615180.16
19E-AJ1Sandstone2728.002.590.440.901.340.554490.9235212170.33
27E-AJ1Sandstone2976.297.031.443.004.440.744400.7643114200.32
30E-AJ1Mudstone2981.004.850.782.963.740.334611.146179160.21
33E-AJ1Shale3039.104.361.184.345.520.354510.96100812270.21
34E-BA1Mudstone2828.051.660.581.001.580.224400.7660135350.37
44E-BA1Mudstone2848.000.980.290.500.790.274490.9251282300.37
46E-BB1Mudstone2541.060.580.150.170.320.214300.5830371260.47
48E-BB1Shale2549.906.481.354.555.900.264370.7170418210.23
53E-BB1Sandstone2662.461.920.351.261.610.244410.7866135180.22
55E-BB1Mudstone2667.002.720.461.852.310.214430.816889170.20
56E-BB1Sandstone2720.906.540.812.363.170.404450.853666120.26
57E-BB1Mudstone2722.935.190.623.183.800.514450.8561106120.16
59E-BB1Mudstone2872.855.370.863.964.820.194460.8774421160.18
65E-BB1Mudstone3283.531.610.952.813.760.174460.871751117590.25
72E-BB1Mudstone3291.861.920.520.881.400.494470.8946262270.37
73E-D3Mudstone3260.901.030.200.420.620.314530.9941301190.32
75E-D3Mudstone3263.601.040.240.410.650.334500.9439321230.37
76E-D3Mudstone3265.500.760.110.230.340.234481.2430301150.32
82E-D3Mudstone3527.660.630.100.150.250.495452.6524780.1160.40
Notes: Calculated values: Ro = (0.0180 × Tmax) – 7.
Table 6. Results of the vitrinite reflectance analysis (calculated and measured) along with the standard deviation and microphotographs (×500, oil immersion, white reflected light unless otherwise indicated; scale bar = 100 µm).
BoreholeDepth (m)Calculated Vitrinite Reflectance
%r
Mean Vitrinite
%r (Measured)
Range of Readings %rStandard DeviationPhotomicrographs of the Dispersed Organic MatterObservations and Maturity Interpretation
E-AH12480.000.600.610.42–0.790.132 Minerals 10 00595 i001
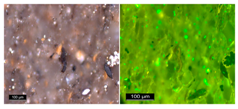
Very small organic fragments interspersed with silicate minerals. Rare fluorescing liptinite fragments were determined.
The sample is mature.
E-AH12484.000.620.680.38–0.980.177 Minerals 10 00595 i002Small vitrinite fragments and liptinite observed.
The sample is mature.
E-AJ12694.070.710.600.50–0.690.073 Minerals 10 00595 i003
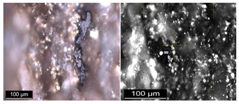
Small vitrinite fragments and liptinite observed. Occasional, large pieces of organic matter.
The sample is mature.
E-AJ12700.101.120.720.5–1.000.132 Minerals 10 00595 i004Distinct band of organic matter like fusinite and semifusinite band, not fragmented, but cracked. Vitrinite particles were limited, and those measured provided low values.
The sample is mature.
E-AJ12707.001.170.810.6–1.020.117 Minerals 10 00595 i005Vitrinite and liptinite observed, and alteration minerals, with lots of organic fragments and framboidal pyrite bands.
The sample is mature.
E-AJ12728.000.920.850.65–1.050.105 Minerals 10 00595 i006Narrow strip of coal in the sample block. The coal was dominated by altered organic matter. Rare vitrinite was embedded in the altered organic material. Zircons were observed as well as large pyrite.
The sample is mature.
E-AJ12976.290.760.880.66–1.070.14 Minerals 10 00595 i007Mostly quartz with stingers of organic matter and darker vitrinite bands between inertinite bands.
The sample is mature.
E-AJ12981.001.140.880.65–1.100.125 Minerals 10 00595 i008Very thin dark organic bands, with less organic matter compared to other samples. Fusinite and vitrinite particles are obvious.
The sample is mature.
E-AJ13039.100.960.900.60–1.200.155 Minerals 10 00595 i009Lots of large vitrinite bands and large fusinite packed into a thin band in the sample.
The sample is mature.
E-BA12828.050.760.750.40–1.090.181 Minerals 10 00595 i010
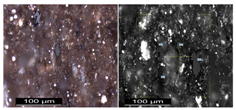
The sample contains a high proportion of vitrinite fragments, and framboidal pyrite band.
The sample is mature.
E-BB12667.000.810.760.46–1.060.122 Minerals 10 00595 i011
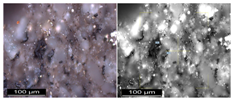
Lots of fragmented organic matter observed and few vitrinite particles.
The sample is mature.
E-BB12541.060.710.780.55–1.000.092 Minerals 10 00595 i012
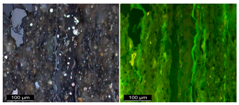
Vitrinite and liptinite were observed and limited pyrite.
The sample is mature.
E-BB12720.900.850.780.55–1.000.105 Minerals 10 00595 i013
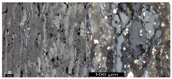
Distinct organic matter bands and vitrinite are obvious in the sample.
The sample is mature.
E-BB12722.930.870.780.50–1.050.121 Minerals 10 00595 i014
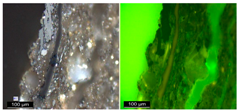
Moderate organic matter, large pieces of liptinite and vitrinite observed.
The sample is mature.
E-BB12872.850.870.790.52–1.060.145 Minerals 10 00595 i015High proportion of suitable vitrinite particles, along with large fusinite particles.
The sample is mature.
E-BB12549.900.850.800.6–1.000.093 Minerals 10 00595 i016
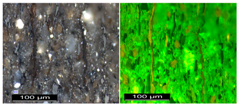
Small vitrinite fragments; liptinite and banded fragments of organic matter were observed.
The sample is mature.
E-BB12662.460.780.820.59–1.050.127 Minerals 10 00595 i017
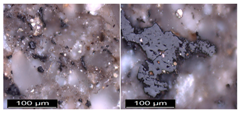
A relatively high proportion of fusinite and vitrinite was observed primarily as very fine fragments compressed between quartz grains.
The sample is mature.
E-BB13291.860.890.960.77–1.150.086 Minerals 10 00595 i018
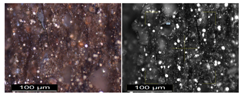
Limited organic matter with lots of fine pyrite.
The sample is mature.
E-D33263.600.940.900.69–1.100.174 Minerals 10 00595 i019
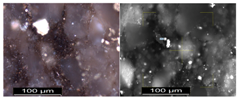
Very fine organic matter dispersed between quartz grains.
The sample is mature.

