Pyrite Textures, Trace Elements and Sulfur Isotope Chemistry of Bijaigarh Shales, Vindhyan Basin, India and Their Implications

 ,
,  , and
, and 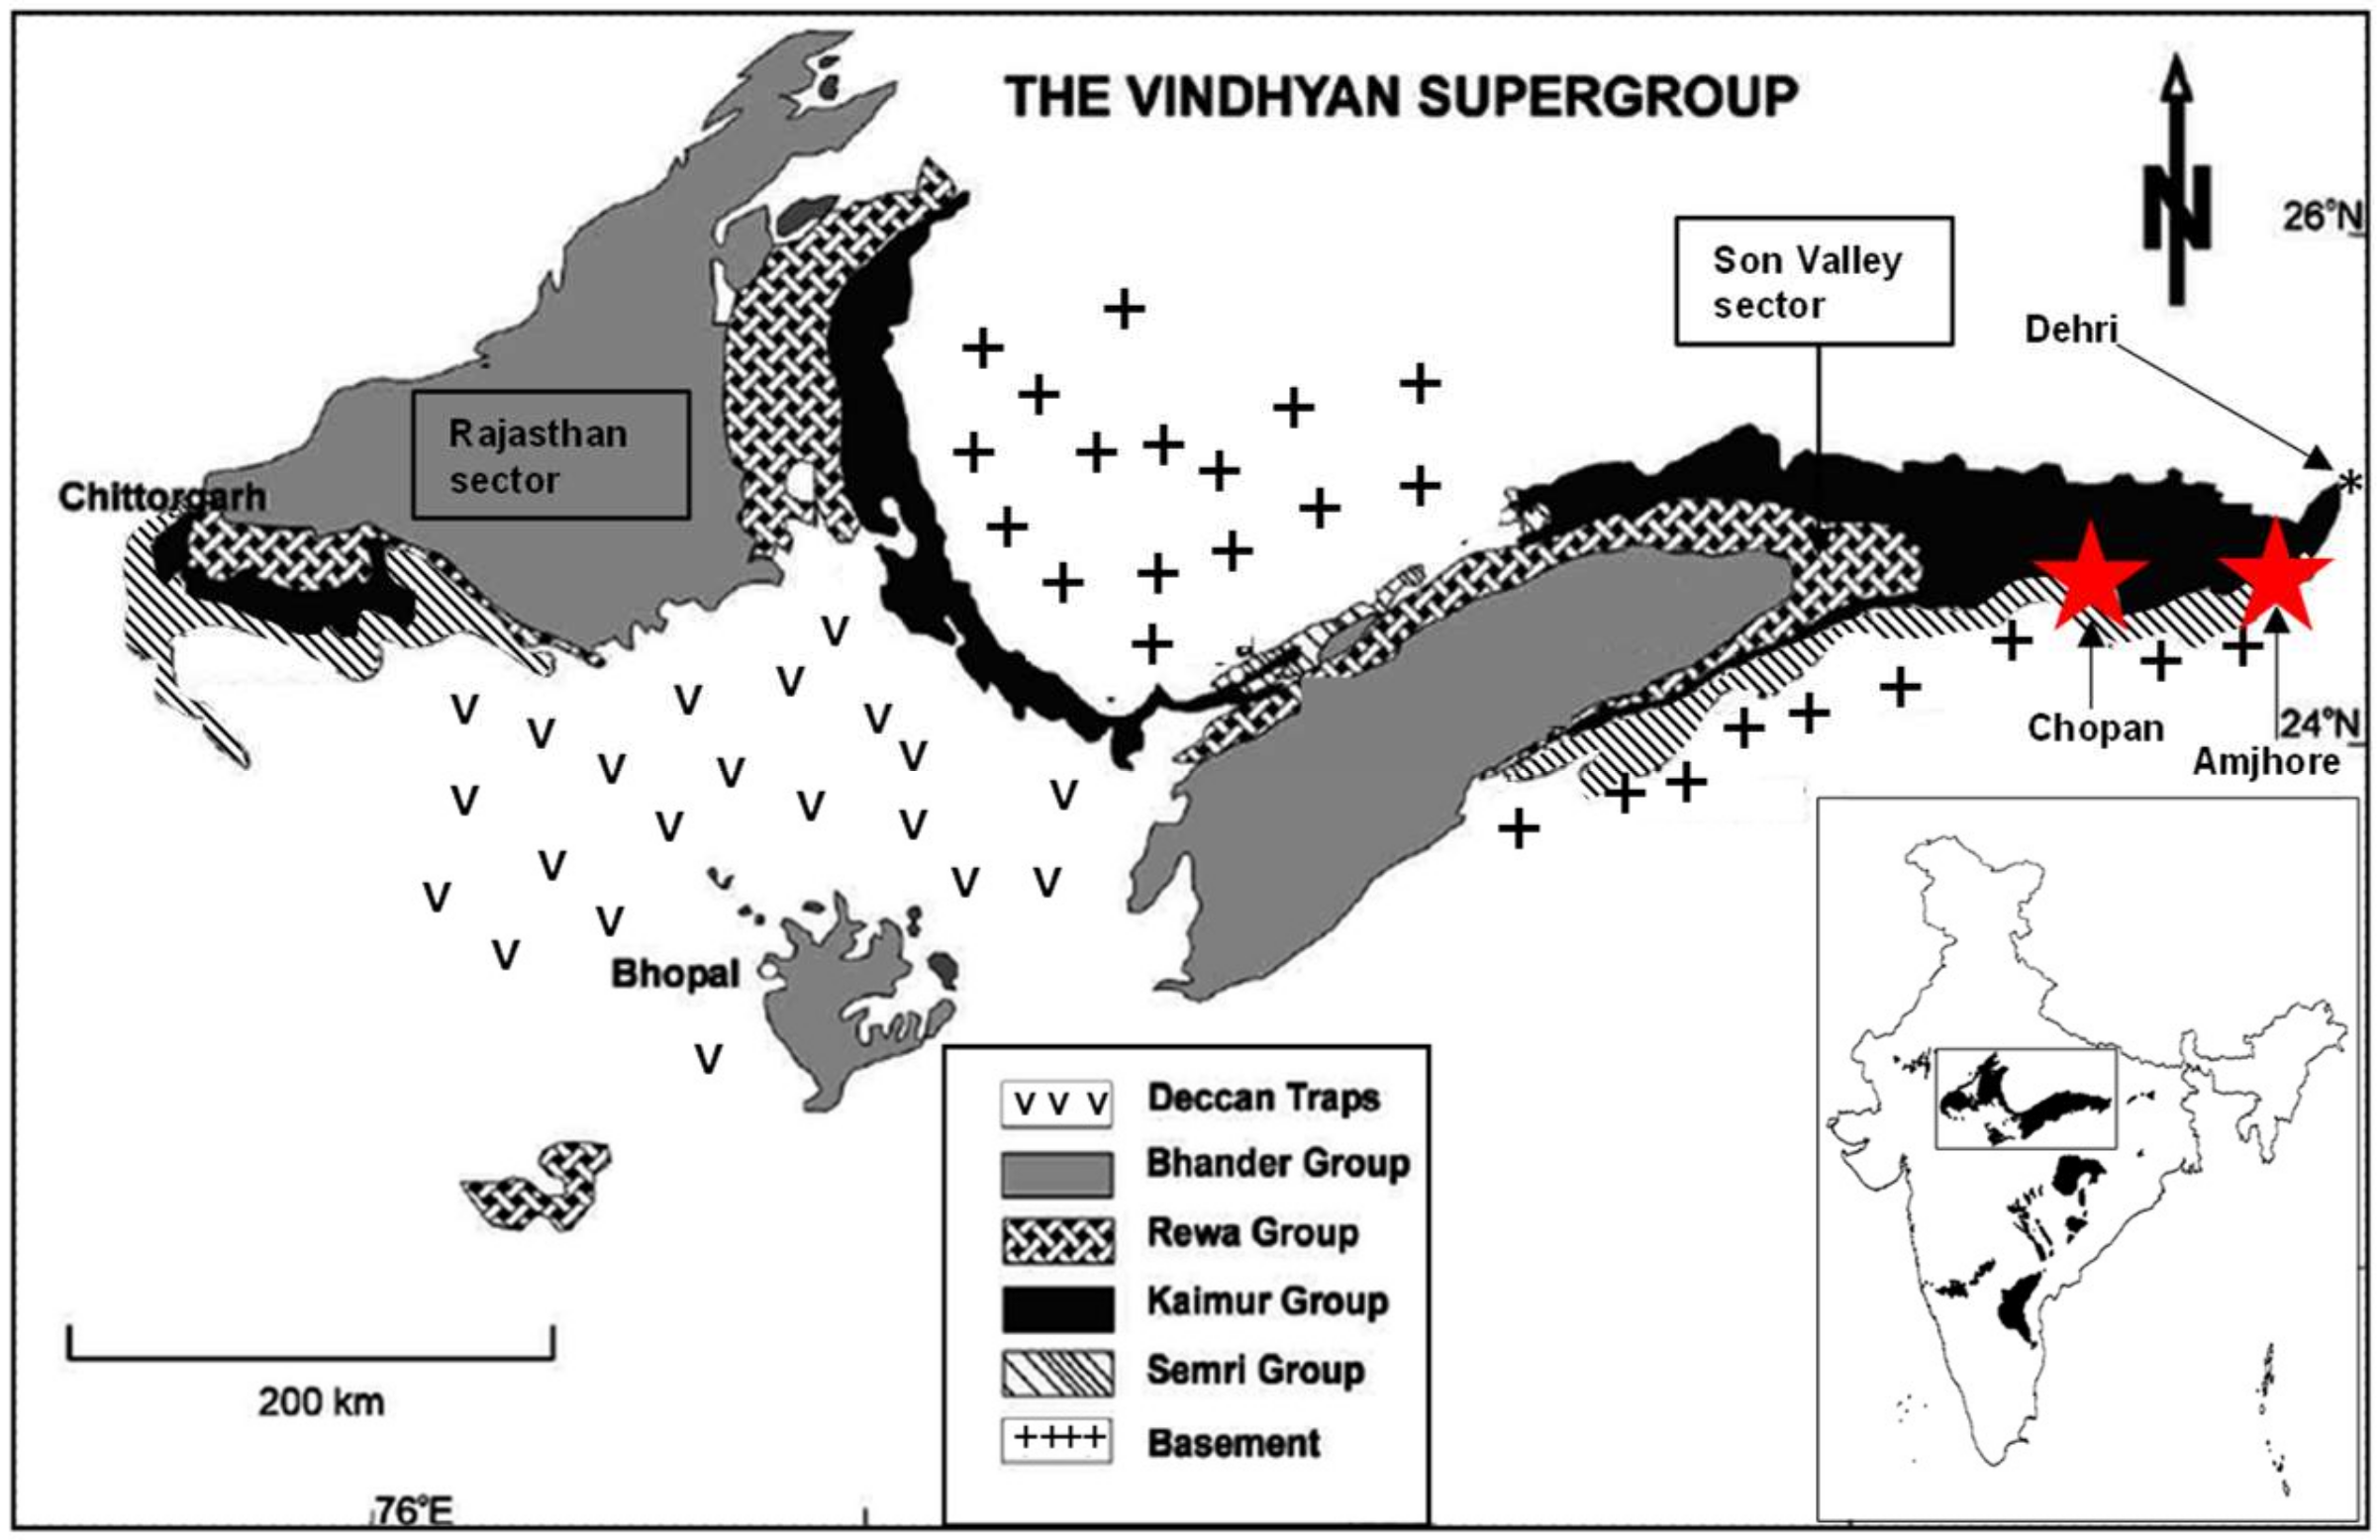
Abstract
1. Introduction
2. Geological Background
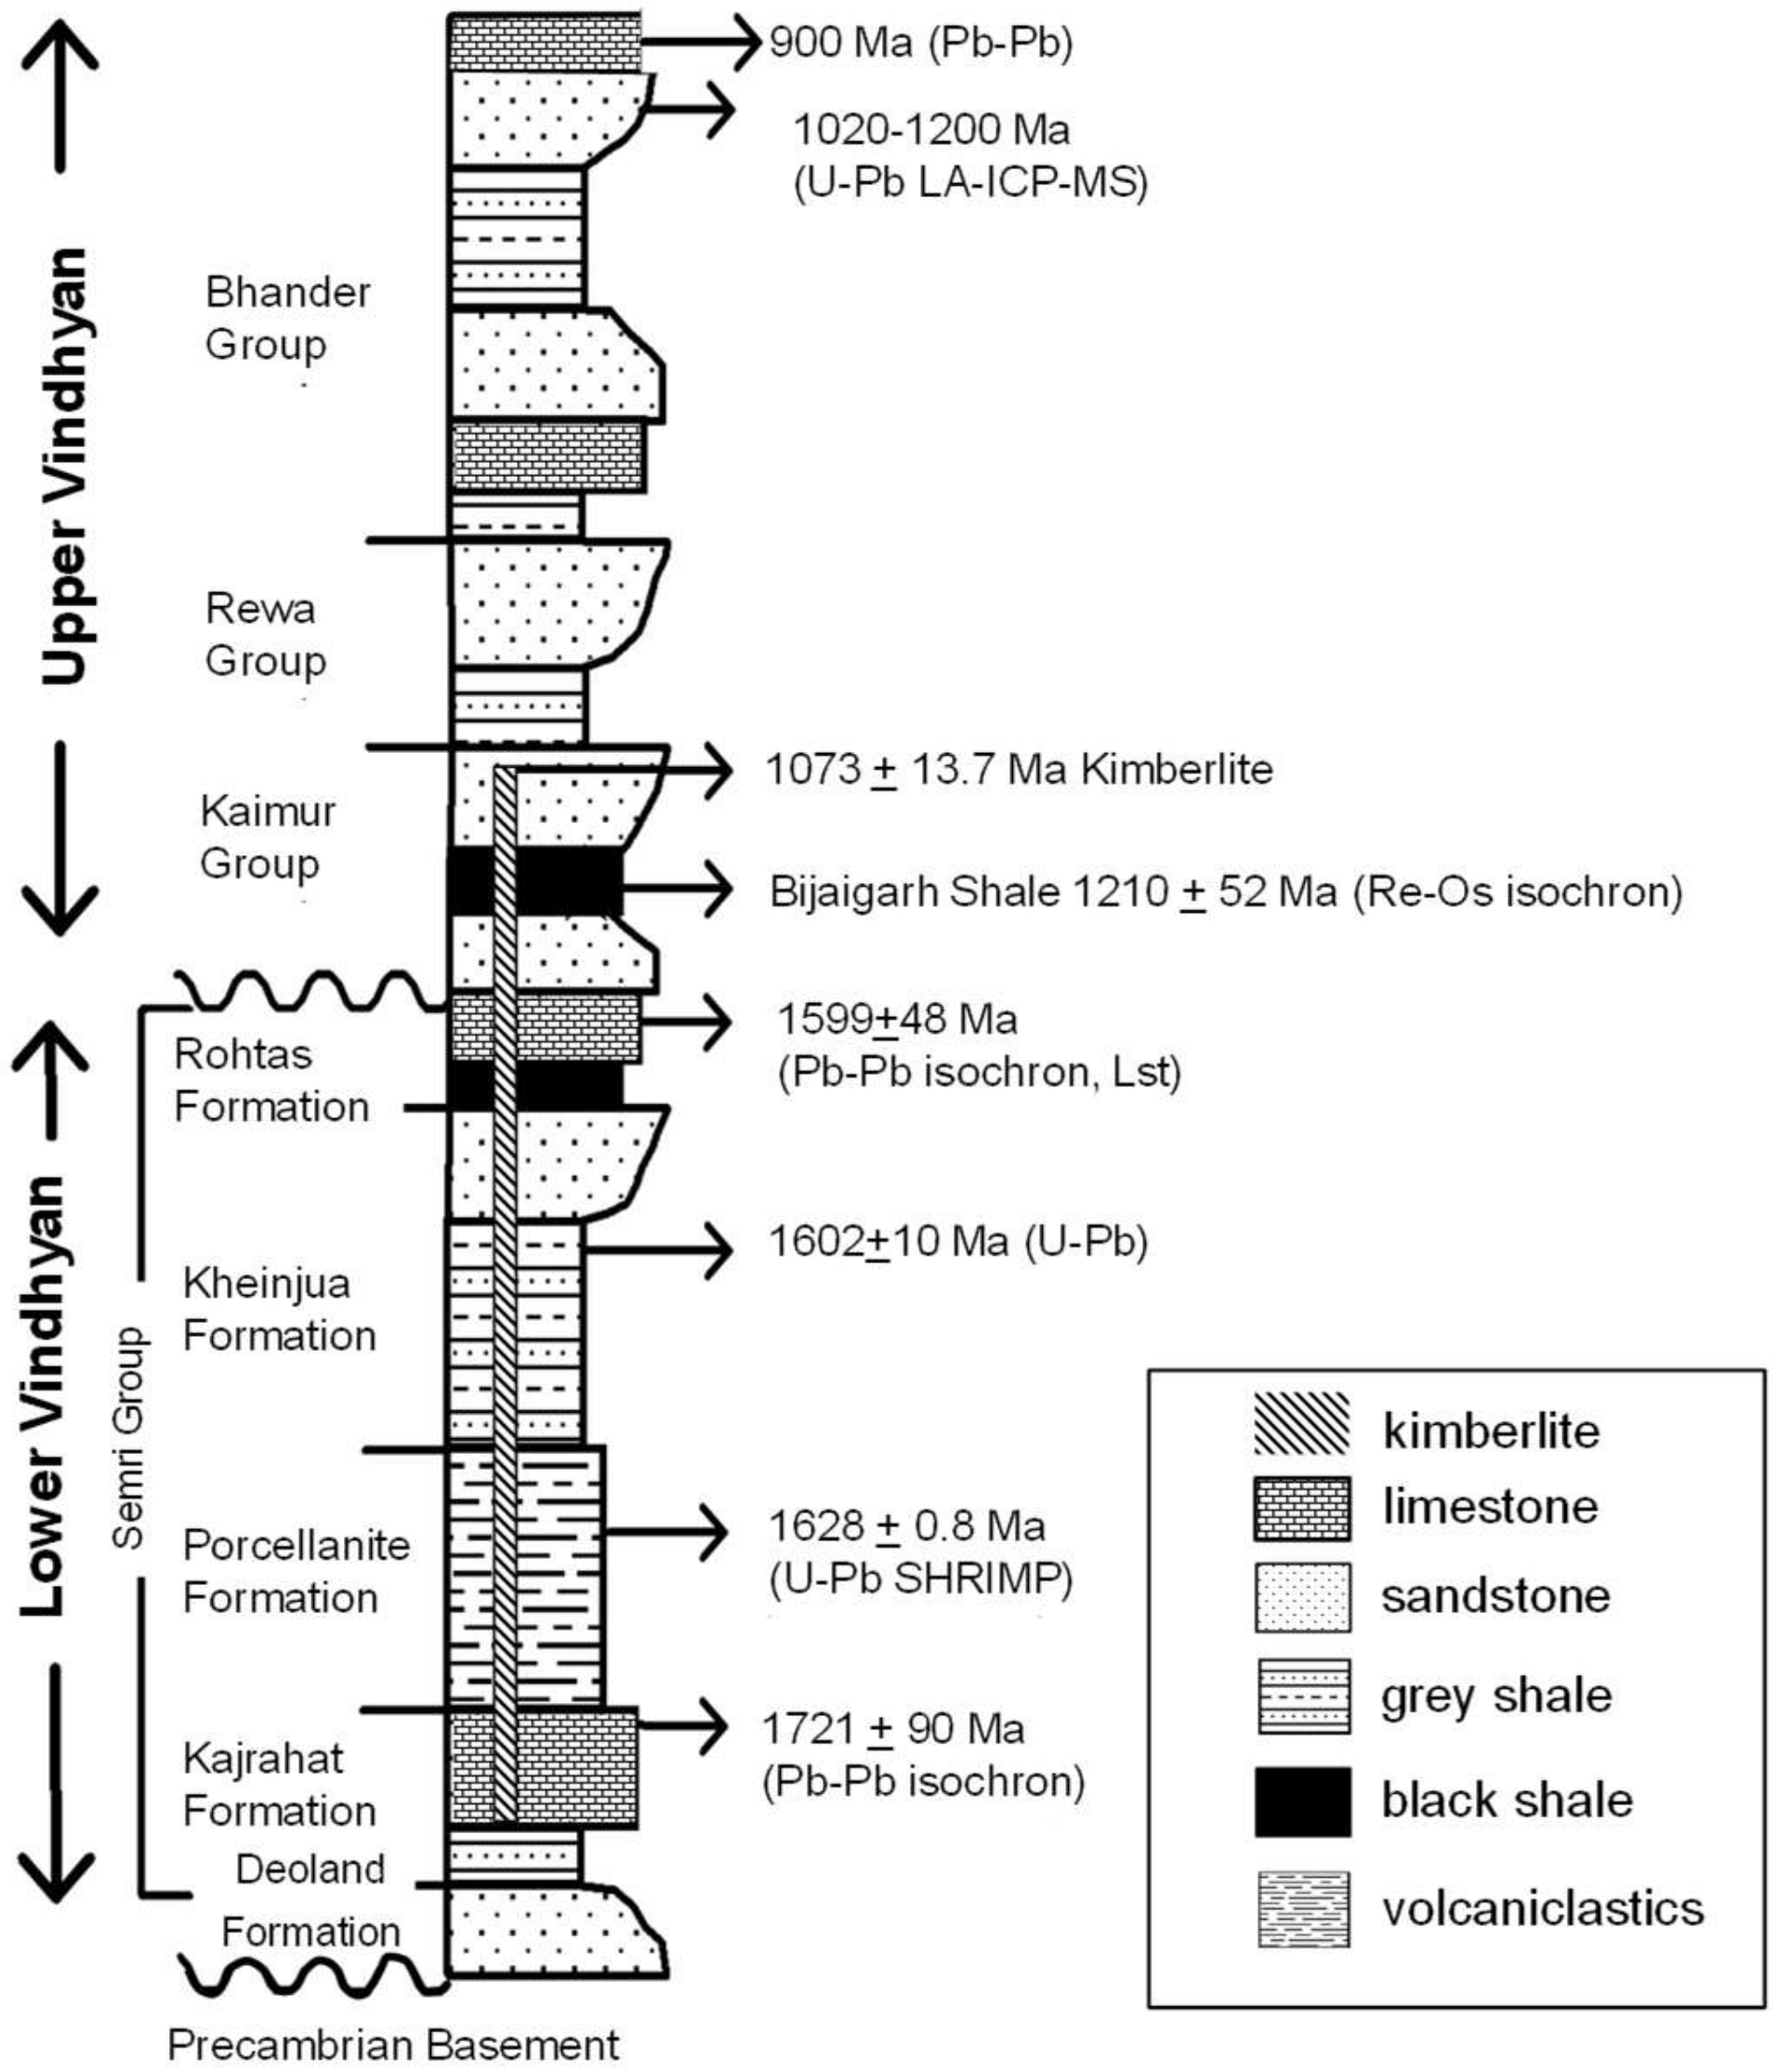
2.1. Stratigraphy and Age
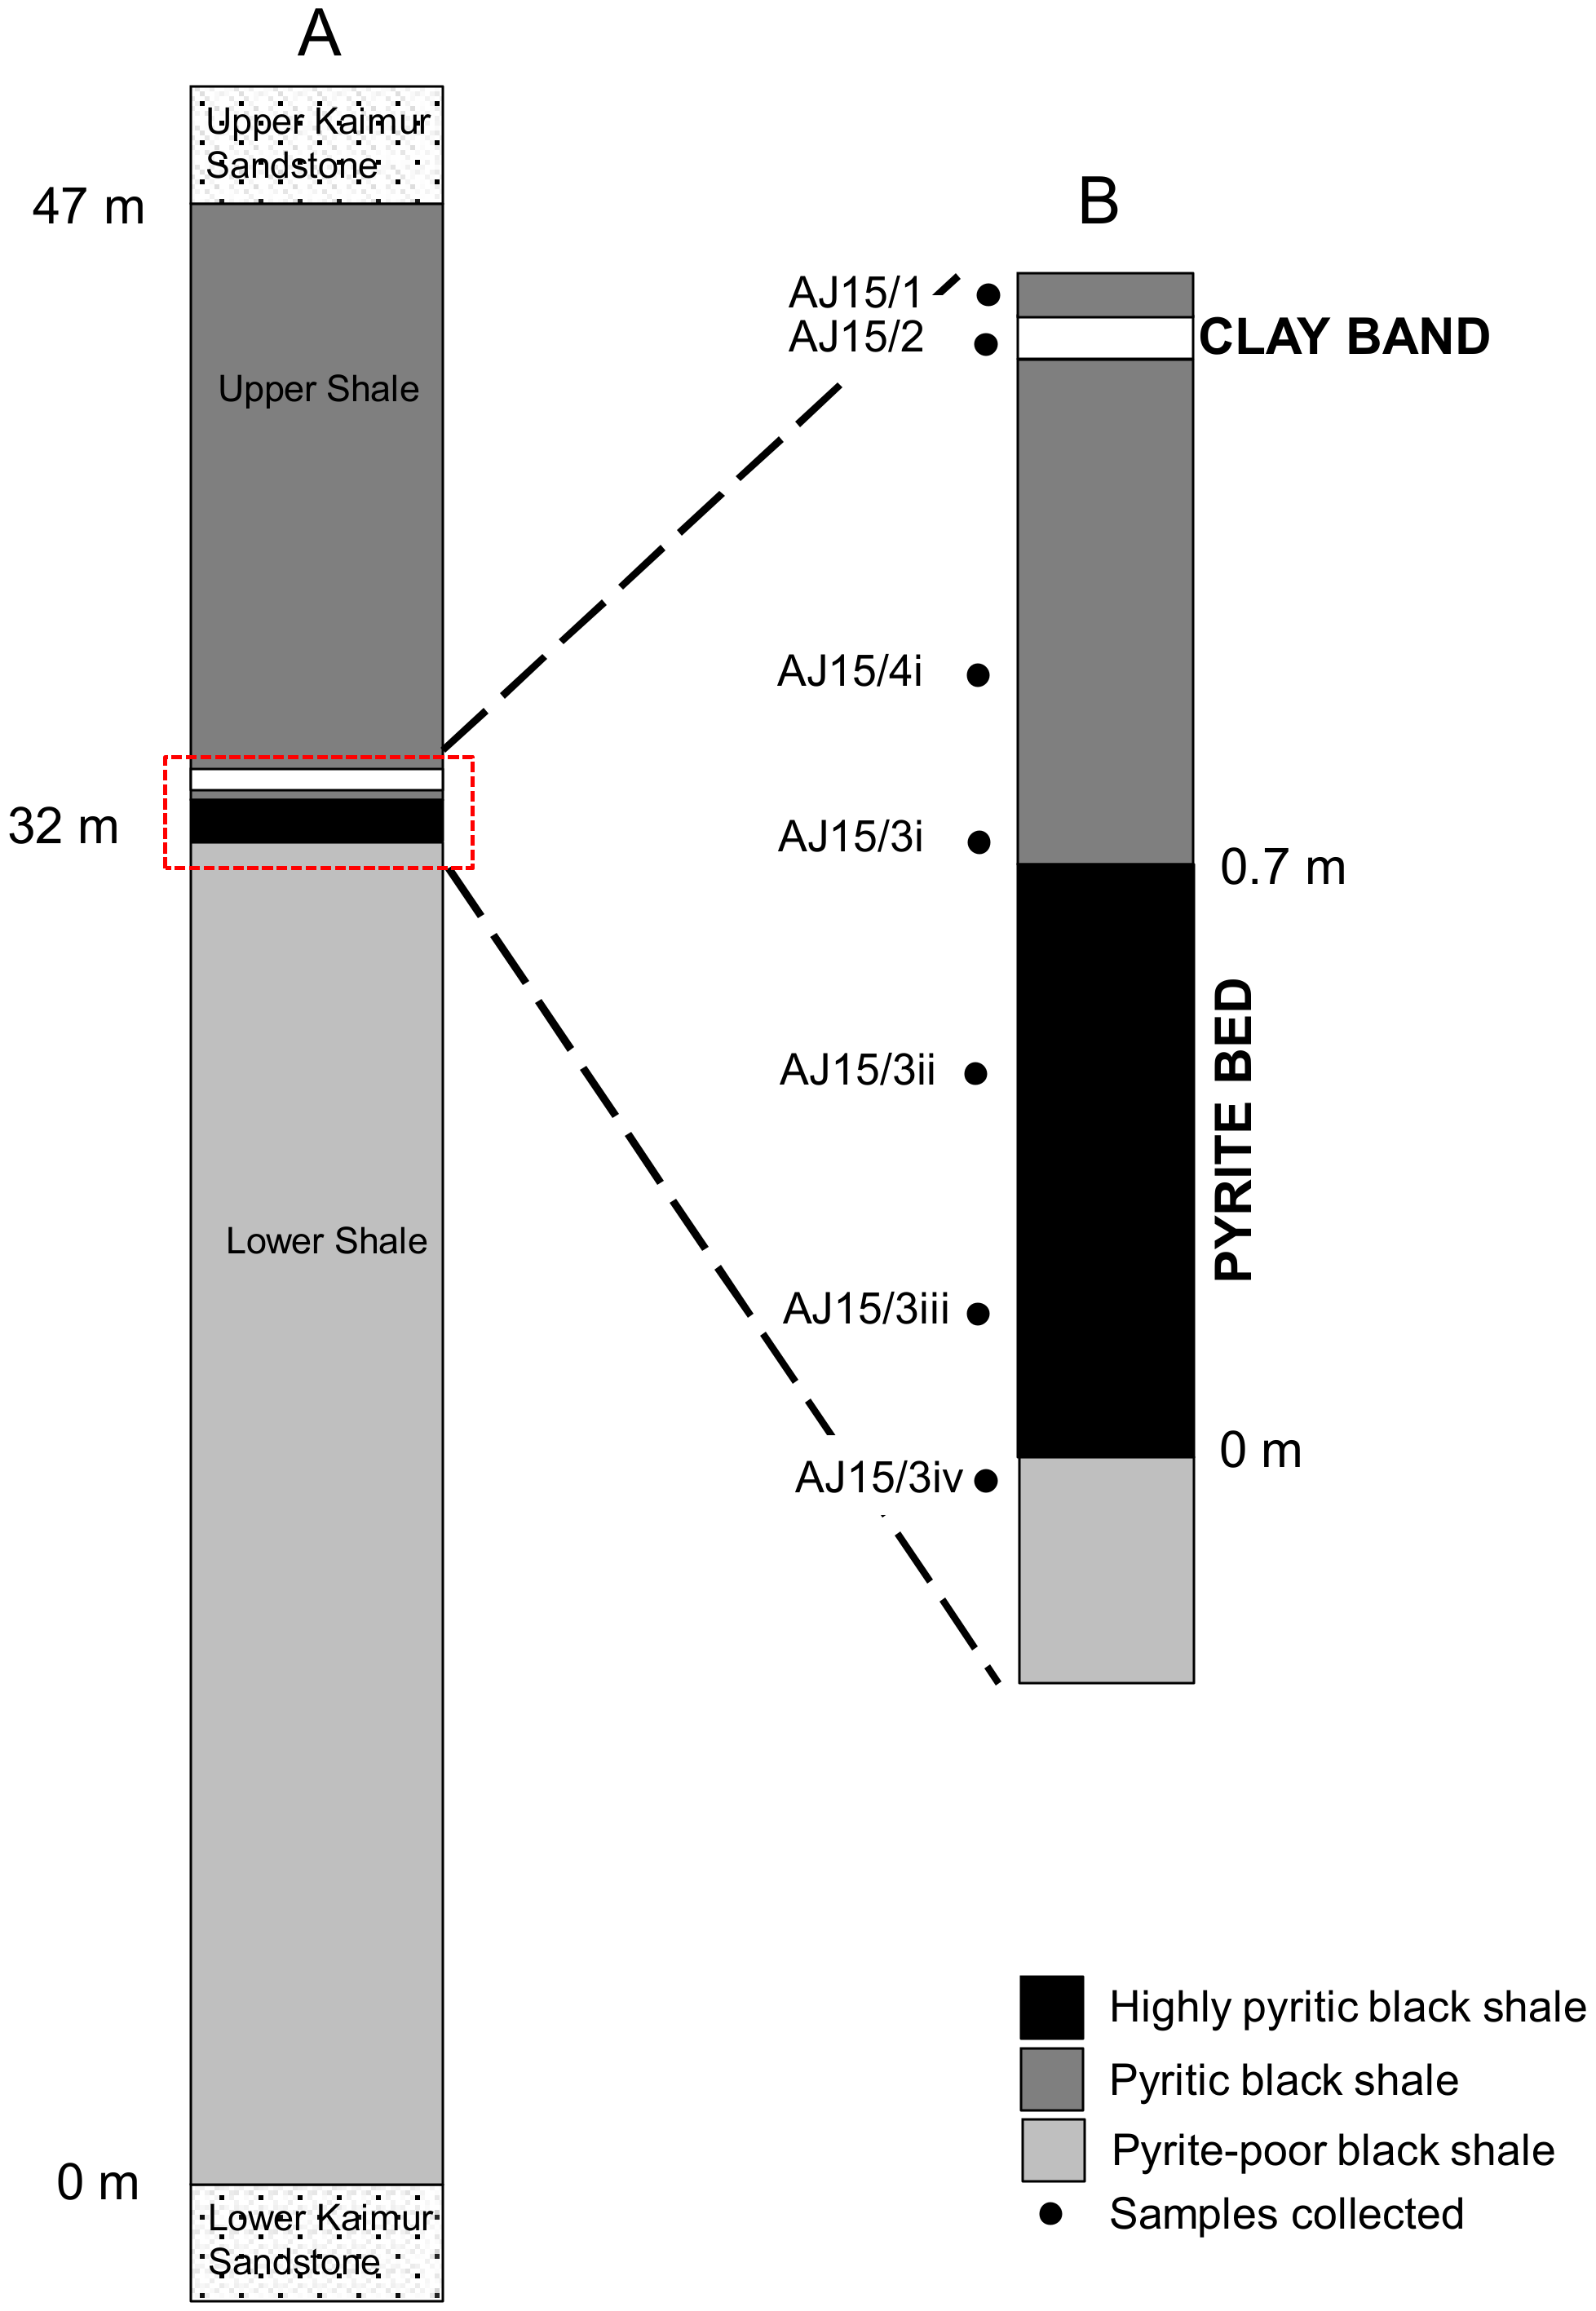
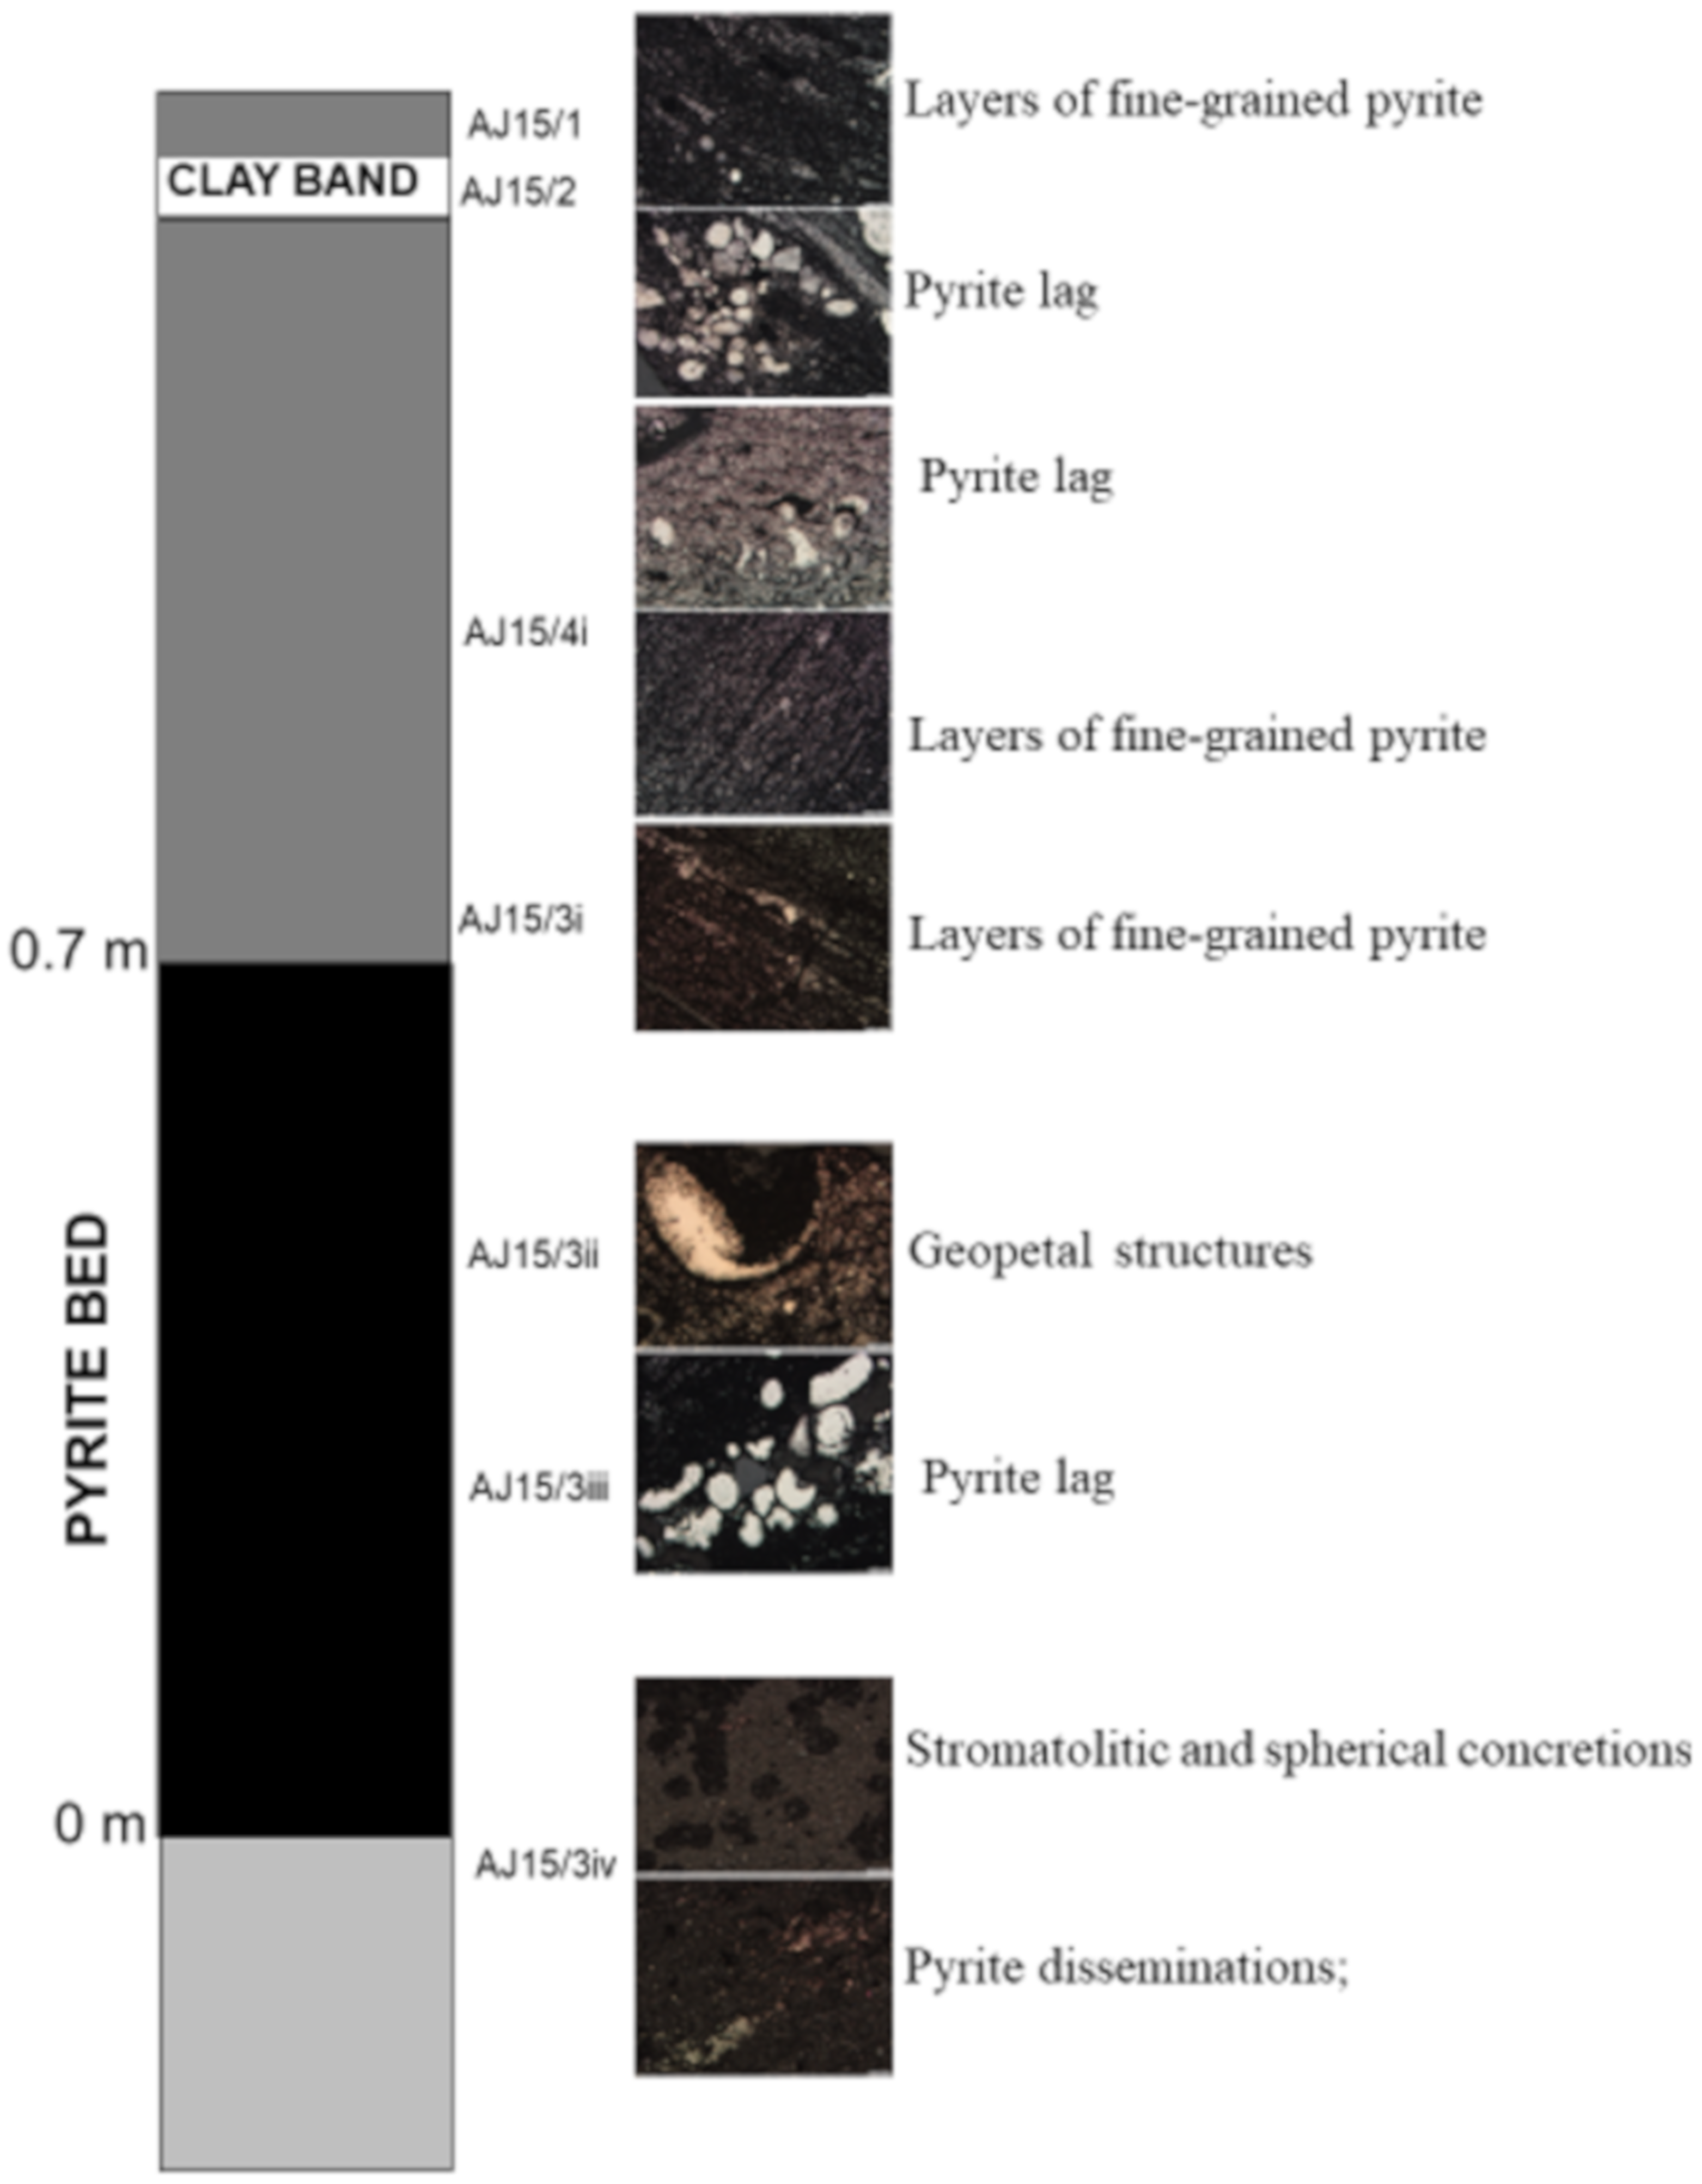
2.2. Bijaigarh Shale
3. Methods
3.1. LA-ICP-MS Pyrite Analyses
3.2. SHRIMP Sulfur Isotopes
4. Results
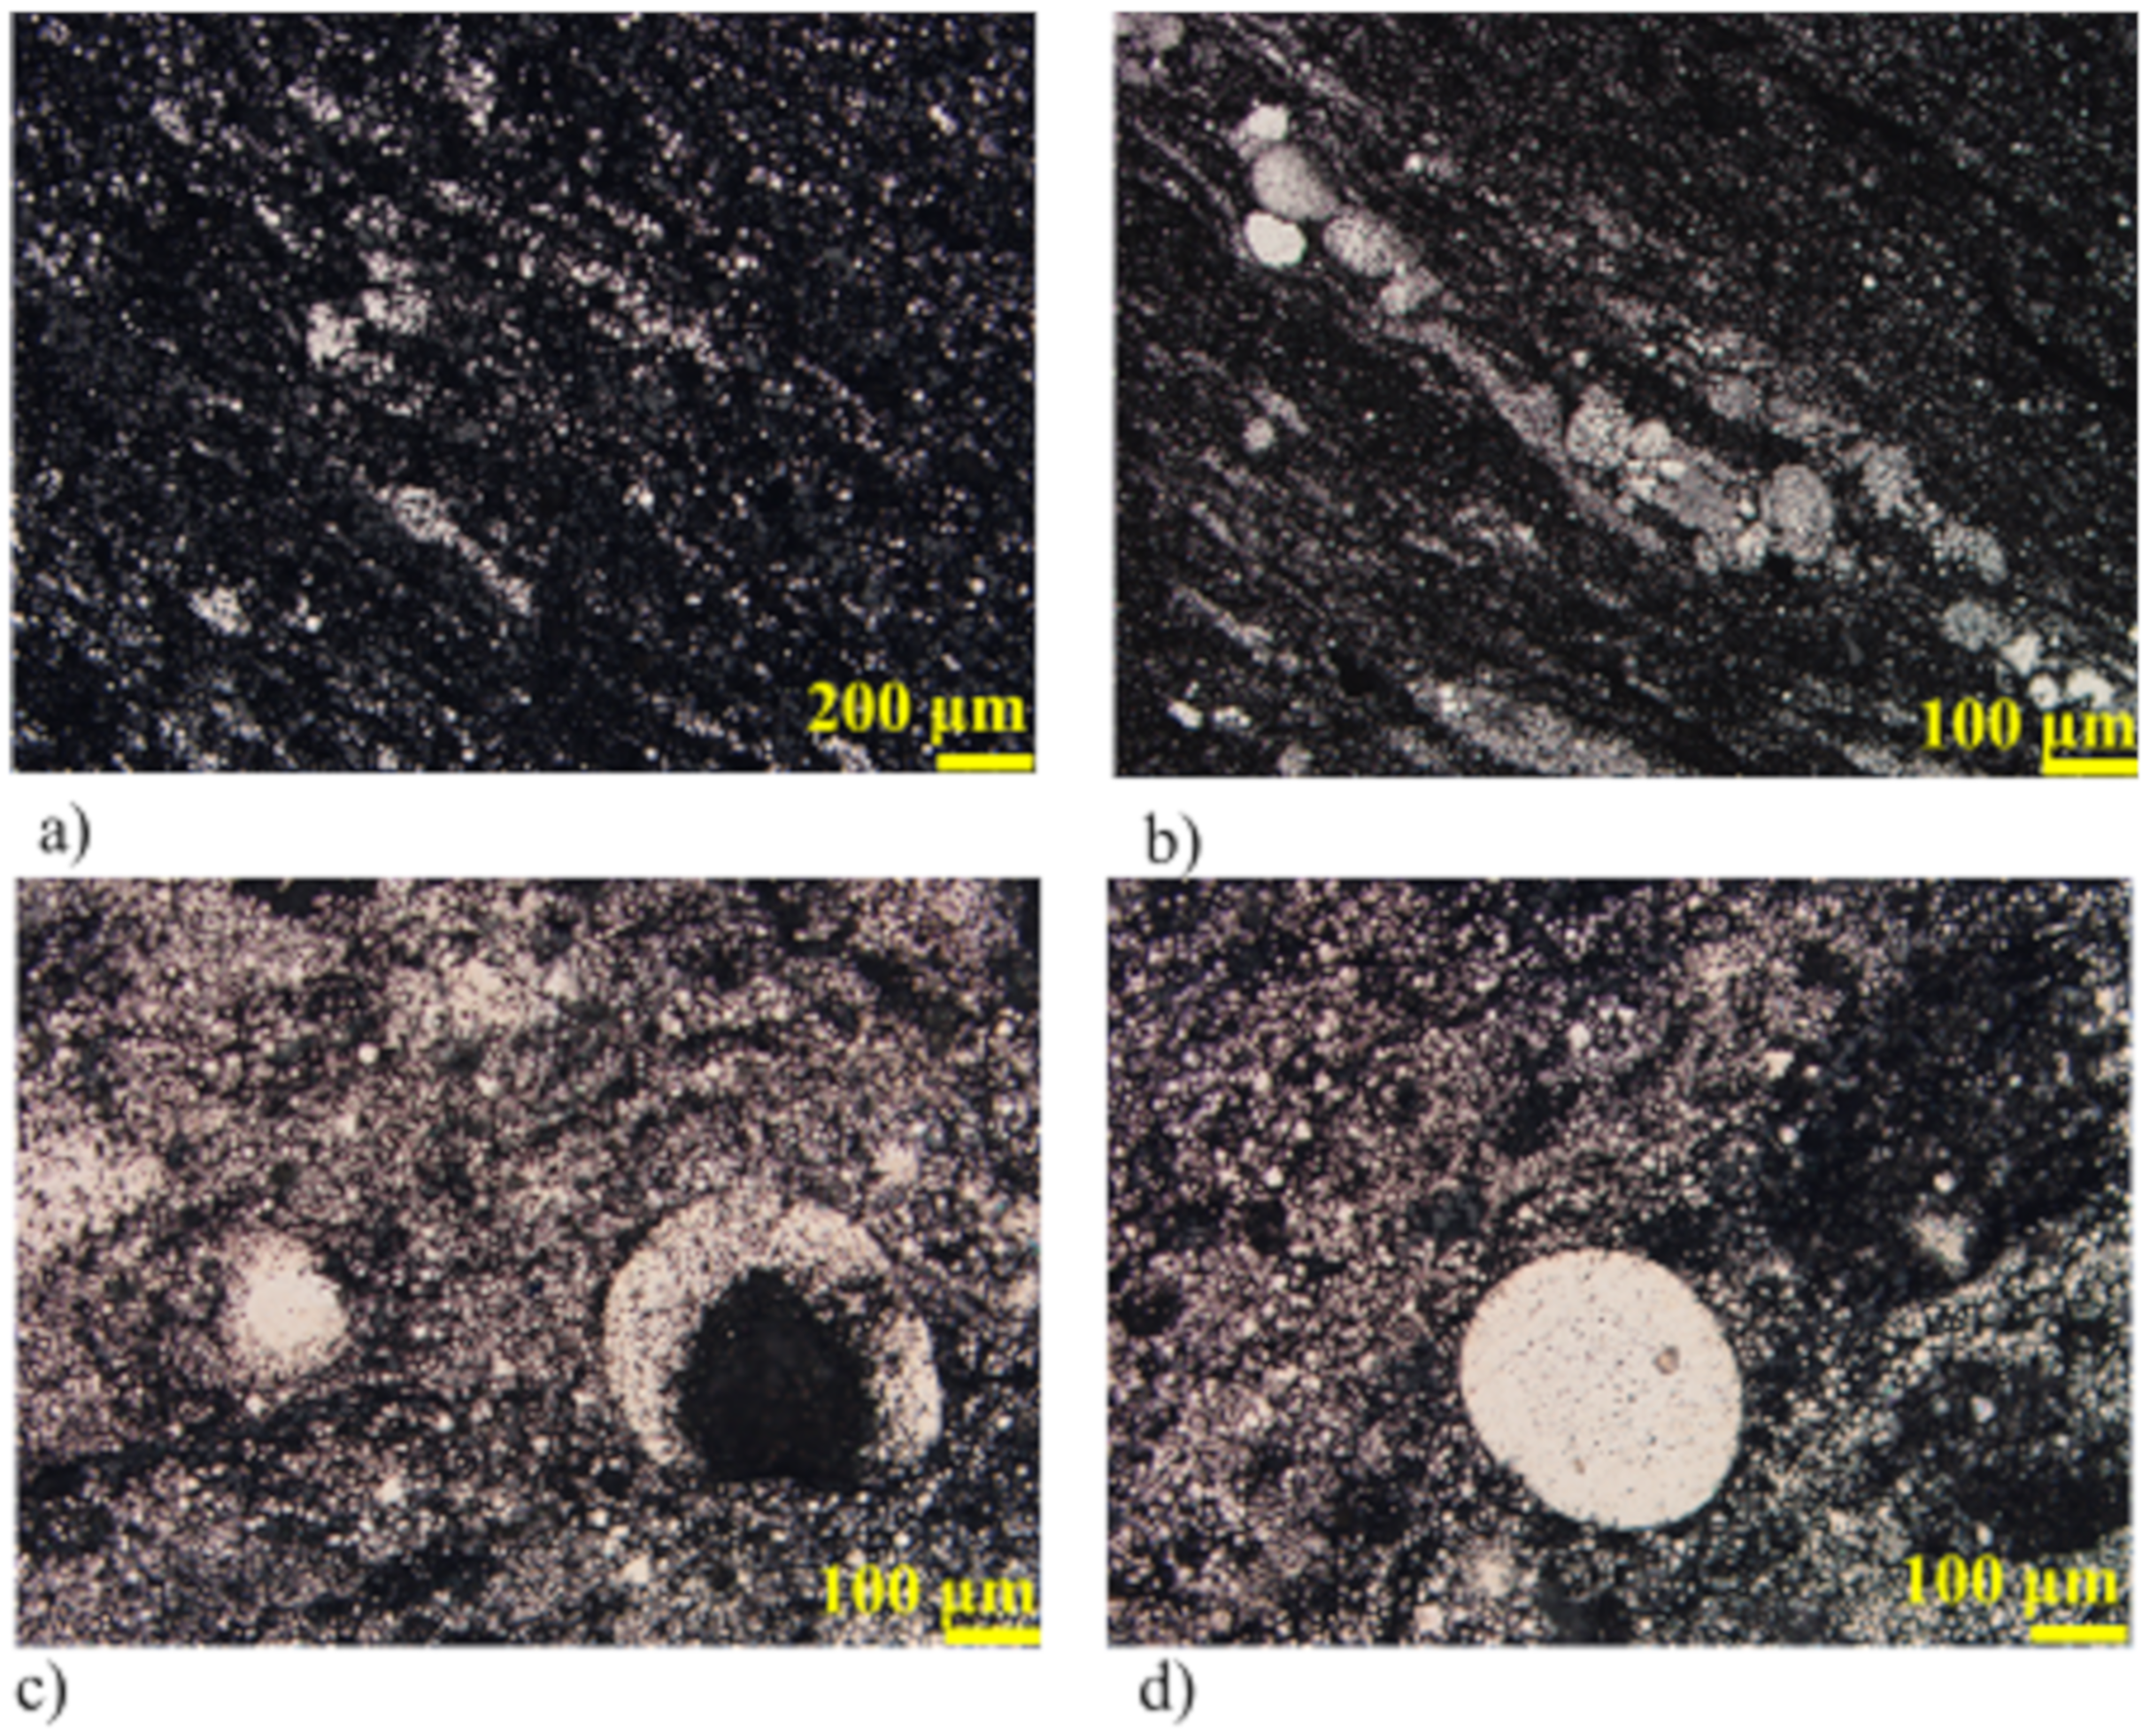
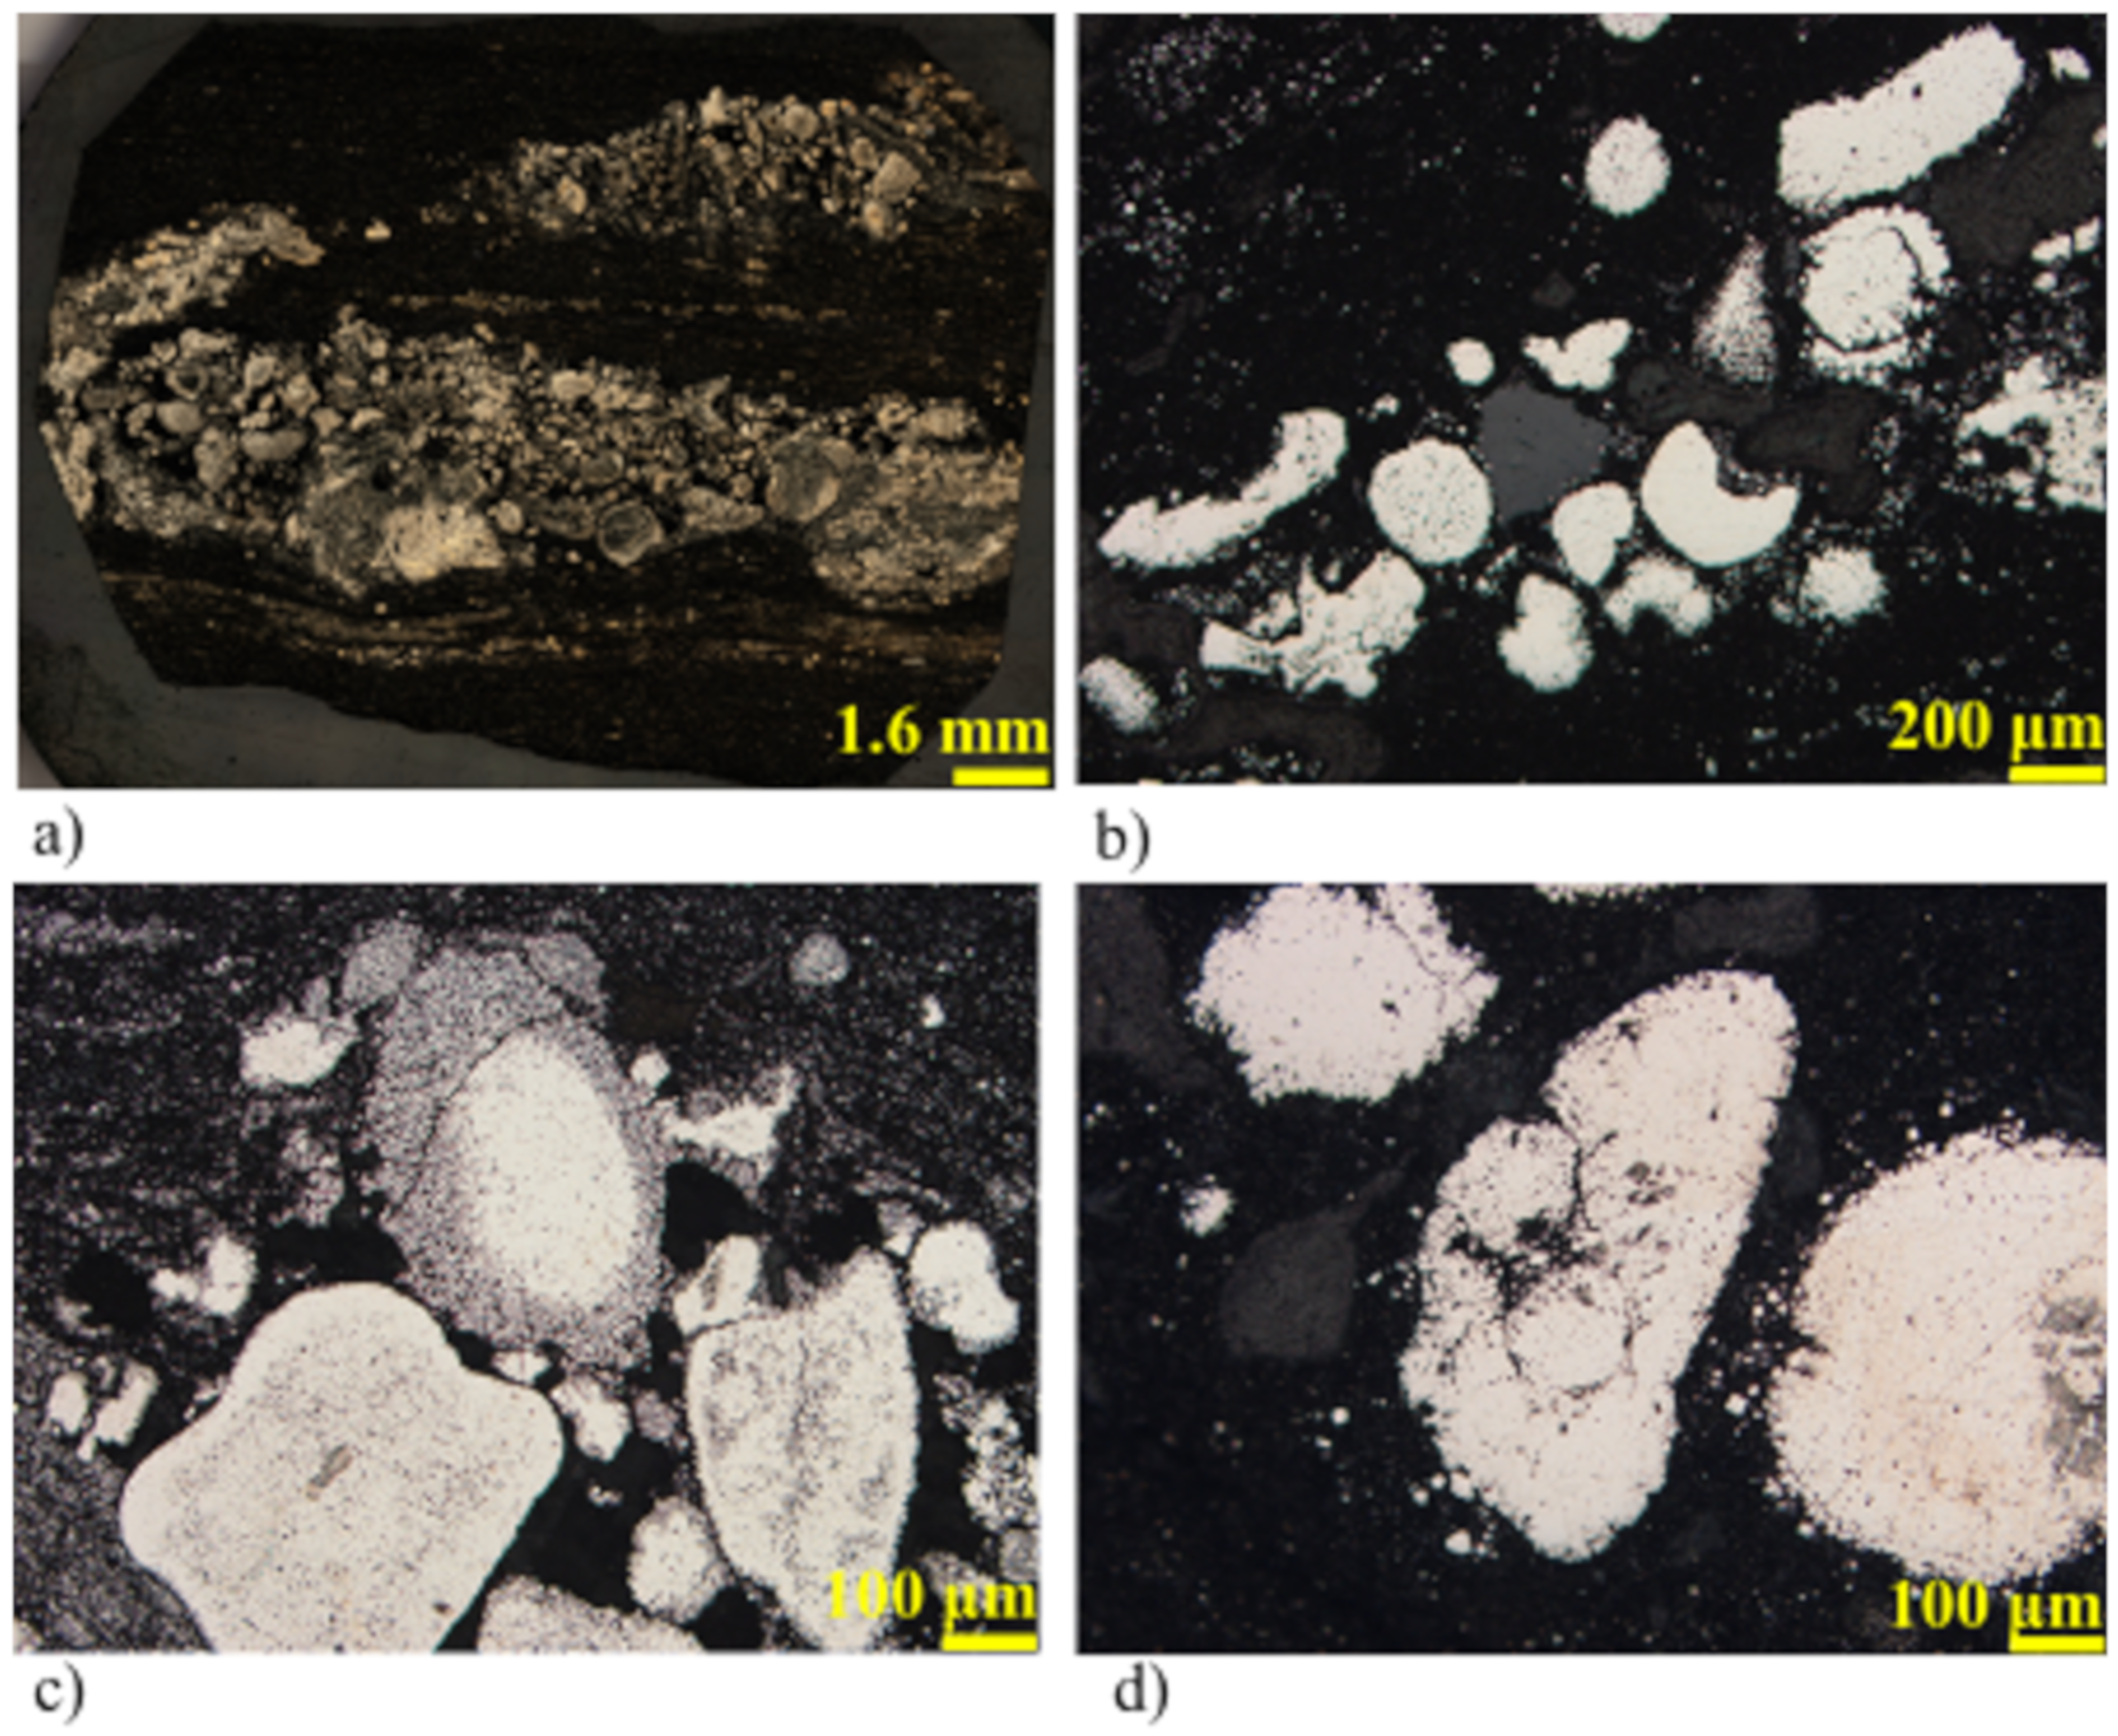
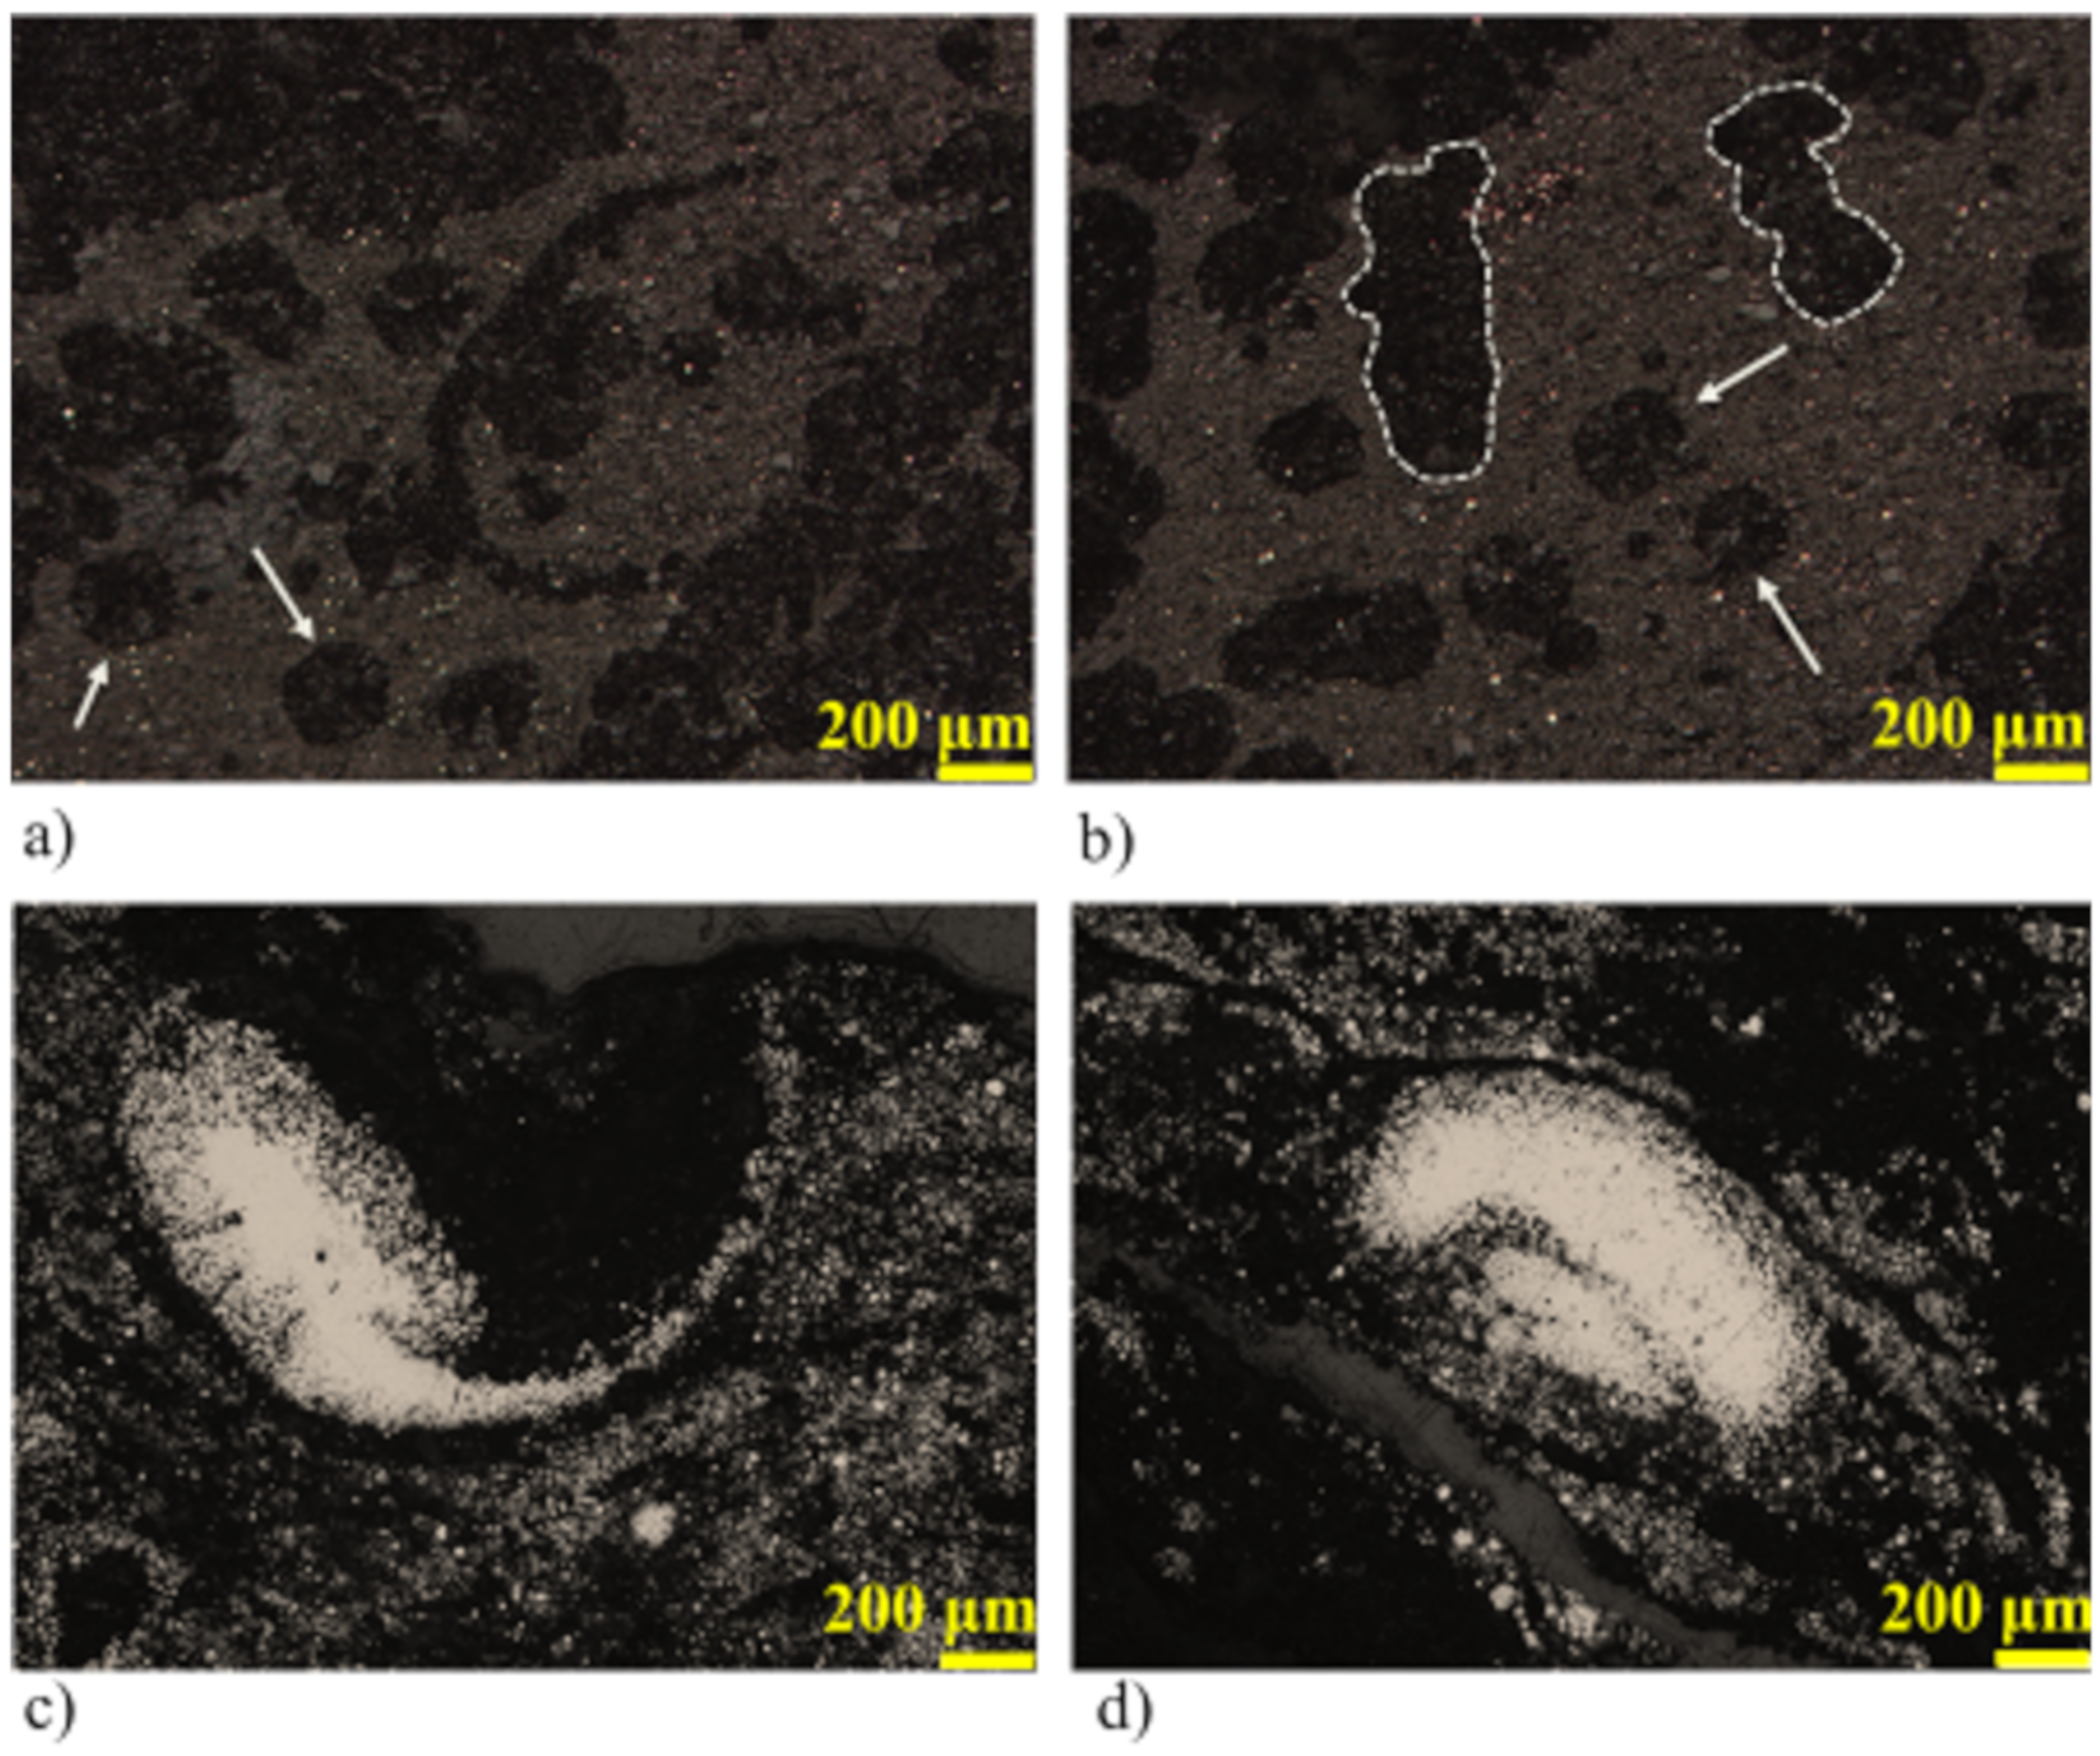
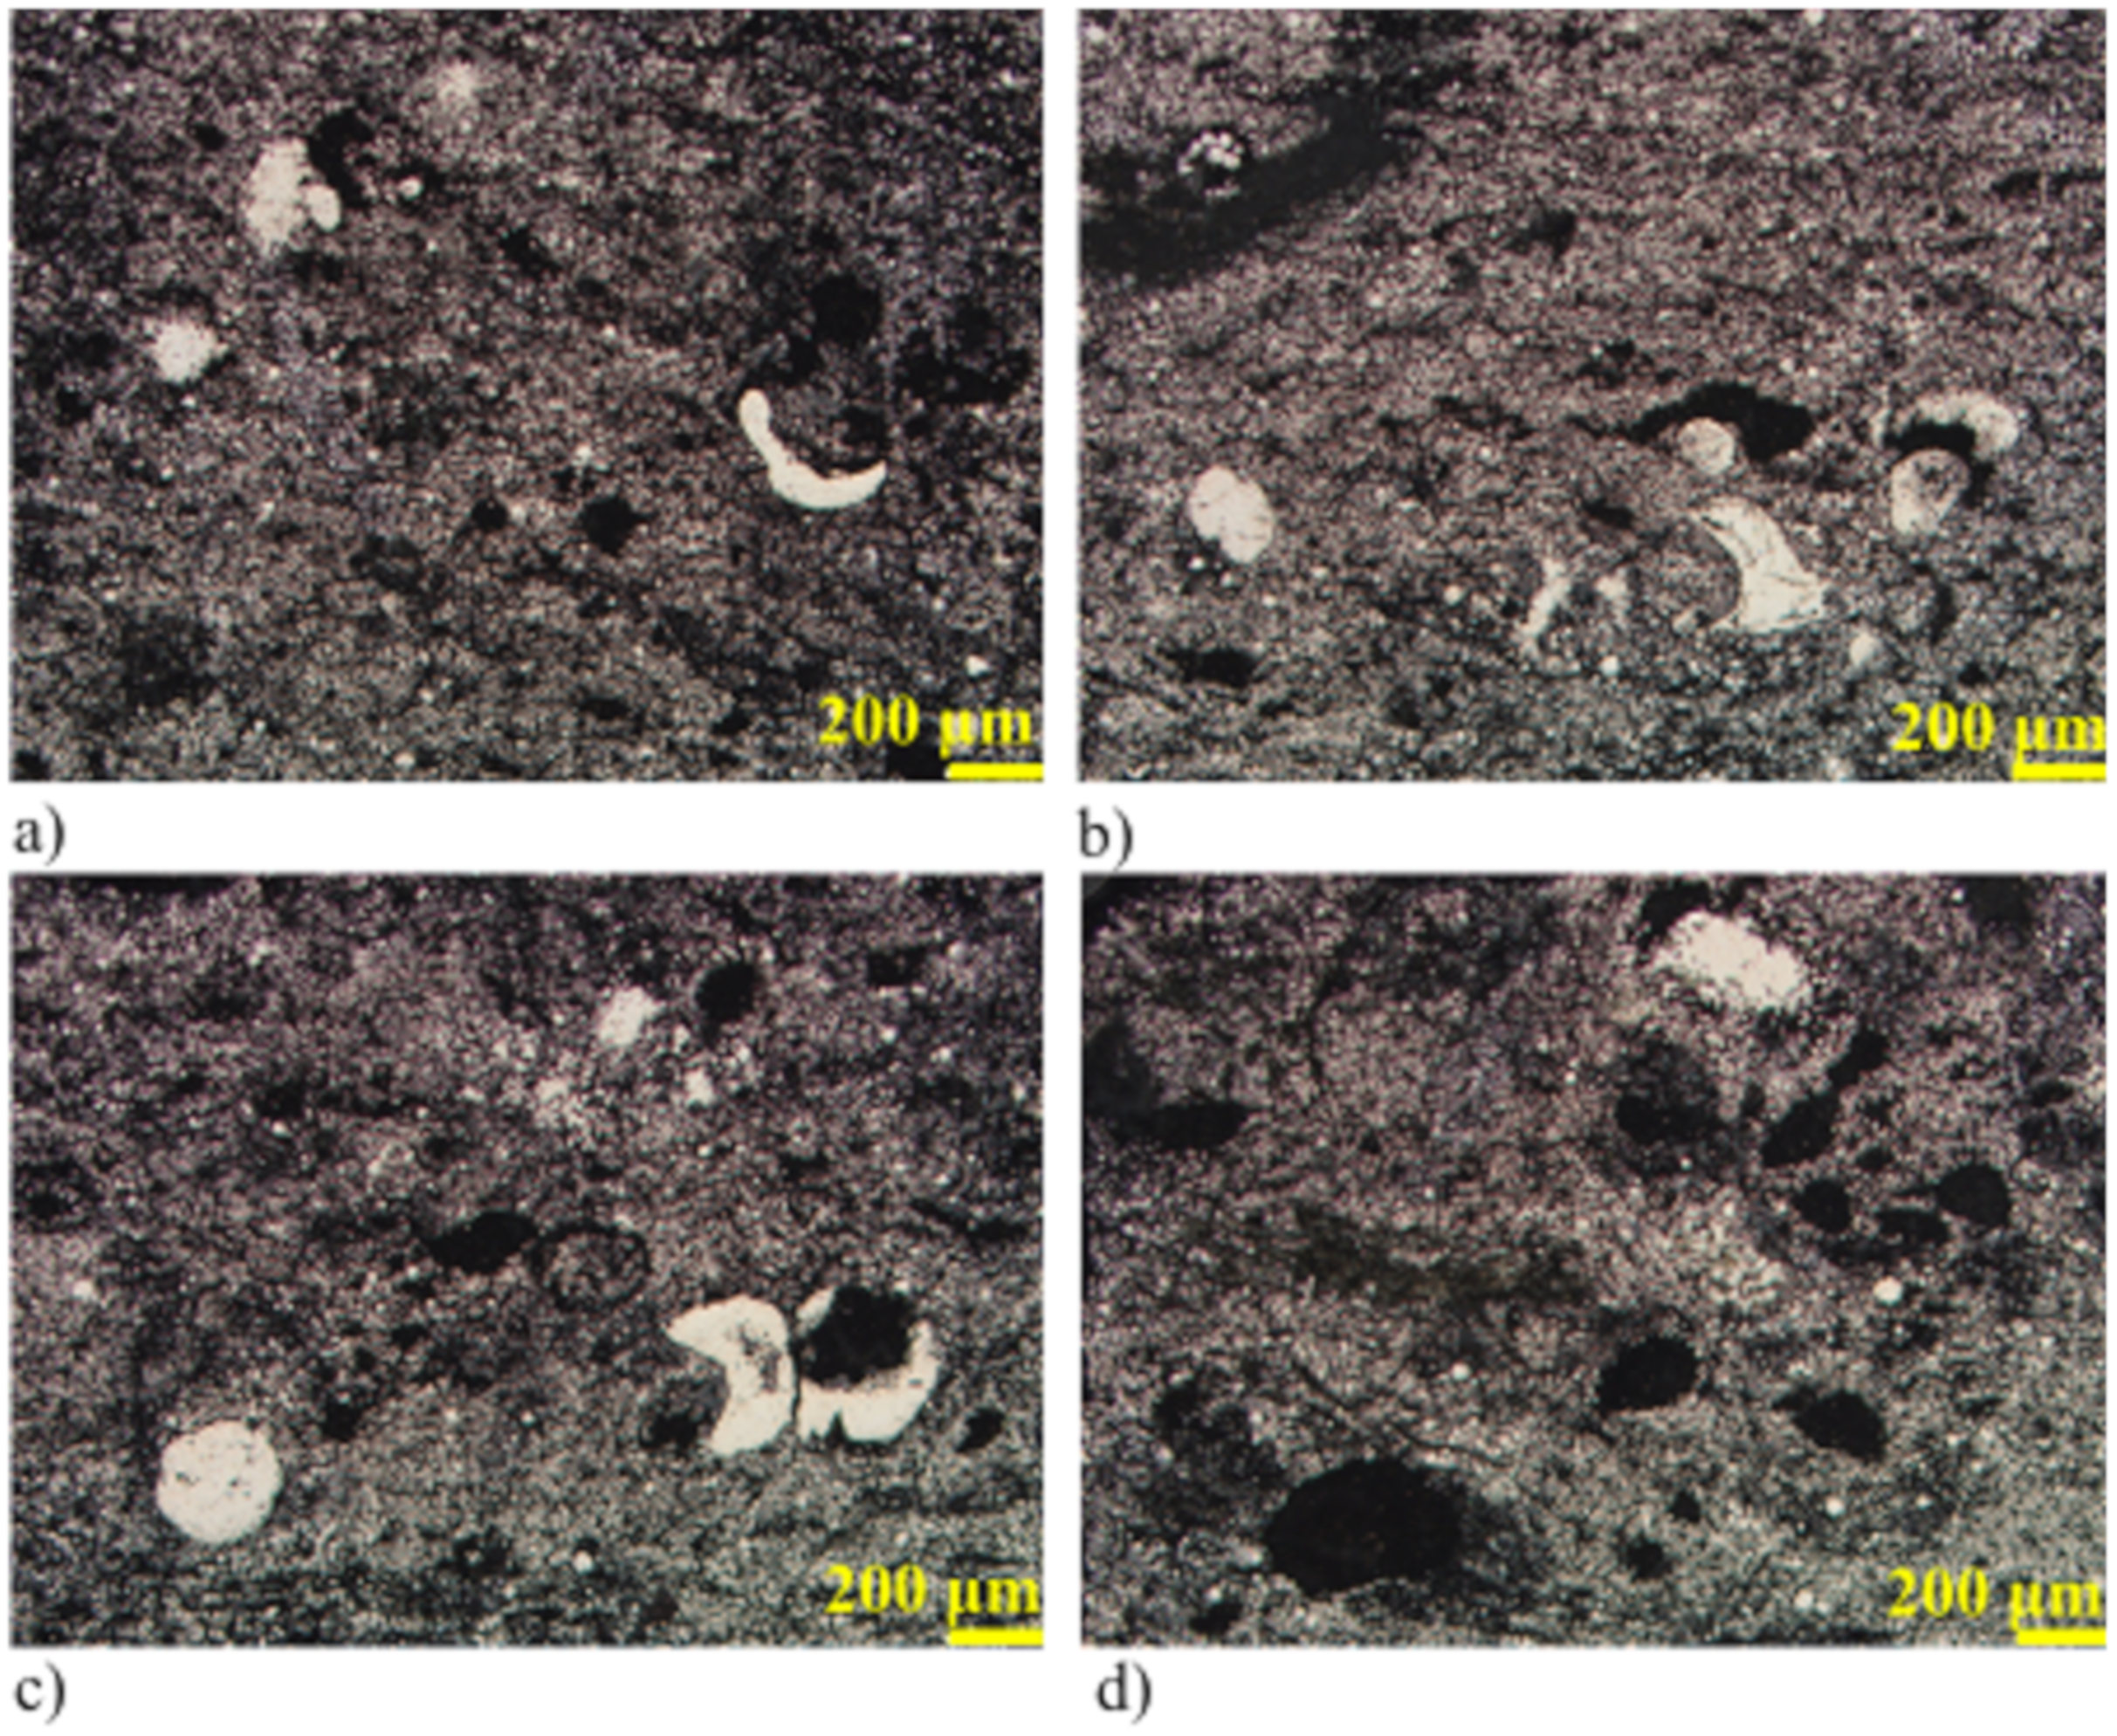
4.1. Pyrite Textures Using Reflected Light Microscopy
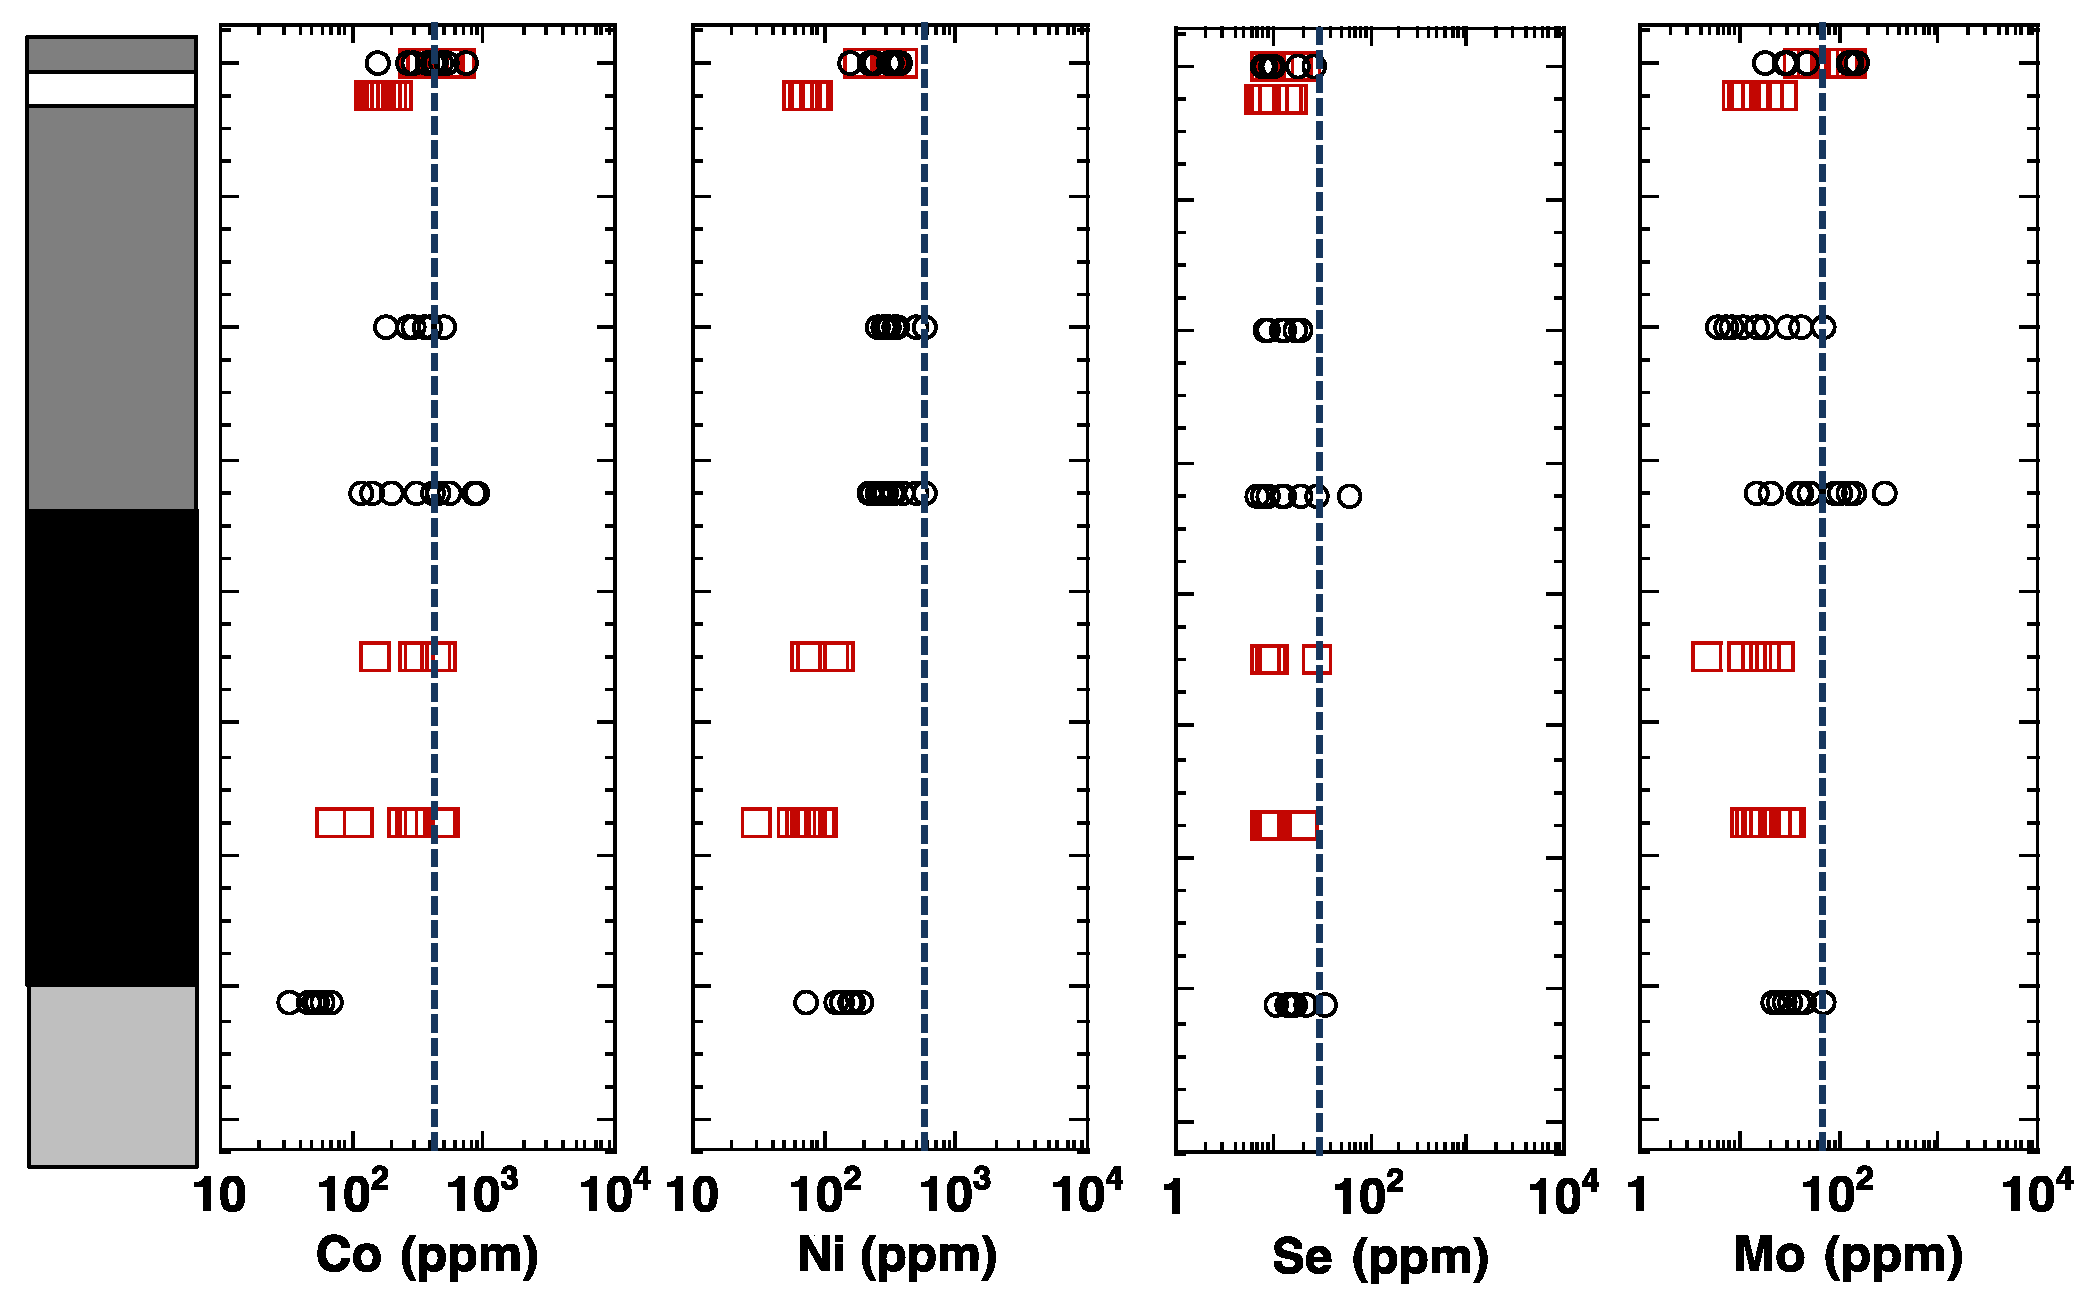
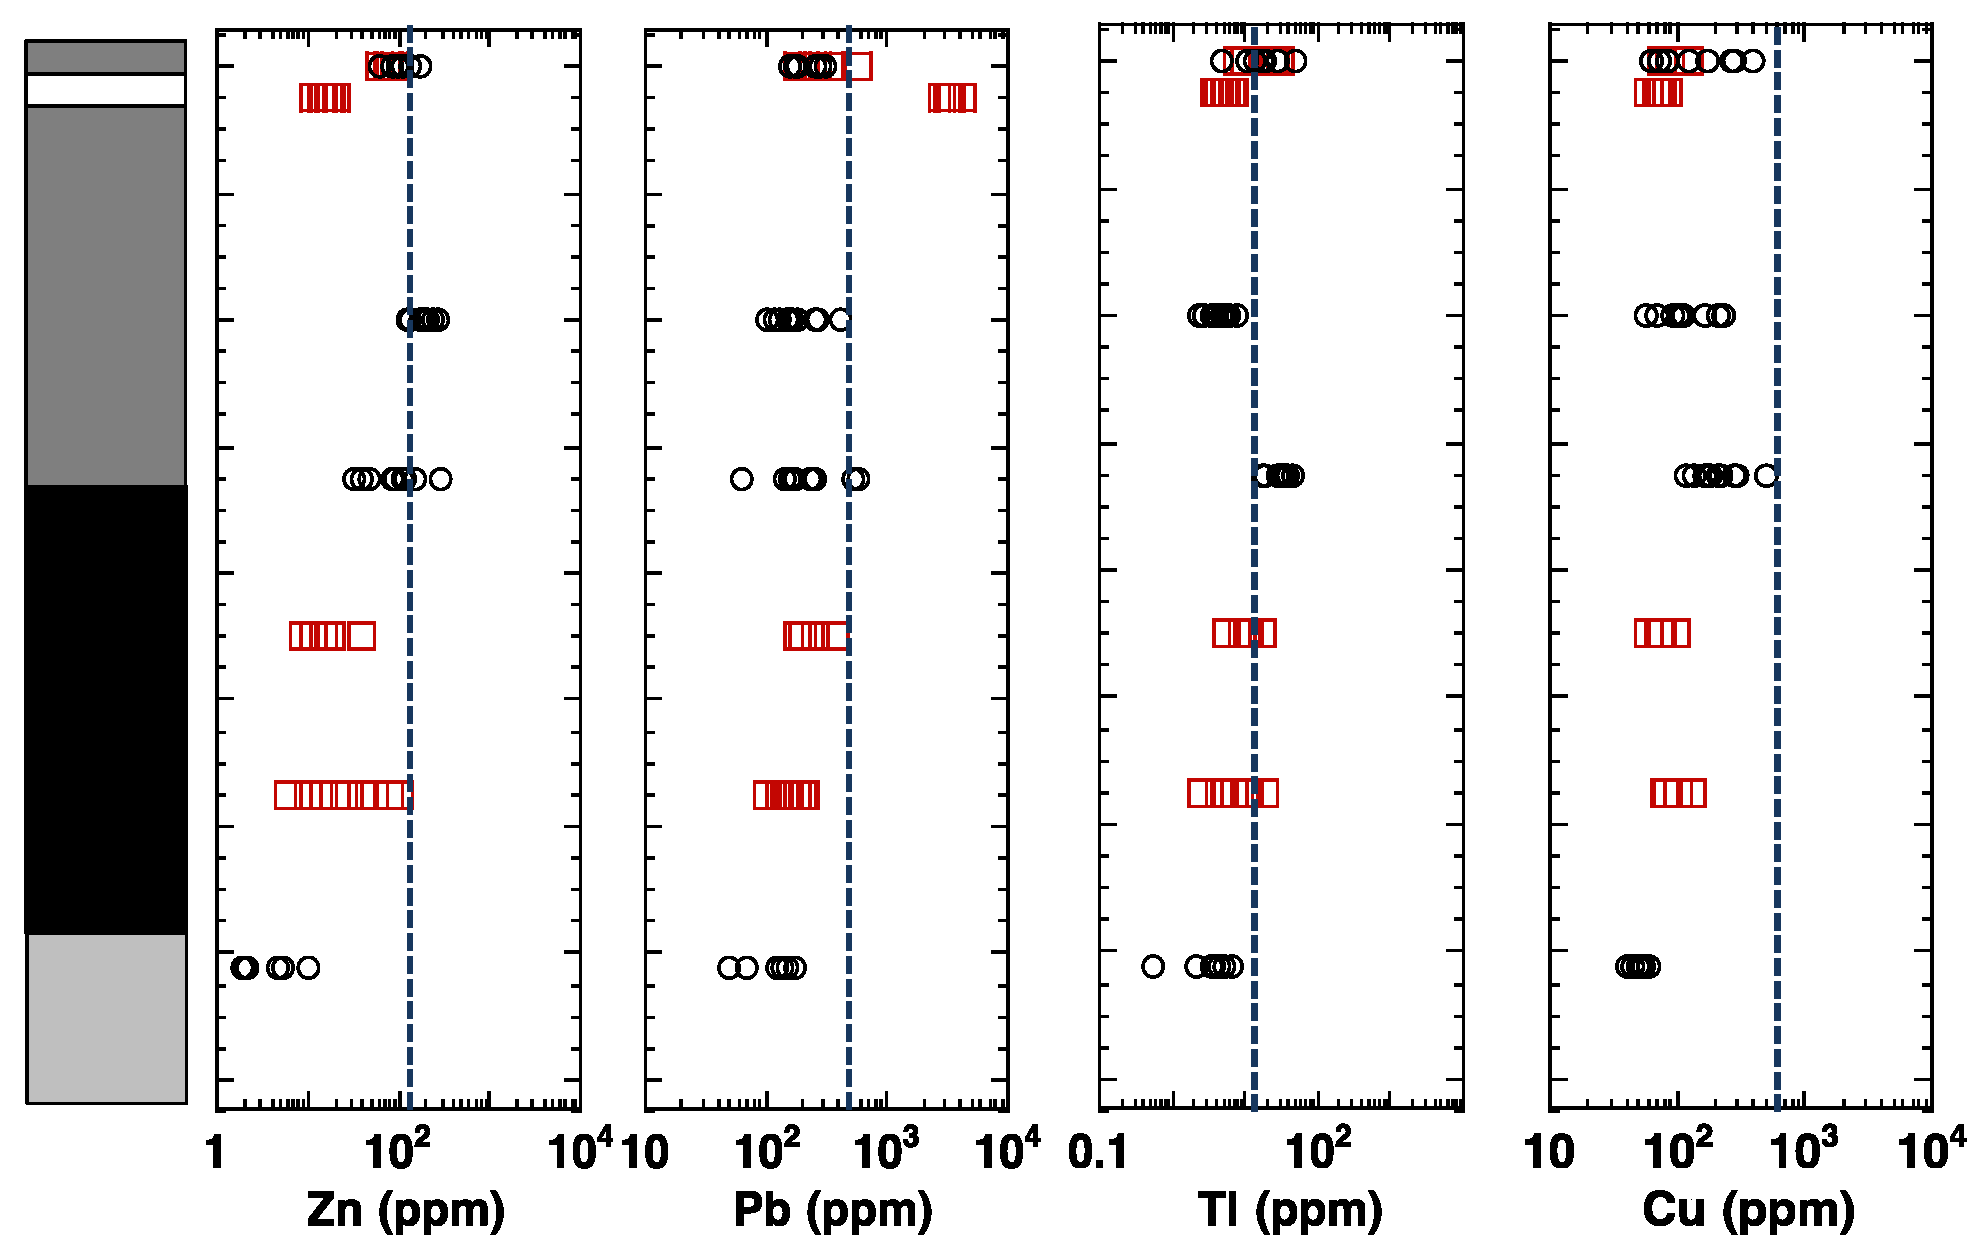
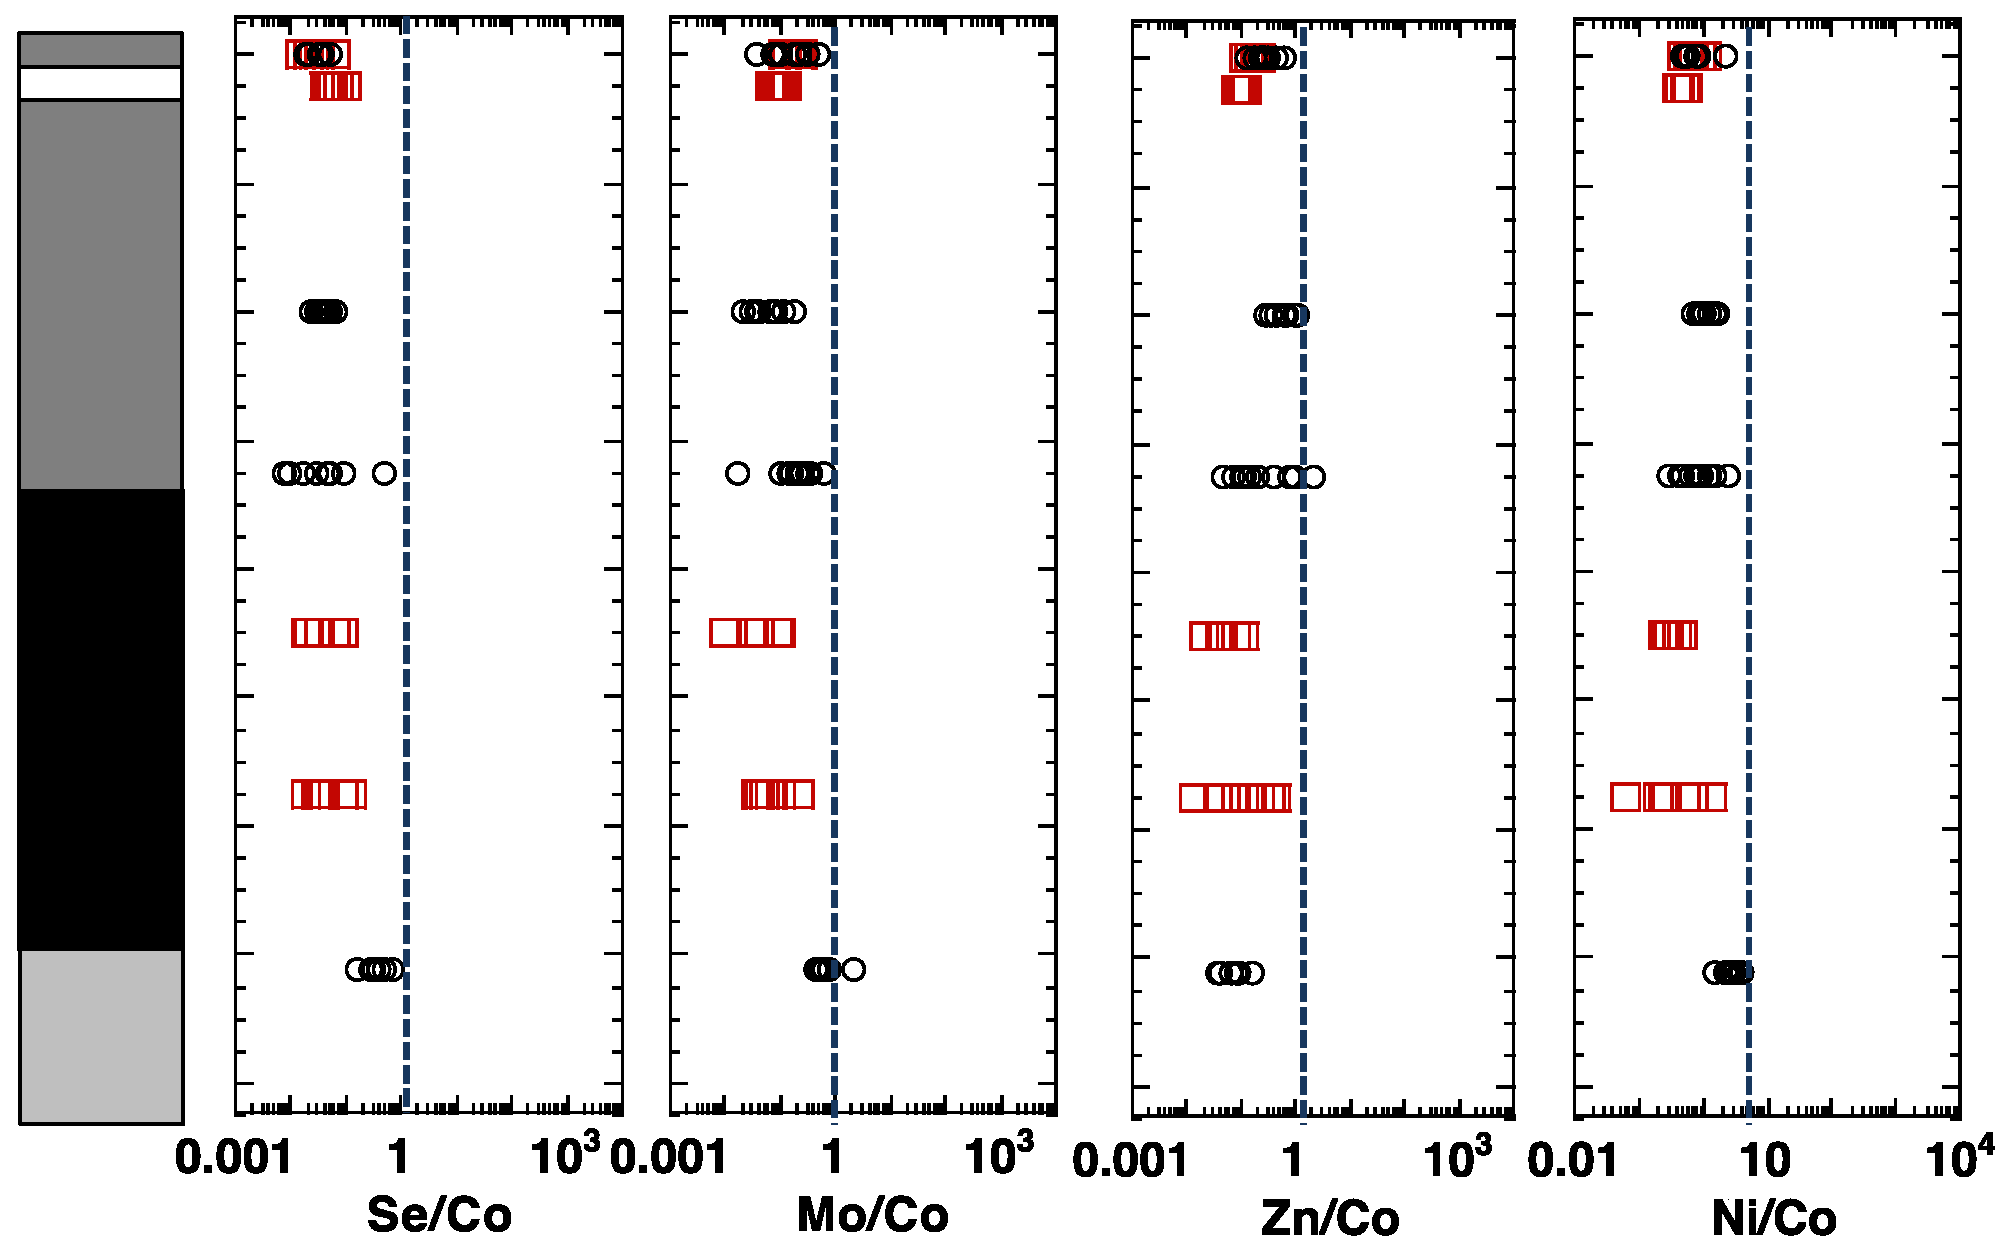
4.2. Pyrite Trace Element Chemistry
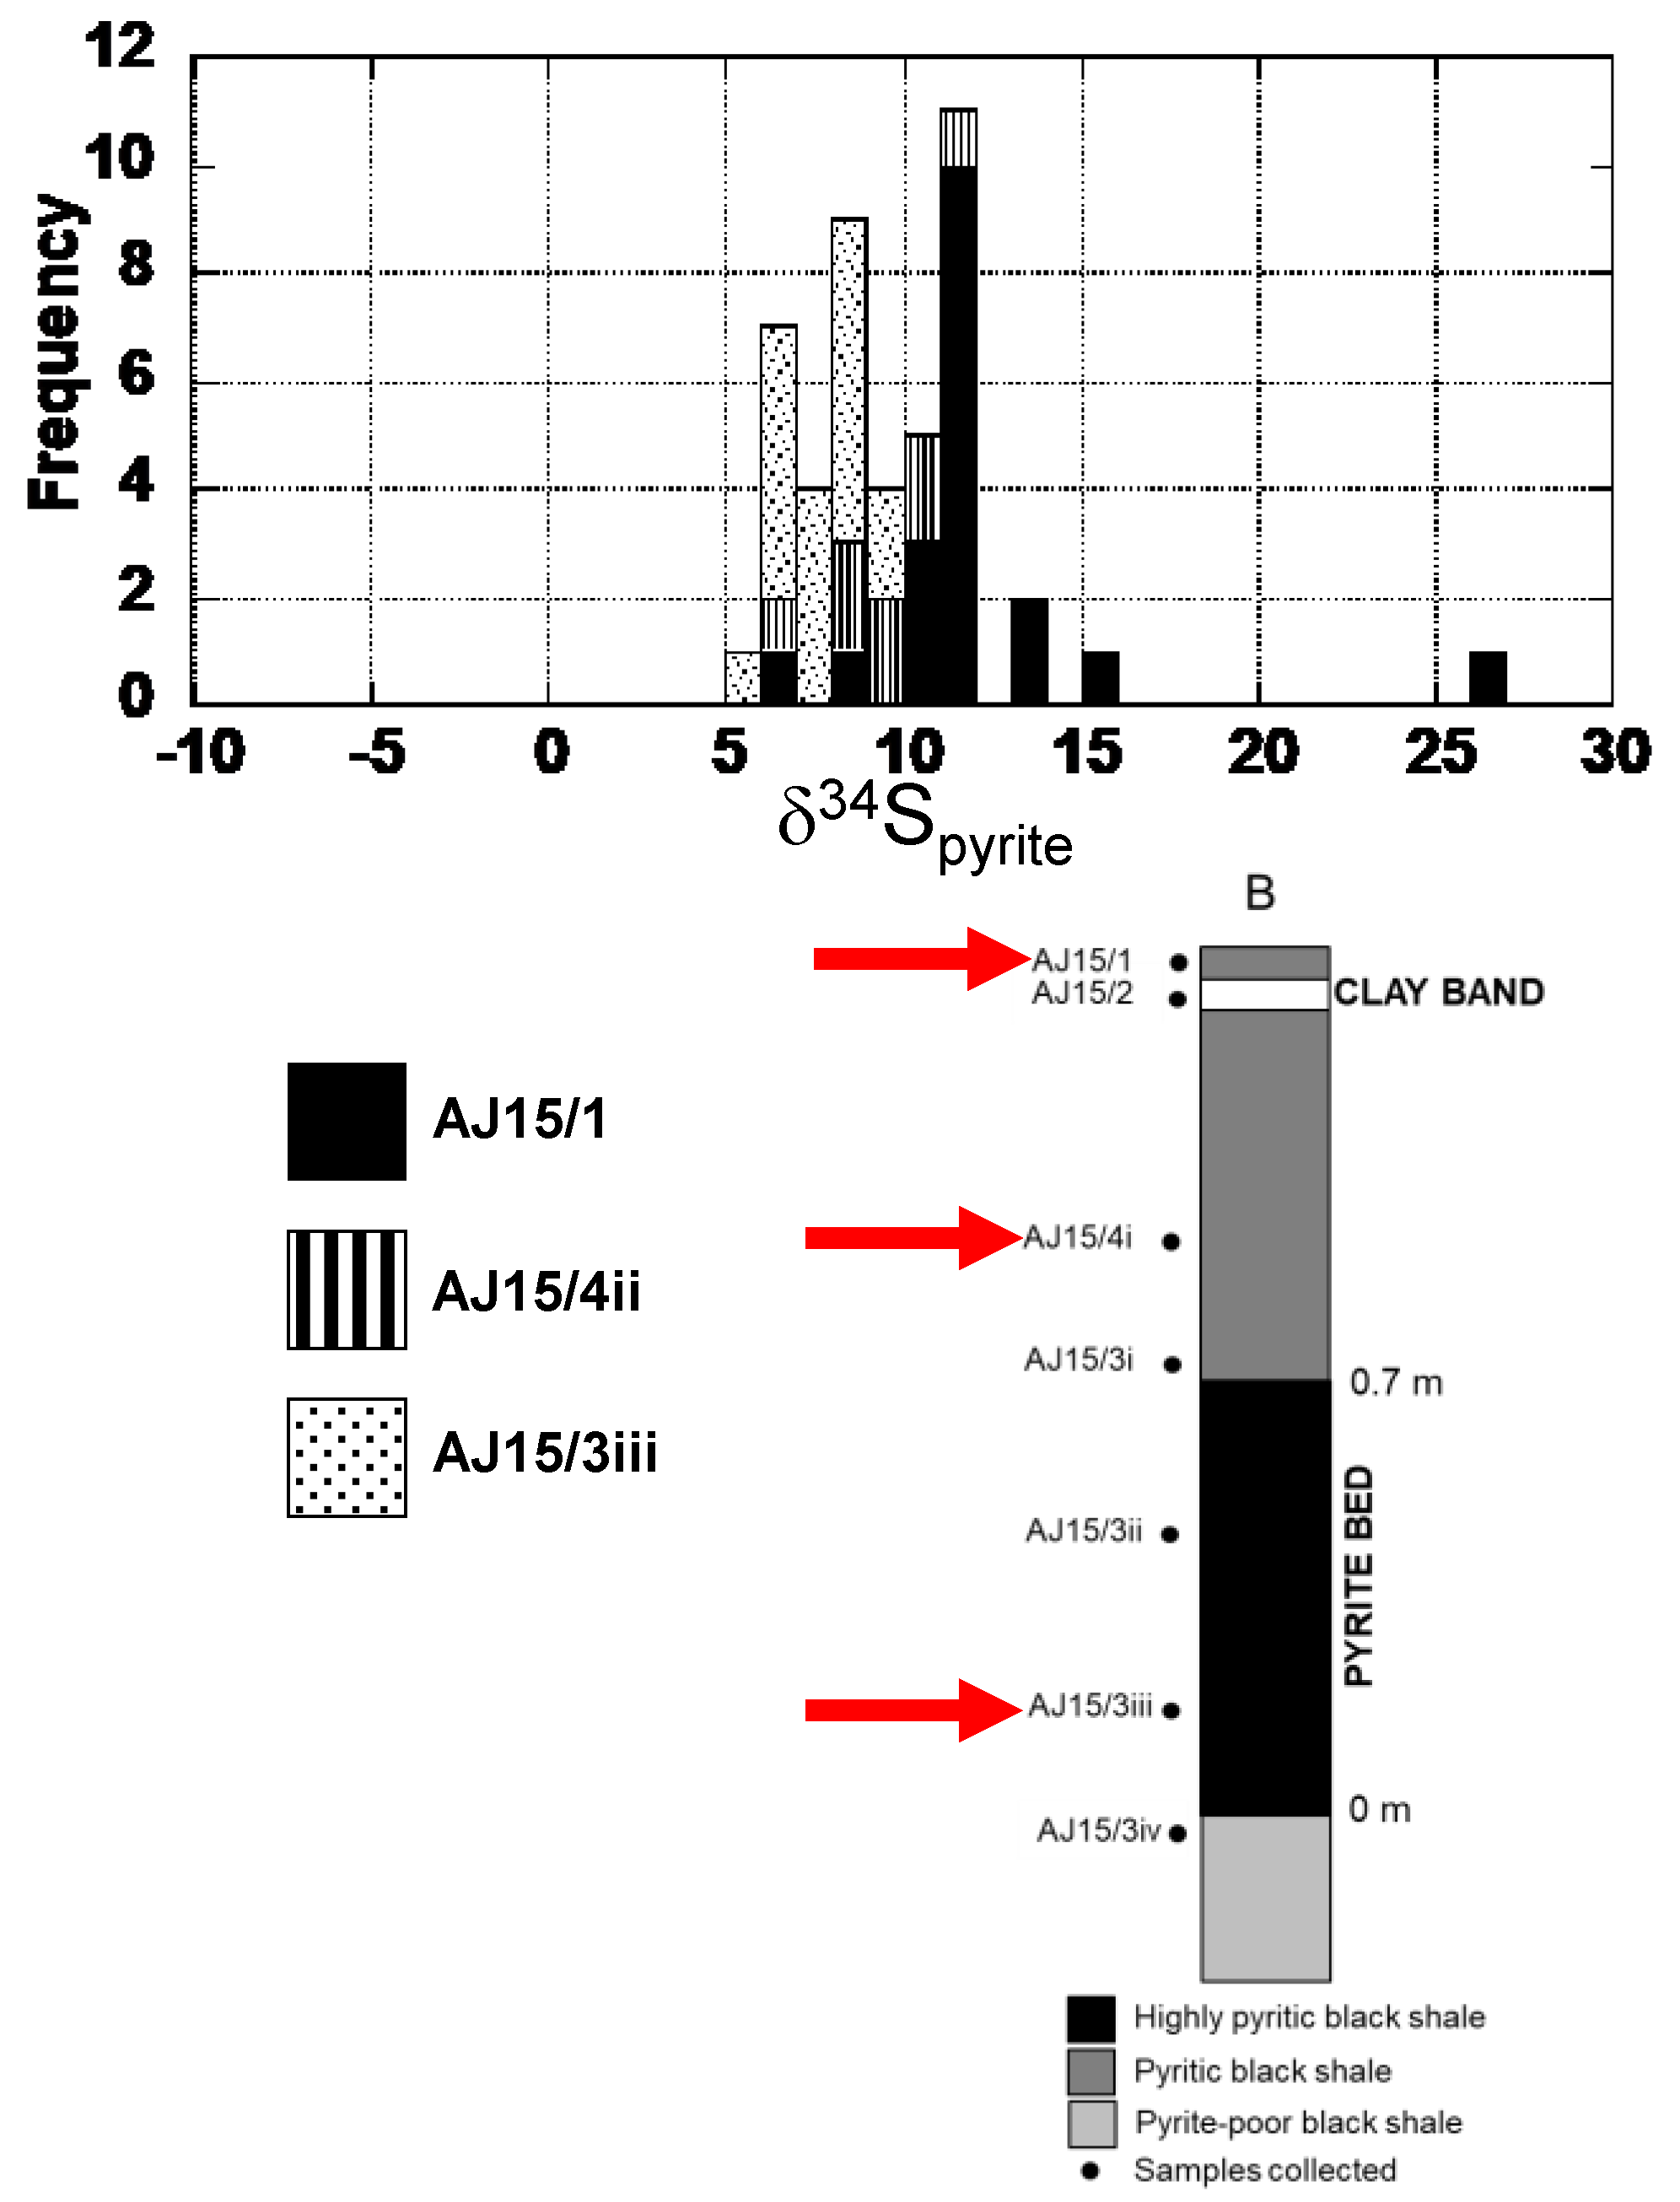
4.3. Sulfur Isotopes (SHRIMP_SI)
- -
- AJ15/3iii (lower) ranged between +5.9 and +9.7‰ (n = 18)
- -
- AJ15/4i (middle) ranged between +6.23 and 11.05‰ (n = 8)
- -
- AJ15/1 (upper) ranged between +6.5 and 26.08‰ (n = 19)
5. Discussion
5.1. Textural Implications
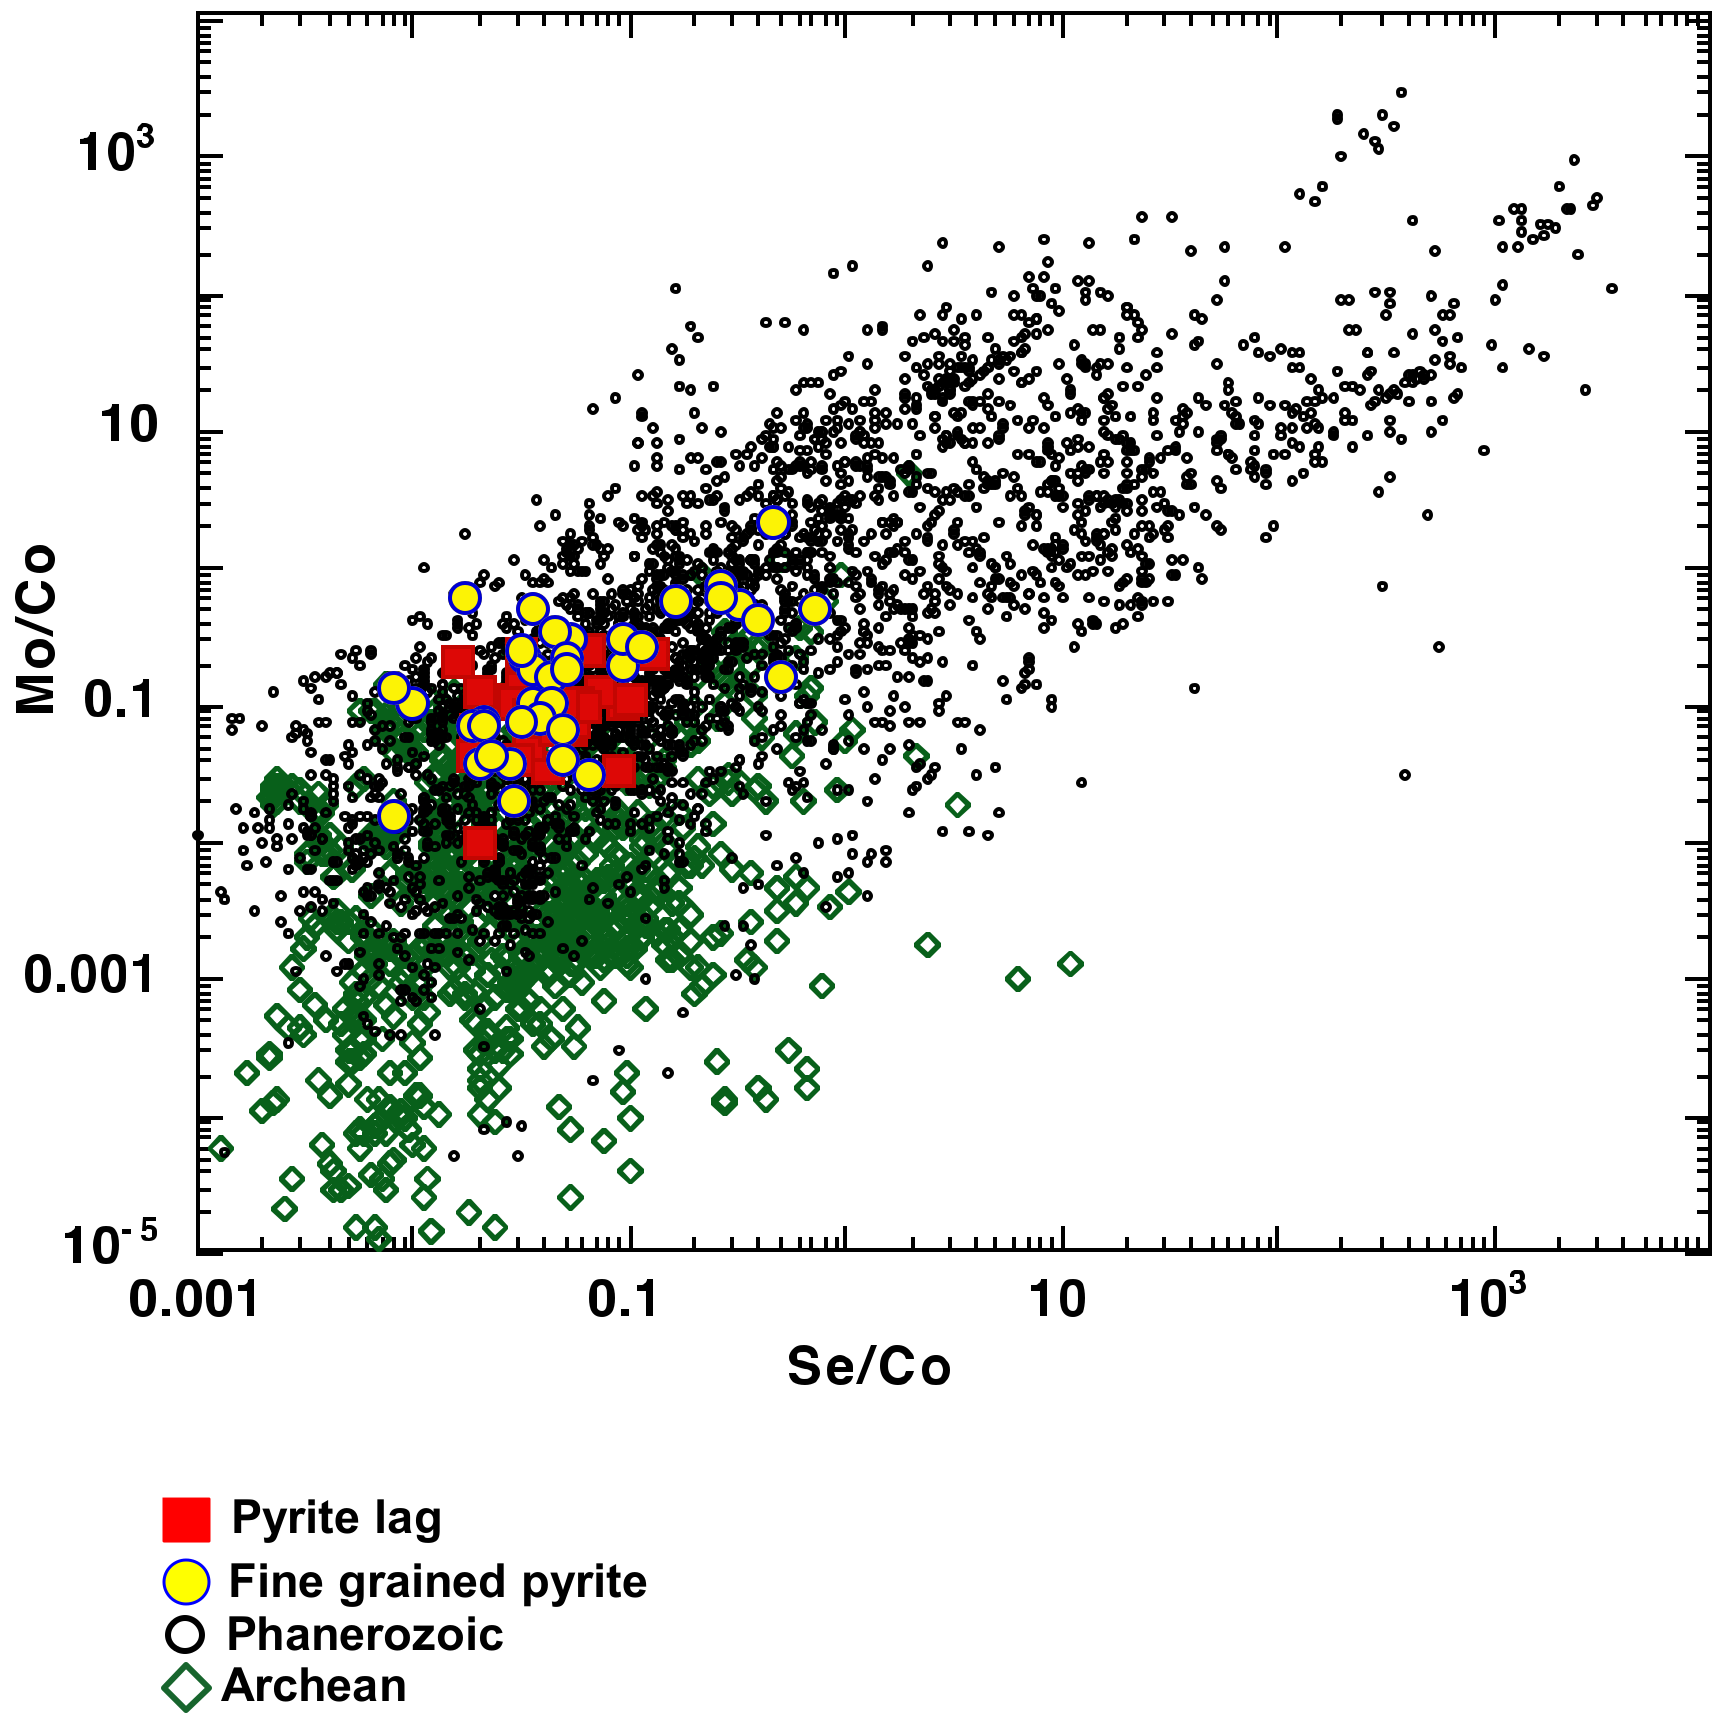
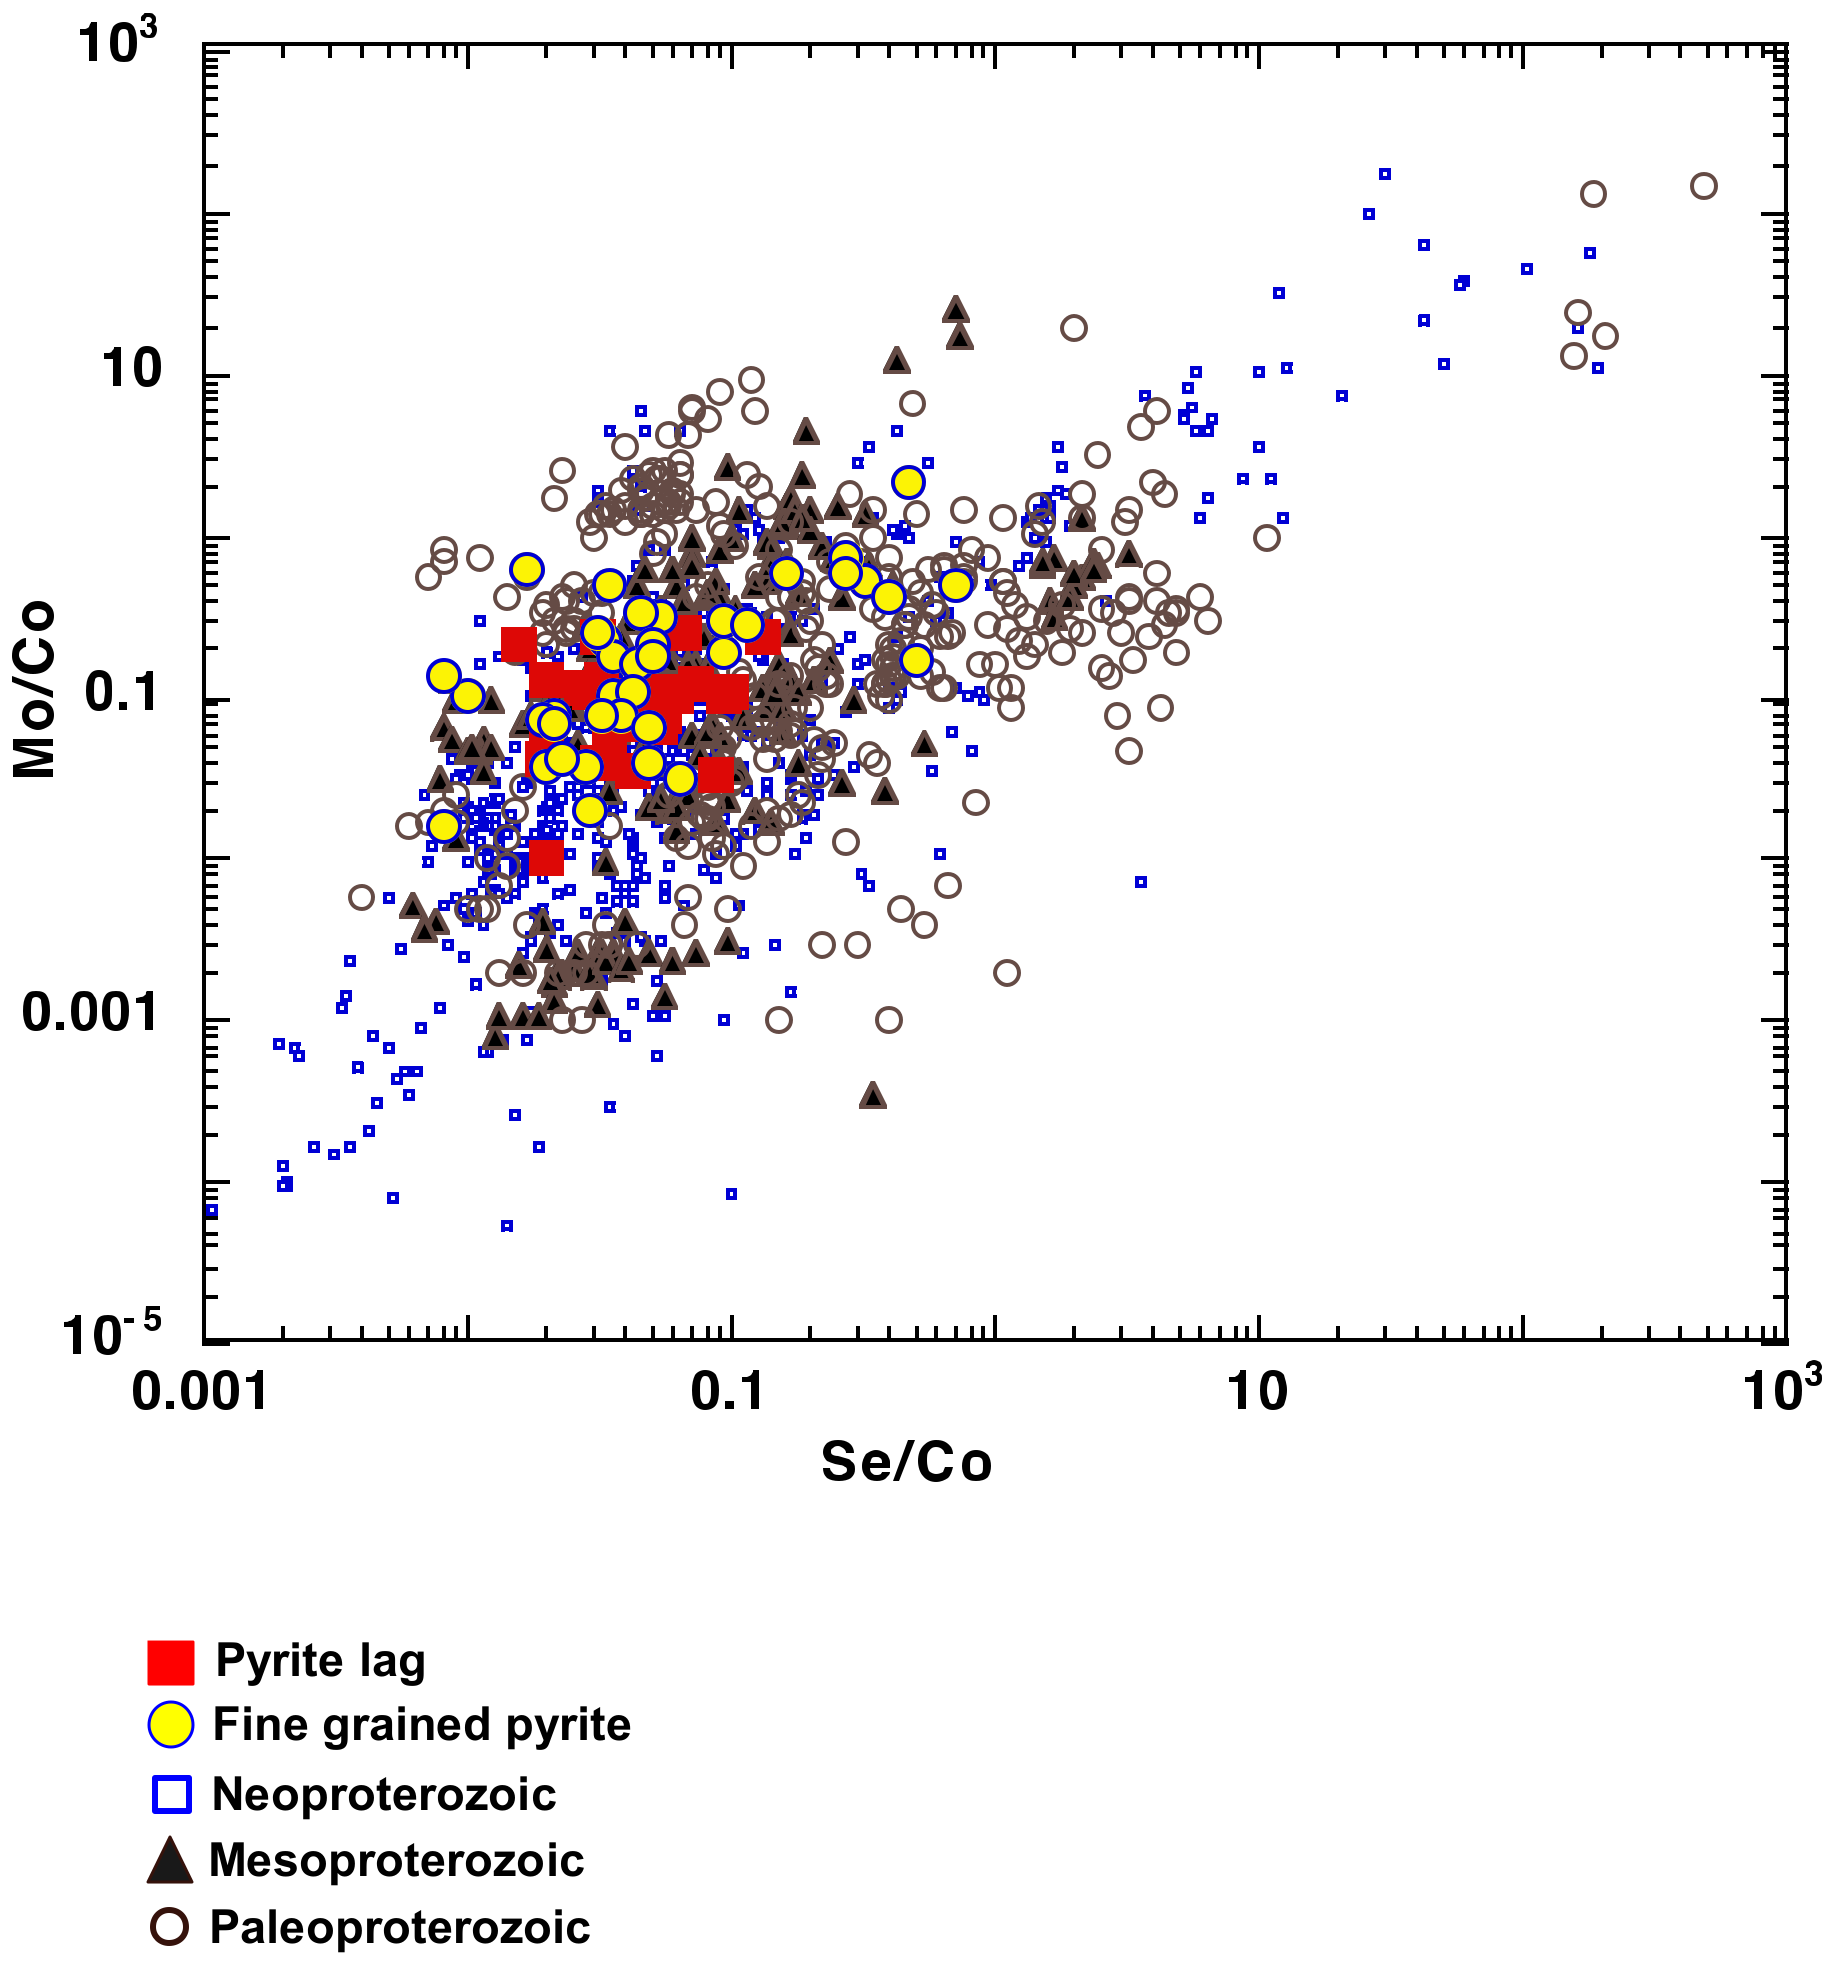
5.2. Atmospheric Redox Implications (Pyrite-Trace Elements)
5.3. Atmospheric Redox Implications (Pyrite-Sulfur Isotopes)
5.4. Summary
6. Conclusions
Supplementary Materials
Author Contributions
Funding
Acknowledgments
Conflicts of Interest
References
- Crawford, A.R.; Compston, W. The age of the Vindhyan system of peninsular India. Q. J. Geol. Soc. Lond. 1970, 125, 351–371. [Google Scholar] [CrossRef]
- Ray, J.S.; Martin, M.W.; Veizer, J.; Bowring, S.A. U–Pb Zircon dating and Sr isotope systematics of the Vindhyan Supergroup, India. Geology 2002, 30, 131–134. [Google Scholar] [CrossRef]
- Malone, S.J.; Meert, J.G.; Banerjee, D.M.; Pandit, M.K.; Tamrat, E.; Kamenov, G.D.; Pradhan, V.R.; Sohl, L.E. Paleomagnetism and detrital zircon geochronology of the Upper Vindhyan sequence, Son Valley and Rajasthan, India: A ca. 1000 Ma closure age for the Purana Basins? Precam. Res. 2008, 164, 137–159. [Google Scholar] [CrossRef]
- Gregory, L.C.; Meert, J.G.; Pradhan, V.; Pandit, M.K.; Tamrat, E.; Malone, S.J. A paleomagnetic and geochronologic study of the Majhgawan kimberlite, India: Implications for the age of the Vindhyan Supergroup. Precam. Res. 2006, 149, 65–75. [Google Scholar] [CrossRef]
- Azmi, R.J.; Joshi, D.; Tewari, B.N.; Joshi, M.N.; Srivastava, S.S. A synoptic view on the current discordant geo- and biochronological ages of the Vindhyan Supergroup, central India. J. Himal. Geol. 2008, 29, 177–191. [Google Scholar]
- Bengtson, S.; Belivanova, V.; Rassmussen, B.; Whitehouse, M.J. The Vindhyan enigma revisited. Geol. Soc. Am. Abstr. 2007, 39, 331. [Google Scholar]
- Sarkar, A.; Chakraborty, P.P.; Mishra, B.; Bera, M.K.; Sanyal, P.; Paul, S. Mesoproterozoic sulphidic ocean, delayed oxygenation and evolution of early life: Sulfur isotope clues from Indian Proterozoic basins. Geol. Mag. 2010, 147, 206–218. [Google Scholar] [CrossRef]
- Deb, M.; Pal, T. Mineral potential of Proterozoic intracratonic basins in India. In Precambrian Basins of India: Stratigraphic and Tectonic Context; Mazumder, R., Eriksson, P.G., Eds.; Geological Society: London, UK, 2015; Volume 43, pp. 309–325. [Google Scholar]
- Brasier, M.D.; Lindsay, J.F. A billion years of environmental stability and the emergence of eukaryotes: New data from northern Australia. Geology 1998, 26, 555–558. [Google Scholar] [CrossRef]
- Algeo, T.J.; Maynard, J.B. Trace element behavior and redox facies in core shales of Upper Pennsylvanian Kansas-type cyclothems. Chem. Geol. 2004, 206, 289–318. [Google Scholar] [CrossRef]
- Algeo, T.J.; Lyons, T.W. Mo–total organic carbon covariation in modern anoxic marine environments: Implications for analysis of paleoredox and paleohydrographic conditions. Paleoceanography 2006, 21, PA1016-23. [Google Scholar] [CrossRef]
- Algeo, T.J.; Rowe, H. Paleoceanographic applications of trace-metal concentration data. Chem. Geol. 2012, 324, 6–18. [Google Scholar]
- Scott, C.; Lyons, T.W.; Bekker, A.; Shen, Y.; Poulton, S.W.; Chu, X.; Anbar, A.D. Tracing the stepwise oxygenation of the Proterozoic ocean. Nature 2008, 452, 456–459. [Google Scholar] [CrossRef] [PubMed]
- Gordon, G.W.; Lyons, T.W.; Arnold, G.L.; Roe, J.; Sageman, B.B.; Anbar, A.D. When do black shales tell molybdenum isotope tales? Geology 2009, 37, 535–538. [Google Scholar] [CrossRef]
- Sahoo, S.K.; Planavsky, N.J.; Kendall, B.; Wang, X.; Shi, X.; Scott, C.; Anbar, A.D.; Lyons, T.W.; Jiang, G. Ocean oxygenation in the wake of the Marinoan glaciation. Nature 2012, 489, 546–549. [Google Scholar] [CrossRef]
- Large, R.R.; Halpin, J.A.; Danyushevsky, L.V.; Maslennikov, V.V.; Bull, S.W.; Long, J.A.; Gregory, D.D.; Lounejeva, E.; Lyons, T.W.; Sack, P.J.; et al. Trace element content of sedimentary pyrite as a new proxy for deep-time ocean- atmosphere evolution. Earth Planet Sci. Lett. 2014, 389, 209–220. [Google Scholar] [CrossRef]
- Large, R.R.; Gregory, D.G.; Steadman, J.A.; Tomkins, A.G.; Lounejeva, E.; Danyushevsky, L.V.; Halpin, J.A.; Maslennikov, V.V.; Sack, P.J.; Mukherjee, I.; et al. Gold in the oceans through time. Earth Planet Sci. Lett. 2015, 428, 139–150. [Google Scholar] [CrossRef]
- Large, R.R.; Halpin, J.A.; Lounejeva, E.; Danyushevsky, L.V.; Maslennikov, V.V.; Gregory, D.; Sack, P.J.; Haines, P.W.; Long, J.A.; Makoundi, C.; et al. Cycles of nutrient trace elements in the Phanerozoic ocean. Gond. Res. 2015, 28, 1282–1293. [Google Scholar] [CrossRef]
- Large, R.; Mukherjee, I.; Gregory, D.; Steadman, J.; Corkrey, R.; Danyushevsky, D. Atmosphere oxygen cycling through the Proterozoic and Phanerozoic. Min. Depos. 2019, 54, 485–506. [Google Scholar] [CrossRef]
- Mukherjee, I.; Large, R. Pyrite trace element chemistry of the Velkerri Formation, Roper Group, McArthur Basin: Evidence for atmospheric oxygenation during the Boring Billion. Precam. Res. 2016, 281, 13–26. [Google Scholar] [CrossRef]
- Mukherjee, I.; Large, R.R. Application of Pyrite Trace Element Chemistry to Exploration for SEDEX Style Zn-Pb Deposits: McArthur Basin, Northern Territory Australia. Ore Geol. Rev. 2017, 81, 1249–1270. [Google Scholar] [CrossRef]
- Pandalai, H.S.; Chandra, D. Textural Studies on the ores of Amjhore pyrite deposit, Rohtas district, Bihar. India. J. Geol. Soc. India 1986, 27, 527–530. [Google Scholar]
- Sur, S.; Schieber, J.; Banerjee, S. Petrographic observations suggestive of microbial mats from Rampur shale and Bijaigarh shale, Vindhyan Basin, India. J. Earth Sys. Sci. 2006, 115, 61–66. [Google Scholar] [CrossRef]
- Tripathy, G.R.; Singh, S.K. Re-Os depositional age for black shales from the Kaimur Group, Upper Vindhyan, India. Chem. Geol. 2015, 413, 63–72. [Google Scholar] [CrossRef]
- Soni, M.K.; Chakraborty, S.; Jain, V.K. Vindhyan Supergroup—A review. In Purana Basins of Peninsular India (Middle to Late Proterozoic); Radhakrishna, B.P., Ed.; Geological Society: Bangalore, India, 1987; Memoir 6; pp. 87–138. [Google Scholar]
- Chaudhuri, A.K.; Saha, D.; Deb, G.K.; Deb, S.P.; Mukherjee, M.K.; Ghosh, G. The Purana basins of southern cratonic province of India- A case for Mesoproterozoic fossil rifts. Gond. Res. 2002, 5, 23–33. [Google Scholar] [CrossRef]
- Chanda, S.K.; Bhattacharyya, A. Vindhyan sedimentation and paleogeography: Post-Auden developments. In Geology of Vindhyanchal; Valdiya, K.S., Bhatia, S.B., Gaur, V.K., Eds.; Hindustan Publishing Corporation: New Delhi, India, 1982; pp. 88–101. [Google Scholar]
- Chakraborty, C.; Karmakar, S. Structural architecture of Vindhyan strata in Son valley: Implications for basin tectonics. J. Geol. Soc. India 1998, 51, 377–382. [Google Scholar]
- Deb, M.; Thorpe, R.; Krstic, D. Hindoli Group of rocks in the Eastern Fringe of the Aravalli–Delhi Orogenic belt—Archean secondary greenstone belt or Proterozoic supracrustals? Gond. Res. 2002, 5, 879–883. [Google Scholar] [CrossRef]
- Mondal, M.E.A.; Goswami, J.N.; Deomurari, M.P.; Sharma, K.K. Ion microprobe 207Pb/206Pb ages of zircons from the Bundelkhand Massif, northern India: Implications for crustal evolution of the Bundelkhand-Aravalli supercontinent. Precam. Res. 2002, 117, 85–100. [Google Scholar] [CrossRef]
- Kumar, A.; Gopalan, K.; Rajagopalan, G. Age of the Lower Vindhyan sediments, central India. Curr. Sci. 2001, 81, 806–809. [Google Scholar]
- Rasmussen, B.; Bose, P.K.; Sarkar, S.; Banerjee, S.; Fletcher, I.R.; McNaughton, N.J. 1.6 Ga U–Pb zircon age for the Chorhat Sandstone, lower Vindhyan, India: Possible implications for early evolution of animals. Geology 2002, 30, 103–106. [Google Scholar] [CrossRef]
- Ray, J.S.; Veizer, J.; Davis, W.J. C, O, Sr and Pb isotope systematics of carbonate sequences of the Vindhyan Supergroup, India: Age, diagenesis, correlations and implications for global events. Precam. Res. 2003, 121, 103–140. [Google Scholar] [CrossRef]
- Sarangi, S.; Gopalan, K.; Kumar, S. Pb–Pb age of the earliest megascopic, eukaryotic alga-bearing Rohtas Formation, Vindhyan Supergroup, India: Implications for Precambrian atmospheric oxygen evolution. Precam. Res. 2004, 121, 107–121. [Google Scholar] [CrossRef]
- Ray, J.S. Age of the Vindhyan Supergroup: A review of recent findings. J. Earth Syst. Sci. 2006, 115, 149–160. [Google Scholar] [CrossRef]
- Bose, P.K.; Chaudhuri, A.K. Tide versus storm in epeiric coastal deposition: Two Proterozoic sequences, India. Geol. J. 1990, 25, 81–100. [Google Scholar] [CrossRef]
- Gopalan, K.; Kumar, A.; Kumar, S.; Vijayagopal, B. Depositional history of the Upper Vindhyan succession, central India: Time constraints from Pb–Pb isochron ages of its carbonate components. Precam. Res. 2013, 233, 108–117. [Google Scholar] [CrossRef]
- Auden, J.B. Vindhyan sedimentation in the Son Valley, Mirzapur District. Geol. Surv. India 1933, 62, 141–150. [Google Scholar]
- Banerjee, S.; Dutta, S.; Paikaray, S.; Mann, U. Stratigraphy, sedimentology and bulk organic geochemistry of black shales from the Proterozoic Vindhyan Supergroup (central India). J. Earth Syst. Sci. 2006, 115, 37–47. [Google Scholar] [CrossRef]
- Banerjee, P.K.; Prakash, O. Galena mineralisation in the Vindhyan rocks of Amjhore, Sahabad district, Bihar, India. Econ. Geol. 1975, 70, 399–404. [Google Scholar] [CrossRef]
- Guha, J. Sulfur isotope study of the pyrite deposit of Amjhore, Shahbad district, Bihar, India. Econ. Geol. 1971, 66, 326–330. [Google Scholar] [CrossRef]
- Nair, N.; Ray, A. Syndepositional and diagenetic features in the pyrite ores of Amjhore, Bihar, India. Min. Depos. 1977, 12, 151–154. [Google Scholar] [CrossRef]
- Valdiya, K.S. The Making of India: Geodynamic Evolution; Macmillan Publishers India Ltd.: Delhi, India, 2010; p. 816. [Google Scholar]
- Singh, I. The Bijaigarh shale, Vindhyan system (Precambrian), India—An example of a lagoonal deposit. Sediment. Geol. 1980, 25, 83–103. [Google Scholar] [CrossRef]
- Chakraborty, C. Gutter casts from the Proterozoic Bijaygarh Shale Formation, India: Their implication for storm-induced circulation in shelf settings. Geol. J. 1995, 30, 69–78. [Google Scholar] [CrossRef]
- Bose, P.K.; Sarkar, S.; Chakrabarty, S.; Banerjee, S. Overview of the Meso- to Neoproterozoic evolution of the Vindhyan Basin, central India. Sed. Geol. 2001, 141, 395–419. [Google Scholar] [CrossRef]
- Chakraborty, C. Proterozoic intracontinental basin: The Vindhyan example. J. Earth Syst. Sci. 2006, 115, 3–22. [Google Scholar] [CrossRef]
- Danyushevsky, L.; Robinson, P.; Gilbert, S.; Norman, M.; Large, R.; McGoldrick, P.; Shelley, M. Routine quantitative multi-element analysis of sulphide minerals by laser ablation ICP-MS: Standard development and consideration of matrix effects. Geochem. Explor. Environ. Anal. 2011, 11, 51–60. [Google Scholar] [CrossRef]
- Jochum, K.P.; Pfänder, J.; Woodhead, J.D.; Willbold, M.; Stoll, B.; Herwig, K.; Amini, M.; Abouchami, W.; Hofmann, A.W. MPI-DING glasses: New geological reference materials for in situ Pb isotope analysis. Geochem. Geophy. Geosyst. 2005, 6, 1525–2027. [Google Scholar] [CrossRef]
- Stepanov, A.; Danyushevsky, L.; Large, R.; Mukherjee, I.; Zhukova, I. deconvolution of the composition of fine-grained pyrite in sedimentary matrix by regression of time-resolved LA-ICP-MS data. Am. Mineral. 2020, 105, 820–832. [Google Scholar] [CrossRef]
- Ireland, T.; Clement, S.; Compston, W.; Foster, J.; Holden, P.; Jenkins, B.; Lanc, P.; Schram, N.; Williams, I. Development of SHRIMP. Aus. J. Earth Sci. 2008, 55, 937–954. [Google Scholar] [CrossRef]
- Crowe, D.E.; Vaughan, R.G. Characterization and use of isotopically homogeneous standards for in situ laser microprobe analysis of 34S/32S ratios. Am. Mineral. 1996, 81, 187–193. [Google Scholar] [CrossRef]
- Farquhar, J.; Wing, B.A. The terrestrial record of stable sulphur isotopes: A review of the implications for evolution of Earth’s sulphur cycle. In Mineral Deposits and Earth Evolution; McDonald, I., Boyce, A.J., Butler, I.B., Herrington, R.J., Polya, D.A., Eds.; Geological Society: London, UK, 2003; Volume 248, pp. 167–177. [Google Scholar]
- Philippot, P.; Ávila, J.N.; Killingsworth, B.A.; Tessalina, S.; Baton, F.; Caquineau, T.; Muller, E.; Pecoits, E.; Cartigny, P.; Lalonde, S.V.; et al. Globally asynchronous sulphur isotope signals require re-definition of the Great Oxidation Event. Nat. Commun. 2018, 9, 2245. [Google Scholar] [CrossRef]
- Baird, G.C.; Lash, G.G. Devonian strata and environments: Chautauqua County region. In 62nd Annual Meeting Guidebook; New York State Geological Association: New York, NY, USA, 1990; pp. A1–A46. [Google Scholar]
- Baird, G.C.; Brett, C.E. Submarine erosion on the anoxic seafloor: Statinomic, paleoenvironmental, and temporal significance of reworked pyrite-bone deposits. In Modern and Ancient Continental Shelf Anoxia; Tyson, R.V., Pearson, T., Eds.; Geological Society of Special Publication: London, UK, 1991; Volume 58, pp. 233–257. [Google Scholar]
- Wilkin, R.T.; Barnes, H.L.; Brantley, S.L. The size distribution of framboidal pyrite in modern sediments: An indicator of redox conditions. Geochim. Cosmo. Acta 1996, 60, 3897–3912. [Google Scholar] [CrossRef]
- Lyons, T.W. Sulfur isotopic trends and pathways of iron sulfide formation in upper Holocene sediments of the anoxic Black Sea. Geochim. Cosmo. Acta 1997, 61, 3367–3382. [Google Scholar] [CrossRef]
- Wignall, P.B.; Newton, R. Pyrite framboid diameter as a measure of oxygen deficiency in ancient mudrocks. Am. J. Sci. 1998, 298, 537–552. [Google Scholar] [CrossRef]
- Schieber, J. Sedimentary features indicating erosion, condensation, and hiatuses in the Chattanooga Shale of central Tennessee: Relevance for sedimentary and stratigraphic evolution. In Mudstones and Shales 1: Basin Studies, Sedimentology and Paleontology; Schieber, J., Zimmerle, W., Sethi, P., Eds.; Schweizerbartsch Verlagsbuchhandlung: Stuttgart, Germany, 1998; pp. 187–215. [Google Scholar]
- Schieber, J.; Baird, G. On the origin and significance of pyrite spheres in Devonian black shales of North America. J. Sed. Res. 2001, 71, 155–166. [Google Scholar] [CrossRef]
- Formolo, M.J.; Lyons, T.W. Accumulation and Preservation of Reworked Marine Pyrite Beneath an Oxygen-Rich Devonian Atmosphere: Constraints from Sulfur Isotopes and Framboid Textures. J. Sed. Res. 2007, 77, 623–633. [Google Scholar] [CrossRef]
- Rickard, D. Sulfidic sediments and sedimentary rocks. In Developments in Sedimentology; Van Loon, A.J., Ed.; Elsevier: Amsterdam, The Netherlands, 2012; p. 801. [Google Scholar]
- Rickard, D.; Mussmann, M.; Steadman, J.A. Sedimentary Sulfides. Elements 2017, 13, 117–122. [Google Scholar] [CrossRef]
- Pandalai, H.S.; Changkakoti, A.; Krouse, H.R.; Gunalan, N. The relationship between Carbon, Sulfur and Pyritic Iron in the Amjhore Deposit, Bihar, India. Econ. Geol. 1991, 86, 862–869. [Google Scholar] [CrossRef]
- Schieber, J.; Sur, S.; Banerjee, S. Benthic microbial mats in black shale units from the Vindhyan Supergroup, Middle Proterozoic of India: The challenges of recognizing the genuine article. In Atlas of Microbial Mat Features Preserved within the Siliciclastic Rock Record; Schieber, J., Bose, P.K., Eriksson, P.G., Banerjee, S., Sarkar, S., Altermann, W., Catuneanu, O., Eds.; Elsevier BV: Amsterdam, The Netherlands, 2007; pp. 189–197. [Google Scholar]
- Morse, J.W.; Luther, G.W., III. Chemical influences on trace metal-sulfide interactions in anoxic sediments. Geochim. Cosmochim. Acta 1999, 63, 3373–3378. [Google Scholar] [CrossRef]
- Partin, C.A.; Bekker, A.; Planavsky, N.J.; Scott, C.T.; Gill, B.C.; Li, C.; Podkovyrov, V.; Maslov, A.; Konhauser, K.O.; Lalonde, S.V.; et al. Large-scale fluctuations in Precambrian atmospheric and oceanic oxygen levels from the record of U in shales. Earth Planet. Sci. Lett. 2013, 369–370, 284–293. [Google Scholar] [CrossRef]
- Bertine, K.K.; Koide, M.; Goldberg, E.D. Comparative marine chemistries of some trivalent metals-bismuth, rhodium and rare Earth elements. Mar. Chem. 1996, 53, 89–100. [Google Scholar] [CrossRef]
- Taylor, S.R.; Mclennan, S.M. The geochemical evolution of the continental crust. Rev. Geophys. 1995, 33, 241–265. [Google Scholar] [CrossRef]
- Crowe, S.A.; Døssing, L.N.; Beukes, N.J.; Bau, M.; Kruger, S.J.; Frei, R.; Canfield, D.E. Atmospheric oxygenation three billion years ago. Nature 2013, 501, 535–538. [Google Scholar] [CrossRef] [PubMed]
- Planavsky, N.J.; Reinhard, C.T.; Wang, X.; Thomson, D.; McGoldrick, P.; Rainbird, R.H.; Johnson, T.; Fischer, W.W.; Lyons, T.W. Low Mid-Proterozoic atmospheric oxygen levels and the delayed rise of animals. Science 2014, 346, 635–638. [Google Scholar] [CrossRef] [PubMed]
- Mishra, M.; Sen, S. Provenance, tectonic setting and source-area weathering of Mesoproterozoic Kaimur Group, Vindhyan Supergroup, Central India. Geol. Acta 2012, 10, 283–293. [Google Scholar]
- Reimann, C.; De Caritat, P. Chemical Elements in the Environment, Fact Sheets for the Geochemist and Environmental Scientist; Springer: Berlin, Germany, 1998; p. 397. [Google Scholar]


© 2020 by the authors. Licensee MDPI, Basel, Switzerland. This article is an open access article distributed under the terms and conditions of the Creative Commons Attribution (CC BY) license (http://creativecommons.org/licenses/by/4.0/).
Share and Cite
Mukherjee, I.; Deb, M.; Large, R.R.; Halpin, J.; Meffre, S.; Ávila, J.; Belousov, I. Pyrite Textures, Trace Elements and Sulfur Isotope Chemistry of Bijaigarh Shales, Vindhyan Basin, India and Their Implications. Minerals 2020, 10, 588. https://doi.org/10.3390/min10070588
Mukherjee I, Deb M, Large RR, Halpin J, Meffre S, Ávila J, Belousov I. Pyrite Textures, Trace Elements and Sulfur Isotope Chemistry of Bijaigarh Shales, Vindhyan Basin, India and Their Implications. Minerals. 2020; 10(7):588. https://doi.org/10.3390/min10070588
Chicago/Turabian StyleMukherjee, Indrani, Mihir Deb, Ross R. Large, Jacqueline Halpin, Sebastien Meffre, Janaína Ávila, and Ivan Belousov. 2020. "Pyrite Textures, Trace Elements and Sulfur Isotope Chemistry of Bijaigarh Shales, Vindhyan Basin, India and Their Implications" Minerals 10, no. 7: 588. https://doi.org/10.3390/min10070588
APA StyleMukherjee, I., Deb, M., Large, R. R., Halpin, J., Meffre, S., Ávila, J., & Belousov, I. (2020). Pyrite Textures, Trace Elements and Sulfur Isotope Chemistry of Bijaigarh Shales, Vindhyan Basin, India and Their Implications. Minerals, 10(7), 588. https://doi.org/10.3390/min10070588