Article

Quantitative Analysis of Asbestos-Containing Materials Using Various Test Methods

1
Department of Oceanography, Pusan National University, Busan 46241, Korea
2
Division of Polar Paleoenvironment, Korea Polar Research Institute, Incheon 406840, Korea
*
Author to whom correspondence should be addressed.
Minerals 2020, 10(6), 568; https://doi.org/10.3390/min10060568
Submission received: 29 May 2020 / Revised: 22 June 2020 / Accepted: 23 June 2020 / Published: 24 June 2020
(This article belongs to the Special Issue Application of Mineral-Based Amendments)

Abstract

:
The advantages of X-ray powder diffraction (XRPD) analysis are its non-destructive nature, reliability, fast and easy sample preparation, and low costs. XRPD analysis has been used for mineral identification and the quantitative/qualitative determination of various types of fibrous minerals in asbestos-containing materials (ACMs). In order to test the detection limit of ACMs by XRPDD, standard samples with various concentrations of ACMs (0.1%, 1%, and 3%) were fabricated using three matrix materials (talc, vermiculite, and sepiolite). Asbestiform tremolite and chrysotile were identified in the XRPD profiles of the samples with 1% and 3% ACMs. Their integral intensities were positively correlated with the concentrations. However, the XRPD peak of asbestos was not found in the samples with 0.1% ACMs. Therefore, scanning and transmission electron microscopy were utilized to investigate the samples with a very low concentration of ACMs. Although the ACM concentration (0.1%) was negligible and its direct observation was time-consuming, electron microscopy allowed for the detection of asbestos in several matrix materials. Thus, a combination of XRPD and electron microscopy improve analytical performance and data reliability.

1. Introduction

Fibrous materials have been an important part of global industries over the last several decades [1]. Asbestos is an industrial term that covers six minerals: chrysotile, crocidolite, amosite, asbestiform anthophyllite, asbestiform actinolite, and asbestiform tremolite [2,3,4,5]. It has several advantages over man-made materials, such as its mechanical strength, resistance to heat and chemicals, durability, and sound absorption effects [6,7]. Asbestos minerals can be classified into two groups: serpentine and amphibole [8,9]. Chrysotile is the most common fibrous serpentine and constitutes over 90% of asbestos used globally [1]. Asbestos amphiboles are less important industrially [10]. Asbestos and elongate mineral particles can cause asbestosis, pleural abnormalities, bronchogenic carcinomas, and mesothelioma [11,12,13]. Symptoms do not appear within a short period of time with the incubation period being 25 to 40 years for pulmonary asbestosis and 15 to 30 years for lung cancer, depending on the intake of asbestos [14,15]. According to a previous study, nano-size airborne particles with a mean diameter of less than 100 nm are much more toxic than expected and can cause serious health problems, including chronic bronchitis, asthma complications, respiratory tract infections, and stroke [13,15,16,17]. As a result, asbestos-containing materials (ACMs), used for fireproofing, insulation, construction, and friction, have been banned in 52 countries, including the United States and the European Union [18]. Multiple techniques (X-ray powder diffraction (XRPD), scanning electron microscopy (SEM) and transmission electron microscopy (TEM), Fourier transform infrared (FTIR), and Raman spectroscopy) have been applied to detect and characterize the microparticles and nanoparticles of asbestos [7,19,20,21,22,23]. Until recently, the most common methods used have been electron microscopy and XRPD [24]. The most accurate method to detect asbestos has been determined to be the collection of ACMs and their microscopic examination [25]. SEM and TEM are direct observation methods and provide information on the surface features, size, shape, chemical composition, valence states, and structure of particles [26]. However, these methods are time-intensive, expensive, and destructive [27]. Moreover, it is necessary to analyze several hundreds of particles in order to guarantee that the analyzed sample is representative of the bulk sample [24]. On the contrary, XRPD analysis is fast, inexpensive, non-destructive, and reliable. Due to these advantages, XRPD has been used for mineral identification and the quantitative determination of various types of fibrous minerals in ACMs [20]. Herein, we investigate standard samples with various concentrations of ACMs (0.1%, 1%, and 3%), consisting of three matrix materials, namely talc, vermiculite, and sepiolite. These powders were prepared to compare XRPD, SEM, and TEM measurements for the quantitative determination of asbestiform tremolite with different concentrations. We also compare the results for the detection limit of asbestos (i.e., chrysotile and tremolite) in ACMs by XRPD, SEM-EDS, and TEM-EDS. We suggest that a combination of X-ray techniques and electron microscopy will improve the analytical performance and data reliability of ACM evaluation.

2. Materials and Methods

2.1. Materials

Three types of standard samples (talc (T), vermiculite (V), and sepiolite (S) matrix) containing 1% (T1–8, V1–8, and S1–8) and 3% (T9–16, V9–16, and S9–16) ACMs (i.e., chrysotile and asbestiform tremolite) were obtained from the National Institute of Environmental Research (NIER), South Korea. Additionally, talc (Mg3 Si4 O11·H2O), vermiculite ((Mg, Al, Fe2+)3(Si, Al)4O10(OH)2·nH2O), and sepiolite (Mg2Si3O8·2H2O) were purchased from Sigma-Aldrich. Talc, vermiculite, and sepiolite were used to make the 0.1% asbestos standard samples used as matrix materials. Powder samples were prepared using a milling device (Planetary Mill Pulverisette-5) at NIER for the production of homogeneous ACMs. The planetary ball mill was operated at a speed of 400 rpm for 10 min.

2.2. X-ray Diffractometer

The mineralogy of the standard matrix samples (i.e., talc, vermiculite, and sepiolite) containing 0.1%, 1%, 3%, and 0% of the pure matrix (control sample) was determined using a Rigaku HR-XRD SmartLab with Cu-Kα radiation (20 kV and 10 mA) at Yonsei University. Randomly oriented powder samples were homogenized with a pulverizer and by taping gently onto an automatic sample changer. The XRPD measurements were repeated five times to evaluate the homogeneity of each specimen and achieve reliable results. The XRPD profiles for a 2θ range from 3 to 60° were recorded at a scan speed of 1.5° /min, step size of 0.02°, a receiving slit size of 0.3 mm, and a divergence slit size of 1.25°. Crystallographica Search-Match software (version 2.0.3.1) was used to determine whether the prominent peaks of asbestos (i.e., chrysotile and asbestiform tremolite) could be detected, depending on the difference in content.

2.3. Scanning and Transmission Electron Microscopy (SEM and TEM)

The morphology and aspect ratio (length:width ≥ 3:1) of asbestos [28,29] in the specimens were confirmed using secondary electron images with magnification in the range of ×200–×1000. The images were taken at Yonsei University with a JEOL-7800F scanning electron microscope (SEM) equipped with an energy dispersive spectrometer (EDS) operating at 15 keV and with a working distance of 6 to 10 mm. The SEM samples were prepared in such a way that the powder samples with 0.1% asbestos were attached to a sticky carbon tape. The elemental composition of the asbestos particles was measured by EDS. Transmission electron microscopy (TEM) was used to confirm the aspect ratio (length:width) and morphology of asbestos in the specimens with 0.1% asbestos. In these samples, asbestos was not detected using only the bulk XRPD analysis. Asbestos structure and its elemental composition were acquired at the Korea Basic Science Institute, Seoul, Korea, utilizing a TECHNAL G2 F30 field emission TEM (FE-TEM) (FEI Company, Hillsboro, OR, USA) equipped with an EDS operating at 300 kV. The 0.1% homogenized powder samples were dispersed in ethanol (0.0001 mg/mL), immersed in an ultrasonic water bath for 5 min, removed with a TEM micro Cu-grid and completely dried on a clean bench. The chemical composition of asbestos minerals was measured by EDS with an acquisition time of 30 s under the scanning transmission electron microscope (STEM) mode to confirm that the observed mineral particles were not the matrix minerals but asbestos.

2.4. Homogeneity Evaluation

In order to achieve reliable results in the process of analyzing three types of standard matrix minerals (i.e., talc, vermiculite, and sepiolite) and asbestos (i.e., chrysotile and asbestiform tremolite) mixture samples, it was essential to evaluate the homogeneity of each sample. As such, a total of 144 mixture samples (3 types of matrix × triplet test × 16 repetitions) were evaluated for homogeneity. One-way analysis of variance (one-way ANOVA) is a widely used statistical technique to compare group means [30]. This statistical method was applied to confirm the similarity of the proportional means of 10 different mixture powder samples. For the homogeneity assessment, the statistical values of 10 samples were evaluated at a 95% confidence level using the p-value, while the F-value was to be less than the F-rejection value [31].

3. Results and Discussion

3.1. XRPD Analysis and Homogeneity Evaluation

The XRPD analyses of talc, vermiculite, and sepiolite with different asbestos concentrations of 0.1%, 1% and 3% were compared with those of the standard materials for the quantitative analysis of asbestiform tremolite in the homogeneous materials (Figure 1). The peaks of asbestos, including tremolite and chrysotile, were identified in the samples with 1% and 3% ACMs. In the XRPD profiles, the (002) (d = 0.730 nm) and (004) (d = 0.365 nm) peaks of chrysotile, which are unique to chrysotile, were observed. However, they were not observed in the samples with 0.1% and 0% ACMs. This means that the peaks of asbestiform tremolite and chrysotile in these samples were weak and broad (Figure 1). They likely overlapped with the main peaks of the matrix materials. These results were homogenous among all the analyzed matrix materials (i.e., talc, vermiculite, and sepiolite). For this reason, additional methods should be used for the detection of trace asbestos in industrial products such as cement, friction materials, and other similar products [1]. The integrated intensities of asbestos peaks for the samples with 1% and 3% ACMs that showed distinguishable peaks were calculated (Table 1, Table 2 and Table 3). T1–T8, containing 1% asbestos, had integral intensities in the range of 6036–6180, whereas T9–T16, containing 3% asbestos, presented integral intensities in the range of 20,146–21,166 (Table 1). The intensities of T9–T16 were approximately 3.3 times those of T1–T8. The integral intensities of V1–V8, containing 1% asbestos, were in the range of 3006–3422, whereas the integral intensities of V9–V16, containing 3% asbestos, were determined to be in the range of 9408–11,557 (Table 2). The intensities of V9–V16 were approximately 3.4 times those of V1–V8. The integral intensities of S1–S8 and S9–S16 were 9496–11,018 and 20,016–21,910, respectively (Table 3); thus, the latter values were approximately 2.1 times the former. Generally, the intensities of representative peaks in the XRPD profile correlated positively with the concentration of asbestos in matrix materials. Thus, XRPD analysis allows for a quick and simple mineral identification with a detection limit of 1%.
The critical F value and F ratio of one-way ANOVA were compared to evaluate the homogeneity of the ACM samples. The homogeneity at a 95% confidence level using the p-value was calculated as a statistical value [31]; the analyzed values are summarized in Table 4. The homogeneity of T1–T8, T9–T16, V9–V16, S1–S8, and S9–S16 was evaluated using the statistical test of the one-way ANOVA; the respective F ratios (1.8388, 0.9688, 0.7656, 1.4317, 1.2310) were less than the critical F value (2.6572). This demonstrates homogeneity at a 95% confidence level. However, some F ratios for V1–V8 (3.8964) were higher than the critical F value (2.6572), indicating non-homogeneity at a 95% confidence level. According to these results, three kinds of standard ACMs with various concentrations were sufficiently homogeneous and reproducible [20,32].

3.2. Electron Microscopy

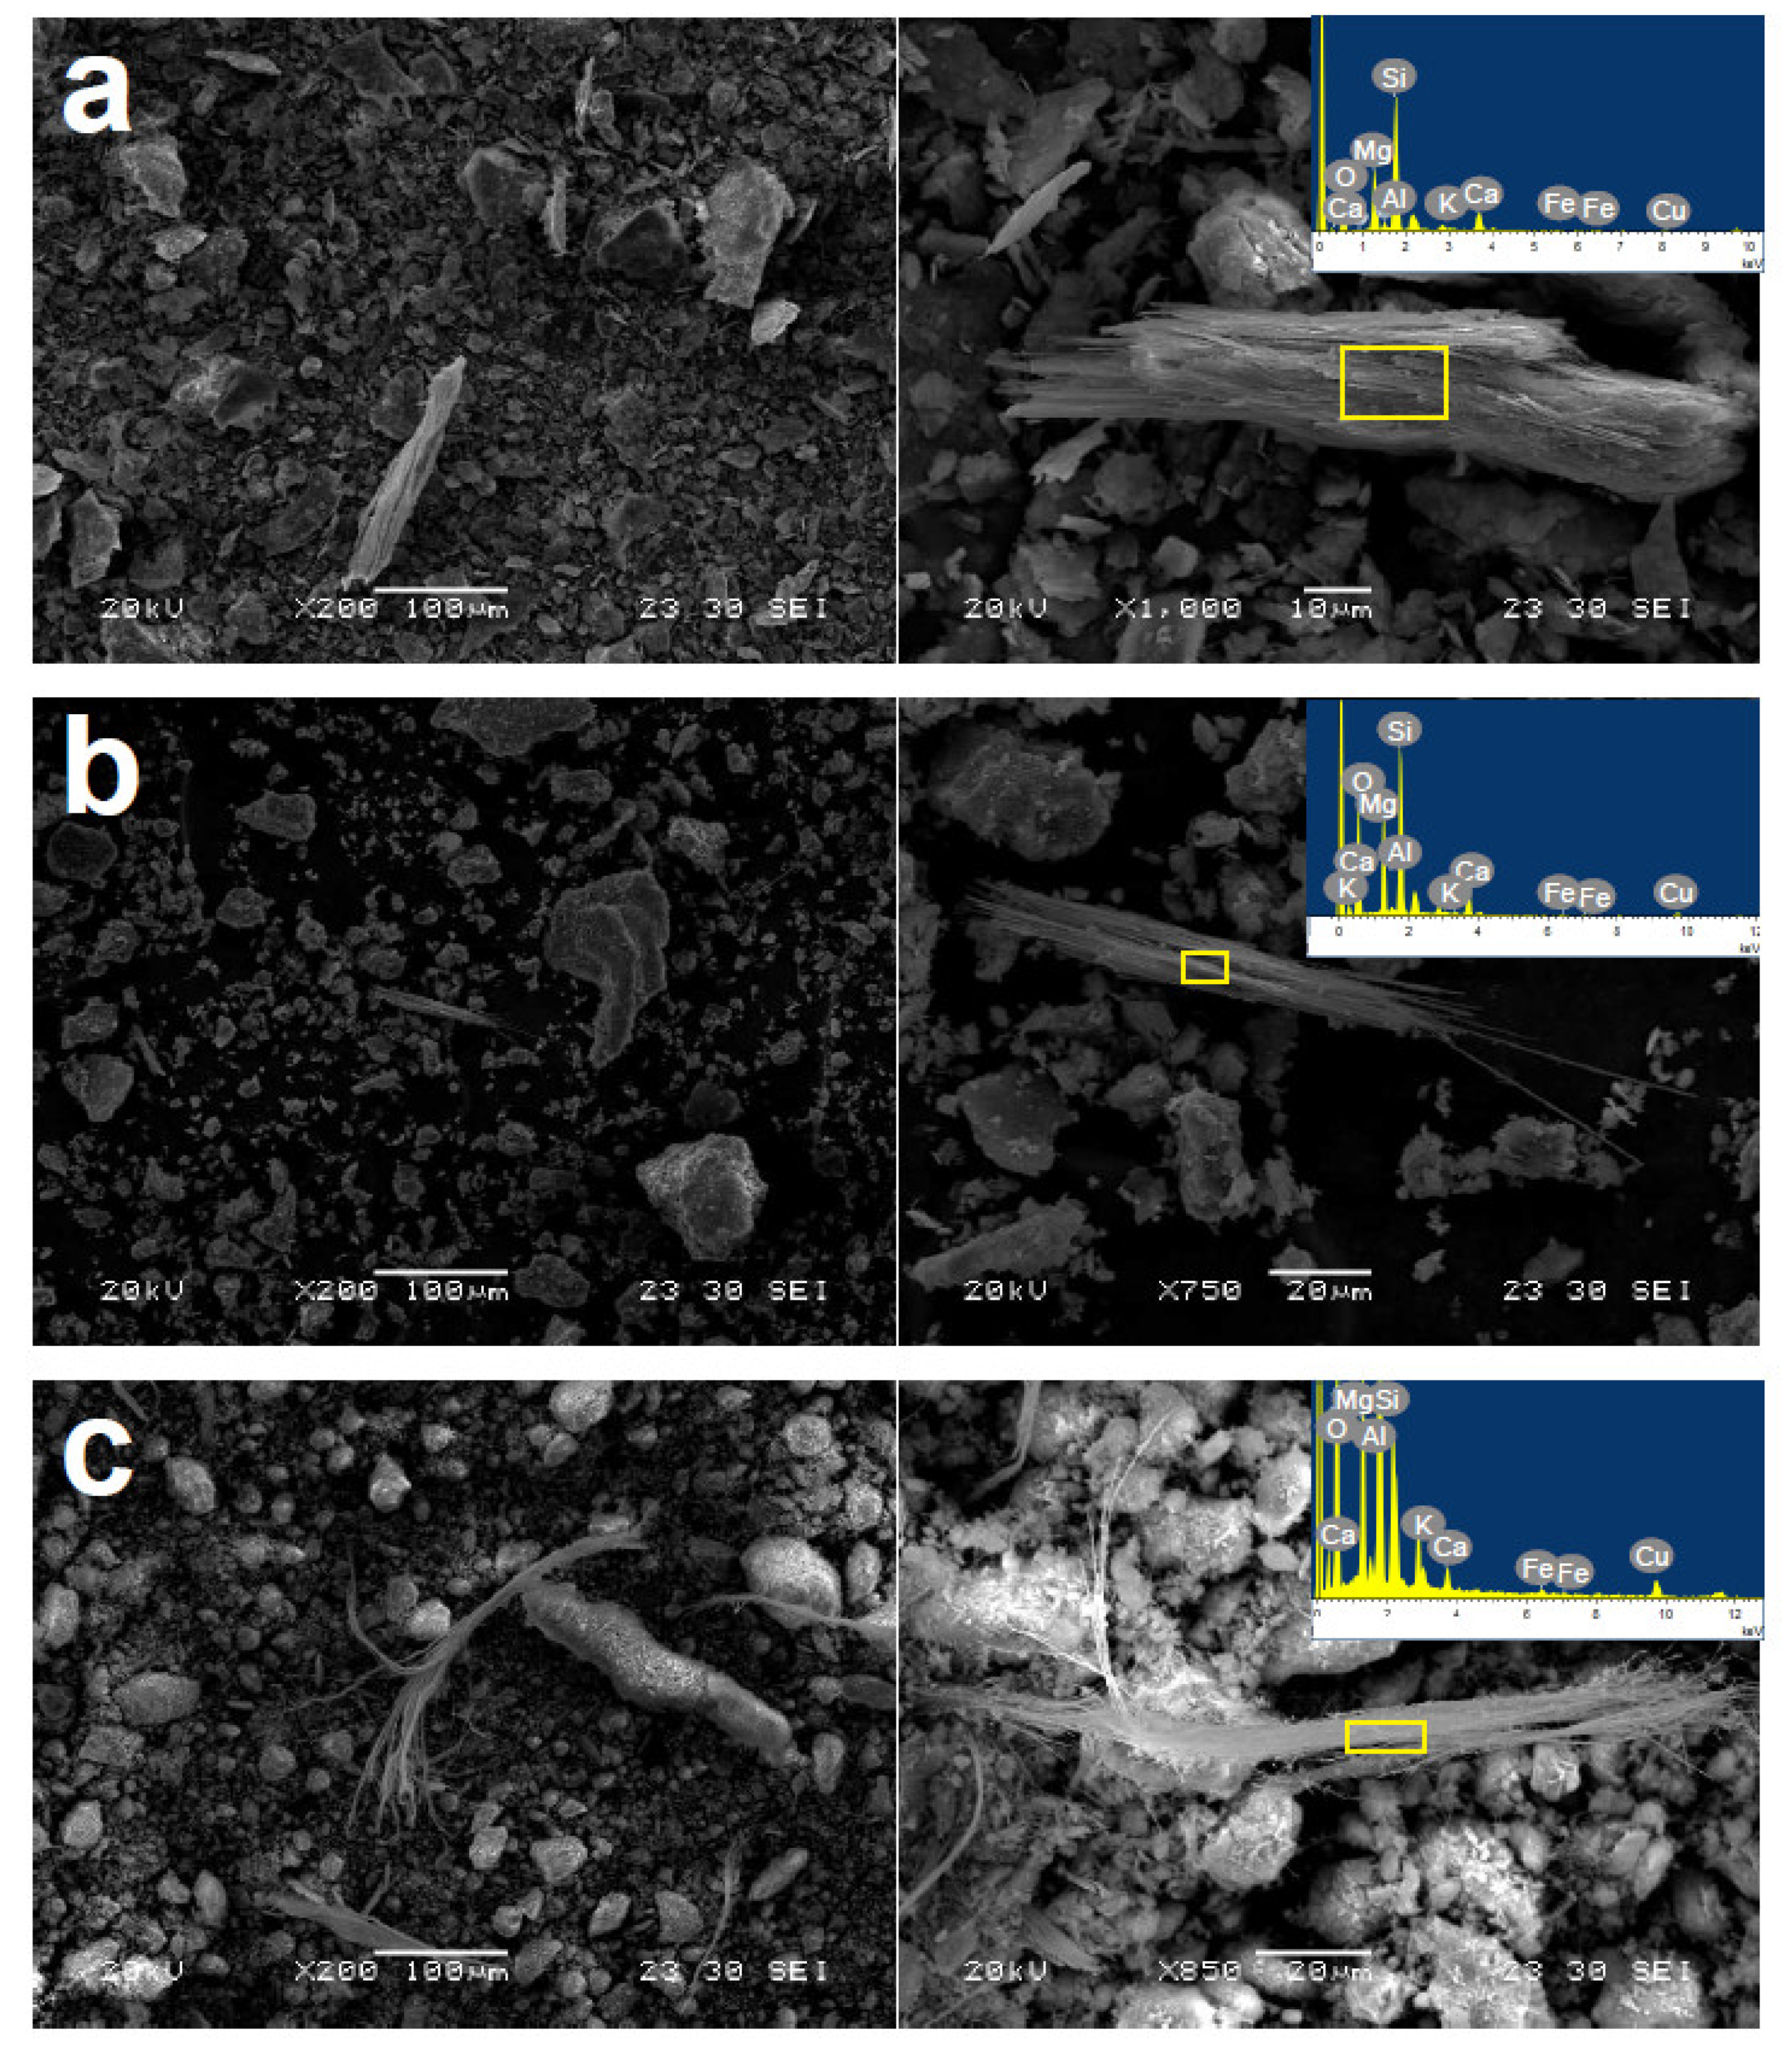
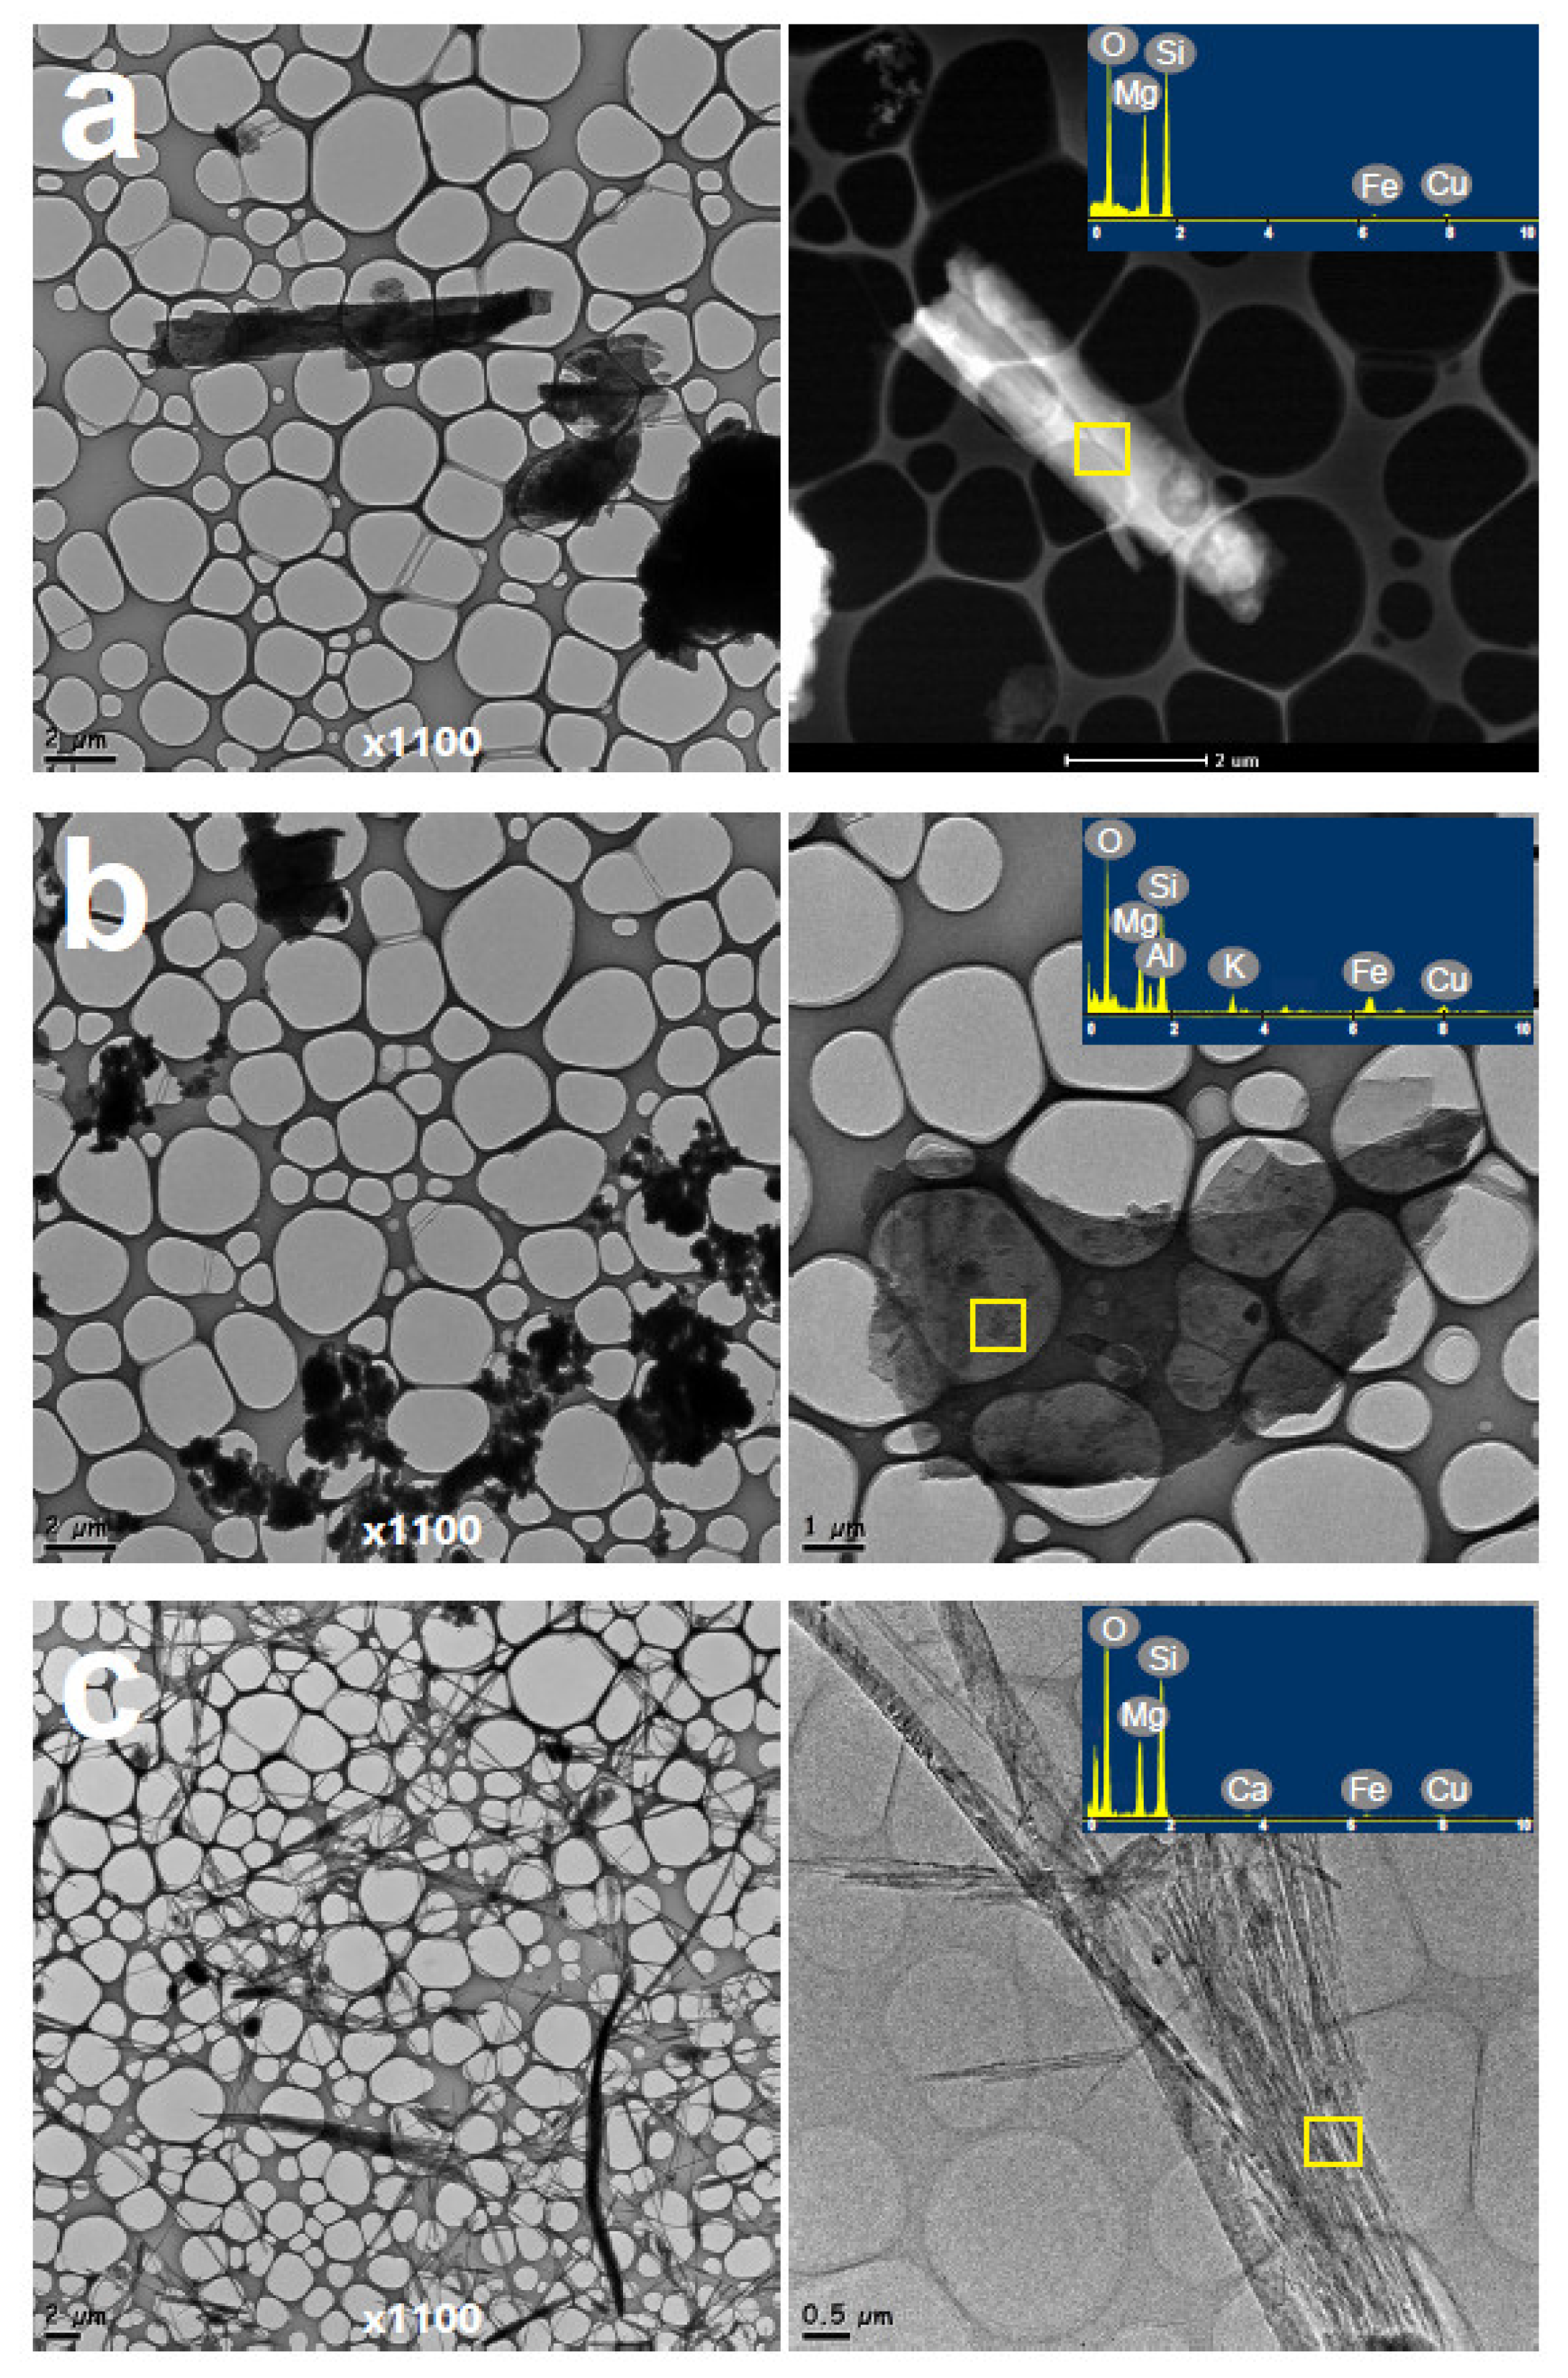
Scanning and transmission electron microscopy were performed for the samples with 0.1% ACMs (i.e., talc, vermiculite, and sepiolite) to detect the concentration of asbestos (Figure 2 and Figure 3). The SEM imaging revealed that elongate mineral particles were mostly present adjacent to the matrix materials. Most of the elongate mineral particles were over 100 μm in length, and their thickness was not uniform (Figure 2). Elongate mineral particles [33] ranged from 10 to 150 μm in length and from 0.1 to 1 μm in diameter. Chrysotile (Figure 2) was composed of straight, thin, and flexible elongate particles, identifiable as asbestos due to their length/diameter ratio of more than 3 [34,35]. Individual elongate mineral particles presented a rough surface and measured less than 0.1 μm in length, thus being below the SEM resolution [36,37]. The asbestos particles were also observed using TEM. They appeared more isolated than those in the SEM samples (Figure 3), making it easier to find them and note their morphology in high resolution (Figure 3c). According to a previous study, the detection limit of elongate mineral particles by TEM is approximately 0.01 particles/cm2 in the air [1]. This is probably due to the sub-micron size of fine particles that can be observed by TEM (Figure 3) and cannot be detected by XRPD analysis. The peaks of asbestos, including chrysotile and asbestiform tremolite, were very weak and overlapped with the peaks of other minerals. Despite being time-consuming, destructive, and expensive, electron microscopy is essential for the identification and quantification of finer elongate mineral particles in low-concentration ACM samples. As such, electron microscopy should be performed and compared with the XRPD results to improve analytical efficiency. The correlation of a point count method using electron microscopy and the XRPD analysis will be presented in a future study.

4. Conclusions

This study provides reliable and simple techniques for the identification of trace amounts of asbestos in several matrix materials and suggests a new analytical approach. (a) Various concentrations of ACMs were used for the determination of X-ray diffractometric quantitation. The homogeneity of the standard materials was estimated by the one-way ANOVA test. Our results suggest that standard materials as prepared herein were sufficiently homogenous in mixture phases. The XRPD analysis detected asbestos in the samples with 1% and 3% ACMs; however, the XRPD peak of asbestos was not visible in the samples with 0.1% ACMs. Although the XRPD profiles could be obtained quickly and easily, they presented a detection limit of 1% ACMs. (b) Scanning and transmission electron microscopy allowed for the detection of asbestos in matrix materials with a concentration of 0.1%. The asbestos particles were competently visualized in microscopic images detailing the particle morphology and size. As such, electron microscopy allows for the detection of trace amounts of asbestos and its qualitative estimation, despite being time-consuming, destructive, and expensive.
The analytical efficiency and data reliability can be improved by a combination of X-ray techniques and electron microscopy. The results outlined herein can also be used to detect trace minerals in bulk sediments in natural environments.

Author Contributions

K.Y. designed the study concept and produced the SEM and TEM data. K.-C.Y. revised the manuscript. J.J. contributed to the XRPD data production and manuscript preparation. All authors have read and agreed to the published version of the manuscript.

Funding

This work was funded by a Pusan National University Research Grant, 2020 to K.Y. and an Korea Polar Research Institute (KOPRI) project (PE20180) to K.-C.Y.

Acknowledgments

This work was supported by a Pusan National University Research Grant, 2020 to K.Y. and an Antarctic Project of KOPRI (PE20180) to K.-C.Y.

Conflicts of Interest

The authors declare no conflict of interest.

References

  1. Mossman, B.T.; Bignon, J.; Corn, M.; Seaton, A.; Gee, J.B. Asbestos: Scientific developments and implications for public policy. Science 1990, 247, 294–301. [Google Scholar] [CrossRef] [PubMed] [Green Version]
  2. Williams, C.; Dell, L.; Adams, R.; Rose, T.; Van Orden, D. State-of-the-science assessment of non-asbestos amphibole exposure: Is there a cancer risk? Environ. Geochem. Health 2013, 35, 357–377. [Google Scholar] [CrossRef] [PubMed]
  3. Campbell, W.J. Selected Silicate Minerals and Their Asbestiform Varieties: Mineralogical Definition Sand Identification-Characterization; Department of the Interior, Bureau of Mines: Washington, DC, USA, 1977; Volume 8751. [Google Scholar]
  4. Punturo, R.; Ricchiuti, C.; Mengel, K.; Apollaro, C.; De Rosa, R.; Bloise, A. Serpentinite-derived soils in southern Italy: Potential for hazardous exposure. J. Mediterr. Earth Sci. 2018, 10, 51–61. [Google Scholar]
  5. Punturo, R.; Ricchiuti, C.; Bloise, A. Assessment of Serpentine Group Minerals in Soils: A Case Study from the Village of San Severino Lucano (Basilicata, Southern Italy). Fibers 2019, 7, 18. [Google Scholar] [CrossRef] [Green Version]
  6. Kim, H.-W.; Park, G.-Y.; Han, J.-G.; Han, Y.-S.; Hwang, B.-G.; Lee, J.-H. Releasing of asbestos fibers from the weathered asbestos cement slate roofing. J. Korean Soc. Occup. Environ. Hyg. 2010, 20, 88–93. [Google Scholar]
  7. Murr, L.E.; Soto, K. TEM comparison of chrysotile (asbestos) nanotubes and carbon nanotubes. J. Mater. Sci. 2004, 39, 4941–4947. [Google Scholar] [CrossRef]
  8. Wagner, J.C.; Sleggs, C.A.; Marchand, P. Diffuse pleural mesothelioma and asbestos exposure in the North Western Cape Province. Occup. Environ. Med. 1960, 17, 260–271. [Google Scholar] [CrossRef] [Green Version]
  9. World Health Organization. Asbestos and other natural mineral fibres. International programme on chemical safety. Environ. Health Criteria 1986, 53, 194. [Google Scholar]
  10. Skinner, H.C.W.; Ross, M.; Frondel, C. Asbestos and Other Fibrous Materials: Mineralogy, Crystal Chemistry, and Health Effects; Oxford University Press: Oxford, UK, 1988. [Google Scholar]
  11. Mossman, B.T.; Gee, J.B.L. Asbestos-related diseases. New Engl. J. Med. 1989, 320, 1721–1730. [Google Scholar] [CrossRef]
  12. Jablonski, R.P.; Kim, S.; Cheresh, P.; Liu, G.; Kamp, D.W. Insights into mineral fibre-induced lung epithelial cell toxicity and pulmonary fibrosis. In Mineral Fibres: Crystal Chemistry, Chemical-Physical Properties, Biological Interaction and Toxicity; Northwestern University: Evanston, IL, USA, 2017; pp. 447–500. [Google Scholar]
  13. WHO. Guidelines for Drinking-Water Quality; World Health Organization: Geneva, Switzerland, 2004; Volume 1. [Google Scholar]
  14. Becklake, M.R. Asbestos-related diseases of the lung and other organs: Their epidemiology and implications for clinical practice. Am. Rev. Respir. Dis. 1976, 114, 187–227. [Google Scholar]
  15. International Agency for Research on Cancer. Asbestos (chrysotile, amosite, crocidolite, tremolite, actinolite, and anthophyllite). In Metals, Arsenic, Dusts and Fibres; A review of human carcinogens; World Health Organization: Geneva, Switzerland, 2012; pp. 219–309. [Google Scholar]
  16. Samet, J.M.; Dominici, F.; Curriero, F.C.; Coursac, I.; Zeger, S.L. Fine particulate air pollution and mortality in 20 US cities, 1987–1994. New Engl. J. Med. 2000, 343, 1742–1749. [Google Scholar] [CrossRef] [PubMed]
  17. Europe, W. Air Quality Guidelines, 2nd ed.; Regional Office for Europe: Copenhagen, Denmark, 2000. [Google Scholar]
  18. LaDou, J.; Castleman, B.; Frank, A.; Gochfeld, M.; Greenberg, M.; Huff, J.; Joshi, T.K.; Landrigan, P.J.; Lemen, R.; Myers, J. The case for a global ban on asbestos. Environ. Health Perspect. 2010, 118, 897–901. [Google Scholar] [CrossRef] [PubMed] [Green Version]
  19. Della Ventura, G.; Vigliaturo, R.; Gieré, R.; Pollastri, S.; Gualtieri, A.F.; Iezzi, G. Infra Red Spectroscopy of the Regulated Asbestos Amphiboles. Minerals 2018, 8, 413. [Google Scholar] [CrossRef] [PubMed] [Green Version]
  20. Asahi, T.; Kobayashi, S.; Nakayama, K.; Konya, T.; Fujinawa, G.; Nakamura, T. Preparation and evaluation of a chrysotile asbestos-containing standard material for validating x-ray diffractometric quantitation. Anal. Sci. 2011, 27, 1217. [Google Scholar] [CrossRef] [PubMed] [Green Version]
  21. Wang, N.; Jaurand, M.; Magne, L.; Kheuang, L.; Pinchon, M.; Bignon, J. The interactions between asbestos fibers and metaphase chromosomes of rat pleural mesothelial cells in culture. A scanning and transmission electron microscopic study. Am. J. Pathol. 1987, 126, 343. [Google Scholar]
  22. Bloise, A.; Miriello, D. Multi-analytical approach for identifying asbestos minerals in situ. Geosciences 2018, 8, 133. [Google Scholar] [CrossRef] [Green Version]
  23. Januch, J.; Brattin, W.; Woodbury, L.; Berry, D. Evaluation of a fluidized bed asbestos segregator preparation method for the analysis of low-levels of asbestos in soil and other solid media. Anal. Methods 2013, 5, 1658–1668. [Google Scholar] [CrossRef]
  24. Borchert, H.; Shevchenko, E.V.; Robert, A.; Mekis, I.; Kornowski, A.; Grübel, G.; Weller, H. Determination of nanocrystal sizes: A comparison of TEM, SAXS, and XRD studies of highly monodisperse CoPt3 particles. Langmuir 2005, 21, 1931–1936. [Google Scholar] [CrossRef]
  25. Compton, S.P. TEM Quantification of Amphibole in Asbestos Containing Materials: A Summary of Data 20 Years in the Making. Microsc. Microanal. 2018, 24, 1184–1185. [Google Scholar] [CrossRef] [Green Version]
  26. Vigliaturo, R.; Pollastri, S.; Gieré, R.; Gualtieri, A.F.; Dražić, G. Experimental quantification of the Fe-valence state at amosite-asbestos boundaries using acSTEM dual-electron energy-loss spectroscopy. Am. Mineral. 2019, 104, 1820–1828. [Google Scholar] [CrossRef]
  27. Engelmann, H.-J. Advantages and Disadvantages of TEM Sample Preparation Using the FIB Technique. Prakt. Metallogr. 2003, 40, 163–174. [Google Scholar]
  28. Vigliaturo, R.; Della Ventura, G.; Choi, J.K.; Marengo, A.; Lucci, F.; O’Shea, M.J.; Pérez-Rodríguez, I.; Gieré, R. Mineralogical characterization and dissolution experiments in Gamble’s solution of Tremolitic amphibole from Passo di Caldenno (Sondrio, Italy). Minerals 2018, 8, 557. [Google Scholar] [CrossRef] [PubMed] [Green Version]
  29. Gualtieri, A.F. Naturally Occurring Asbestos: A Global Health Concern? State of the Art and Open Issues. Environ. Eng. Geosci. 2020, 26, 3–8. [Google Scholar] [CrossRef]
  30. Hirsch, R.F. Analysis of variance in analytical chemistry. Anal. Chem. 1977, 49, 691A–700A. [Google Scholar] [CrossRef]
  31. Guide, I. General Requirements for the Competence of Reference Material Producers; ISO: Geneva, Switzerland, 2009. [Google Scholar]
  32. Guide, I. 35 Reference Materials—General and Statistical Principles for Certification; International Organization for Standardization: Geneva, Switzerland, 2006. [Google Scholar]
  33. Schulte, P.S.; Trout, D.; Zumwalde, R.D. Asbestos Fibers and Other Elongate Mineral Particles: State of the Science and Roadmap for Research; United States Department of Health and Human Services: Washington, DC, USA, 2011. [Google Scholar]
  34. Davis, J.M. In Vivo Assays to Evaluate the Pathogenic Effects of Minerals in Rodents; Mineralogical Society of America: Washington, DC, USA, 1993. [Google Scholar]
  35. Militello, G.M.; Sanguineti, E.; Yus González, A.; Mantovani, F.; Gaggero, L. The Concentration of Asbestos Fibers in Bulk Samples and Its Variation with Grain Size. Minerals 2019, 9, 539. [Google Scholar] [CrossRef] [Green Version]
  36. Yang, H.; Xiao, Y.; Liu, K.; Yang, Y.; Feng, Q. Physicochemical dispersion of chrysotile. Colloids Surf. A Physicochem. Eng. Asp. 2007, 301, 341–345. [Google Scholar] [CrossRef]
  37. Bloise, A.; Ricchiuti, C.; Lanzafame, G.; Punturo, R. X-ray synchrotron microtomography: A new technique for characterizing chrysotile asbestos. Sci. Total Environ. 2020, 703, 135675. [Google Scholar] [CrossRef]
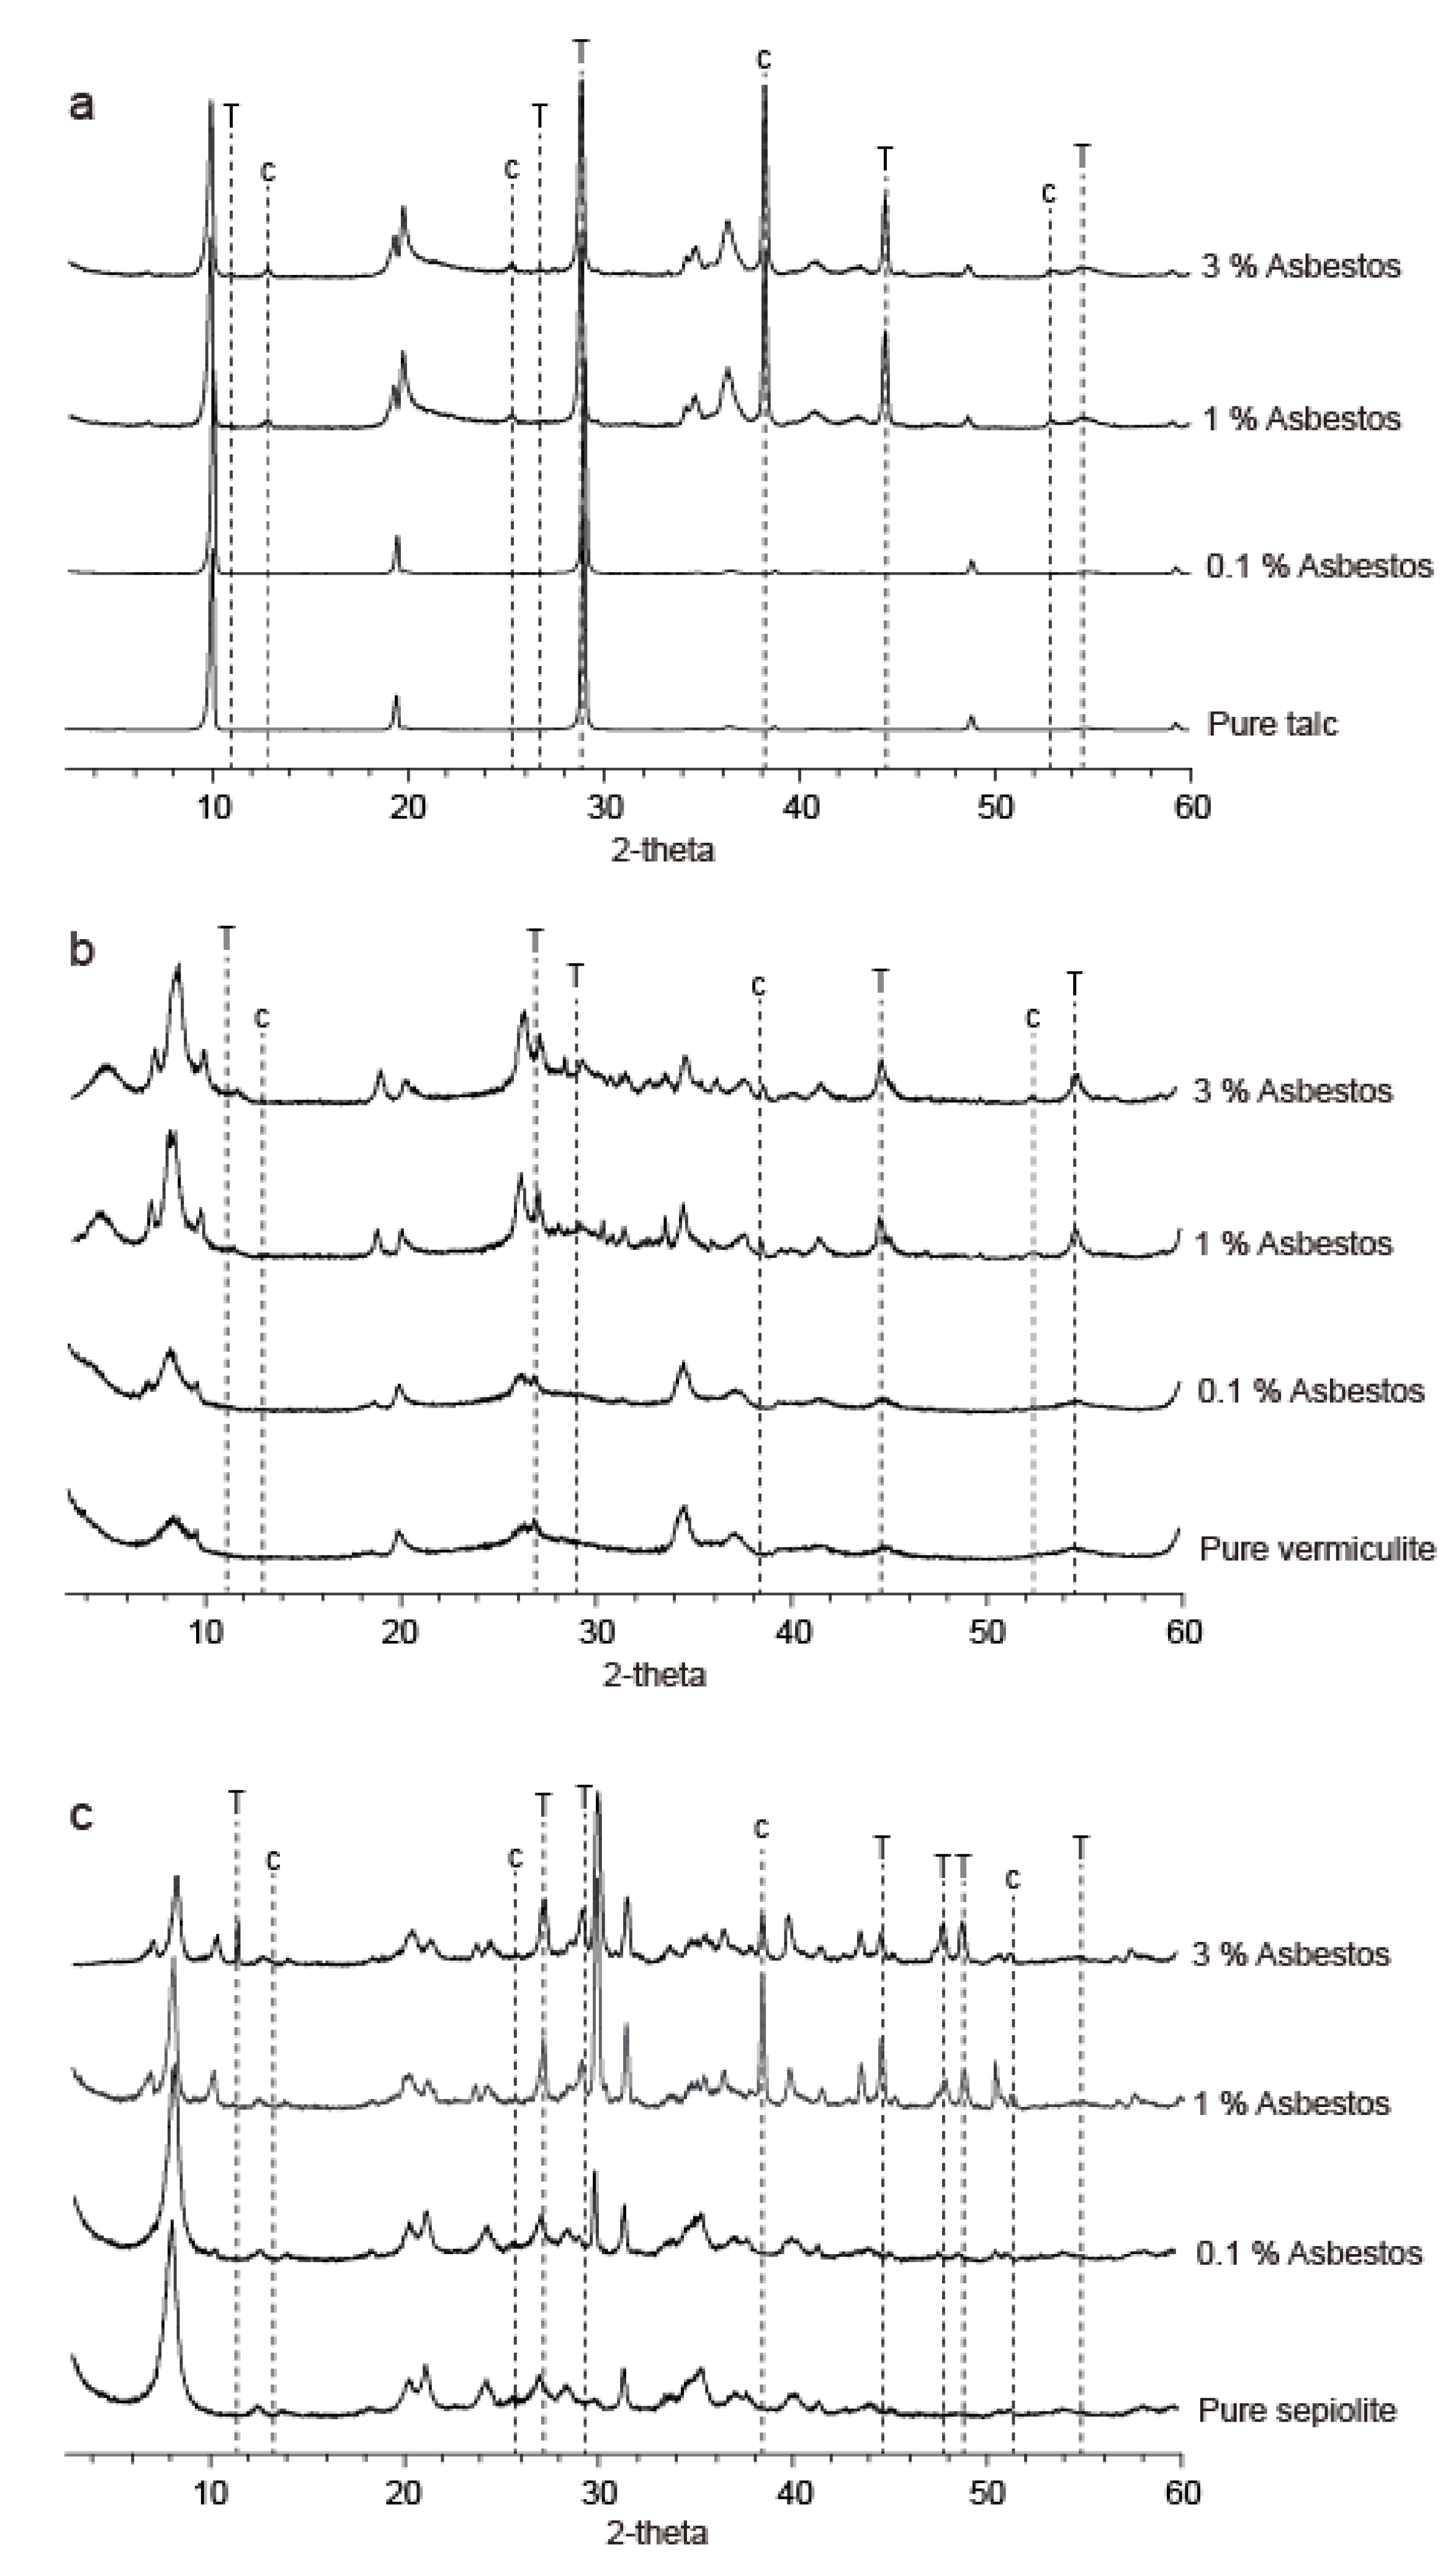
Figure 1. X-ray diffraction patterns of standard asbestos-containing materials (ACMs): (a) talc, (b) vermiculite, and (c) sepiolite with different concentrations of asbestos (0%, 0.1%, 1%, and 3%). T represents asbestiform tremolite; C represents chrysotile.
Minerals 10 00568 g001
Figure 2. Representative SEM images and EDS spectra of asbestos in a sample with 0.1% ACMs: (a) talc, (b) vermiculite, and (c) sepiolite.
Minerals 10 00568 g002
Figure 3. Representative TEM micrographs of asbestos in a sample with 0.1% ACMs: (a) talc, (b) vermiculite, and (c) sepiolite. EDS analysis of the area (inset) further confirms the presence of silicate minerals.
Minerals 10 00568 g003
Table 1. Integral intensities of asbestos peaks for standard talc samples with different ACM concentrations (1% and 3%).
No.Integral IntensityNo.Integral Intensity
123123
T1626647897236T9 20,51217,56718,319
T2539953852458T1021,74416,51319,647
T3687458606624T1120,79321,93322,993
T4582862307330T1224,70421,83820,618
T5684562575552T1318,12121,01523,730
T6582874105714T1422,18218,72223,055
T7613670138095T1518,62723,21822,257
T8556553466427T1622,61720,36318,707
Avg.609360366180Avg.21,16320,14621,166
SD5498801725SD214723352119
T1–8 contain 1% asbestos, and T9–16 contain 3% asbestos.
Table 2. Integral intensities of asbestos peaks for standard vermiculite samples with different ACM concentrations (1% and 3%).
No.Integral IntensityNo.Integral Intensity
123123
V119761140773V9 779497236376
V217122455956V1015,10712,5067065
V333033702722V11708998556619
V46472363915V1263731512212880
V5248723847027V136775672912584
V6454053555896V1414,093782311,234
V7420359052175V1583421149916851
V8517740737749V169689867018,849
Avg.300634223277Avg.940810,24111,557
SD156616363068SD337627154713
V1–8 contain 1% asbestos, and V9–16 contain 3% asbestos.
Table 3. Integral intensities of asbestos peaks for standard sepiolite samples with different ACM concentrations (1% and 3%).
No.Integral IntensityNo.Integral Intensity
123123
S17670929210,224S9 23,62715,86823,029
S211,13313,46612,441S1017,17118,42822,624
S311,132897613,323S1120,29716,30520,722
S4797711,09710,260S1219,14121,84419,389
S511,38511,34312,337S1318,24422,30718,799
S610,43197839008S1422,29324,45824,180
S79436667811,391S1518,18820,57422,984
S8680412,7499156S1621,16922,86923,549
Avg.949610,42311,018Avg.20,01620,33221,910
SD180021971600SD223531502007
S1–8 contain 1% asbestos, and S9–16 contain 3% asbestos.
Table 4. Results of the evaluation of sample homogeneity.
Sample No. T1–T8
Source of VariationSum of SquaresDegrees of FreedomMean SquaresF RatioP-ValueF-Crit
Between groups12,676,33171,810,9041.83880.14822.6572
Among groups15,757,69916984,856
Total28,434,03023
Sample No. T9–T16
Source of VariationSum of SquaresDegrees of FreedomMean SquaresF RatioP-ValueF-Crit
Between groups31,973,31374,597,6160.96880.48542.6572
Among groups75,432,023165,714,501
Total107,405,33623
Sample No. V1–V8
Source of VariationSum of SquaresDegrees of FreedomMean SquaresF RatioP-ValueF-Crit
Between groups64,612,875792304113.89640.01152.6572
Among groups37,903,497162368969
Total102,516,37223
Sample No. V9–V16
Source of VariationSum of SquaresDegrees of FreedomMean SquaresF RatioP-ValueF-Crit
Between groups76,695,341710,956,4770.76560.62372.6572
Among groups229,000,00816
Total305,695,34923
Sample No. S1–S8
Source of VariationSum of SquaresDegrees of FreedomMean SquaresF RatioP-ValueF-Crit
Between groups32,276,82374,610,9751.43170.26002.6572
Among groups51,528,728163,220,546
Total83,805,551
Sample No. S9–S16
Source of VariationSum of SquaresDegrees of FreedomMean SquaresF RatioP-ValueF-Crit
Between groups52,197,52377,456,3601.23100.34262.6572
Among groups96,916,481166,057,280
Total149,114,00423