Article

Significance of Fracture-Filling Rose-Like Calcite Crystal Clusters in the SE Pyrenees

1
Institut de Ciències de la Terra Jaume Almera, ICTJA-CSIC, Lluís Solé i Sabaris s/n, 08028 Barcelona, Spain
2
Departament de Mineralogia, Petrologia i Geologia Aplicada, Facultat de Ciències de la Terra, Universitat de Barcelona (UB), Martí i Franquès s/n, 08028 Barcelona, Spain
3
Department of Earth Science and Engineering, Imperial College London, London SW7 2BP, UK
*
Author to whom correspondence should be addressed.
Minerals 2020, 10(6), 522; https://doi.org/10.3390/min10060522
Submission received: 7 May 2020 / Revised: 28 May 2020 / Accepted: 4 June 2020 / Published: 5 June 2020

Abstract

:
Fracture-filling rose-like clusters of bladed calcite crystals are found in the northern sector of the Cadí thrust sheet (SE Pyrenees). This unusual calcite crystal morphology has been characterized by using optical and electron microscope, X-ray diffraction, Raman spectroscopy, δ18O, δ13C, 87Sr/86Sr, clumped isotopes, and major and rare earth elements + yttrium (REEs + Y) analysis. Petrographic observations and powder X-ray diffraction measurements indicate that these bladed crystals are mainly made of massive rhombic crystals with the conventional (104) faces, as well as of possibly younger, less abundant, and smaller laminar crystals displaying (108) and/or ( 1 ¯ 08) rhombic faces. Raman analysis of liquid fluid inclusions indicates the presence of aromatic hydrocarbons and occasionally alkanes. Clumped isotopes thermometry reflects that bladed calcite precipitated from meteoric fluids at ~60–65 °C. The 87Sr/86Sr ratios and major elements and REEs content of calcite indicate that these fluids interacted with Eocene marine carbonates. The presence of younger ‘nailhead’ calcite indicates later migration of shallow fresh groundwater. The results reveal that rose-like calcite clusters precipitated, at least in the studied area, due to a CO2 release by boiling of meteoric waters that mixed with benzene and aromatic hydrocarbons. This mixing decreased the boiling temperature at ~60–65 °C. The results also suggest that the high Sr content in calcite, and probably the presence of proteins within hydrocarbons trapped in fluid inclusions, controlled the precipitation of bladed crystals with (104) rhombohedral faces.

1. Introduction

The geochemical composition of calcite cement provides information about the type, source, temperature, and age of the fluids from which this mineral precipitated [1,2,3,4,5]. Furthermore, the geochemical composition of adjacent host rocks also records the degree of fluid–rock interaction [6,7,8,9]. Physical parameters such as temperature, ion saturation, and pressure during mineral precipitation have a strong influence on the morphology of calcite crystals [10,11,12,13,14], which is also controlled by pH of fluids and the presence of organic compounds [15,16]. The study of these parameters allows us to decipher processes such as boiling and effervescence during fluid migration, which also control the precipitation of calcites with different morphologies [12,17,18,19,20,21,22,23,24]. However, fluid systems are complex, and the conditions at which these processes take place can change due to the input of exotic fluids [25,26,27]. To identify these changes, petrographic observations, coupled with crystallographic and geochemical analyses, are needed.
The Southern Pyrenees is a fold and thrust belt where fluid migration has been well-studied by means of the geochemical and petrographic analysis of fracture-filling calcites [1,2,28,29,30,31,32,33,34,35,36,37,38]. However, these previous works only focused on the type and origin of fluids from which calcites precipitated during different stages of compressional deformation. A more detailed study integrating the analysis of the morphology and geochemistry of fracture-filling calcite crystals will have strong implications on identifying processes such as boiling and/or effervescence, and changes in fluid salinity.
In the present work, we present an example of fracture-filling rose-like calcite crystal clusters of bladed calcites cropping out in the Southeastern Pyrenees. These uncommon calcite morphologies have been characterized by using optical, cathodoluminescence and electron microscope, X-ray diffraction (XRD), Raman spectroscopy, δ18O, δ13C, 87Sr/86Sr, and clumped isotopes, as well as major elements and rare earth element + yttrium analysis (REEs + Y). The results provide information about what parameters controlled the precipitation of these bladed calcite crystals in the Pyrenees area.

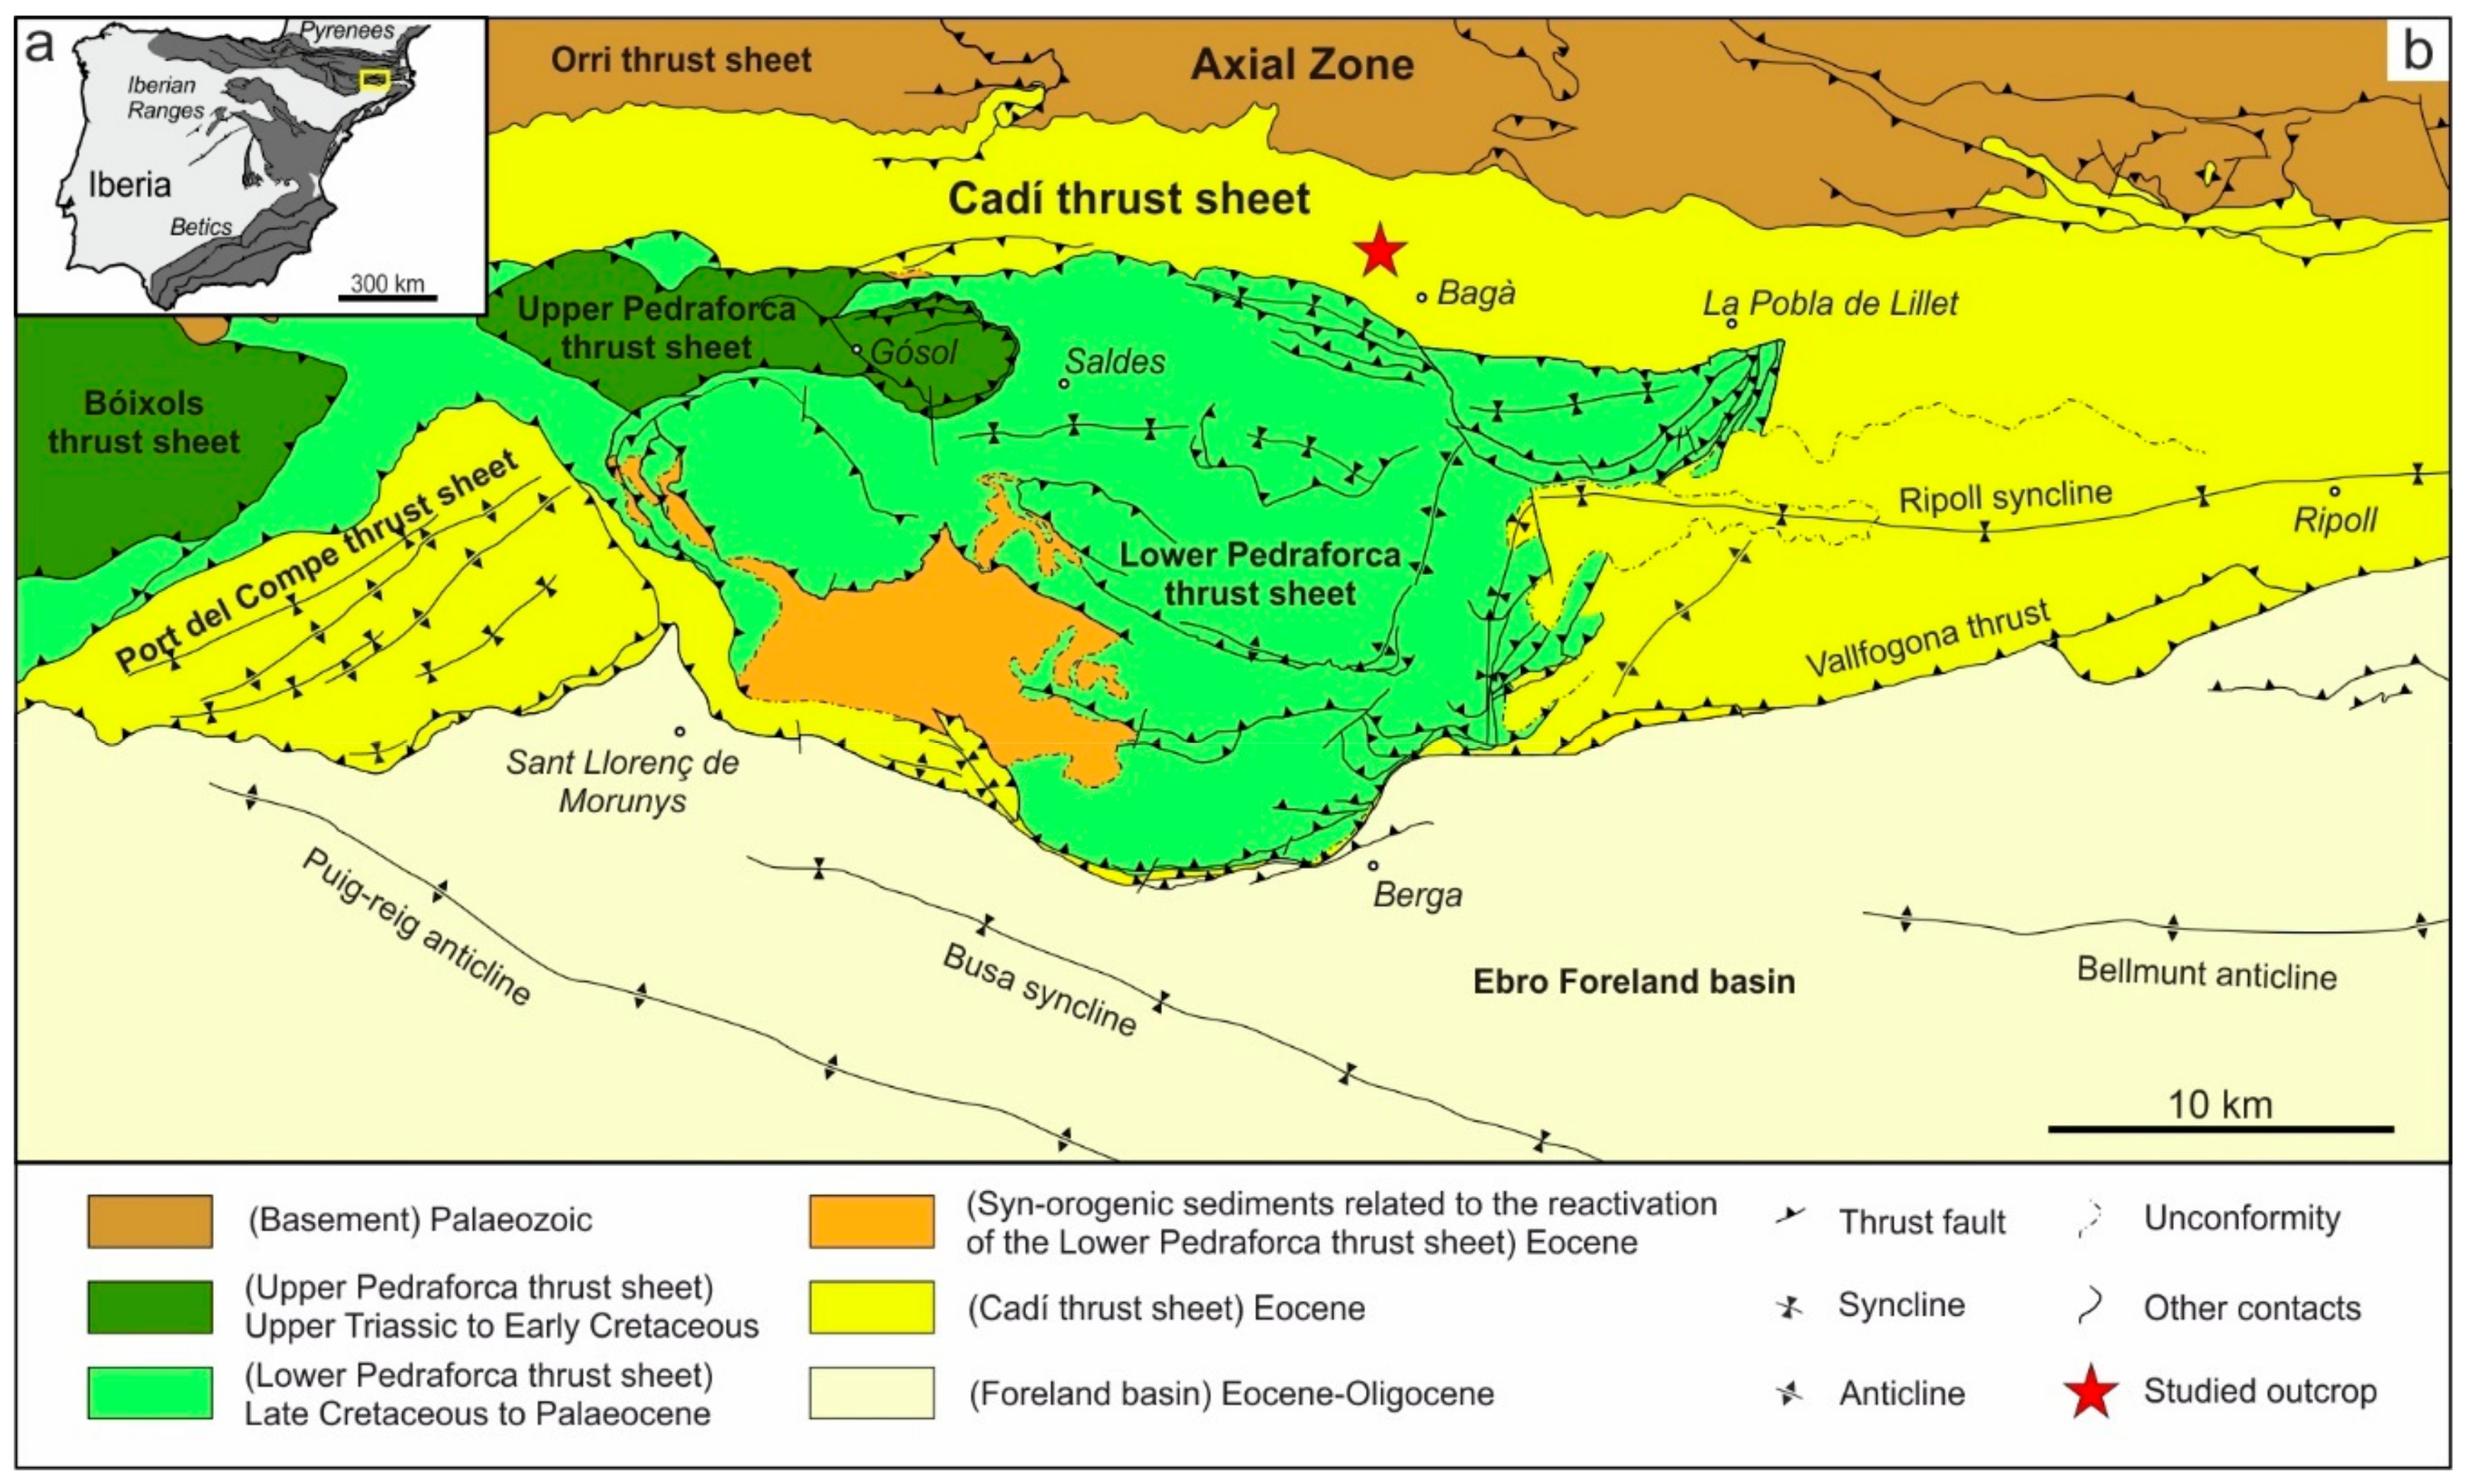
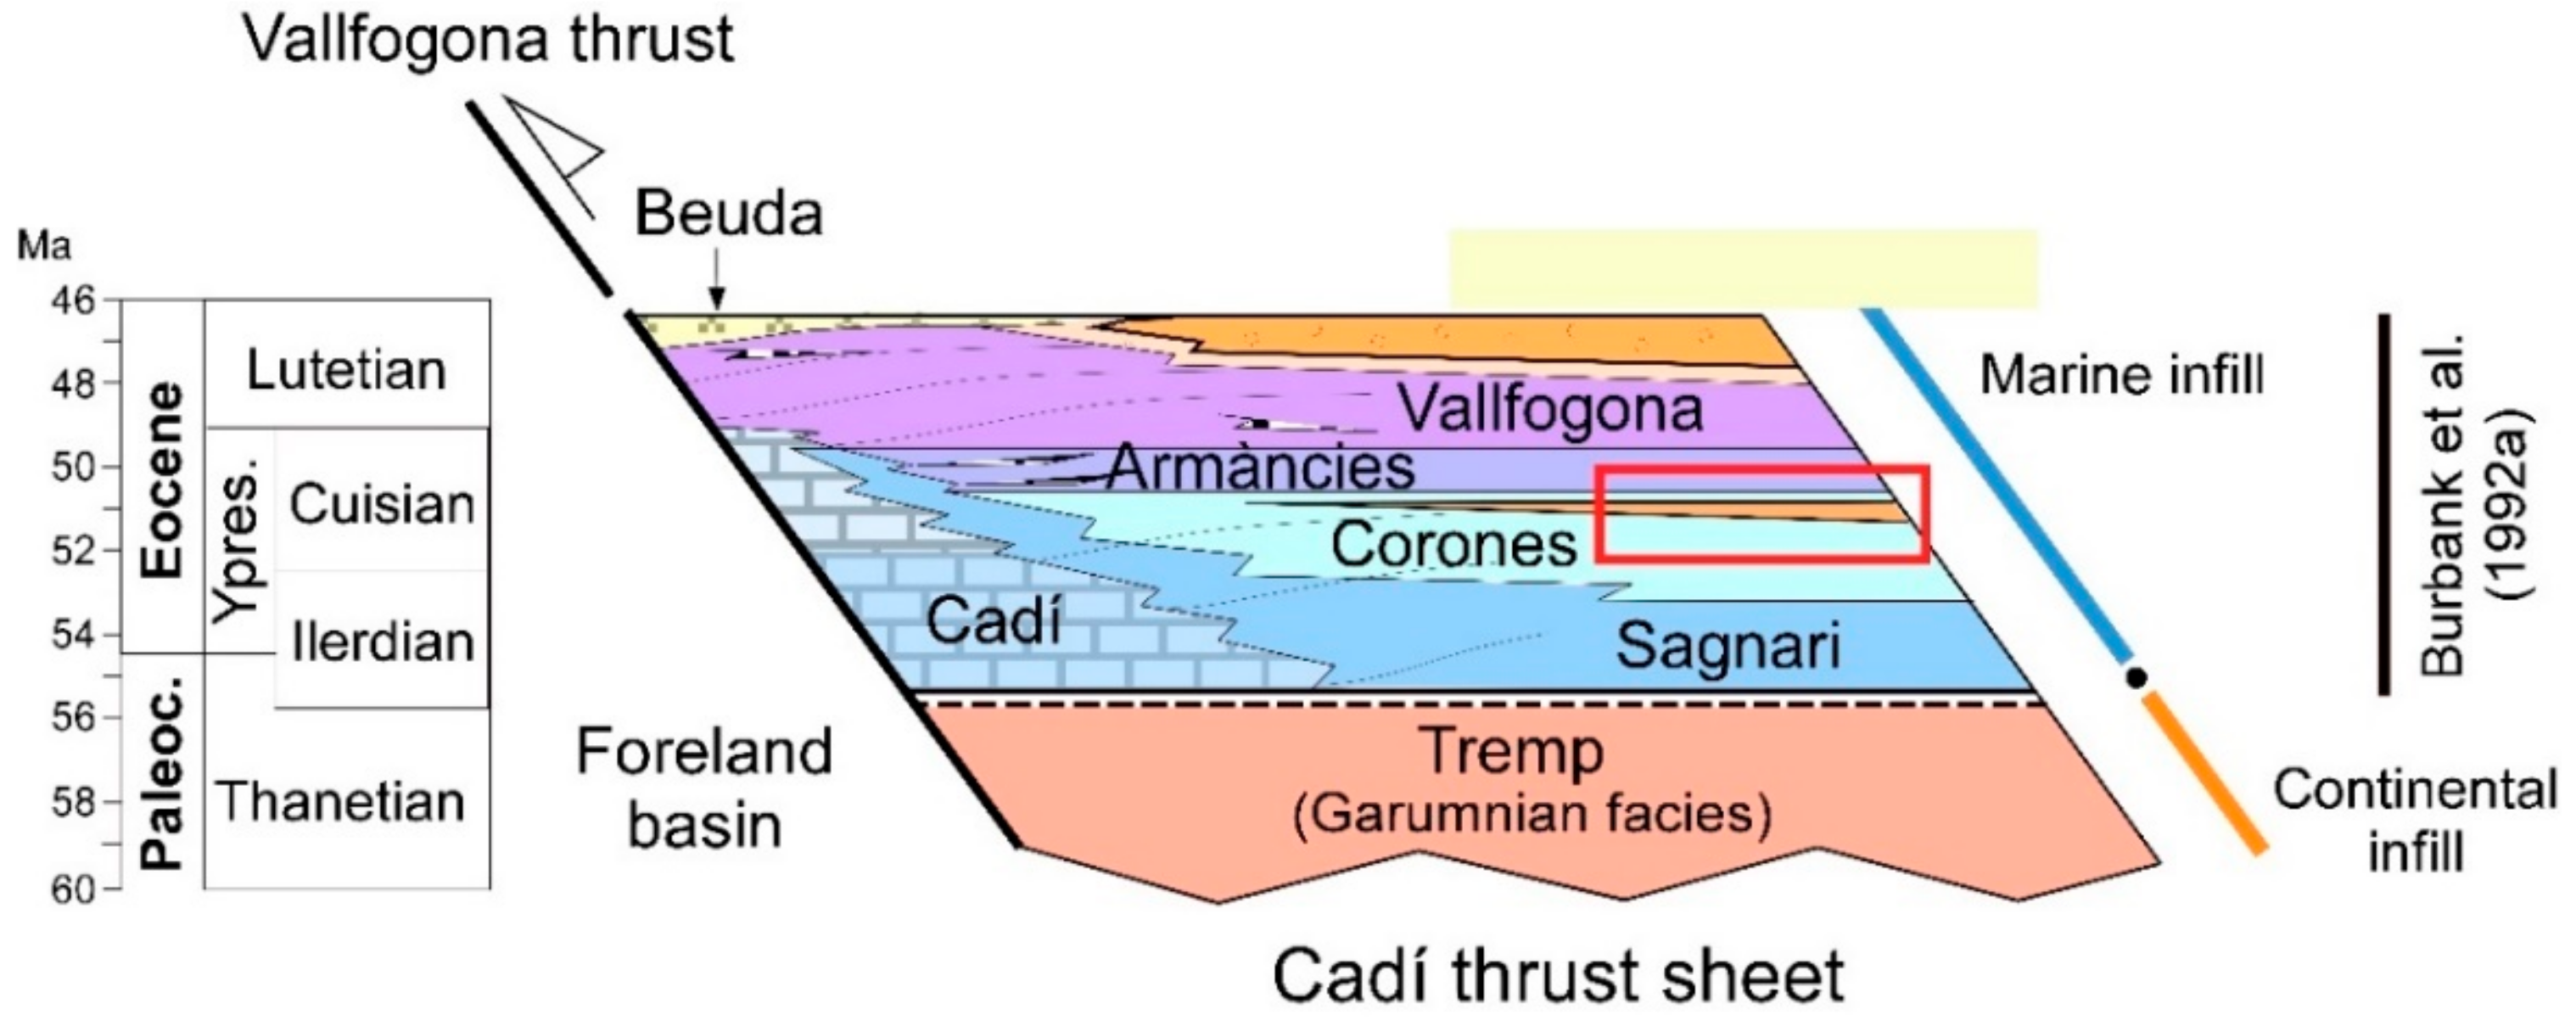
2. Geological Setting

The SE Pyrenees are located in the northeastern sector of the Iberian Peninsula and formed due to the continental collision between Iberia and Eurasia plates, from the Late Cretaceous to the Oligocene [39,40,41,42,43,44,45] (Figure 1a). This fold and thrust belt consist of the stacking of three superposed thrust sheets, which from top-and-older to bottom-and-younger are the Upper Pedraforca, Lower Pedraforca, and Cadí, and their related Ebro foreland basin [43] (Figure 1b).
The studied area is located in the northern margin of the Cadí thrust sheet (Figure 1b). This thrust sheet is linked to the antiformal stack formed by the Orri and Rialp basement thrusted units in the Axial Zone, which are unconformably overlain by a thin sequence of Mesozoic rocks and a thick sequence of Paleogene rocks [41,50]. The southern boundary of the Cadí thrust sheet is the Vallfogona thrust, which was active from the Middle Eocene under marine conditions to the Lower Oligocene, under continental conditions, during the development of the Ebro foreland basin [51,52,53,54] (Figure 1b). In detail, the studied samples were obtained from a fracture cutting the calcareous member of the Lower Eocene Corones Formation [55,56,57] (Figure 2). In the study area, this member consists of a lower carbonate unit of miliolid-rich grainstones, a gray marlstone unit, laminated limestones with ostracods and an upper carbonate unit with benthic foraminifera (discorbids and miliolids), and, less frequently, ostracods [57,58,59]. Sporadically, the carbonate member of the Corones Formation contains celestite concretions and show oil seeps [30,60]. The Corones Formation is overlain by the Armàncies Formation, which consists of limestones and marls and represents the petroleum source rock in the SE Pyrenees [30,61,62]. The Armàncies Formation also contains celestite concretions [60].

3. Methodology

Field work has consisted of fracture and bedding data acquisition, description of their crosscutting relationships, and sampling of fracture-filling calcite cement and adjacent host rocks for petrographic studies and geochemical analyses.
Petrographic analysis was made by using optical, scanning electron, and cathodoluminescence microscopy. For scanning electron microscope, a FEI-Quanta 200 device (FEI Europe B.V., Eindhoven, The Netherlands) with and EDS Spectrometer (EDAX-Genesis) was used. A CL Technosyn cathodoluminescence device Model 8200 MkII (Technosyn Limited, Cambridge, UK) operating at 15–18 kV and 350 μA gun current was used.
XRD measurements were performed on as-collected large crystalline fragments of the calcite cement, in order to obtain information about the orientation of the crystals. The measurements were acquired with a Bruker D8-A25 powder diffractometer (Bruker AXS, Karlsruhe, Germany), equipped with a Cu X-ray source (Cu Kα radiation) and a LynxEye position sensitive detector (PSD). In order to obtain information about the orientation of calcite crystals, XRD measurements were performed on several as-collected crystalline fragments. The methodology employed here is similar to that used in Reference [63], where platy calcite crystals were measured on a powder XRD mount with the short-length axis perpendicular to the plate. In that case, such measurements are allowed to confirm that the studied samples were oriented with the c-axis perpendicular to the XRD mount. In the present case, we have mounted the calcite crystals with the largest, best-developed face perpendicular to the XRD mount. The measurements were acquired with a Bruker D8-A25 powder diffractometer (Bruker AXS), equipped with a Cu X-ray source (Cu Kα radiation) and a LynxEye position sensitive detector (PSD). Phase identification and X-ray reflection assignment were carried out by using the DIFFRAC.EVA software and the Powder Diffraction File (PDF-2) database.
Room-temperature Raman microspectroscopy analyses were carried out on calcite cement and fluid inclusions, using a LabRam HR800 Jobin-Yvon™ spectrometer (HORIBA France SAS, Longjumeau, France). The measurements were performed with a 600 groove/mm grating, using a 532 nm (green) laser as excitation source. Acquisition timespan was of 30 or 60 s, with a total of 10 accumulations to improve the signal-to-noise ratios. The incident power density on the sample was carefully controlled, to avoid any damage on the studied areas. Fluid inclusions were analyzed to determine the presence of hydrocarbons and/or volatile species (CO2, CH4, N2, and H2S).
For carbon- and oxygen-isotope analysis, six microsamples were prepared by using a 500 μm thick dental drill to extract 60 ± 10 μg of powder from trims containing carbonate host rocks and calcite cement. The carbonate powder was reacted with 100% phosphoric acid for two minutes at 70 °C for calcite. The resultant CO2 was analyzed by using an automated Kiel Carbonate Device attached to a Thermal Ionization Mass Spectrometer Thermo Electron (Finnigan) MAT-252 (Thermo Fisher Scientific, Bremen, Germany), following the method of Reference [64]. The obtained results were corrected by using the standard technique from References [65,66], expressed in ‰, with respect to the VPDB (Vienna Pee Dee Belemnite) standard. Standard deviation is ±0.01‰ for δ13C and ± 0.05‰ for δ18O.
Clumped isotopes thermometry was applied to the fracture-filling calcite cement in order to calculate the temperature and δ18O of the former fluid from which it precipitated. To analyze this calcite cement, 2–3 mg aliquots were measured with the Imperial Batch EXtraction system (IBEX), an automated line developed at Imperial College of London. Each powdered sample was dropped in 105% phosphoric acid, at 90 °C, and reacted during 10 min. The reactant CO2 was separated by using a poropak-Q column and transferred into the bellows of a Thermo Scientific MAT 253 mass spectrometer (Thermo Fisher GmbH, Bremen, Germany). The mass spectrometric analysis of a single replicate consisted of 8 acquisitions in dual inlet mode, with 7 cycles per acquisition. Post-acquisition processing was completed with the Easotope software [67]. ∆47 values were corrected for isotope fractionation during phosphoric acid digestion, employing a phosphoric acid correction of 0.082‰, at 90 °C, for calcite [68]. The data were corrected for non-linearity by applying the pressure baseline method (PBL) [69,70] and projected into the absolute reference frame of [71]. Carbonate δ18O values were calculated with the acid fractionation factors of Reference [72]. Samples were measured three times, and the average result was converted to temperatures, using the calibration method of Reference [73]. The calculated δ18O values of the fluid are expressed in ‰ with respect to the VSMOW standard (Vienna Standard Mean Ocean Water).
For 87Sr/86Sr analyses, two samples of 100% calcite cement and carbonate host rocks were analyzed. Samples were fully dissolved in 5 mL of 10% acetic acid and introduced in an ultrasonic bath for 15 min. After this time, samples were centrifuged during ten minutes, at 4000 rpm, and dried. The resultant product was reacted in 1 mL of 3 M HNO3 and dried. Finally, the sample was digested again in 3 mL of 3 M HNO3 and introduced in chromatographic columns. For the chromatographic separation of Sr, an extraction resin type SrResinTM was used (Trisken International) (crown-ether (4.4’(5’)-di-t-butylcyclohexano-18-crown-6). The Sr was recovered with HNO3 0.05 M as eluent. The fraction where Sr is concentrated was dried, charged on a Re single filament with 1 μL of H3PO4 1 M and 2 μL of Ta2O5, and analyzed on a TIMS-Phoenix mass spectrometer (Isotopx, Cheshire, UK). The acquisition method of data consisted of dynamic multicollection during ten blocks of 16 cycles, each one with a beam intensity in the 88Sr mass of 3 V. Analyses were corrected for possible interferences of 87Rb. 87Sr/86Sr ratios were normalized with respect to the measured mean value of the ratio 86Sr/88Sr = 0.1194 of the isotopic standard NBS-987, in order to correct possible mass fractionation during filament charge and instrumental analyses. The precision of the analytical standard error or internal precision is 0.000003.
Carbon-coated polished thin sections were used to analyze major, minor, and trace element concentrations on a CAMECA SX-50 electron microprobe (CAMECA SAS, Gennevilliers, France). The microprobe was operated, using 20 kV of excitation potential, 15 nA of current intensity, and a beam diameter of 10 µm. Analytical standards included natural silicates, carbonates, and oxides as follows: calcite (Ca), dolomite (Mg), Fe2O3 (Fe), rhodonite (Mn), and celestite (Sr). The detection limits were 135 ppm for Mn, 127 ppm for Fe, 102 ppm for Ca, 185 ppm for Mg, and 403 ppm for Sr. Precision on major element analyses averaged 0.64% standard error at 2σ confidence levels.
To determine the rare earth element and yttrium content (REEs + Y) of calcite cement and carbonate host rocks, four samples were analyzed by means of high-resolution inductively coupled plasma mass spectrometry (HR-ICP-MS), using a Thermo Scientific model Element XR (Thermo Fisher Scientific, Bremen, Germany). Up to 100 mg of powder was sampled from trims, using a 400/500 μm diameter dental drill. Powdered samples were dried at 40 °C during 24 h, and later, 100 mg of sample was acid digested in closed PTFE vessels, with a combination of HNO3 + HF + HClO4 (2.5 mL: 5 mL: 2.5 mL v/v). The samples were evaporated, and 1 mL of HNO3 was added, to make a double evaporation. Finally, the sample was re-digested and diluted with Milli-Q water (18.2 MΩcm-1) and 1 mL of HNO3, in a 100 mL volume flask. In order to improve the sensitivity of the ICP-MS, a tuning solution containing 1 µg L−1 Li, B, Na, K, Sc, Fe, Co, Cu, Ga, Y, Rh, In, Ba, Tl, and U was used, and as internal standard, 20 mg L−1 of a monoelemental solution of 115In. Reference materials were the BCS-CRM number 393 (ECRM 752-1) limestone, JA-2 Andesite, and JB-3 Basalt. The precision of the results was expressed in terms of two standard deviations of a set of eight reference materials measurements (reference material JA-2), whereas accuracy (%) was calculated by using the absolute value of the difference between the measured values obtained during the analysis and the certified values of a set of eight reference material analysis (reference material BCS-CRM n° 393 for major oxides and JA-2 for trace elements). The analyzed elements and their detection limits expressed in ppm are as follows: La (0.21), Ce (0.32), Pr (0.04), Nd (0.15), Sm (0.03), Eu (0.01), Gd (0.02), Tb (0.003), Dy (0.02), Y (0.20), Ho (0.003), Er (0.01), Yb (0.01), and Lu (0.01). The detection limit was calculated as three times the standard deviation of the average of ten blanks. A Multielemental Solution IV-CCS-1 Rare Earths Standard in HNO3, 125 mL (100 µg mL−1) of Inorganic Ventures, was used in order to perform the calibration curves. REEs and Y data were normalized to the Post-Archean Australian Shale (PAAS) from Reference [74].
Sulphur and oxygen isotopes were analyzed in two celestite samples to establish the origin of the precipitating fluid. The CO and SO2 gases produced from the samples were analyzed in a continuous flow elemental analyzer Thermo Delta Plus XP mass spectrometer (Thermo, Bremen, Germany), with a TC/EA pyrolizer for δ18O and a Finnigan MAT CHNS 1108 analyzer (Finnigan, Bremen, Germany) for δ34S. The results were calibrated with the international standards NBS-127, SO-5, and SO-6 [75], and the internal standard YCEM (+12.78‰ CDT). The analytical error was ±0.4‰ CDT (Canyon Diablo Troilite) for δ34S and ±0.5‰ VSMOW for δ18O.

4. Results

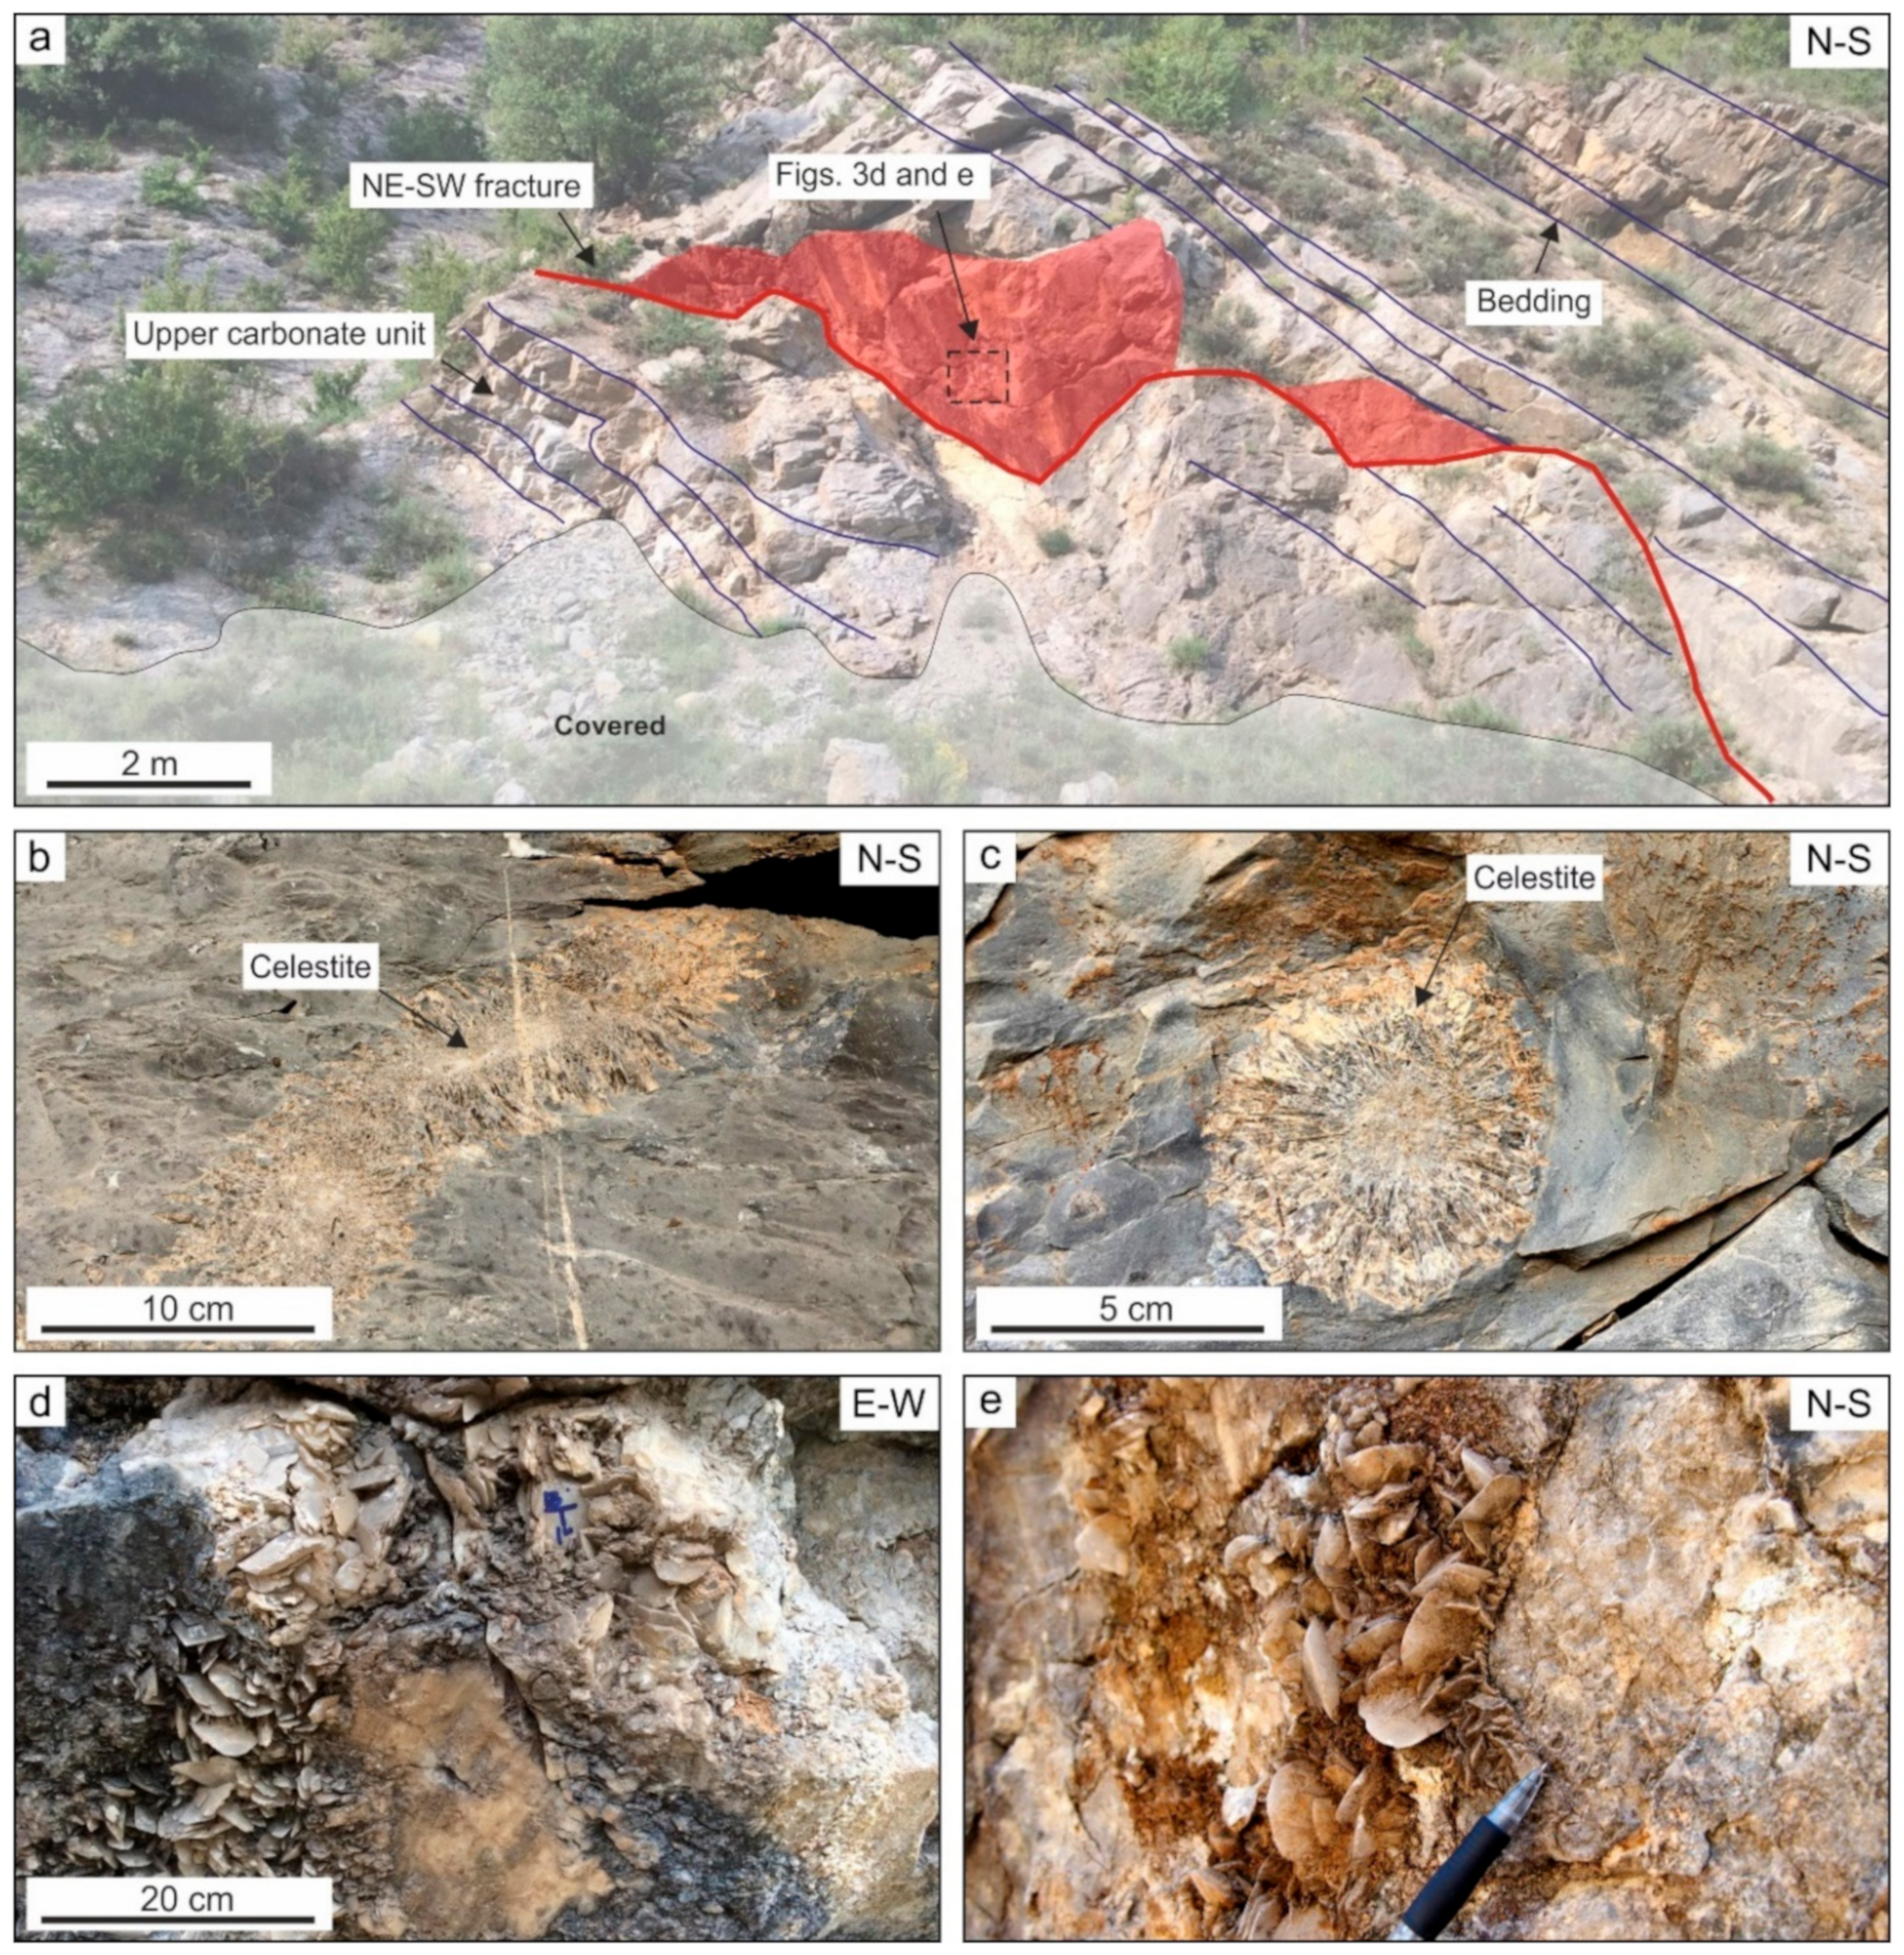
4.1. Description of the Studied Outcrop
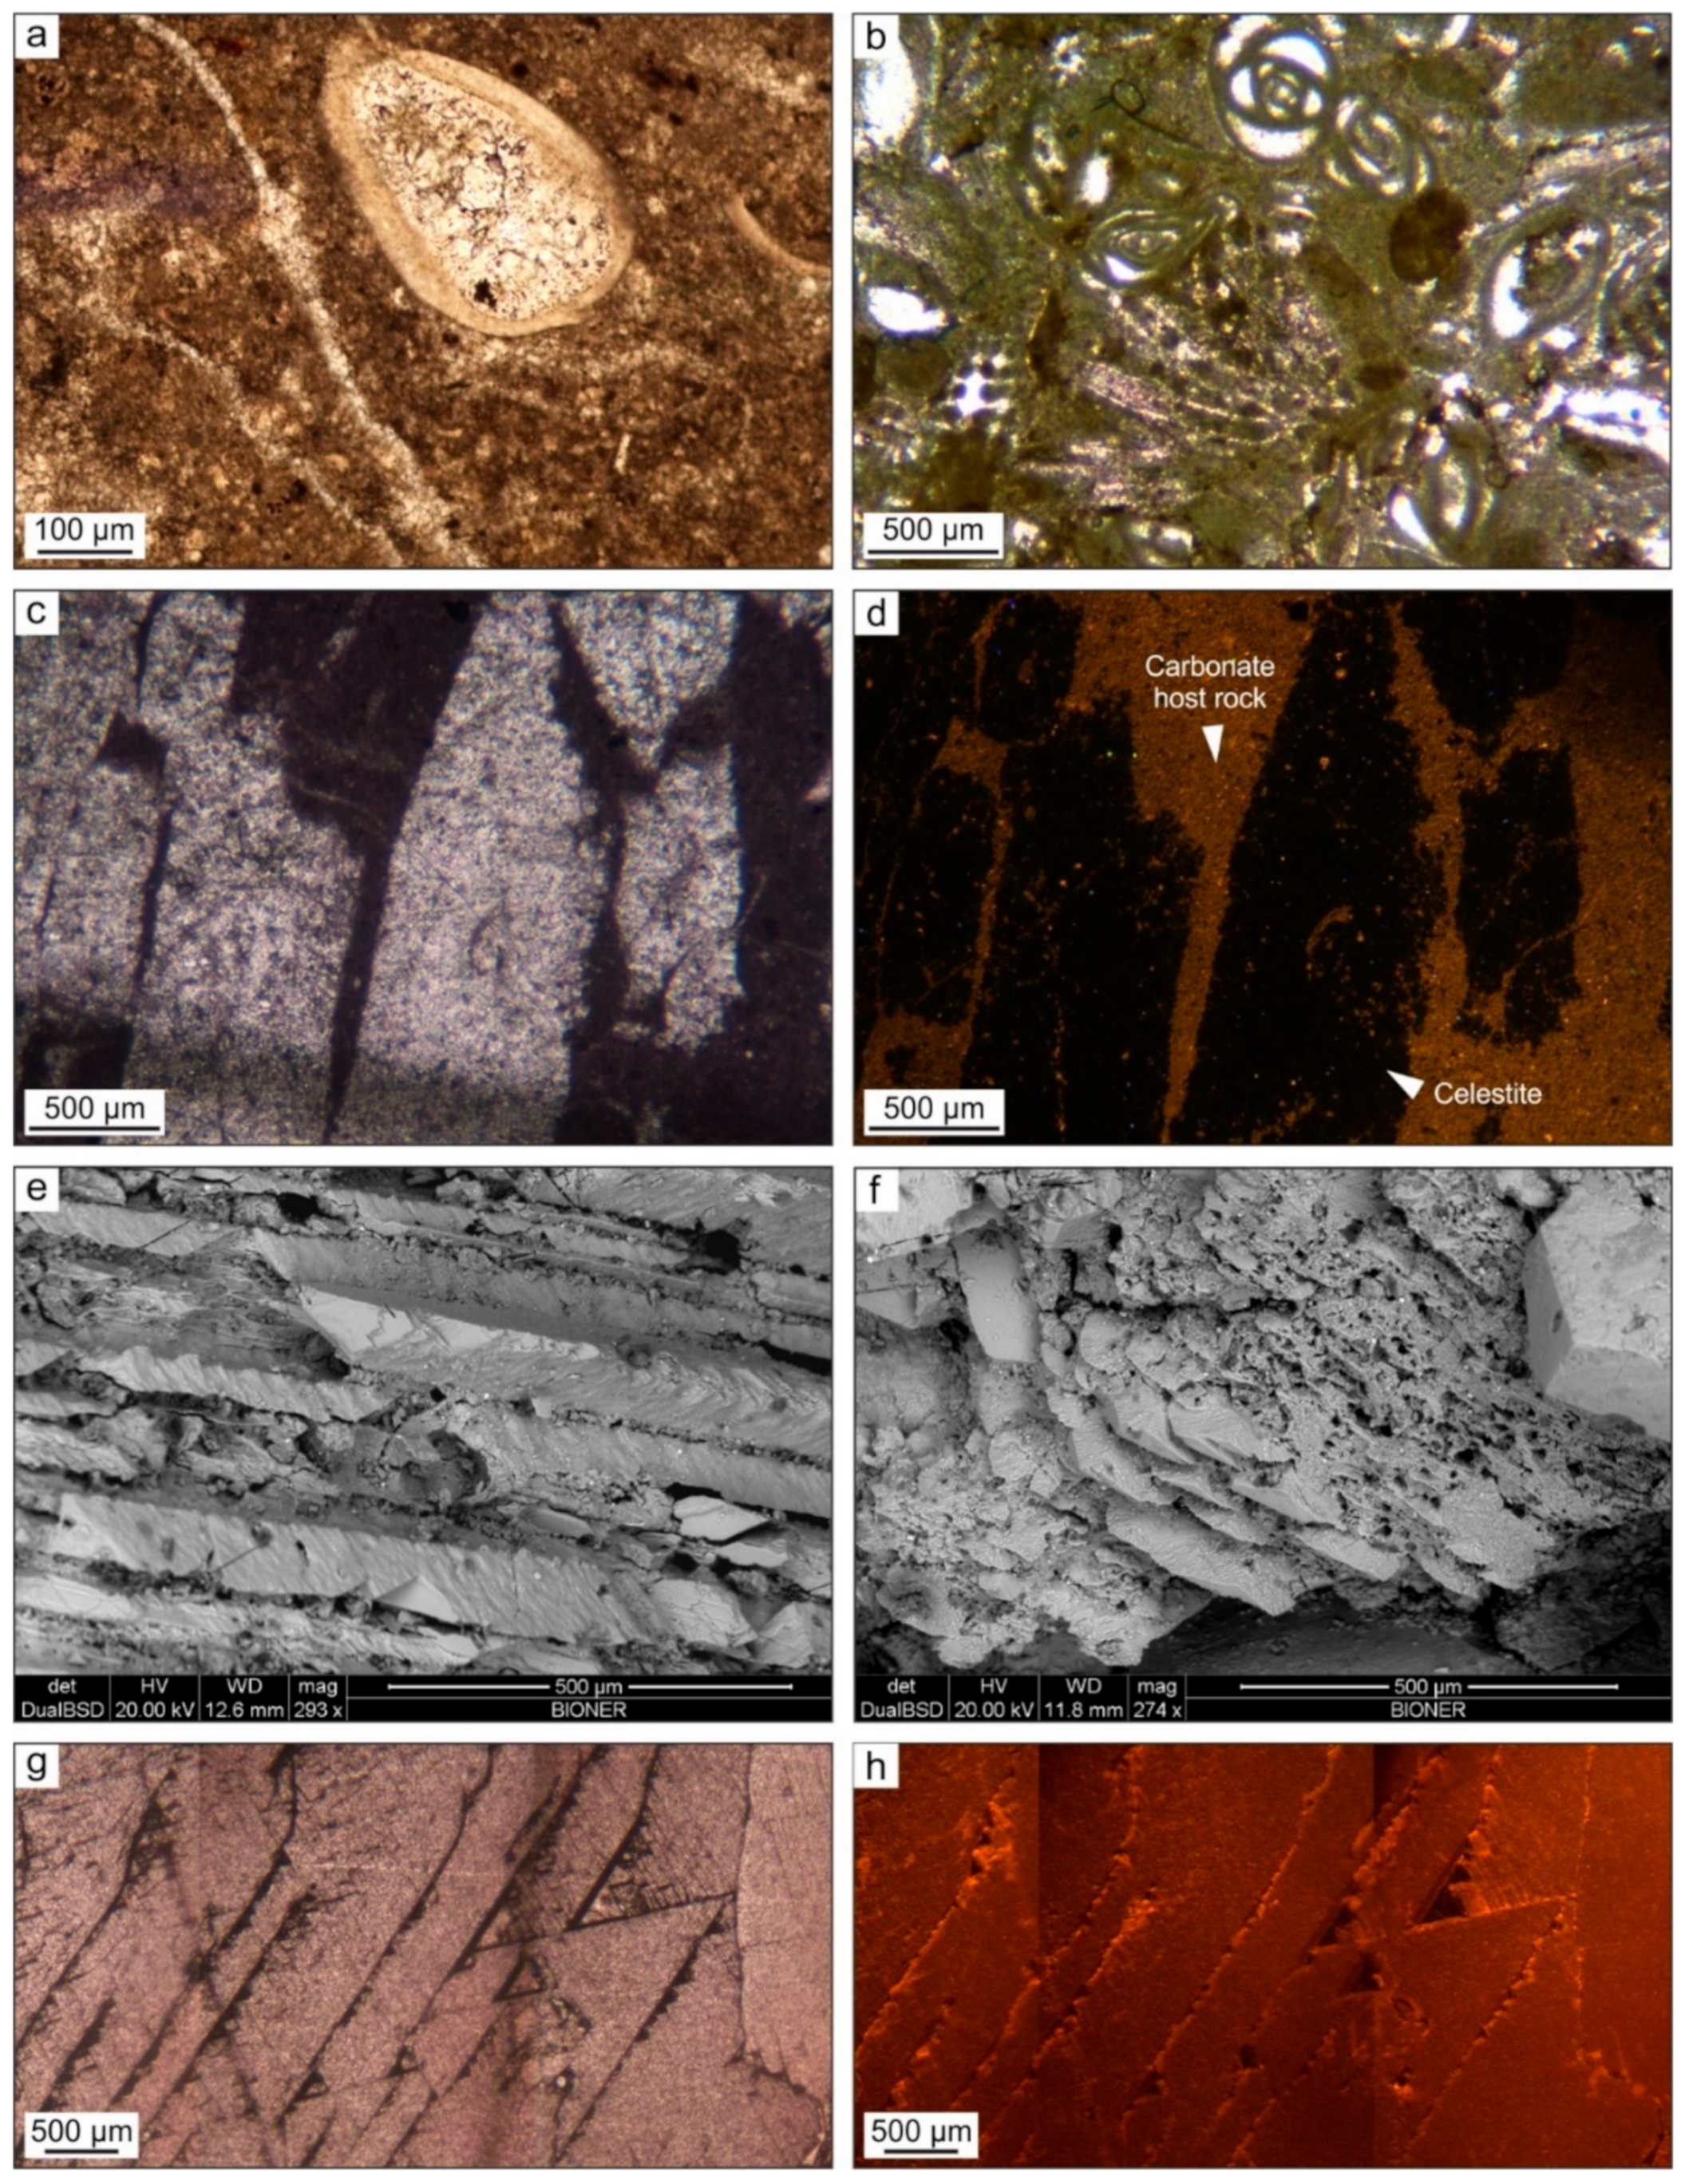
The studied outcrop is located 1.7 km NW of the Bagà Village (Figure 1b). In this area, a NE–SW striking fracture, which dips 57 degrees toward the southeast, cuts the upper carbonate unit of the Corones Formation (Figure 3a). Limestones are gray and are constituted of up to 50 cm thick layers dipping 40 degrees toward the south. Occasionally, celestite concretions replace the Corones Formation (Figure 3b,c and Supplementary Materials Figure S1). These concretions consist of radial aggregates of prismatic crystals. The sampled fracture is partially filled with up to 10 cm thick calcite cement arranged in rose-like crystal clusters of bladed calcites (Figure 3d,e). Bladed crystals have sizes ranging from a few millimeters to 4 cm, are milky to brownish, and are occasionally impregnated with petroleum.

4.2. Petrography

4.1.1. The Host Rock

The upper carbonate unit of the Corones Formation hosting the sampled fracture consists of wackestones and packstones of ostracods and micritized benthic and planktonic foraminifera (Figure 4a,b). Blocky calcite cement and framboidal aggregates of pyrite fill the intraparticle porosity of ostracods and foraminifera. Celestite concretions within the carbonate Corones Formation are constituted of non-luminescent and up to 1 cm long prismatic crystals (Figure 4c,d). Celestite concretions within the Armàncies Formation show the same texture.

4.1.2. Calcite Cement

The cement is mainly formed by large centimetric bladed calcite crystals, as seen in Figure 3d,e. However, scarce and smaller crystals exhibiting a more laminar habit are occasionally observed in the non-cemented spaces by bladed calcite, thus indicating a possible later precipitation. SEM imaging revealed that the centimetric bladed calcites are mainly constituted of rhombohedral subcrystals, with a thickness ranging between 30 to 200 µm and a length of up to 0.5 cm (Figure 4e). However, up to 250 µm bladed subcrystals are also observed (Figure 4f). The calcite cement is dull-orange to luminescent, with more luminescent areas between crystal borders (Figure 4g,h). Evidence of crystal zonation was not observed from scanning electron and cathodoluminescence microscope observations.
XRD was applied to bladed crystals with the largest, best-developed face perpendicular to the XRD mount and smaller and more laminar crystals. The results, shown in Figure 5, indicate that, in the largest bladed crystals, which we label as ‘bulky calcite’, the analyzed surface corresponds to one of the conventional {10 1 ¯ 4} rhombohedral faces. In contrast, the XRD patterns from the smaller crystals turn out to be dominated by the (108) reflection of calcite. This result indicates that the main face of the bladed crystals with laminar habit coincide with one of the {10 1 ¯ 8} or {01 1 ¯ 8 } rhombohedral faces (recall that the powder XRD setup does not allow us to perform a full textural analysis). As discussed by Reference [76], only {01 1 ¯ 8} faces seem to be expressed in inorganically precipitated calcite. This is the case, for instance, of the so-called ‘nailhead’ laminar habit. In contrast, the {10 1 ¯ 8} faces have been found in the surfaces of the foliated calcite of bivalves [76]. Accordingly, here we attribute the observed (108) reflections in the more laminar crystals to {01 1 ¯ 8} rhombohedral surfaces, ruling out the c-axis orientation reported in Reference [63] for platy calcite.

4.3. Fluid Inclusion Studies

Two types of fluid inclusion assemblages (FIA1 and FIA2) were identified in the studied calcite cement. Fluid inclusions in FIA1 are elongated (up to 120 µm long) or squared and have faces ranging in size between 7 and 50 µm (Figure 6a,b). FIA1 are abundant and contain a single liquid phase, although very occasionally transparent to gray gas bubbles are observed (Figure 6b). These gas bubbles have diameters of up to 5 µm, and they occupy a fluid inclusion volume between 10% and 70%. Under ultraviolet light (UV), FIA1 inclusions are non-fluorescent. FIA1 is mainly concentrated at the center of crystals, and their faces are parallel to that of the host calcite. Furthermore, FIA1 are restricted to growth boundaries of calcites, thus suggesting their primary origin. This FIA is occasionally cut by a system of healed fractures containing petroleum, which are arranged parallel and orthogonal to the FIA1 (Figure 6c).
The FIA2 contain fluid inclusions filled with liquid petroleum and have more irregular shapes and rounded faces than inclusions of FIA1 (Figure 6d). The length of FIA2 inclusion faces range between 5 and 40 µm and are usually trapped along the healed fractures containing petroleum and postdating FIA1, thus indicating their secondary origin (Figure 6c,d). Under UV light, FIA2 inclusions are non-fluorescent to dark blue, making them hard to distinguish from the host calcite cement.
Raman analyses in both FIA1 and FIA2 in bladed calcites show similar peaks, although they are more intense in FIA2 inclusions (Figure 7). The spectra show for both FIA1 and FIA2 peaks at 620, 650, 1001, 1040, 1165, 1200, 1280, 1580, 1600, 1720, 2945, 2990, and 3065 cm−1, which are within the range of vibration of the aromatic hydrocarbons and the benzene group [77,78] (Figure 7; Table 1). The spectra also show two peaks at 795 and 850 cm−1, which are within the range of vibrations of the alkanes group [78] (Figure 7; Table 1).

4.4. Geochemistry of Bladed Calcite

4.4.1. C–O Stable Isotopes

The carbonate host rock from the Corones Formation has δ13C values ranging from −1.36‰ to −0.94‰ VPDV and δ18O values ranging from −10.56‰ to −10.02‰ VPDV (Figure 8 and Table S1).
Bladed calcite cement has δ13C values ranging from −3.89‰ to −1.01‰ VPDV and δ18O values ranging from −16.94‰ to −14.48 ‰ VPDV (Figure 8). This calcite cement shows a depletion in δ18O from 3.83‰ to 6.29‰ VPDV with respect to its adjacent host carbonates of the Corones Formation and from 10.41‰ to 12.88‰ VPDV with respect to Eocene marine carbonates (Figure 8).

4.4.2. Clumped Isotopes
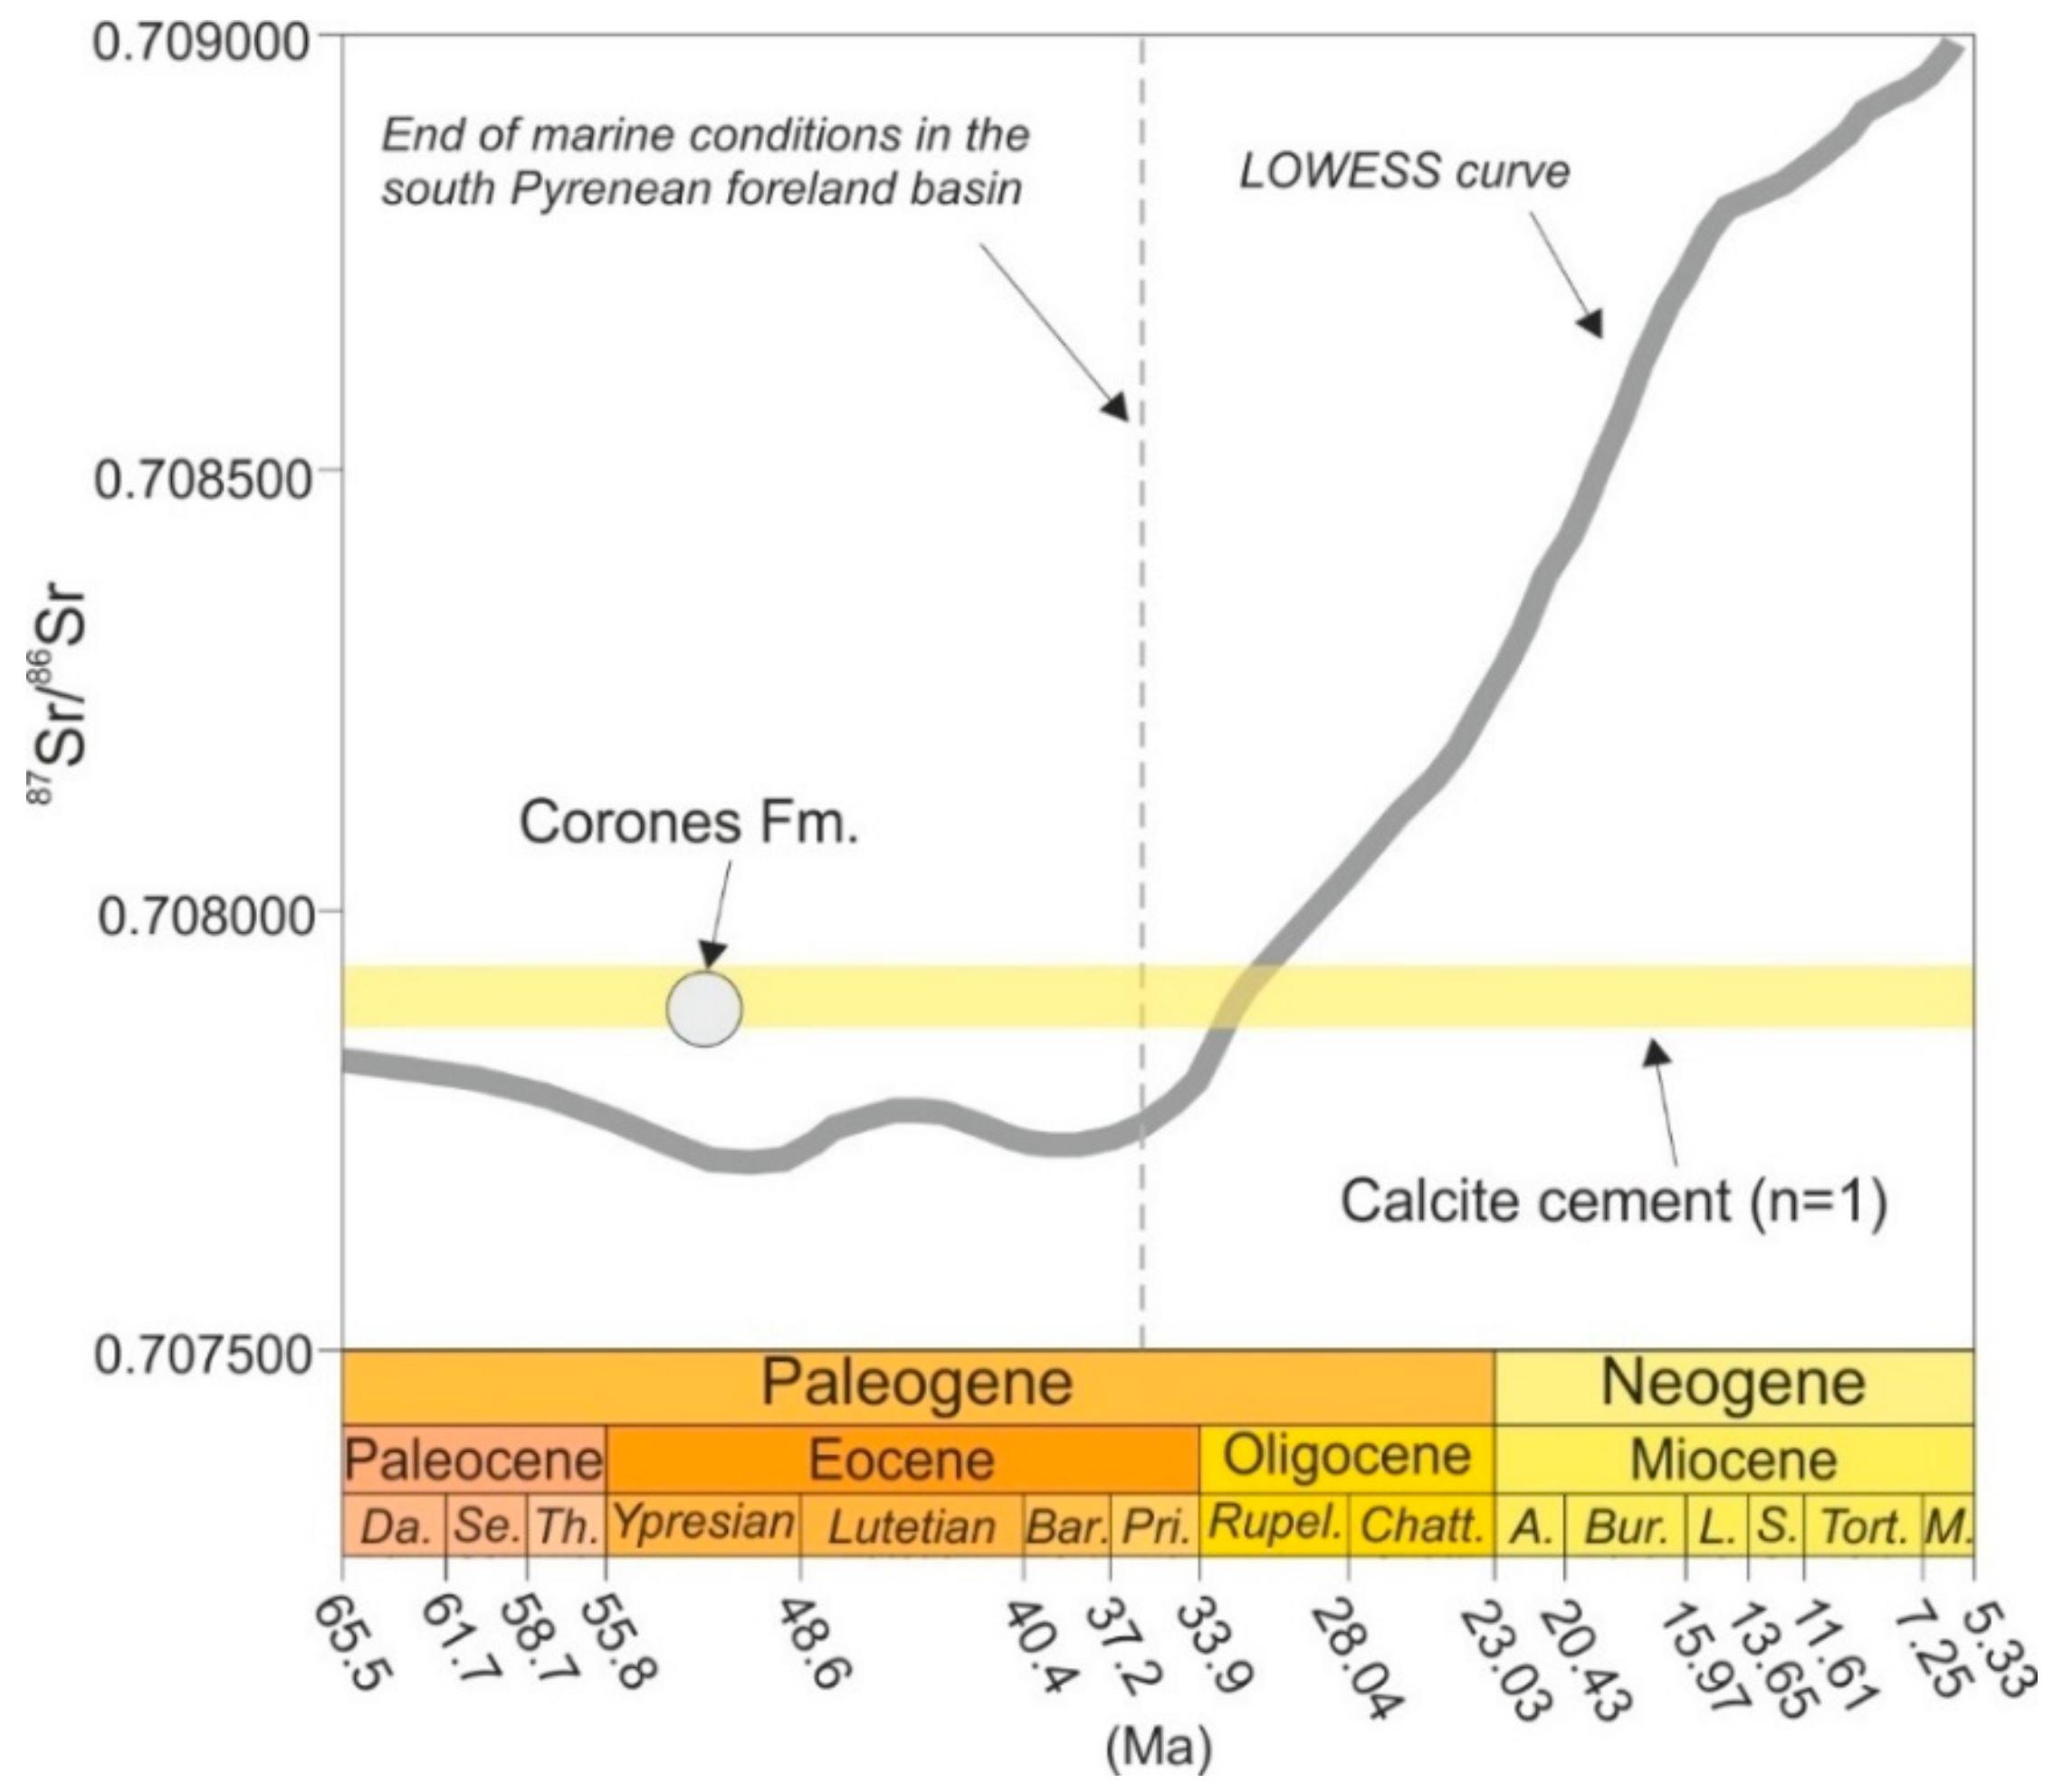
Clumped isotopes thermometry was applied to one sample of bladed calcites (Figure 9; Table S2). The measured ∆47 is 0.594‰ ± 0.02‰, which translates into a temperature of 62.13 ± 5.25 °C and a δ18Ofluid of −5.52‰ ± 0.9‰ (Figure 9). Temperature in °C and δ18Ofluid in ‰ VSMOW of fluids are calculated from measured ∆47 in carbonate cement, using the equation of Reference [73] for clumped isotope temperature and Reference [80] for the δ18Ofluid.
In Figure 9, a range of δ18Ofluid values between −9.01‰ and −4.91‰ VSMOW is also plotted (yellow box). This range of δ18Ofluid was calculated by using the δ18O in ‰ VPDB of bladed calcites in Figure 8, the measured clumped isotopes temperature, and the formula of Reference [80].

4.4.3. Sr isotopes

Limestones from the Corones Formation and bladed calcite crystals were analyzed for strontium isotopes (Figure 10; Table S3). The 87Sr/86Sr ratio of the Corones Formation is 0.707888, whereas the bladed calcite has an 87Sr/86Sr ratio of 0.707903 (Figure 10). In both cases, the 87Sr/86Sr ratio is higher than the marine values reported in the LOWESS curve from the Paleocene to the Upper Eocene [82] (Figure 10), when the marine conditions in the South Pyrenean foreland basin finished.

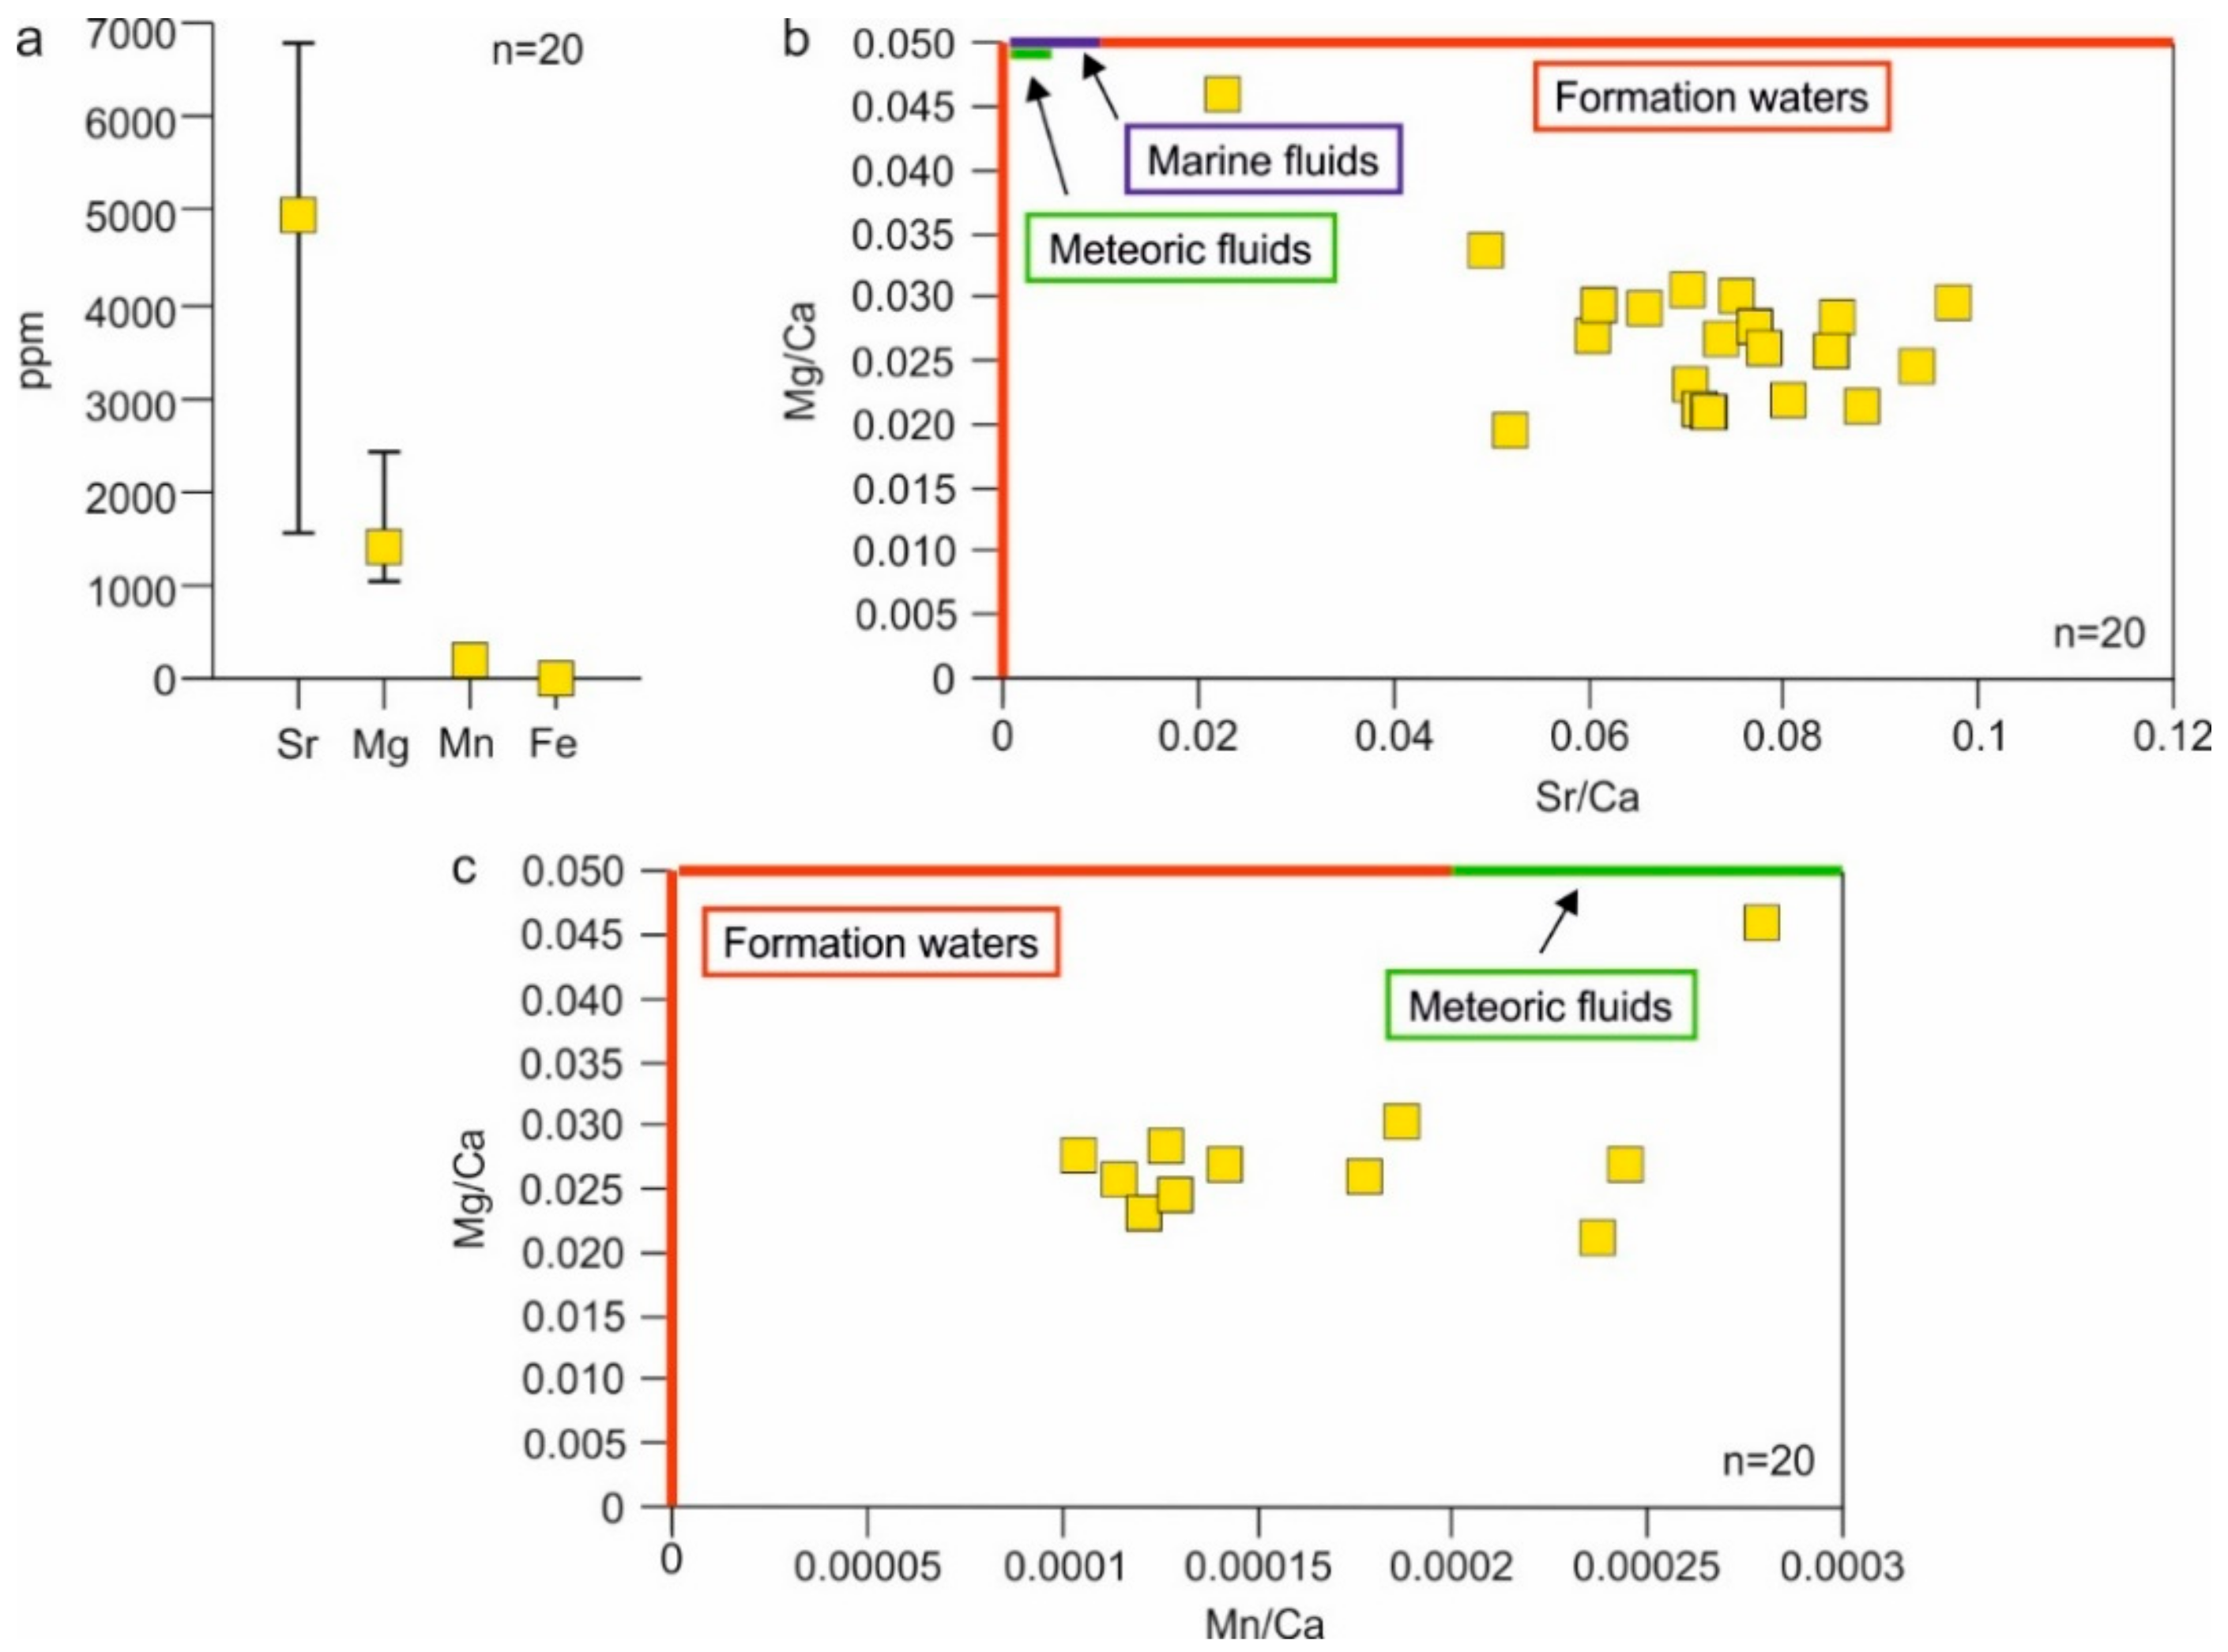
4.4.4. Elemental Composition

The Sr, Mg, Mn, and Fe content of bladed calcite cement was measured by using electron probe microanalysis (Figure 11a and Table S4). From these results, the Ca/Fe and Mg/Ca molar ratios were calculated (Figure 11b,c; Table S5).
The elemental composition of bladed calcite crystals shows values ranging from 1578 to 6787 ppm in Sr, from 1031 to 2441 ppm in Mg, and values from below the detection limit to 365 ppm in Mn (Figure 11a). The Fe content is below the detection limit. The Mg/Ca, Sr/Ca and Mn/Ca molar ratios have been calculated by using the formula of Reference [83] and the following coefficient factors: KMg = 0.097 at 70 °C [89], KMn = 5.4 at 25 °C [90], and KSr = 0.08 at 100 °C [91]. The calculated Mg/Ca and Sr/Ca ratios range from 0.02 to 0.05 and from 0.02 to 0.09, respectively (Figure 11b), whereas the Mn/Ca ratio ranges from 0.0001 to 0.0003 (Figure 11c).

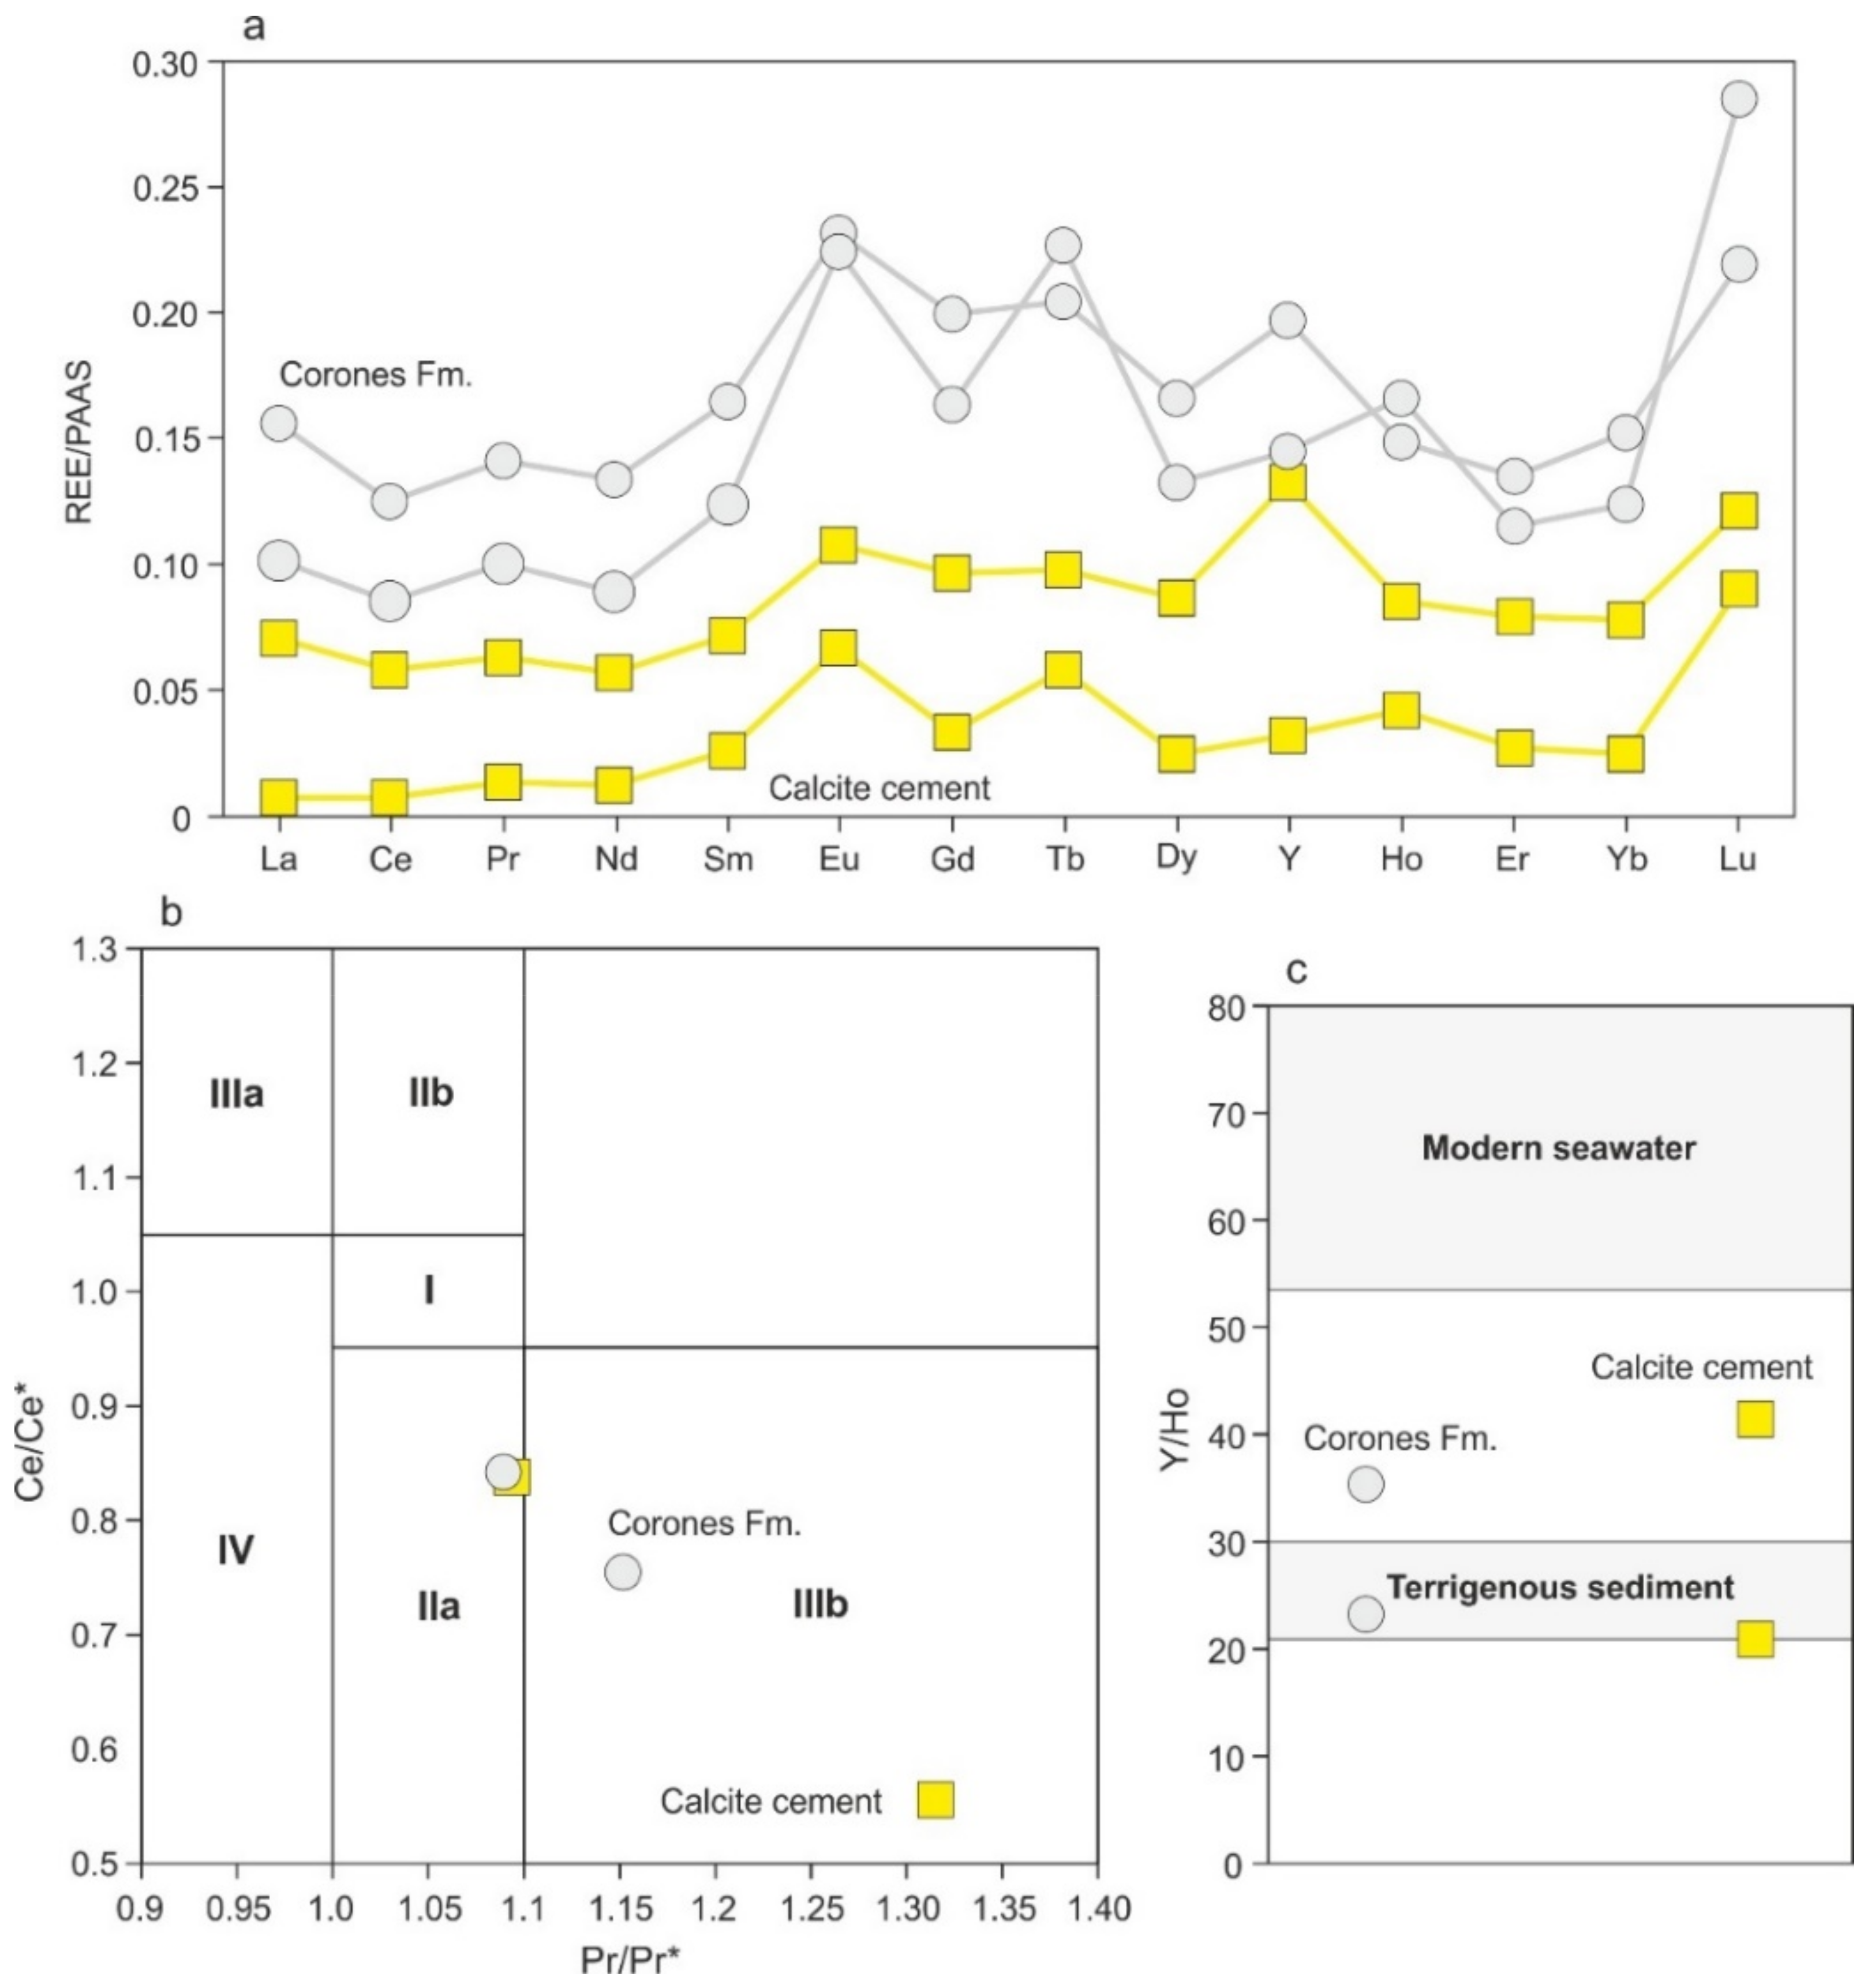
4.4.5. REEs + Y Content

The REEs and Y content of limestones from the Corones Formation and the bladed calcite crystals were analyzed. The REEs + Y content in ppm, their normalized values to the Post-Archean Australian Shale (PAAS) from Reference [74], and their Ce/Ce*, Pr/Pr* and Y/Ho ratio are presented in Figure 12 and Tables S6–S8.
The REEs + Y pattern of the Corones Formation shows a positive Eu anomaly, which is less pronounced in the bladed calcite cement (Figure 12a). This pattern also shows positive Y and Tb anomalies for one sample of the Corones Formation limestone and for one sample of the bladed calcite cement (Figure 12a). Negative Ce anomalies are observed for limestones from the Corones Formation and for one sample of the bladed calcite. Ce and Pr anomalies (Ce/Ce* and Pr/Pr*) were also calculated by using the formulas of References [92,96], respectively (Figure 12b). The Ce and Pr anomalies in the Corones Formation range between 0.75 and 0.84 and between 1.09 and 1.15, respectively (Figure 12b). In the bladed calcite cement, the Ce anomaly ranges from 0.55 to 0.84, and the Pr anomaly ranges from 1.09 to 1.31 (Figure 12b). The Y/Ho ratios range from 23.78 to 35.83 in the Corones Formation limestones and from 20.94 to 41.88 in the bladed calcite cement (Figure 12c). In both cases, the Y/Ho ratios are within the range of composition of the terrigenous sediments and between the composition of these sediments and modern seawater (Figure 12c).

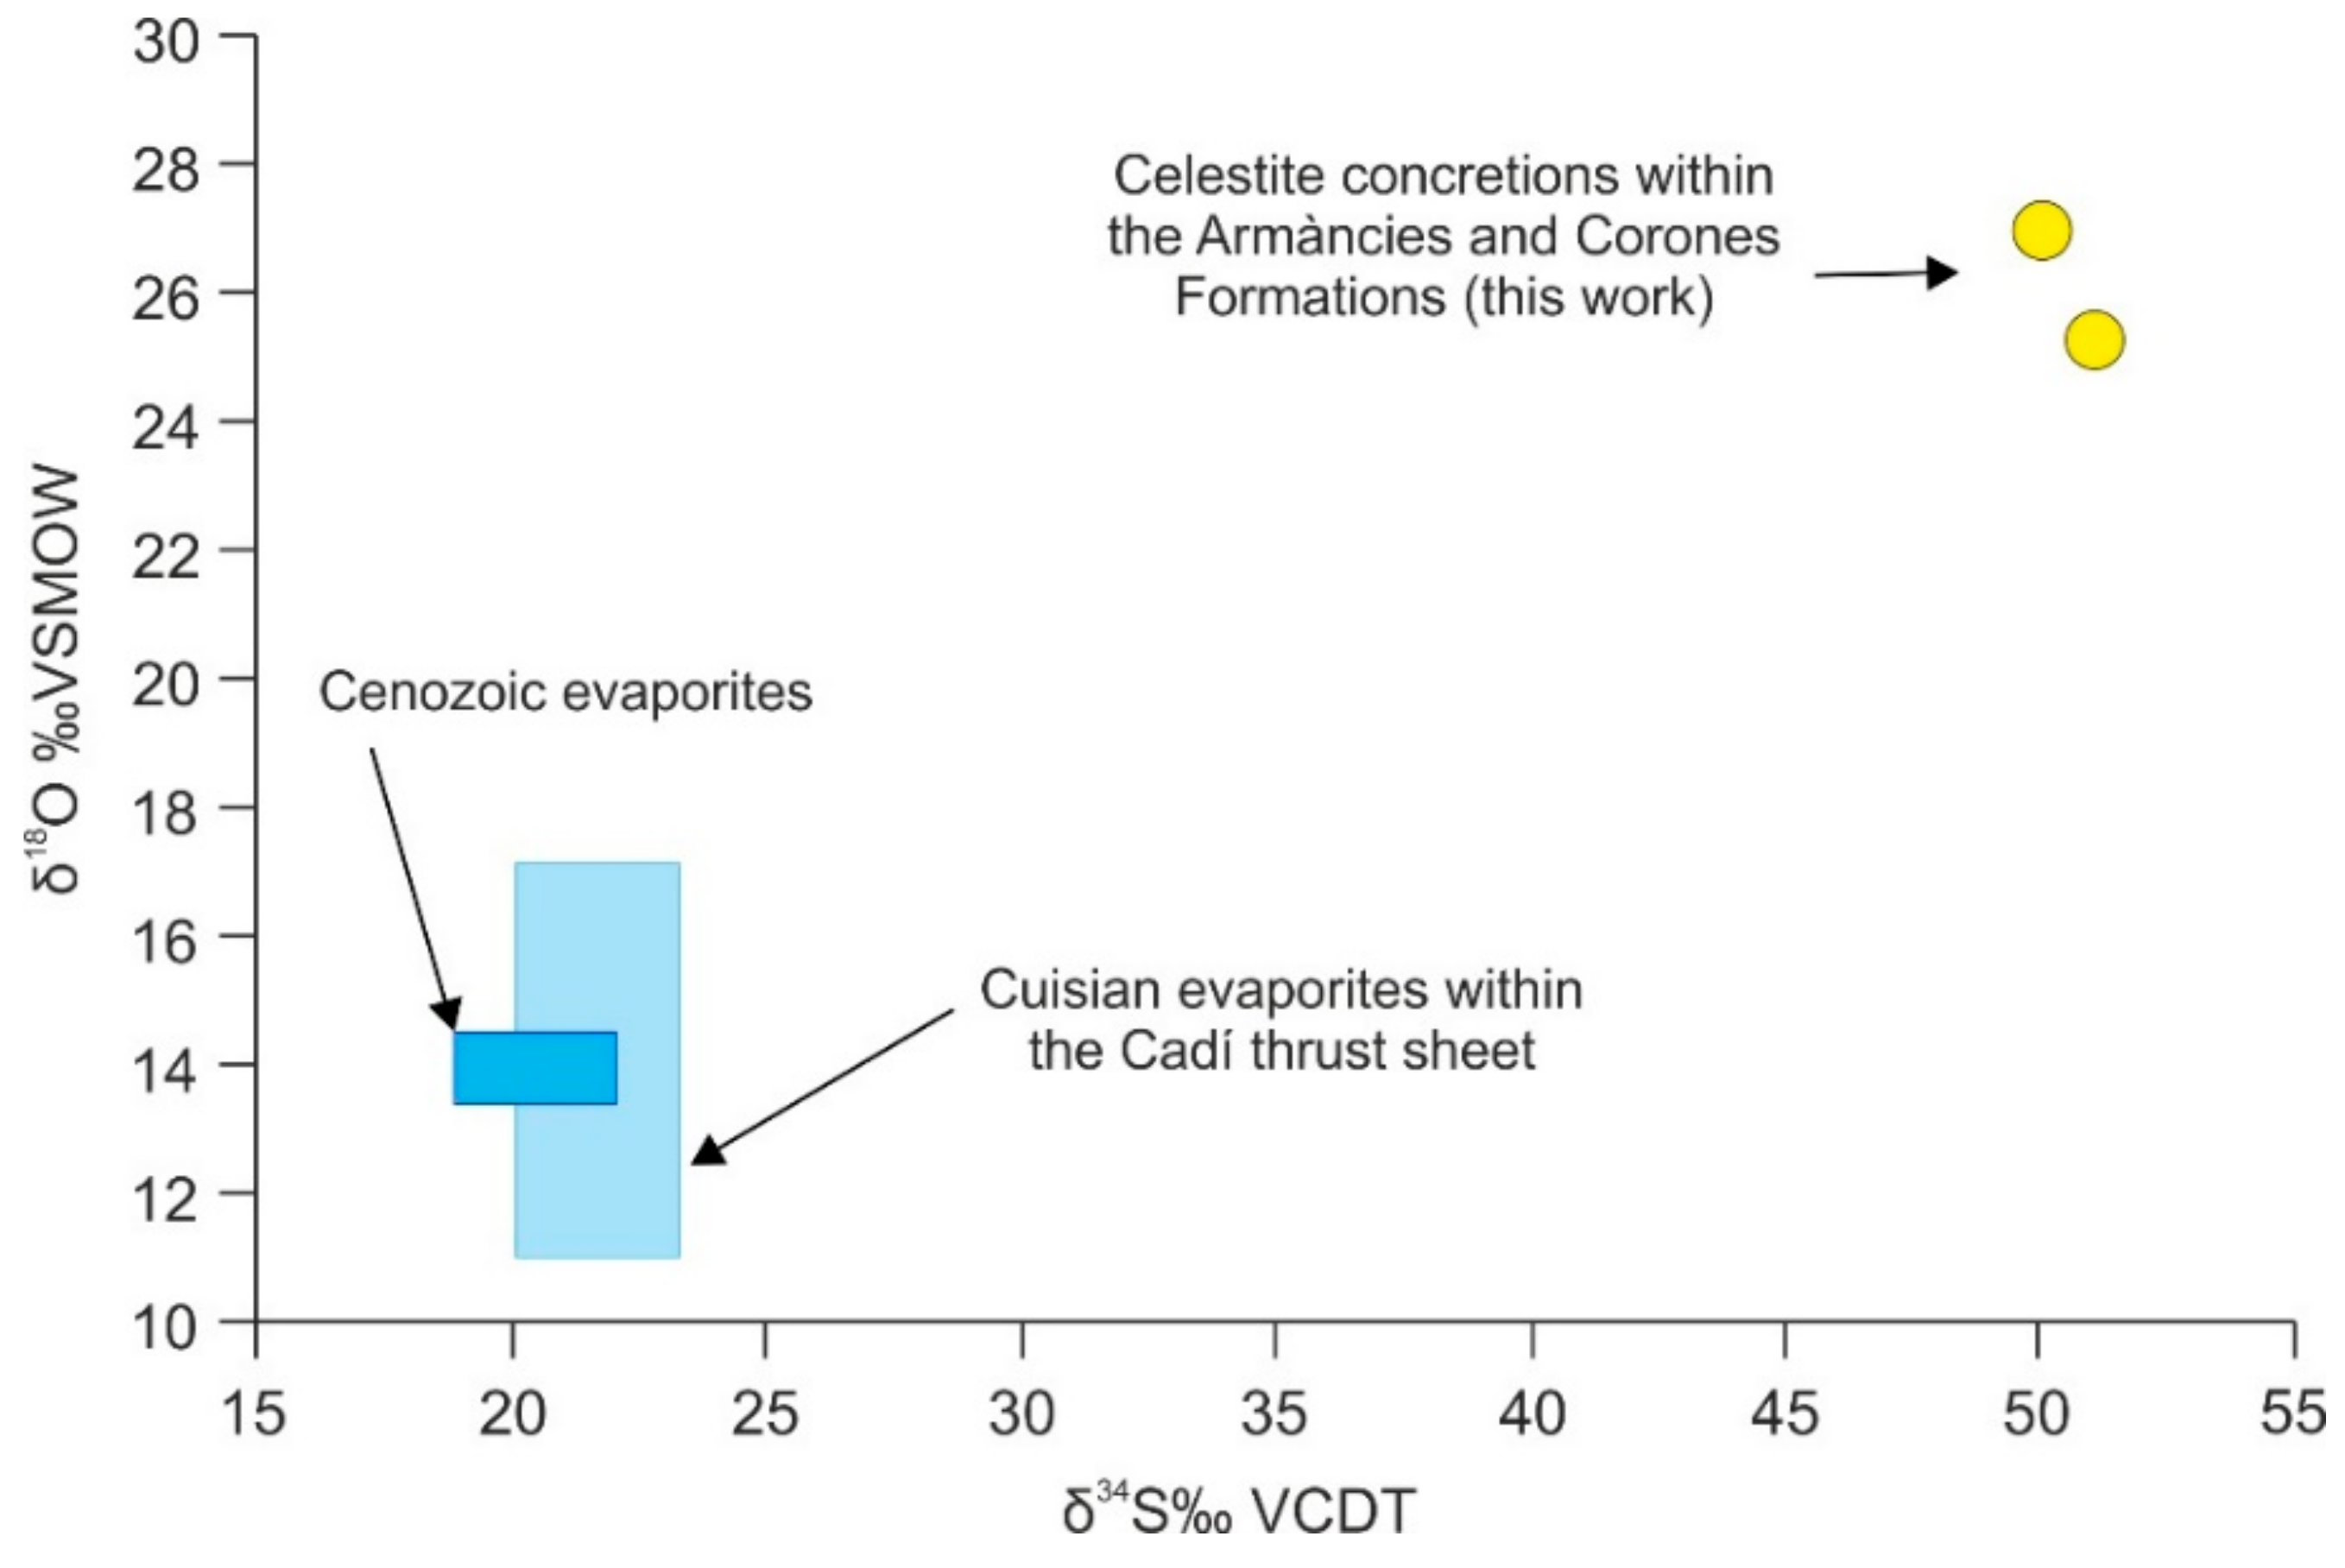
4.4.6. Sulfur and Oxygen Isotopes of Celestite Concretions

The δ34S and δ18O of celestite concretions within the Corones and Armàncies Formations are presented in Figure 13 and Table S9. Values for Cenozoic evaporites from Reference [66] and for evaporites in the Cadí thrust sheet from Reference [97] are also presented.
The δ34S of celestite concretions within the Corones and Armàncies is +50.1‰ and +51.1‰ VCDT, respectively (Figure 13). The δ18O is +25.3‰ and +27‰ VSMOW for concretions within the Armàncies and the Corones Formations, respectively (Figure 13).

5. Discussion

The integration of petrology and geochemistry of the host rock and bladed calcite cement allows us to decipher the origin of the fluids and the processes that controlled the precipitation of these unusual rose-like clusters of bladed calcite crystals.

5.1. Host Rock Diagenesis

The upper carbonate unit of the Corones Formation shows a depletion in δ18O of up to 6‰, with respect to Eocene marine carbonates (Figure 8), which can be interpreted as the interaction between this carbonate unit and high temperature fluids [8]. This geochemical change could have occurred during the Middle–Upper Eocene, when fluids at temperatures between 90 and 120 °C migrated through fractures in the studied area during the Pyrenean orogeny [60]. The measured positive Eu anomalies in the Corones Formation limestones is also indicative of the influence of hot fluids [92,98,99] (Figure 12a).
The 87Sr/86Sr ratio of 0.70789 of the Corones Formation is slightly higher than that expected for Middle Eocene seawater, when this carbonate unit deposited (Figure 10). This enrichment in 87Sr/86Sr could be related to the presence of terrigenous sediments within the Corones Formation or the influence of fluids with higher 87Sr/86Sr ratios than those of Middle Eocene seawater. The absence of negative Ce anomalies in one sample of the Corones Formation and the Y/Ho ratios ranging from 23.84 to 35.83 of this carbonate unit reflect the influence of terrigenous sediments rather than the input of external fluids [99] (Figure 12b,c).
The origin of the celestite concretions within the Corones and Armàncies Formations can be deduced from their isotopic composition. The δ34S (+50.1‰ to +51.1‰ VCDT) and δ18O (+25.3‰ to +27‰ VSMOW) values of these concretions are highly enriched with respect to Cenozoic evaporites and the sulfates within the Cadí thrust sheet [66,97] (Figure 13). This enrichment could indicate that these concretions precipitated from residual sulfate left after sulfate reduction processes [100,101]. The source of this sulfate could be the Corones Formation, where gypsum pseudomorphs have been observed [102]. The presence of celestite concretions has also been interpreted in many carbonate reservoirs to be linked with oil migration [103].

5.2. Type of Fluids

Bladed calcite crystals forming rose-like clusters have a δ18Ofluid of −5.52‰ ± 0.9‰ VSMOW, which is within the range of meteoric waters [104] (Figure 8). The slight positive Eu anomaly observed in the bladed calcites indicates that these crystals precipitated at higher temperatures than those present in surficial conditions [92,99]. The measured clumped temperature of 60–65 °C for calcite cement supports this interpretation (Figure 9).
The very low Mn and Fe content of bladed calcite crystals indicates oxidizing conditions during its precipitation [84,105,106,107] (Figure 11a). These oxidizing conditions are also reported by the negative Ce anomaly calculated for one of the samples of this cement [92,99,108] (Figure 12b). However, the absence of this negative anomaly in another sample of bladed calcite, together with its Y/Ho ratios ranging from 20.94 to 41.88, could indicate that the meteoric fluids interacted with terrigenous sediments [99] (Figure 12c). These terrigenous sediments are probably derived from the same Corones Formation, since this carbonate unit has Y/Ho ratios similar to that of bladed calcite (from 23.84 to 35.83) (Figure 12c). This influence is also evidenced by the similarity between the 87Sr/86Sr ratio of the bladed calcite cement and that of the host Corones Formation (0.70790 and 0.70789, respectively; Figure 10). In the same line, the Mg (from 0.020 to 0.046), Sr (from 0.02 to 0.09), and Mn (from 0.0001 to 0.0003) molar ratios of bladed calcites are within the range of formation waters, probably indicating interaction between meteoric fluids and the Corones Formation [83,84,85,86,87,88] (Figure 11b,c). The positive Y anomaly in one of the samples of the bladed calcite could indicate the interaction between these fluids and a marine source, which, in this case, are the studied marine host carbonates [92,99] (Figure 12a). The high Sr content of bladed crystals could result from fluids interacting with celestite concretions existing within the carbonate member of the Corones Formation [60]. Summarizing, based on the geochemical results, rose-like clusters of bladed calcites precipitated at 60–65 °C from oxidizing meteoric fluids that interacted with their adjacent host rocks. This interaction partly modified the geochemical signature of these fluids.
X-ray diffraction of the less abundant, and probably younger, laminar calcite indicates the presence of laminar crystal habits with prominent {01 1 ¯ 8} rhombohedral faces (Figure 5), which are found in ‘nailhead’ calcites [76]. This type of calcite crystals, with c-axis flattened morphology, has been attributed to calcite precipitated from shallow fresh groundwater with a lower salinity than calcite with rhombohedral morphologies [12,14].
Finally, Raman spectroscopy applied to FIA1 and FIA2 allows us to identify mainly aromatic hydrocarbons and significantly less abundant alkanes (Figure 7 and Table 1). This is in contrast with previous studies about the composition of petroleum within the Armàncies Formation, the source rock in the SE Pyrenees, where not altered hydrocarbons are dominated by the presence of n-Alkanes. However, the same authors conclude that bacterial biodegradation of hydrocarbons in the SE Pyrenees mainly resulted in the removal of n-Alkanes, whereas alteration of aromatic compounds was less pronounced. This different susceptibility of hydrocarbons to microbial degradation could explain why most of Raman peaks are within the range of vibration of the aromatic hydrocarbons.

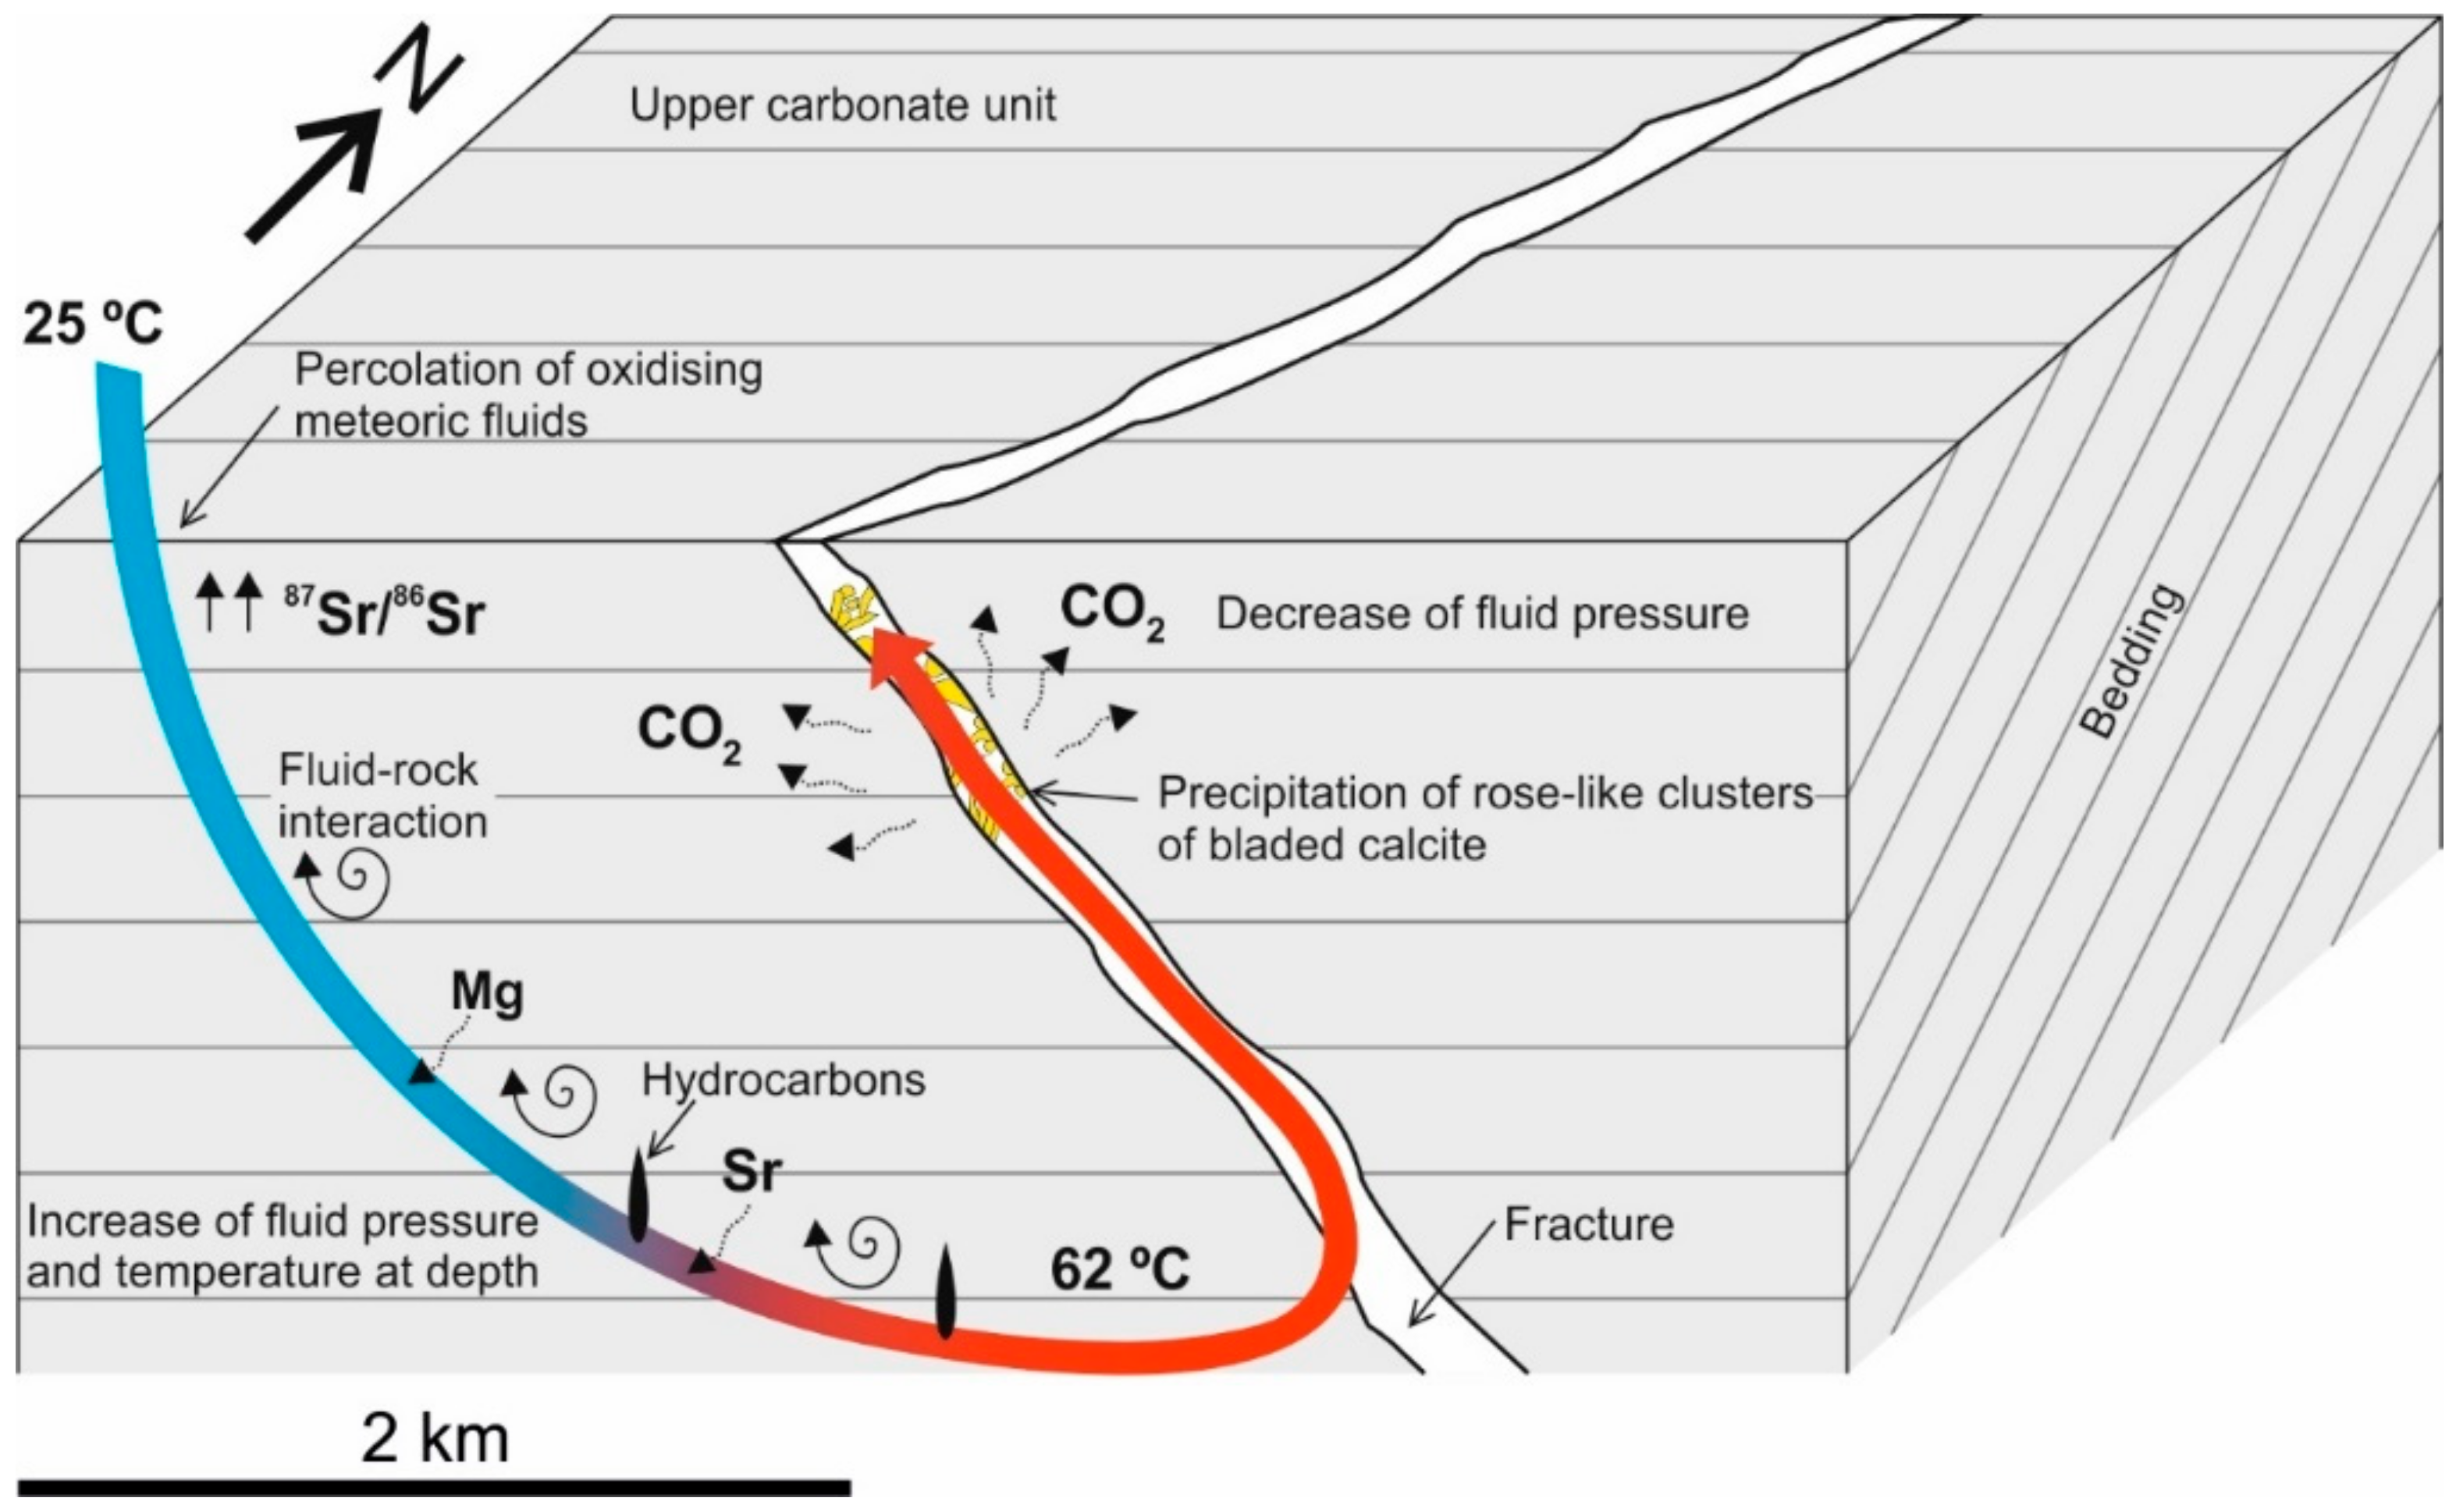
5.3. Precipitation Model for Rose-Like Clusters of Bladed Calcites

The petrographic characterization of rose-like clusters of bladed calcite crystals, together with their geochemical composition, allows us to identify the controlling parameters during their precipitation.
Bladed crystal morphologies in calcite are commonly associated with settings in which CO2 is released by boiling [18,19,21]. However, this is in contrast with the clumped temperature of 62.13 ± 5.25 °C obtained for these calcites, the estimated burial depth of 2 km, and the presence of rhombohedral morphologies, whose relationship with fluid boiling is not clear [19,109]. An alternative model for CO2 release from fluids implies a sudden pressure drop and effervescence during their rapid upward migration to shallow positions and fracture opening [19,23,110,111]. However, it is important to highlight that mixing between two immiscible fluids can also decrease the boiling temperature of the two components [26,27]. In this line, calculations made by Reference [25] proved that a mixture of water and benzene decreases the boiling temperature to below 70 °C. The presence in the studied bladed calcites of benzene, aromatic hydrocarbons, and alkanes in FIA1 and FIA2, together with the measured clumped temperature of ~60–65 °C, accounts for boiling of fluids at this temperature rather than sudden pressure drop and effervescence. The coexistence between liquid-rich and vapor-rich FIA1, together with the different volumes of their gas bubbles, also suggests the fluid boiling hypothesis [18,19,21,23,109,112]. Calcites with (104) rhombohedral faces could be attributed to the high concentration of divalent cations, such as Sr (Figure 11a) [13]. The development of calcite crystals with (104) faces could also be related to the presence of proteins and peptides within hydrocarbons trapped in fluid inclusions [15]. The presence of these organic compounds has not been documented in previous works characterizing the composition of hydrocarbons within the Corones and Armàncies Formations [62]. However, these authors also report a marine origin for the hydrocarbons in the SE Pyrenees (e.g., planktonic, bacteria). The protein content of these marine organisms can reach a concentration of up to 50%, according to Reference [113]. Therefore, the influence of proteins on calcite morphology cannot be ruled out. Other parameters controlling calcite morphology are pH and supersaturation of fluids. In this line, rhombohedral calcites and the absence of vaterite polymorphs (Figure S2) are indicative of pH values between 11 and 13, and [Ca2+]/[CO32−] ratios between 2 and 5 [16].
Based on the model of CO2 release mentioned above, and the geochemical composition of the studied bladed crystals, we have drawn a conceptual model of precipitation for the rose-like clusters of bladed calcites in the studied outcrop of the Southern Pyrenees (Figure 14). In this model, oxidizing meteoric fluids, at ambient temperatures, percolated up to 2 km in depth, where they reached a temperature of ~60–65 °C (Figure 14), considering the geothermal gradient of 30 °C/km assumed by [114,115] for the Southern Pyrenees. During their downward migration, these meteoric fluids interacted with the host Corones Formation limestone, resulting in the modification of the elemental composition and REEs+Y content of fluids to a formation water composition. Interaction with the host Corones Formation, where petroleum oil seeps have been identified [30,60], would have also been the responsible for the presence in the FIA1 of aromatic hydrocarbons, components from the group of alkanes and benzene (Figure 7 and Figure 14; Table 1). In this setting, hydrocarbons may have mixed with evolved meteoric waters during their migration. Subsequent NE–SW fracturing of the host rock and buoyance forces facilitated these fluids to migrate upward [116]. As a result of fracture opening and the migration of fluids to shallow positions, pressure conditions decreased. The new shallow conditions allowed fluid boiling, CO2 release, and the precipitation of bladed calcites in rose-like clusters. After their precipitation, bladed crystals were affected by a later fracturing event, resulting in the development of secondary inclusions and a second pulse of hydrocarbon migration.

6. Conclusions

The integration of petrographic, crystallographic, vibrational, and geochemical methods allowed us to decipher the origin of fracture-filling rose-like clusters of bladed calcite crystals in the northern sector of the Cadí thrust sheet (SE Pyrenees).
Optical and electron microscope observations, together with X-ray diffraction measurements, have allowed us to characterize the morphology and orientation of the studied calcite crystals. Petrographic observations of bladed calcites also indicate the presence of primary and secondary fluid inclusion assemblages (FIA1 and FIA2). Raman spectroscopy of FIA1 and FIA2 show several features that can be attributed to vibrational modes of the aromatic hydrocarbons and the benzene group. However, Raman peaks corresponding to the range of vibrations of the group the alkanes are also observed.
Clumped isotopes thermometry reflects that bladed calcite precipitated from meteoric fluids at 60–65 °C. The very low Mn and Fe content and the presence of negative Ce anomalies measured in this calcite indicate oxidizing conditions during its precipitation. High Sr content in bladed calcite suggests the interaction of fluids with celestite concretions developed within the carbonate member of the Corones Formation. The similar 87Sr/86Sr ratios of the Eocene marine carbonates and the studied bladed calcite (0.70789 and 0.70790, respectively), together with the Y/Ho ratios ranging from 20.94 to 41.88 and the Mg/Ca, Sr/Ca, and Mn/Ca ratios within the range of formation waters calculated for bladed calcites, also indicate interaction between meteoric fluids and the Corones Formation. The high Sr content in calcite, the presence of organic compounds within hydrocarbons trapped in fluid inclusions, and pH controlled the precipitation of bladed crystals with (104) rhombohedral faces. The presence of ‘nailhead’ calcites in non-cemented spaces by bladed crystals probably indicates later migration of shallow fresh groundwater with a lower salinity than that of bladed calcite.
The integration of the obtained results and their comparison with bladed calcites from other fluid systems worldwide reveal that the fracture-filling rose-like calcite clusters studied in the northern side of the Cadí thrust sheet precipitated due to a CO2 release by boiling meteoric fluids that mixed with benzene and aromatic hydrocarbons at ~60–65 °C. This mixture controlled the decrease of the boiling point at these temperatures.

Supplementary Materials

The following are available online at https://www.mdpi.com/2075-163X/10/6/522/s1. Figure S1: XRD pattern of celestite concretions, Figure S2: XRD pattern of calcite crystals, Table S1: δ18O and δ13C values of the carbonate host rocks and bladed calcite crystals precipitated in the Cadí thrust sheet, Table S2: δ13C, δ18O, Δ47, and δ18Ofluid of one sample of bladed calcites within the Cadí thrust sheet, Table S3: δ13C, δ18O, Δ47, and δ18Ofluid of one sample of bladed calcites within the Cadí thrust sheet, Table S4: Mg, Sr, Fe, Mn, and Ca content in ppm of bladed calcites, Table S5: Mg/Ca, Sr/Ca, Ca/Fe, and Mn/Ca molar ratios of bladed calcites, Table S6: Rare earths and yttrium content in ppm of the Corones Formation and Bladed calcites within the Cadí thrust sheet, Table S7: PAAS-normalized rare earths and yttrium content of the Corones Formation and bladed calcites within the Cadí thrust sheet, Table S8: Calculated cerium (Ce/Ce*) and praseodymium (Pr/Pr*) anomalies and Y/Ho ratios for the Corones Formation and bladed calcite within the Cadí thrust sheet, Table S9: δ34S and δ18O of celestite concretions within the Corones and Armàncies Formations.

Author Contributions

Conceptualization, A.T.; methodology, all of the authors; investigation, D.C., J.I.-I., I.C., and A.T.; data curation, D.C., J.I.-I., and C.M.J.; writing—original draft preparation, D.C.; writing—review and editing, D.C., J.I.-I., I.C., A.T., and C.M.J.; visualization, D.C.; supervision, A.T.; project administration, A.T.; funding acquisition, A.T. All authors have read and agreed to the published version of the manuscript.

Funding

This research was funded by DGICYT Spanish Project PGC2018-093903-B-C22 Ministerio de Ciencia, Innovación y Universidades/Agencia Estatal de Investigación/Fondo Europeo de Desarrollo Regional, Unión Europea, Grup Consolidat de Recerca ”Geologia Sedimentària” (2017SGR-824).

Acknowledgments

Scanning Electron Microscope observations and the isotopic, Raman, and electron microprobe analyses were carried out at “Centres Científics i Tecnològics” of the Universitat de Barcelona. Strontium analyses were done at the “CAI de Geocronología y Geoquímica Isotópica (UCM-CEI)” of the Universidad Complutense de Madrid. The XRD diffraction analysis was carried out by the X-ray Diffraction Service of the Institute of Earth Sciences Jaume Almera (ICTJA-CSIC). The high-resolution inductively coupled plasma mass spectrometry analyses were carried out at Geochemistry Facility of labGEOTOP of the ICTJA-CSIC, a cofounded structure by FEDER-UE (Ref. CSIC08-4E-001). The clumped isotopes analyses were performed in the Qatar Stable Isotope Laboratory of Imperial College of London. The accurate and constructive comments of two anonymous reviewers and the editor Francis Wu helped to improve the original manuscript.

Conflicts of Interest

The authors declare no conflict of interest.

References

  1. Travé, A.; Calvet, F.; Sans, M.; Vergés, J.; Thirlwall, M. Fluid history related to the Alpine compression at the margin of the south-Pyrenean Foreland basin: The El Guix anticline. Tectonophysics 2000, 321, 73–102. [Google Scholar] [CrossRef]
  2. Travé, A.; Labaume, P.; Calvet, F.; Soler, A.; Tritlla, J.; Bautier, M.; Potdevin, J.L.; Séguret, M.; Raynaud, S.; Briqueu, L. Fluid migration during Eocene thrust emplacement in the south Pyrenean foreland basin (Spain): An integrated structural, mineralogical and geochemical approach. In Cenozoic Foreland Basins of Western Europe; Mascle, A., Puigdefàbregas, C., LuterBacher, H.P., Fernàndez, M., Eds.; Geological Society, Special Publications: London, UK, 1998; Volume 134, pp. 163–188. [Google Scholar]
  3. Swennen, R.; Ferket, H.; Benchilla, L.; Roure, F.; Ellam, R.; Team, S. Fluid flow and diagenesis in carbonate dominated Foreland Fold and Thrust Belts: Petrographic inferences from field studies of late-diagenetic fabrics from Albania, Belgium, Canada, Mexico and Pakistan. J. Geochem. Explor. 2003, 78–79, 481–485. [Google Scholar] [CrossRef]
  4. Hansman, R.J.; Albert, R.; Gerdes, A.; Ring, U. Absolute ages of multiple generations of brittle structures by U-Pb dating of calcite. Geology 2018, 46, 207–210. [Google Scholar] [CrossRef] [Green Version]
  5. Cantarero, I.; Parcerisa, D.; Plata, M.A.; Gómez-Gras, D.; Gómez-Rivas, E.; Martín-Martín, J.D.; Travé, A. Fracturing and Near-Surface Diagenesis of a Silicified Miocene Deltaic Sequence: The Montjuïc Hill (Barcelona). Minerals 2020, 10, 135. [Google Scholar] [CrossRef] [Green Version]
  6. Rochelle, C.A.; Czernichowski-Lauriol, I.; Milodowski, A.E. The impact of chemical reactions on CO2 storage in geological formations: A brief review. In Geological Storage of Carbon Dioxide; Baines, S.J., Worden, R.H., Eds.; Geological Society Special Publications: London, UK, 2004; Volume 233, pp. 87–106. [Google Scholar]
  7. Pham, V.T.H.; Lu, P.; Aagaard, P.; Zhu, C.; Hellevang, H. On the potential of CO2–water–rock interactions for CO2 storage using a modified kinetic model. Int. J. Greenh. Gas Control 2011, 5, 1002–1015. [Google Scholar] [CrossRef] [Green Version]
  8. Gasparrini, M.; Ruggieri, G.; Brogi, A. Diagenesis versus hydrothermalism and fluid–rock interaction within the Tuscan Nappe of the Monte Amiata CO2-rich geothermal area (Italy). Geofluids 2013, 13, 159–179. [Google Scholar] [CrossRef]
  9. Banner, J.L.; Hanson, G.N. Calculation of simultaneous isotopic and trace element variations during water-rock interaction with applications to carbonate diagenesis. Geochim. Cosmochim. Acta 1990, 54, 3123–3137. [Google Scholar] [CrossRef]
  10. Warren, J. Dolomite: Occurrence, evolution and economically important associations. Earth-Sci. Rev. 2000, 52, S0012–S8252. [Google Scholar] [CrossRef]
  11. Aquilano, D.; Otálora, F.; Pastero, L.; García-Ruiz, J.M. Three study cases of growth morphology in minerals: Halite, calcite and gypsum. Prog. Cryst. Growth Charact. Mater. 2016, 62, 227–251. [Google Scholar] [CrossRef] [Green Version]
  12. Milodowski, A.E.; Bath, A.; Norris, S. Palaeohydrogeology using geochemical, isotopic and mineralogical analyses: Salinity and redox evolution in a deep groundwater system through Quaternary glacial cycles. Chem. Geol. 2018, 97, 40–60. [Google Scholar] [CrossRef]
  13. Fernández-Díaz, L.; Astilleros, J.M.; Pina, C.M. The Morphology of calcite crystals grown in a porous medium doped with divalent cations. Chem. Geol. 2006, 225, 314–321. [Google Scholar] [CrossRef] [Green Version]
  14. Iwatsuki, T.; Satake, H.; Metcalfe, R.; Yoshida, H.; Hama, K. Isotopic and morphological features of fracture calcite from granitic rocks of the Tono area, Japan: A promising palaeohydrogeological tool. Appl. Geochem. 2002, 17, 1241–1257. [Google Scholar] [CrossRef]
  15. Chen, C.L.; Qi, J.; Tao, J.; Zuckermann, R.N.; Yoreo, J.J.D. Tuning calcite morphology and growth acceleration by a rational design ofhighly stable protein-mimetics. Sci. Rep. 2014, 4, 6266. [Google Scholar] [CrossRef] [PubMed] [Green Version]
  16. Oral, C.M.; Ercan, B. Influence of pH on morphology, size and polymorph of room temperature synthesized calcium carbonate particles. Powder Technol. 2018, 339, 781–788. [Google Scholar] [CrossRef]
  17. Harvey, C.C.; Browne, P.R.L. Note on the occurrence and compositions of calcite from the Te Mihi sector of the Wairakei geothermal system, New Zealand. In Proceedings of the 14th New Zealand Geothermal Workshop, Taupo, New Zealand, 14–16 November 2018. [Google Scholar]
  18. Canet, C.; Franco, S.I.; Prol-Ledesma, R.M.; González-Partida, E.; Villanueva-Estrada, R.E. A model of boiling for fluid inclusion studies: Application to the Bolaños Ag–Au–Pb–Zn epithermal deposit, Western Mexico. J. Geochem. Explor. 2011, 110, 118–125. [Google Scholar] [CrossRef]
  19. Montcada, D.; Mutchler, S.; Nieto, A.; Reynolds, T.J.; Rimstidt, J.D.; Bodnar, R.J. Mineral textures and fluid inclusion petrography of the epithermal Ag–Au deposits at Guanajuato, Mexico: Application to exploration. J. Geochem. Explor. 2012, 114, 20–35. [Google Scholar] [CrossRef]
  20. Griffiths, L.; Heap, M.J.; Wang, F.; Daval, D.; Gilg, H.A.; Baud, P.; Schmittbuhl, J.; Genter, A. Geothermal implications for fracture-filling hydrothermalprecipitation. Geothermics 2016, 64, 235–245. [Google Scholar] [CrossRef]
  21. Lu, Y.C.; Song, S.R.; Taguchi, S.; Wang, P.L.; Yeh, E.C.; Lin, Y.J.; MacDonald, J.; John, C.M. Evolution of hot fluids in the Chingshui geothermal field inferred from crystal morphology and geochemical vein data. Geothermics 2018, 74, 305–318. [Google Scholar] [CrossRef] [Green Version]
  22. Hutcheon, I.; Shevalier, M.; Abercrombie, H.J. pH buffering by metastable mineral-fluid equilibria and evolution of carbon dioxide fugacity during burial diagenesis. Geochim. Cosmochim. Acta 1993, 57, 1017–1027. [Google Scholar] [CrossRef]
  23. Simmons, S.F.; Christenson, B.W. Origin of calcite in a boiling geothermal system. Am. J. Sci. 1994, 294, 361–400. [Google Scholar] [CrossRef]
  24. Ruiz-Agudo, E.; Putnis, C.V.; Rodríguez-Navarro, C.; Putnis, A. Effect of pH on calcite growth at constant aCa2+/aCO32− ratio and supersaturation. Geochim. Cosmochim. Acta 2011, 75, 284–296. [Google Scholar] [CrossRef]
  25. Randall, M.; Avila, W. The boiling point-composition diagram of insmiscible and partially miscible liquid systems. J. Geochem. Explor. 1940, 17, 536–537. [Google Scholar] [CrossRef]
  26. Krell, E. (Ed.) Chapter 4. Physical fundamentals of the separation process. In Techniques and Instrumentation in Analytical Chemistry; Elsevier: Amsterdam, The Netherlands, 1982; Volume 2, pp. 43–202. [Google Scholar]
  27. Geankoplis, C.J. Transport Processes and Separation Process Principles, 4th ed.; Prentice Hall: Upper Saddle River, NJ, USA, 2003. [Google Scholar]
  28. Travé, A.; Labaume, P.; Calvet, F.; Soler, A. Sediment dewatering and pore fluid migration along thrust faults in a foreland basin inferred from isotopic and elemental geochemical analyses (Eocene southern Pyrenees, Spain). Tectonophysics 1997, 282, 375–398. [Google Scholar] [CrossRef]
  29. Travé, A.; Labaume, P.; Vergés, J. Fluid systems in Foreland Fold and thrust belts: An overview from the Southern Pyrenees. In Thrust Belts and Foreland Basins: From Fold Kinematics to Hydrocarbon Systems; Lacombe, O., Lavé, J., Roure, F., Vergés, J., Eds.; Springer: Amsterdam, The Netherlands, 2007; pp. 93–115. [Google Scholar]
  30. Caja, M.A.; Permanyer, A.; Marfil, R.; Al-Asm, I.S.; Martín-Crespo, T. Fluid flow record from fracture-fill calcite in the Eocene limestones from the South-Pyrenean Basin (NE Spain) and its relationship to oil shows. J. Geochem. Explor. 2006, 89, 27–32. [Google Scholar] [CrossRef]
  31. Lacroix, B.; Baumgartner, L.P.; Bouvier, A.S.; Kempton, P.D.; Vennemann, T. Multi fluid-flow record during episodic mode I opening: Amicrostructural and SIMS study (Cotiella Thrust Fault, Pyrenees). Earth Planet. Sci. Lett. 2018, 503, 37–46. [Google Scholar] [CrossRef]
  32. Lacroix, B.; Buatier, M.; Labaume, P.; Travé, A.; Dubois, M.; Charpentier, D.; Ventalon, S.; Convert-Gaubier, D. Microtectonic and geochemical characterization of thrusting in a foreland basin: Example of the South-Pyrenean orogenic wedge (Spain). J. Struct. Geol. 2011, 33, 1359–1377. [Google Scholar] [CrossRef]
  33. Lacroix, B.; Travé, A.; Buatier, M.; Labaume, P.; Vennemann, T.; Dubois, M. Syntectonic fluid-flow along thrust faults: Example of the South-Pyrenean fold-and-thrust belt. Mar. Pet. Geol. 2014, 49, 84–98. [Google Scholar] [CrossRef]
  34. Crognier, N.; Hoareau, G.; Aubourg, C.; Dubois, M.; Lacroix, B.; Branellec, M.; Callot, J.P.; Vennemann, T. Syn-orogenic fluid flow in the Jaca basin (south Pyrenean fold and thrust belt) from fracture and vein analyses. Basin Res. 2017. [Google Scholar] [CrossRef]
  35. Beaudoin, N.; Huyghe, D.; Bellahsen, N.; Lacombe, O.; Emmanuel, L.; Mouthereau, F.; Ouanhnon, L. Fluid systems and fracture development during syn-depositional fold growth: An example from the Pico del Aguila anticline, Sierras Exteriores, southern Pyrenees, Spain. J. Struct. Geol. 2015, 70, 23–38. [Google Scholar] [CrossRef] [Green Version]
  36. Cruset, D.; Cantarero, I.; Travé, A.; Vergés, J.; John, C.M. Crestal graben fluid evolution during growth of the Puig-reig anticline (South Pyrenean fold and thrust belt). J. Geodyn. 2016, 101, 30–50. [Google Scholar] [CrossRef] [Green Version]
  37. Cruset, D.; Cantarero, I.; Vergés, J.; John, C.M.; Muñoz-López, D.; Travé, A. Changes in fluid regime in syn-orogenic sediments during the growth of the south Pyrenean fold and thrust belt. Glob. Planet. Chang. 2018, 171, 207–224. [Google Scholar] [CrossRef]
  38. Nardini, N.; Muñoz-López, D.; Cruset, D.; Cantarero, I.; Martín-Martín, J.D.; Benedicto, A.; Gómez-Rivas, E.; John, C.M.; Travé, A. From early contraction to post-folding fluid evolution in the frontal part of the Bóixols thrust sheet (southern Pyrenees) as revealed by the texture and geochemistry of calcite cements. Minerals 2019, 9, 117. [Google Scholar] [CrossRef] [Green Version]
  39. Choukroune, P.; Team ECORS. The ECORS Pyrenean deep seismic profile reflection data and the overall structure of an orogenic belt. Tectonics 1989, 8, 23–39. [Google Scholar] [CrossRef]
  40. Roure, F.; Choukroune, P.; Berastegui, J.; Muñoz, J.A.; Villien, A.; Matheron, P.; Bareyt, M.; Seguret, M.; Camara, P.; Deramond, J. Ecors deep seismic data and balanced cross sections: Geometric constraints on the evolution of the Pyrenees. Tectonics 1989, 8, 41–50. [Google Scholar] [CrossRef]
  41. Muñoz, J.A. Evolution of a continental collision belt: ECORS–Pyrenees crustal balanced section. In Thrust Tectonics; McClay, K.R., Ed.; Chapman & Hall: London, UK, 1992; pp. 235–246. [Google Scholar]
  42. Muñoz, J.A. The Pyrenees. In The Geology of Spain; Gibbons, W., Moreno, T., Eds.; Geological Society: London, UK, 2002; pp. 370–385. [Google Scholar]
  43. Vergés, J.; Fernàndez, M.; Martínez, A. The Pyrenean orogen: Pre-, syn-, and post-collisional evolution. In Reconstruction of the Evolution of the Alpine-Himalayan Orogen, Journal of the Virtual Explorer; Rosenbaum, G., Lister, G., Eds.; Research School of Earth Sciences, Australian National University: Canberra, Australia, 2002; Volume 8, pp. 55–74. [Google Scholar]
  44. Vergés, J.; Millán, H.; Roca, E.; Muñoz, J.A.; Marzo, M.; Cirés, J.; Bezemer, T.D.; Zoetemeijer, R.; Cloetigh, S. Eastern Pyrenees and related foreland basins: Pre-, syn- and post-collisional cristal-scale cross-sections. Mar. Pet. Geol. 1995, 12, 893–915. [Google Scholar] [CrossRef]
  45. Teixell, A.; Labaume, P.; Ayarza, P.; Espurt, N.; Blanquat, M.d.S.; Lagabrielle, Y. Crustal structure and evolution of the Pyrenean-Cantabrian belt: A review and new interpretations from recent concepts and data. Tectonophysics 2018, 724–725, 146–170. [Google Scholar] [CrossRef] [Green Version]
  46. Mató, E.; Saula, E.; Martínez-Rius, A.; Muñoz, J.A.; Escuer, J. Memoria de la Hoja n° 293 (Berga). In Mapa Geológico de España E. 1:50.000 (MAGNA), Segunda Serie, Primera Edición; IGME: Madrid, Spain, 1994; p. 66. [Google Scholar]
  47. Pi, M.E.; Samsó-Escola, J.M.; Vilella, L.; Arbués, P.; Casanovas, J.; Berastegui, X. Mapa geológico de la Hoja n° 291 (Oliana). In Mapa Geológico de España E. 1:50.000. Segunda Serie (MAGNA), Primera Edición; IGME: Madrid, Spain, 2001. [Google Scholar]
  48. Muñoz, J.A.; Vergés, J.; Martínez, A.; Fleta, J.; Cirés, J.; Casas, J.M.; Sàbat, F. Mapa geológico de la Hoja n° 256 (Ripoll). In Mapa Geológico de España E. 1:50.000. Segunda Serie (MAGNA), Primera Edición; IGME: Madrid, Spain, 1994. [Google Scholar]
  49. Vergés, J.; Martínez, A.; Domingo, F.; Muñoz, J.A.; Losantos, M.; Fleta, J.; Gisbert, J. Mapa geológico de la Hoja n° 255 (La Pobla de Lillet). In Mapa Geológico de España E. 1:50.000. Segunda Serie (MAGNA), Primera Edición; IGME: Madrid, Spain, 1994. [Google Scholar]
  50. Puigdefàbregas, C.; Muñoz, J.A.; Marzo, M. Thrust Belt Development in the Eastern Pyrenees and Related Depositional Sequences in the Southern Foreland Basin. In Foreland Basins; Allen, P.A., Homewood, P., Eds.; Blackwell Publishing Ltd.: Oxford, UK, 1986; Volume 8, pp. 229–246. [Google Scholar]
  51. Burbank, D.W.; Vergés, J.; Muñoz, J.A.; Bentham, P. Coeval hinward- and forward-imbricating thrusting in the south-central Pyrenees, Spain: Timing and rates of shortening and deposition. Geol. Soc. Am. Bull. 1992, 104, 3–17. [Google Scholar] [CrossRef]
  52. Burbank, D.W.; Puigdefàbregas, C.; Muñoz, J.A. The chronology of the Eocene tectonic and stratigraphic development of the Eastern Pyrenean Foreland Basin. NE Spain. Geol. Soc. Am. Bull. 1992, 104, 1101–1120. [Google Scholar] [CrossRef]
  53. Vergés, J.; Burbank, D.W. Eocene-Oligocene thrusting and basin configuration in the eastern and central Pyrenees (Spain). In Tertiary Basins of Spain; Friend, P., Dabrio, C., Eds.; World and Regional Geology E11; Cambridge University Press: Cambridge, UK, 1996; pp. 120–133. [Google Scholar]
  54. Vergés, J. Estudi Geològic del Vessant sud del Pirineu Oriental i Central, Evolució cinemàtica en 3D. Ph.D. Thesis, Universitat de Barcelona, Barcelona, Spain, 1993. [Google Scholar]
  55. Gich, M. Estudio geológico del Eoceno prepirenaico del Ripollés oriental. Acta Geol. Hisp. 1973, 8, 120–124. [Google Scholar]
  56. Barnolas, A. Evolución sedimentaria de la Cuenca Surpirenaica Oriental durante el Eoceno. Acta Geol. Hisp. 1992, 27, 15–31. [Google Scholar]
  57. Giménez-Monsant, J. Análisis de Cuenca del Eoceno Inferior de la Unidad Cadí (Pirineo oriental). El Sistema Deltaico y de Plataforma Carbonática de la Formación Corones. Ph.D. Thesis, Universitat de Barcelona, Barcelona, Spain, 1993. [Google Scholar]
  58. Gimènez-Montsant, J.; Calvet, F. Ciclos y ciclicidad en depósitos de ostrácodos del Cuisiense inferior del sur de los Pirineos orientales. In Proceedings of the I Congreso del Grupo Español del Terciario, Vic, Spain, 12–17 April 1998. [Google Scholar]
  59. Calvet, F.; Playà, E.; Giménez-Montsant, J.; Permanyer, A. Fifth-order cyclicity and organic matter contents relationship (Lower Eocene, Pyrenees). Geol. Acta 2007, 5, 59–75. [Google Scholar]
  60. Cruset, D.; Cantarero, I.; Vergés, J.; Benedicto, A.; John, C.M.; Gerdes, A.; Albert, R.; Travé, A. Tectonically-induced oil migration in the south-eastern Pyrenean foreland basin. In Proceedings of the 34th International Meeting of Sedimentology (IAS), Rome, Italy, 10–13 September 2019. [Google Scholar]
  61. Permanyer, A.; Vallés, D.; Dorronsoro, C. Source rocks potential of an Eocene carbonate ramps: The Armàncies Formation of the southern Pyrenean Basin, northeast Spain. AAPG Bull. 1988, 72, 1019. [Google Scholar]
  62. Permanyer, A.; Gallego, J.L.R.; Caja, M.A.; Dessort, D. Crude oil biodegradation and environmental factors at the Riutort oil shale mine, SE Pyrenees. J. Pet. Geol. 2010, 33, 123–140. [Google Scholar] [CrossRef]
  63. Jones, B.; Renaut, R.W. Origin of Platy calcite crystals in hot-spring deposits in the Kenya Rift Valley. J. Sediment. Res. 1998, 68, 913–927. [Google Scholar] [CrossRef]
  64. McCrea, J.M. On the Isotopic Chemistry of Carbonates and a Paleotemperature Scale. J. Chem. Phys. 1950, 18, 849–957. [Google Scholar] [CrossRef]
  65. Craig, H.; Gordon, I.-I. Deuterium and oxygen-18 variations in the ocean and the marine atmosphere. In A Conference on Stable Isotopes in Oceanographic Studies and Paleotemperatures; Tongiorgi, E., Ed.; Consiglio Nazionale delle Richerche, Laboratorio di Geologia Nucleare: Pisa, Italy, 1965; pp. 9–130. [Google Scholar]
  66. Claypool, G.E.; Kaplan, W.T.; Kaplan, I.R.; Sakai, H.; Zak, I. The age curves of sulfur and oxygen isotopes in marine sulfate and their mutual interpretations. Chem. Geol. 1980, 28, 199–260. [Google Scholar] [CrossRef]
  67. John, C.M.; Bowen, D. Community software for challenging isotope analysis: First applications of “Easotope” to clumped isotopes. Rapid Commun. Mass Spectrom. 2016, 30, 2285–2300. [Google Scholar] [CrossRef]
  68. Guo, W.; Mosenfelder, J.L.; Goddard, W.A.; Eiler, J.M. Isotopic fractionations associated with phosphoric acid digestion of carbonate minerals: Insights from first-principles theoretical modeling and clumped isotope measurements. Geochim. Cosmochim. Acta 2009, 73, 7203–7225. [Google Scholar] [CrossRef]
  69. Huntington, K.W.; Eiler, J.M.; Affeck, H.P.; Guo, W.; Bonifacie, M.; Yeung, L.Y.; Thiagarajan, N.; Passey, B.; Tripati, A.; Daëron, M.; et al. Methods and limitations of ‘clumped’ CO2 isotope (Δ47) analysis by gas-source isotope ratio mass spectrometry. J. Mass Spectrom. 2009, 44, 1318–1329. [Google Scholar] [CrossRef]
  70. Bernasconi, S.M.; Hu, B.; Wacker, U.; Fiebig, J.; Breitenbach, S.F.M.; Rutz, T. Background effects on Faraday collectors in gas-source mass spectrometry and implications for clumped isotope measurements. Rapid Commun. Mass Spectrom. 2013, 27, 603–612. [Google Scholar] [CrossRef]
  71. Dennis, K.J.; Affeck, H.P.; Passey, B.H.; Schrag, D.P.; Eiler, J.M. Defining an absolute reference frame for ‘clumped’ isotope studies of CO2. Geochim. Cosmochim. Acta 2011, 75, 7117–7131. [Google Scholar] [CrossRef]
  72. Kim, S.T.; O’Neil, J.R. Equilibrium and nonequilibrium oxygen isotope effects in synthetic carbonates. Geochim. Cosmochim. Acta 1997, 61, 3461–3475. [Google Scholar] [CrossRef]
  73. Davies, A.J.; John, C.M. The clumped (13C18O) isotope composition of echinoid calcite: Further evidence for “vital effects” in the clumped isotope proxy. Geochim. Cosmochim. Acta 2019, 245, 172–189. [Google Scholar] [CrossRef]
  74. McLennan, S. Rare earth elements in sedimentary rocks; influence of provenance and sedimentary processes. Rev. Mineral. Geochem. 1989, 21, 277–290. [Google Scholar]
  75. Halas, S.; Szaran, J. Improved thermal decomposition of sulfates to SO2 and mass spectrometric determination of δ34S of IAEA SO-5, IAEA SO-6 and NBS-127 sulfate standards. Rapid Commun. Mass Spectrom. 2001, 15, 1618–1620. [Google Scholar] [CrossRef]
  76. Checa, A.G.; Esteban-Delgado, F.J.; Rodríguez-Navarro, A.B. Crystallographic structure of the foliated calcite of bivalves. J. Struct. Biol. 2007, 157, 393–402. [Google Scholar] [CrossRef]
  77. Orange, D.; Knittle, E.; Farber, D.; Williams, Q. Raman spectroscopy of crude oils and hydrocarbon fluid inclusions: A feasibility study. In Mineral Spectroscopy: A Tribute to Roger G. Burns; Dyar, M.D., McCammon, C., Schaefer, M.W., Eds.; The Geochemical Society; Special Publication: Washington, DC, USA, 1996; Volume 5, pp. 65–81. [Google Scholar]
  78. Hurai, V.; Huraiová, M.; Slobondník, M.; Thomas, R. (Eds.) Chapter 7-Raman and Infrared Spectroscopic Analysis. In Geofluids: Developments in Microthermometry, Spectroscopy, Thermodynamics, and Stable Isotopes; Elsevier: Amsterdam, The Netherlands, 2015; pp. 231–279. [Google Scholar] [CrossRef]
  79. Veizer, J.; Ala, D.; Azmy, K.; Bruckschen, P.; Buhl, D.; Bruhn, F.; Carden, G.A.F.; Diener, A.; Ebneth, S.; Godderis, Y.; et al. 87Sr/86Sr, d13C and d18O evolution of Phanerozoic seawater. Chem. Geol. 1999, 161, 59–88. [Google Scholar] [CrossRef] [Green Version]
  80. Friedman, I.; O’Neil, J.R. Compilation of stable isotope fractionation factors of geochemical interest. In Data of Geochemistry; Fleischer, M., Ed.; U.S. Government Printing Office: Washington, DC, USA, 1977; pp. 1–12. [Google Scholar]
  81. Tindall, J.; Flecker, R.; Valdes, P.; Schmidt, D.N.; Markwick, P.; Harris, J. Modelling the oxygen isotope distribution of ancient seawater using a coupled ocean–atmosphere GCM: Implications for reconstructing early Eocene climate. Earth Planet. Sci. Lett. 2010, 292, 265–273. [Google Scholar] [CrossRef]
  82. McArthur, J.M.; Howarth, R.J.; Bailey, T.R. Strontium Isotope Stratigraphy: LOWESS Version 3: Best Fit to the Marine Sr-Isotope Curve for 0–509 Ma and Accompanying Look-up Table for Deriving Numerical Age. J. Geol. 2001, 109, 155–170. [Google Scholar] [CrossRef] [Green Version]
  83. McIntire, W.L. Trace element partition coefficients, a review of theory and applications to geology. Geochim. Cosmochim. Acta 1963, 27, 1209–1264. [Google Scholar] [CrossRef]
  84. Tucker, M.E.; Wright, P.V. Carbonate Sedimentology; Blackwell: Oxford, UK, 1990; p. 482. [Google Scholar]
  85. Howson, M.R.; Pethybridge, A.D.; House, W.A. Synthesis and distribution coefficients of low-magnesium calcites. Chem. Geol. 1987, 64, 79–87. [Google Scholar] [CrossRef]
  86. Kolker, A.; Chou, C.L. Cleat-Filling Calcite in Illinois Basin Coals: Trace-Element Evidence for Meteoric Fluid Migration in a Coal Basin. J. Geol. 1994, 102, 111–116. [Google Scholar] [CrossRef] [Green Version]
  87. Steuber, T.; Rauch, M. Evolution of the Mg/Ca ratio of Cretaceous seawater: Implications from the composition of biological low-Mg calcite. Mar. Geol. 2005, 217, 199–213. [Google Scholar] [CrossRef]
  88. Ligi, M.; Bonatti, E.; Cuffaro, M.; Brunelli, D. Post-Mesozoic Rapid Increase of Seawater Mg/Ca due to Enhanced Mantle-Seawater Interaction. Sci. Rep. 2013, 3, 2752. [Google Scholar] [CrossRef] [PubMed]
  89. Katz, A. The interaction of magnesium with calcite during crystal growth at 25–90 °C and one atmosphere. Geochim. Cosmochim. Acta 1973, 39, 486–508. [Google Scholar] [CrossRef]
  90. Lorens, R. Sr, Cd, Mn and Co distribution coefficients in calcite as a function of calcite precipitation rate. Geochim. Cosmochim. Acta 1981, 45, 553–561. [Google Scholar] [CrossRef]
  91. Kinsman, D.J.J. Interpretation of Sr2+ concentrations in carbonate minerals and rocks. J. Sediment. Petrol. 1969, 39, 486–508. [Google Scholar]
  92. Bau, M.; Dulski, P. Distribution of yttrium and rare-earth elements in the Penge and Kuruman iron-formations, Transvaal Supergroup, South Africa. Precambr. Res. 1996, 79, 37–55. [Google Scholar] [CrossRef]
  93. Webb, G.E.; Kamber, B.S. Rare earth elements in Holocene reefal microbialites: A new shallow seawater proxy. Geochim. Cosmochim. Acta 2000, 64, 1557–1565. [Google Scholar] [CrossRef]
  94. Bau, M.; Dulski, P. Evolution of the yttrium-holmium systematics of seawater through time. Mineral. Mag. 1994, 58, 61–62. [Google Scholar] [CrossRef]
  95. Zhao, L.; Chen, Z.Q.; Algeo, T.J.; Chen, J.; Chen, Y.; Tong, J.; Gao, S.; Zhou, L.; Hu, Z.; Liu, Y. Rare-earth element patterns in conodont albid crowns: Evidence for massive inputs of volcanic ash during the latest Permian biocrisis? Glob. Planet. Chang. 2013, 105, 135–151. [Google Scholar] [CrossRef]
  96. Lawrence, M.G.; Creig, A.; Collerson, K.D.; Kamber, B.S. Rare earth element and yttrium variability in south east Queensland Waterways. Aquat. Geochem. 2006, 12, 39–72. [Google Scholar] [CrossRef]
  97. Carrillo, E. The Evaporites of the Southeastern Pyrenean Basin (Late Cuisian–Lutetian): Sedimentology and Structure. Ph.D. Thesis, University of Barcelona, Barcelona, Spain, 2012. [Google Scholar]
  98. Meyer, E.E.; Quicksall, A.N.; Landis, J.D.; Link, P.K.; Bostick, B.C. Trace and rare earth elemental investigation of a Sturtian cap carbonate, Pocatello, Idaho: Evidence for ocean redox conditions before and during carbonate deposition. Precambr. Res. 2012, 192–195, 89–106. [Google Scholar] [CrossRef]
  99. Tostevin, R.; Shields, G.A.; Tarbuck, G.M.; He, T.; Clarckson, M.O.; Wood, R.A. Effective use of cerium anomalies as a redox proxy in carbonate-dominated marine settings. Chem. Geol. 2016, 438, 146–162. [Google Scholar] [CrossRef] [Green Version]
  100. Clark, I.D.; Fritz, P. Environmental Isotopes in Hydrogeology; CRC Press/Lewis Publishers: Boca Raton, FL, USA, 1997. [Google Scholar]
  101. Aharon, P.; Fu, B. Sulfur and oxygen isotopes of coeval sulfate–sulfide in pore fluids of cold seep sediments with sharp redox gradients. Chem. Geol. 2003, 195, 201–218. [Google Scholar] [CrossRef]
  102. Giménez-Montsant, J.; Calvet, F.; Tucker, M.E. Silica diagenesis in Eocene shallow-water platform carbonates, southern Pyrenees. Sedimentology 1999, 46, 969–984. [Google Scholar] [CrossRef]
  103. Esteban, M.; Taberner, C. Secondary porosity development during late burial in carbonate reservoirs as a result of mixing and/or cooling of brines. J. Geochem. Explor. 2003, 78–79, 355–359. [Google Scholar] [CrossRef]
  104. Taylor, B.E. Stable isotope geochemistry of ore-forming fluids. In Short Course in Stable Isotope Geochemistry of Low Temperature Fluids; Kyser, T.K., Ed.; Mineral Association of Canada: Saskatoon, SK, Canada, 1987; Volume 13, pp. 337–418. [Google Scholar]
  105. Froelich, P.N.; Klinkhammer, G.P.; Bender, M.L.; Luedtke, N.A.; Heath, G.R.; Cullen, D.; Dauphin, P.; Hammond, D.; Hartman, B.; Maynard, V. Early oxidation of organic matter in pelagic sediments of the eastern equatorial Atlantic: Suboxic diagenesis. Geochim. Cosmochim. Acta 1979, 43, 1075–1090. [Google Scholar] [CrossRef]
  106. Barnaby, R.J.; Rimstidt, J.D. Redox conditions of calcite cementation interpreted from Mn and Fe contents of authigenic calcites. Geol. Soc. Am. Bull. 1989, 101, 795–804. [Google Scholar] [CrossRef]
  107. Travé, A.; Roca, E.; Playà, E.; Parcerisa, D.; Gómez-Gras, D.; Martín-Martín, J.D. Migration of Mn-rich fluids through normal faults and fine-grained terrigenous sediments during early development of the Neogene Vallès-Penedès half-graben (NE Spain). Geofluids 2009, 9, 303–320. [Google Scholar] [CrossRef] [Green Version]
  108. Lécuyer, C.; Reynard, B.; Grandjean, P. Rare earth element evolution of Phanerozoic seawater recorded in biogenic apatites. Chem. Geol. 2004, 204, 63–102. [Google Scholar] [CrossRef]
  109. Camprubí, A.; Albinson, T. Epithermal deposits in mexico update of current knowledge, and an empirical reclassification. Geol. Soc. Am. Spec. Pap. 2007, 422, 377–415. [Google Scholar]
  110. Bons, P.D.; Elburg, M.A.; Gómez-Rivas, E. A review of the formation of tectonic veins and their microstructures. J. Struct. Geol. 2012, 43, 33–62. [Google Scholar] [CrossRef]
  111. Beaudoin, N.; Bellahsen, N.; Lacombe, O.; Emmanuel, L.; Pironon, J. Crustal-scale fluid flow during the tectonic evolution of the Bighorn Basin (Wyoming, USA). Basin Res. 2014, 26, 403–435. [Google Scholar] [CrossRef] [Green Version]
  112. Kerkhof, A.M.V.D.; Hein, U.F. Fluid inclusion petrography. Lithos 2001, 55, 27–47. [Google Scholar] [CrossRef]
  113. Ke, C.W.; Xu, Y.H.; Chang, X.C.; Lin, W.B. Composition and distribution of NSO compounds in two different shales at the early maturity stage characterized by negative ion electrospray ionization coupled with Fourier transform ion cyclotron resonance mass spectrometry. Pet. Sci. 2018, 15, 289–296. [Google Scholar] [CrossRef]
  114. Beamud, E.; Muñoz, J.A.; Fitzgerald, P.G.; Baldwin, S.L.; Garcés, M.; Cabrera, L.; Metcalf, J.R. Magnetostratigraphy and detrital apatite fission track thermochronology in syntectonic conglomerates: Constraints on the exhumation of the South-Central Pyrenees. Basin Res. 2010, 23, 309–331. [Google Scholar] [CrossRef]
  115. Rushlow, C.R.; Barnes, J.B.; Ehlers, T.A.; Vergés, J. Exhumation of the southern Pyrenean fold-thrust-belt (Spain from orogenic growth to decay. Tectonics 2013, 32, 843–860. [Google Scholar] [CrossRef] [Green Version]
  116. Taillefer, A.; Soliva, R.; Guillou-Frottier, L.; Goff, E.L.; Martin, G.; Saranne, M. Fault-Related Controls on Upward Hydrothermal Flow: An Integrated Geological Study of the Têt Fault System, Eastern Pyrénées (France). Geofluids 2017, 8190109. [Google Scholar] [CrossRef]
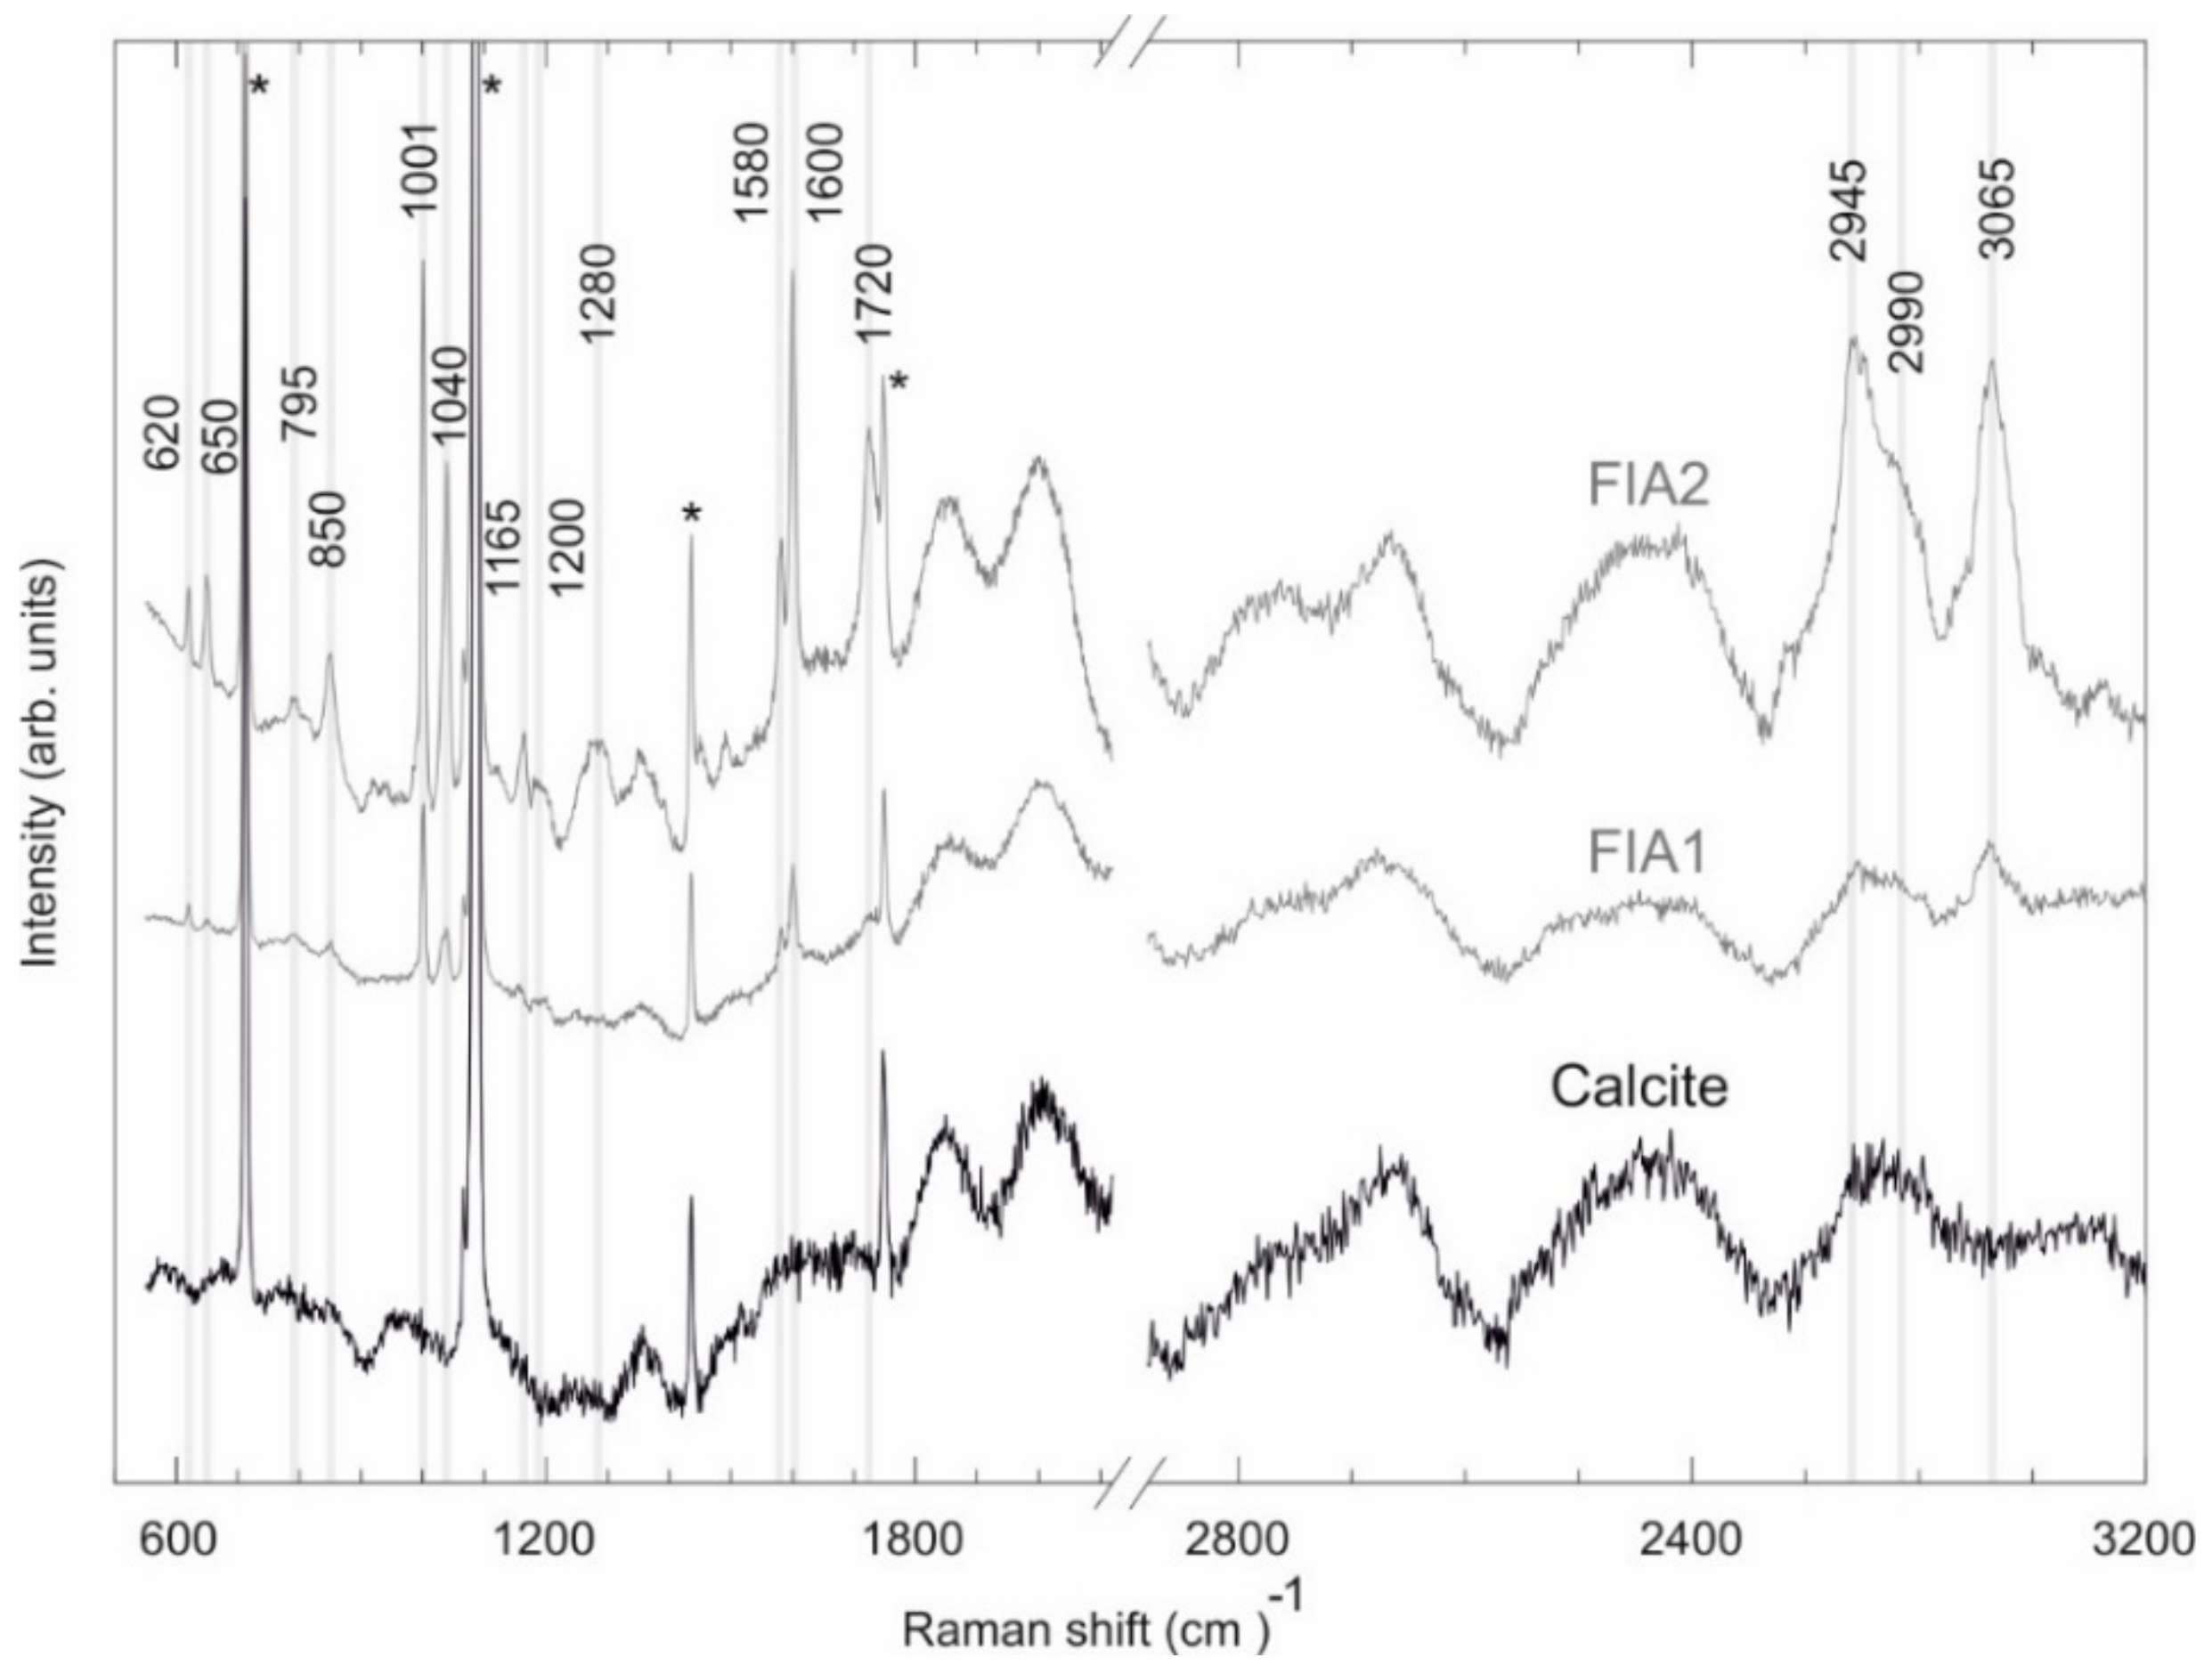
Figure 1. (a) Regional map of the Iberian Peninsula, showing the location of the Southeastern Pyrenees (yellow box). (b) Geological map showing the main structural units forming the Southeastern Pyrenean fold and thrust belt, based on Reference [46,47,48,49]. The red star indicates the location of the studied outcrop.
Minerals 10 00522 g001
Figure 2. N–S stratigraphic panel of the Cadí thrust sheet. The age of sedimentary units was stablished according to [44]. The sedimentary record of the Cadí thrust sheet was separated into Paleocene continental deposits and Eocene marine formations. The red box indicates the stratigraphic position of the studied outcrop.
Minerals 10 00522 g002
Figure 3. Images of the studied outcrop in the northern side of the Cadí thrust sheet. (a) Crosscutting relationships between the Corones Formation and the sampled NE–SW fracture. The thick red line and the red surface represent trace and plane of this fracture, respectively. The thin blue lines represent bedding. The dashed black box indicates the locations for (d,e). (b,c) Celestite concretions within the Corones Formation. (d,e) Images of the rose-like clusters of bladed calcites.
Minerals 10 00522 g003
Figure 4. Images from polarizing optical, electron (SEM), and cathodoluminescence (CL) microscopes of the main features of the upper carbonate unit of the Corones Formation and studied bladed calcites. (a) Optical microscope image (PPL, plane polarized light) of an ostracod cemented by blocky calcite crystals. (b) Optical microscope image (PPL) of a packstone of miliolids and other unknown components. (c,d) Optical (PPL) and CL images of celestite crystals growing within the carbonates of the Corones Formation. (e) SEM image of rhombic calcite subcrystals forming the bladed crystals. (f) SEM image of µm-scale bladed calcite subcrystals. (g,h) Optical (PPL) and CL images of bladed calcites.
Minerals 10 00522 g004
Figure 5. X-ray diffraction patterns of the studied bladed calcites, which are dominated by the (104) reflection in the bulky crystal habit and by the (108) reflection in the more laminar crystals. Complete XRD patterns of calcite are shown in Figure S2.
Minerals 10 00522 g005
Figure 6. Images from polarizing optical microscope of the main features of fluid inclusions FIA1 and FIA2 (not crossed nicols). (a) FIA1 inclusion without gas bubble. (b) Very scarce FIA1 inclusions containing gas bubbles. (c,d) FIA2 inclusions filled with petroleum. Note how they are arranged parallel to fractures that also contain petroleum.
Minerals 10 00522 g006
Figure 7. Raman spectra of the studied bladed calcite and FIA1 and FIA2. Main vibrations are given in cm−1. The assignment of the observed Raman peaks for FIA1 and FIA2 is given in Table 1. Raman peaks highlighted with * indicate the main vibrations of calcite.
Minerals 10 00522 g007
Figure 8. δ18O vs. δ13C cross-plots of the Corones Formation and bladed calcite crystals. Range for the Eocene marine carbonates from Reference [79].
Minerals 10 00522 g008
Figure 9. Clumped isotopes temperature in °C vs. calculated δ18Ofluid (‰ VSMOW) for the bladed calcites. The yellow box indicates the range of δ18Ofluid calculated from the δ18O values of bladed calcites in Figure 8 in ‰ VPDB and the measured clumped isotopes temperature, using the formula of [80]. δ18O of Eocene seawater in ‰ VSMOW is from Reference [81].
Minerals 10 00522 g009
Figure 10. 87Sr/86Sr composition of the Corones Formation and bladed calcite crystals. The 87Sr/86Sr ratios of the LOWESS curve from Reference [82] are also plotted.
Minerals 10 00522 g010
Figure 11. (a) Mg, Sr, Fe, and Mn content of bladed calcite crystals. Maximum, minimum, and mean values are given. (b,c) Mg/Ca vs. Sr/Ca and Mg/Ca vs. Mn/Ca cross-plots of bladed calcites. Areas bounded by blue, green, and red thick lines represent the composition of marine, meteoric, and formation fluids, respectively, based on References [83,84,85,86,87,88].
Minerals 10 00522 g011
Figure 12. (a) PAAS-normalized REEs + Y distribution patterns of the Corones Formation and bladed calcites. (b) Ce/Ce* vs. Pr/Pr* cross-plot showing the Ce and Pr anomalies of the Corones Formation and bladed calcites. The method of Reference [92] modified by Reference [93] is used. Field I: neither Ce nor La anomaly; field IIa: positive La anomaly and no Ce anomaly; field IIb: negative La anomaly and no Ce anomaly; field IIIa: positive Ce anomaly; field IIIb: negative Ce anomaly; field IV: positive Ce and La anomalies. (c) Y/Ho ratios the Corones Formation and bladed calcites. Y/Ho limits for modern seawater and terrigenous sediments are based on References [94,95].
Minerals 10 00522 g012
Figure 13. δ34S and δ18O of celestite concretions within the Corones and Armàncies Formations. Values for Cenozoic evaporites from Reference [66] and for evaporites in the Cadí thrust sheet from Reference [97] are also presented.
Minerals 10 00522 g013
Figure 14. Conceptual precipitation model for the rose-like clusters of bladed calcite crystals in the northern side of the Cadí thrust sheet.
Minerals 10 00522 g014
Table 1. Raman vibrations (cm−1) of FIA1 and FIA2 fluid inclusions. The identified peaks are compared with the main range of vibrations for aromatic hydrocarbons, alkanes, and the benzene group [77,78].
Observed Peak (cm−1)Functional GroupMode AssignmentCompoundMeasured Peaks by [78] (cm−1)Measured Peaks by [77] (cm−1)
620C–CBendingAromatic hydrocarbons620–625-
650S–CStretchingAromatic hydrocarbons620–715-
795C–CRing breathing/stretchingCycloalkanes700–1000-
850C–CStretchingn-Alkanes837–905-
1001RingRing deformationBenzene and derivates990–1060999
1040RingRing deformationBenzene and derivates990–1060-
1165C–CStretching/BendingAromatic hydrocarbons1020–1200-
1200C–CStretching/BendingAromatic hydrocarbons1020–1200-
1280C–CStretchingAromatic hydrocarbons1284–1295-
1580RingRing ScissorsBenzene and derivates-1580
1600C–CStretchingAromatic hydrocarbons1600–1605-
1720C–HStretchingSingle aromatic compounds1700–2000-
2945C–HStretchingAromatic hydrocarbons2927–3085-
2990C–HStretchingAromatic hydrocarbons2927–3085-
3065C–HStretchingBenzene and derivates3057–30603064

