Article

Phase Transitions in the α–γ–β Spodumene Thermodynamic System and Impact of γ-Spodumene on the Efficiency of Lithium Extraction by Acid Leaching

by
Colin Dessemond
1,
Gervais Soucy
1,*,
Jean-Philippe Harvey
2 and
Philippe Ouzilleau
1
1
Département de Génie Chimique et Biotechnologique, Université de Sherbrooke, Sherbrooke, QC J1K 2R1, Canada
2
Polytechnique Montréal, Université de Montréal, Montréal, QC H3T 1J4, Canada
*
Author to whom correspondence should be addressed.
Minerals 2020, 10(6), 519; https://doi.org/10.3390/min10060519
Submission received: 25 March 2020 / Revised: 29 May 2020 / Accepted: 2 June 2020 / Published: 5 June 2020
(This article belongs to the Section Mineral Processing and Extractive Metallurgy)

Abstract

:
Heat-treatment of spodumene concentrate at 1323 K (1050 °C) for 30 min in a rotary kiln yielded a successful decrepitation. Particle size decreased from 2 cm to less than 425 µm for 80% of the initial mass. X-ray analysis of both fractions did not reveal the presence of α-spodumene or γ-spodumene. The coarse fraction was ground to less than 425 µm with minimal mechanical energy and mixed with the finer fraction to perform lithium extraction. The lithium extraction efficiency reached 98 wt% without the need for flotation. Some aspects of the thermodynamic behavior of the spodumene system were assessed. Results show that metastable γ-spodumene may hinder the formation of β-spodumene at lower heat treatment temperatures. Some heat-treated samples presented non-negligible γ-spodumene content and lithium extraction efficiency decreases as the γ content increases. Finally, the assumed irreversibility of the transformations was studied by analyzing heat-treated samples following long controlled-storage periods. The results show that concentrate composition is not static over the studied time. This suggests that the β formation is not as irreversible as claimed. It is recommended to avoid long periods between heat-treatment and extraction to avoid the slow conversion of β-spodumene to other allotropes, which are less susceptible to lithium extraction.

1. Introduction

Spodumene is an important source of mineral lithium. It is part of the lithium-rich pegmatites family, which holds more than 20% of the identified worldwide lithium reserves [1]. With the ever increasing demand for lithium, due mostly to the electrical vehicle industry, spodumene has become an important strategic lithium source to answer the upcoming demand for metallic lithium that is expected to reach 106 kt Li by 2027 [2] (compared to the current 69 kt Li world production [1]). The spodumene mineral was first described in 1800 [3]. It was well studied over the years and processes for extracting its lithium content have been patented since the 1950s [4] with a lithium extraction efficiency of 90 wt% at the time. Since then, several processes have been patented and published, which try to improve lithium recovery. The typical lithium extraction efficiency for a modern industrial process is around 95 wt% [5]. In nature, the mineral spodumene is found in the α-spodumene configuration (i.e., monoclinic spodumene). However, this allotrope is not suitable for efficient lithium production due to its high density (3.27 g cm−3) and resilience towards extraction chemicals [4]. To circumvent these limitations [5], industrial practices rely on the heat treatment of the monoclinic spodumene concentrate, which allows α-spodumene to transform into a new allotrope, i.e., tetragonal β-spodumene. The thermally activated phase transition occurs through a phenomenon called decrepitation. In the case of spodumene, decrepitation leads to a lattice expansion of about 27% upon heating α-spodumene to a temperature above 1143 K (870 °C). The spodumene mineral density decreases to 2.45 g cm−3 [6] following the decrepitation process, which is indicative of a more open atomic structure. The temperature reported for an efficient decrepitation process typically ranges from 1143 K (870 °C) to 1373 K (1100 °C) [7]. Historically [8,9], experimental studies focused on understanding the impact between the monoclinic and tetragonal forms of spodumene on the lithium extraction efficiency. This analysis is not complete as a third spodumene allotrope exists, i.e., the hexagonal γ-spodumene, which was identified in many different heat-treated spodumene minerals [10,11,12]. This elusive phase is sometimes called spodumene-III or virgilite [13,14] and forms a complete solid solution with β-quartz [15]. Only recently have papers [6,16,17] focused on the impact of hexagonal spodumene on the lithium extraction process.
It is known [18] that γ-spodumene is readily formed during the heat treatment of mechanically activated monoclinic spodumene in the lower temperature range of 973 to 1173 K (700 to 900 °C). However, the γ-spodumene is not the most stable spodumene allotrope and will convert to β-spodumene above 1173 K (900 °C). It is suggested [19] that the energetics of the γ-spodumene formation mechanism are somehow affected by the crystallinity of the sample. Some authors [20] suggested that the grinding of α-spodumene favors the formation of γ-spodumene through an increase in surface area (which provides more nucleation sites) and the formation of structural damage in the crystals of α-spodumene. The structural damage can then be readily annealed through the crystallization of γ-spodumene. Nonmechanically activated samples [11] of α-spodumene do not appear to present any phase transition up to 1223 K (950 °C). Above 1223 K (950 °C), these samples undergo important structural reorganizations. At first, a three-phase mixture of spodumene is produced (monoclinic, tetragonal, and hexagonal). This three-phase mixture converts to β-spodumene for longer heat treatment time or higher heat treatment temperatures. This could explain why some authors did not detect the formation of γ-spodumene when heat-treating monoclinic spodumene at temperatures greater than 1223 K (950 °C), as time is a critical parameter for the phase transition from γ to β. Complete conversion to β-spodumene for prolonged heat treatments above 1223 K (950 °C) is also reported by Moore et al. [6]. These results highlight that β-spodumene is the thermodynamically stable allotrope above 1173–1223 K (900–950 °C) at atmospheric pressure. This is also confirmed by other theoretical work [6,17,21]. The three phase transition pathways in the α–γ–β spodumene (α to γ, γ to β, α to β) are commonly reported as being irreversible transformations [6,18,22]. In this case, the formation of β-spodumene is considered definitive and cannot go back to its previous state.
Crystallographic studies [13,23] on β-spodumene and γ-spodumene calculated their lattice parameters. Using those results to calculate the lattice volumes show that γ-spodumene is 8% more voluminous than α-spodumene, while β-spodumene is 17% more voluminous than γ-spodumene, making β-spodumene 26% more voluminous than α-spodumene. In terms of energetics, it is reported [11,12,19,24] that the transitions from α-spodumene to β-spodumene and from γ-spodumene to β-spodumene are both endothermic reactions, while the phase transition from α-spodumene to γ-spodumene is an exothermic reaction. Previous differential scanning calorimetry (DSC) work by Salakjani et al. [12] clearly showed that a strong exothermic reaction occurs when the α-spodumene sample is heat treated above 1313 K (1040 °C) using microwaves. These authors attributed this exothermic DSC peak to a significant occurrence of the α-to-γ phase transition. For the other phase transitions to occur (i.e., α-to-β and γ-to-β), higher temperatures (above 1393 K (1120 °C)) are required, according to these same authors. However, it is difficult to know when using microwaves exactly what temperature the minerals reach.
It is commonly accepted [7,16] that lithium extraction by acid leaching is significantly more effective with β-spodumene as the precursor material when compared to α-spodumene. This resistance to acid extraction is attributed [16] to the packed structure of the monoclinic spodumene. The less accessible lithium atomic sites in the α-spodumene structure limit the acid leaching efficiency. As noted by Salakjani et al. [16], no extensive study on the impact of the partial presence of γ-spodumene on the lithium acid extraction efficiency is presented in the literature.
Another important aspect to consider is the effect of the decrepitation process and resulting particle size distribution on the lithium extraction process. A previous study [22] showed that the decrepitation process of α-spodumene during a thermal treatment performed at 1323 K (1050 °C) for 30 min drastically reduced the particle size of the initial material. In these experiments, the particle diameter of 65 wt% of the initial mass became smaller than 180 µm after the thermal treatment. The study also showed that the finer fraction reached about 99 wt% lithium extraction efficiency (i.e., the mass ratio between extracted lithium and total lithium in the material) without additional pretreatment of the raw concentrate such as flotation. This is to be compared with the lithium extraction of the coarser fraction that only reached 61 wt% lithium extraction efficiency. These observations lead to the conclusion that downstream purification treatments are still necessary for the coarser fraction following decrepitation. This study leaves open some questions. Is 180 µm the optimal sifting size? Is it possible to reach high lithium extraction efficiency on the whole sample without flotation?
Thus, the objectives of this work are to: (1) study extraction efficiencies on whole samples after decrepitation without flotation, (2) study the impact of the presence of some hexagonal γ-spodumene on the lithium extraction efficiency by acid leaching following decrepitation of a spodumene mineral at various temperatures, and (3) produce a predictive thermodynamic analysis of the spodumene system that includes γ-spodumene. Whereas the whole spodumene system is studied in this work, its novelty lies in the attention accorded to γ-spodumene as its behavior and association in the spodumene system are not well known. This will allow a better understanding of the phenomena that take place when heat-treating spodumene.
Section 2 presents the initial material used for this study and the protocols used in the experiments. Specifically, Section 2.6 is dedicated to the analyses’ protocols. Section 3 presents the experimental results (Section 3.1, Section 3.2, Section 3.3, Section 3.4 and Section 3.5) and the associated thermodynamic analysis (Section 3.6 and Section 3.7).

2. Materials and Methods

2.1. Material

The spodumene concentrate particle size distribution studied in the present work ranged from 2 mm to 2 cm (Figure 1). The material was obtained following an industrial concentration of a spodumene mineral through several cyclones, followed by a drying step performed in a rotary electric dryer. The magnetic fraction of the concentrate was removed by using a dry magnetic separator prior to the experiments. The concentrate itself was a green rock-hard material where most particles present had white to green tints. Several impurities were identified in the concentrate, such as muscovite (1 wt%), albite (2 wt%), and quartz (5–10 wt%). Some black particles were also found in the material. They were identified as a mixture of diopside, augite, and anorthite in a previous study [22] and were not affected by the thermal treatment. They represented approximately 1 wt% of the sample. Overall, the material was not homogeneous, which is to be expected when studying industrial samples. All samples obtained from any thermal treatment discussed over the course of the present study originated from this concentrate, with the exception of samples I1 and I2, and are named A to Q by order of appearance.

2.2. Thermal Conversion of α-Spodumene to β-Spodumene

In order to assess how our initial concentrate converted to β-spodumene during heat treatment, approximately 680 g of concentrate was weighted with a Mettler Toledo New Classic MF balance. The concentrate was introduced into a rotary kiln furnace (YC-1200RT) equipped with an Inconel tube (Ø 6.73 cm). The concentrate was then heated at 1323 K (1050 °C) during 30 min. To improve the precision, the temperature was controlled with a K-type thermocouple rather than the furnace controller. The 30 minute holding time started when the temperature reached 1318 K (1045 °C) and it was maintained at 1323 ± 5 K (1050 ± 5 °C). The tube was closed by alumina sheets rolled to fit the tube.

2.3. Sifting

Following the thermal treatment, the converted concentrate was sifted in a Fisher Scientific 425 µm laboratory test sieve using Tyler RO-TAP RX-29 equipment for 5 min. The material was weighted before and after sifting to determine the weight proportion in the converted concentrate of each fraction (one being above 425 µm and the other under 425 µm). In our previous work [22], the sifting size was set at 180 µm as it is the average size of a typical sample for flotation processes in the industry. The sifting step in this previous study showed that 65 wt% of the concentrate particle distribution was smaller than 180 µm. In this study, the sifting size was set to 425 µm to further decrease the need to grind large amounts of the coarser fraction.

2.4. Acid Roasting and Lithium Leaching

Following the decrepitation heat treatment, the coarser fraction was ground down to 425 µm or less and added to the finer fraction. This provided a more uniform particle size distribution of the material prior to leaching (all particles had a diameter under 425 µm). Thirty g of this concentrate was weighted and an H2SO4 solution (CH2SO4 = 96.2 wt%) was added with a 30% excess (excess calculated with Equation (1)). These leaching conditions were chosen to obtain the highest lithium extraction efficiency, based on our previous results [25]. The leaching action of the sulphuric acid on spodumene is described by the chemical reaction presented in Equation (2) [26].
macid = mβ-spod(100% + %excess ) × (Macid/2MLi ) × (CLi/Cacid)
2LiAlSi2O6 (s) + H2SO4 (aq.) → 2HAlSi2O6 (s) + Li2SO4 (s)
where macid represents the mass of sulfuric acid (g), mβ-spod the mass of concentrate (g), %excess the excess of acid compared to stoichiometric quantity, Macid the molar mass of sulfuric acid (g mol−1), MLi the molar mass of pure lithium (g mol−1), CLi the lithium weight concentration of the sample (wt%), and Cacid the sulphuric acid weight concentration of the acid solution (wt%).
It is noted that liquid lithium bisulfate LiHSO4 forms as a reaction intermediate [27]. The formation of the liquid lithium bisulfate is linked to an exothermic reaction observed around 343 K (170 °C) [25,27]. The reported melting point of lithium bisulfate LiHSO4 varies between 293 K (120 °C) [28] and 343 K (170 °C) [27]. The extraction efficiencies of the impurities were not examined as they were beyond the scope of this study.
Each leached concentrate sample was then heated in the Thermo Scientific Lindberg Blue M Tube Furnace equipped with a quartz tube (Ø 2.5 cm) at 498 K (225 °C) for 30 min with the simultaneous presence of alumina spheres (Ø 4 mm). This method was determined to give the highest lithium extraction efficiency [25,29]. After the acid roasting step, 40 mL of osmosed water was added to the mixture and magnetically stirred for 30 min to leach and solubilize as much Li2SO4 as possible from the concentrate. The leached Li2SO4 solution was then separated from the roasted concentrate by filtration with a Buchner filter using 1 µm pore paper filter; the roasted concentrate was washed three times with 25 mL of water to ensure that all of the Li2SO4 solution was recovered.

2.5. Gibbs Energy Phase Diagram Calculations

Computational thermodynamic analysis is a powerful tool to model the equilibrium behavior of complex multicomponent and multiphasic systems involving the presence of both stable and metastable phases (e.g., the complex iron–carbon phase diagram [30]). This approach calculates the Gibbs energy of any compound in any phase as a function of temperature, pressure, and phase composition by using various numerical techniques, and will produce diagrams showing which system composition (i.e., the phases that are present and their proportion) exhibits the minimal Gibbs energy [31] (i.e., is the most stable) with regard to temperature and pressure. The purpose of Gibbs energy calculations is to predict the phase behavior in the thermodynamic system and subsequently to compare it with experimental results to extrapolate general phase behavior. Each potential phase (metastable and stable) is considered in the constrained minimization algorithm to identify the equilibrium state of the systems for the imposed thermodynamic conditions. In this work, we use computational classical thermodynamics in order to better understand the phase relations that exist in a spodumene concentrate system. These thermodynamic calculations were performed using the FactSage software [31,32]. The thermodynamic properties of the α-spodumene and β-spodumene phases, the relative enthalpy of formation at 298 K (ΔH298), absolute entropy at 298 K (S298), and the heat capacity (Cp) were taken from fitting the recommended experimental data performed by Barin [33]. A literature review confirmed that a more recent thermodynamic assessment performed by Konar et al. [15] exists for the energetic description of the α-spodumene and β-spodumene. The thermodynamic properties of these two allotropes from the two authors are presented in Table 1. These data were compared in an effort to produce the most realistic results from an experimental point of view. These data served as a base for the thermodynamic study of the α–γ–β system mentioned in Section 1.
When comparing the heat capacity expression given by Konar for α-spodumene [15] with actual experimental measures, only values up to 1200 K should be considered. Above this temperature, α-spodumene does not exist in its pure form, to the best of our knowledge. Extrapolation of the heat capacity expression of Konar above 1200 K can still be useful for theoretical analysis in complex systems, but care should be taken not to compare extrapolated values of the function with experimental heat capacity measurements once α-spodumene is no longer a single-phase system. The same reasoning is behind the use of β-spodumene’s data up to only 1700 K, since β-spodumene melts above this temperature.

2.6. Chemical and Structural Characterization

2.6.1. X-ray Diffraction (XRD)

All analyzed samples were crushed with a ball mill before analysis. XRD patterns were obtained using a PANalytical X’Pert PRO MPD diffractometer (Malvern Panalytical Ltd., Malvern, UK) equipped with a PIXcel1D detector. The data were collected between 5° and 70° (2θ angle) with the Cu Kα radiation at a rotation speed set at 1 s−1. Rietveld analyses using MDI Jade2010 were performed when deemed necessary to determine the phase proportion of the samples. Quantitative X-ray analysis was studied as early as 1919 [34], and the Rietveld method [35] is widely accepted due to its more global approach to phase quantification when compared to a single peak analysis [36]. High crystallinity of the sample is required in order to get a precise analysis [37]. This method was found to have a limit of detection as low as 0.2 wt%, as well as a good accuracy for quantification of phase proportion above 1.0 wt% [38]. In this study, the Rietveld analyses were performed by attributing the peaks to crystalline phases on the XRD patterns and refining the simulation parameters as long as the calculated error was above 1.5 wt%.

2.6.2. Atomic Absorption Spectroscopy (AAS)

Since AAS only works with liquids, all analyzed samples (heat treated or not) must be digested following a well-defined protocol detailed in previous work [25,29]. Approximately 250 mg of each heat-treated sample was weighted with a Mettler Toledo XA204 DeltaRange balance. Then, a solution that contains 3 mL of hydrochloric acid (HCl), 4 mL of hydrofluoric acid (HF), and 1 mL of nitric acid (HNO3) was added. The heterogeneous samples were then placed into a CEM Mars 6 microwave digestion system at 473 K (200 °C) during 20 min (the room temperature to 473 K (200 °C) ramp was performed in 20 min for a total of 40 min) to solubilize the solids. A second microwave treatment was performed after adding 50 mL of H3BO3 solution (C = 4.5% m/v) at 443 K (170 °C) during 15 min (the room temperature to 443 K (170 °C) ramp was performed in 15 min for a total of 30 min) to neutralize the hydrofluoric acid. The solutions obtained were diluted in nitric acid HNO3 (C = 2% m/v) and their lithium content was measured using a PerkinElmer AAnalyst 200 AA spectrometer (PerkinElmer Inc., Waltham, MA, USA). The filtrated lixiviates were further diluted in nitric acid HNO3 (C = 2% m/v) and analyzed using the same spectrometer.

2.6.3. Differential Scanning Calorimetry (DSC)

A sample mass of 25 mg of the initial concentrate, which was not heat treated in any way, was weighted with a Mettler Toledo XA204 DeltaRange balance and placed into an alumina crucible. This sample was then introduced into a Netzsch DSC 404 F3 Pegasus DSC analyzer (Erich Netzsch GmbH & Co. Holding KG, Selb, Germany) and studied between 303 K and 1473 K (30 and 1200 °C) using a heating rate of 20 K/min under a 70 mL/min flow of N2/O2 70/30. The isobaric heat capacity (Cp) of the material was ultimately derived from the differential heat flow measurement following standard procedure [39]. A high-purity sapphire standard was used to calibrate the baseline of the heat flow measurement.

3. Results and Discussion

3.1. Thermal Conversion

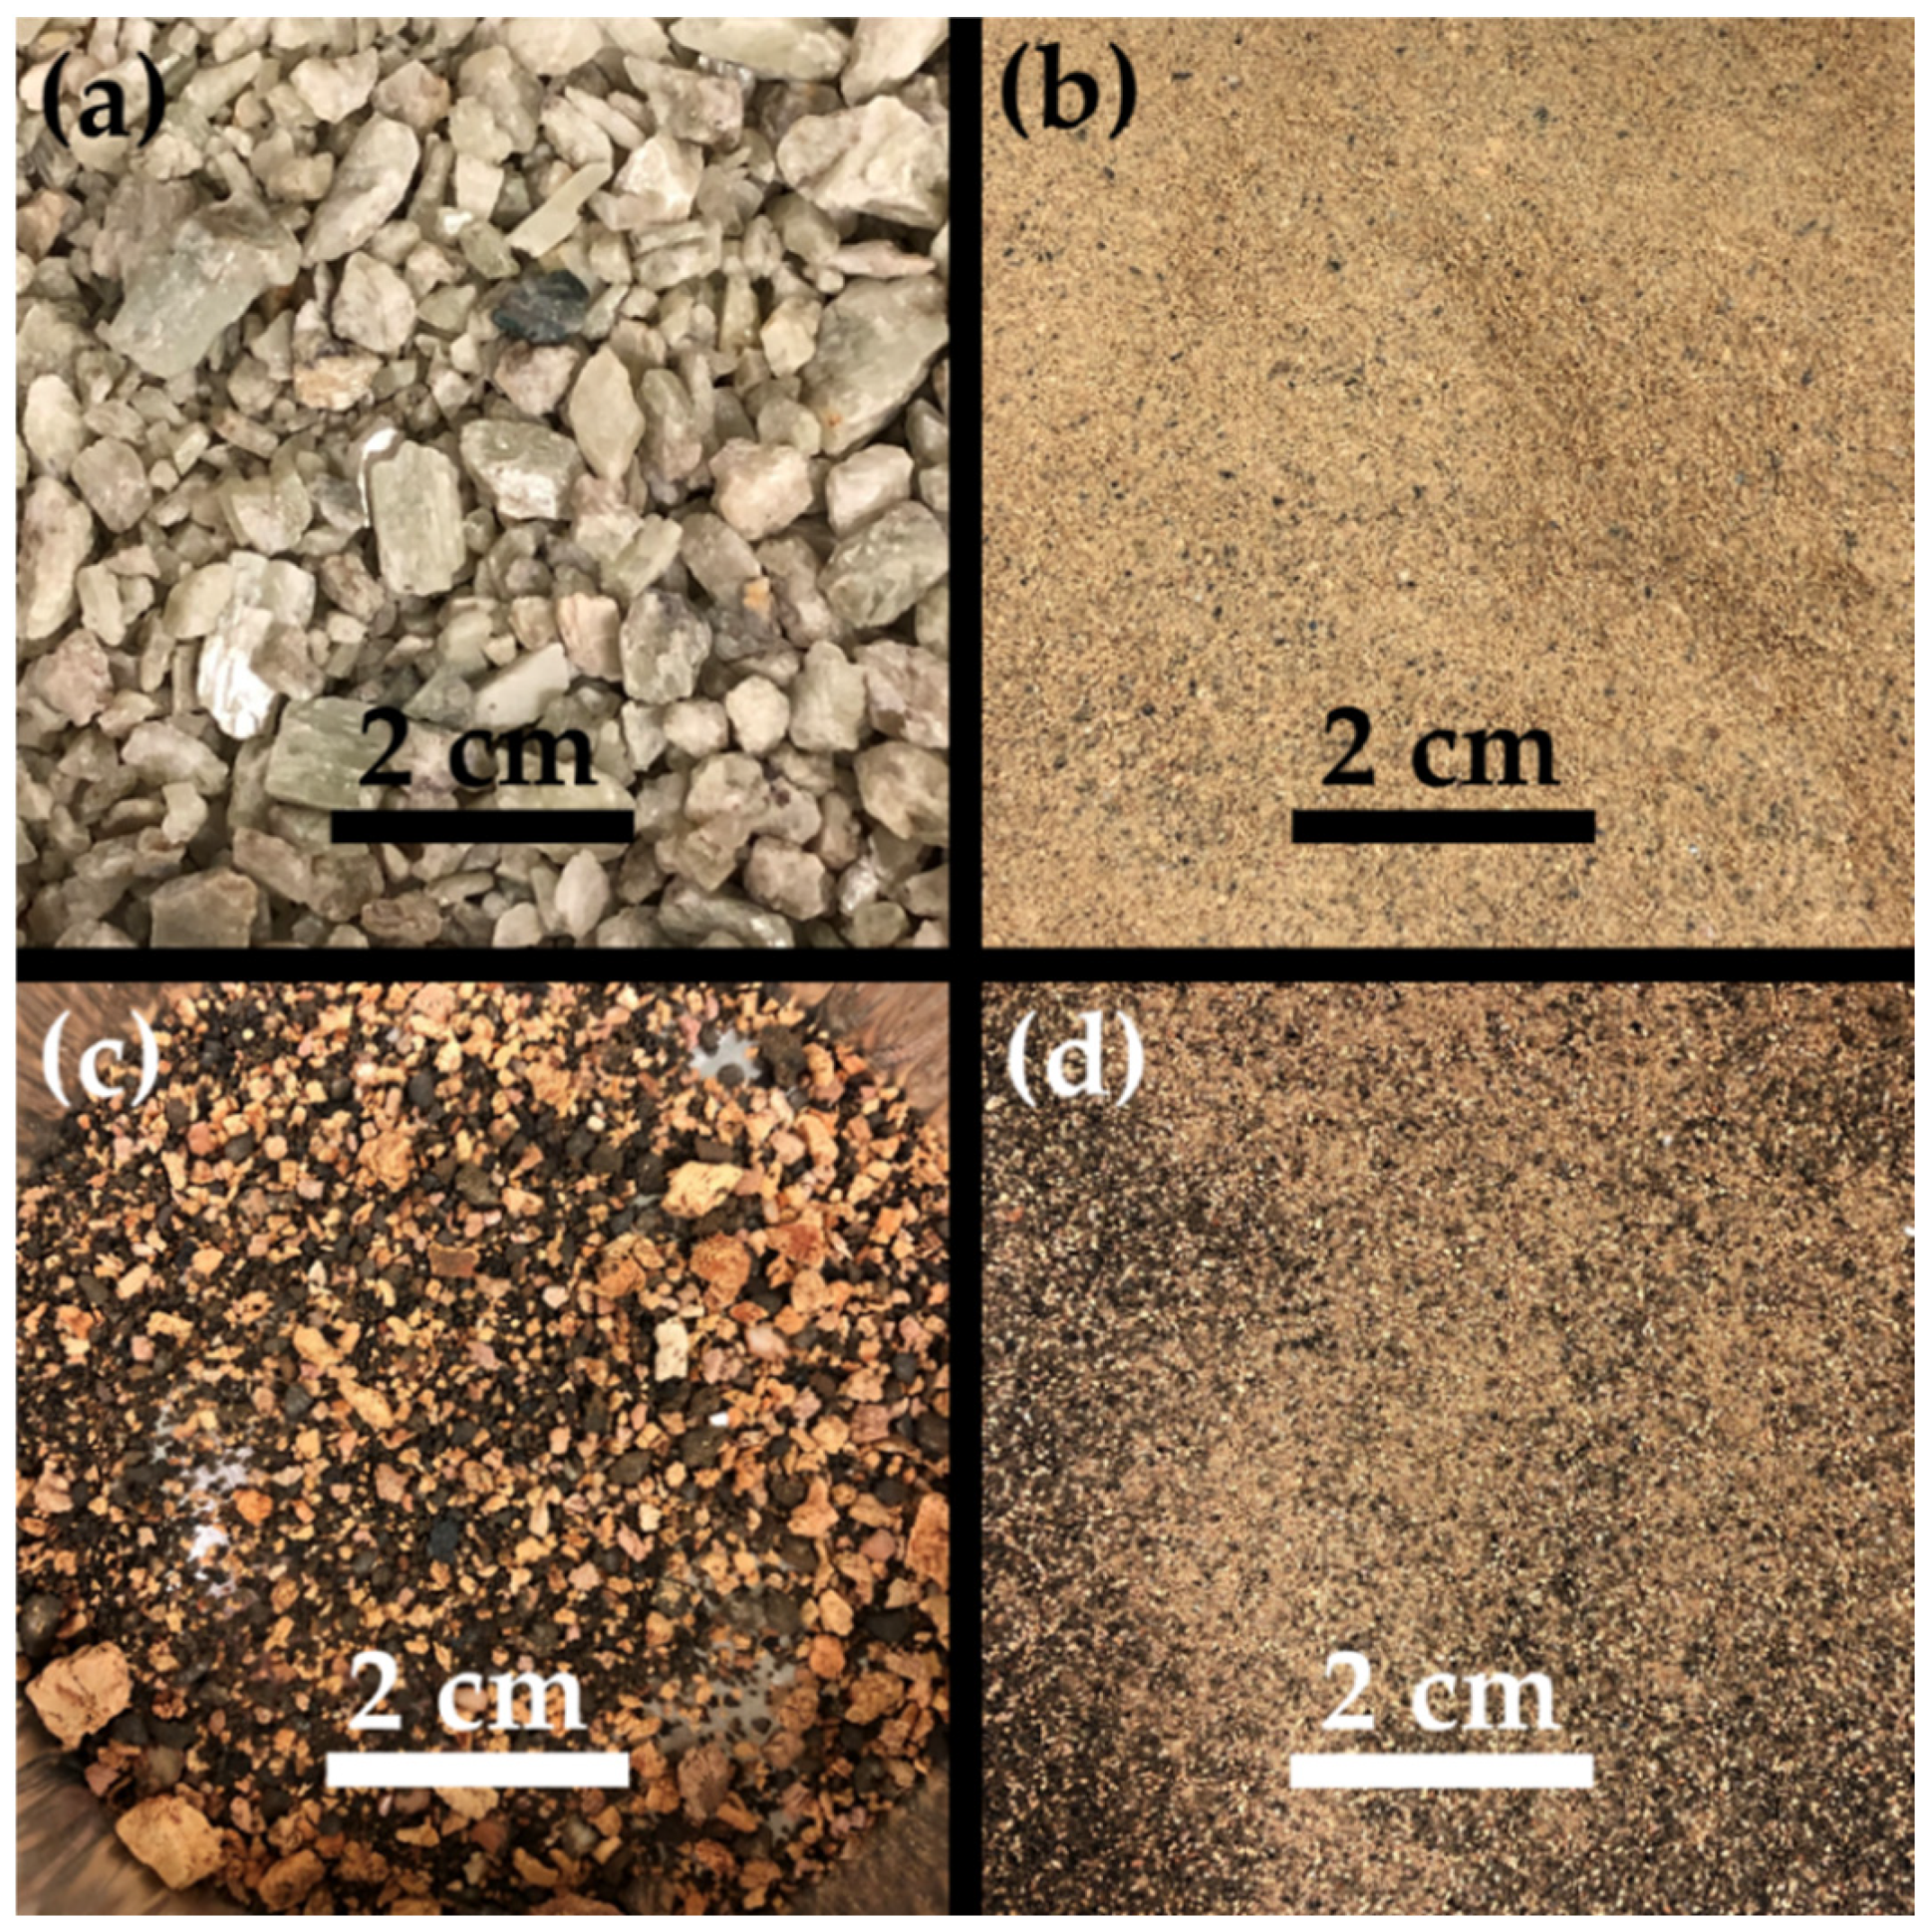
In a first experiment, the initial concentrate was thermally treated at 1323 K (1050 °C) during 30 min and analyzed by XRD. The fractions were first analyzed separately. The coarser fraction was then ground and added to the finer fraction. The mixture obtained was then also analyzed by XRD. It must be noted that the material lost its green rocky appearance and became a red dusty powder (Figure 2). Coarse particles were also present in the sample following heat treatment and their color also changed to a red tint. Contrary to their green counterparts, these reddish coarse particles were not hard and could easily be crushed, even by simple hand pressure. A total of 665.3 g of converted spodumene were recovered (initial mass prior to heat treatment was 680 g). Some of the heat-treated material (14.7 g) stayed on the alumina sheets that closed the inconel tube; this material was not collected to avoid unnecessary contamination. After sifting, the finer fraction weighted 534.7 g while the coarser fraction weighted 130.6 g. Hence, 81 wt% of the heat-treated concentrate collected had a size distribution of less than 425 µm. After analysis, the coarser fraction was ground down to 425 µm and added to the finer fraction. The concentrate obtained is referred to as sample A. The XRD patterns of the untreated initial concentrate and of each fraction, and sample A are presented in Figure 3a,b.
Figure 3a presents a classical α-spodumene concentrate. Many preferential orientations can be seen as the two main peaks of α-spodumene are supposed to be the two peaks at 30.6° and 32.0°, while our XRD shows the main peak at 21.2°. This is not uncommon for spodumene concentrates. According to Figure 3b, the XRD patterns show the presence of neither α- nor γ-spodumene after the thermal treatment at 1323 K (1050 °C) during 30 min for the fine and coarse fractions, as well as sample A. We thus concluded with a full α-to-β conversion since the XRD patterns only showed the presence of β-spodumene. Aside from this major phase, the XRD identified the presence of quartz impurities that remained in the heat-treated concentrates. Albite and muscovite were not detected and are suspected to have undergone transitions or decompositions into phases that were not detectable by our XRD methodology. The Rietveld analyses show that quartz was concentrated in the coarser fraction (Table 2).
It was thus found that a controlled temperature of 1323 K (1050 °C) inside the reactor completely converted α-spodumene into β-spodumene in our samples. However, this result was achieved under carefully controlled conditions in a batch reactor. As industrial processes do not rely on batch processes to convert spodumene for economic reasons, further work is required to assess if the same result would be obtained under continuous large-scale thermal treatment.

3.2. Lithium Extraction

The initial lithium content of the raw concentrate was analyzed by AAS and measured at CLi = 2.98 ± 0.08 wt% (CLi2O = 6.34 ± 0.17 wt%). Sample A was analyzed by AAS and measured at CLi = 3.04 ± 0.01 wt% (CLi2O = 6.47 ± 0.02 wt%). The AAS results show that the homogeneity of the concentrate is better after the thermal treatment, as the error linked to the measurement dispersion is smaller. The lithium extraction efficiency for sample A is 98 ± 1 wt%. Given that the initial concentrate was not ground prior to the heat treatment (which is a highly energy intensive step in the industry) and did not undergo flotation, which usually happens after grinding of the thermally untreated concentrate prior to obtaining the converted concentrate, the lithium extraction efficiency obtained is very high. This shows that it is possible under laboratory conditions to reach a high lithium extraction efficiency without increasing the lithium concentration in the initial material by using these two preprocessing steps (grinding and flotation). This observation could lead to a change in standard lithium extraction practice (which includes grinding and flotation) and may result in significant economic gain. These results are also in agreement with our previous work [22], which showed a high lithium extraction efficiency following leaching on homogeneous fine fractions. This previous study showed that a high lithium extraction efficiency was reached on very small particles (i.e., under 180 µm) only. However, as expected, the lithium extraction process on the coarser fraction only reached 61 wt% lithium extraction efficiency, indicating a need to somewhat grind the sample following heat treatment (but prior to leaching). In the present work, the sifting size was increased to 425 µm. The lithium extraction efficiency on the coarser fraction was increased by grinding it down below 425 µm (with minimal mechanical work, as grinding the heat-treated fraction proved relatively easy). As a result, this new method reached a better lithium extraction efficiency (98 wt%) than the overall 88 wt% lithium extraction efficiency of our previous work [22]. The relative ease of the post-heat-treatment grinding step could be explained by the lower mechanical integrity of β-spodumene compared to the much more resilient α-spodumene.

3.3. γ-Spodumene Formation at Lower Temperatures

The thermal conversion of the initial concentrate at 1323 K (1050 °C) showed complete transformation to β-spodumene, which is in agreement with the available literature [11]. However, this result is not expected to readily occur at the industrial scale where incomplete conversion to β-spodumene is likely to occur for various reasons (e.g., heat transfer limitations, presence of temperature gradients, effective residence time in the reactor). As stated in the introduction, an elusive phase called γ-spodumene is known to form at lower temperatures (1073–1273 K (800–1000 °C)) [6,16,17], which may strongly impact industrial performance. Under industrial conditions, the γ-spodumene phase is known to be concomitant with β-spodumene. This work attempts to quantify if the presence of γ-spodumene negatively impacts the leaching process, leading to lower lithium extraction efficiencies. In order to evaluate this effect, an attempt was made to maximize the formation of the γ-spodumene in our initial untreated concentrate through three maximum heat treatment temperatures, which are as follows: (1) 1073 K (800 °C), (2) 1148 K (875 °C), and (3) 1223 K (950 °C), respectively, samples B, C, and D. All samples were heat treated under atmospheric pressure for one hour. These conditions were expected to generate γ-spodumene based on our literature assessment [6]. A heat treatment of one hour was used in an attempt to maximize the amount of γ-spodumene formed.
XRD analysis of samples B, C, and D did not show any sign of decrepitation; the particles remained hard. No dusty material was present in the samples. In fact, the only visible effect of these thermal treatments was a change of color, the materials becoming more reddish. The color change is difficult to explain at this point, but some hypotheses can be made. Augite ((Si,Al)2O6)(Ca,Mg,Fe,Ti,Al)2 contains Fe2+, and the change of oxidation degree of its iron into Fe3+ could be the reason behind the reddish color. The reddish color could also be the actual color of β-spodumene. Because of that, we decided to extend the heat treatment performed at 1123 K (850 °C) (sample E) for 6 h under air (1 atm) to give even more time to the α-to-γ conversion to occur (Figure 4).
Overall, all the XRD patterns of these heat-treated samples show for the most part only the presence of α-spodumene, which confirms that phase transitions are slow in this specific temperature range. When exclusively focusing on the diffraction peaks for β-spodumene and γ-spodumene, we could confirm about 3 wt% (β + γ) conversion (results presented in Table 3). A typical XRD pattern for one heat-treated sample (sample D) is presented in Figure 5.
Rietveld analyses on the entire peak spectra were performed and revealed mainly the presence of α-spodumene and quartz. The respective quantity of β-spodumene and γ-spodumene was low. In fact, the error margin did not allow us to conclude whether one is formed preferentially over the other (Table 3).
As reported in previous studies [6,12], γ-spodumene is metastable and thus does not form under equilibrium conditions. It could be that γ-spodumene could act as a lower energy transition state for the formation of stable β-spodumene since the formation of γ-spodumene from α-spodumene is stated as exothermic while the α-spodumene to β-spodumene transition is endothermic [12]. The metastable character of γ-spodumene is further demonstrated here by the fact that even long heat treatment periods of up to 6 h below 1223 K (950 °C) did not produce a significant conversion of α-spodumene in the initial concentrate. Based on the kinetic studies of Botto et al. [24], the mechanism for β-spodumene formation is limited by nucleation at lower temperatures and limited by nucleation and growth at higher temperatures. They also derived that the nucleation mechanism has a high activation energy (750 kJ mol−1) and is effective up to approximately 1203 K (930 °C). At higher temperatures, the nucleation and growth mechanisms are dominant with a much lower activation energy (290 kJ mol−1). Overall, this could imply that the formation of metastable γ-spodumene acts as a kinetic shortcut to α-spodumene conversion, hence the high activation energy and the observed low conversions of the concentrate at low temperatures. However, at higher temperatures, once sufficient nucleation sites are created, the γ-spodumene to β-spodumene reaction mechanism (which may be the nucleation and growth phenomenology suggested by Botto) can readily proceed with a much lower activation energy, hence the higher conversion of α-spodumene for a given heat treatment time. This analysis would be consistent with the suggestion of Gassala et al. [20] that grinding spodumene concentrates favors the formation of γ-spodumene at lower heat treatment temperatures through the formation of favorable nucleation sites for this allotrope.
This also explains why γ-spodumene is often detected even when the conversion temperature is high, as it was in our previous work [22]. Because of its lower kinetic barrier, the system favors the formation of β-spodumene from γ-spodumene, but some γ-spodumene may still remain in the material due to limiting experimental factors. For example, if the heat treatment time is not long enough, then γ-spodumene does not have the time to fully transition into β-spodumene. To conclude, no matter the exact reaction mechanism for spodumene conversion, these observations justify the need to reach higher conversion temperatures as reported in this study and others [7] to maximize formation of β-spodumene from α-spodumene.

3.4. γ-Spodumene Influence on Lithium Extraction Efficiency

Section 2.3 presented some evidence that highlighted the metastable nature of γ-spodumene. It is therefore viewed here as an energetically favorable transition state (with a high activation energy for its formation) to eventually reach the equilibrium crystal structure of the β-spodumene at high temperatures. As stated, the impact of the presence of γ-spodumene on the lithium leaching extraction has yet to be reported. This is attempted here.
To investigate the impact of γ-spodumene on the leaching efficiency, several heat-treated concentrates were obtained from the initial concentrate (same initial material discussed in Section 2.1) and were tested for lithium extraction efficiency. Heat treatment conditions and particle sizes were carefully selected to obtain different γ-spodumene proportions in each decrepitated sample. The metastable character of γ-spodumene made it difficult to precisely control its proportion in the final product, which explains the uneven distribution of final γ-spodumene contents. This difficulty also explains why our sample only reached a maximum γ-spodumene content of about 37 wt%. Converted samples were characterized by XRD to determine their phase proportions with the Rietveld method. A total of six converted concentrates (procedures and details in Table 4) were selected, each having a different proportion of γ-spodumene (ranging from 0 wt% for sample A up to 37.4 wt% for samples I1 and I2). Each converted sample underwent the leaching extraction process detailed in Section 2.2. The resulting lithium extraction efficiency is presented in Table 4 and Figure 6.
Sample A is the one featured in Section 2.1 and Section 2.2 for which a holding time of 30 min at 1323 K (1050 °C) was used. Samples F and H were obtained in a similar way to samples A and G, but with a higher rate of heating (~200 K min−1 vs. ~30 K min−1 for samples A and G). As the temperature showed no sign of stabilization, the heating was voluntarily stopped as soon as the targeted temperature of 1323 K (1050 °C) was reached in an attempt to obtain the presence of γ-spodumene (hence why the holding time is null). Sample G is the sample featured in our previous study [22]. The base material for samples I1 and I2 was a flotation spodumene concentrate sifted between 212 μm and 425 μm. Sample I1 is the one originally obtained after heat treatment in a direct contact heating reactor, after an exploratory test of a new reactor configuration. Its γ-spodumene content reached a value of 37.4 wt%, which was the highest of all. Despite not originating from the same concentrate as the other samples presented in this study, we included it since we could not reproduce such a high γ-spodumene content in a rotary kiln. However, it aggregated during the thermal treatment and resulted in a particle size distribution of over 1000 µm in diameter. This particle size change is obviously expected to reduce lithium extraction efficiency relative to our other samples (A, F, G, H). To eliminate as much as possible the influence of the size of the particle on lithium extraction efficiency and thus isolate the effect of γ-spodumene, a portion of sample I1 was ground down to 100 µm to obtain sample I2. In this way, we believe it is reasonable to compare sample I2 to the furnace produced samples to better assess the impact of γ-spodumene content.
According to our results presented in Figure 6, it seems like the amount of γ-spodumene in a sample does not have a major influence on the acid leaching lithium extraction process when its proportion is under 10 wt%. The samples with low γ-spodumene contents presents a relatively high lithium extraction efficiency while the higher content samples show a decrease, culminating with sample I2. This shows that γ-spodumene cannot be ignored when industrially converting spodumene since ignoring its formation could lead to a lower overall process efficiency.
Sample I2 clearly shows the effect of high γ-spodumene on the acid leaching process. The even lower lithium extraction efficiency of sample I1 (51 wt%) is attributed to the combined effect of higher γ-spodumene content and greater average particle size (more than 1000 µm), a consequence of the direct contact heating treatment. As stated, to isolate the contribution of γ-spodumene, the heat-treated concentrate was ground following heat treatment. This allowed an effective comparison between I2 (which has a much higher γ-spodumene content than what could readily be achieved in a furnace) and the furnace-treated samples. Overall, the present results show that a γ-spodumene content of up to about 10 wt% should not have a strong impact on the efficiency of the leaching process.

3.5. Assessing the Irreversibility of the Allotropic Transformations in Spodumene

To further extend the comprehension of the different phase transitions that may occur in the spodumene system upon heating concentrates, the irreversibility of the α-spodumene to β-spodumene transformation was studied by aging the heat-treated samples (J to Q) under controlled conditions (storage in air-tight containers in a temperature, pressure, humidity controlled room). Those heat-treated samples were obtained long before the other heat-treated samples presented in this study and during exploratory tests and equipment testing. During the decrepitation process, the conversion to the β-spodumene allotropic led to a more open crystal structure that was more suitable for the subsequent leaching and solvent extraction [4]. At the macroscopic level, this spodumene allotropic transformation converts the coarse and hard α particles (over 2 mm) into soft, dusty, and micrometric β particles [22]. According to the literature, this allotropic transformation is linked to irreversible volumetric changes [40]. In addition, the β-spodumene formation is reported as irreversible [7,40], while the α-to-γ allotropic transition is stated as reversible [19,20,40]. The nature of the γ-to-β transition is unknown.
To quantify the reversible/irreversible nature of the α-to-β allotropic transformation, several converted samples were stored in airtight containers and kept at room temperature for two years and reanalyzed by XRD. The selected samples (J to Q) all presented an initial high β-spodumene content. The typical XRD pattern of some freshly converted concentrate (sample M) and its aged counterpart are presented in Figure 7. Rietveld quantifications were performed again on the aged thermally converted concentrates to confirm whether the crystallography of the samples had changed over the years (Table 5). Only the diffraction peaks of the three spodumene allotropes are presented in the Rietveld quantifications. As seen in Table 5, a total of eight samples were aged for over two years.
The XRD patterns of sample M indicate that the intensities of the peaks associated to α-spodumene increased over the years. This observation suggests that the commonly reported irreversibility of the α-to-β allotropic transformation may require a more extensive study in order to assess its validity. To study the irreversibility of the α-to-β process, we define a reversibility factor Ω as follows (Equation (3)):
Ω = %wtβ/(%wtα + %wtβ + %wtγ)
If the β-spodumene and the γ-spodumene formations are indeed respectively irreversible and reversible, no change in Ω should be measured over the aging period:
1)
any increase in %wtα would be compensated by a corresponding decrease in %wtγ through the reversible α-to-γ phase transition;
2)
the variable %wtβ would not vary over time.
Figure 8 presents the change of Ω as a function of aging time t. Each sample is identified by its name (from J to Q). The x-axis represents the aging time while the y-axis represents the value of (Ωt–Ω0). Ωt is the value of Ω after the storage while Ω0 is the initial value of Ω right after the first XRD analysis.
It is noted from Figure 8 that Ω is not static as a function of time for most of our samples. Only samples L and P (respectively aged for 2 and 2.5 years) did not exhibit a decrease of Ω. All other samples (J, K, M, O, N, Q) with aging periods greater than 2 years exhibit a decrease of Ω. However, it should be noted that only samples J, K, and M exhibit a statistically significant decrease in Ω due to the error of the Rietveld method. Thus, the common statement that the conversion to β-spodumene is irreversible is challenged by our results. More fundamental work is required to validate the mechanism.
Nonetheless, the results presented in this section show that a high thermal conversion to β-spodumene is required if the concentrates are to be stored for long periods before the lithium leaching step of the process. Indeed, β-spodumene being more susceptible to lithium extraction means that its reverse conversion over time implies this will result in a reduction of the lithium extraction efficiency when performing the acid leaching. Complementary thermal treatment may be performed to these stored samples to counter this effect to ensure maximal recovery. It is expected that the degradation of β-spodumene in an industrial environment may lead to significant energy and economic inefficiencies.

3.6. Thermodynamic Analysis of the Spodumene System

Equilibrium calculations performed using the FactSage software are presented in this section to study the thermodynamic behavior of the spodumene system upon heat treatments at atmospheric pressure.
The mass balances representing the chemical composition of pure spodumene (LiAlSi2O6) was first imposed by constraining the molar amount of Li, Al, Si, and O2 in the thermodynamic system. This leads to 20 gaseous species (SiO2, SiO, Si3, Si2, Si, O3, O2, O, LiO, Li2O2, Li2O, Li2, Li, AlO2, AlO, Al2O3, Al2O2, Al2O, Al2, Al), 11 pure liquid compounds (SiO2, Si, LiAlO2, Li2SiO3, Li2Si2O5, Li2O2, Li2O, Li, Al2O3, Al; (Li2O)2(SiO2)), and 34 stoichiometric compounds (SiO2: stishovite, coesite, cristobalite (h), cristobalite (l), tridymite (h), tridymite (l), quartz (h), quartz (l); Si; eucryptite LiAlSiO4: α, β; petalite LiAlSi4O10; spodumene LiAlSi2O6: α, β; LiAlO2; LiAl; Li2SiO3; Li2Si2O5: I, II; Li2O2; Li2O; mullite Al6Si2O13; Al2SiO5: kyanite, sillimanite, andalusite; Al2O3: γ, δ, κ, corundum; Al; (Li2O)2(SiO2); (Al2O3)(SiO2)2)) considered for this four-element system. Konar et al. [15] also did thermodynamic assessments for petalite, α-eucryptite, and β-eucryptite. Figure 9 presents the phase diagram obtained using Konar’s data for the four-element system.
Implementing Konar’s data [15] into the calculations results in an allotropic phase transition from α-spodumene to β-spodumene at 1162 K (889 °C). This is in agreement with our experimental results since it validates that β-spodumene is the only stable allotrope at 1323 K (1050 °C). Moreover, the beginning of this allotropic transition temperature of 1162 K (889 °C) is higher than the previous calculations presented by Roy [8], who predicts a transition at 1023 ± 50 K (750 ± 50 °C), while being in agreement with the work of Moore [21], who calculates a transition at 1073 ± 80 K (800 ± 80 °C).
In an effort to compare Konar’s [15] and Barin’s [33] data, calculations were performed using Konar’s data for α-spodumene and β-spodumene, and Barin’s data for the rest of the species. Figure 10 presents the phase diagram.
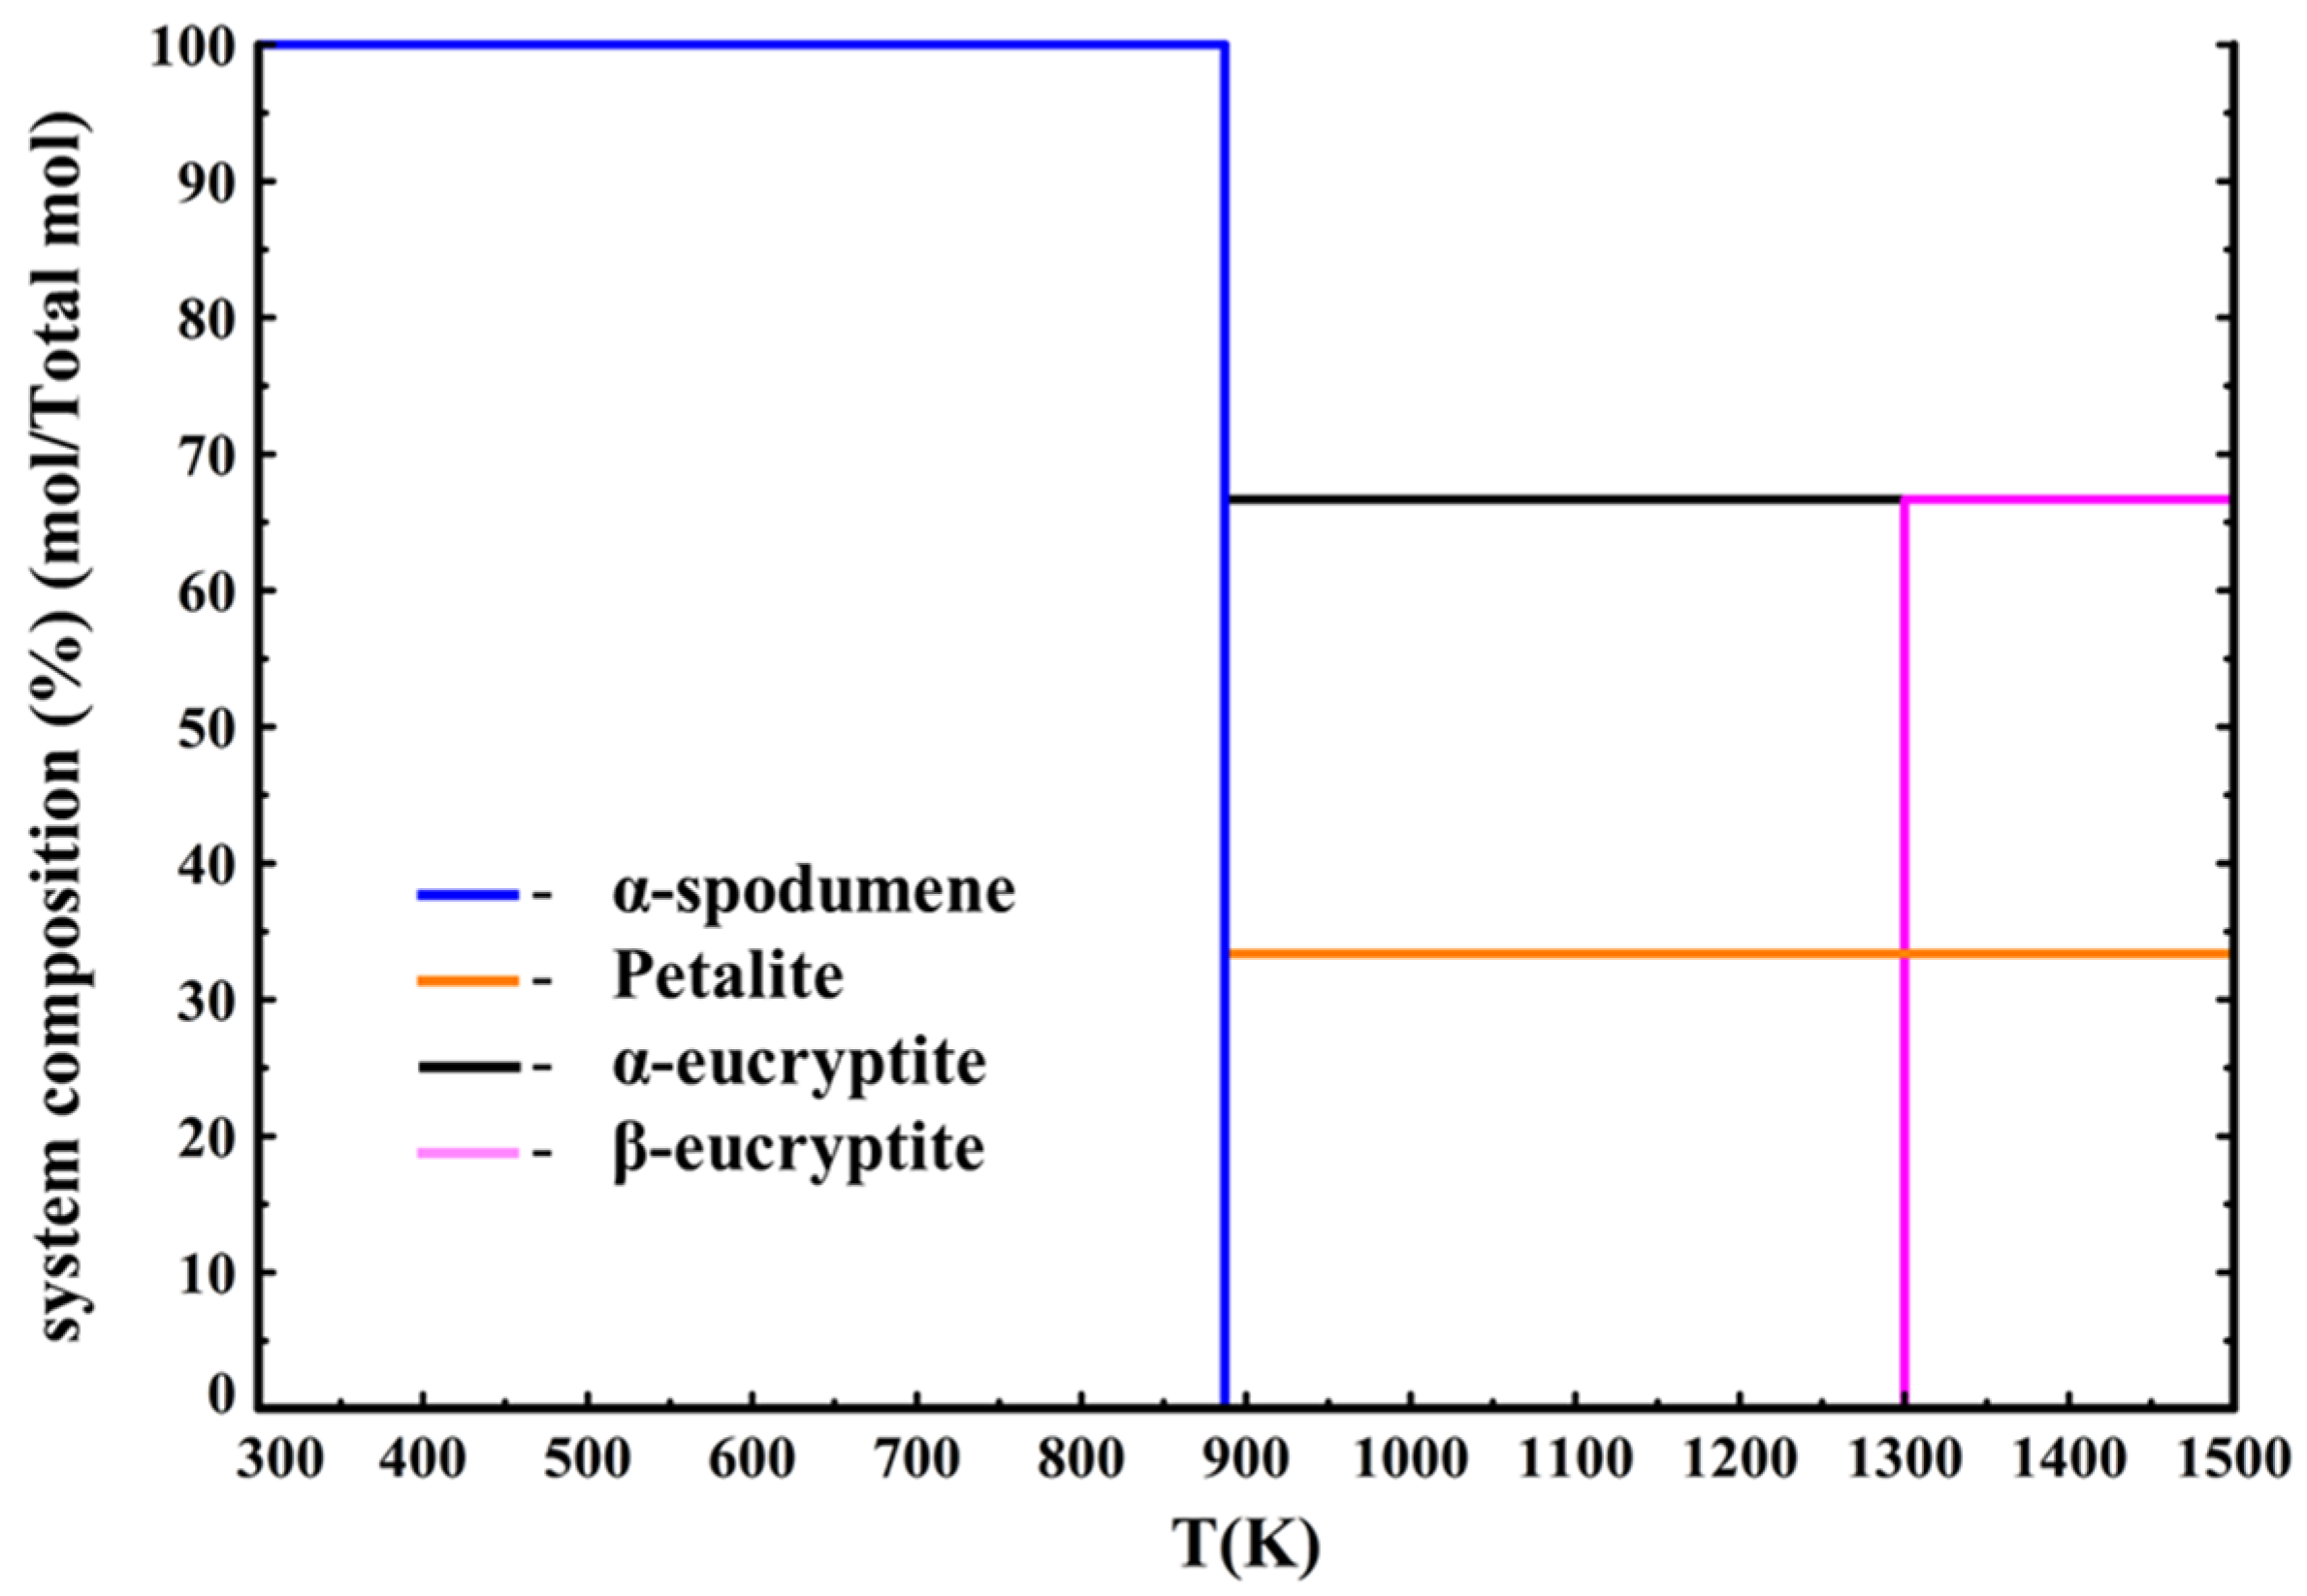
According to Figure 10, α-spodumene dissociates into eucryptite LiAlSiO4 and petalite LiAlSi4O10 (data from Barin [33]) at 880 K (607 °C), with eucryptite transitioning into β-eucryptite at 1300 K (1027 °C). Moreover, β-spodumene (data from Konar [15]) is also not a thermodynamically stable phase as it never forms under these equilibrium conditions. However, as β-spodumene is indeed a stable phase it should appear in the thermodynamic calculations. It is to be noted that there exist phase equilibrium data in literature [41] involving the simultaneous presence of spodumene, eucryptite, and petalite. However, the reactions between the three minerals occur when quartz is present in excess (at least 50 wt%). As the industrial samples are cleaned from their quartz content (less than 10 wt%), it is unlikely that these reactions will occur. The CALPHAD (CALculation of PHAse Diagrams) work of Konar et al. on the Li2O–SiO2–Al2O3 system [15] shows that the LiAlSi2O6 stoichiometric composition leads to the formation of an eutectic liquid in the LiAlO2/SiO2 pseudobinary system. Their work confirms the thermodynamic stability of spodumene at high temperature.
Finally, calculations using only Barin’s data were performed. The phase diagram is presented in Figure 11.
Figure 11 shows that using only Barin’s data [33] leads to the same kind of diagram as in Figure 10, where Konar’s data were only used for α-spodumene and β-spodumene except that α-spodumene now decomposes into eucryptite and petalite at 540 K (267 °C) instead of 880 K (607 °C), making this diagram even further away from the experimental results. This means that using Barin’s data to perform calculations on the spodumene system leads to results that are far from the experimental results. Therefore, we recommend using Konar’s data when performing calculations on the spodumene system.
However, these thermodynamic calculations do not include the potential formation of the γ-spodumene metastable phase. Literature data on the energetic behavior of γ-spodumene are scarce. Fasshauer et al. [42] assumed, for example, that virgilite (the natural form of γ-spodumene) has the same heat capacity function as β-spodumene, which was taken from the work of Robie et al [43]. Their data are presented in Table 6. In the absence of experimental data, the same assumption is used in our work.
When adding γ-spodumene into the phase selection, our equilibrium calculations still predict that β-spodumene is the only stable phase above 1162 K (889 °C). However, it also calculates that the activity of both β-spodumene and γ-spodumene are always equal and equal to one above 1162 K (Figure 12).
This is logical since the thermodynamic data of the two phases are the same, FactSage does not differentiate them. However, it was proven that while β-spodumene is the stable phase at higher temperature, γ-spodumene presents a metastable character and is not present in concentrates thermally treated at high temperature. This means that γ-spodumene’s activity should never be equal to one and that the calculations should show β-spodumene being the favored allotrope at higher temperatures. To assess the sensitivity of this issue, data for γ-spodumene’s thermodynamic properties were changed to better fit the experimental behavior according to these assumptions:
  • the higher the temperature, the lesser γ-spodumene is thermodynamically favored compared to β-spodumene;
  • the γ-to-β transition is an endothermic reaction;
  • γ-spodumene and β-spodumene are concomitant in a wide range of temperature (at least in the 1073–1223 K or 800–950 °C range).
From hypothesis (1), it can be deduced that γ-spodumene’s entropy must be smaller than β-spodumene’s, as entropy dominates the stability of compounds at high temperature. From hypothesis (2), it can be deduced that β-spodumene’s enthalpy must be less negative than γ-spodumene’s. Finally, from hypothesis (3), it can be deduced that the thermodynamic properties of the two allotropes must remain reasonably close to each other.
Following this reasoning, γ-spodumene’s entropy was set to 150 J K−1 mol−1 (the reported [15] entropy of β-spodumene was 154.2 J K−1 mol−1).
The enthalpy was changed to –3035 kJ mol−1 (the reported [15] enthalpy of β-spodumene was –3030.517 kJ mol−1). Table 7 and Table 8 present a summary of spodumene’s data.
The calculations show that only β-spodumene is stable above 1162 K (889 °C). However, this time the activity of γ-spodumene shows it to be favored compared to β-spodumene at lower temperature, before becoming increasingly less favored with the temperature increase, while never being a thermodynamically stable phase (Figure 13).
These results show the sensitivity of the spodumene system. With these minor changes to γ-spodumene’s data, its metastable character is immediately observed. It also shows how it is less favored at increasingly higher temperatures. This means that γ-spodumene could indeed function as an intermediate metastable phase and could act as barrier to β-spodumene formation if the thermodynamic conditions for metastability for hexagonal spodumene are met (e.g., the proposed greater availability of nucleation sites [20]).

3.7. DSC Analysis

Section 2.6 presented thermodynamic calculations to evaluate the allotropic phase transition temperature in the spodumene system. These phase transitions are highly sensitive to the thermodynamic description of each allotrope used in the calculations. Because of that, DSC experiments were performed to ensure that the energetic behavior of our concentrate is compatible with these thermodynamic calculations.
The DSC samples consist of the initial concentrate material (which was not heat treated) that was ground to obtain a fine powder suitable for the DSC capsules (<10 µm). The samples were composed of 1 wt% muscovite, 2 wt% albite, 5–10 wt% quartz, 1 wt% of other impurities (including augite, anorthite, diopside), with the rest being spodumene (exclusively composed of monoclinic α-spodumene). DSC experiments were performed to assess the isobaric heat capacity Cp as a function of temperature. The apparent Cp(T) expression of the material was then derived from this heat flow vs T measurement and compared to the fitted Cp(T) of the α-spodumene and β-spodumene phases from Konar [15] (Figure 14).
Four phase transitions can be identified. The first transition occurs at 850 K (577 °C) and corresponds to the α-to-β quartz allotropic transition, which starts at 845 K (572 °C) at 1 bar [44]. The second transition occurs at 1050 K (777 °C) and corresponds to the dehydration of muscovite [45]. The third transition starts at around 1100 K (827 °C) and is found to be dominated by an endothermic process up to around 1300 K (1027 °C). This is attributed to the β-spodumene formation, which is an endothermic process. Finally, after 1300 K (1027 °C) an exothermic reaction dominates. This is attributed to impurities and the appearance of vitreous phases. This reaction is not a concern for the samples presented in this study since the heat treatments were never significantly above this temperature. Contrary to Salakjani et al. [12], we do not report an exothermic reaction before the β-spodumene formation. Our DSC measurements do not allow for pointing out the formation of γ-spodumene. However, our XRD results show that γ-spodumene is present in concentrates heat treated at temperatures below 1300 K (1027 °C). This means that γ-spodumene would be a mandatory step in the formation of β-spodumene, making the α–γ–β route the only possible one. The other proposed route, the α–β route, originated in older studies, which only considered α-spodumene and β-spodumene. For example, White and McVay [46] report that α-spodumene is fully converted into β-spodumene at 1323 K (1050 °C). The first two peaks of β-spodumene they report show a d(hkl) of 3.48 Å and 3.91 Å, (2θ angles of 25.6° and 22.7°), respectively. Figure 3b shows the first two peaks of β-spodumene also at 25.6° and 22.7°. However, they report two other peaks with a d(hkl) of 4.51 Å and 4.68 Å, (2θ angles of 19.6° and 18.9°), while Figure 3b only shows one peak at 19.3°. In a previous study [22], it was reported that if γ-spodumene shares its main peak’s angle with β-spodumene’s main peak, it can be identified through its second peak, which was reported at 19.7°. The closeness of the two peaks reported by White and McVay may be linked to the presence of γ-spodumene in their sample. This would mean that even in older studies, spodumene conversion took the α–γ–β route and that the α–β route was reported due to the lack of data about γ-spodumene.

4. Conclusions

This study aimed to obtain data on the lithium extraction efficiency on spodumene without grinding and flotation, and to study the behavior of γ-spodumene and its impact on the process. It was shown that it is indeed possible to reach high extraction efficiency (98 wt%) without the need for grinding and flotation steps prior to decrepitation and with minimal grinding postdecrepitation. From acid leaching experiments, γ-spodumene was found out to have a negative impact on lithium extraction efficiency. However, our results show that an amount of γ-spodumene of less than 10 wt% should not have a significant influence on the lithium extraction efficiency. Therefore, the amount of γ-spodumene should be controlled to avoid losses.
Moreover, the lithium extraction efficiencies can be negatively affected by storing converted (decrepitated) concentrates for long periods (over two years). Indeed, the assumed irreversibility of the β-spodumene formation is challenged by the results of the present work. Several samples showed a decreased β-spodumene content in favor of the less extraction suitable γ-spodumene and α-spodumene.
Finally, the γ-spodumene was studied in the overall spodumene thermodynamic system. Our results show that the choice of reference thermodynamic data when performing prediction calculations is crucial to obtaining accurate results for this system. We strongly recommend using Konar’s thermodynamic data [15], as those provide the best correlation between theory and experimental results.
Future works should focus on exploring the possibility of better quantifying the thermodynamic properties of γ-spodumene, in order to perform more reliable predictive calculations on systems involving this compound. The present work can also serve as a thermodynamic baseline for future studies on the kinetic of transformations involving γ-spodumene, which are still unexplored to this day.

Author Contributions

Conceptualization, C.D. and G.S.; formal analysis, C.D.; funding acquisition, G.S.; investigation, C.D.; methodology, C.D. and G.S.; resources, G.S.; software, C.D., J.-P.H., and P.O.; supervision, G.S.; validation, C.D., J.-P.H., and P.O.; writing—original draft preparation, C.D.; writing—review and editing, G.S., J.-P.H., and P.O. All authors have read and agreed to the published version of the manuscript.

Funding

This research was funded in part by grant 2016-MI-192454 of the Fonds de recherche du Québec-Nature et Technologies (FQRNT) and by Nemaska Lithium Inc., with a mandatory portion of funding requested the government funder.

Acknowledgments

The authors would like to acknowledge Nemaska Lithium inc. for providing the materials used in this study as well as all the professionals from the Centre de Caractérisation des Matériaux and from the Laboratoire d’Étude des Hautes Températures of the Université de Sherbrooke for their help during the experiments and the characterizations presented in this study.

Conflicts of Interest

The authors declare no conflict of interest.

References

  1. Jaskula, B.W. Lithium. In Mineral Commodity Summaries 2019; United States Geological Survey: Reston, VA, USA, 2019; pp. 98–99. [Google Scholar]
  2. Lithium-ion Batteries Market Development & Raw Materials; Roskill: London, UK, 2018.
  3. d’Andrada, J.B. Der eigenschaften und kennzeichen einiger neuen fossilien aus Schweden und Norwegen nebst einigen chemischen bemerkungen ueber dieselben. Allg. J. Chem. 1800, 4, 28–39. [Google Scholar]
  4. Ellestad, R.B.; Leute, K.M. Method of Extracting Lithium Values from Spodumene Ores. U.S. Patent Application 2,516,109, 25 July 1950. [Google Scholar]
  5. Brook, R.J. Concise Encyclopedia of Advanced Ceramic Materials; Pergamon Press: Oxford, UK, 1991. [Google Scholar]
  6. Moore, R.L.; Mann, J.P.; Montoya, A.; Haynes, B. In situ synchrotron XRD analysis of the kinetics of spodumene phase transitions. Phys. Chem. Chem. Phys. 2018, 20, 10753–10761. [Google Scholar] [CrossRef]
  7. Dessemond, C.; Lajoie-Leroux, F.; Soucy, G.; Laroche, N.; Magnan, J.-F. Spodumene: The Lithium Market, Resources and Processes. Minerals 2019, 9, 334. [Google Scholar] [CrossRef] [Green Version]
  8. Roy, R.; Osborn, E.F. The System Lithium Metasilicate--Spodumene--Silica. J. Am. Chem. Soc. 1949, 71, 2086–2095. [Google Scholar] [CrossRef]
  9. Munoz, J.L. Stability relations of LiAlSi2O6 at high pressures. Mineral. Soc. Am. Spec. Pap. 1969, 2, 203–209. [Google Scholar]
  10. Peltosaari, O.; Tanskanen, P.; Heikkinen, E.; Fabritius, T. α→γ→β-phase transformation of spodumene with hybrid microwave and conventional furnaces. Miner. Eng. 2015, 82, 54–60. [Google Scholar] [CrossRef]
  11. Salakjani, N.K.; Singh, P.; Nikoloski, A. Mineralogical transformations of spodumene concentrate from Greenbushes, Western Australia. Part 1: Conventional heating. Miner. Eng. 2016, 98, 71–79. [Google Scholar] [CrossRef]
  12. Salakjani, N.K.; Nikoloski, A.; Singh, P. Mineralogical transformations of spodumene concentrate from Greenbushes, Western Australia. Part 2: Microwave heating. Miner. Eng. 2017, 100, 191–199. [Google Scholar] [CrossRef]
  13. Li, C.-T. The crystal structure of LiAlSi2O6 III (high-quartz solid solution). Z. Krist. Cryst. Mater. 1968, 127, 327–348. [Google Scholar] [CrossRef]
  14. French, B.M.; Jezek, P.A.; Appleman, D.E. Virgilite, a new lithium aluminum silicate mineral from the Macusani glass, Peru. Am. Miner. 1978, 63, 461–465. [Google Scholar]
  15. Konar, B.; Kim, D.G.; Jung, I.H. Critical thermodynamic optimization of the Li2O-Al2O3-SiO2 system and its application for the thermodynamic analysis of glass-ceramics processing. J. Eur. Ceramic Soc. 2018, 38. [Google Scholar] [CrossRef]
  16. Salakjani, N.K.; Singh, P.; Nikoloski, A. Production of Lithium—A Literature Review Part 1: Pretreatment of Spodumene. Miner. Process. Extr. Met. Rev. 2019, 1–14. [Google Scholar] [CrossRef]
  17. Zhang, J.; Duan, Y.; Li, C. A first-principles investigation of structural properties, electronic structures and optical properties of β- and γ-LiAl(SiO3)2. Ceram. Int. 2017, 43, 13948–13955. [Google Scholar] [CrossRef]
  18. Kotsupalo, N.P.; Menzheres, L.T.; Ryabtsev, A.D.; Boldyrev, V.V. Mechanical activation of α-spodumene for further processing into lithium compounds. Theor. Found. Chem. Eng. 2010, 44, 503–507. [Google Scholar] [CrossRef]
  19. Gasalla, H.; Pereira, E. Activation-deactivation mechanisms in spodumene samples. Solid State Ion. 1990, 42, 1–6. [Google Scholar] [CrossRef]
  20. Gasalla, H.J.; Aglietti, E.F.; López, J.M.P.; Pereira, E. Changes in physicochemical properties of α-spodumene by mechanochemical treatment. Mater. Chem. Phys. 1987, 17, 379–389. [Google Scholar] [CrossRef]
  21. Moore, R.L.; Montoya, A.; Haynes, B.S. Effect of the local atomic ordering on the stability of β-spodumene. Inorg. Chem. 2016, 55, 6426–6434. [Google Scholar] [CrossRef] [PubMed]
  22. Dessemond, C.; Lajoie-Leroux, F.; Soucy, G.; Laroche, N.; Magnan, J.-F. Revisiting the Traditional Process of Spodumene Conversion and Impact on Lithium Extraction. In Proceedings of the 11th International Conference on Porous Metals and Metallic Foams (MetFoam 2019); The Minerals, Metals and Materials Society: Pittsburgh, PA, USA, 2018; pp. 2281–2291. [Google Scholar]
  23. Li, C.T.; Peacor, D.R. The crystal structure of LiAlSi2O6-II (β-spodumene). Z. für Krist. 1967, 126, 46–65. [Google Scholar] [CrossRef]
  24. Botto, I.L.; Arazi, S.C.; Krenkel, T.G. Aplicación de la teoría de Delmon al estudio del mecanismo de la transformación polimórfica del espodumeno I a espodumeno II. Bol. Soc. Esp. Cerám. Vidr. 1976, 15, 5–10. [Google Scholar]
  25. Lajoie-Leroux, F. Étude sur le Grillage Acide du β-Spodumene: Comportements des Impuretés, Maîtrise; Université de Sherbrooke: Sherbrooke, QC, Canada, 2018. [Google Scholar]
  26. Xiao, M.; Wang, S.; Zhang, Q.; Zhang, J. Leaching Mechanism of the Spodumene Sulphuric Acid Process. Rare Met. (Beijing) 1997, 16, 36–44. [Google Scholar]
  27. Archambault, M.; MacEwan, J.U.; Oliver, C.A. Method of producing lithium carbonate from spodumene. U.S. Patent 3,017,243, 16 January 1962. [Google Scholar]
  28. De Kumar, A. A Textbook of Inorganic Chemistry; New Age International Pvt. Ltd. Publishers: New Delhi, India, 2007; p. 229. [Google Scholar]
  29. Lajoie-Leroux, F.; Dessemond, C.; Soucy, G.; Laroche, N.; Magnan, J.F. Impact of the impurities on lithium extraction from β-spodumene in the sulphuric acid process. Miner. Eng. 2018, 129, 1–8. [Google Scholar] [CrossRef]
  30. Naraghi, R.; Selleby, M.; Ågren, J. Thermodynamics of stable and metastable structures in Fe–C system. Comput. Coupling Phase Diagr. Thermochem. 2014, 46, 148–158. [Google Scholar] [CrossRef]
  31. Bale, C.W.; Chartrand, P.; Degterov, S.A.; Eriksson, G.; Hack, K.; Mahfoud, R.; Melançon, J.; Pelton, A.D.; Petersen, S. FactSage Thermochemical Software and Databases. CALPHAD Comput. Coupling Phase Diagr. Thermochem. 2002, 26, 189–228. [Google Scholar] [CrossRef]
  32. Bale, C.W.; Belisle, E.; Chartrand, P.; Decterov, S.A.; Eriksson, G.; Hack, K.; Jung, I.H.; Kang, Y.B.; Mélançon, J.; Pelton, A.D.; et al. FactSage Thermochemical Software and Databases—Recent Developments. CALPHAD Comput. Coupling Phase Diagr. Thermochem. 2009, 33, 295–311. [Google Scholar] [CrossRef]
  33. Barin, I. Thermochemical Data of Pure Substances, 3rd ed.; VCH Verlag GmbH: Weinheim, Germany, 1995. [Google Scholar]
  34. Hull, A.W. A new method of chemical analysis. J. Am. Chem. Soc. 1919, 41, 1168–1175. [Google Scholar] [CrossRef] [Green Version]
  35. Rietveld, H.M. A profile refinement method for nuclear and magnetic structures. J. Appl. Crystallogr. 1969, 2, 65–71. [Google Scholar] [CrossRef]
  36. Zhao, P.; Lu, L.; Liu, X.; De La Torre, A.G.; Cheng, X. Error analysis and correction for quantitative phase analysis based on Rietveld-Internal standard method: Whether the minor phases can be ignored? Crystals 2018, 8, 110. [Google Scholar] [CrossRef] [Green Version]
  37. Snellings, R.; Salze, A.; Scrivener, K. Use of X-ray diffraction to quantify amorphous supplementary cementitious materials in anhydrous and hydrated blended cements. Cem. Concr. Res. 2014, 64, 89–98. [Google Scholar] [CrossRef]
  38. Leon-Reina, L.; García-Maté, M.; Álvarez-Pinazo, G.; Santacruz, I.; Vallcorba, O.; De La Torre, A.G.; Aranda, M.A.G. Accuracy in Rietveld quantitative phase analysis: A comparative study of strictly monochromatic Mo and Cu radiations. J. Appl. Crystallogr. 2016, 49, 722–735. [Google Scholar] [CrossRef]
  39. ASTM E1269-11. Standard Test Method for Determining Specific Heat Capacity by Differential Scanning Calorimetry; ASTM International: West Conshohocken, PA, USA, 2018; Available online: http://www.astm.org (accessed on 16 January 2019).
  40. Shoucri, A. Étude de la Conversion α vers β d’un Minerai de Spodumene, Maîtrise; Université de Sherbrooke: Sherbrooke, QC, Canada, 2015. [Google Scholar]
  41. London, D. Experimental phase equilibria in the system LiAlSiO4-SiO2-H2O: A petrogenetic grid for lithium-rich pegmatites. Am. Mineral. 1984, 69, 995–1004. [Google Scholar]
  42. Fasshauer, D.W.; Chatterjee, N.D.; Cemič, L. A thermodynamic analysis of the system LiAlSiO4-NaAlSiO4-Al2O3-SiO2-H2O based on new heat capacity, thermal expansion, and compressibility data for selected phases. Contrib. Miner. Pet. 1998, 133, 186–198. [Google Scholar] [CrossRef]
  43. Robie, R.A.; Hemingway, B.S. Thermodynamic Properties of Minerals and Related Substances at 298.15 K and 1 Bar (105 Pascals) Pressure and at Higher Temperatures; United States Geological Survey: Reston, VA, USA, 1995; Volume 2131, pp. 1–461.
  44. Van Groos, A.F.K.; Ter Heege, J.P. The high-low quartz transition up to 10 kilobars pressure. J. Geol. 1973, 81, 717–724. [Google Scholar] [CrossRef]
  45. Eberhart, J.P. Étude des transformations du mica muscovite par chauffage entre 700 °C et 1200 °C. Bull. Minéral. 1963, 86, 213–251. [Google Scholar]
  46. White, G.D.; McVay, T.N. Some Aspects of the Recovery of Lithium from Spodumene. No. ORNL-2450; Oak Ridge National Laboratory: Oak Ridge, TN, USA, 1958; pp. 1–17. [CrossRef]
Figure 1. Spodumene concentrate used for the experiments.
Minerals 10 00519 g001
Figure 2. Converted concentrate after thermal treatment: (a) initial material, (b) under 425 µm, (c) over 425 µm, and (d) sample A (finer fraction {(b)} + ground coarser fraction {(c)}).
Minerals 10 00519 g002
Figure 3. (a) XRD pattern of the untreated initial concentrate. (b) XRD patterns: (1) sample A (finer fraction + ground coarser fraction), (2) coarser fraction, and (3) finer fraction.
Minerals 10 00519 g003
Figure 4. Concentrates obtained after low temperature thermal treatment: (a) sample B, 1073 K (800 °C), 1 h; (b) sample C, 1148 K (875 °C), 1 h; (c) sample D, 1223 K (950 °C), 1h; and (d) sample E, 1123 K (850 °C), 6 h.
Minerals 10 00519 g004
Figure 5. XRD pattern of the 950 °C, 1h sample focusing on the peaks for β-spodumene and γ-spodumene.
Minerals 10 00519 g005
Figure 6. Influence of the amount of γ-spodumene on lithium extraction efficiency by acid leaching for various heat-treated concentrates. Furnace heat treatment: samples A, F, G, and H. Direct contact heating treatment with size normalization grinding: sample I2.
Minerals 10 00519 g006
Figure 7. XRD patterns of sample M: (1) initial heat-treated concentrate, (2) aged heat-treated concentrate.
Minerals 10 00519 g007
Figure 8. Ω variation over the aging period of samples J, K, L, M, N, O, P, Q.
Minerals 10 00519 g008
Figure 9. Phase diagram of spodumene using data from Konar [15] for the four-element system (Li + Al + 2Si + 3O2).
Minerals 10 00519 g009
Figure 10. Phase diagram of spodumene using data from Konar [15] for α-spodumene and β-spodumene, and Barin’s [33] data for the other species considered in the four-element system (Li + Al + 2 Si + 3 O2).
Minerals 10 00519 g010
Figure 11. Phase diagram of spodumene using data from Barin [33] for the four-element system (Li + Al + 2 Si + 3 O2).
Minerals 10 00519 g011
Figure 12. Activity diagram for α-spodumene, β-spodumene, and γ-spodumene using Konar’s data [15] for α-spodumene and β-spodumene in the four-element system (Li + Al + 2Si + 3O2). According to Fasshauer’s [42] assumption, γ-spodumene is assumed to have the same parameters as β-spodumene.
Minerals 10 00519 g012
Figure 13. Sensitivity analysis for the activity diagram of the spodumene system with Konar’s data [15] for α-spodumene and β-spodumene and modified γ-spodumene data for the four-element system (Li + Al + 2 Si + 3 O2).
Minerals 10 00519 g013
Figure 14. Derived Cp(T) of the initial material compared to the calculated Cp(T) of α-spodumene and β-spodumene.
Minerals 10 00519 g014
Table 1. Thermodynamic properties of α-spodumene and β-spodumene from Barin (data used by the FactSage software) [33] and Konar [15].
PhaseΔH298
(J mol−1)
S298
(J K−1 mol−1)
Cp(T)
(J K−1 mol−1)
Reference
α-spodumene−3,054,701129.29(298 to 800 K)
312.1 + 0.02604T − 2 759T−0.5
(800 to 1200 K) 172.1 + 0.07776T
[33]
−3,060,000131(up to 1200 K) 354.717 − 3375T−0.5[15]
β-spodumene−3,026,701154.39(298 to 800 K) 8.586 + 0.088 41T − 98140T−1 + 7892T−0.5
(800 to 1700 K) 195.2 + 0.052 07T
[33]
−3,030,517154.2(up to 1700 K) 362.8 − 0.003684T − 3435T−0.5[15]
Table 2. Rietveld analyses of the converted concentrate.
ConcentrateQuartz
(±1.5 wt%)
β-Spodumene
(±1.5 wt%)
Finer fraction1.798.3
Coarser fraction21.278.8
Sample A3.796.3
Table 3. Rietveld analyses on low-temperature heat-treated concentrates.
SampleThermal Treatmentα-Spodumene (wt%)β + γ-Spodumene (wt%)
B1073 K (800 °C), 1 h98 ± 1.52 ± 1.5
C1148 K (875 °C), 1 h98 ± 1.52 ± 1.5
D1223 K (950 °C), 1 h97 ± 1.53 ± 1.5
E1123 K (850 °C), 6 h98 ± 1.52 ± 1.5
Table 4. The γ-spodumene content and lithium extraction efficiency value for several heat-treated concentrates.
SampleConditionsSize
A1323 K (1050 °C), 30 min<425 µm
F1323 K (1050 °C), 0 min<212 µm
G1323 K (1050 °C), 30 min<180 µm
H1323 K (1050 °C), 0 min<212 µm
I1Direct Contact Heating, 33 min~1000 µm
I2Direct Contact Heating, 33 min<100 µm
Table 5. Rietveld quantifications on XRD patterns of initial and aged heat-treated concentrates.
SampleTime between Analyses (y)α-Spodumene
(±1.5 wt%)
β-Spodumene
(±1.5 wt%)
γ-Spodumene
(±1.5 wt%)
J2.30.853.040.6
3.039.649.1
K30.581.413.4
3.175.715.3
L21.281.215.6
1.581.415.2
M2.53.088.05.6
10.084.01.7
N2.51.095.50
3.093.50
O2.50.790.85.0
0.590.85.9
P2.50.493.53.7
0.994.32.4
Q2.53.885.96.9
8.382.35.0
Table 6. Robie and Fasshauer’s data for α-spodumene, β-spodumene, and γ-spodumene [42,43].
PhaseΔH298
(J mol−1)
S298
(J K−1 mol−1)
Cp(T)
(J K−1 mol−1)
α-spodumene−3,053,500129.412(up to 1200 K) 354.717 − 3375T−0.5
β-spodumene−3,031,888155.376(up to 1700 K) 362.8 − 0.003684T – 3435T−0.5
γ-spodumene−3,032,128162.038(up to 1700 K) 362.8 − 0.003684T – 3435T−0.5
Table 7. Summary of spodumene phase data (ΔH298 and S298).
PhaseΔH298
(J mol−1)
S298
(J K−1 mol−1)
References
α-spodumene−3,060,000
−3,054,701
−3,053,500
−3,053,500
131
129.29
129.3
129.412
[15], this work
[33]
[42]
[43]
β-spodumene−3,030,517
−3,026,701
−3,025,300
−3,031,888
154.2
154.39
154.4
155.376
[15], this work
[33]
[42]
[43]
γ-spodumene−3,032,128
−3,035,000
162.038
150
[43]
This work
Table 8. Summary of spodumene phase data (Cp(T)).
PhaseCp(T)
(J K−1 mol−1)
References
α-spodumene(up to 1200 K) 354.717 – 3375T−0.5
(298 to 800 K) 312.1 + 0.02604T – 2759T−0.5
(800 to 1200 K) 172.1 + 0.07776T
(up to 1200 K) 421.2 − 0.02401T + 1,910,000T−2 – 4776T−0.5
[15,43], this work
[33]
[33]
[42]
β-spodumene(up to 1700 K) 362.8 − 0.003684T – 3435T−0.5
(298 K to 800 K) 8.586 + 0.08841T – 98,140T−1 + 7892T−0.5
(800 K to 1700 K) 195.2 + 0.05207T
[15,42,43], this work
[33]
[33]
γ-spodumene(up to 1700 K) 362.8 − 0.003684T – 3435T−0.5[43], this work

