Geochemical Significance of Clay Minerals and Elements in Paleogene Sandstones in the Center of the Northern Margin of the Qaidam Basin, China


Abstract
1. Introduction
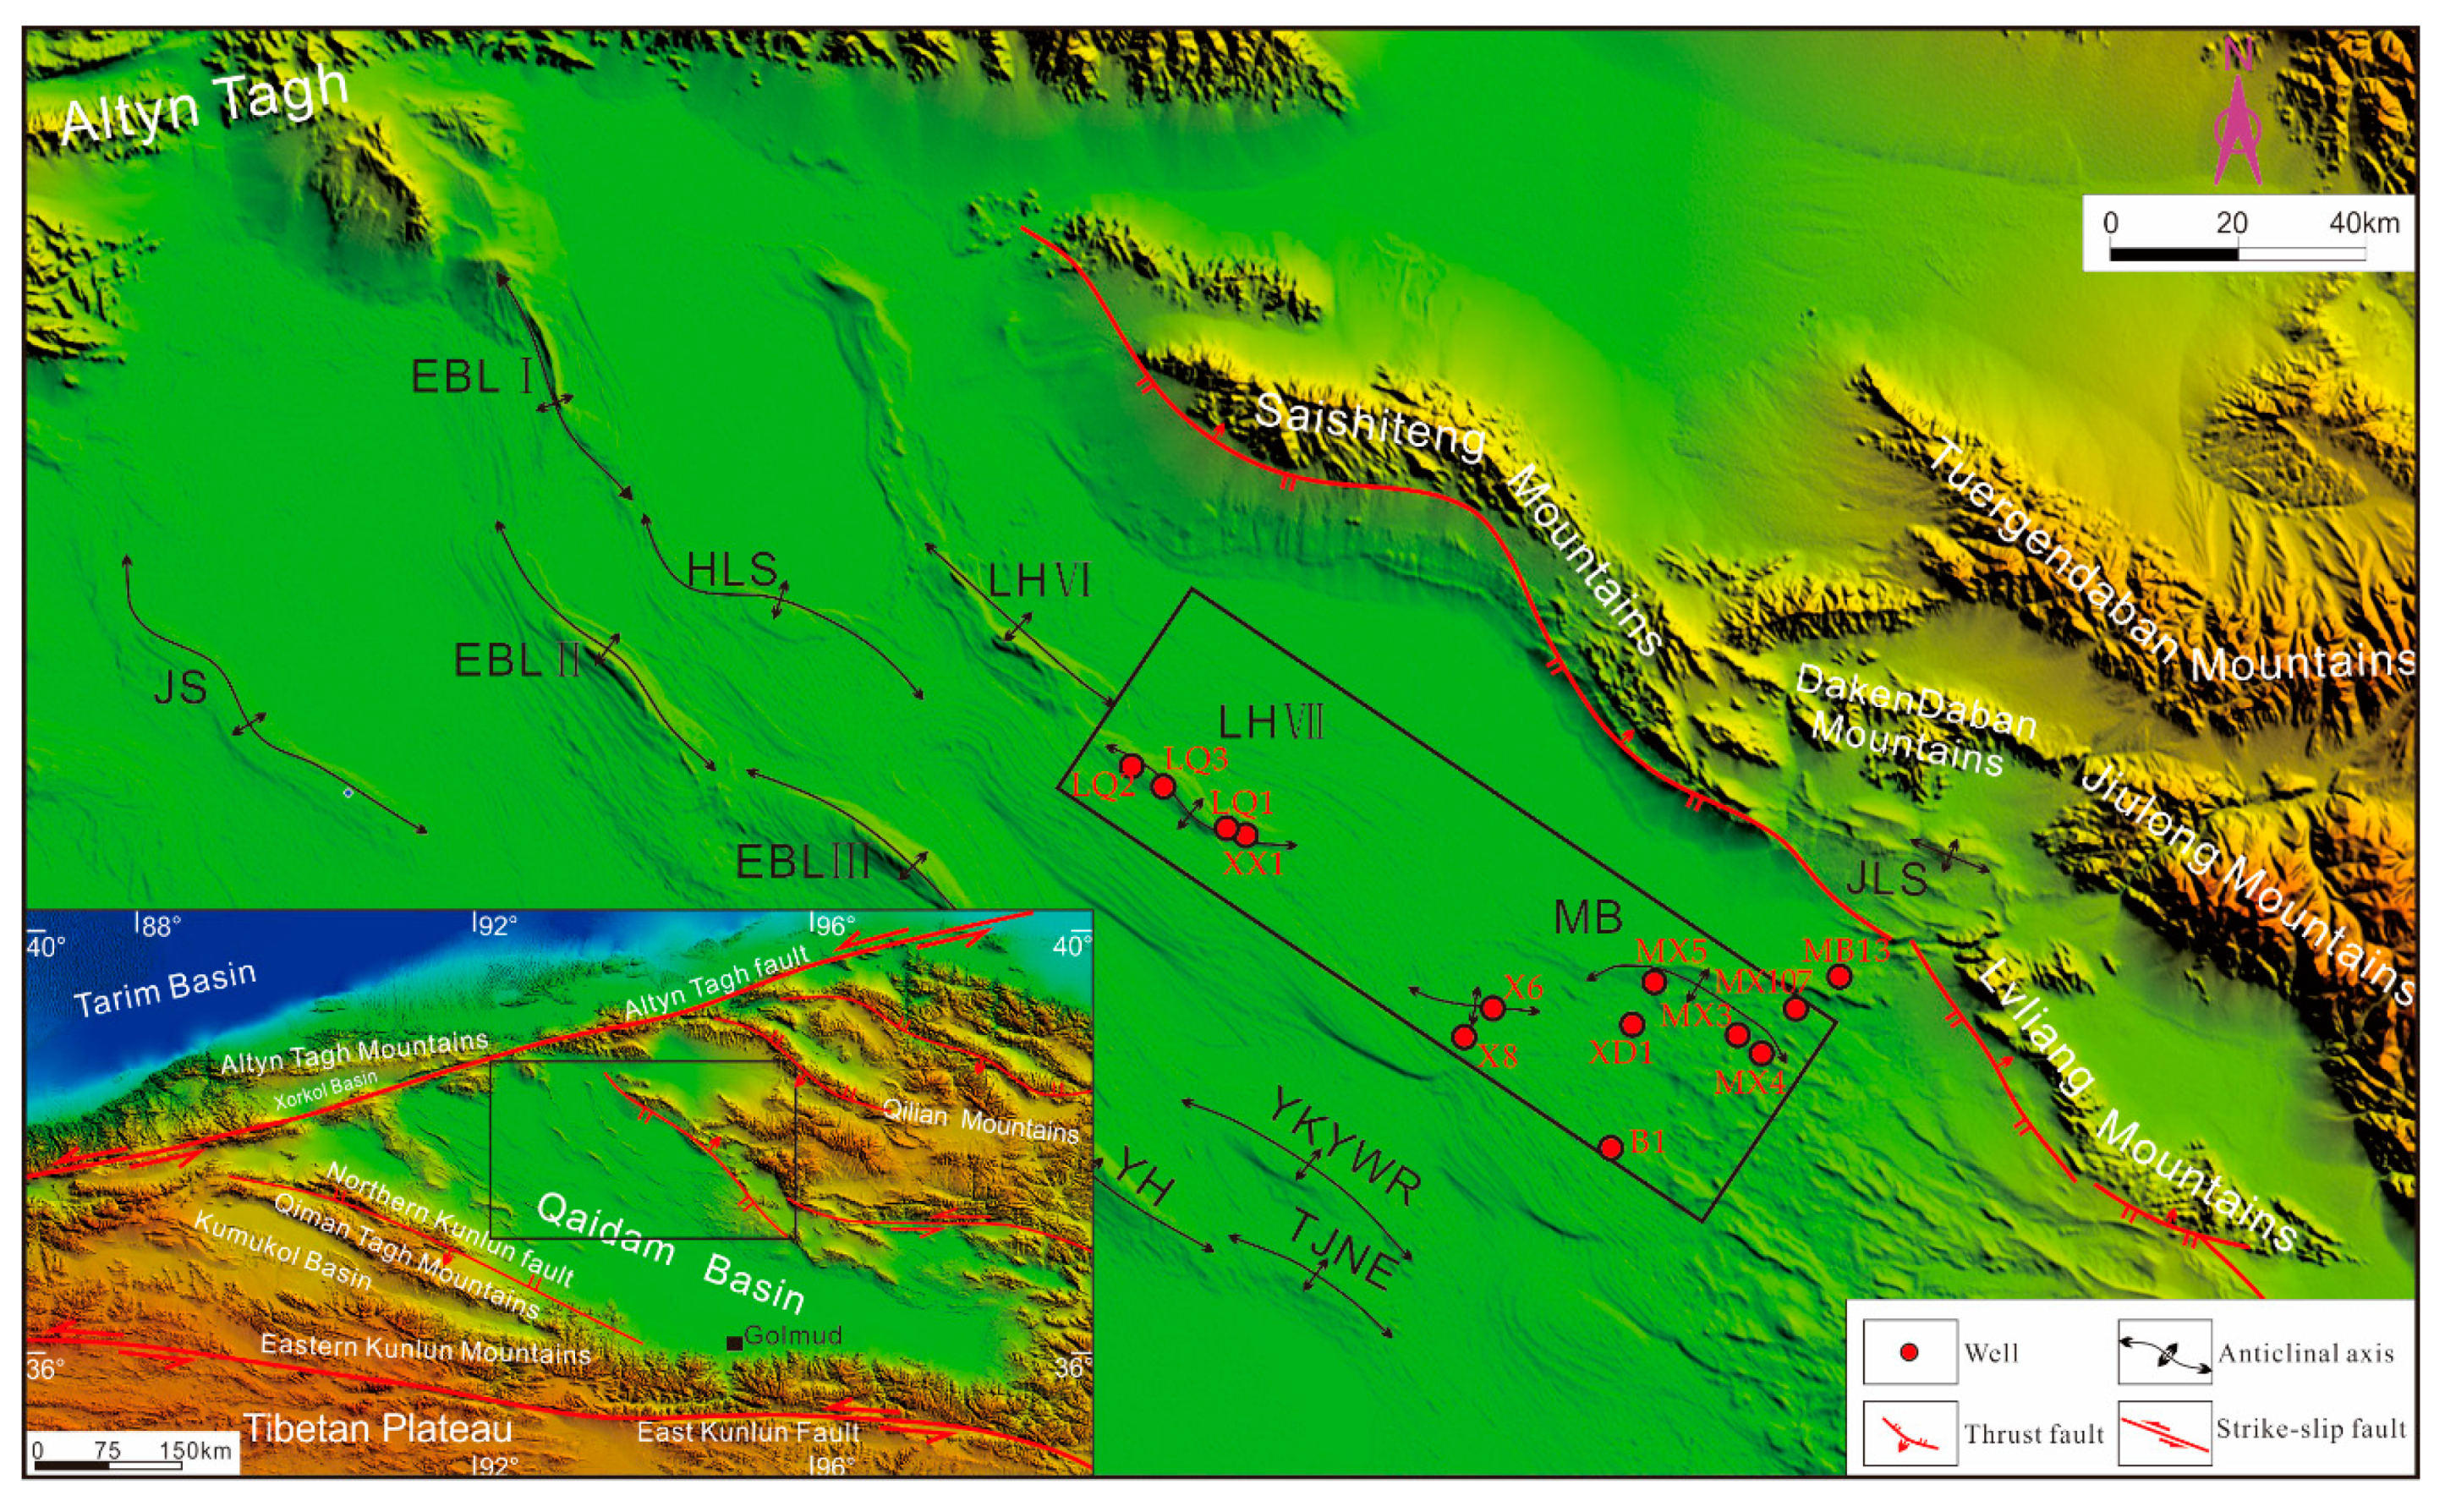
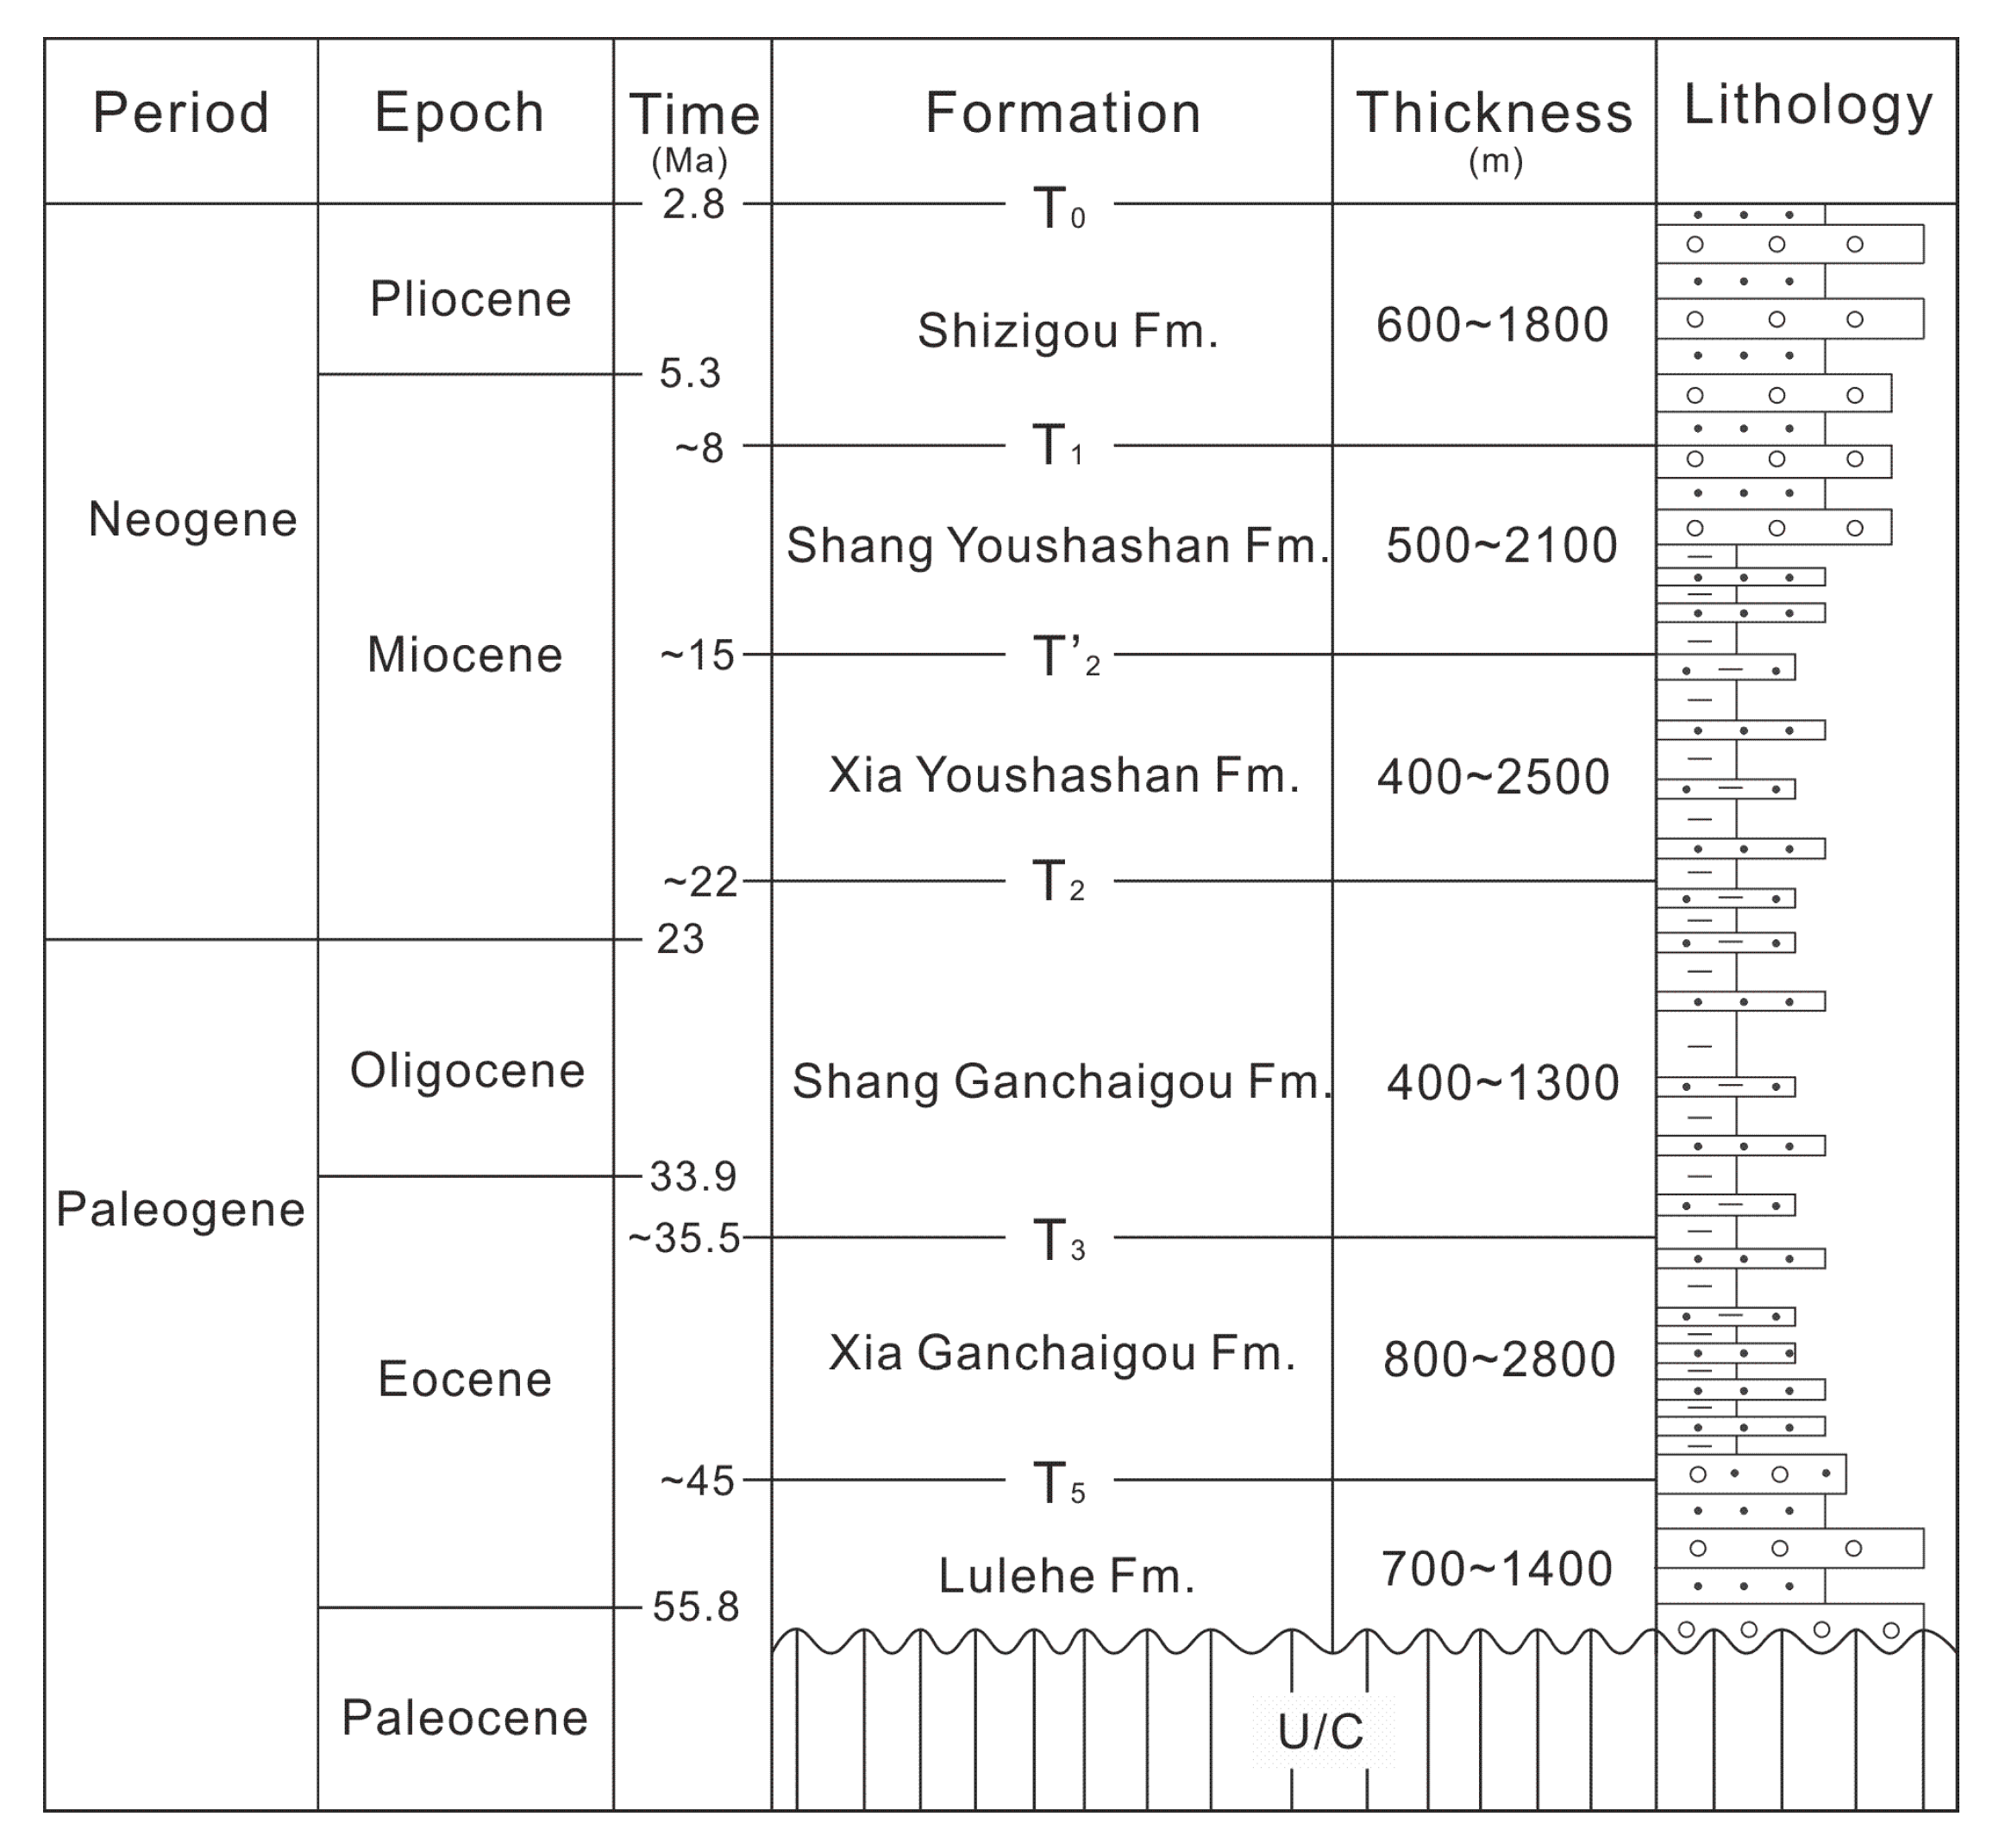
2. Geologic Setting
3. Materials and Methods
4. Sandstone Framework Petrography
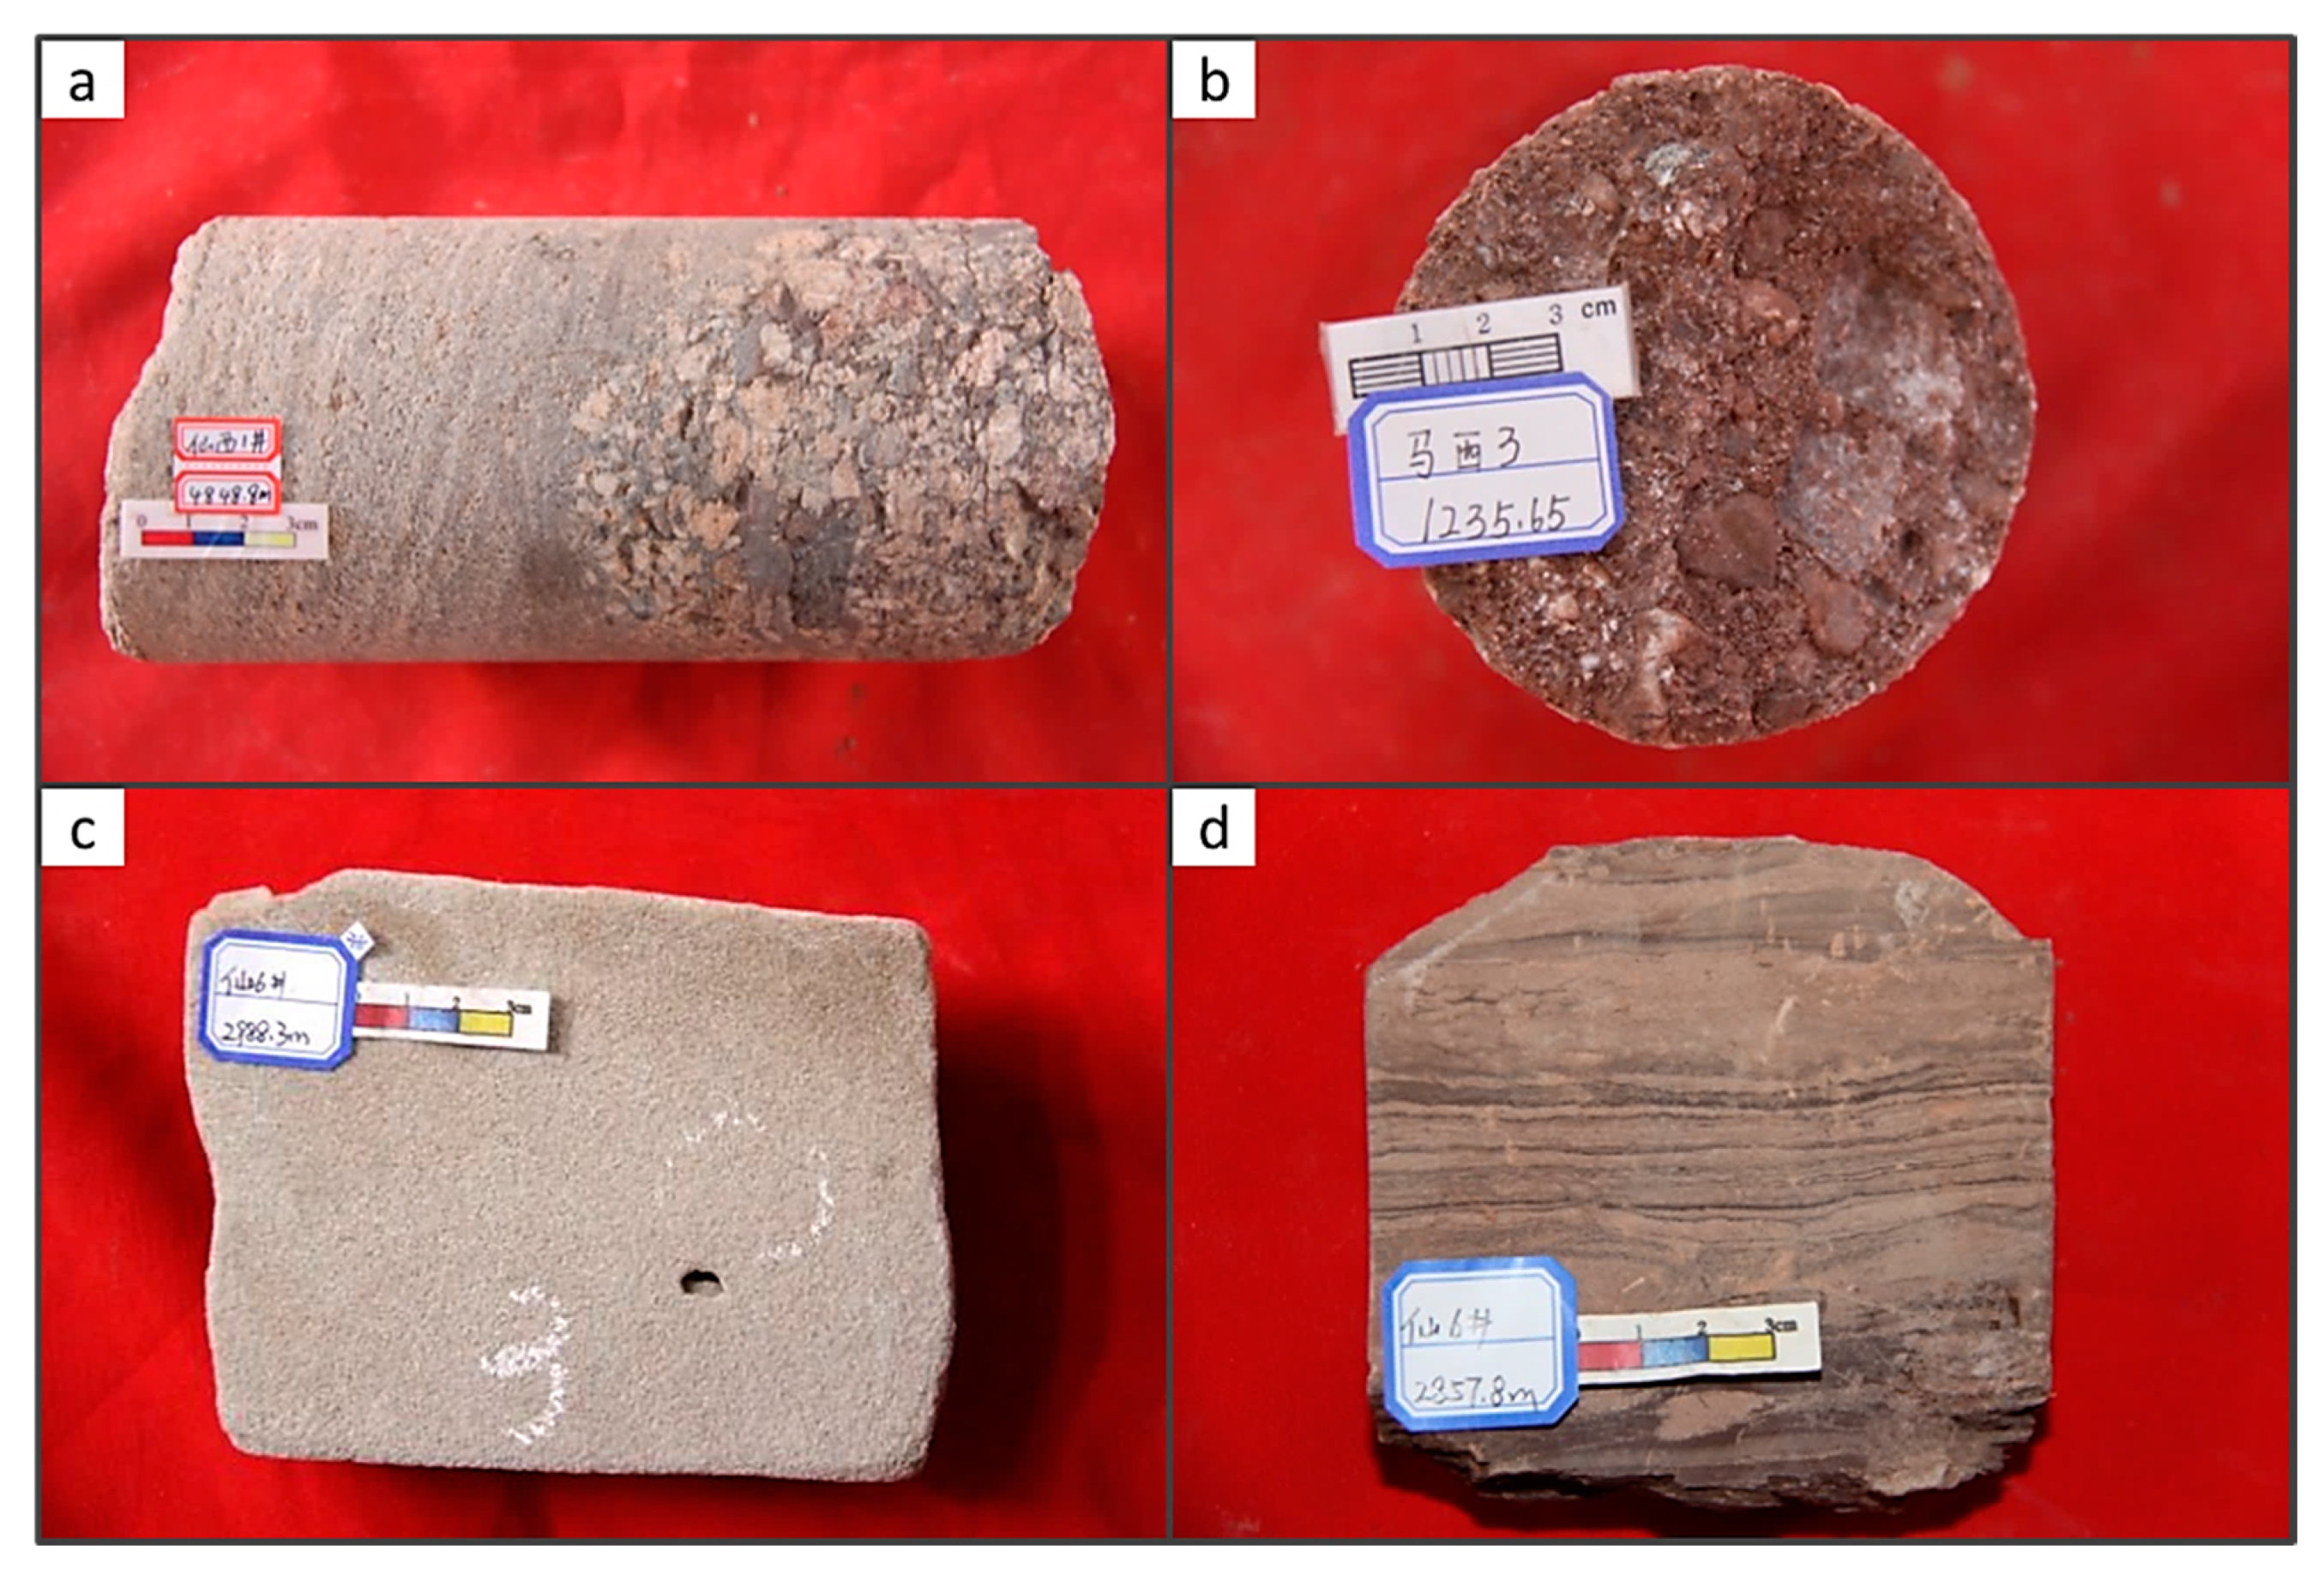
4.1. Texture and Composition
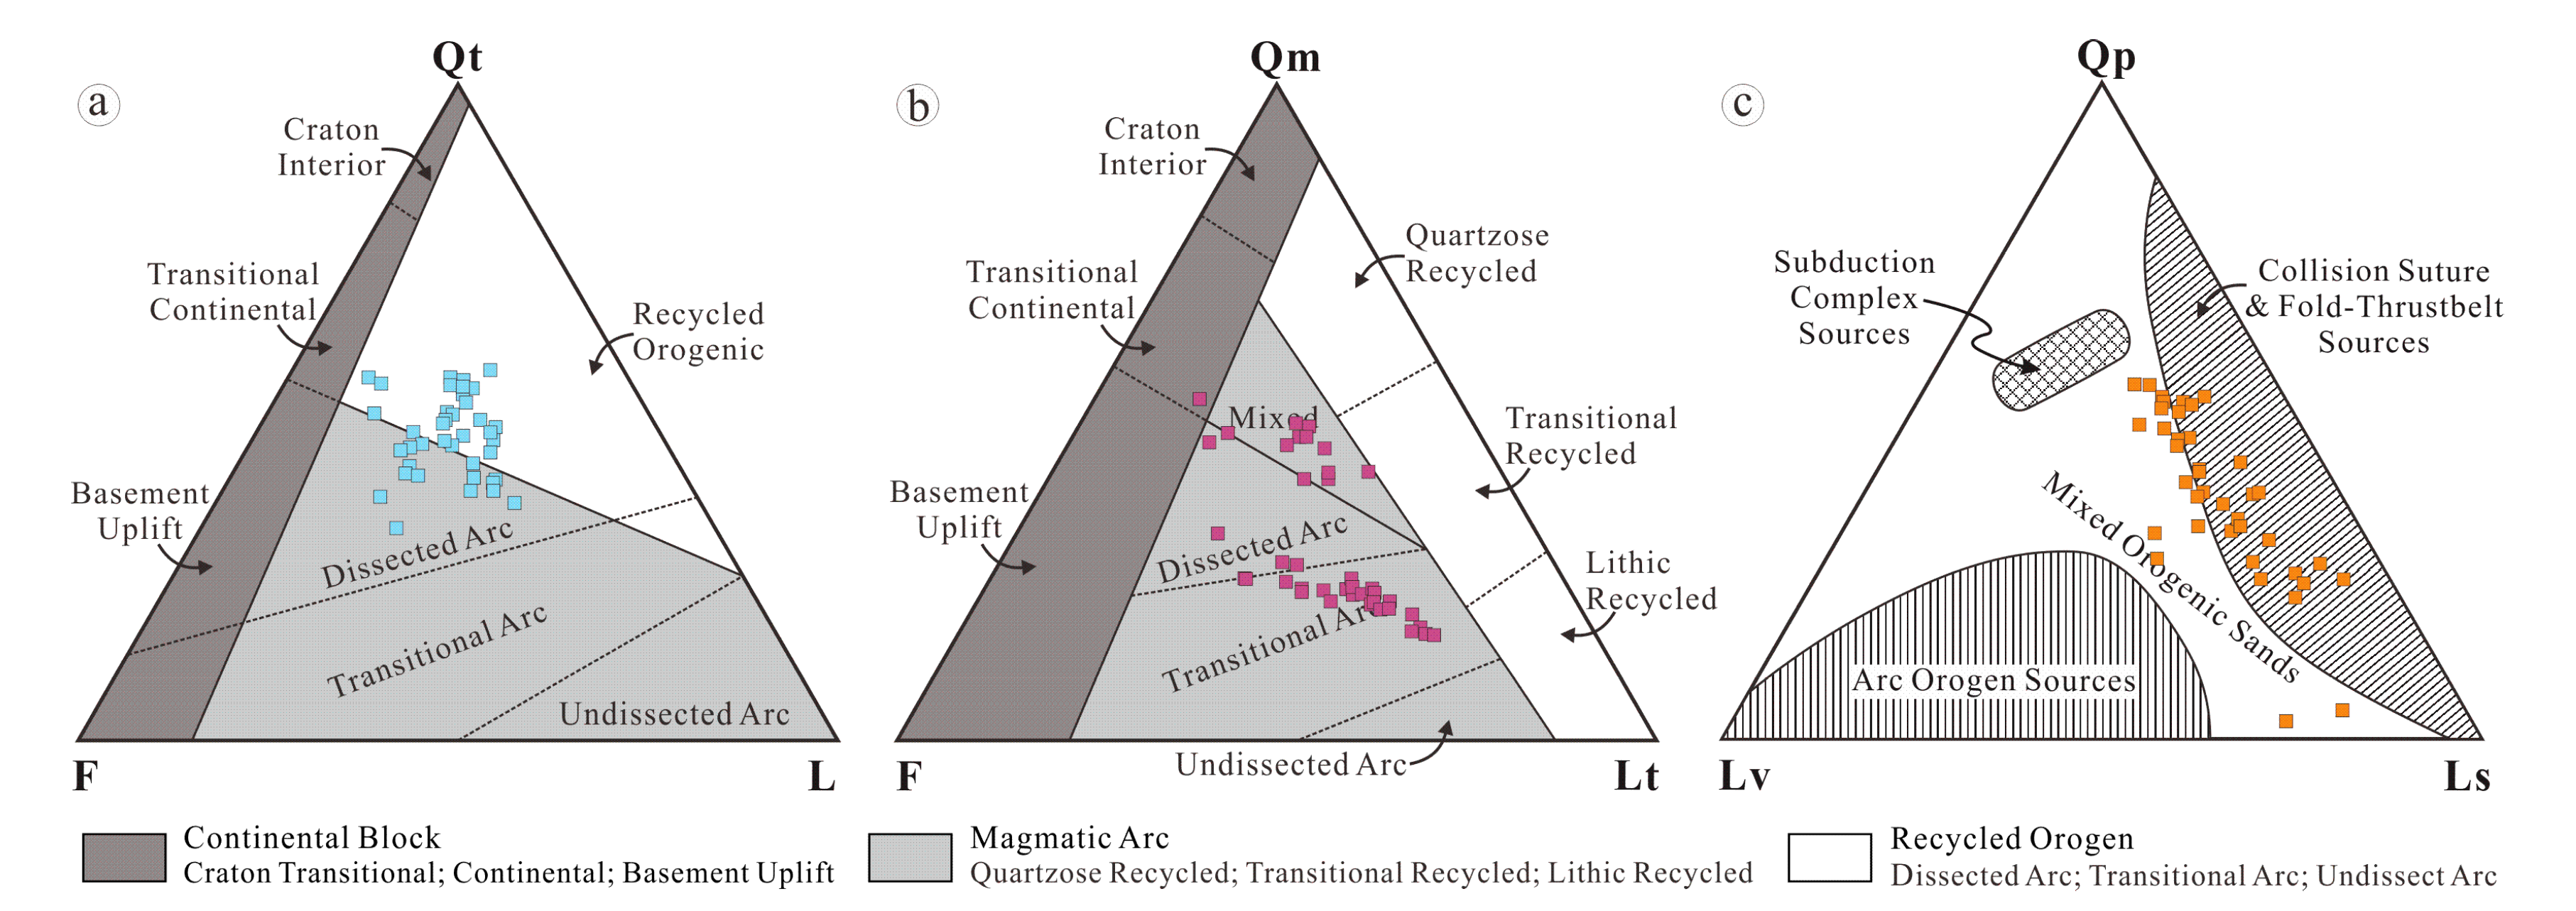
4.2. Detrital Analysis
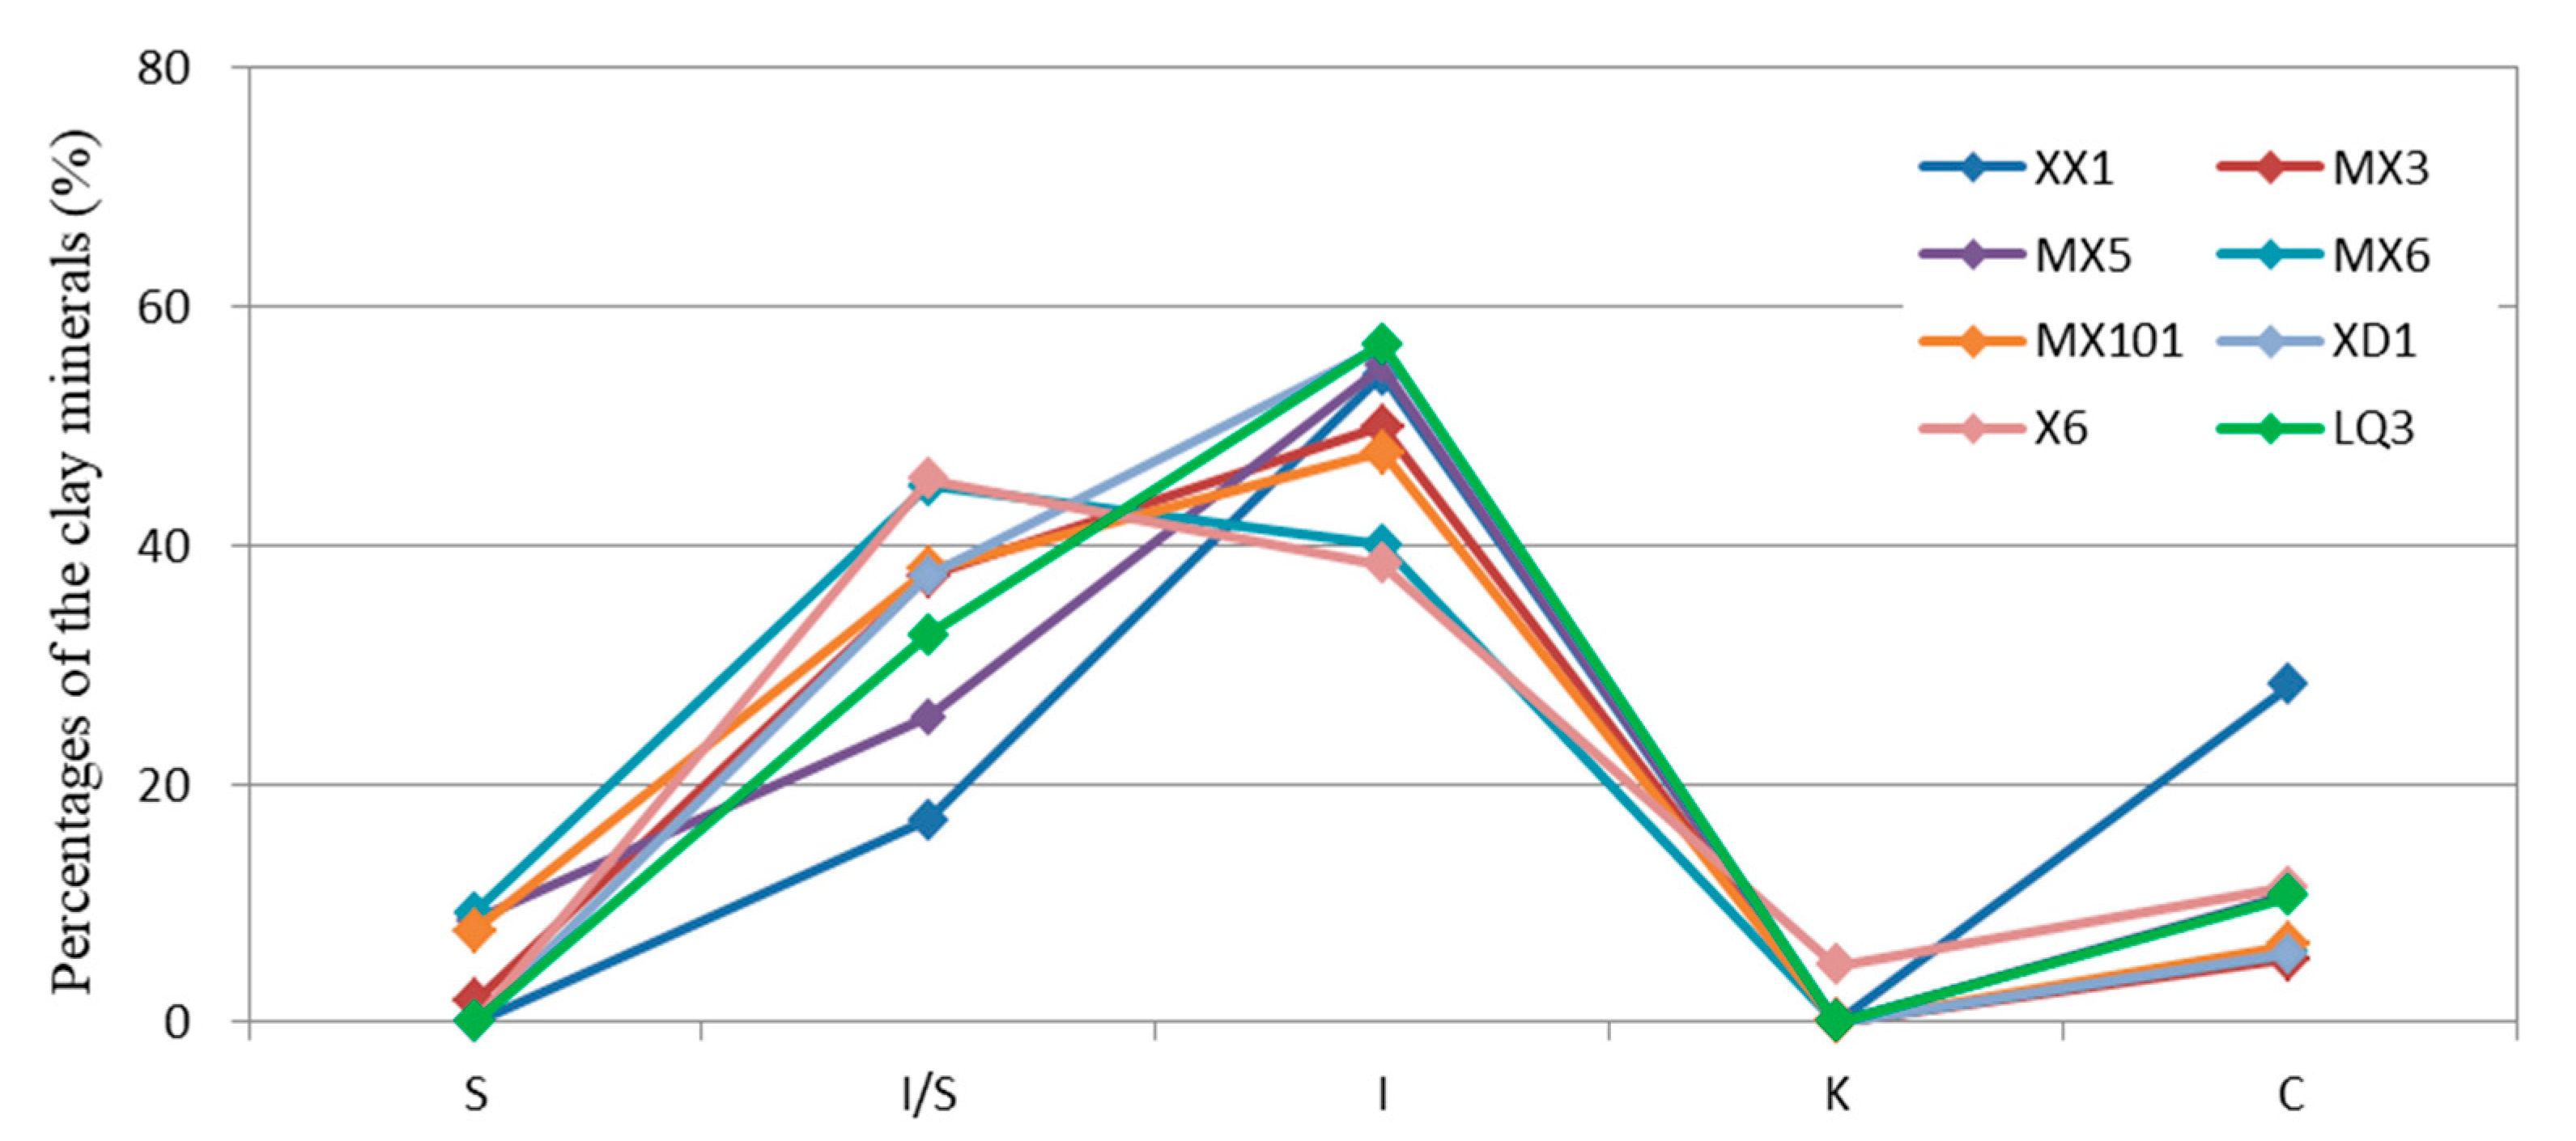
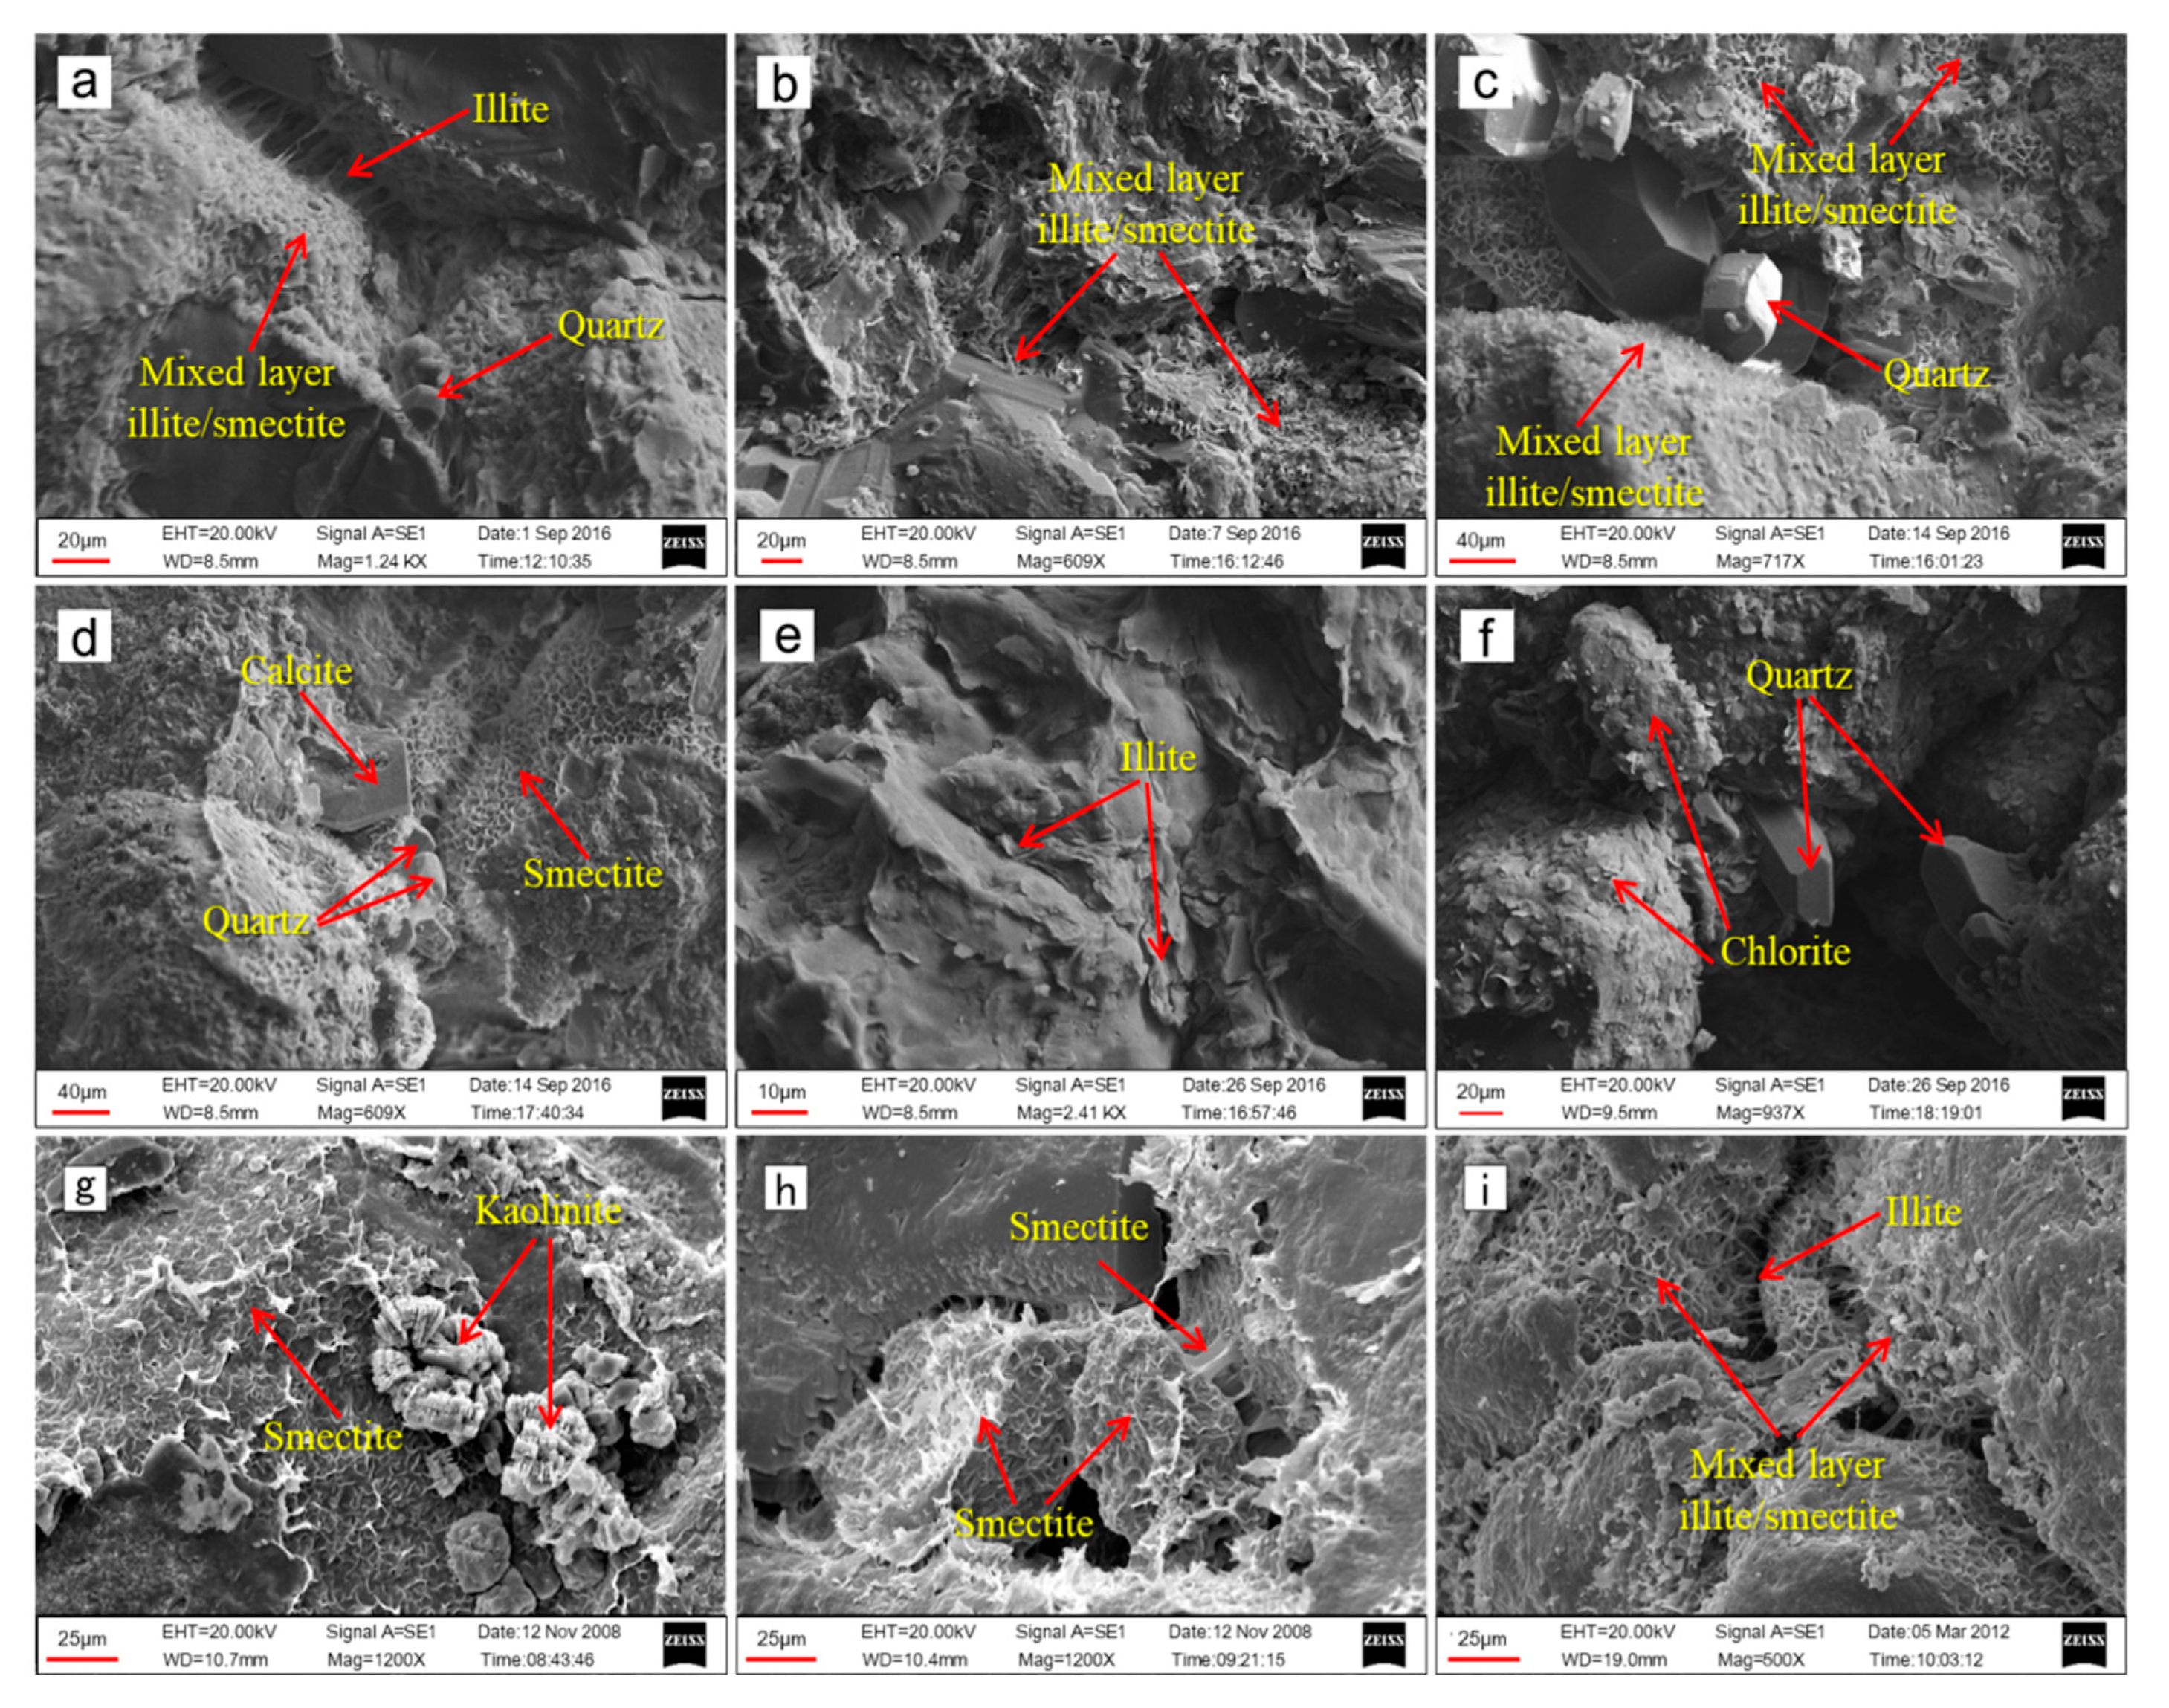
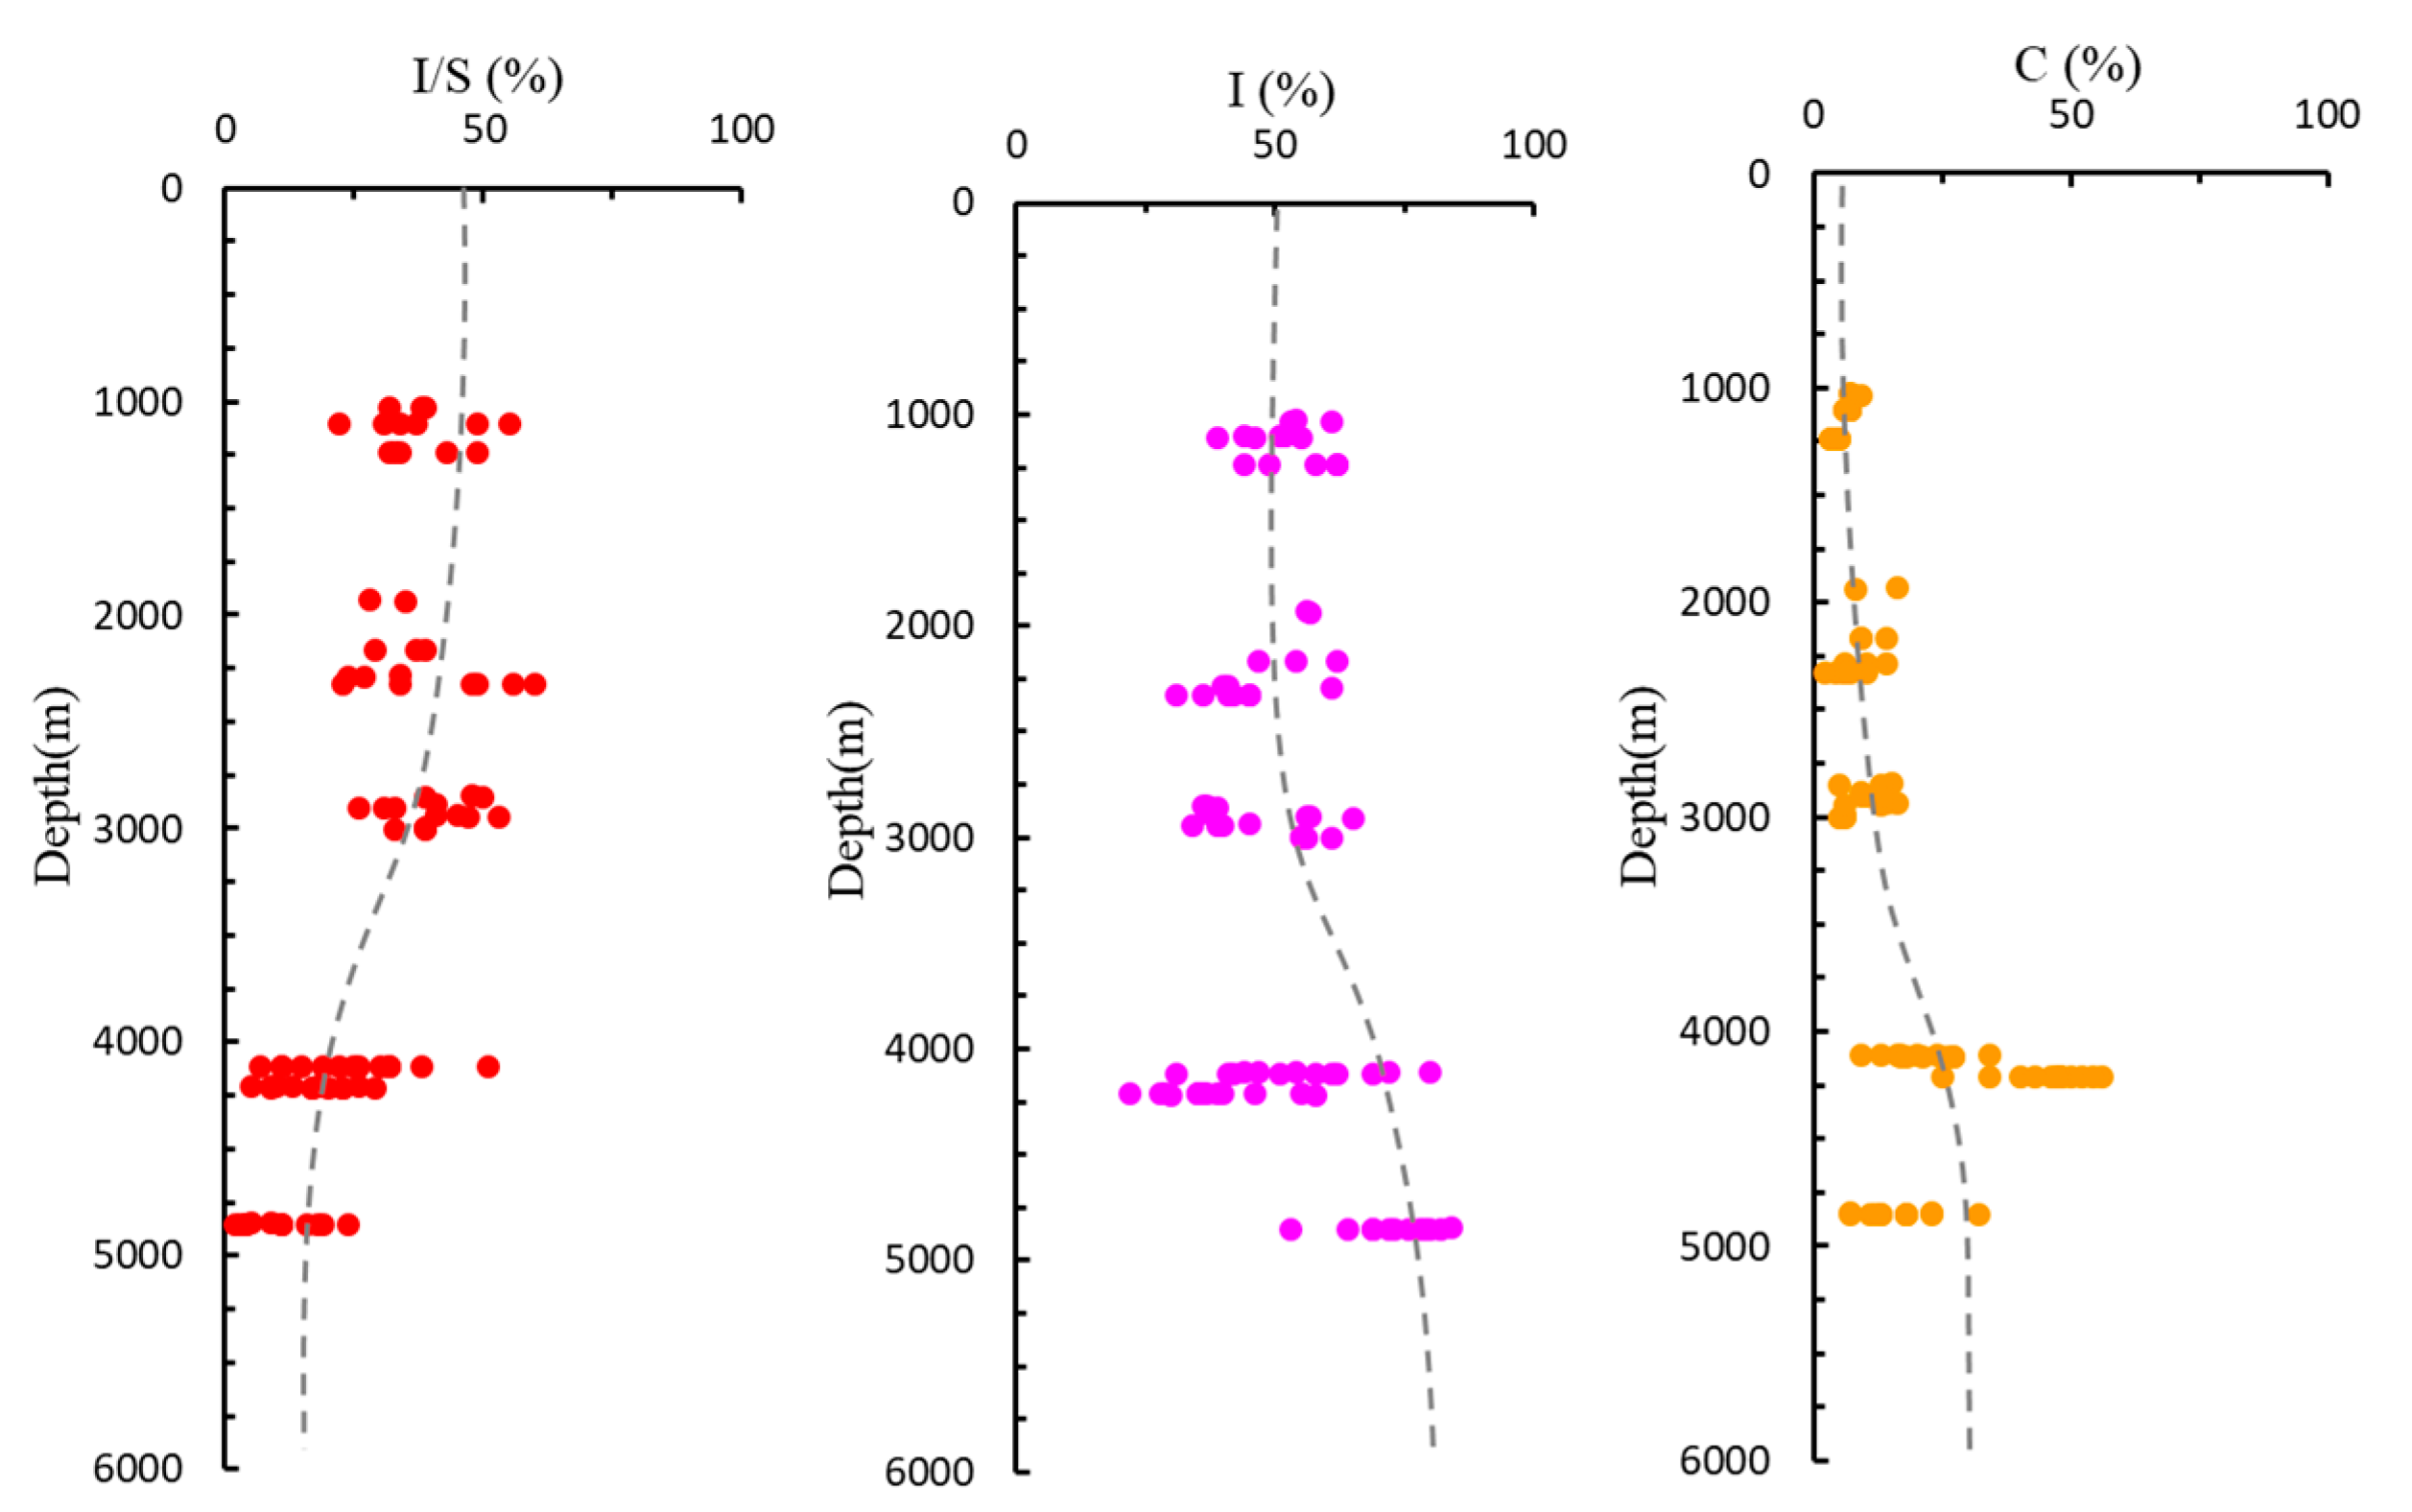
5. Clay Minerals
6. Geochemical Features
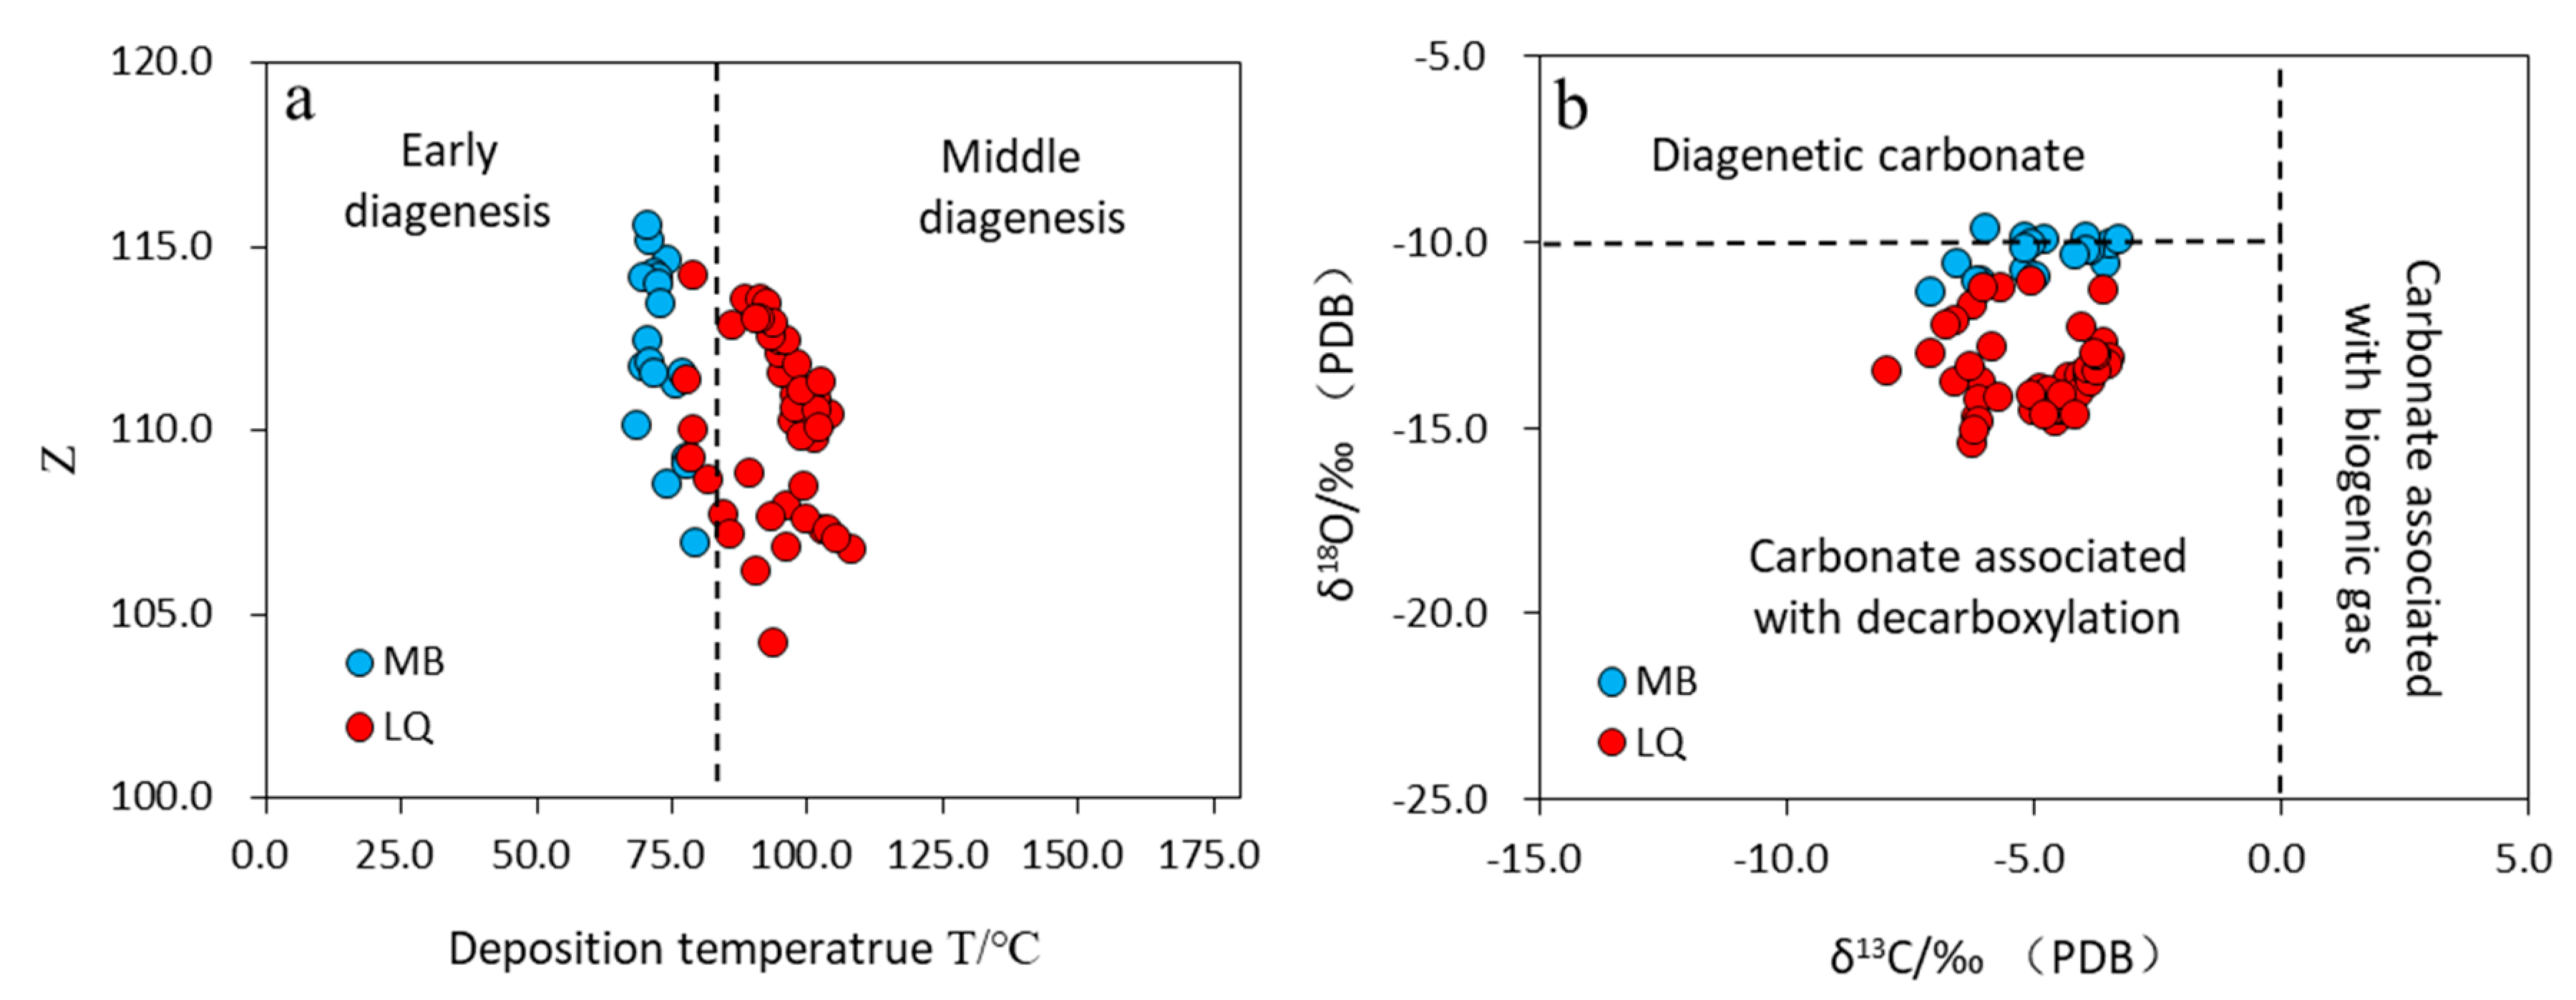
6.1. Stable Carbon and Oxygen Isotopes
6.2. Major Elements
6.3. Trace Elements
6.4. Rare Earth Elements
7. Discussion and Conclusions
Supplementary Materials
Author Contributions
Funding
Acknowledgments
Conflicts of Interest
References
- Singer, A.M.C. Plate Tectonic Theory and Orogeny; Ding, X.; Zhou, Z.Y.; Zhao, G.X., Translators; Fudan University Publishing House: Shanghai, China, 1992; pp. 36–120. [Google Scholar]
- Ge, X.H.; Ren, S.M.; Ma, L.X.; Wu, G.D.; Liu, Y.J.; Yuan, S.H. Multi-stage uplifts of the Qinghai—Tibet plateau and their environmental effects. Earth Sci. Front. 2006, 13, 118–130. [Google Scholar]
- Zheng, D.; Yao, T.D. Uplifting of Tibetan Plateau with its environmental effects. Adv. Earth Sci. 2006, 21, 451–458. [Google Scholar]
- Zheng, D.; Yao, T.D. Research progress on formation and evolution of Qinghai-Tibet Plateau and its environmental and resource effects. China Basic Sci. 2004, 6, 15–21. [Google Scholar]
- Sun, G.Q.; Liu, W.M.; Guo, J.J.; Wang, Y.T. Fission-track evidence of tectonic evolution in the northwestern qaidam basin, china. J. Earth Syst. Sci. 2018, 127, 12. [Google Scholar] [CrossRef]
- Zhai, G.M.; Xu, F.Y. A reconsideration of Qaidam Basin for a great breakthrough in oil and natural gas exploration. Acta Pet. Sin. 1997, 18, 1–7. [Google Scholar]
- Dai, J.S.; Ye, X.S.; Tang, L.J.; Jin, Z.J.; Shao, W.B.; Hu, Y.; Zhang, B.S. Tectonic units and oil-gas potential of the Qaidam Basin. Chin. J. Geol. 2003, 38, 291–296. [Google Scholar]
- Fu, S.T.; Ma, D.D.; Chen, Y.; Zhang, G.Q.; Wu, K.Y. New advance of petroleum and gas exploration in Qaidam Basin. Acta Pet. Sin. 2016, 37 Suppl. S1, 1–10. [Google Scholar]
- Guo, J.; Sun, G.; Men, H.; Zhu, W.; Ma, J.; Zhu, J.; Guan, B.; Shi, J. Genetic analysis of anomalously high porosity zones in deeply buried reservoirs in the west part of northern edge of Qaidam Basin, NW China. Acta Sedimentol. Sin. 2018, 36, 777–786. [Google Scholar]
- Singer, A. The paleoclimatic interpretation of clay minerals in soils and weathering profiles. Earth Sci. Rev. 1980, 15, 303–326. [Google Scholar] [CrossRef]
- Chen, B.; Wang, F.; Shi, J.; Chen, F.; Shi, H. Origin and Sources of Minerals and Their Impact on the Hydrocarbon Reservoir Quality of the Paleogene Lulehe Formation in the Eboliang Area, Northern Qaidam Basin, China. Minerals 2019, 9, 436. [Google Scholar] [CrossRef]
- Deconinck, J.F.; Blanc-Valleron, M.M.; Rouchy, J.M.; Camoin, G.; Badaut-Trauth, D. Palaeoenvironmental and diagenetic control of the mineralogy of Upper Cretaceous-Lower Tertiary deposits of the Central Palaeo-Andean basin of Bolivia (Potosi area). Sediment. Geogr. 2000, 132, 263–278. [Google Scholar] [CrossRef]
- Li, Y.C.; Wang, S.M.; Huang, Y.S. The lake sediments rediments to environmental and climatic change. Adv. Earth Sci. 1999, 14, 412–416, (In Chinese with English abstract). [Google Scholar]
- Fan, Y.H.; Qu, H.J.; Wang, H.; Yang, X.C.; Feng, Y.W. The application of trace elements analysis to identifying sedimentary media environment: A case study of Late Triassic strata in the middle part of western Ordos Basin. Geol. China 2012, 39, 382–389. [Google Scholar]
- Yu, S.H.; Zheng, H.H. REE of sediments of the Chang Liushui section at Zhong Wei County of Ning Xia and the environmental significance. Acta Sedimentol. Sin. 1999, 17, 149–155. [Google Scholar] [CrossRef]
- Zheng, J.J.; Su, L.; Liu, X.W.; Yang, X.; Sun, G.Q.; Zhang, S.C.; Liu, Y.H. The conversion of dynamical mechanisms and formation of intra-plate depression under the compress(-shear) dynamics. Geotecton. Metallog. 2009, 33, 107–114. [Google Scholar]
- Zheng, J.; Peng, Z. Tectonic kinematic process of chief oil-gas bearing basins and the formation of oil-gas in China. Acta Sedimentol. Sin. 1995, 13, 160–168. [Google Scholar]
- Deway, F.J. Extensional collapse of orogens. Teetonics 1988, 7, 1123–1139. [Google Scholar] [CrossRef]
- Huang, R.H. Geotectonic evolution and its characteristics in Qilianshan region. Geotecton. Metallog. 1996, 20, 95–104. [Google Scholar]
- Zhao, S.G. The features and tectonic evolution of the Qilian orogenic belt. Acta Geol. Gansu 1996, 5, 16–29. [Google Scholar]
- Yang, J.S.; Xu, Z.Q.; Li, H.B.; Wu, C.L.; Cui, J.W.; Zhang, J.X.; Chen, W. Discovery of eclogite at northern margin of Qaidam basin, NW China. Chin. Sci. Bull. 1998, 43, 1755–1760. [Google Scholar] [CrossRef]
- Sun, G.Q.; Zheng, J.J.; Su, L.; Liu, X.W.; Yang, X.; Liu, Y.H. Mesozoic-Cenozoic Tectonic Evolution in Northwestern Qaidam Basin. Nat. Gas Geosci. 2010, 21, 212–217. [Google Scholar]
- Sun, G.Q.; Si, D.; Wang, M.; Shen, Y.S.; Zhou, F.; Hao, X.M.; Niu, F. The tectonic kinematic process and the types of oil and gas reservoirs in northern margin of Qaidam basin. Nat. Gas Geosci. 2012, 23, 826–832. [Google Scholar]
- Sun, G.Q.; Du, Z.M.; Jia, Y.Y.; Zhou, F.; Hao, X.M.; Shi, J.A. Sedimentary model since Paleogene in northern margin of Qaidam Basin. Lithol. Reserv. 2012, 24, 13–18. [Google Scholar]
- Jian, X.; Guan, P.; Zhang, D.W.; Zhang, W.; Feng, F.; Liu, R.J.; Lin, S.D. Provenance of Tertiary sandstone in the northern Qaidam basin, northeastern Tibetan Plateau: Integration of framework petrography, heavy mineral analysis and mineral chemistry. Sediment. Geol. 2013, 290, 109–125. [Google Scholar] [CrossRef]
- Sun, Z.M.; Yang, Z.Y.; Pei, J.L.; Ge, X.H.; Wang, X.S.; Yang, T.S.; Li, W.M.; Yuan, S.H. Magnetostratigraphy of Paleogene sediments from northern Qaidam Basin, China: Implications for tectonic uplift and block rotation in northern Tibetan plateau. Earth Planet. Sci. Lett. 2005, 237, 635–646. [Google Scholar] [CrossRef]
- Sun, Z.C.; Jing, M.C.; Sun, N.D.; Lu, Y.L.; Cao, L. Discussion on boundary between the upper and lower members of Xiaganchaigou Formation of Paleogene in Well Kun-2 Qaidam Basin. J. Palaeogeogr. 2007, 9, 611–618. [Google Scholar]
- Wang, X.M.; Qiu, Z.D.; Li, Q.; Wang, B.Y.; Qiu, Z.X.; Downs, W.R.; Xie, G.P.; Xie, J.Y.; Deng, T.; Takeuchi, G.T.; et al. Vertebrate paleontology, biostratigraphy, geochronology, and paleoenvironment of Qaidam Basin in northern Tibetan Plateau. Palaeogeogr. Palaeoclimatol. Palaeoecol. 2007, 254, 363–385. [Google Scholar] [CrossRef]
- Wang, Q.; Hao, L.W.; Chen, G.J.; Zhang, G.C.; Zhang, R.; Ma, X.F.; Wang, H. Forming mechanism of carbonate cements in siliciclastic sandstone of Zhuhai Formation in Baiyun sag. Acta Pet. Sin. 2010, 31, 553–558. [Google Scholar]
- Sun, G.Q.; Yin, J.G.; Zhang, S.C.; Lu, X.C.; Zhang, S.Y.; Shi, J.A. Diagenesis and sedimentary environment of Miocene series in Eboliang III area. Environ. Earth Sci. 2015, 74, 5169–7159. [Google Scholar] [CrossRef]
- Dickinson, W.R. Interpreting Provenance Relations from Detrital Modes of Sandstones. In Provenance of Arenites; Zuffa, G.G., Ed.; NATO ASI Series (Series C: Mathematical and Physical Sciences); Springer: Dordrecht, The Netherland, 1985; Volume 148, pp. 333–361. [Google Scholar] [CrossRef]
- Ingersoll, R.V.; Bullard, T.F.; Ford, R.L.; Grimm, J.P.; Pickle, J.D.; Sares, S.W. The effect of grain size on detrital modes: A test of the Gazzi–Dickinson point-counting method. J. Sediment. Petrol. 1984, 54, 103–116. [Google Scholar] [CrossRef]
- Long, H.; Wang, C.H.; Liu, Y.P.; Ma, H.Z. Application of clay minerals in paleoenviroment research. J. Salt Lake Res. 2007, 15, 21–25. [Google Scholar] [CrossRef]
- Jin, N.; Li, A.C.; Liu, H.Z.; Meng, Q.Y.; Wan, S.M.; Xu, Z.K. Clay minerals in surface sediment of the northwest parece vela basin: Distribution and provenance. Oceanol. Limnol. Sin. 2007, 6, 504–511. [Google Scholar]
- Fu, W.J. Influence of clay minerals onsandstone reservoir properties. J. Palaeogeogr. 2000, 3, 59–67. [Google Scholar]
- Dong, W.H.; Su, X.S.; Hou, G.C.; Lin, X.Y.; Liu, F.T. Study on distribution law of TDS and main ion concentration in groundwater in the Ordos Cretaceous Artesian Basin. Hydrogeol. Eng. Geol. 2008, 4, 11–16. [Google Scholar]
- Wu, B.H.; Yangm, H.N.; Li, S.J. The Mineral Composition of Sediment and Sedimentation of Central Pacific; Geological Publishing House: Beijing, China, 1993; pp. 44–45. [Google Scholar]
- Tang, Y.J.; Jia, J.Y.; Xie, X.D. Environment significance of clay minerals. Earth Sci. Front. 2002, 2, 337–341. [Google Scholar]
- Lu, C.X. Clay minerals as indicators of paleoenvironment. J. Desert Res. 1997, 4, 456–460. [Google Scholar]
- Liu, Y. The clay mineral characteristics and the analysis for sedimentary environment of the Late Cretaceous in Songliao Basin. Acta Sedimentol. Sin. 1985, 4, 131–137. [Google Scholar]
- Xie, Y.; Wang, J.; Li, L.X.; Xie, Z.W.; Deng, G.H.; Li, M.H.; Jiang, X.S. Distribution of the Cretaceous clay minerals in Ordos basin, China and its implication to sedimentary and diagenetic environment. Geol. Bull. China 2010, 29, 93–104. [Google Scholar] [CrossRef]
- Yuan, H.R.; Nie, Z.; Liu, J.Y.; Wang, M. Paleogene sedimentary characteristics and their paleoclimatic implications in the Baise Basin. Guangxi Acta Geol. Sin. 2007, 12, 1692–1697. [Google Scholar]
- Hower, J.; Eslinger, E.V.; Hower, M.E.; Perry, E.A. Mechanism of burial metamorphism of argillaceous sediments: 1. Mineralogical and chemical evidence. Geol. Soc. Am. Bull. 1976, 5, 725–737. [Google Scholar] [CrossRef]
- He, L.B. The relation between clay mineral variation of marine sediment cores and paleoclimate. Chin. Sci. Bull. 1982, 13, 809–812. [Google Scholar]
- Yang, Z.S. Mineralogical assemblages and chemical characteristics of clays from sediments of the Huanghe, Changjiang, Zhujiang rivers and their relationship to the climate environment in their sediment source areas. Oceanol. Limnol. Sin. 1988, 4, 336–346. [Google Scholar]
- Sun, G.Q.; Wang, Y.T.; Guo, J.J.; Wang, M.; Jiang, Y.; Pan, S.L. Clay Minerals and Element Geochemistry of Clastic Reservoirs in the Xiaganchaigou Formation of the Lenghuqi Area, Northern Qaidam Basin, China. Minerals 2019, 11, 678. [Google Scholar] [CrossRef]
- Zhao, D.; He, P.; Kong, H.X.; Zheng, H.P.; Lei, Z.F. Characteristics and evolution of the clay minerals in Qaidam basin. Acta Sedimentol. Sin. 2001, 19, 66–70. [Google Scholar]
- Singer, A. The paleoclimatic interpretation of clay minerals insediments: A review. Earth Sci. Rev. 1984, 21, 251–293. [Google Scholar] [CrossRef]
- Zhang, Y.F.; Gao, D.L.; Liu, Y.; Miao, W.L.; Shi, L.; Li, B.L. Characteristics and environmental significance of clay minerals in the late Pieistocene sediment, Qaidam basin. Bull. Mineral. Petrol. Geochem. 2014, 33, 49–54. [Google Scholar]
- Zhang, X.L. Relationship between carbon and oxygen stable isotope in carbonate rocks and paleosalinity and paleotemperature of sea water. Acta Sedimentol. Sin. 1985, 4, 17–30. [Google Scholar]
- Shackleton, N.J. Attainmnet of isotopic equilibrium between ocean water and benthonic foraminifera genus Uvigerina: Isotopic changes in the ocean during the last glacial. Colloq. Int. CNRS (France) 1974, 219, 203–209. [Google Scholar]
- Keith, M.H.; Weber, J.N. Isotopic composition and environmental classification of selected limestones and fossils. Geochim. Cosmochim. Acta 1964, 28, 1787–1816. [Google Scholar] [CrossRef]
- Wang, D.R. Stable Isotope Geochemistry of Oil and Gas; Petroleum Industry Press: Beijing, China, 2000; pp. 82–85. [Google Scholar]
- Guo, H.L.; Wang, D.R. Stable isotopic composition and origin analysis of the carbonate cements with sandstone reservoir of Tarim oil-gas bearing area. Pet. Explor. Dev. 1999, 26, 31–34. [Google Scholar]
- Nesbitt, H.W.; Young, G.M. Early Proterozoic climate and plate motion inferred from major element chemistry of lutites. Nature 1982, 299, 715–717. [Google Scholar] [CrossRef]
- Fedo, C.M.; Nesbitt, H.W.; Young, G.M. Unraveling the effects of potassium metasomatism in sedimentary rocks and paleosols, with implication for paleoweathering conditions and provenance. Geology 1995, 23, 921–924. [Google Scholar] [CrossRef]
- Bauluz, B.; Mayayo, M.J.; Constanza, F.N.; Lopez, J.M.G. Geochemistry of Precambrian and Paleozoic siliciclastic rocks from the Iberian Range (NE Spain): Implications for source-area weathering, sorting, provenance, and tectonic setting. Chem. Geol. 2000, 168, 135–150. [Google Scholar] [CrossRef]
- Rahman, M.J.J.; Suzuki, S. Geochemistry of sandstones from the Miocene Surma Group, Bengal Basin, Bangladesh: Implications for Provenance, tectonic setting and weathering. Geochem. J. 2007, 41, 415–428. [Google Scholar] [CrossRef]
- Li, S.Y.; Yang, D.D.; Wang, S.; Wan, Q.; Wang, D.X. Characteristics of petrology, geochemistry, heavy minerals and isotope chronology of upper Carboniferous detrital rocks in the middle segment of south Tianshan and constraints to the provenance and tectonic evolution. Acta Geol. Sin. 2014, 88, 167–184. [Google Scholar]
- Nesbitt, H.W.; Young, G.M. Prediction of some weathering trends of plutonic and volcanic rocks based on thermodynamic and kinetic considerations. Geochim. Cosmochim. Acta 1984, 48, 1523–1534. [Google Scholar] [CrossRef]
- Nesbitt, H.W.; Young, G.M. Formation and diagenesis of weathering profiles. J. Geol. 1989, 97, 129–147. [Google Scholar] [CrossRef]
- Panahi, A.; Young, G.M.; Rainbird, R.H. Behavior of major and trace elements (including REE) during Paleoproterozoic pedogenesis and diagenetic alteration of an Archean granite near Ville Marie, Quebec, Canada. Geochim. Cosmochim. Acta 2000, 64, 2199–2220. [Google Scholar] [CrossRef]
- McLennan, S.M. Weathering and global denudation. J. Geol. 1993, 101, 295–303. [Google Scholar] [CrossRef]
- Young, G.M.; Long, D.G.F.; Fedo, C.M.; Nesbitt, H.W. Paleoproterozoic Huronian basin: Product of a Wilson cycle punctuated by glaciations and a meteorite impact. Sediment. Geol. 2001, 141–142, 233–254. [Google Scholar] [CrossRef]
- Wang, C.S.; Li, X.H. Analysis Principle and Method of Sedimentary Basin; Higher Education Press: Beijing, China, 2003; p. 102. [Google Scholar]
- Mclennan, S.M.; Hemming, S.; Mcdaniel, D.K.; Hanson, G.N. Geochemical approaches to sedimentation, provenance, and tectonics. Special Pap. Geol. Soc. Am. 1993, 284, 21–40. [Google Scholar] [CrossRef]
- Boynton, W.V. Chapter 3–Cosmochemistry of the Rare Earth Elements: Meteorite Studies. Dev. Geochem. 1984, 2, 63–114. [Google Scholar] [CrossRef]
- Bhatia, M.R.; Crook, K.A.W. Trace element characteristics of graywackes and tectonic setting discrimination of sedimentary basins. Contrib. Mineral. Petrol. 1986, 92, 181–193. [Google Scholar] [CrossRef]
- Mclennan, S.M. Rare earth elements in sedimentary rocks: Influence of provenance and sedimentary processes. Rev. Mineral. Geochem. 1989, 21, 169–200. [Google Scholar] [CrossRef]
- Bock, B.; Bahlburg, H.; Wörner, G.; Zimmermann, U. Tracing Crustal Evolution in the Southern Central Andes from Late Precambrian to Permian with Geochemical and Nd and Pb Isotope Data. J. Geol. 2000, 108, 515–535. [Google Scholar] [CrossRef]
- Bhatia, M.R. Plate tectonics and geochemical composition of sandstones. J. Geol. 1983, 91, 611–627. [Google Scholar] [CrossRef]
- Floyd, P.A.; Leverideg, B.E. Tectonic environment of the Devonian Gramscatho basin, south Cornwall: Framework mode and geochemical evidence from turbiditic sandstones. J. Geol. Soc. Lond. 1987, 144, 531–542. [Google Scholar] [CrossRef]
- Armstrong-Altrin, J.S.; Verma, S.P. Critical evaluation of six tectonic setting discrimination diagrams using geochemical data of Neogene sediments from known tectonic settings. Sediment. Geol. 2005, 177, 115–129. [Google Scholar] [CrossRef]
- Gao, D.; Cheng, R.H.; Shen, Y.J.; Wang, L.L.; Hu, X.Q. Southwestern Provenance-Sedimentary System and Provenance Tectonic Setting of Eastern Sag in the North Yellow Sea Basin. Earth Sci. 2016, 41, 1171–1187. [Google Scholar]
- Song, L.J.; Liu, C.Y.; Zhao, H.G.; Wang, J.Q.; Zhang, X.L. Geochemical Characteristics, Sedimentary Environment and Tectonic Setting of Huangqikou Formation, Ordos Basin. Earth Sci. 2016, 41, 1295–1308. [Google Scholar]
- Huang, Y.F.; Zhang, C.M.; Zhu, R.; Yi, X.F.; Qu, J.H.; Tang, Y. Palaeoclimatology, Provenance and Tectonic Setting during Late Permian to Middle Triassic in Mahu Sag, Junggar Basin, China. Earth Sci. 2017, 42, 1736–1749. [Google Scholar]
- Ramkumar, M.; Santosh, M.; Nagarajan, R.; Li, S.S.; Mathew, M.J.; Menier, D.; Siddiqui, N.; Rai, J.; Sharma, A.; Farroqui, S.; et al. Late Middle Miocene volcanism in Northwest Borneo, Southeast Asia: Implications for tectonics, paleoclimate and stratigraphic marker. Palaeogeogr. Palaeoclimatol. Palaeoecol. 2018, 490, 141–162. [Google Scholar] [CrossRef]
- Huang, B.; Fu, D.; Kusky, T.M.; Ruan, K.P.; Zhou, W.X.; Zhang, X.H. Sedimentary provenance in response to Carboniferous arc-basin evolution of East Junggar and North Tianshan belts in the southwestern Central Asian Orogenic Belt. Tectonophysics 2018, 722, 324–341. [Google Scholar] [CrossRef]
- Bhatia, M.R. Rare earth element geochemistry of Australian Paleozoic graywackes and mudrocks: Province and tectonic control. Sediment. Geol. 1985, 45, 97–113. [Google Scholar] [CrossRef]
- McDonough, W.F.; Sun, S.S. The composition of the earth. Chem. Geol. 1995, 120, 223–253. [Google Scholar] [CrossRef]
- Qin, X.F.; Xia, B.; Li, C.Q.; Li, J.; Lu, J.P.; Xu, H.; Zhou, F.S.; Hu, G.A.; Li, Q. Geochemical characteristics and tectonic setting of Precambrian granitic gneiss in the western segment of Altyn Tagh tectonic belt. Geoscience 2008, 22, 34–44. [Google Scholar]
- Meng, F.C.; Zhang, J.X.; Yang, J.S. Subducted continental arc:Geochemical and isotopic evidence of gneisses in the north Qaidam. Acta Geol. Sin. 2005, 79, 46–55, (in Chinese with English abstract). [Google Scholar]
- Wedepohl, K.H. Handbook of Geochemistry; Springer: Berlin, Germany, 1969; p. 248. [Google Scholar]


| Well | Buried Depth (m) | L (%) | Qt (%) | F (%) | Lt (%) | Qm (%) | F (%) | Ls (%) | Qp (%) | Lv (%) |
|---|---|---|---|---|---|---|---|---|---|---|
| XX1 | 4111.55 | 24.14 | 49.99 | 25.87 | 50.85 | 23.28 | 25.87 | 37.31 | 52.52 | 10.17 |
| 4111.75 | 31.85 | 40.27 | 27.87 | 47.24 | 24.89 | 27.87 | 46.35 | 32.57 | 21.07 | |
| 4112.11 | 34.72 | 39.49 | 25.79 | 51.40 | 22.81 | 25.79 | 52.11 | 32.45 | 15.44 | |
| 4112.64 | 28.27 | 49.12 | 22.61 | 58.00 | 19.38 | 22.61 | 36.21 | 51.26 | 12.53 | |
| 4112.95 | 32.36 | 38.31 | 29.33 | 47.41 | 23.26 | 29.33 | 51.19 | 31.75 | 17.06 | |
| 4113.72 | 34.87 | 39.95 | 25.18 | 54.48 | 20.34 | 25.18 | 48.00 | 36.00 | 16.00 | |
| 4114.10 | 35.42 | 38.28 | 26.31 | 53.45 | 20.24 | 26.31 | 51.11 | 33.75 | 15.14 | |
| 4114.84 | 39.13 | 36.42 | 24.45 | 54.03 | 21.52 | 24.45 | 43.45 | 27.58 | 28.97 | |
| 4115.32 | 30.90 | 47.95 | 21.14 | 62.59 | 16.26 | 21.14 | 32.48 | 50.63 | 16.89 | |
| 4115.60 | 32.15 | 44.16 | 23.69 | 59.39 | 16.92 | 23.69 | 37.04 | 45.87 | 17.09 | |
| 4115.83 | 31.50 | 46.12 | 22.38 | 60.21 | 17.41 | 22.38 | 34.42 | 47.69 | 17.90 | |
| 4116.12 | 30.53 | 47.20 | 22.28 | 61.22 | 16.50 | 22.28 | 35.04 | 50.14 | 14.82 | |
| 4116.52 | 30.71 | 42.42 | 26.87 | 52.01 | 21.11 | 26.87 | 42.44 | 40.96 | 16.61 | |
| 4207.94 | 24.69 | 53.99 | 21.32 | 33.79 | 44.89 | 21.32 | 56.45 | 26.94 | 16.60 | |
| 4208.41 | 13.81 | 50.08 | 36.11 | 18.22 | 45.67 | 36.11 | 69.93 | 24.24 | 5.83 | |
| 4208.90 | 12.34 | 54.77 | 32.89 | 19.82 | 47.29 | 32.89 | 51.87 | 37.76 | 10.37 | |
| 4209.48 | 25.13 | 51.75 | 23.12 | 36.67 | 40.21 | 23.12 | 41.12 | 31.47 | 27.41 | |
| 4210.33 | 23.26 | 50.32 | 26.43 | 33.40 | 40.17 | 26.43 | 56.96 | 30.38 | 12.66 | |
| 4210.97 | 22.64 | 54.72 | 22.64 | 36.20 | 41.16 | 22.64 | 51.18 | 37.45 | 11.37 | |
| 4211.25 | 22.94 | 55.27 | 21.79 | 30.04 | 48.17 | 21.79 | 64.90 | 23.65 | 11.45 | |
| 4211.82 | 21.60 | 54.52 | 23.88 | 29.51 | 46.62 | 23.88 | 65.51 | 26.79 | 7.71 | |
| 4212.45 | 27.25 | 46.63 | 26.12 | 28.46 | 45.42 | 26.12 | 79.80 | 4.25 | 15.96 | |
| 4212.97 | 21.02 | 55.75 | 23.23 | 28.10 | 48.67 | 23.23 | 62.99 | 25.20 | 11.81 | |
| 4213.57 | 25.69 | 56.88 | 17.43 | 41.29 | 41.28 | 17.43 | 44.44 | 37.79 | 17.77 | |
| 4214.57 | 23.88 | 53.27 | 22.85 | 30.43 | 46.73 | 22.85 | 64.85 | 21.50 | 13.65 | |
| 4215.63 | 10.24 | 55.62 | 34.14 | 13.51 | 52.35 | 34.14 | 58.95 | 24.21 | 16.84 | |
| 4847.08 | 25.48 | 32.49 | 42.04 | 26.12 | 31.84 | 42.04 | 73.15 | 2.47 | 24.38 | |
| 4849.51 | 22.39 | 41.98 | 35.63 | 36.89 | 27.48 | 35.63 | 41.39 | 39.30 | 19.31 | |
| 4850.39 | 23.53 | 48.59 | 27.88 | 49.46 | 22.66 | 27.88 | 31.71 | 52.43 | 15.86 | |
| 4851.06 | 26.44 | 45.23 | 28.33 | 48.06 | 23.61 | 28.33 | 37.33 | 44.98 | 17.68 | |
| 4851.46 | 23.63 | 49.24 | 27.13 | 51.86 | 21.01 | 27.13 | 27.00 | 54.43 | 18.56 | |
| 4851.61 | 25.21 | 45.85 | 28.94 | 48.65 | 22.41 | 28.94 | 30.70 | 48.19 | 21.11 | |
| 4852.37 | 21.00 | 45.01 | 33.99 | 39.01 | 27.00 | 33.99 | 38.44 | 46.18 | 15.38 | |
| 4853.27 | 20.88 | 37.36 | 41.76 | 33.18 | 25.06 | 41.76 | 44.05 | 37.08 | 18.88 | |
| 4853.55 | 20.10 | 44.49 | 35.41 | 41.62 | 22.97 | 35.41 | 32.19 | 51.72 | 16.09 | |
| 4853.87 | 20.32 | 47.34 | 32.33 | 44.57 | 23.09 | 32.33 | 29.02 | 54.40 | 16.58 | |
| 4854.44 | 24.35 | 40.57 | 35.07 | 41.55 | 23.38 | 35.07 | 42.20 | 41.38 | 16.41 | |
| 4854.56 | 22.37 | 45.41 | 32.22 | 46.31 | 21.48 | 32.22 | 34.79 | 51.69 | 13.53 | |
| 4855.35 | 22.41 | 40.92 | 36.67 | 38.89 | 24.44 | 36.67 | 47.15 | 42.38 | 10.48 | |
| 4853.27 | 20.88 | 37.36 | 41.76 | 33.18 | 25.06 | 41.76 | 44.05 | 37.08 | 18.88 | |
| X6 | 2158.50 | 19.00 | 47.00 | 34.00 | 22.09 | 38.37 | 39.53 | 54.55 | 42.42 | 3.03 |
| 2161.50 | 29.00 | 39.00 | 32.00 | 31.87 | 32.97 | 35.16 | 73.68 | 23.68 | 2.63 | |
| 2222.50 | 16.00 | 56.00 | 28.00 | 20.00 | 45.00 | 35.00 | 41.67 | 55.56 | 2.78 | |
| 2312.00 | 26.00 | 44.00 | 30.00 | 28.57 | 38.46 | 32.97 | 71.43 | 25.71 | 2.86 | |
| 2330.50 | 28.00 | 43.00 | 29.00 | 31.11 | 36.67 | 32.22 | 71.05 | 26.32 | 2.63 | |
| 2348.50 | 17.00 | 59.00 | 24.00 | 21.79 | 47.44 | 30.77 | 41.03 | 56.41 | 2.56 | |
| 2355.50 | 19.00 | 49.00 | 32.00 | 21.84 | 41.38 | 36.78 | 56.25 | 40.63 | 3.13 | |
| 2415.50 | 16.00 | 57.00 | 27.00 | 22.54 | 39.44 | 38.03 | 33.33 | 64.44 | 2.22 | |
| 2438.50 | 21.00 | 49.00 | 30.00 | 25.30 | 38.55 | 36.14 | 52.63 | 44.74 | 2.63 | |
| 2467.50 | 21.00 | 51.00 | 28.00 | 25.93 | 39.51 | 34.57 | 50.00 | 47.50 | 2.50 | |
| 2479.00 | 21.00 | 52.00 | 27.00 | 26.92 | 38.46 | 34.62 | 46.51 | 51.16 | 2.33 | |
| 2498.00 | 19.00 | 54.00 | 27.00 | 23.46 | 43.21 | 33.33 | 47.37 | 50.00 | 2.63 | |
| 2538.00 | 16.00 | 57.00 | 27.00 | 21.92 | 41.10 | 36.99 | 34.88 | 62.79 | 2.33 | |
| 2556.00 | 19.00 | 59.00 | 22.00 | 24.05 | 48.10 | 27.85 | 45.00 | 52.50 | 2.50 | |
| 2628.50 | 21.00 | 58.00 | 21.00 | 26.25 | 47.50 | 26.25 | 48.78 | 48.78 | 2.44 | |
| 2658.50 | 18.00 | 52.00 | 30.00 | 21.18 | 43.53 | 35.29 | 51.52 | 45.45 | 3.03 | |
| X8 | 2100.00 | 31.50 | 45.50 | 23.00 | 49.00 | 28.00 | 23.00 | 54.08 | 35.71 | 10.20 |
| 2103.00 | 26.00 | 49.00 | 25.00 | 50.00 | 25.00 | 25.00 | 41.00 | 48.00 | 11.00 | |
| 2161.00 | 26.00 | 48.00 | 26.00 | 44.00 | 30.00 | 26.00 | 52.27 | 40.91 | 6.82 | |
| 2176.00 | 26.00 | 47.00 | 27.00 | 44.00 | 29.00 | 27.00 | 45.45 | 40.91 | 13.64 | |
| 2180.00 | 30.50 | 43.50 | 26.00 | 49.00 | 25.00 | 26.00 | 47.96 | 37.76 | 14.29 | |
| XD1 | 2997.24 | 21.35 | 52.91 | 25.74 | 44.71 | 29.55 | 25.74 | 42.64 | 52.24 | 5.12 |
| 2998.94 | 13.29 | 50.27 | 36.44 | 22.83 | 40.73 | 36.44 | 46.95 | 41.78 | 11.27 | |
| 3001.27 | 9.40 | 49.22 | 41.39 | 13.87 | 44.74 | 41.39 | 48.39 | 32.26 | 19.35 | |
| 3004.89 | 19.23 | 53.15 | 27.62 | 39.23 | 33.15 | 27.62 | 42.25 | 50.99 | 6.76 | |
| 3084.44 | 14.55 | 68.73 | 16.72 | 49.83 | 33.44 | 16.72 | 25.17 | 70.81 | 4.03 | |
| 3085.25 | 14.50 | 69.67 | 15.83 | 50.83 | 33.33 | 15.83 | 24.59 | 71.48 | 3.93 | |
| 3085.80 | 21.27 | 51.83 | 26.89 | 24.21 | 48.90 | 26.89 | 75.76 | 12.12 | 12.12 | |
| 3088.50 | 24.09 | 56.58 | 19.33 | 56.13 | 24.54 | 19.33 | 39.74 | 57.09 | 3.18 | |
| 3091.85 | 22.12 | 59.45 | 18.43 | 61.09 | 20.48 | 18.43 | 33.52 | 63.80 | 2.68 |
| Well | Buried Depth (m) | Relative Content of Clay Minerals (%) | Mixed Layer Ratio (%) | Total Amount of Clay (%) | Well | Buried Depth (m) | Relative Content of Clay Minerals (%) | Mixed Layer Ratio (%) | Total Amount of Clay (%) | ||||||||
|---|---|---|---|---|---|---|---|---|---|---|---|---|---|---|---|---|---|
| S | I/S | I | K | C | I/S | S | I/S | I | K | C | I/S | ||||||
| XX1 | 4111.51 | 0 | 32 | 44 | 0 | 24 | 6 | 12.6 | MX3 | 1236.04 | 5 | 43 | 49 | 0 | 3 | 7 | 11.8 |
| 4111.75 | 0 | 19 | 47 | 0 | 34 | 10 | 9.9 | 1237.10 | 0 | 34 | 62 | 0 | 4 | 14 | 14.5 | ||
| 4112.11 | 0 | 11 | 72 | 0 | 17 | 12 | 21.3 | 1237.70 | 4 | 49 | 44 | 0 | 3 | 5 | 15.8 | ||
| 4112.64 | 0 | 26 | 54 | 0 | 20 | 5 | 12.1 | 1240.90 | 0 | 33 | 62 | 0 | 5 | 5 | 19.4 | ||
| 4112.99 | 0 | 7 | 80 | 0 | 13 | 9 | 22.4 | 1241.34 | 5 | 32 | 58 | 0 | 5 | 5 | 17 | ||
| 4113.65 | 0 | 15 | 69 | 0 | 16 | 10 | 16 | MX5 | 1932.67 | 0 | 18 | 66 | 0 | 16 | 11 | 10.9 | |
| 4114.16 | 0 | 30 | 61 | 0 | 9 | 10 | 18.1 | 1938.09 | 0 | 25 | 67 | 0 | 8 | 7 | 5.6 | ||
| 4114.82 | 0 | 32 | 42 | 0 | 26 | 12 | 21.8 | 2284.59 | 12 | 34 | 40 | 0 | 14 | 37 | 16.3 | ||
| 4115.27 | 0 | 25 | 58 | 0 | 17 | 8 | 12.7 | 2287.44 | 26 | 27 | 41 | 0 | 6 | 16 | 10.9 | ||
| 4115.60 | 0 | 22 | 51 | 0 | 27 | 5 | 10.8 | 2290.20 | 5 | 24 | 61 | 0 | 10 | 5 | 21.3 | ||
| 4115.72 | 0 | 11 | 62 | 0 | 27 | 7 | 15.4 | MX6 | 2324.36 | 29 | 34 | 31 | 0 | 6 | 10 | 14.1 | |
| 4116.04 | 0 | 51 | 31 | 0 | 18 | 14 | 13.3 | 2324.53 | 26 | 23 | 45 | 0 | 6 | 6 | 21.7 | ||
| 4116.34 | 0 | 38 | 41 | 0 | 21 | 15 | 12.3 | 2325.48 | 0 | 49 | 41 | 0 | 10 | 5 | 27.7 | ||
| 4207.72 | 0 | 10 | 40 | 0 | 50 | 10 | 6.9 | 2326.30 | 0 | 60 | 36 | 0 | 4 | 8 | 25.4 | ||
| 4208.32 | 0 | 9 | 35 | 0 | 56 | 8 | 6.6 | 2326.46 | 0 | 48 | 45 | 0 | 7 | 6 | 25 | ||
| 4209.04 | 0 | 5 | 55 | 0 | 40 | 8 | 18.5 | 2326.62 | 0 | 56 | 42 | 0 | 2 | 7 | 19.4 | ||
| 4209.52 | 0 | 18 | 36 | 0 | 46 | 21 | 10.7 | MX101 | 1105.90 | 0 | 49 | 44 | 0 | 7 | 7 | 28.2 | |
| 4210.43 | 0 | 26 | 22 | 0 | 52 | 8 | 10.7 | 1106.34 | 8 | 34 | 52 | 0 | 6 | 5 | 21.3 | ||
| 4210.97 | 0 | 13 | 39 | 0 | 48 | 14 | 6.6 | 1106.40 | 5 | 37 | 51 | 0 | 7 | 7 | 12.2 | ||
| 4211.18 | 0 | 9 | 37 | 0 | 54 | 8 | 15 | 1106.45 | 16 | 22 | 55 | 0 | 7 | 25 | 14.1 | ||
| 4211.82 | 0 | 20 | 46 | 0 | 34 | 8 | 29.9 | 1106.76 | 17 | 31 | 46 | 0 | 6 | 6 | 17.2 | ||
| 4212.32 | 0 | 29 | 18 | 0 | 53 | 9 | 24.5 | 1107.38 | 0 | 55 | 39 | 0 | 6 | 5 | 15.1 | ||
| 4212.93 | 0 | 17 | 35 | 0 | 48 | 12 | 11.9 | XD1 | 2997.40 | 0 | 39 | 55 | 0 | 6 | 9 | 9.7 | |
| 4213.57 | 0 | 23 | 19 | 0 | 58 | 5 | 8.2 | 2998.98 | 0 | 39 | 55 | 0 | 6 | 8 | 20.3 | ||
| 4214.61 | 0 | 23 | 30 | 0 | 47 | 8 | 8.3 | 3001.3 | 0 | 39 | 56 | 0 | 5 | 5 | 11.1 | ||
| 4215.68 | 0 | 17 | 58 | 0 | 25 | 9 | 32.6 | 3004.68 | 0 | 33 | 61 | 0 | 6 | 7 | 19.5 | ||
| 4847.08 | 0 | 9 | 84 | 0 | 7 | 11 | 42.5 | X6 | 2846.58 | 0 | 48 | 37 | 0 | 15 | 55 | 11.3 | |
| 4849.23 | 0 | 5 | 72 | 0 | 23 | 12 | 6.6 | 2852.85 | 0 | 50 | 36 | 9 | 5 | 55 | 15.4 | ||
| 4850.46 | 0 | 4 | 78 | 0 | 18 | 13 | 15.9 | 2854.88 | 0 | 39 | 39 | 9 | 13 | 60 | 10.1 | ||
| 4851.00 | 0 | 16 | 73 | 0 | 11 | 9 | 7.4 | 2883.06 | 0 | 41 | 37 | 13 | 9 | 50 | 35.6 | ||
| 4851.39 | 0 | 24 | 53 | 0 | 23 | 7 | 10.7 | 2936.99 | 0 | 41 | 45 | 0 | 14 | 40 | 63.4 | ||
| 4851.68 | 0 | 4 | 64 | 0 | 32 | 10 | 7.7 | 2939.25 | 0 | 45 | 39 | 0 | 16 | 60 | 19.7 | ||
| 4852.40 | 0 | 18 | 69 | 0 | 13 | 13 | 9.2 | 2943.15 | 0 | 53 | 34 | 7 | 6 | 55 | 14.2 | ||
| 4853.37 | 0 | 2 | 80 | 0 | 18 | 10 | 4.1 | 2945.18 | 0 | 47 | 40 | 0 | 13 | 55 | 21.7 | ||
| 4853.91 | 0 | 3 | 79 | 0 | 18 | 11 | 13 | LQ3 | 2165.25 | 0 | 37 | 54 | 0 | 9 | 6 | 17 | |
| 4854.38 | 0 | 11 | 82 | 0 | 7 | 10 | 16.6 | 2166.27 | 0 | 39 | 47 | 0 | 14 | 7 | 14.8 | ||
| 4854.62 | 0 | 19 | 69 | 0 | 12 | 14 | 15.2 | 2167.48 | 0 | 29 | 62 | 0 | 9 | 9 | 46.5 | ||
| 4855.30 | 0 | 11 | 76 | 0 | 13 | 5 | 15.9 | 2903.79 | 0 | 31 | 56 | 0 | 13 | 6 | 14.7 | ||
| MX3 | 1025.10 | 0 | 39 | 54 | 0 | 7 | 8 | 14.5 | 2904.28 | 0 | 33 | 57 | 0 | 10 | 5 | 20.7 | |
| 1031.05 | 0 | 32 | 61 | 0 | 7 | 9 | 9.9 | 2905.88 | 0 | 26 | 65 | 0 | 9 | 6 | 44.7 | ||
| 1031.93 | 0 | 38 | 53 | 0 | 9 | 9 | 12.1 | Average | 2.0 | 28.4 | 51.6 | 0.5 | 17.6 | 13.7 | 17.1 | ||
| Tectonic Setting | Oceanic Island Arc | Continental Island Arc | Active Continental Margin | Passive Margins | XX1 (n = 34) |
|---|---|---|---|---|---|
| Th (×10−6) | 2.27 ± 0.7 | 11.1 ± 1.1 | 18.8 ± 3.0 | 16.7 ± 3.5 | 5.69 (2.20–13.15) |
| U (×10−6) | 1.09 ± 0.21 | 2.53 ± 0.24 | 3.90 ± 0.5 | 3.20 ± 0.8 | 2.99 (0.79–10.75) |
| Hf (×10−6) | 2.1 ± 0.6 | 6.3 ± 2.0 | 6.8 | 10.1 | 3.62 (1.61–8.85) |
| Rb/Sr | 0.05 ± 0.05 | 0.65 ± 0.33 | 0.89 ± 0.24 | 1.19 ± 0.4 | 0.60 (0.03–1.170 |
| Th/U | 2.1 ± 0.78 | 4.6 ± 0.45 | 4.8 ± 0.38 | 5.6 ± 0.7 | 2.72 (1.22–5.27) |
| La/Y | 0.48 ± 0.12 | 1.02 ± 0.07 | 1.33 ± 0.09 | 1.31 ± 0.26 | 1.40 (0.90–1.83) |
| La/Sc | 0.55 ± 0.22 | 7.82 ± 0.3 | 4.55 ± 0.8 | 6.25 ± 1.35 | 4.20 (2.39–6.70) |
| Th/Sc | 0.15 ± 0.13 | 0.85 ± 0.13 | 2.59 ± 0.5 | 3.06 ± 0.8 | 1.75 (0.48–4.76) |
| Tectonic Settings | Provenance Type | REE | ||||||
|---|---|---|---|---|---|---|---|---|
| La (×10−6) | Ce (×10−6) | ∑REE (×10−6) | La/Yb | LaN/YbN | ∑LREE /∑HREE | Eu/Eu* | ||
| Oceanic island arc | Undissected Magmatic arc | 8 ± 1.7 | 19 ± 3.7 | 58 ± 10 | 4.2 ± 1.3 | 2.8 ± 0.9 | 3.8 ± 0.9 | 1.04 ± 0.11 |
| Continental island arc | Dissected magmatic arc | 27 ± 4.5 | 59 ± 8.2 | 146 ± 20 | 11.0 ± 3.6 | 7.5 ± 2.5 | 7.7 ± 1.7 | 0.79 ± 0.13 |
| Andean-type continental margin | Uplifted basement | 37 | 78 | 186 | 12.5 | 8.5 | 9.1 | 0.60 |
| Passive margins | Craton interior tectonic highlands | 39 | 85 | 210 | 15.9 | 10.8 | 8.5 | 0.56 |
| XX1 | / | 19.7 | 35.6 | 88.5 | 13.1 | 8.9 | 8.19 | 0.75 |
© 2020 by the authors. Licensee MDPI, Basel, Switzerland. This article is an open access article distributed under the terms and conditions of the Creative Commons Attribution (CC BY) license (http://creativecommons.org/licenses/by/4.0/).
Share and Cite
Sun, G.; Wang, M.; Guo, J.; Wang, Y.; Yang, Y. Geochemical Significance of Clay Minerals and Elements in Paleogene Sandstones in the Center of the Northern Margin of the Qaidam Basin, China. Minerals 2020, 10, 505. https://doi.org/10.3390/min10060505
Sun G, Wang M, Guo J, Wang Y, Yang Y. Geochemical Significance of Clay Minerals and Elements in Paleogene Sandstones in the Center of the Northern Margin of the Qaidam Basin, China. Minerals. 2020; 10(6):505. https://doi.org/10.3390/min10060505
Chicago/Turabian StyleSun, Guoqiang, Meng Wang, Jiajia Guo, Yetong Wang, and Yongheng Yang. 2020. "Geochemical Significance of Clay Minerals and Elements in Paleogene Sandstones in the Center of the Northern Margin of the Qaidam Basin, China" Minerals 10, no. 6: 505. https://doi.org/10.3390/min10060505
APA StyleSun, G., Wang, M., Guo, J., Wang, Y., & Yang, Y. (2020). Geochemical Significance of Clay Minerals and Elements in Paleogene Sandstones in the Center of the Northern Margin of the Qaidam Basin, China. Minerals, 10(6), 505. https://doi.org/10.3390/min10060505