Article

Effects of Composition, Pressure, and Temperature on the Elastic Properties of SiO2–TiO2 Glasses: An Integrated Ultrasonic and Brillouin Study

by
Murli H. Manghnani
1,*,
Quentin Williams
2,
Teruyuki Matsui
3,
Peter C. Schultz
4 and
Charles R. Kurkjian
5
1
Hawai’i Institute of Geophysics and Planetology, University of Hawai’i, Honolulu, HI 96822, USA
2
Department of Earth and Planetary Sciences, University of California, Santa Cruz, CA 95064, USA
3
Knowledge Outsourcing Co., Inc., 46-001 Nagoya, Japan
4
Peter Schultz Consulting LLC, 1 Evarts Lane, Madison, CT 06443, USA
5
Department of Materials Science and Engineering, Rutgers University, Piscataway, NJ 08855, USA
*
Author to whom correspondence should be addressed.
Minerals 2020, 10(5), 481; https://doi.org/10.3390/min10050481
Submission received: 2 April 2020 / Revised: 17 May 2020 / Accepted: 18 May 2020 / Published: 25 May 2020
(This article belongs to the Special Issue Mineral Physics—In Memory of Orson Anderson)

Abstract

:
We have systematically investigated the elastic properties (ρ, VP, VS, K, μ and σ) of eight SiO2–TiO2 glasses, varying in composition from 1.3 to 14.7 wt% TiO2, as a function of pressure up to 0.5 GPa by the pulse superposition (PSP) ultrasonic technique, and two compositions (1.3 and 9.4 wt% TiO2) up to ~5.7 GPa by Brillouin scattering in a diamond anvil cell. The parameters were also measured after annealing to 1020 °C. Composition–elasticity relationships, except for K and σ, are more or less linear; the annealing simply makes the relationships more uniform (less scatter). There is excellent agreement between the ultrasonic and Brillouin measurements at ambient and high pressure. The pressure-induced anomalous elastic behavior (negative dVP/dP and dK/dP) becomes more negative (more compressible) with the increasing TiO2 content. Correspondingly, the acoustic Grüneisen parameters become more negative with increases in the TiO2 content, reaching a minimum near ~8–10 wt% TiO2. The comparison of the low- and high-pressure ultrasonic and Brillouin VP and VS in two glasses (1.3 and 9.4 wt% TiO2) shows excellent agreement, defining the reversible elastic behavior at low pressures and irreversible behavior at higher pressures (≥5.7 GPa) well. This result is consistent with our previous high-pressure Raman study showing an irreversible structural change in a similar pressure range.

1. Introduction

Interest in the SiO2–TiO2 glass system has continued to develop in view of its low thermal expansion properties and the ability to tune the coefficient of thermal expansion over wide ranges of temperature by varying compositions (TiO2 content) and/or annealing. SiO2–TiO2 glasses containing up to ~11 wt% TiO2 have been synthesized as apparently single homogeneous phases [1,2,3]. At relatively modest TiO2 concentrations (>~3 wt%), TiO2 plays the role of a network former just as SiO2 does; thus, like Si, Ti is tetrahedrally coordinated with oxygen. A SiO2–TiO2 glass (ULE®, Corning Code 7971) containing about 7.5 wt% TiO2 has been demonstrated to have a nearly zero thermal expansion [4,5] in the temperature range of 0 to 300 °C. It has been shown [6,7,8] that moderate amounts of TiO2 (up to 10 wt%) added to fused silica cause a systematic and linear decrease in the coefficient of thermal expansion of silica glass. Such composition-dependent variations in the thermal expansion of SiO2–TiO2 glasses have been plausibly correlated with changes in the structure and lattice vibrations in the glass network [6,9]. Schultz [7,8] successfully synthesized SiO2–TiO2 glasses containing higher TiO2 contents (up to 16.5 wt%) that were clear, and demonstrated unique annealing methods for developing the low-expansion properties of such glasses, containing even up to 20 wt% TiO2, across wider ranges of temperature. The synthesized glasses with relatively high TiO2 contents (16.5–20.0 wt%) were not, however, fully transparent due to phase separation and the presence of crystalline phases of TiO2 (rutile/anatase).
A number of investigators [10,11,12,13,14,15,16,17,18,19,20,21,22,23,24] have studied the effects of TiO2 content on the various physical, thermal, elastic and optical properties of SiO2–TiO2 and other related glasses, such as those in the system Na2O–TiO2–SiO2. Some of these studies [10,11] have thrown light on the roles of the structure and coordination of Ti and Si ions in the variations of glass properties. The infrared reflection and Raman scattering studies [23,25,26] on SiO2–TiO2 glasses have enabled an elucidation of the structural variations caused by the addition of TiO2 to SiO2.
The purpose of this paper is to report more extensive information on the elastic properties of SiO2–TiO2 glasses as a function of composition, annealing, pressure and temperature, and to correlate the results, in light of a structural model, with the variations in thermal expansion and other related anharmonic parameters. The pressure dependences of the ultrasonic elastic moduli of the glasses reported here have been described recently [24], but primarily in the context of possible coordination changes in TiO2 at low titania concentrations. Here, we probe the behavior of the system on annealing, and particularly focus on the acoustic Grüneisen parameters and the minimal anelastic behavior in this system at frequencies exceeding the MHz range via a comparison of new Brillouin data with the ultrasonic measurements.

2. Materials and Methods

The eight SiO2–TiO2 glasses used in this study were prepared by the flame hydrolysis boule process [6,7,8] at the Corning Glass Works laboratory. The TiO2 content of the glasses ranged from 1.3 to 14.7 wt% (Table 1). Further, a fused silica sample obtained from the Corning Glass Works (Corning Code 7940) is included in this study. The preparation of these glasses has been described in detail previously [6,8]. Briefly, compositions were determined by X-ray fluorescence, with net uncertainties in the compositions of ±0.03 wt% [8]. The abundance of Ti3+ in these glasses was minimal; prior to annealing, the abundance was estimated as ~10 ppm [8], and after annealing, the glasses became entirely water-white, implying that the amount of Ti3+ was negligible [8].

2.1. Density and Ultrasonic Measurements

The density of the glass specimens was measured by the Archimedes method, using distilled water. The density and velocity measurements were made on the glasses both in an “as received, unannealed state,” as well as after annealing. The annealing process involved heating the glasses to 1020 °C for about 1–1/2 h, and then cooling them slowly from 1020 to 700 °C at a rate of 5 °C/h, and then allowing them to cool inside the furnace from 700 °C to room temperature.
The ultrasonic velocities were measured by the pulse super-position method at pressures up to 0.5 GPa [19,24]. Samples of the acoustic path length of about 1 cm were employed. The two faces of the sample were lapped flat within about 1 µm and parallel to within about 30 s of the arc. X- and Y-cut 20 MHz quartz transducers, 0.63 cm in diameter, were used for the compressional and shear wave velocity measurements, respectively. The details of the electronics and high-pressure and temperature equipment used, and the procedure to reduce the basic pulse repetition frequency data to obtain the elastic moduli are described elsewhere [19,24]. Briefly, Cook’s [27] method (Equation (1)), which solves for the high-pressure density (ρ) at the pressure (P) from the adiabatic bulk modulus ( K S ) corrected to isothermal conditions (using Δ, which is equal to αγT, the product of the thermal expansion, Grüneisen parameter and temperature), was used to iteratively solve for the density under pressure at progressive intervals of 0.0275 GPa.
ln ( ρ / ρ 0 ) = ( 1 + ) P 0 P d P / K S
The precision of the frequency (f) measurements is ~ 1 part in 105. The phase angle correction, γ/360 f, due to the bond between the transducer and the specimen, is negligible (γ does not exceed 2° for a well-prepared bond) and was ignored. The errors in the ultrasonic velocity values reported here are between 0.05% and 0.14%; incorporating the errors in density, our uncertainties on the derived moduli are less than 0.24%. The pressure derivatives of the moduli were calculated from a combination of fits to the velocities and the iteratively-derived densities from Equation (1) [24].

2.2. Brillouin Scattering Measurements

The Brillouin scattering technique was used by deploying a 5-pass Fabry–Pérot interferometer (Sandercock design) coupled with an Ar+-ion laser (at 100 mW power) for the excitation of the approximately 120 μm diameter sample. Measurements of the acoustic velocities were conducted at an ambient pressure and up to ~7.5 GPa in a diamond anvil cell. The apparatus and methodology are described elsewhere [28]: briefly, the modified platelet geometry approach was deployed with a ~20° external scattering angle, with the angle chosen to optimize the signal. A collection time of 45 min was used for each Brillouin data point. Diamond anvils with 0.8 mm size culets and a T301 stainless steel gasket were used, with a 4:1 methanol/ethanol mixture as the pressure medium. The ruby fluorescence technique was used for the in situ pressure measurements. Due to the relative sharpness and amplitude of the peaks, the compressional velocities were more accurately determined than the shear velocities in these experiments, with estimated accuracies of ±0.4–0.7% for the compressional velocities and ±0.8–1.5% for the shear velocities. The shear velocity error was somewhat larger than the compressional velocity because the lower amplitude of the shear peak generated a smaller signal-to-noise ratio relative to the strong and sharp compressional peak.

3. Results and Discussion

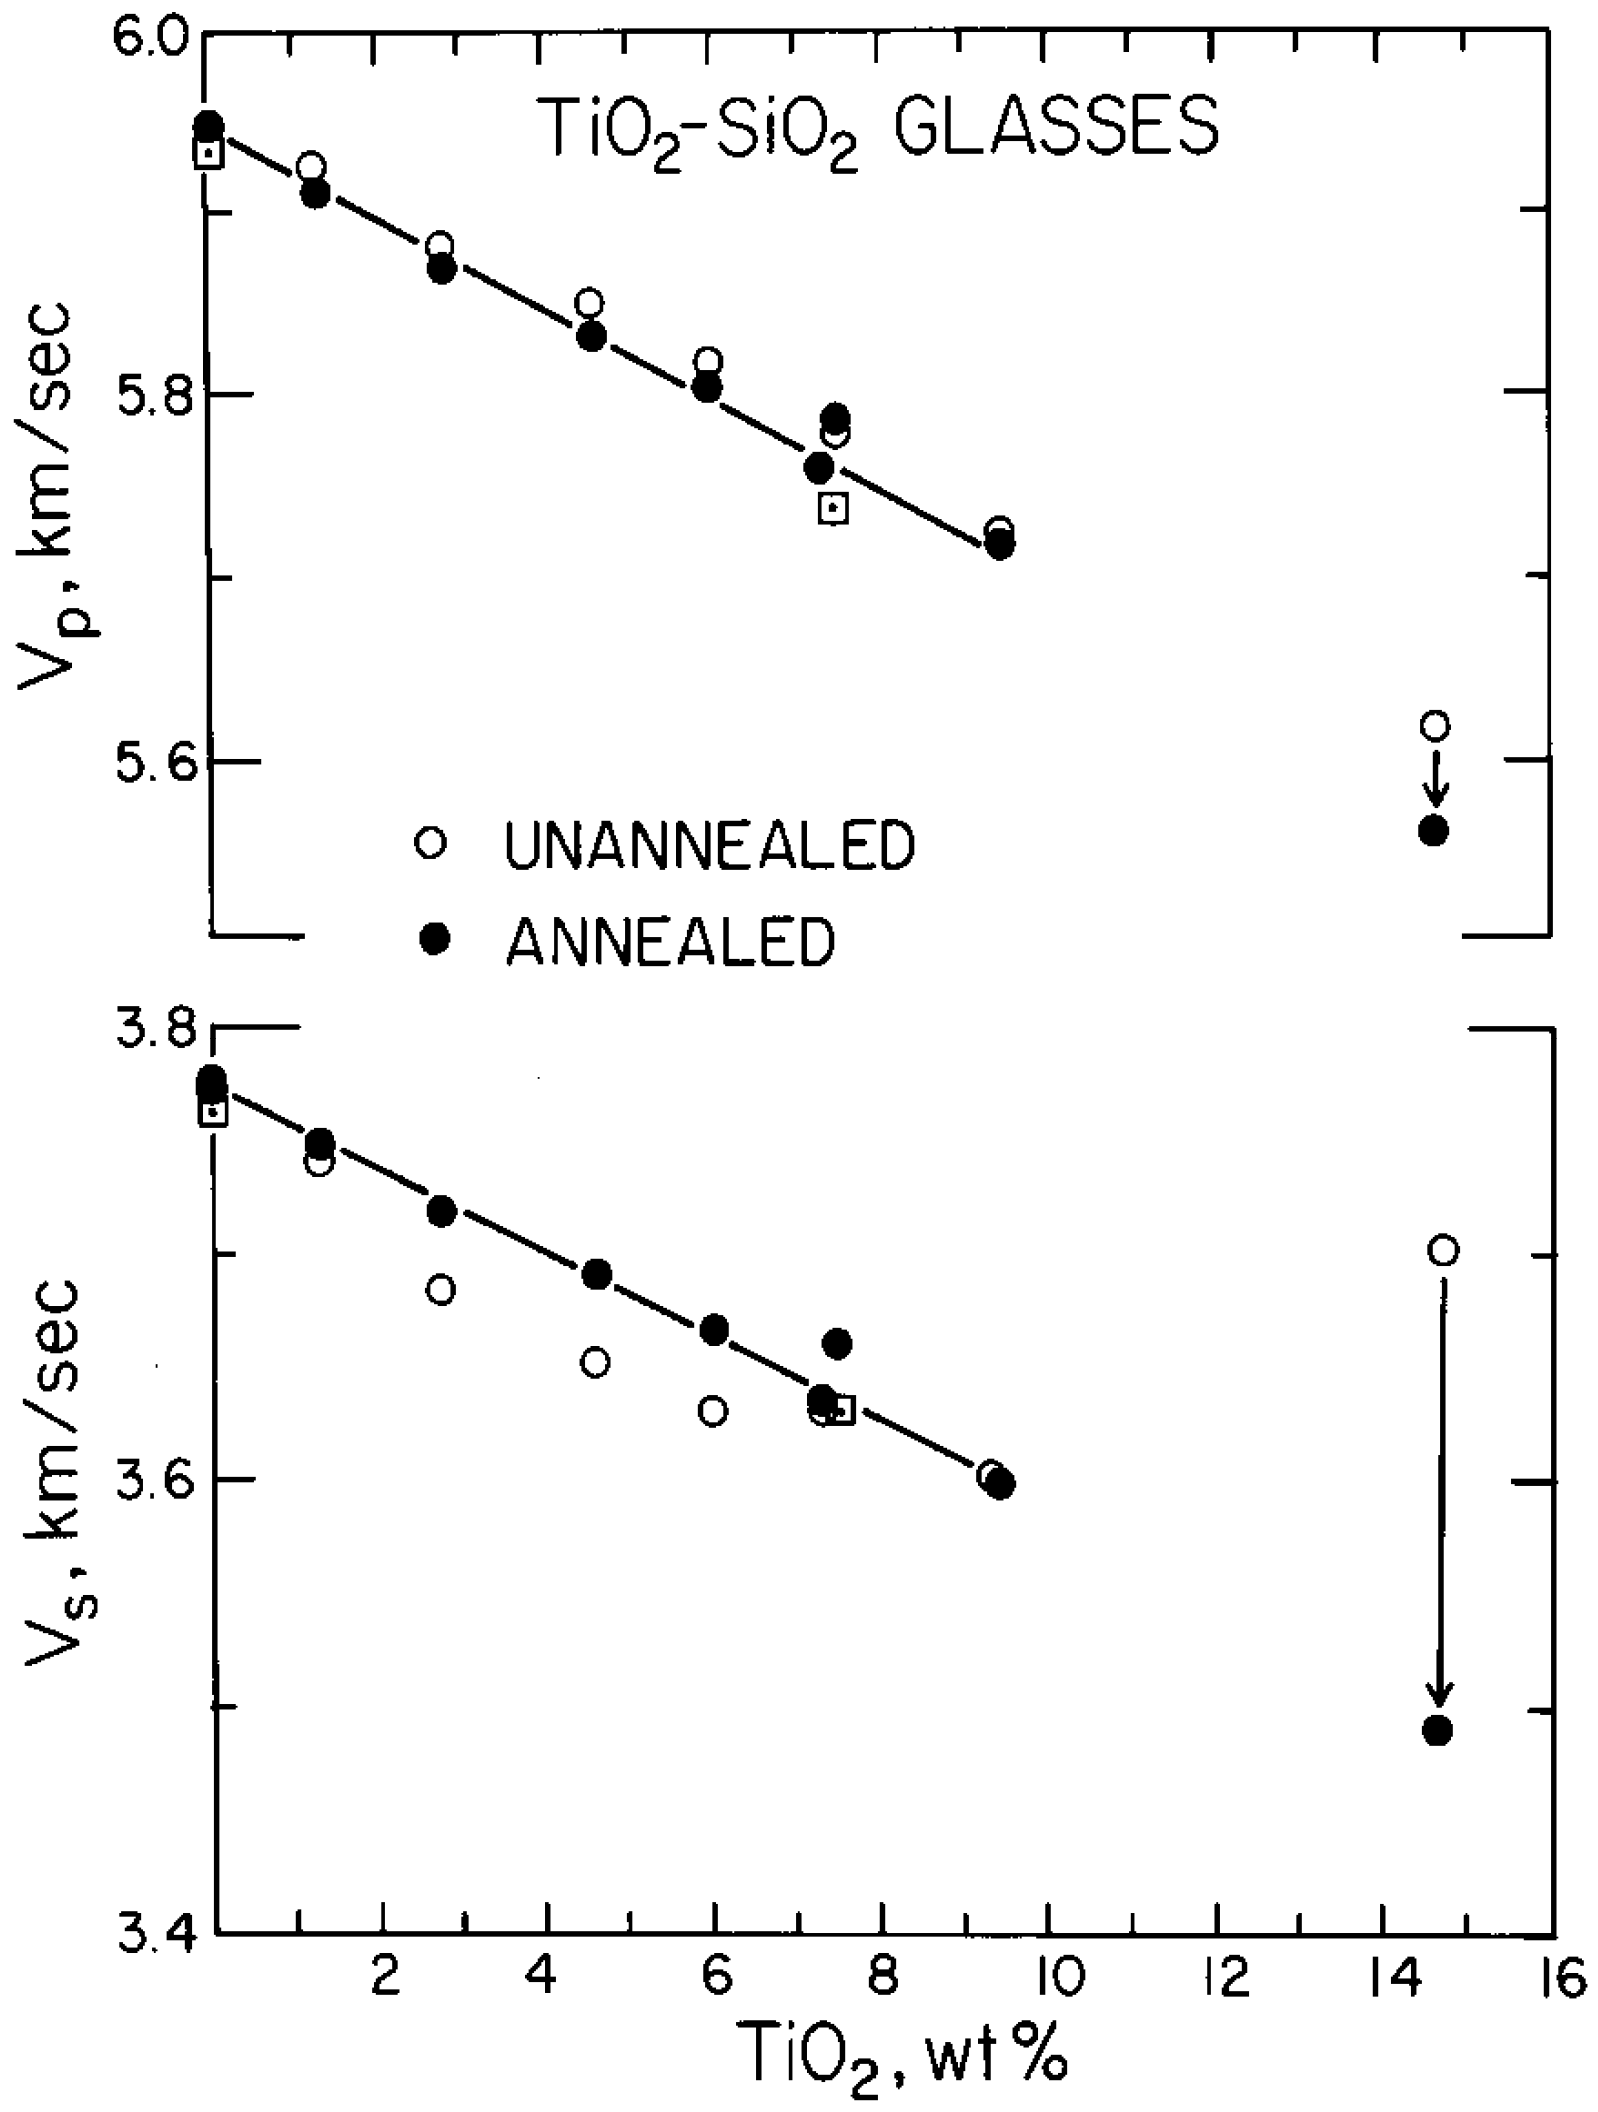
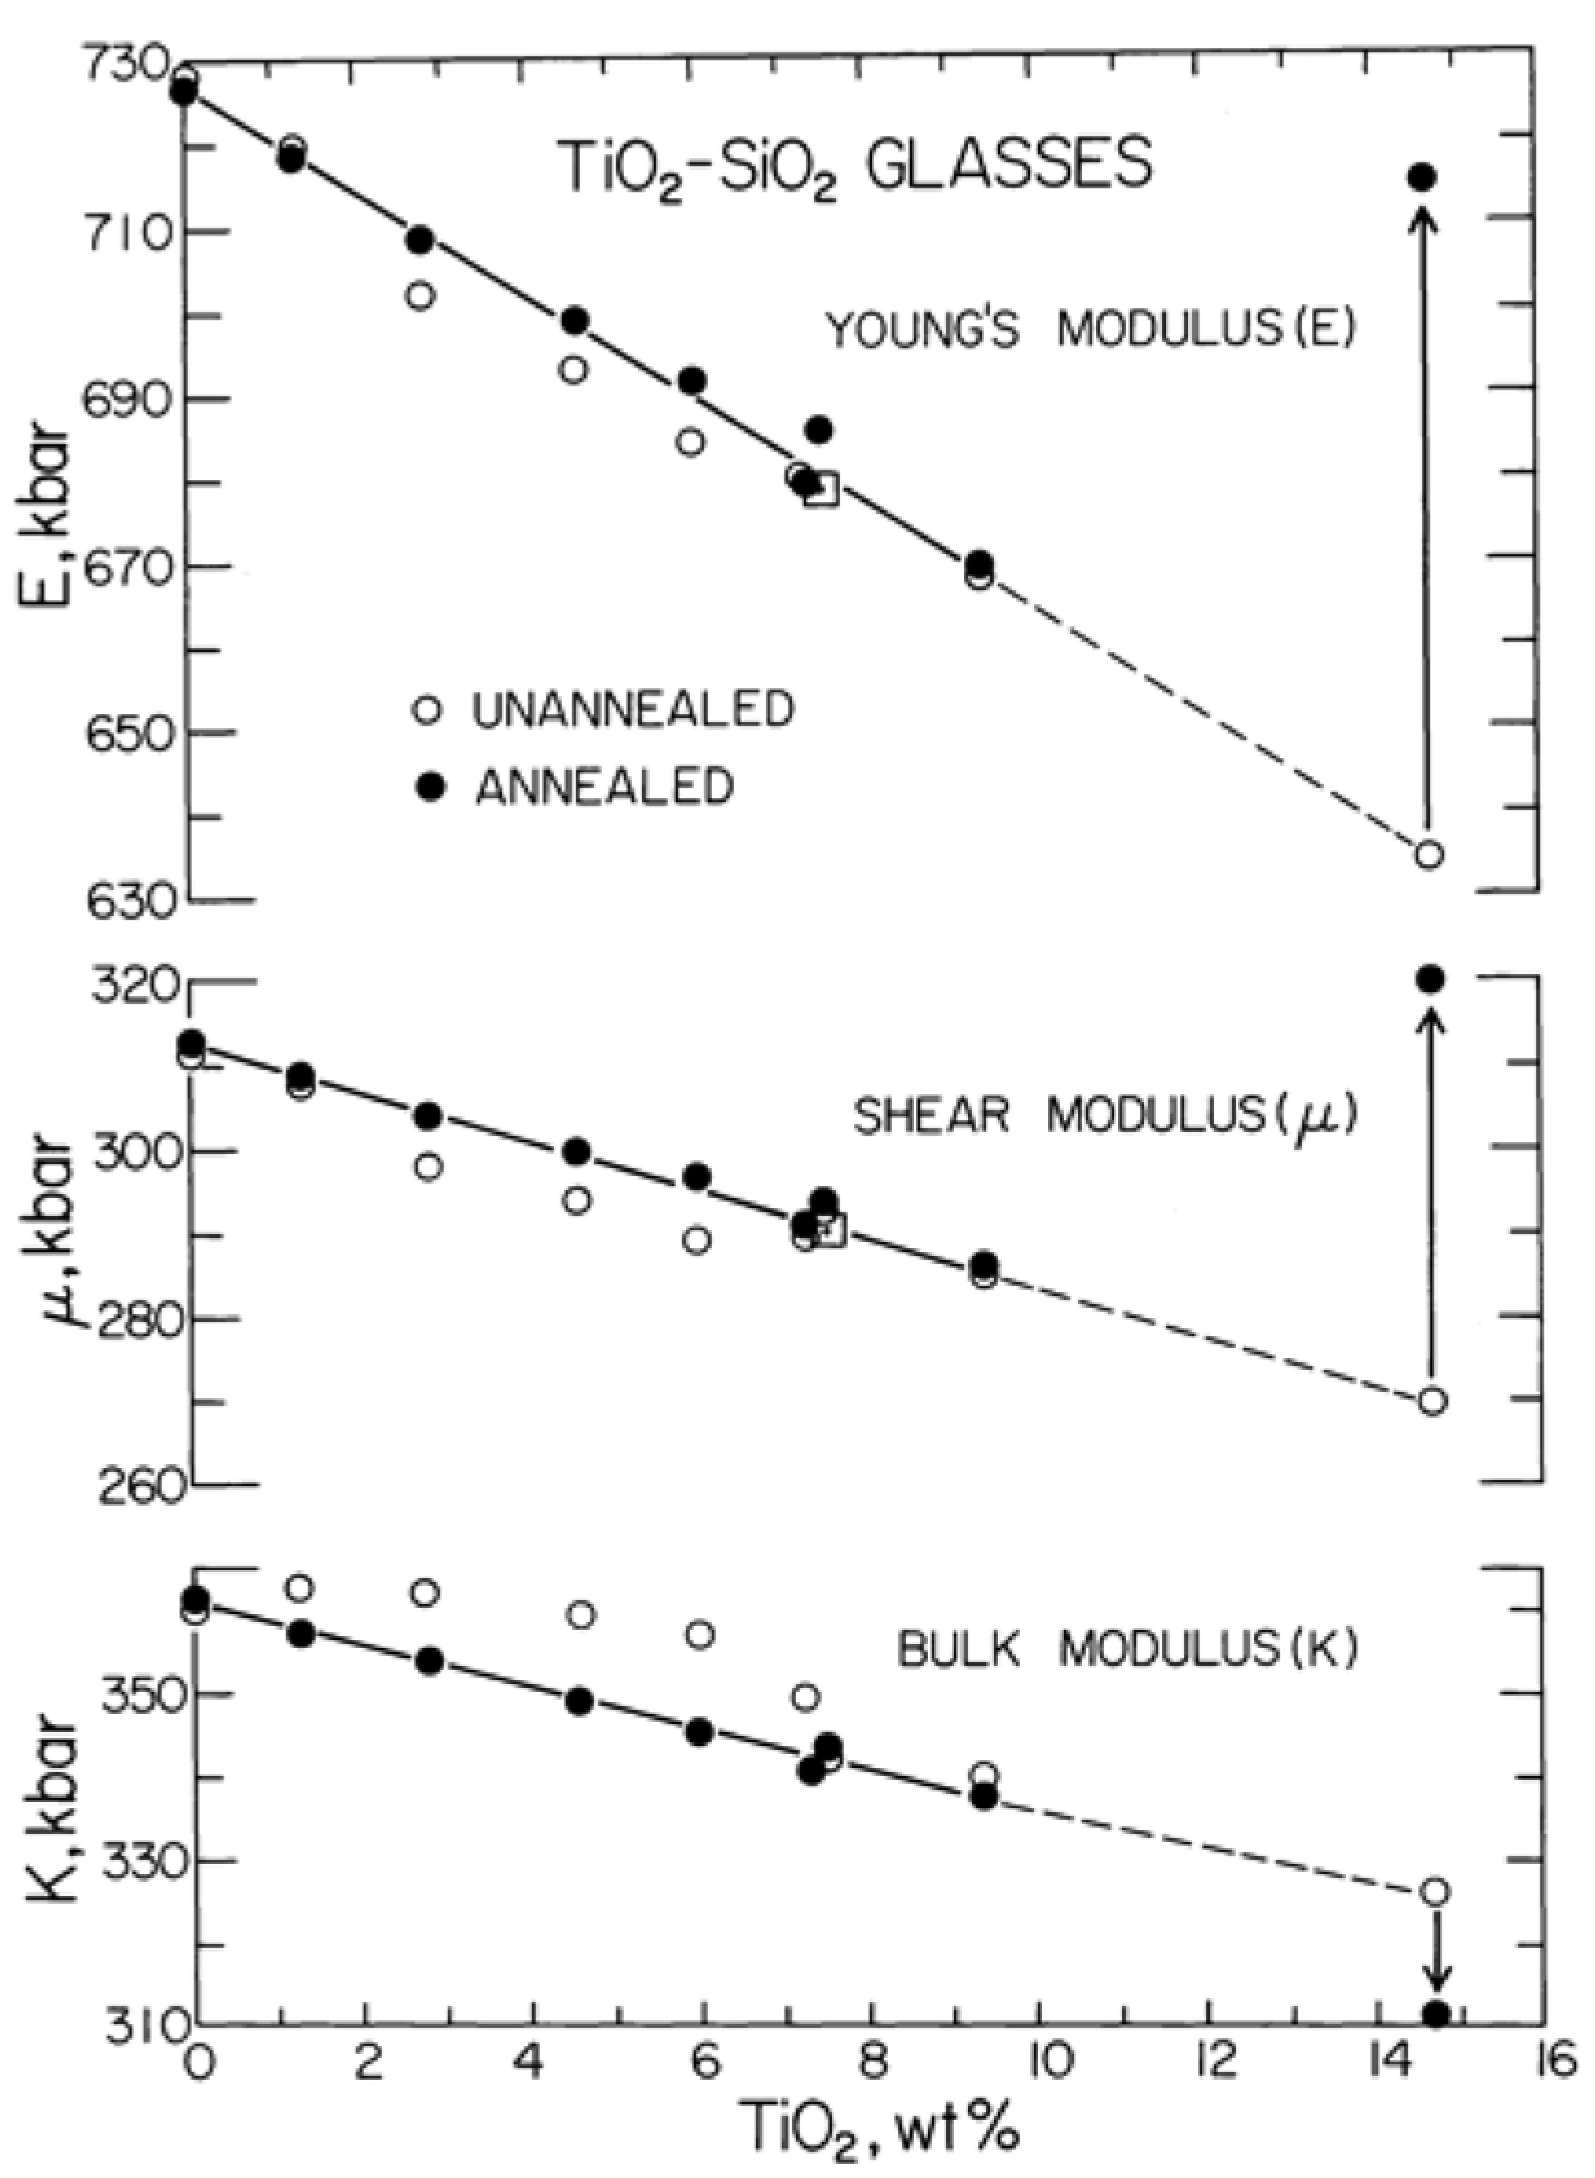
3.1. Elastic Parameters at 1 bar and 25 °C

(A) Effect of composition and annealing. The composition and measured elastic parameters of SiO2–TiO2 glasses, including fused silica (Corning Glass Works Code 7940), are listed in Table 1. The data for fused silica and the ULE® SiO2–TiO2 glass (Corning Code 7971) containing 7.5 wt% TiO2 are in good agreement with the previous measurements of McSkimin and Andreatch [29] and the published Corning Glass Works specification [3], but in less good agreement with those of Gerlich et al. [30] The density and bulk moduli values reported by Gerlich et al. for these glasses are appreciably lower. For end-member fused silica, our results are in good accord with previous ultrasonic and Brillouin results at 300 K [30,31,32]. Notably, there are variations in the reported values of the velocity in fused silica of up to ~50 m/sec in compressional velocity [33], but velocities are known to vary depending on the thermal history/fictive temperature of the glass [34].
The compositional dependence of the compressional (Vp) and shear (Vs) velocities, density (ρ), Poisson’s ratio (σ), and bulk, shear and Young’s moduli (K, μ and Ε, respectively) for these glasses are shown in Figure 1, Figure 2 and Figure 3. The relations between the TiO2 content and the elastic parameters, particularly K and σ, are not as uniform and systematic for the unannealed glasses as for the annealed glasses.
As a result of annealing, the relations between the TiO2 content and the elastic parameters become uniform and more or less linear for glasses containing up to 9.4% TiO2 (Figure 1, Figure 2 and Figure 3). The interesting aspect here is that the effect of annealing, which plausibly equilibrated the glasses closer to their glass transition temperature, Tg, has the effect of increasing the density of the glasses while lowering their compressional wave velocities, while also eliminating the unusually complex behavior of Poisson’s ratio, σ, observed in the unannealed samples (Figure 2). Indeed, while the bulk moduli are greater in the unannealed samples, the shear moduli are substantially less (Figure 3), producing the anomalous behavior in the Poisson’s ratio of these samples. The origin of the higher bulk moduli of the unannealed samples is not simple to explain: it is possible that there is a complex interplay between the internal strains and compressibility. Moreover, the lower density/higher temperature of the equilibration of the unannealed samples generates a substantial weakening of the shear modulus, implying that the lower density of the unannealed glasses has a particularly strong effect on the shear modulus. An explanation for these observations is that annealing causes the removal of strains and the rearrangement of the glass network such that the structure becomes more compact. This compaction effect of annealing, in particular, is dramatic in SiO2–TiO2 glass (T 7) containing 14.7 wt% TiO2 and, in contrast to the lower Ti-content glasses, results in increases in ρ, µ and E, but decreases in Vp, Vs, σ and K. Optical evidence shows that the annealing of the 14.7 wt% glass generates the unmixing of the glass and crystallization of TiO2, and hence the elastic results on this phase represent that of a two-phase aggregate. This unmixing is in full accord with the analysis that such high TiO2 glasses are highly metastable and prone to unmixing to a crystalline TiO2 phase and a coexisting glass at temperatures beneath the annealing point and as low as 750 °C [8]. The compaction effect in the T7 glasses may be related to an annealing-induced partial coordination change of Ti ions from four to six in the glass structure at high Ti contents. This reasoning is consistent with the infrared reflection [23] and Raman studies [23,25,26]. For the annealed glasses containing up to 9.4% TiO2, the parameters, Vp, Vs, K, µ and E decrease linearly with the increase in the TiO2 content; however, increases linearly with the TiO2 content.
The decreases in the moduli are certainly caused by the weakening of the silica network. The Ti4+ ions have a lower field strength than the Si4+ ions, and the average length of the Ti–O bonds is larger than those of the Si–O bonds; hence, the Ti–O and Si–O–Ti bonds in SiO2–TiO2 glasses are weaker than the corresponding Si–O and Si–O–Si bonds in endmember silica glass. This view has been supported by infrared absorption studies [9,26].
The density of the glasses is particularly interesting in this respect: despite the larger mass of Ti, the effect of the increased Ti content is to weakly lower the density of these glasses.
Hence, the decrease in with the increasing TiO2 content (Figure 2) seems, at first, surprising in view of the fact that the substituted Ti4+ ions are heavier than the Si4+ ions. In crystalline silica, Evans [1] clearly demonstrated that the additions of small amounts of TiO2 to the SiO2–TiO2 solid solution (cristobalite phase) cause the tetragonal ao and co d-spacings of this phase to increase. Such an effect is consistent with the observed trend in the density of the SiO2–TiO2 glasses. A decrease in density can thus be viewed as being due to the increasing openness of the structure as TiO2 is added: while Ti may be present five-fold in coordination at low concentrations (below ~3 wt%), and four-fold at higher concentrations [24], it appears that the net effect of both larger Ti ions and potentially weaker polyhedral linkages for more highly coordinated species may each contribute to the unexpected decrease in density. The openness of the structure can also increase if the Si–O–Ti angles increase. This is exactly what is concluded from the optical studies [23,26].

3.2. Densification

The pressure density data for a solid can be used for calculating its bulk modulus, Ko and initial pressure derivative K’o = (∂K/∂P)P = 0 through the Birch–Murnaghan equation of state [35]:
P = (3/2 Ko {(ρo/ρ)7/3 − (ρo/ρ)5/3} {1 − ξ [(ρo/ρ)2/3 − 1]}
where ξ = 3(4 − K’o)/4. Correspondingly, if Ko and K’o are known, (ρ/ρo) can be evaluated as a function of pressure.
Using Equation (1) and the data for fused silica and the SiO2–TiO2 glasses containing 7.3 wt% TiO2 (Table 2), (ρ/ρo) was calculated as 6 GPa (Figure 4) using our elasticity data. Here, we deployed our values of the bulk modulus and its pressure derivative to calculate the relative densities: due to the importance of the bulk modulus in determining the compression curve in this pressure range, higher order derivatives do not notably impact the density offset between the two phases. Values of the derivative parameters in Table 2 are derived from the initial (zero-pressure) slopes of the respective elastic parameters (Figure 2 and Figure 3). As shown in Figure 4, the glass containing TiO2 shows higher densification (ρ/ρo) under pressure, as anticipated from the lower bulk modulus of this material. At 2 GPa, the difference between the (ρ/ρo) ratios is expected to be ~7%. Thus, despite the almost identical initial densities of the two glasses (differing by ~0.1% at ambient pressures: Figure 2, top), the effect of pressure is to produce markedly higher densities for the Ti-bearing glass under pressure. The net result that a glass that contains more of a more massive cation is comparable in density to silica at an ambient pressure but becomes denser at a high pressure (as anticipated from its higher mean atomic number) illustrates that the initial structural role of Ti is to expand the overarching Si-dominated network in these glasses, but this Ti-induced expansion of the glass network is reduced under pressure.

3.3. Comparison between Ultrasonic and Brillouin Measurements

A representative Brillouin spectrum from these results, using an apparatus described elsewhere [29], is shown in Figure 5, and Table 3 compares the Brillouin scattering results on two of these glasses within the diamond anvil cell with the lower pressure ultrasonic data. Figure 6 shows the elastic results under pressure from the two techniques. Clearly, on this scale, the two sets of results are in outstanding agreement. The larger pressure range of the Brillouin results reveals the well-known velocity minima occurring under compression in silica-rich glasses, and shows that the minima both shift to slightly higher pressures and the amplitude of the depression increases with higher TiO2 contents. The pressure at which such minima occur has generally been correlated with the degree of polymerization of the glass [36], and the possible implication here thus might be that progressively more Ti enrichment may induce a greater polymerization of glasses. We speculate that it is more likely that the role of increased Ti is rather to broaden the average T–O–T (tetrahedral cation-oxygen-tetrahedral cation) angles in the glass relative to pure silica, producing a broader pressure range over which these angles may undergo a relatively easy contraction (and softening) of the glass [37].
While Table 3 shows generally excellent agreement between the Brillouin and ultrasonic data sets, there is a small but systematic offset between the two sets of the velocity determinations. Table 3 shows the relative ambient pressure velocities determined within each glass and the offset between the optical and ultrasonic measurements. Here, the Brillouin measurements are observed to yield average compressional velocities higher by ~0.15% relative to the ultrasonic results. Although these velocity differences are small and close to the sums of the respective errors of the two measurements (and, with the less-well determined Brillouin shear velocities, the average velocities are within error), their average sign is in accord with the possible presence of dispersive effects. Notably, the two sets of measurements differ in the frequency of their probes by between a factor of ~450–750, or approaching three orders of magnitude. The average magnitude of difference for compressional velocities is roughly comparable to the ~0.2–0.3% difference across a factor of a ~7 larger frequency range that is observed in silica glass at 300 K [38], and our results thus indicate that weak dispersive effects might be present at ambient temperatures in Brillouin measurements in silica-rich glasses. The origin of these dispersive effects has been proposed to be via anharmonic interactions with localized vibrational states (termed “network viscosity” in [38]), although tunneling between nearly energetically equivalent local structural configurations could also play a significant role [38,39]. If the latter effect predominates, higher temperatures could produce a greater offset between the Brillouin and ultrasonic results in glassy materials, which could produce noticeable discrepancies between highly accurate experiments deploying these respective techniques.
Figure 6 also shows results on decompression from compression to near 6 GPa: this pressure has been previously identified from Raman results as the pressure at which irreversible structural changes within these glasses take place [37]. Such irreversibility is well-documented in silica glass, with the onset of irreversible densification occurring near 9 GPa [40,41]: our results indicate that the onset of irreversible densification occurs at lower pressures within titania-bearing glasses relative to the SiO2 endmember. The rationale for this lower onset pressure of irreversible densification is almost certainly associated with the weaker Ti–O bonds (and Si–O–Ti linkages) within the glass network: irreversible changes in the ring statistics associated with compaction are likely to be generated more readily due to the presence of titanium in the framework. As an important aside, this irreversible densification will also augment the difference in densities between titania-bearing glasses and silica above 6 GPa (Figure 4).

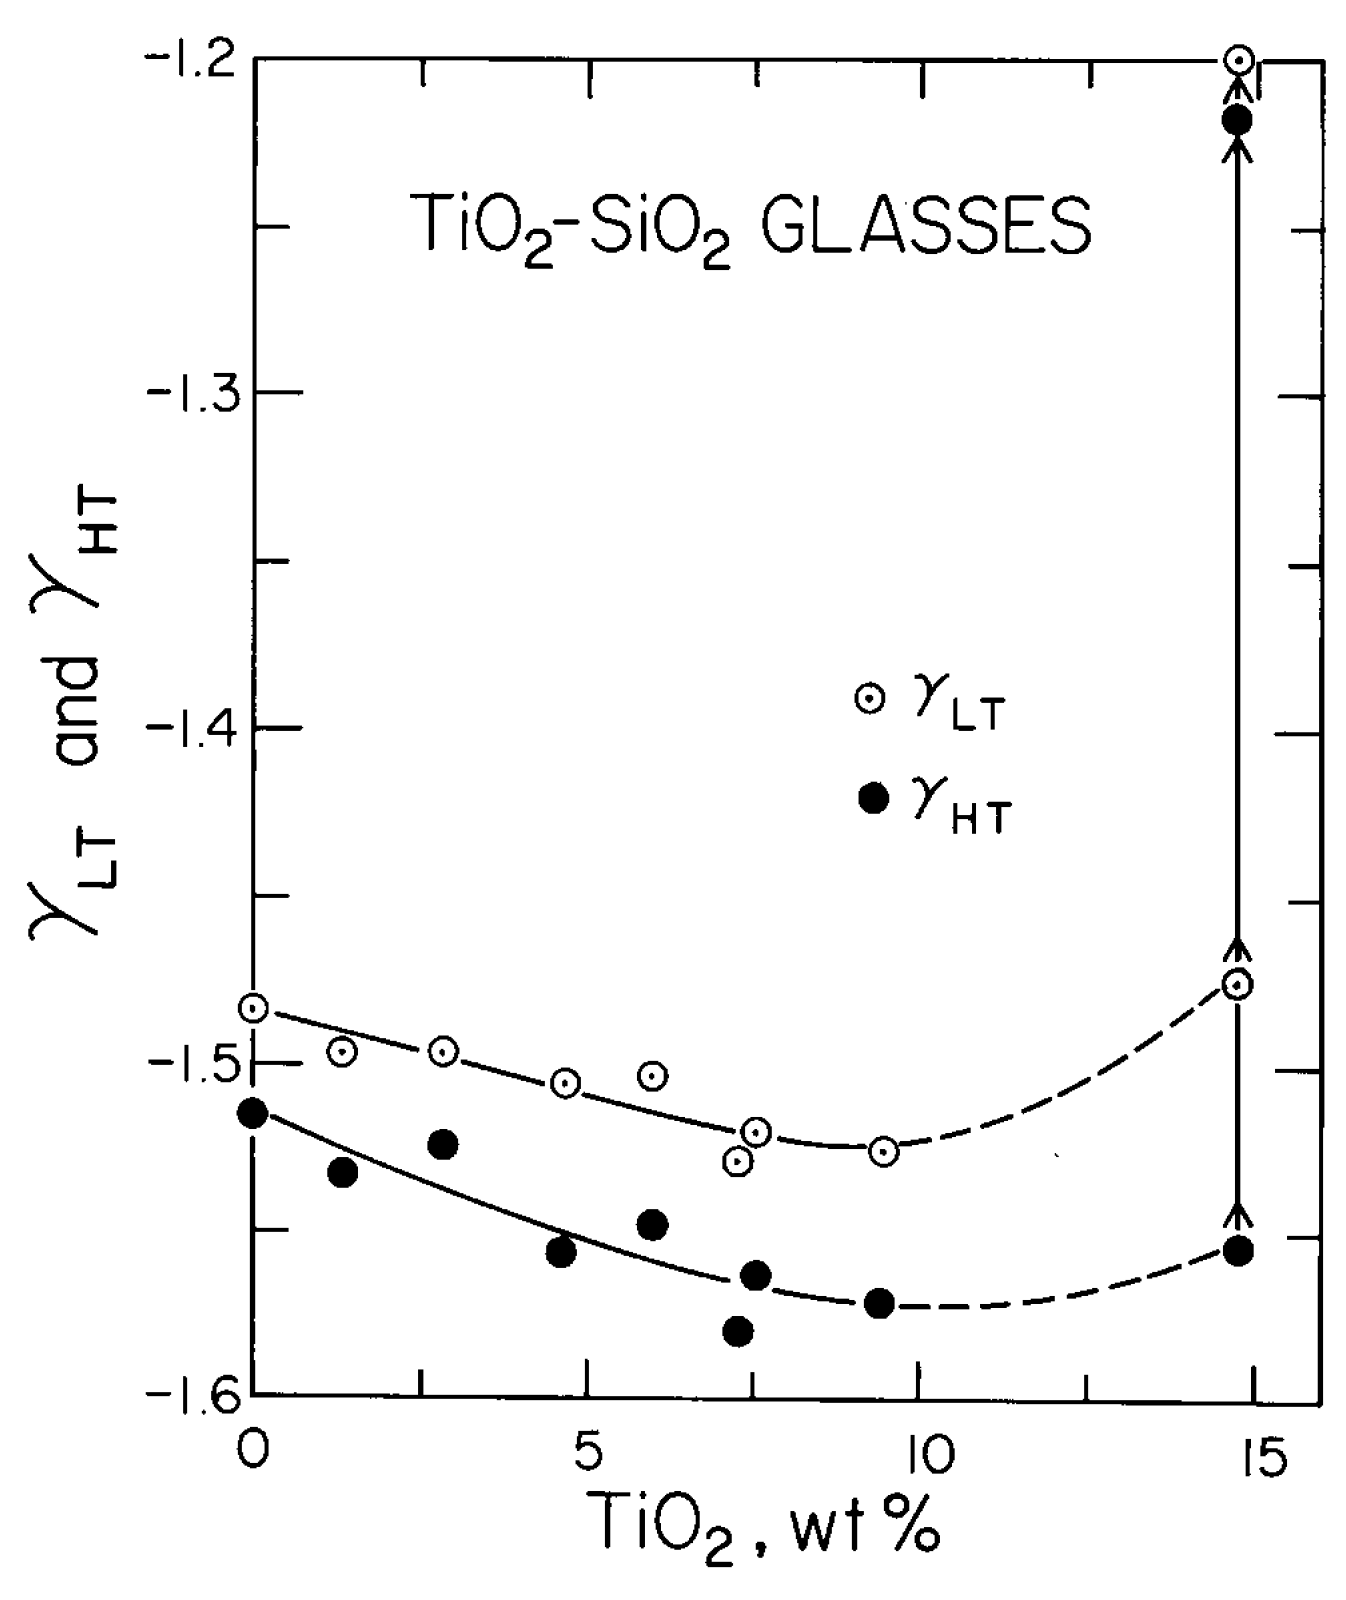
3.4. Mode Grüneisen Parameters γHT and γLT

The mode Grüneisen parameters γi are evaluated from the pressure dependence of the acoustic mode velocities, Vi:
γi = (KT/Vi) (dVi/dP)
where KT is the isothermal bulk modulus. Assuming only contributions from the acoustic modes, the high- and low-temperature limiting values of the Grüneisen parameters, γHT and γLT, can be evaluated from (dVs/dP) and (dVp/dP) using well-established relations [35,42]. As in fused silica, the γHT values for all the SiO2–TiO2 glasses are negative (Figure 7).
Indeed, both γHT and γLT become more negative with the TiO2 content. Here, the acoustic mode Grüneisen parameters reflect the low-frequency response of the glass, and demonstrate that the near-zero thermal expansion of these glasses reflects a balance between the strongly negative Grüneisen parameters associated with the acoustic modes and the generally positive Grüneisen parameters of the optical modes within these glasses [37]. Hence, the anomalously small thermal expansions of these glasses are generated by the competing and compensating effects of the low-frequency acoustic modes and high-frequency optic modes, and the decrease in thermal expansion with the addition of TiO2 is likely related to the influence of TiO2 on the acoustic lattice vibration frequencies.

4. Conclusions

The elastic properties and their pressure derivatives of the SiO2–TiO2 glasses studied systematically vary with composition. In general, Vp, Vs, ρ, E, K and µ decrease more or less linearly with the increases in the TiO2 content. Further, both the acoustic γHT and γLT become more negative with the TiO2 content. The effect of annealing is to increase ρ, decrease VP and increase VS. Nonetheless, the net effect of annealing is complex, and indicates that the annealing of glasses at temperatures closer to their glass transition may generate markedly more systematic elastic behavior relative to higher temperature quenching.
The excellent agreement between the ultrasonic and Brillouin measurements at ambient and high pressure enables a well-defined demonstration of the anomalous, as well as (elastically) the reversible and irreversible, pressure-induced compression behavior, as observed in VP and VS vs. the pressure plots for two selected glasses containing 1.3 and 9.4 wt% TiO2 up to ~5.7 GPa, supporting our previous Raman study regarding the irreversible structural change near ≥5.7 GPa [37].
Further studies of the elastic, thermodynamic and structural properties of the SiO2–TiO2 glasses, involving acoustic and spectroscopic, simultaneously under in situ high-P-T environments, would enhance our understanding of their anomalous elastic and irreversible compressional behavior and structural changes under a high pressure and temperature.

Author Contributions

M.H.M. and T.M. conceived the project; P.C.S. and C.R.K. provided the samples and initial guidance in identifying the scientific issues in this glass system; T.M. carried out the ultrasonic measurements and participated in the Brillouin measurements. The plotting, analysis and preliminary interpretation of the data were done by T.M., M.H.M. and Q.W. The manuscript was prepared by joint efforts, fully shared by M.H.M., Q.W., and T.M. P.C.S. and C.K. provided useful comments on the manuscript. All authors have read and agreed to the published version of the manuscript.

Funding

This research project has been supported by an ONR grant, and the NSF-EAR grants 0757137 (to M.H.M.) and 1620423 (to Q.W.).

Acknowledgments

This paper is dedicated to the memory and in honor of the Late Orson L. Anderson, who made significantly important contributions in the physics of the non-crystalline solids and high-pressure mineral physics throughout his career and lifetime. One of us (M.H.M.) remains most grateful to the late Orson Anderson for introducing him in the field of ultrasonic techniques in his High-Pressure Mineral Physics Laboratory at the Columbia University. We are indebted to the late John Balogh for his invaluable support in maintaining the laboratory ultrasonic and high-P-T research facilities at the University of Hawaii, deployed for carrying out this project. We thank three reviewers for helpful comments on the paper.

Conflicts of Interest

The authors declare no conflict of interest in all respects.

References

  1. Evans, D.L. Solid solution of TiO2 in SiO2. J. Am. Ceram. Soc. 1970, 53, 418–419. [Google Scholar] [CrossRef]
  2. Nordberg, M.E. Glass Having an Expansion Lower than That of Silica. U.S. Patent 2,326,059, 3 August 1943. [Google Scholar]
  3. Corning Glass Works. Low Expansion Materials Bulletin; Corning Glass Works: Corning, NY, USA, 1969. [Google Scholar]
  4. Ricker, R.W.; Hummel, F.A. Reactions in the system TiO2-SiO2; Revision of the phase diagram. J. Am. Ceram. Soc. 1951, 34, 271–279. [Google Scholar] [CrossRef]
  5. DeVries, R.C.; Roy, R.; Osborn, E.F. The system TiO2-SiO2. Trans. Br. Ceram. Soc. 1954, 53, 525–540. [Google Scholar]
  6. Schultz, P.; Smyth, G.T. Ultra-low expansion glasses and their structure in the SiO2-TiO2 system. In Amorphous Materials; Douglas, R.W., Ellis, B., Eds.; Wiley-Interscience: New York, NY, USA, 1972; pp. 453–461. [Google Scholar]
  7. Schultz, P.C. Method for Producing TiO2-SiO2 Glasses. U.S. Patent 3,690,855, 12 September 1972. [Google Scholar]
  8. Schultz, P.C. Binary titania-silica glasses containing 10–20 wt% TiO2. J. Am. Ceram. Soc. 1976, 58, 214–219. [Google Scholar] [CrossRef]
  9. Arndt, J. Irreversible compression of glasses of the system TiO2-SiO2 by high static pressures. In Proceedings of the 4th International Conference on High Pressure, Kyoto, Japan, 25–29 November 1974; The Physico-Chemical Society of Japan: Tokyo, Japan, 1975; pp. 317–320. [Google Scholar]
  10. Hirao, K.; Tanaka, K.; Furukawa, S.; Soga, N. Anomalous temperature dependence of the sound velocities of SiO2-TiO2 glasses. J. Mater. Sci. Lett. 1995, 14, 697–699. [Google Scholar] [CrossRef]
  11. Kushibiki, J.-I.; Arakawa, M.; Ueda, T.; Fujinoki, A. Homogeneous TiO2-SiO2 glass for extreme ultraviolet lithography evaluated by the line-focus-beam ultrasonic material characterization system. Appl. Phys. Express 2008, 1, 087002. [Google Scholar] [CrossRef]
  12. Carson, D.S.; Maurer, R.D. Optical attenuation in titania-silica glasses. J. Non-Cryst. Solids 1973, 11, 368–380. [Google Scholar] [CrossRef]
  13. Copley, G.J.; Redmond, A.D.; Yates, B. Influence of titania upon thermal expansion of vitreous silica. Phys. Chem. Glasses 1973, 14, 73–76. [Google Scholar]
  14. Plummer, W.A.; Hagy, H.E. Precision thermal expansion measurements on low expansion optical materials. Appl. Opt. 1968, 7, 825–831. [Google Scholar] [CrossRef]
  15. Kurkjian, C.R.; Peterson, G.E. An EPR study of Ti3+-Ti4+ in TiO2-SiO2 glasses. Phys. Chem. Glasses 1974, 15, 12–17. [Google Scholar]
  16. Turnbull, R.C.; Lawrence, W.G. The role of titania in silica glasses. J. Am. Ceram. Soc. 1952, 35, 48–53. [Google Scholar] [CrossRef]
  17. Trap, H.J.L.; Stevels, J.M. Conventional and inverted glasses containing titania, Part I. Phys. Chem. Glasses 1960, 1, 107–118. [Google Scholar]
  18. Hirayama, C.; Berg, D. Dielectric properties of glasses in the system TiO2-Na2O-SiO2. Phys. Chem. Glasses 1961, 2, 145–151. [Google Scholar]
  19. Manghnani, M.H. Pressure and temperature dependence of the elastic moduli of Na2O-TiO2-SiO2 glasses. J. Am. Ceram. Soc. 1972, 55, 360–365. [Google Scholar] [CrossRef]
  20. McSkimin, J.H. Pulse superposition method for measuring ultrasonic wave velocities in solids. J. Acoust. Soc. Am. 1961, 33, 12–16. [Google Scholar] [CrossRef]
  21. Anderson, O.L.; Dienes, G.J. The anomalous properties of vitreous silica. Chap. 18. In Non-Crystalline Solids; Frechette, V.D., Ed.; John Wiley & Sons, Inc.: New York, NY, USA, 1960; pp. 449–490. [Google Scholar]
  22. Barron, T.H.K. On the thermal expansion of solids at low temperatures. Phil. Mag. 1955, 46, 720–734. [Google Scholar] [CrossRef]
  23. Scannell, G.; Koike, A.; Huang, L. Structure and thermo-mechanical response of TiO2-SiO2 glasses to temperature. J. Non-Cryst. Solids 2016, 447, 238–247. [Google Scholar] [CrossRef] [Green Version]
  24. Williams, Q.; Manghnani, M.H.; Matsui, T. The effect of coordination changes on the bulk moduli of amorphous silicates: The SiO2-TiO2 system as a test case. Am. Miner. 2019, 104, 679–685. [Google Scholar] [CrossRef]
  25. Chmel, A.; Eranosyan, G.M.; Karshak, A.A. Vibrational spectroscopic study of Ti-substituted SiO2. J. Non-Cryst. Solids 1992, 136, 213–217. [Google Scholar] [CrossRef]
  26. Chandrasekhar, H.R.; Chandrasekhar, M.; Manghnani, M.H. Phonons in TiO2-SiO2 glasses. J. Non-Cryst. Solids 1980, 40, 567–575. [Google Scholar] [CrossRef]
  27. Cook, R.K. Variation of elastic constants and static strains with hydrostatic pressure: A method for calculation from ultrasonic measurements. J. Acoust. Soc. Am. 1957, 29, 445–449. [Google Scholar] [CrossRef]
  28. Tkachev, S.N.; Manghnani, M.H.; Williams, Q.; Ming, L.C. Compressibility of hydrated and anhydrous Na2O-2SiO2 liquid and also glass to 8 GPa using Brillouin scattering. J. Geophys. Res. 2005, 110, B07201. [Google Scholar] [CrossRef]
  29. Andreatch, P.; McSkimin, H.J. Pressure dependence of ultrasonic wave velocities and elastic stiffness moduli for a TiO2-SiO2 glass (Corning 7971). J. Appl. Phys. 1976, 47, 1299–1301. [Google Scholar] [CrossRef]
  30. Gerlich, D.; Wolf, M.; Yaacov, I.; Nissenson, B. Thermoelastic properties of ULE® titanium silicate glass. J. Non-Cryst. Solids 1976, 21, 243–249. [Google Scholar] [CrossRef]
  31. Vacher, R.; Pelous, J.; Plicque, F.; Zarembowitch, A. Ultrasonic and Brillouin scattering study of the elastic properties of vitreous silica between 10 and 300 K. J. Non-Cryst. Solids 1981, 45, 397–410. [Google Scholar] [CrossRef]
  32. Tielburger, D.; Merz, R.; Enhrenfels, R.; Hunklinger, S. Thermally activated relaxation processes in vitreous silica: An investigation by Brillouin scattering at high pressures. Phys. Rev. B 1992, 45, 2750–2760. [Google Scholar] [CrossRef] [PubMed]
  33. Zhang, J.S.; Bass, J.D.; Taniguchi, T.; Goncharov, A.F.; Chang, Y.-Y.; Jacobsen, S.D. Elasticity of cubic boron nitride under ambient conditions. J. Appl. Phys. 2011, 109, 063521. [Google Scholar] [CrossRef] [Green Version]
  34. Le Parc, R.; Levelut, C.; Pelous, J.; Martinez, V.; Champagnon, B. Influence of fictive temperature and composition of silica glass on anomalous elastic behavior. J. Phys. Cond. Matter 2006, 18, 7507–7527. [Google Scholar] [CrossRef]
  35. Birch, F. Elasticity and constitution of the Earth’s interior. J. Geophys. Res. 1952, 57, 227–286. [Google Scholar] [CrossRef]
  36. Sonneville, C.; De Ligny, D.; Mermet, A.; Champagnon, B.; Martinet, C.; Henderson, G.H.; Deschamps, T.; Margueritat, J.; Barthel, E. In situ Brillouin study of sodium alumino silicate glasses under pressure. J. Chem. Phys. 2013, 139, 074501. [Google Scholar] [CrossRef]
  37. Xu, J.-A.; Manghnani, M.H.; Ming, L.C.; Wang, S.-Y. High-pressure Raman study of TiO2-SiO2 glasses: Evidence of the structural change. In High Pressure Research: Application to Earth and Planetary Sciences; Syono, Y., Manghnani, M.H., Eds.; Terra Publishing: Tokyo, Japan, 1992; pp. 519–525. [Google Scholar]
  38. Vacher, R.; Courtens, E.; Foret, M. Anharmonic versus relaxational sound damping in glasses. II. Vitreous silica. Phys. Rev. B 2005, 72, 214205. [Google Scholar] [CrossRef] [Green Version]
  39. Rau, S.; Enss, C.; Hunklinger, S.; Neu, P.; Wurger, A. Acoustic properties of oxide glasses at low temperatures. Phys. Rev. B 1995, 52, 7179–7194. [Google Scholar] [CrossRef]
  40. Rouxel, T.; Ji, H.; Hammouda, T.; Moreac, A. Poisson’s ratio and the densification of glass under high pressure. Phys. Rev. Lett. 2008, 100, 225501. [Google Scholar] [CrossRef] [PubMed]
  41. Guerette, M.; Ackerson, M.R.; Thomas, J.; Yuan, F.; Watson, E.B.; Walker, D.; Huang, L. Structure and properties of silica glass densified in cold compression and hot compression. Sci. Rep. 2015, 5, 15343. [Google Scholar] [CrossRef] [PubMed] [Green Version]
  42. Schuele, D.E.; Smith, C.S. Low temperature thermal expansion of RbI. J. Phys. Chem. Solids 1964, 25, 801–814. [Google Scholar] [CrossRef]
Figure 1. Longitudinal (Vp) and shear wave (Vs) velocities versus TiO2 content for unannealed (as received) and annealed glasses. For the compositions up to 9.4 wt% TiO2, annealing causes an increase in Vs and a slight decrease in Vp. Squares are McSkimin’s (unpublished) 1972 data for the CorningULE® 7971 glass. For the 14.7 wt% glass, which is partly crystalline, both velocities drastically decrease on annealing (see text for discussion).
Minerals 10 00481 g001
Figure 2. Density (ρ) and Poisson’s ratio (σ) versus TiO2 content. As shown, annealing causes an increase in ρ and decrease in σ for the SiO2–TiO2 glasses studied.
Minerals 10 00481 g002
Figure 3. Bulk (K), shear (μ) and Young’s (E) moduli versus TiO2 content. Annealing causes an increase in K, and a decrease in μ and E. Squares are McSkimin’s (unpublished) 1972 data. Error bars are smaller than the symbols.
Minerals 10 00481 g003
Figure 4. Comparison of the densification of fused silica and SiO2–TiO2 glass containing 7.3 wt% TiO2 up to 6 GPa using the Birch–Murnaghan equation of state.
Minerals 10 00481 g004
Figure 5. Representative Brillouin spectrum of an SiO2–TiO2 glass at 2.77 GPa; P and S represent compressional and shear peaks, respectively. Peaks generated by different orders of the grating are also present, as is a peak produced from the pressure medium between the P and S peaks. The higher signal-to-noise of the compressional peak relative to the shear peak produces a smaller error bar for the compressional velocity determination relative to the shear velocity.
Minerals 10 00481 g005
Figure 6. Pressure dependence of the compressional (VP) and shear (VS) velocities measured by the ultrasonic method up to 0.5 GPa (inverted filled triangles) and Brillouin scattering (triangles, circles) up to ~5.7 GPa for two SiO2–TiO2 glasses. Black filled symbols are compression data and the open are decompression data that have been compressed to pressures below that at which irreversible deformation occurs. Red triangles are decompression points for irreversibly densified glasses compressed to slightly above 5.5 GPa. Error bars for the Brillouin data are in the order of, or smaller than, the size of the symbols; for the ultrasonic data, they are smaller than the symbol sizes.
Minerals 10 00481 g006
Figure 7. Variation of the low-temperature and high-temperature limits of the acoustic Grüneisen parameter as a function of the TiO2 content.
Minerals 10 00481 g007
Table 1. Chemical composition and ultrasonic elastic parameters of seven SiO2–TiO2 glasses at an ambient pressure and temperature. The measurements of these glasses after annealing are listed.
Glass NumberComposition in wt%ρ (g/cm3)Vp (km/s)Vs (km/s)K (GPa)μ(GPa)E (GPa)σ Poisson’s Ratio
SiO2TiO2
7940A
(fused silica)
10002.20075.9473.76936.1631.26728.00.165
T4A98.71.32.20055.9113.74635.7130.8879.110.164
T1A97.22.82.20015.8723.71735.3230.4070.880.166
T5A95.44.62.19955.8333.69234.8729.9869.700.166
T6A94.06.02.19925.8033.67234.5329.6569.160.166
T2A92.77.32.19865.7583.63534.1529.0.567.900.169
ULE 7971A92.57.52.19935.7833.65334.4229.3562.560.168
T3A90.69.42.19855.7193.60733.7728.6066.910.170
Table 2. Pressure derivatives of the elastic parameters (moduli in Mbar) of the annealed SiO2–TiO2 glasses at ambient conditions.
Glass
Number
Composition
in wt%
dK/dPdρ/dP
g/cm3
Mbar−1
dμ/dPdE/dPdσ/dP
Mbar−1
SiO2TiO2
7940A
(fused silica)
1000−5.376.68−3.53−8.82−1.01
T4A98.71.3−5.686.78−3.56−9.00−1.24
T1A97.22.8−5.426.80−3.56−8.87−1.00
T5A95.44.6−5.977.01−3.55−9.13−1.52
T6A94.06.0−5.857.06−3.54−9.05−1.42
T2A92.7.3−5.967.20−3.60−9.20−1.47
ULE 7971A92.57.5−5.887.10−3.60−9.16−1.36
T3A90.69.4−5.777.26−3.59−9.09−1.30
Table 3. Comparison of the ultrasonic and Brillouin scattering measurements of Vp and Vs in SiO2–TiO2 glasses at ambient conditions.
Composition
TiO2, wt%
g/cm3Brillouin
Vp (km/s)
Scattering
Vs (km/s)
Ultrasonic
Vp (km/s)
Ultrasonic
Vs (km/s)
ΔVp;
%
ΔVs;
%
1.32.20055.9333.7435.9113.7460.4−0.08
2.82.20015.8903.7325.8723.7170.30.4
4.62.19955.8283.6835.8333.692−0.09−0.2
6.02.19925.8003.6565.8033.672−0.05−0.4
7.32.19865.7513.6225.7583.635−0.1−0.3
9.42.19855.7463.6165.7193.6070.50.2

