Petrogenesis of the Snezhnoe Ruby Deposit, Central Pamir

Abstract
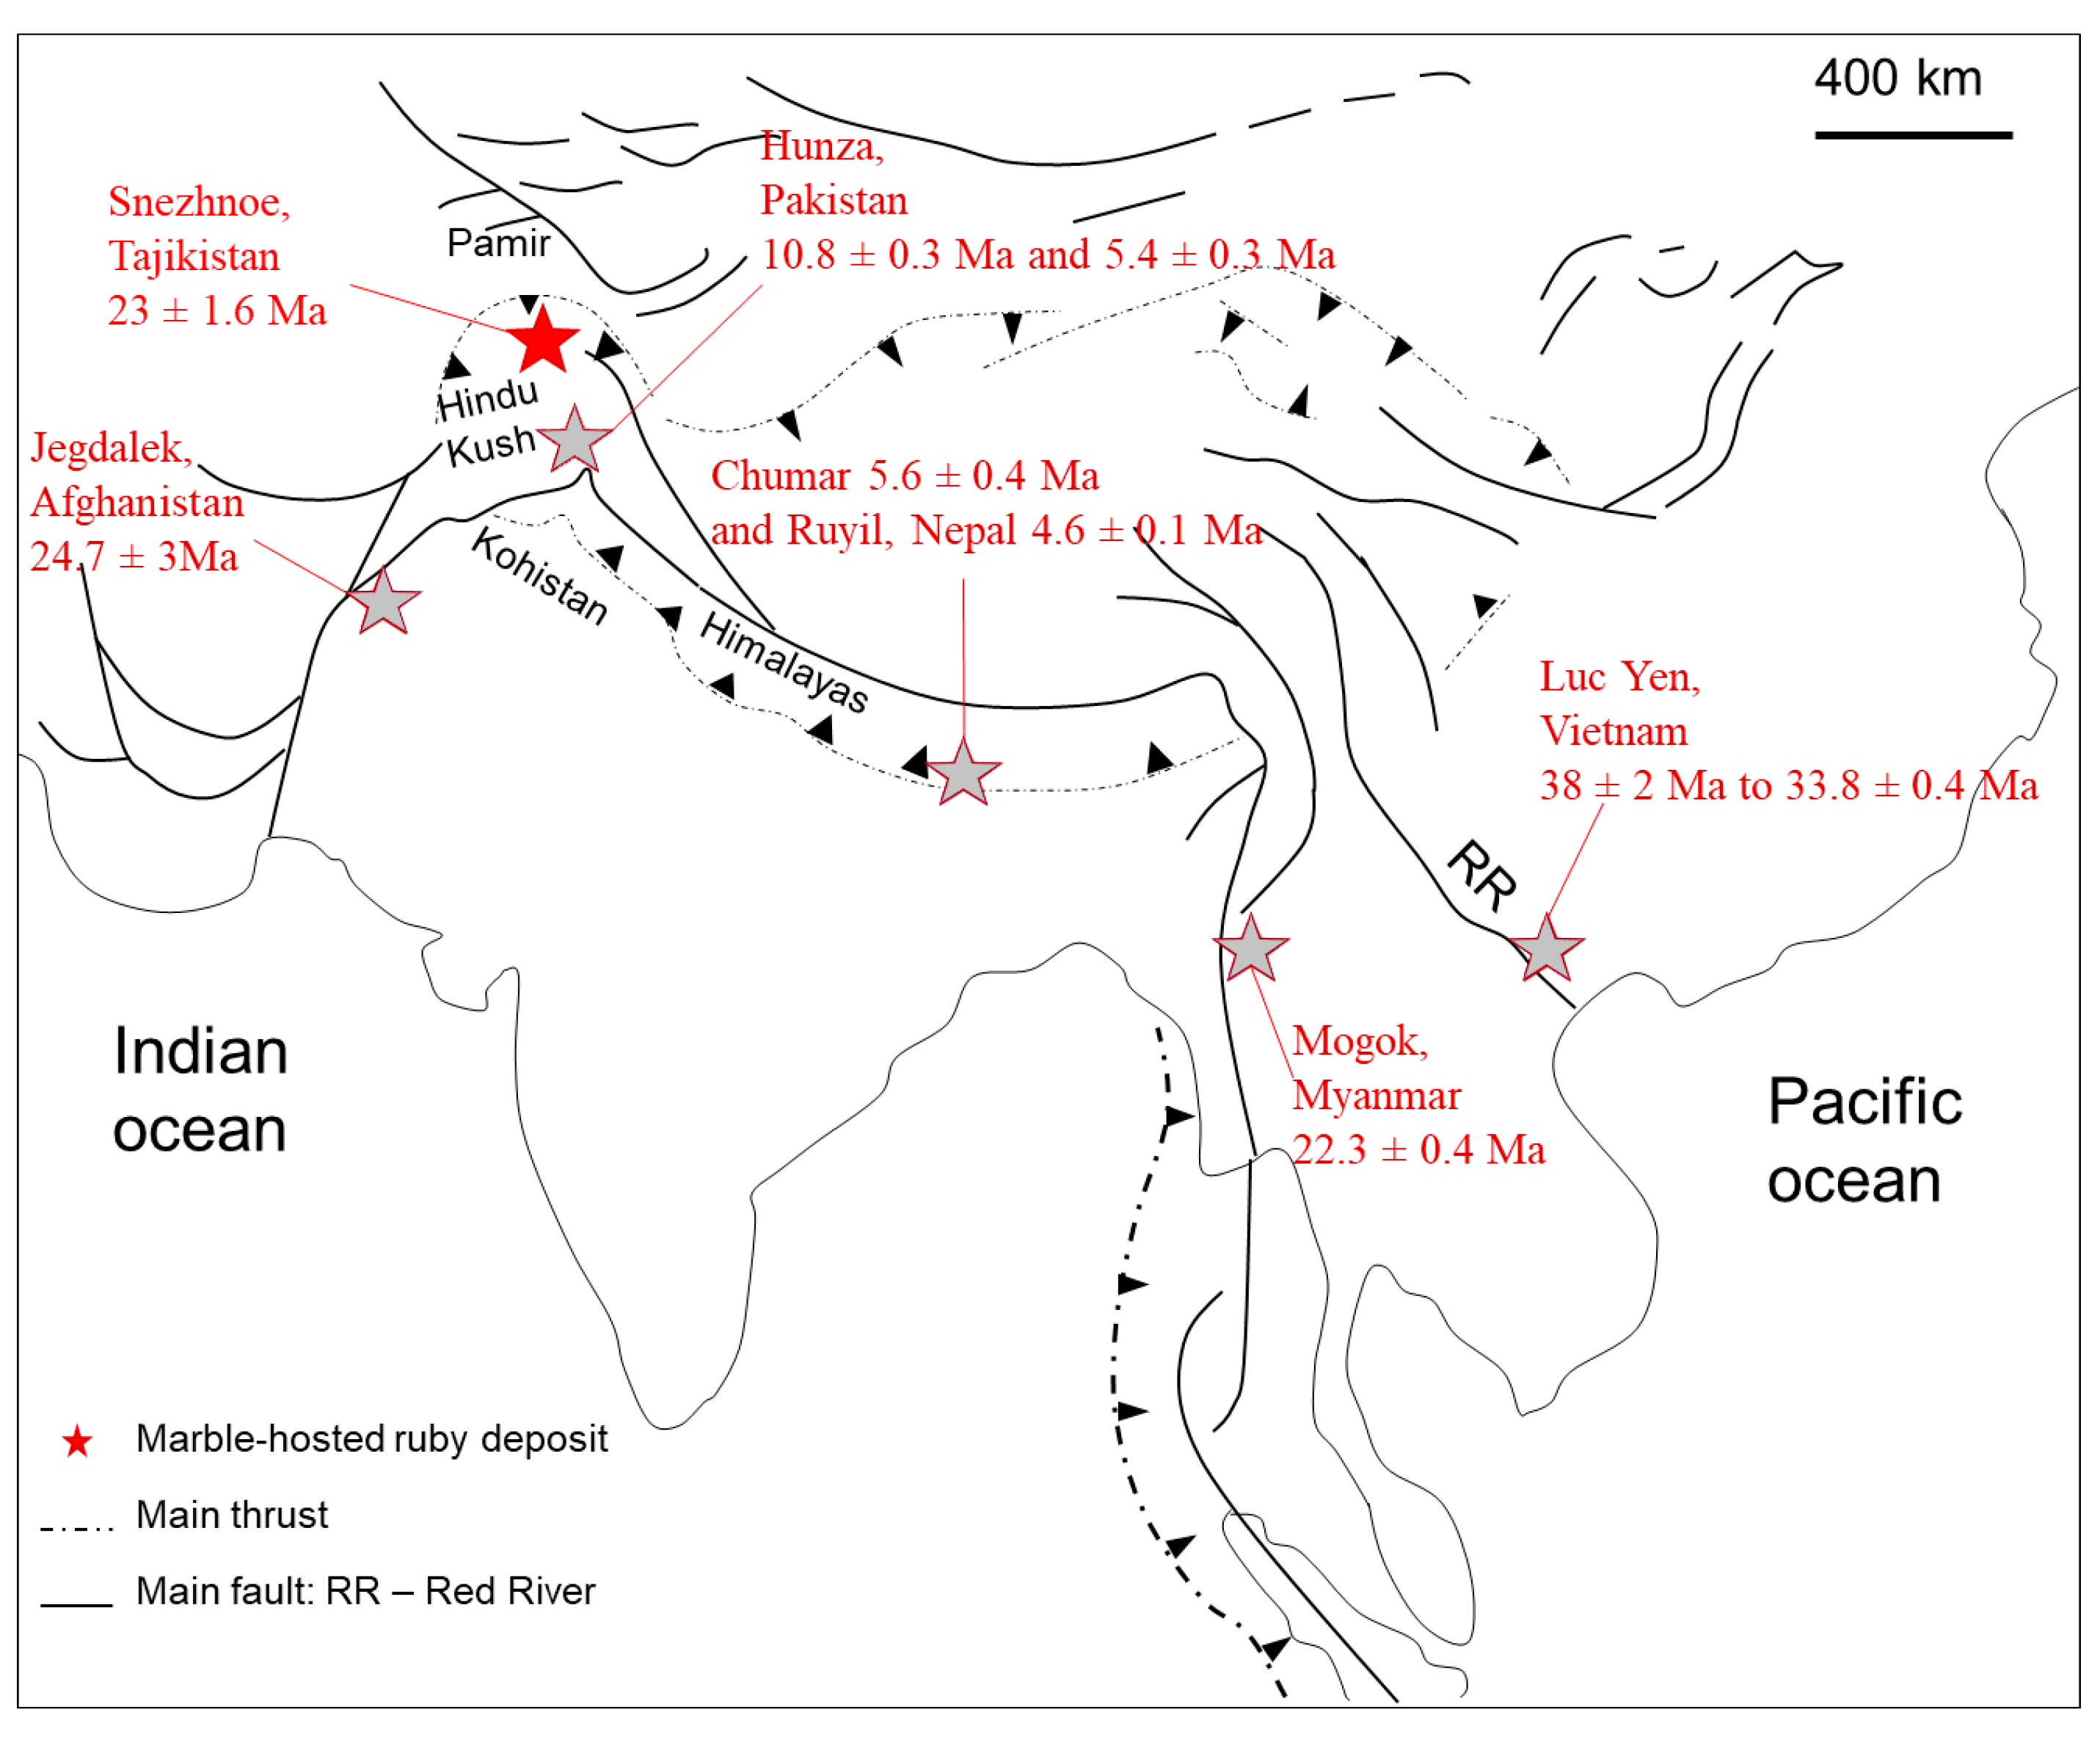
1. Introduction
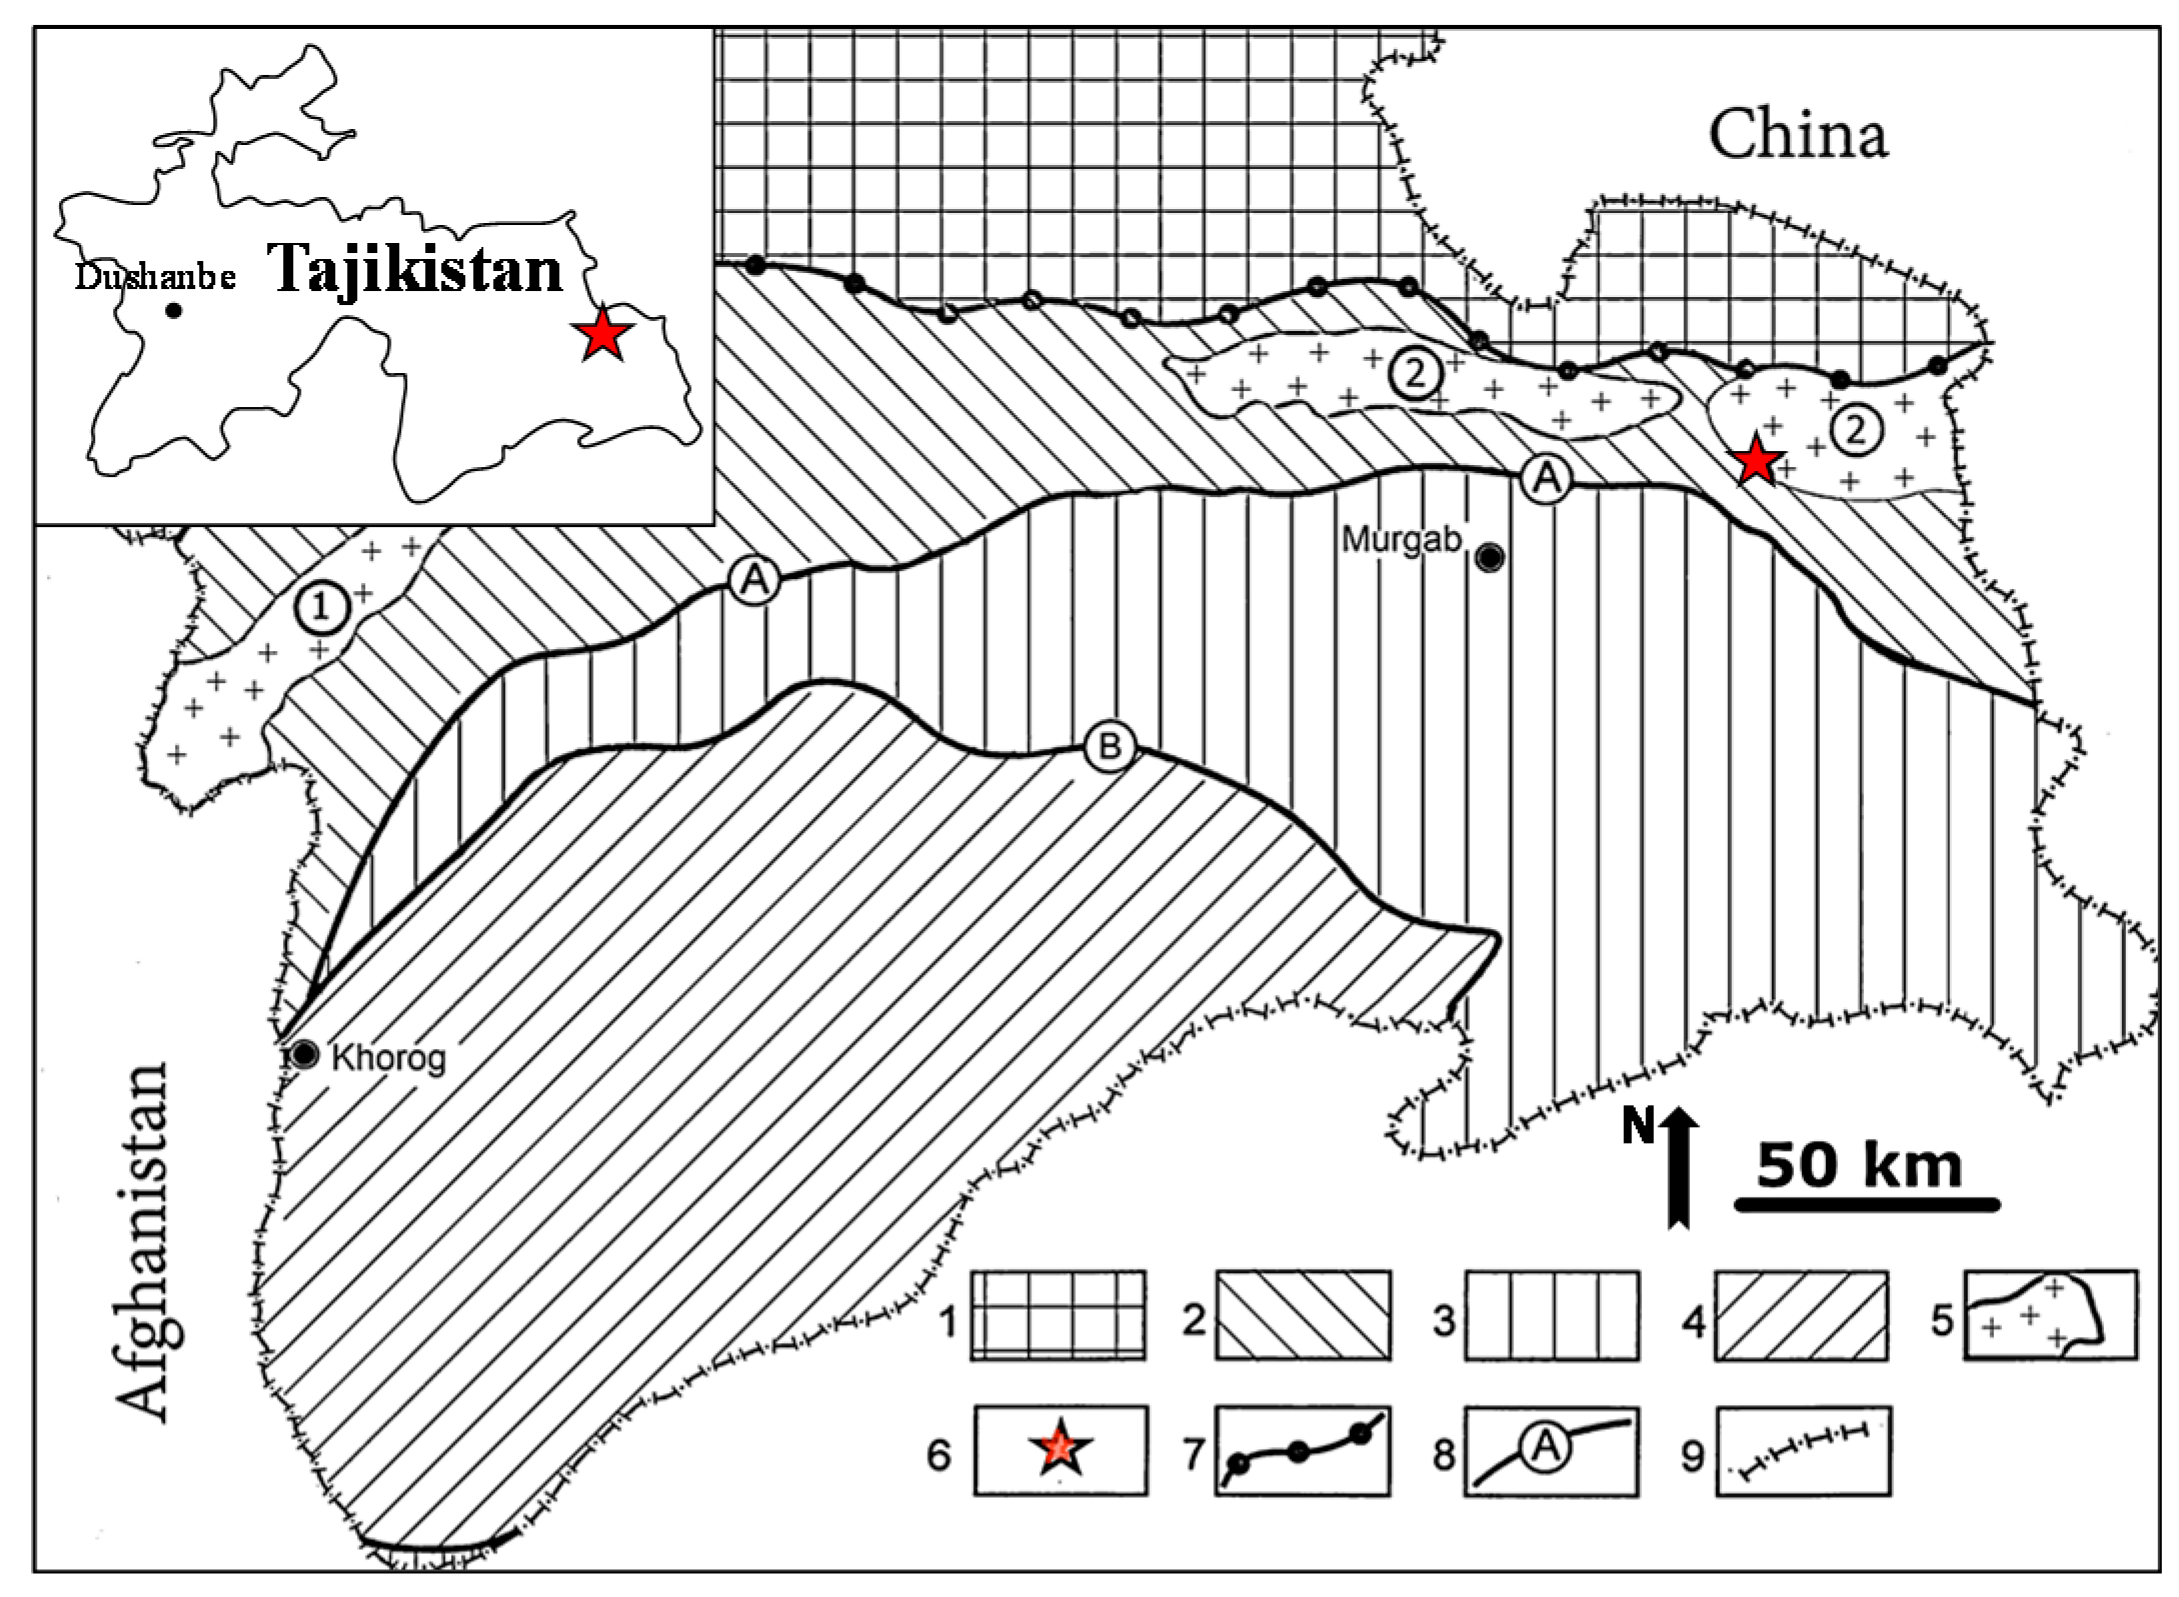
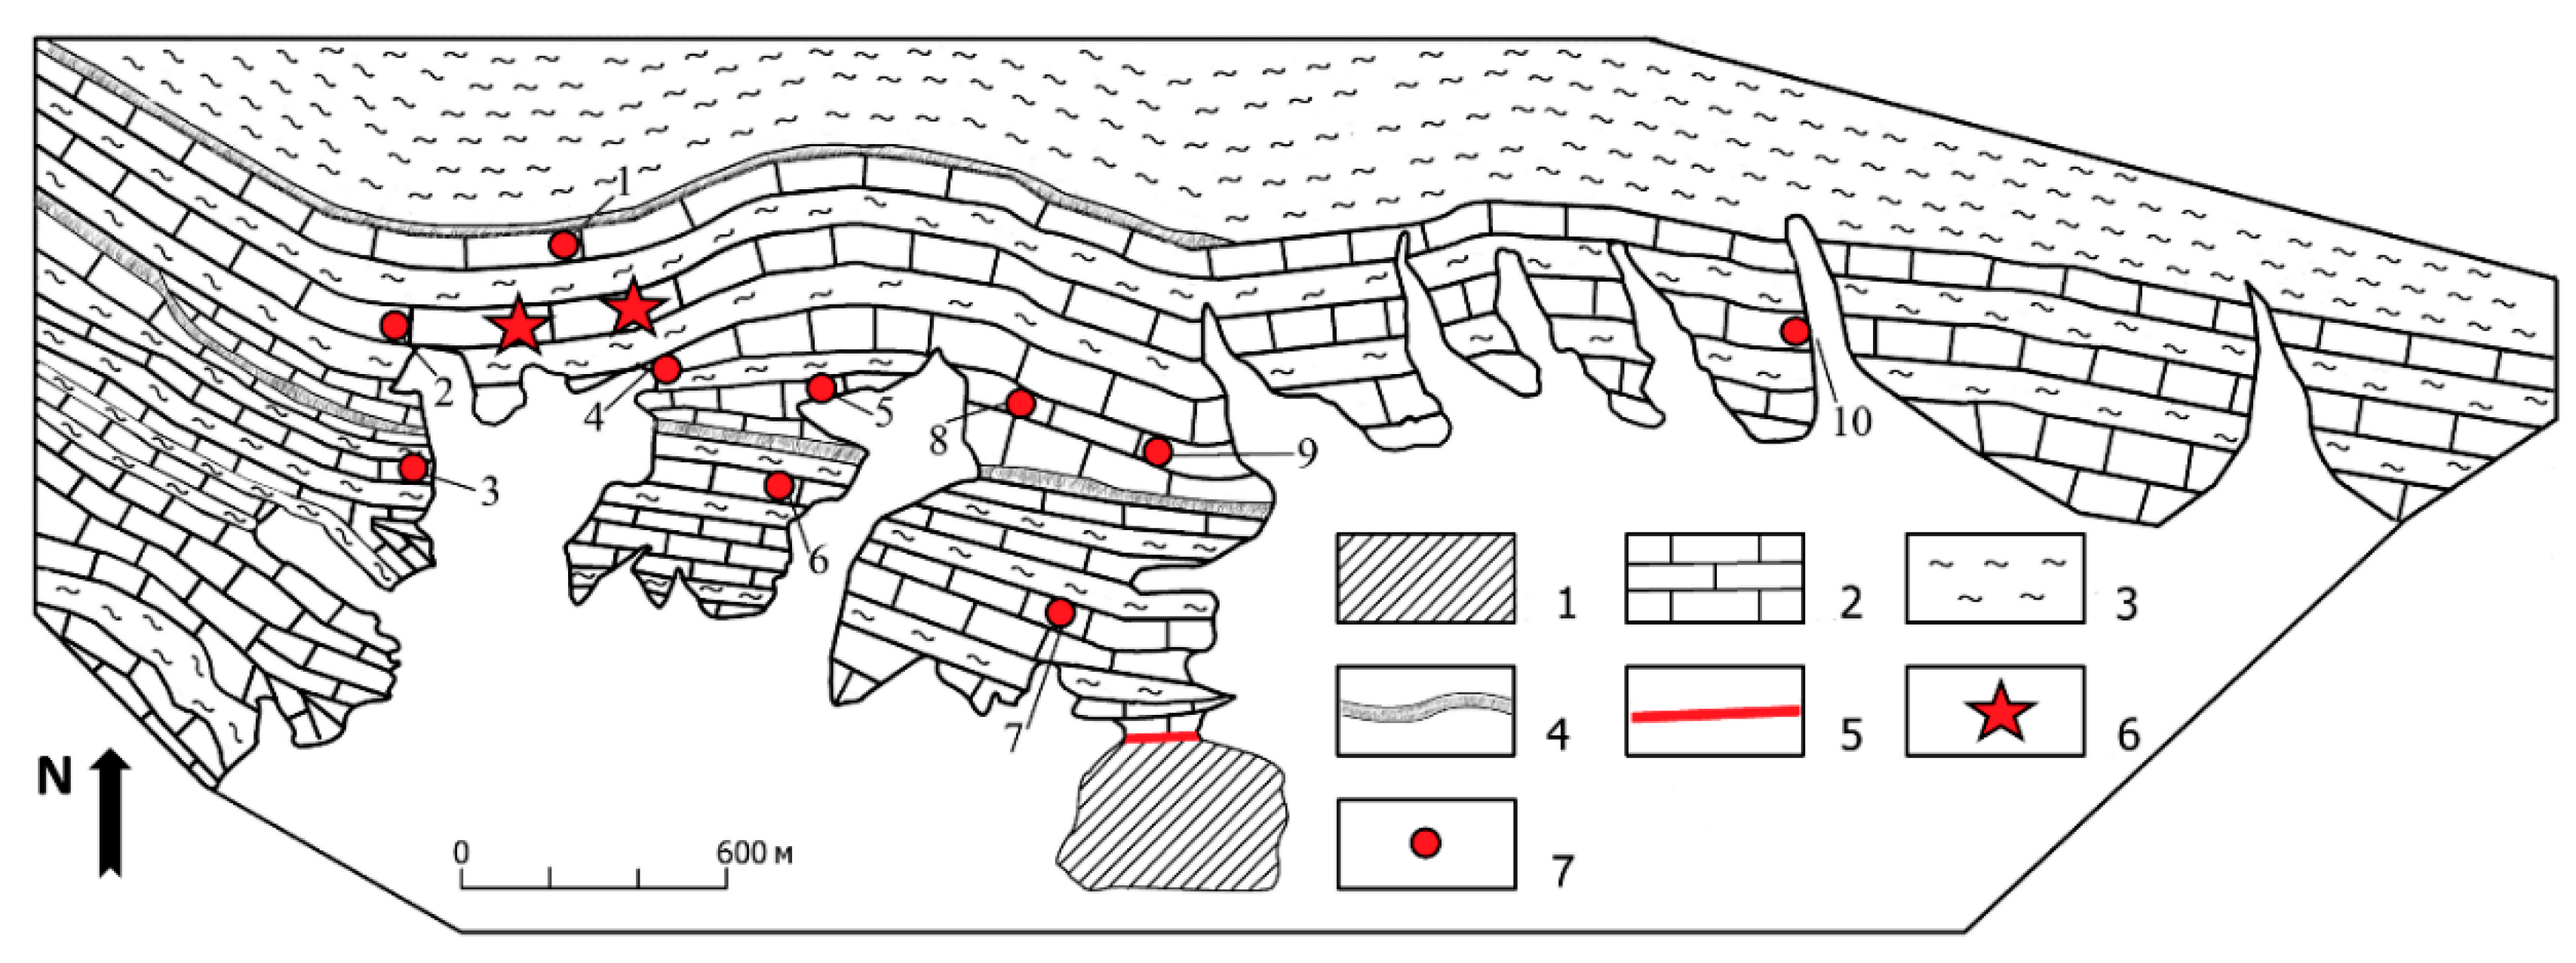
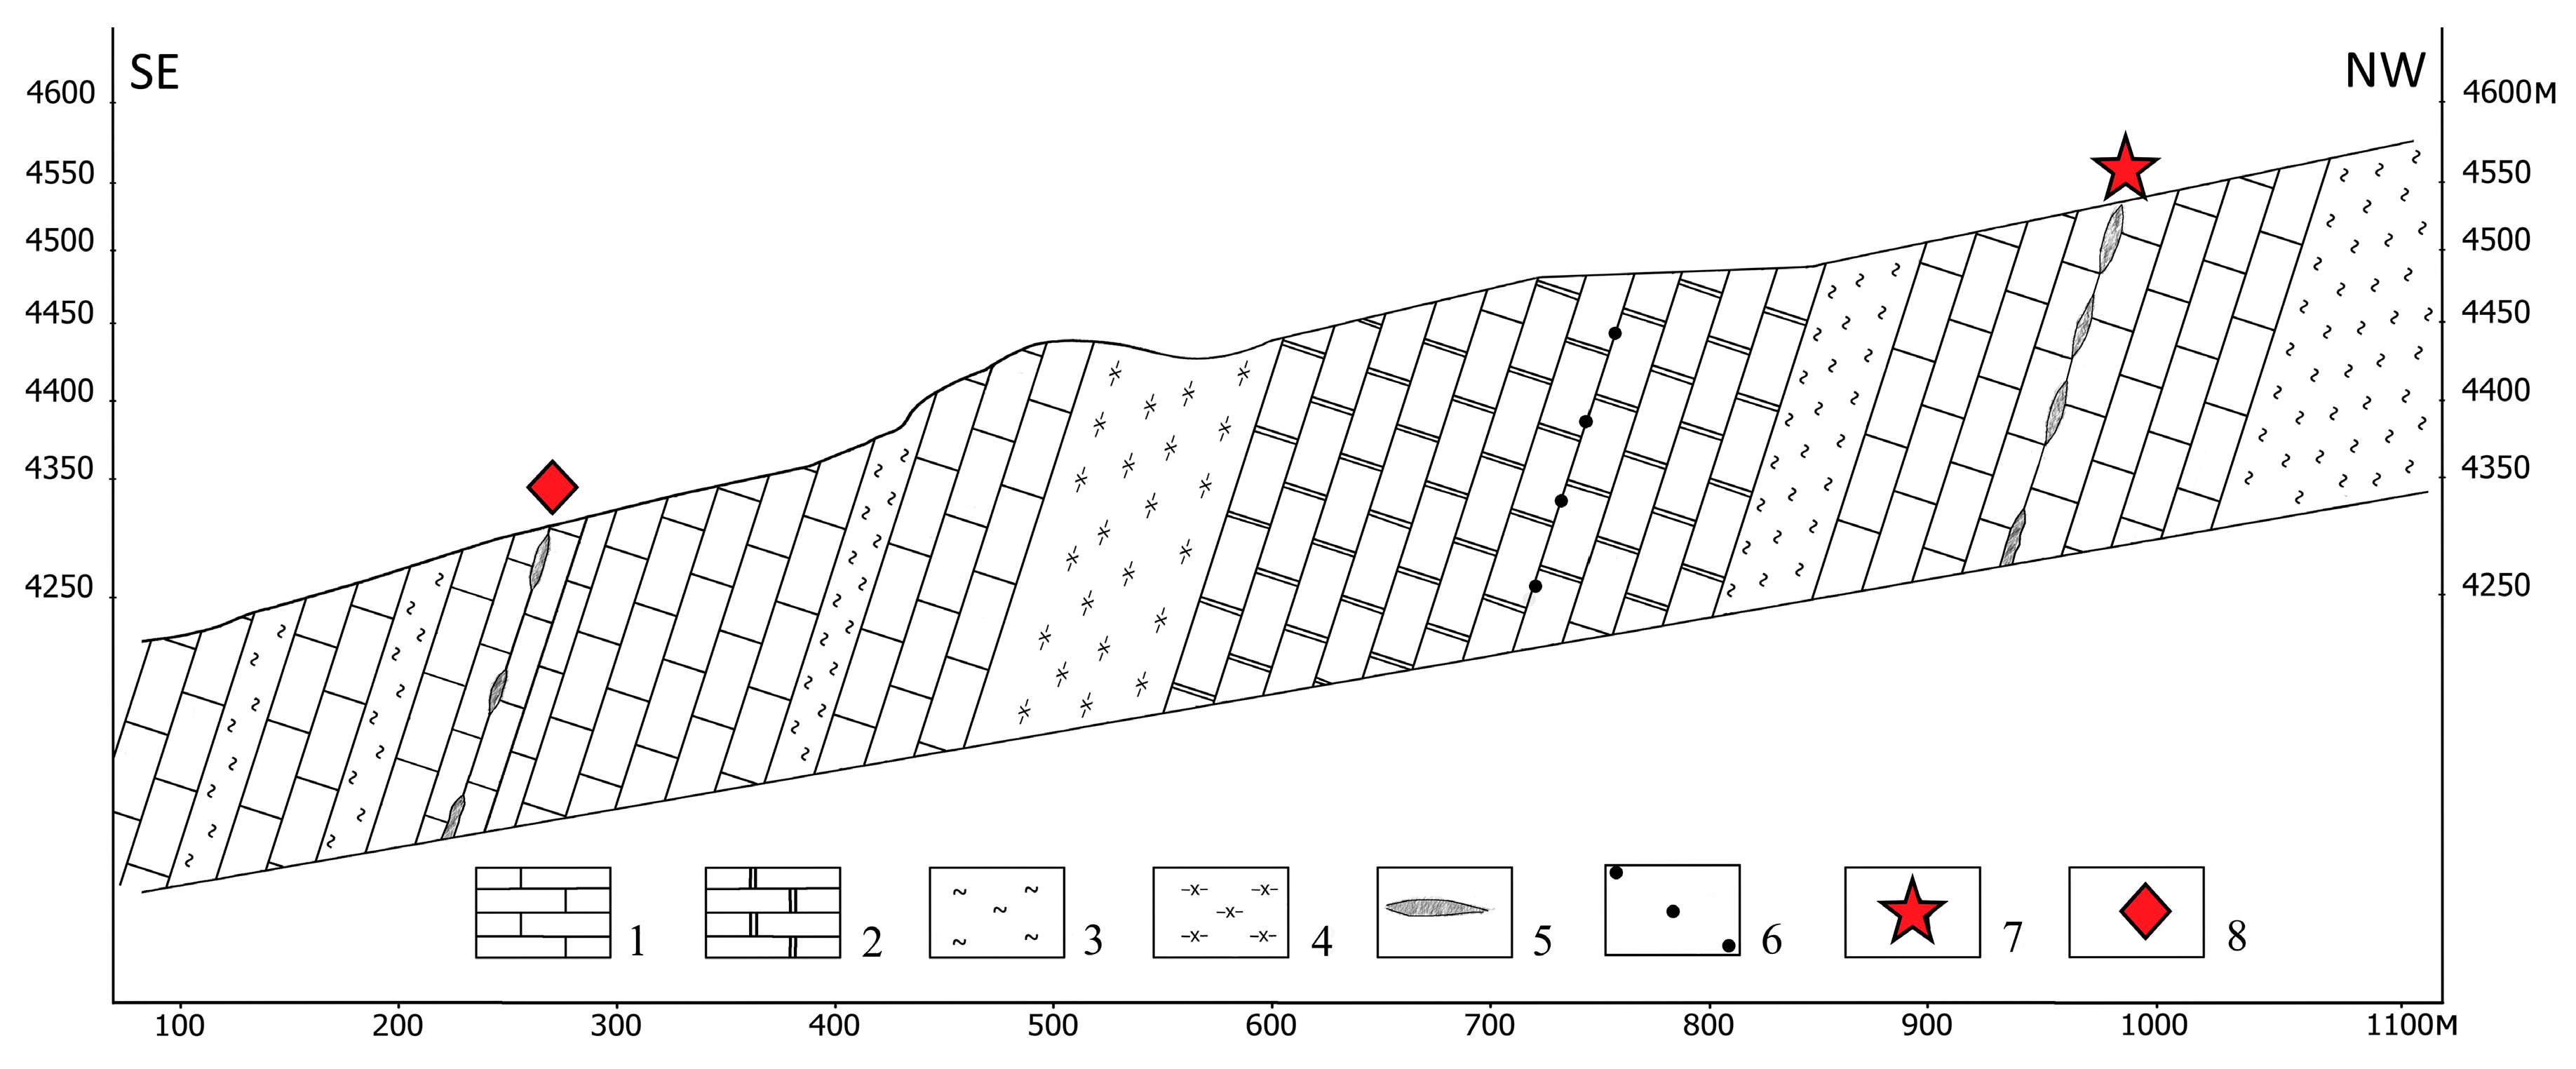
2. Geological Setting
3. Materials and Methods
4. Results
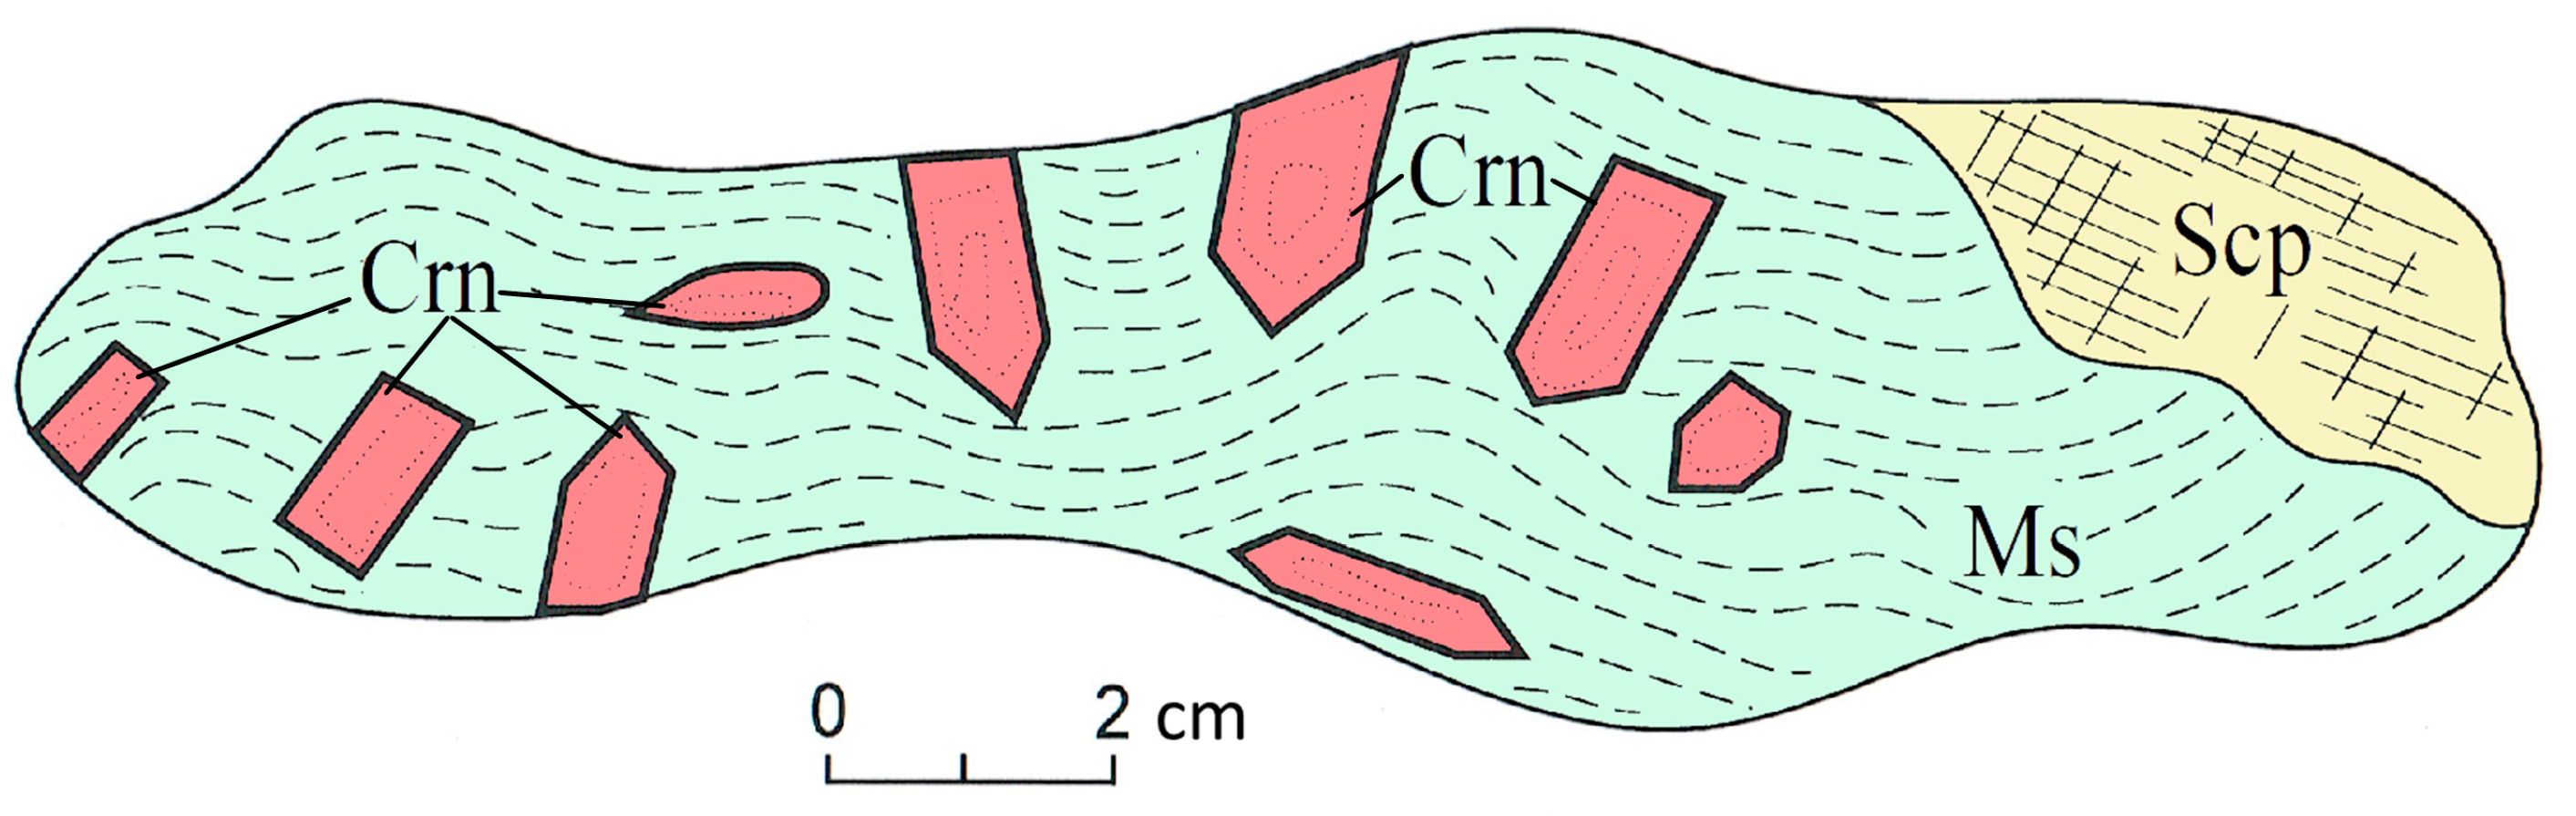
4.1. Petrology of the ruby-bearing rocks
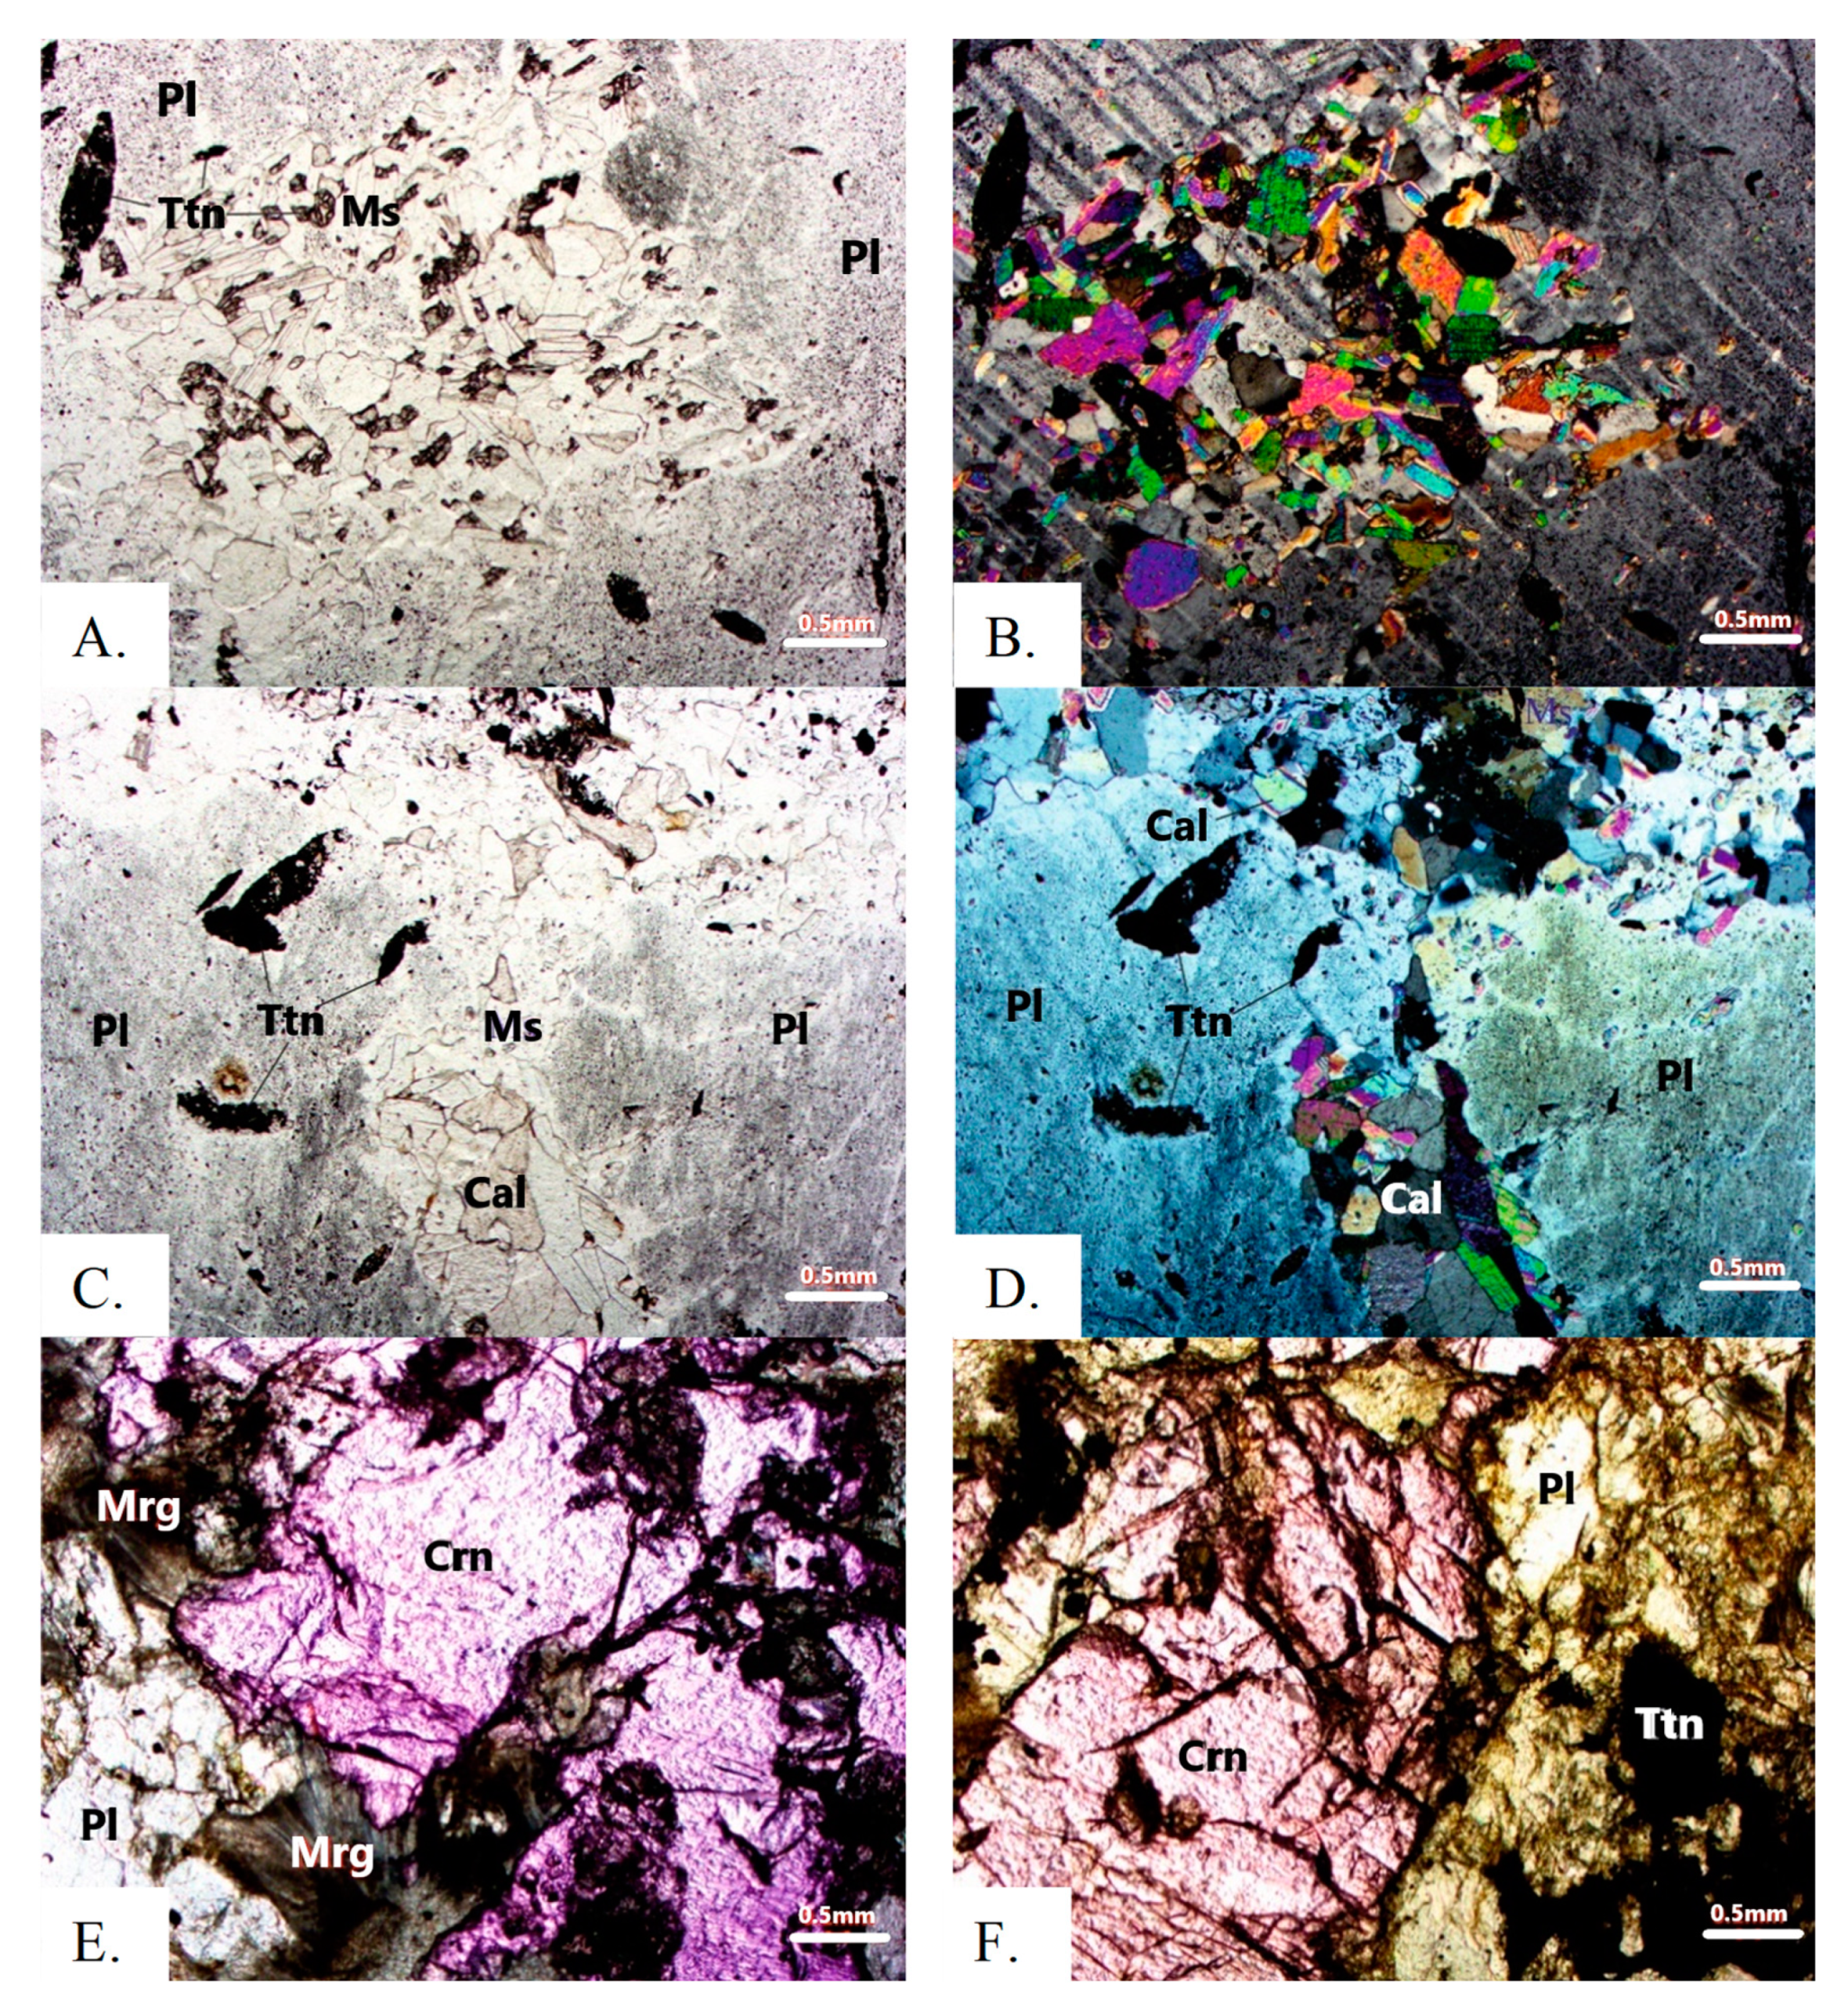
4.2. Mineralogy of Ruby-Bearing Rocks
4.2.1. Major and Minor Minerals
4.2.2. Accessory Minerals
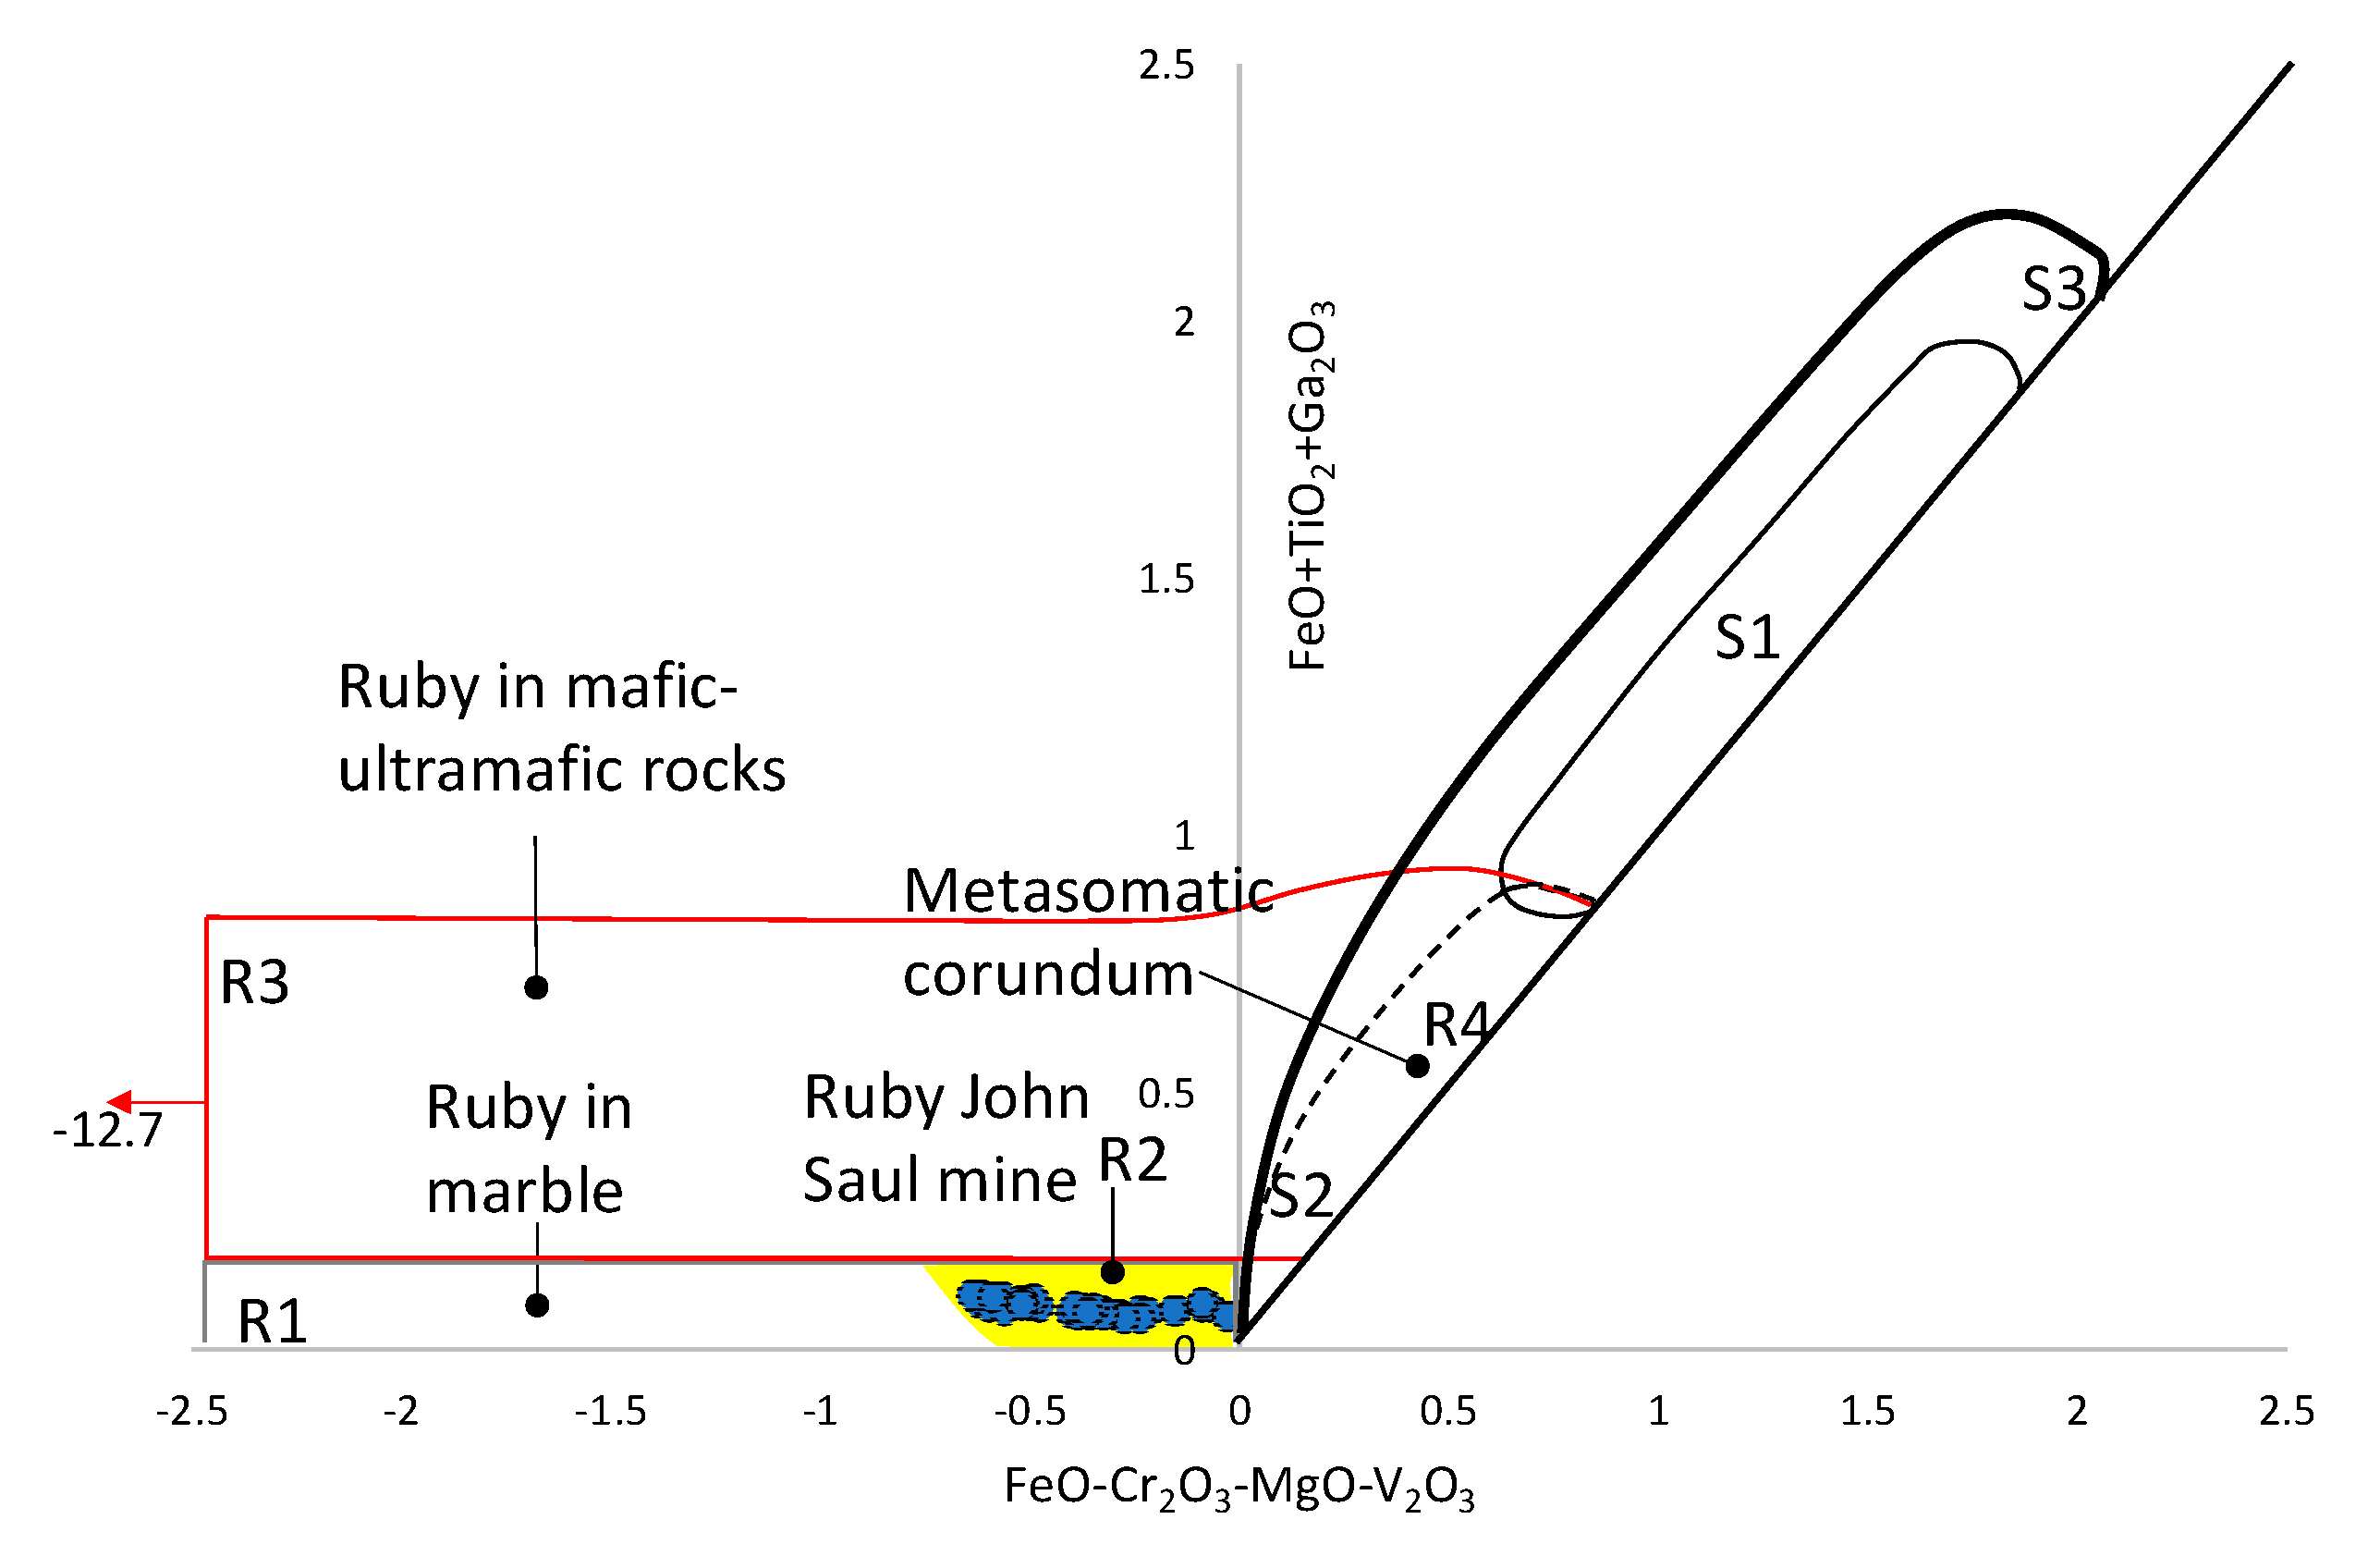
4.2.3. Mineralogy, Geochemistry and Oxygen Isotopes of Ruby
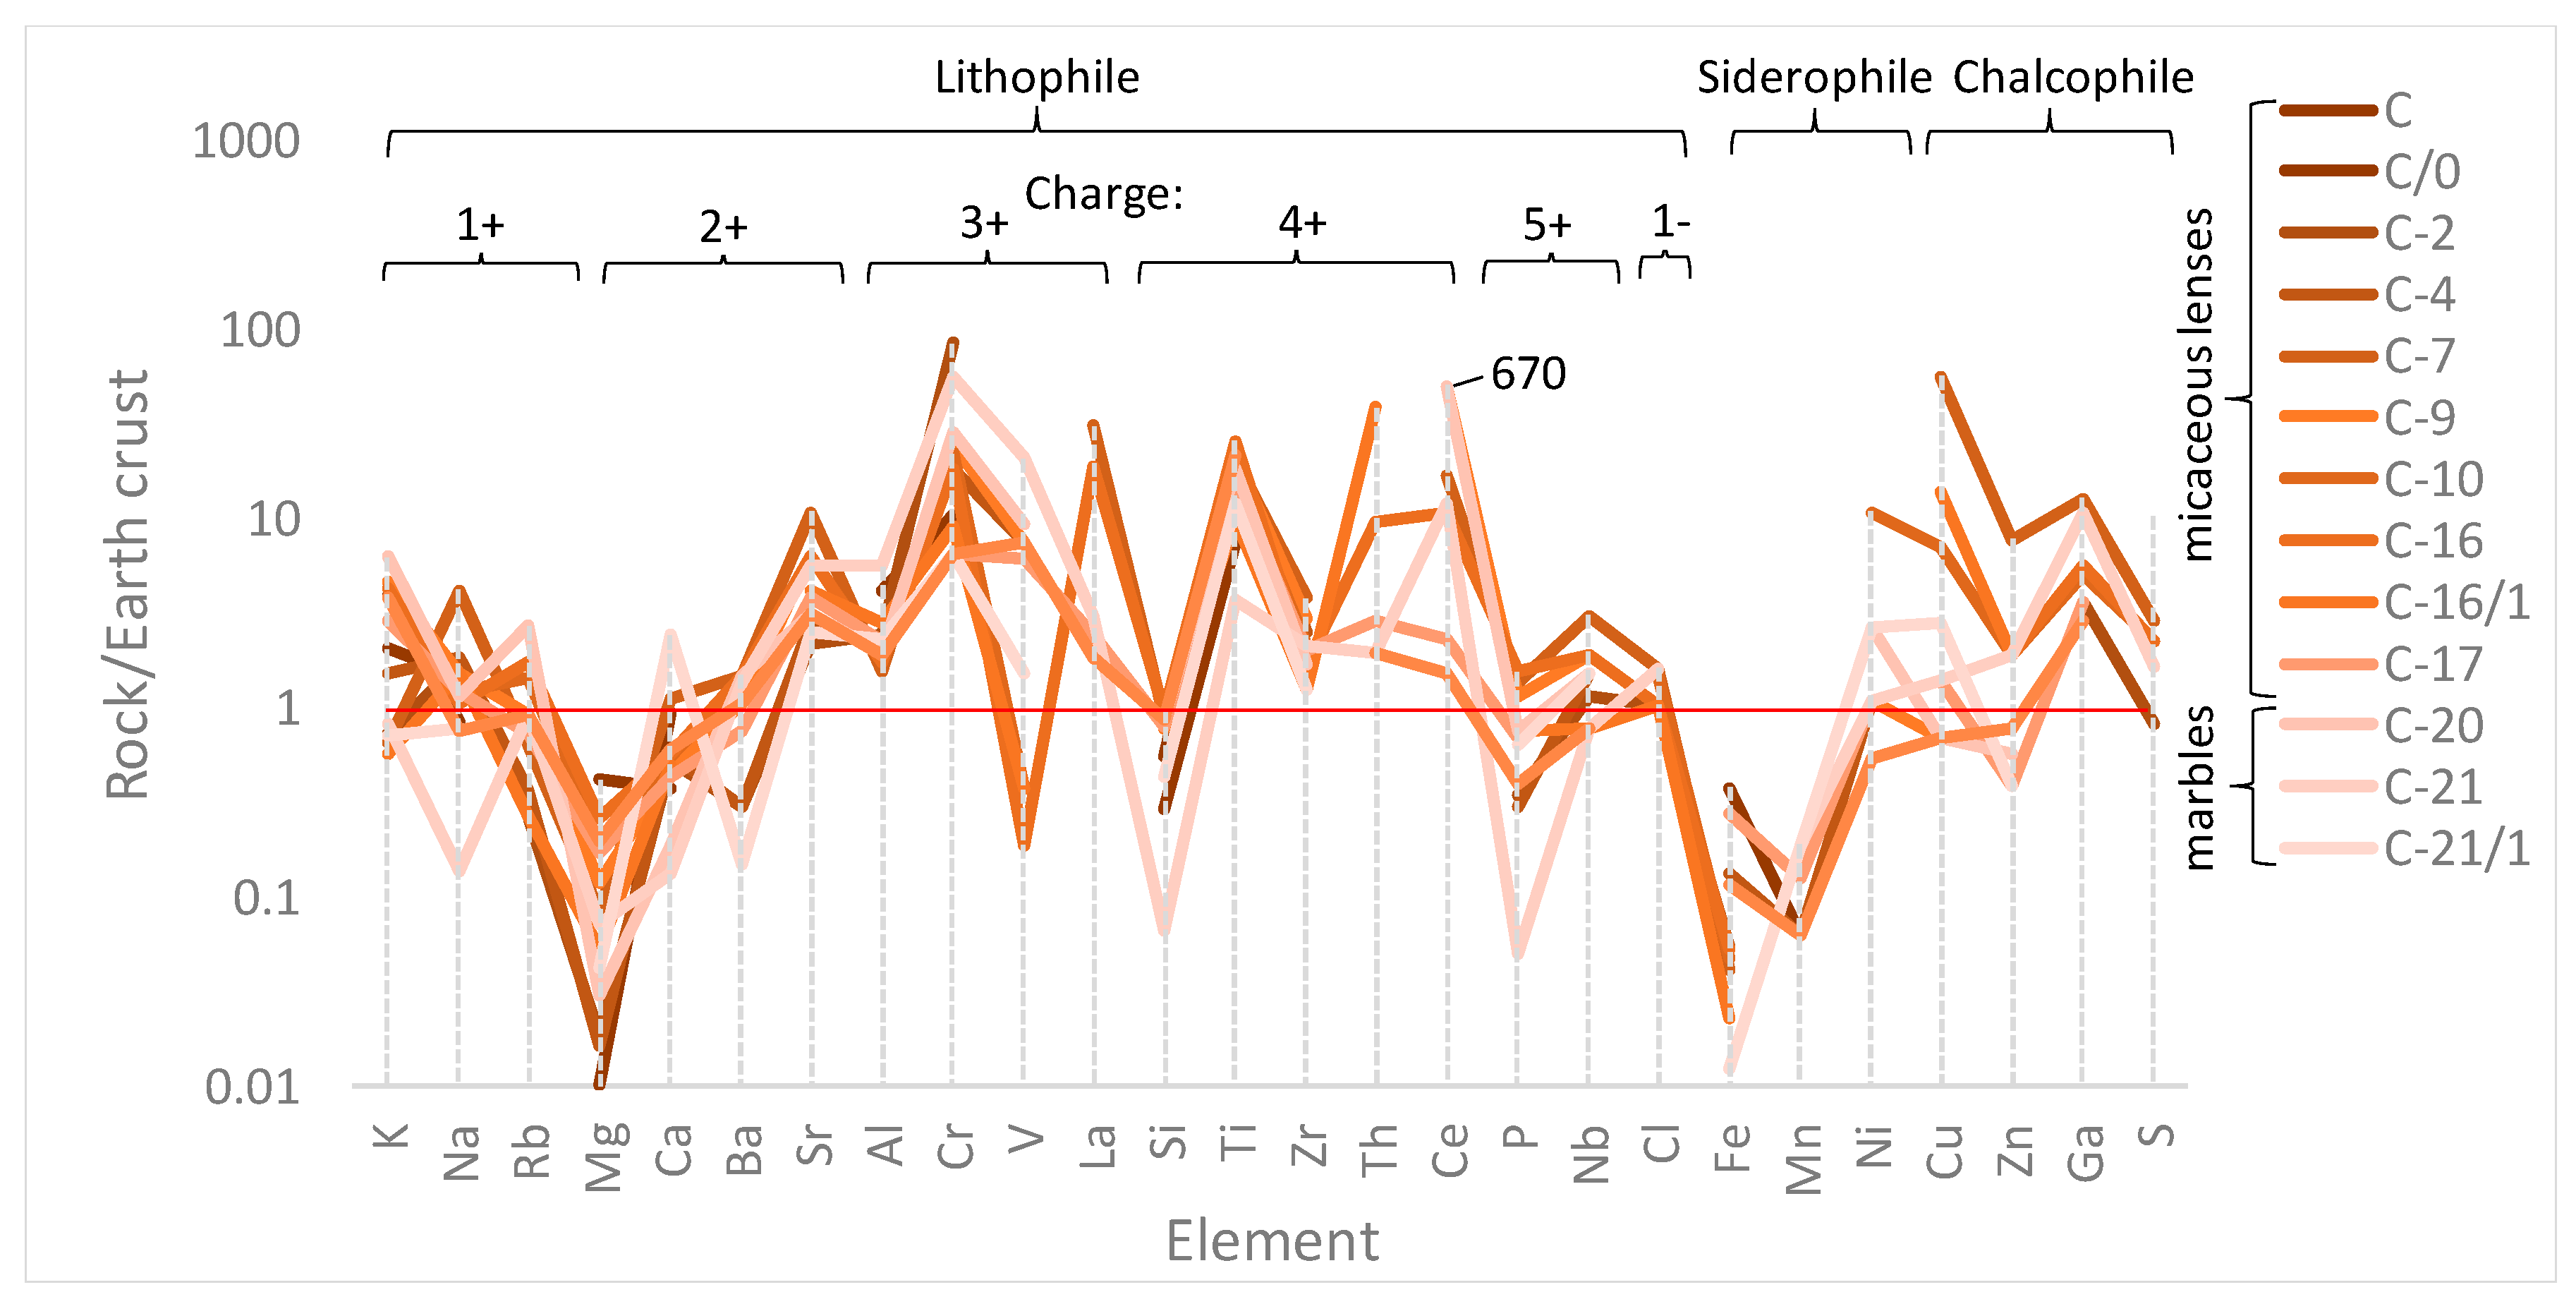
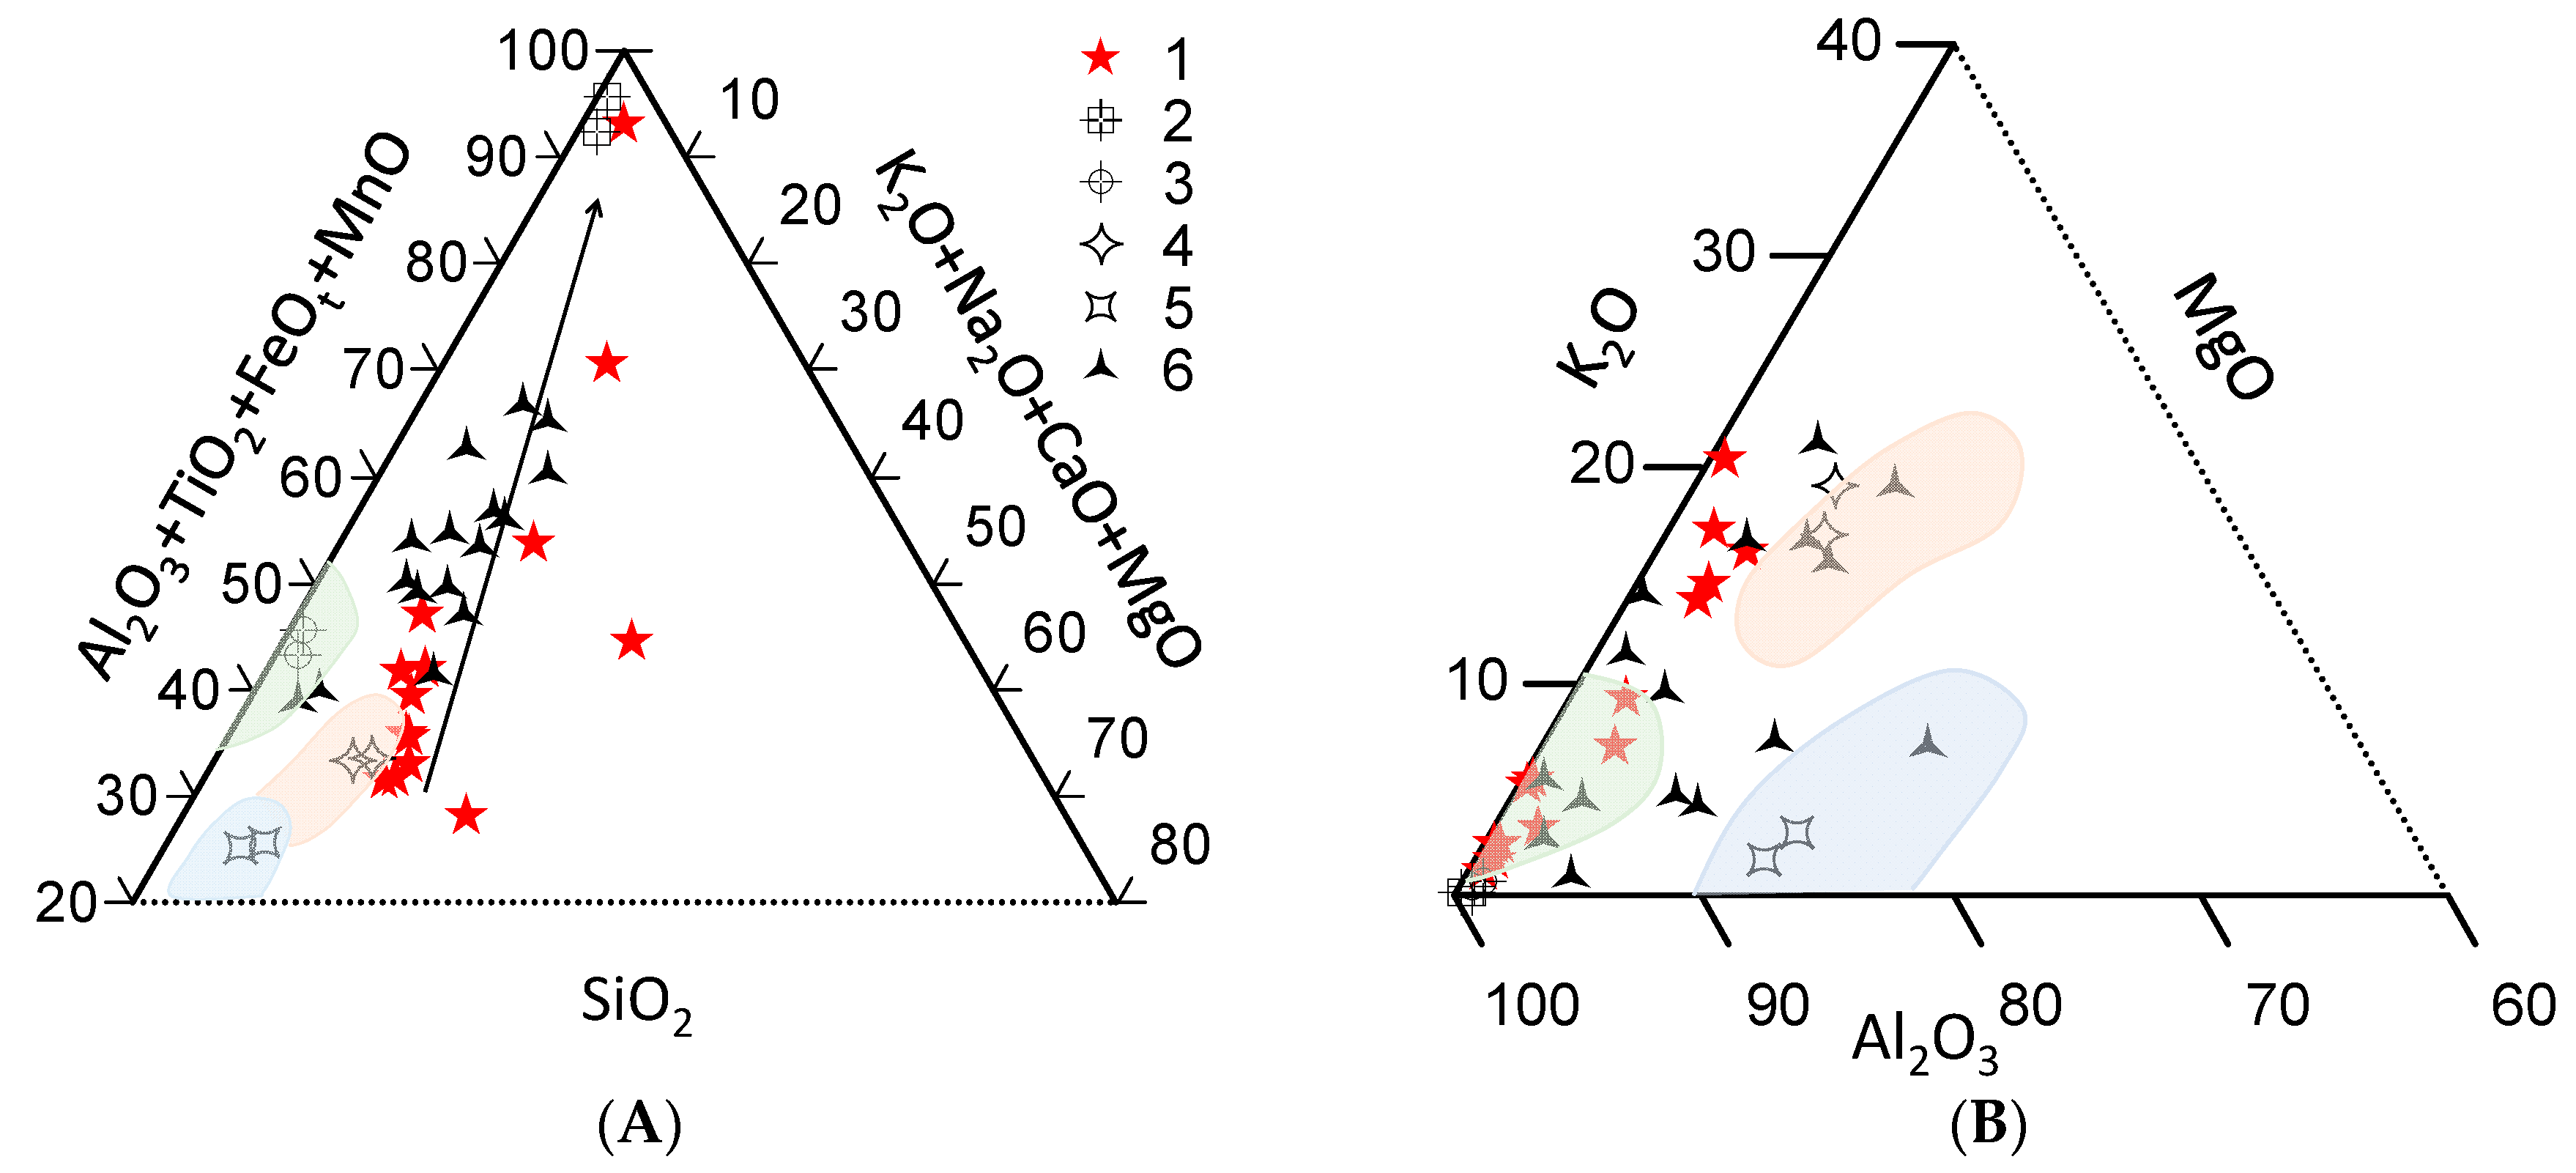
4.3. Petrochemical Features of the Ruby-Bearing Rocks
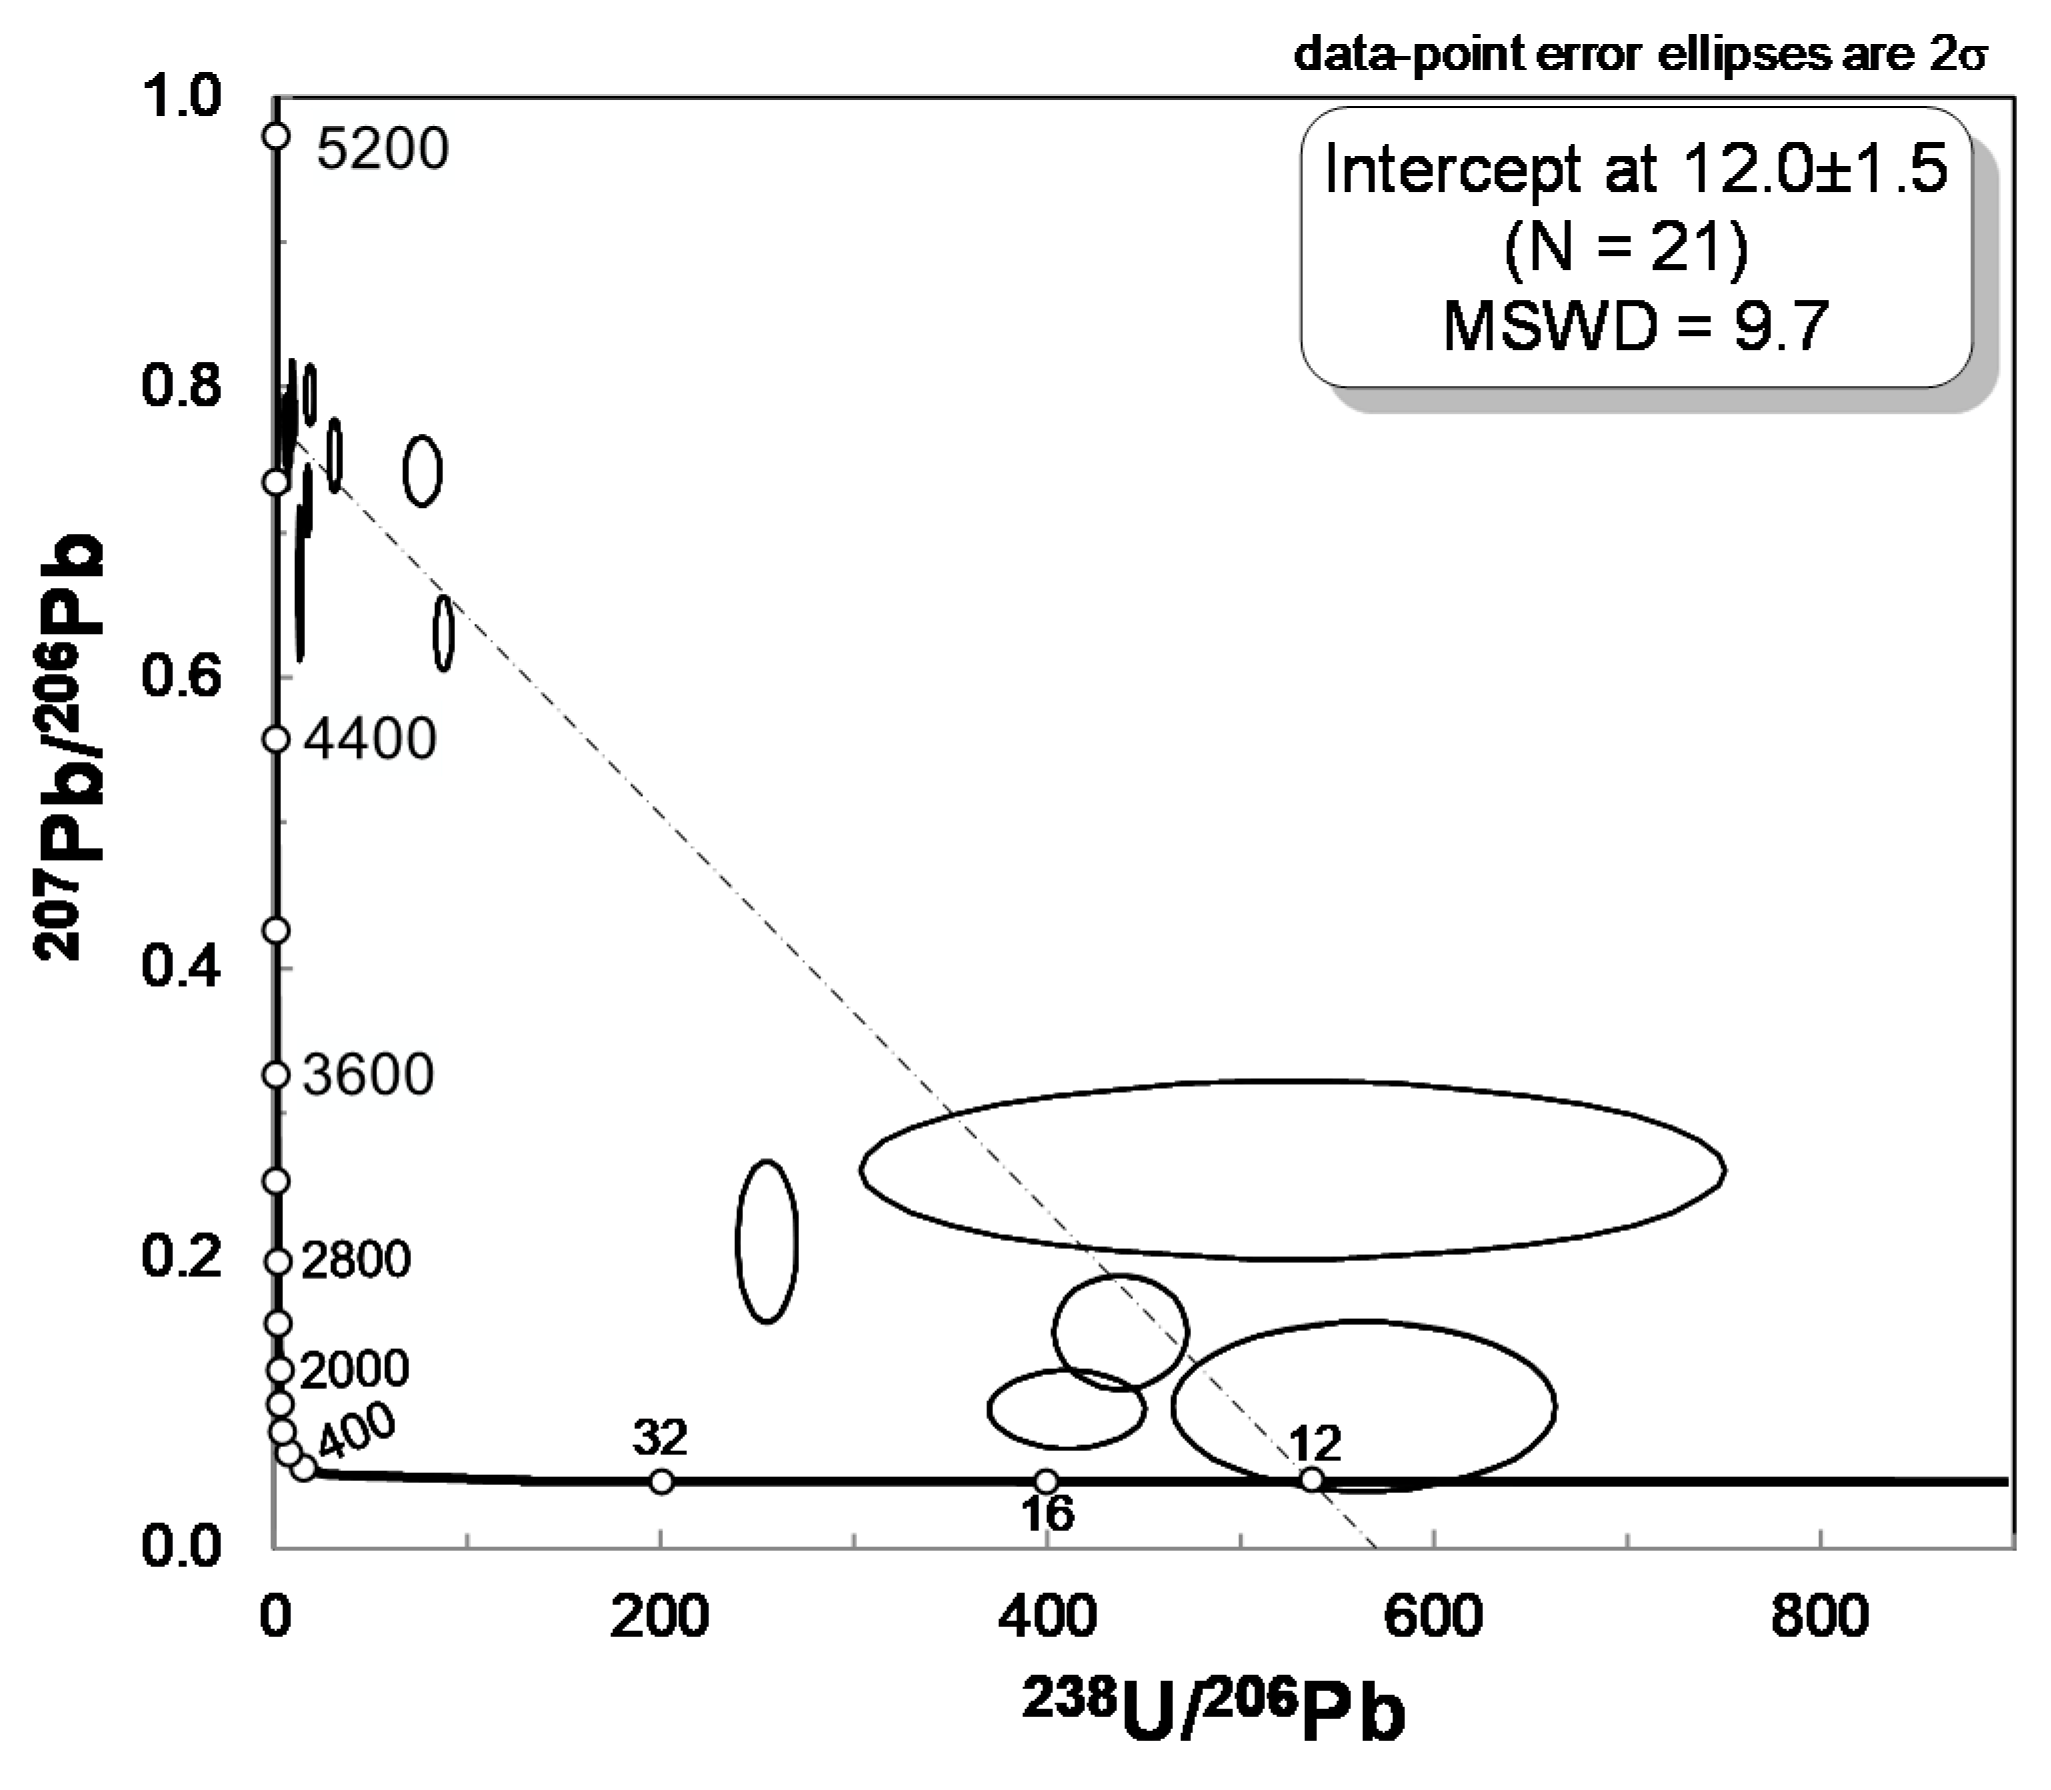
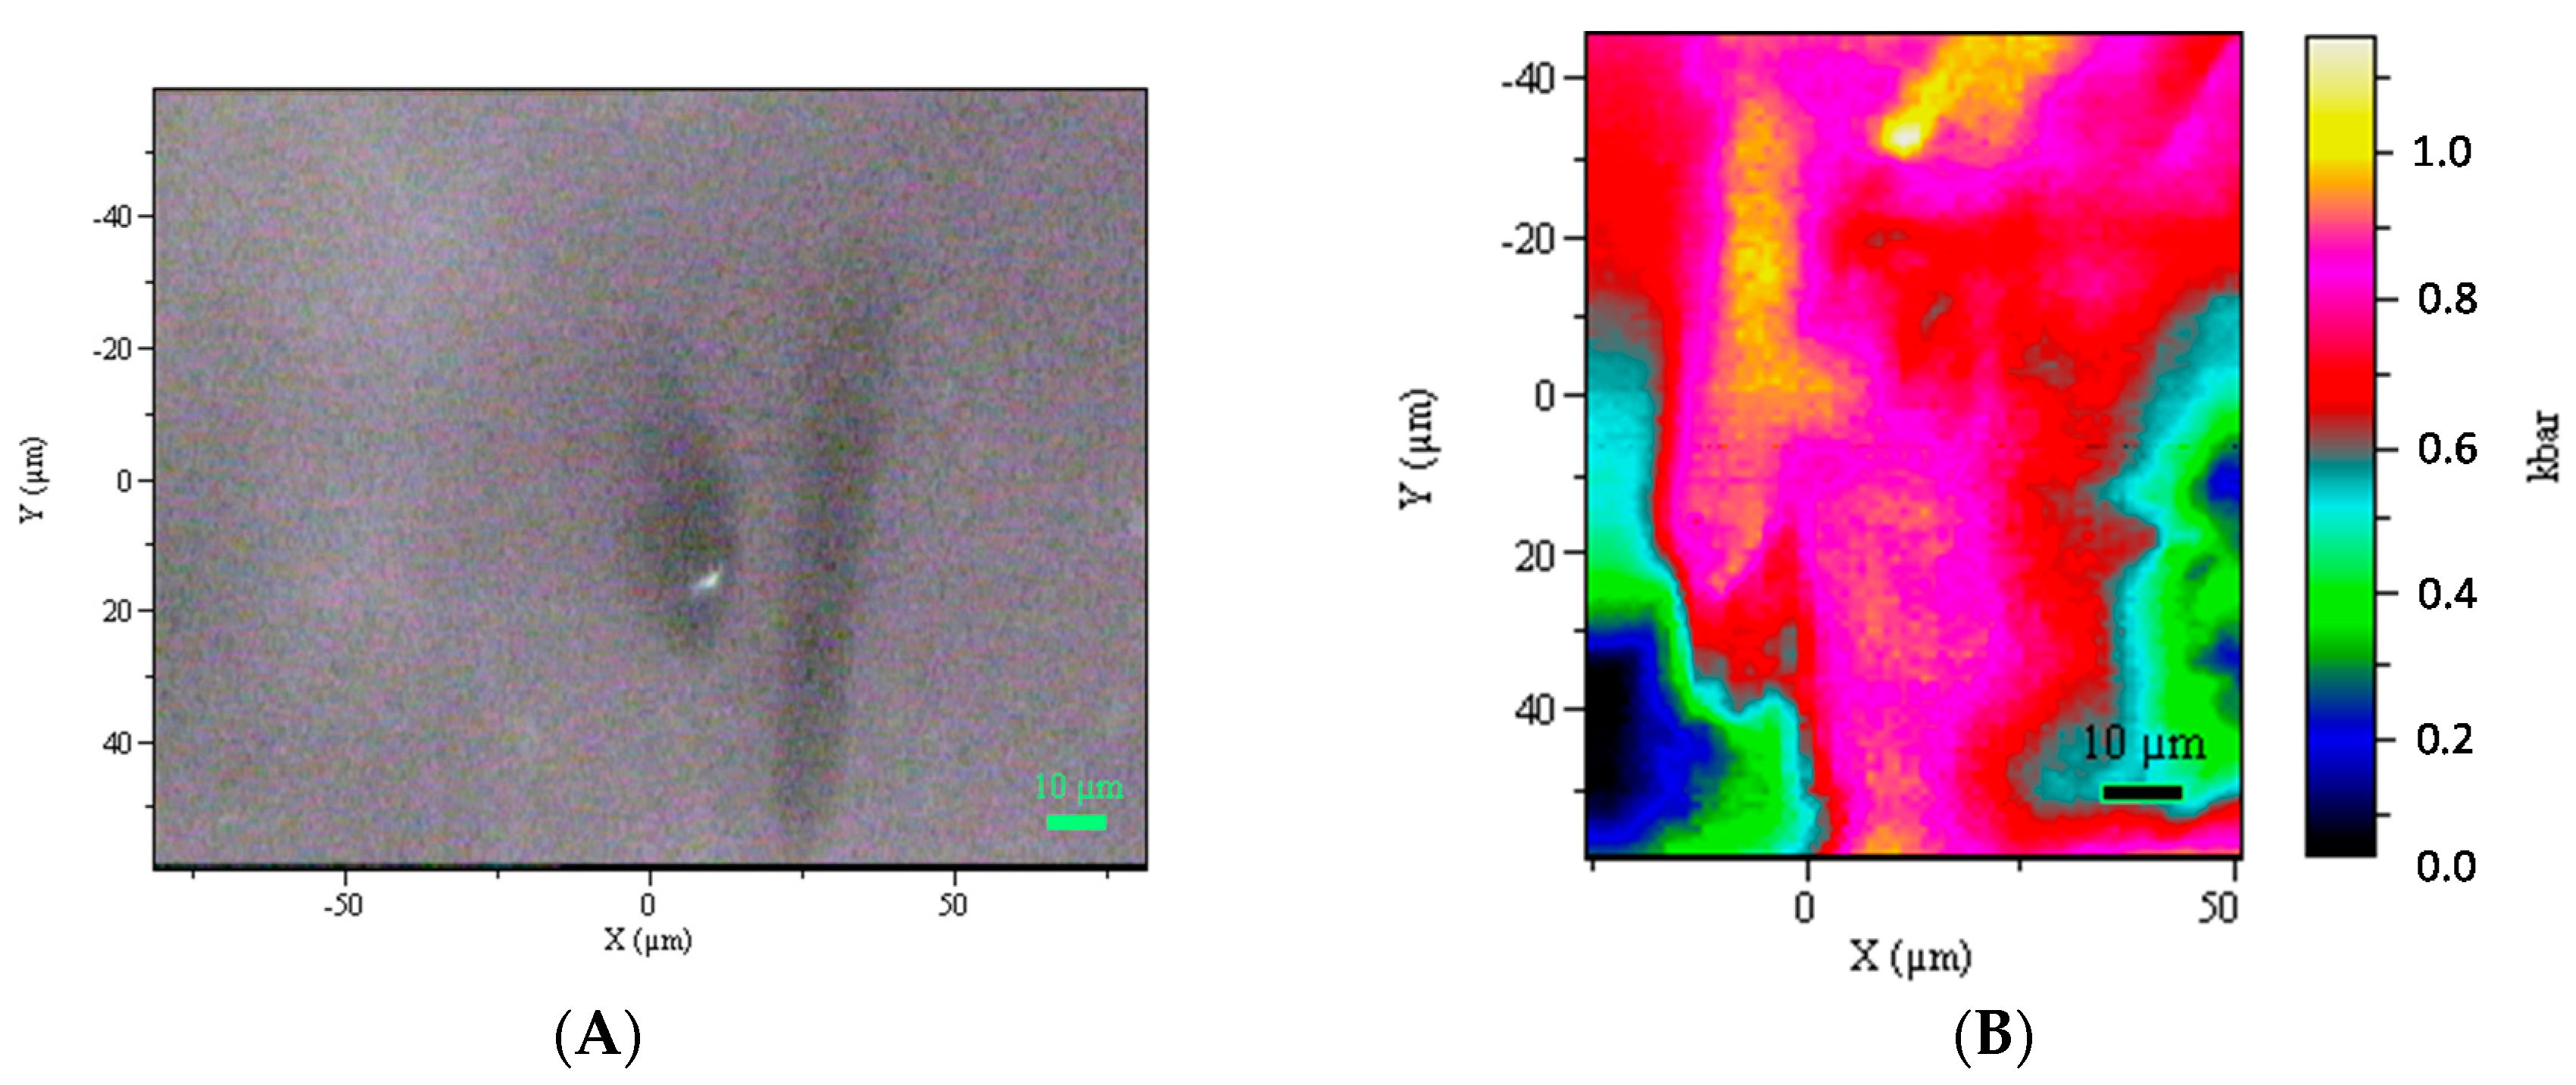
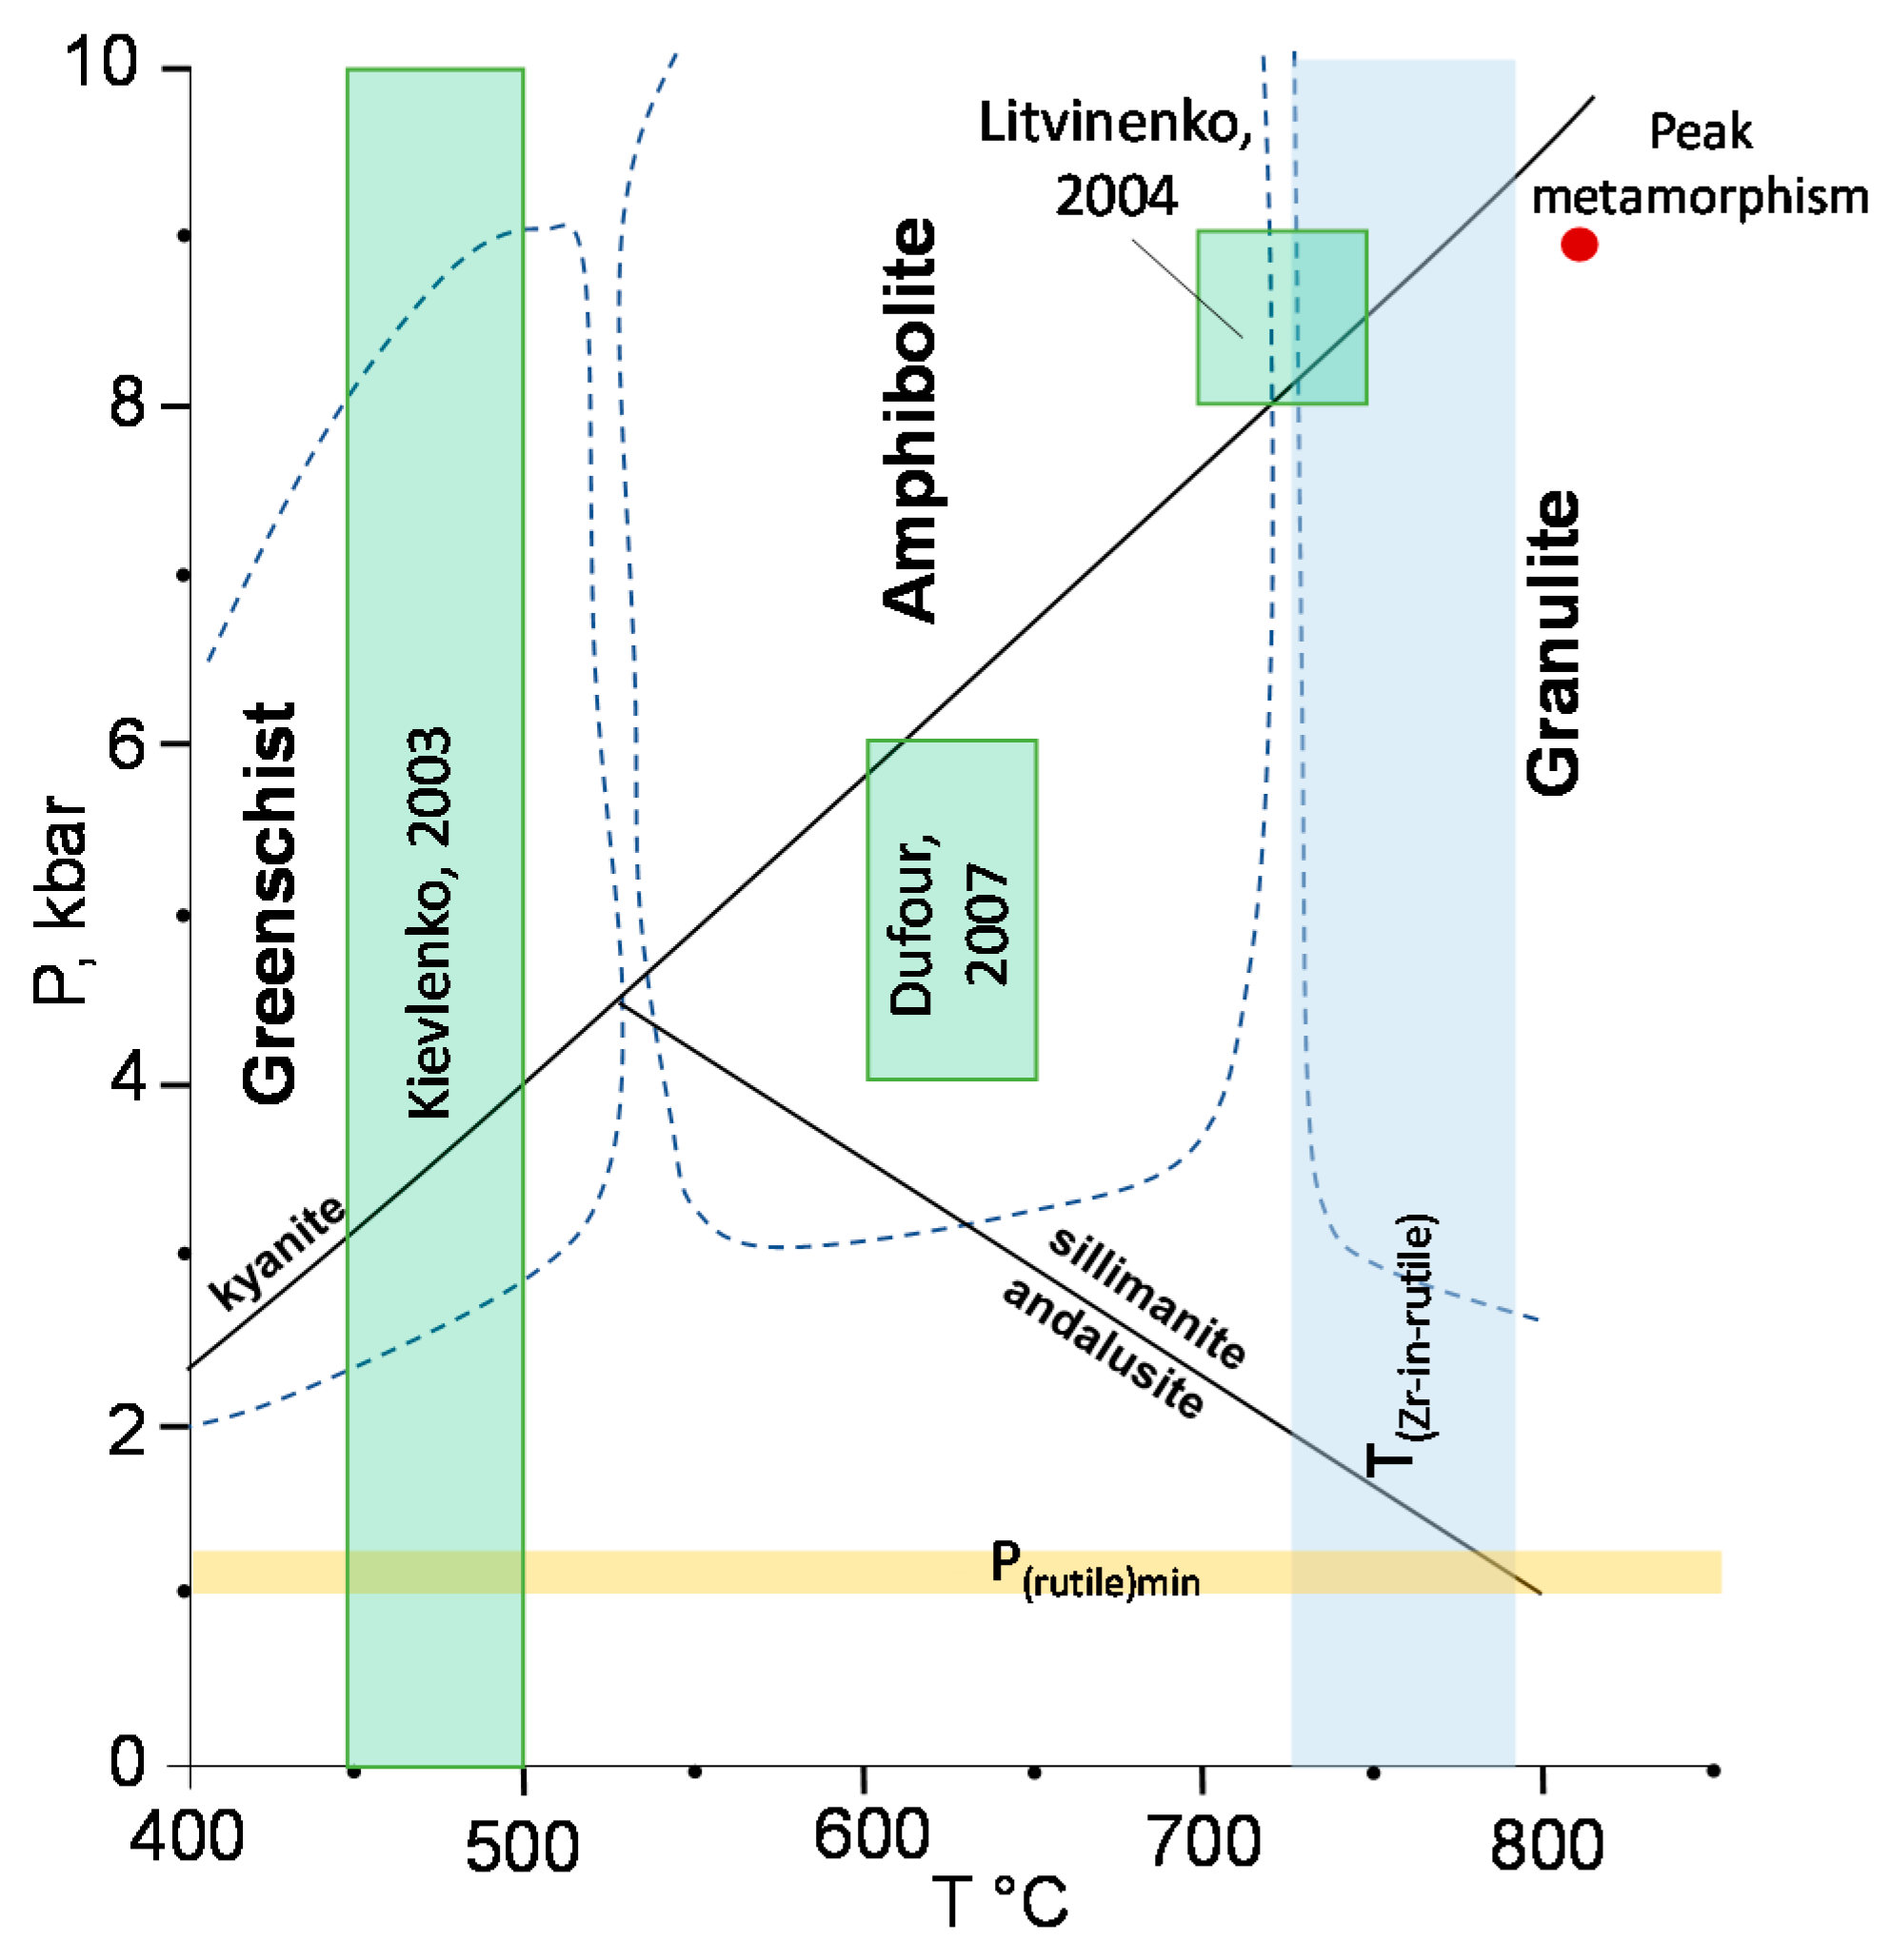
4.4. In Situ U–Pb LA–ICP–MS Rutile Dating, Zr-in-rutile Temperature and Raman Mapping of Rutile Inclusions
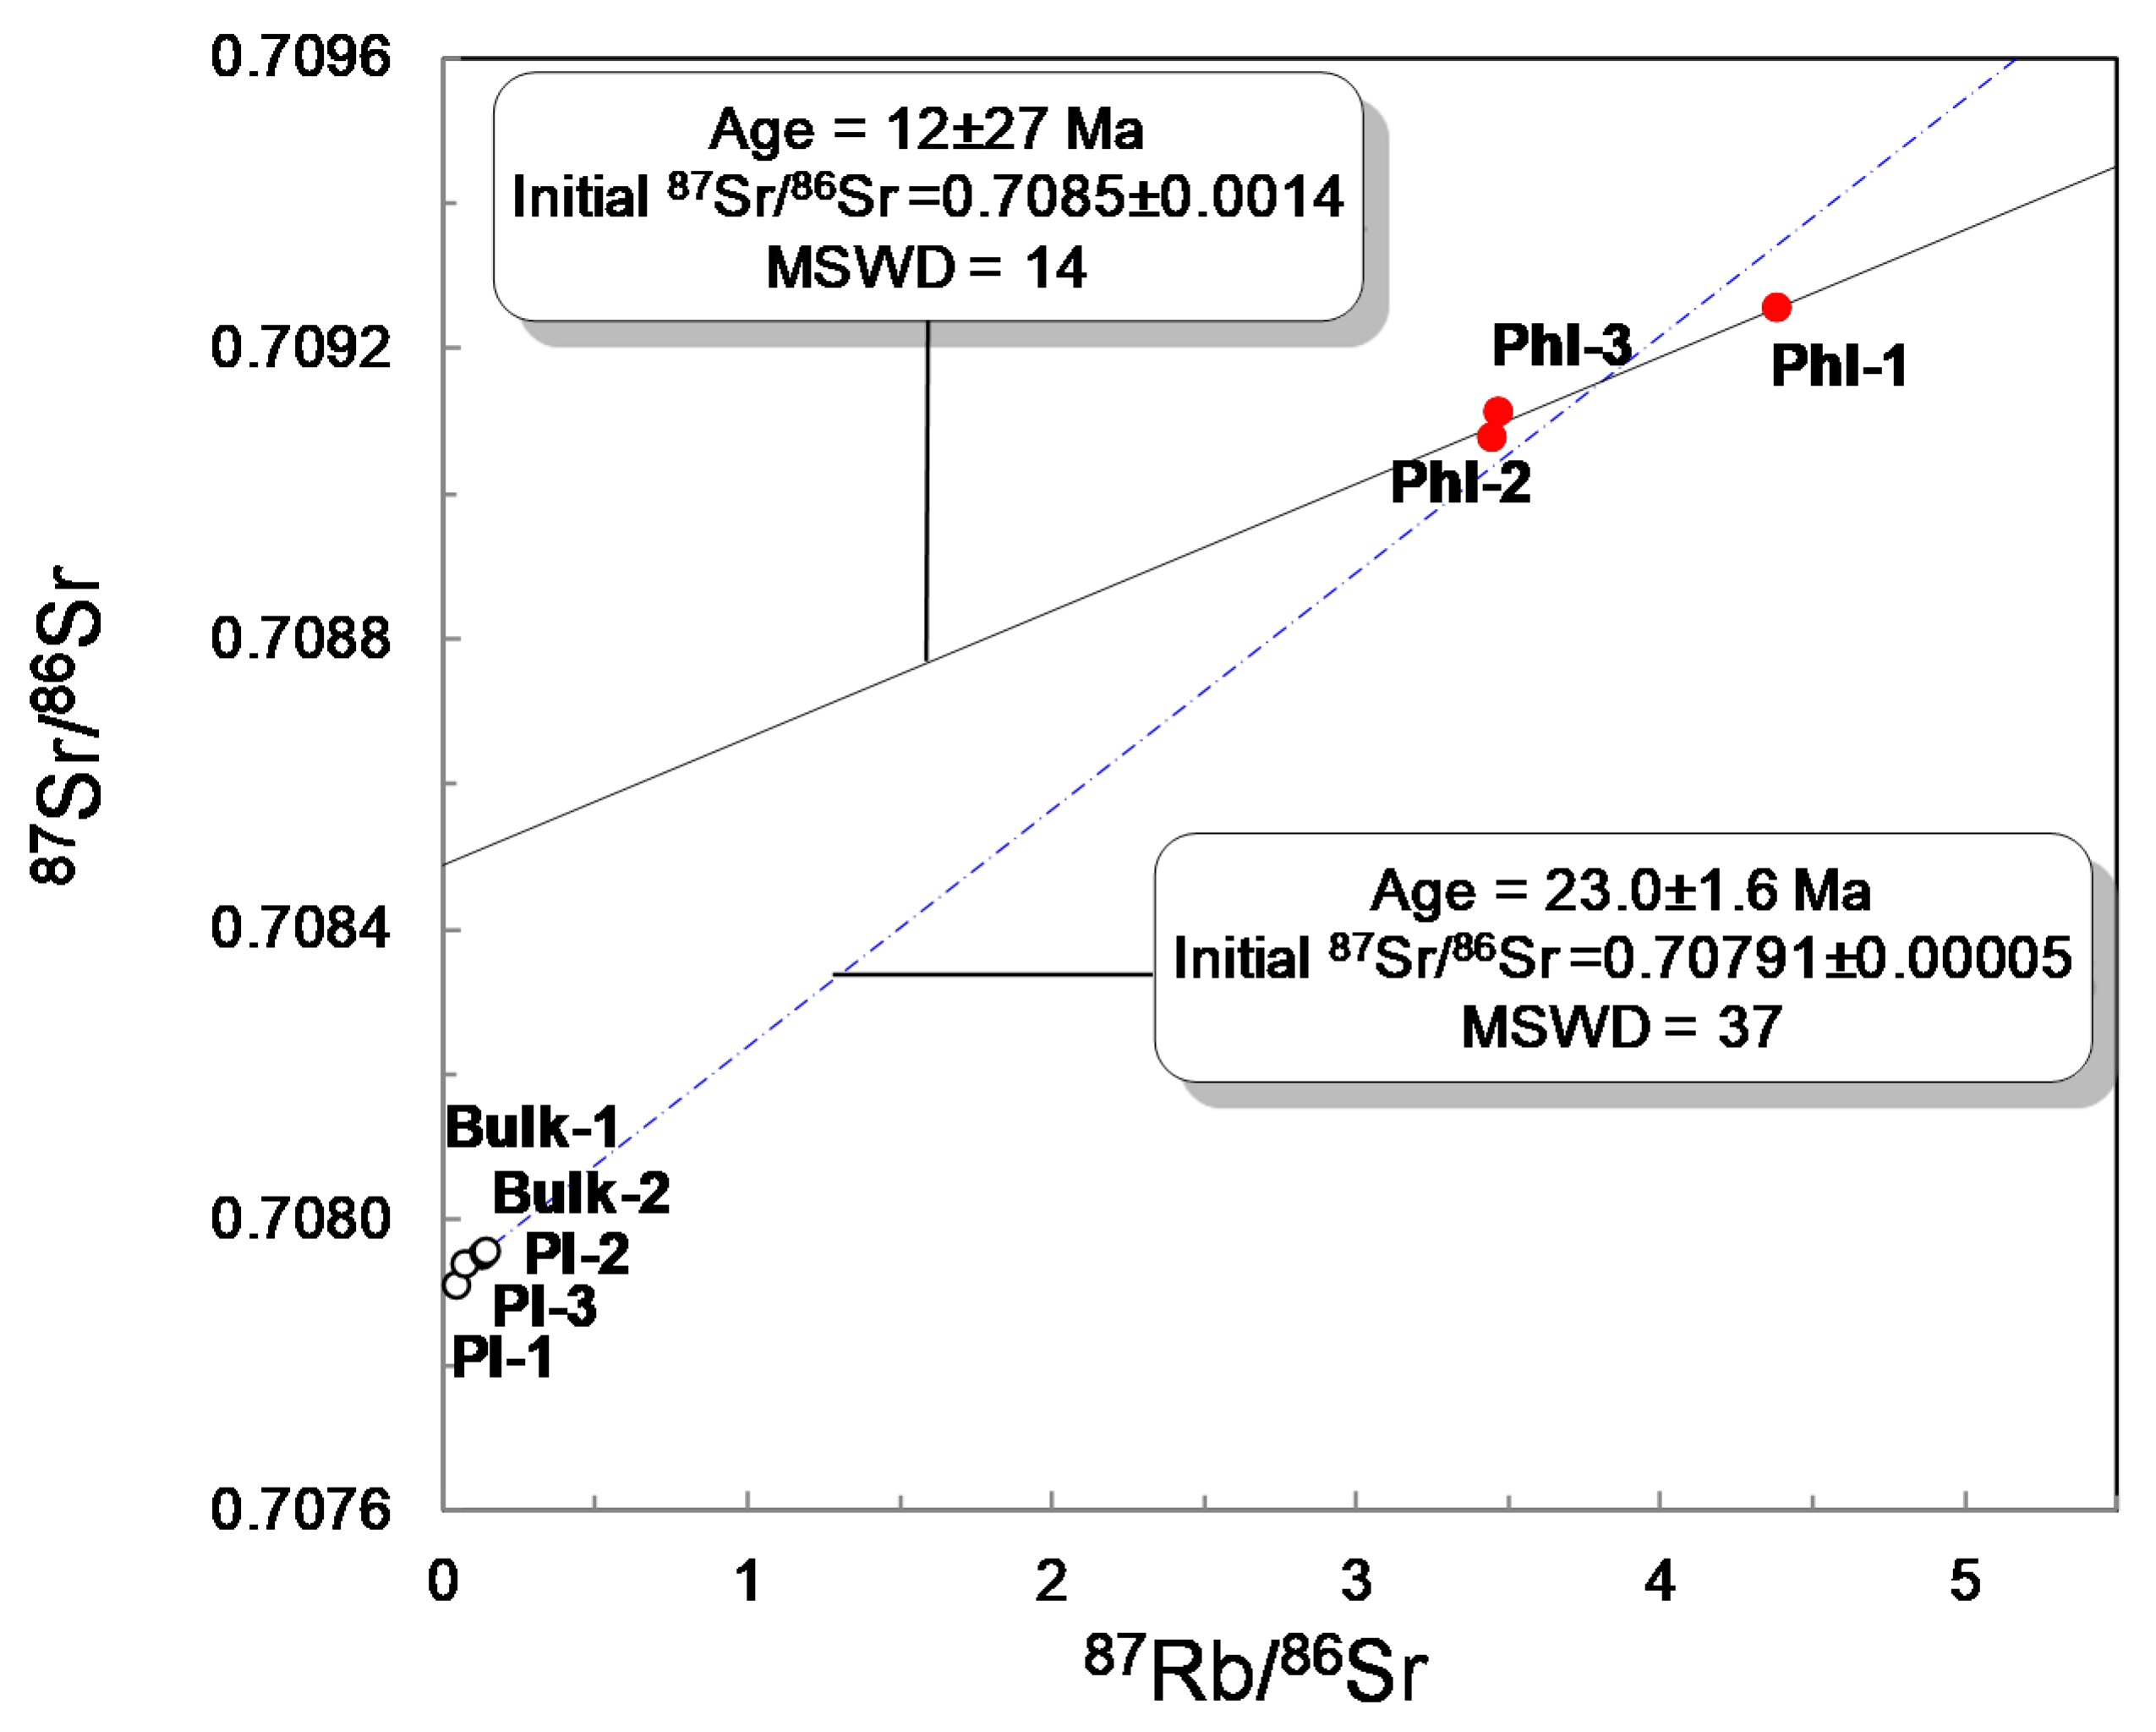
4.5. Rb–Sr and Sm–Nd Isotope Measurements
5. Discussion
5.1. Hypotheses of Origin of the Snezhnoe Ruby-Bearing Rocks
5.2. Origin of the Snezhnoe Ruby-Bearing Rocks
6. Conclusions
Supplementary Materials
Author Contributions
Funding
Acknowledgments
Conflicts of Interest
References
- Graham, I.; Sutherland, F.L.; Zaw, K.; Nechaev, V.; Khanchuk, A. Advances in our understanding of the gem corundum deposits of the West Pacific continental margins intraplate basaltic fields. Ore Geol. Rev. 2008, 34, 200–215. [Google Scholar] [CrossRef]
- Garnier, V.; Giuliani, G.; Ohnenstetter, D.; Fallick, A.E.; Dubessy, J.; Banks, D.; Hoàng Quang, V.; Lhomme, T.; Maluski, H.; Pêcher, A.; et al. Marble-hosted ruby deposits from Central and Southeast Asia: Towards a new genetic model. Ore Geol. Rev. 2008, 34, 169–191. [Google Scholar] [CrossRef]
- Stern, R.G.; Tsujimori, T.; Harlow, G.; Groat, L.A. Plate tectonic gemstones. Geology 2013, 41, 723–726. [Google Scholar] [CrossRef]
- Giuliani, G.; Ohnenstetter, D.; Fallick, A.E.; Groat, L.; Fagan, A.G. The geology and genesis of gem corundum deposits. In Geology of Gem Deposits, 2nd ed.; Groat, L.A., Ed.; Mineralogical Association of Canada: Tucson, AZ, USA, 2014; pp. 29–112. [Google Scholar]
- Sorokina, E.S.; Rösel, D.; Häger, T.; Mertz-Kraus, R.; Saul, J.M. LA-ICP-MS U–Pb dating of rutile inclusions within corundum (ruby and sapphire): New constraints on the formation of corundum deposits along the Mozambique belt. Miner. Depos. 2017, 52, 641–649. [Google Scholar] [CrossRef]
- Saul, J.M. Transparent gemstones and the most recent supercontinent cycle. Int. Geol. Rev. 2017, 60, 889–910. [Google Scholar] [CrossRef]
- Meng, F.; Shmelev, V.R.; Kulikova, K.V.; Ren, Y. A red-corundum-bearing vein in the Rai-Iz ultramafic rocks, Polar Urals, Russia: The product of fluid activity in a subduction zone. Lithos 2018, 320, 302–314. [Google Scholar] [CrossRef]
- Dmitriev, E.A. Types of corundum mineralization in the Precambrian marbles of the Muzkol-Rangkulsky anticlinorium. In Proceedings on Geology and Prospecting of the Gemstone Deposits of Tajikistan; Klimkin, A.V., Ed.; Donish: Dushanbe, Tajikistan, 1987; pp. 34–36. (In Russian) [Google Scholar]
- Dufour, M.S.; Kol’tsov, A.B.; Zolotarev, A.A.; Kuznetsov, A.B. Corundum-bearing metasomatic rocks in the Central Pamirs. Petrology 2007, 15, 151–167. [Google Scholar] [CrossRef]
- Barnov, N.G. Geological Conditions of Localization and Prerequisites for Industrial Mineralization of Ruby in Marbles Using the Example of the Snezhnoye Deposit (Central Pamir). Unpublished Ph.D. Thesis, MGRI, Moscow, Russia, 2010. (In Russian). [Google Scholar]
- Sorokina, E.S. Ontogeny and Quality of Gem Ruby from the Deposits of Central and South-East Asia. Unpublished Ph.D. Thesis, Fedorovsky All-Russian Research Institute of Mineral Resources, Moscow, Russia, 2011. (In Russian). [Google Scholar]
- Nasriddinov, Z.Z. Geological and Mineralogical Features, Determining Quality of Rough from Snezhnoe Deposit. Unpublished Ph.D. Thesis, Russian State Geological Prospecting University, Moscow, Russia, 2013. (In Russian). [Google Scholar]
- Barkhatov, B.P. Tectonics of the Pamirs; Leningrad University: Leningrad, USSR, 1963; 240p. (In Russian) [Google Scholar]
- Litvinenko, A.K.; Nasreddinov, Z.Z.; Sorokina, E.S. Margarite—Rock-forming mineral from Snezhnoe ruby deposit, Central Pamir. Proc. High. Educ. Establ. Geol. Explor. 2015, 4, 80–82. (In Russian) [Google Scholar]
- Sorokina, E.S.; Litvinenko, A.K.; Hofmeister, W.; Häger, T.; Jacob, D.E.; Nasriddinov, Z.Z. Rubies and Sapphires from Snezhnoe, Tajikistan. Gems Gemmol. 2015, 51, 160–175. [Google Scholar] [CrossRef]
- Baratov, R.B. Dismemberment of Stratified and Intrusive Rocks of Tajikistan; Donish: Dushanbe, Tajikistan, 1976; 268p. (In Russian) [Google Scholar]
- Budanov, V.I.; Budanova, K.T. Geological and petrological characteristics of the exposed crystalline basement. In The Earth’s Crust and the Upper Mantle of Tajikistan; Donish: Dushanbe, Tajikistan, 1993; 275p. (In Russian) [Google Scholar]
- Dufour, M.S.; Popova, V.A.; Krivets, T.N. Alpine Metamorphic Complex of the Eastern Part of the Central Pamirs; Leningrad University: Saint Petersburg, Russia, 1970; 126p. [Google Scholar]
- Budanova, K.T. Metamorphic Formations of Tajikistan; Donish: Dushanbe, Tajikistan, 1991; 336p. (In Russian) [Google Scholar]
- Litvinenko, A.K. Geology of Snezhnoe Ruby Deposit, Central Pamirs; Gornaya kniga: Moscow, Russia, 2020; 103p. (In Russian) [Google Scholar]
- Jochum, K.P.; Nohl, U.; Herwig, K.; Lammel, E.; Stoll, B.; Hofmann, A.W. GeoReM: A new geochemical database for reference materials and isotopic standards. Geostand. Geoanal. Res. 2005, 29, 333–338. [Google Scholar] [CrossRef]
- Jochum, K.P.; Weis, U.; Stoll, B.; Kuzmin, D.; Yang, Q.; Raczek, I.; Jacob, D.E.; Stracke, A.; Birbaum, K.; Frick, D.A.; et al. Determination of reference values for NIST SRM 610-617 glasses following ISO Guidelines. Geostand. Geoanal. Res. 2011, 35, 397–429. [Google Scholar] [CrossRef]
- Luvizotto, G.; Zack, T.; Meyer, H.P.; Ludwig, T.; Triebold, S.; Kronz, A.; Münker, C.; Stockli, D.; Prowatke, S.; Klemme, S.; et al. Rutile crystals as potential trace element and isotope mineral standards for microanalysis. Chem. Geol. 2009, 261, 346–369. [Google Scholar] [CrossRef]
- Axelsson, E.; Pape, J.; Berndt, J.; Corfu, F.; Mezger, K.; Raith, M.M. Rutile R632—A new natural reference material for U-Pb and Zr determination. Geostand. Geoanal. Res. 2018, 42, 319–338. [Google Scholar] [CrossRef]
- Kooijman, E.; Berndt, J.; Mezger, K. U-Pb dating of zircon by laser ablation ICP-MS: Recent improvements and new insights. Eur. J. Miner. 2012, 24, 5–21. [Google Scholar] [CrossRef]
- Mezger, K.; Hanson, G.N.; Bohlen, S.R. High-precision U–Pb ages of metamorphic rutile: Application to the cooling history of high-grade terranes. Earth Planet. Sci. Lett. 1989, 96, 106–118. [Google Scholar] [CrossRef]
- Ludwig, K.R. A User’s Manual; Berkeley Geochronology Center: Berkeley, CA, USA, 2009; p. 100. [Google Scholar]
- Wanthanachaisaeng, B.; Häger, T.; Hofmeister, W.; Nasdala, L. Raman-und fluoreszenz-spektroskopische Eigenschaften von Zirkon-Einschlüssen in chrom-haltigen Korunden aus Ilakaka und deren Veränderung durch Hitzebehandlung. Z Dt. Gemmol. Ges. 2006, 55, 119–131. (In German) [Google Scholar]
- Mariga, J.; Ripley, E.M.; Li, C.; McKeegan, K.D.; Schmidt, A.; Groove, M. Oxygen isotopic disequilibrium in plagioclase-corundum-hercynite xenoliths from the Voisey’s Bay Intrusion, Labrador, Canada. Earth Planet. Sci. Lett. 2006, 248, 263–275. [Google Scholar] [CrossRef]
- Sorokina, E.S.; Ozhogina, E.G.; Jacob, D.E.; Hofmeister, W. Some features of corundum ontogeny and the quality of ruby from Snezhnoe deposit, Tajikistan (the Eastern Pamirs). Zapiski RMO (Proc. Russ. Mineral. Soc.) 2012, 141, 100–108. (In Russian) [Google Scholar]
- Sorokina, E.S.; Hofmeister, W.; Häger, T.; Mertz-Kraus, R.; Buhre, S.; Saul, J.M. Morphological and chemical evolution of corundum (ruby and sapphire): Crystal ontogeny reconstructed by EMPA, LA-ICP-MS, and Cr3+ Raman mapping. Am. Mineral. 2016, 101, 2716–2722. [Google Scholar] [CrossRef]
- Peucat, J.J.; Ruffault, P.; Fritch, E.; Bouhnik-Le-Coz, M.; Simonet, C.; Lasnier, B. Ga/Mg ratio as a new geochemical tool to differentiate magmatic from metamorphic blue sapphires. Lithos 2007, 98, 261–274. [Google Scholar] [CrossRef]
- Sutherland, F.L.; Abduriyim, A. Geographic typing of gem corundum: A test case from Australia. J. Gemmol. 2009, 31, 203–210. [Google Scholar] [CrossRef]
- Giuliani, G.; Caumon, G.; Rakotosamizanany, S.; Ohnenstetter, D.; Rakototondrazafy, M. Classification chimique des corindons par analyse factorielle discriminante: Application à la typologie des gisements de rubis et saphirs. Rev. Gemmol. 2014, 188, 14–22. [Google Scholar]
- Giuliani, G.; Fallick, A.E.; Garnier, V.; France-Lanord, C.; Ohnenstetter, D.; Schwarz, D. Oxygen isotope composition as a tracer for the origins of rubies and sapphires. Geology 2005, 33, 249–252. [Google Scholar] [CrossRef]
- Yaroshevsky, A.A. Abundances of chemical elements in the Earth’s crust. Geochem. Int. 2006, 44, 48–55. [Google Scholar] [CrossRef]
- Kostitsyn, Y.A.; Belousova, E.A.; Silant’ev, S.A.; Bortnikov, N.S.; Anosova, M.O. Modern problems of geochemical and U-Pb geochronological studies of zircon in oceanic rocks. Geochem. Int. 2005, 53, 759–785. [Google Scholar] [CrossRef]
- Zack, T.; Moraes, R.; Kronz, A. Temperature dependence of Zr in rutile: Empirical calibration of a rutile thermometer. Contrib. Mineral. Petrol. 2004, 148, 471–488. [Google Scholar] [CrossRef]
- Watson, E.B.; Wark, D.A.; Thomas, J.B. Crystallization thermometers for zircon and rutile. Contrib. Mineral. Petrol. 2006, 151, 413–433. [Google Scholar] [CrossRef]
- Kievlenko, E.Y. Geology of Gems; Soregaroli, A., Ed.; Ocean Pictures Ltd.: Littleton, CO, USA, 2003; 432p. [Google Scholar]
- Dmitriev, E.A.; Ishan-Sho, G.A. Chromium-bearing muscovites in metamorphic and hydrothermal formations of the Pamirs. Zapiski VMO (Proc. All-Union Mineral. Soc.) 1987, 116, 690–697. (In Russian) [Google Scholar]
- Terekhov, E.N.; Akimov, A.P. Tectonic setting and genesis of the gem corundum deposits of High Azia. Lithosphere 2013, 5, 122–140. (In Russian) [Google Scholar]
- Rossovskiy, L.N.; Konovalenko, S.I.; Ananjev, S.A. Conditions of ruby formation in marbles. Geol. Rudn. Mestorozhd. 1982, 24, 57–66. (In Russian) [Google Scholar]
- Rossovsky, L.N. Ruby and sapphire deposits of the Alpine-Himalayan fold belt and their formation conditions. In Proceedings on Geology and Prospecting of Gemstone Deposits in Tajikistan; Klimkin, A.V., Ed.; Donish: Dushanbe, Tajikistan, 1987; pp. 36–38. (In Russian) [Google Scholar]
- Litvinenko, A.K. Nuristan-South Pamir province of Precambrian gems. Geol. Ore Deposit. 2004, 46, 263–268. [Google Scholar]
- Litvinenko, A.K. The reconstruction of bauxite-like sediments in the Early Proterozoic metamorphites of the Central Pamir. In Proceedings of the Materials of the 5th All-Russian Lithologic Conference “the Types of Sedimentogenesis and Lithogenesis and Their Evolution in the History of the Earth”, Ekaterinburg, Russia, 14–16 October 2008; pp. 428–430. (In Russian). [Google Scholar]
- Predovsky, A.A. Reconstruction of Conditions of Sedimentogenesis and Volcanism of Early Precambrian; Nauka: Leningrad, USSR, 1980; 152p. (In Russian) [Google Scholar]
- Golovenok, V.K. High-Alumina Precambrian Formations; Nedra: Leningrad, USSR, 1977; 267p. (In Russian) [Google Scholar]
- Budanova, K.T. Mineralogical and petrochemical characteristics of high-alumina rocks in the eastern part of Central Pamir. Proc. AS Repub. Tajikistan (Zap. AN Resp. Tadjikistan). 1993, 1, 26–33. (In Russian) [Google Scholar]
- Giuliani, G.; Fallick, A.E.; Rakotondrazafy, A.F.M.; Ohnenstetter, D.; Andriamamonjy, A.; Rakotosamizanany, S.; Ralantoarison, T.; Razanatseheno, M.M.; Dunaigre, C.; Schwarz, D. Oxygen isotope systematics of gem corundum deposits in Madagascar: Relevance for their geological origin. Miner. Deposita 2007, 42, 251. [Google Scholar] [CrossRef]
- Ferry, J.M.; Watson, E.B. New thermodynamic models and revised calibrations for the Ti-in-zircon and Zr-in-rutile thermometers. Contrib. Mineral. Petrol. 2007, 154, 429–437. [Google Scholar] [CrossRef]
- Bohlen, S.; Montana, A.; Kerrick, D.M. Precise determination of the equilibria kyanite=sillimanite and kyanite=andalusite and a revised triple point for Al2SiO5 polymorphs. Am. Mineral. 1991, 76, 677–680. [Google Scholar]
- Phyo, M.M.; Wang, H.A.; Guillong, M.; Berger, A.; Franz, L.; Balmer, W.A.; Krzemnicki, M.S. U–Pb Dating of Zircon and Zirconolite Inclusions in Marble-Hosted Gem-Quality Ruby and Spinel from Mogok, Myanmar. Minerals 2020, 10, 195. [Google Scholar] [CrossRef]
- Mattauer, M.; Matte, P.; Jolivet, J.L. A 3D model of the India-Asia collision at late scale. Comptes Rendus 1999, 328, 499–508. [Google Scholar]


| Minerals/Mineral Class | Major and Minor Minerals (Methods Applied *) | Accessory Minerals (Methods Applied) |
|---|---|---|
| Oxides | Corundum (LA–ICP–MS geochemistry, SIMS oxygen isotopy) | Rutile (U–Pb LA–ICP–MS dating, Raman mapping) Ilmenite + Nb-rich rutile Magnetite |
| Alumino-silicates | Plagioclase (TIMS Rb–Sr/Sm–Nd isotopy) Phlogopite (TIMS Rb–Sr/Sm–Nd isotopy) Muscovite Margarite | Corundophillite |
| Silicates | Scapolite | Zircon Titanite Tourmaline Thorite Dissakisite-(Ce) |
| Carbonates | Calcite | REE carbonates Dolomite |
| Sulfides | Pyrite Pyrrhotite Chalcopyrite | |
| Phosphates | Xenotime-(Y) Monazite-(Ce) Fluorapatite | |
| Native element | Graphite |
© 2020 by the authors. Licensee MDPI, Basel, Switzerland. This article is an open access article distributed under the terms and conditions of the Creative Commons Attribution (CC BY) license (http://creativecommons.org/licenses/by/4.0/).
Share and Cite
Litvinenko, A.K.; Sorokina, E.S.; Häger, T.; Kostitsyn, Y.A.; Botcharnikov, R.E.; Somsikova, A.V.; Ludwig, T.; Romashova, T.V.; Hofmeister, W. Petrogenesis of the Snezhnoe Ruby Deposit, Central Pamir. Minerals 2020, 10, 478. https://doi.org/10.3390/min10050478
Litvinenko AK, Sorokina ES, Häger T, Kostitsyn YA, Botcharnikov RE, Somsikova AV, Ludwig T, Romashova TV, Hofmeister W. Petrogenesis of the Snezhnoe Ruby Deposit, Central Pamir. Minerals. 2020; 10(5):478. https://doi.org/10.3390/min10050478
Chicago/Turabian StyleLitvinenko, Andrey K., Elena S. Sorokina, Tobias Häger, Yuri A. Kostitsyn, Roman E. Botcharnikov, Alina V. Somsikova, Thomas Ludwig, Tatiana V. Romashova, and Wolfgang Hofmeister. 2020. "Petrogenesis of the Snezhnoe Ruby Deposit, Central Pamir" Minerals 10, no. 5: 478. https://doi.org/10.3390/min10050478
APA StyleLitvinenko, A. K., Sorokina, E. S., Häger, T., Kostitsyn, Y. A., Botcharnikov, R. E., Somsikova, A. V., Ludwig, T., Romashova, T. V., & Hofmeister, W. (2020). Petrogenesis of the Snezhnoe Ruby Deposit, Central Pamir. Minerals, 10(5), 478. https://doi.org/10.3390/min10050478