A Study of Temperature Effect on the Xanthate’s Performance during Chalcopyrite Flotation


Abstract
:1. Introduction
2. Materials and Methods
2.1. Materials
2.2. Contact Angle Measurement
2.3. Fourier Transform Infrared Spectroscopy-Attenuated Total Reflectance (FTIR-ATR) Measurement
2.4. Atomic Force Microscopy (AFM) Surface Image Measurement
2.5. Hallimond Tube Microflotation Tests
2.6. Lab Flotation Tests
2.7. Surface Tension Measurements
3. Results
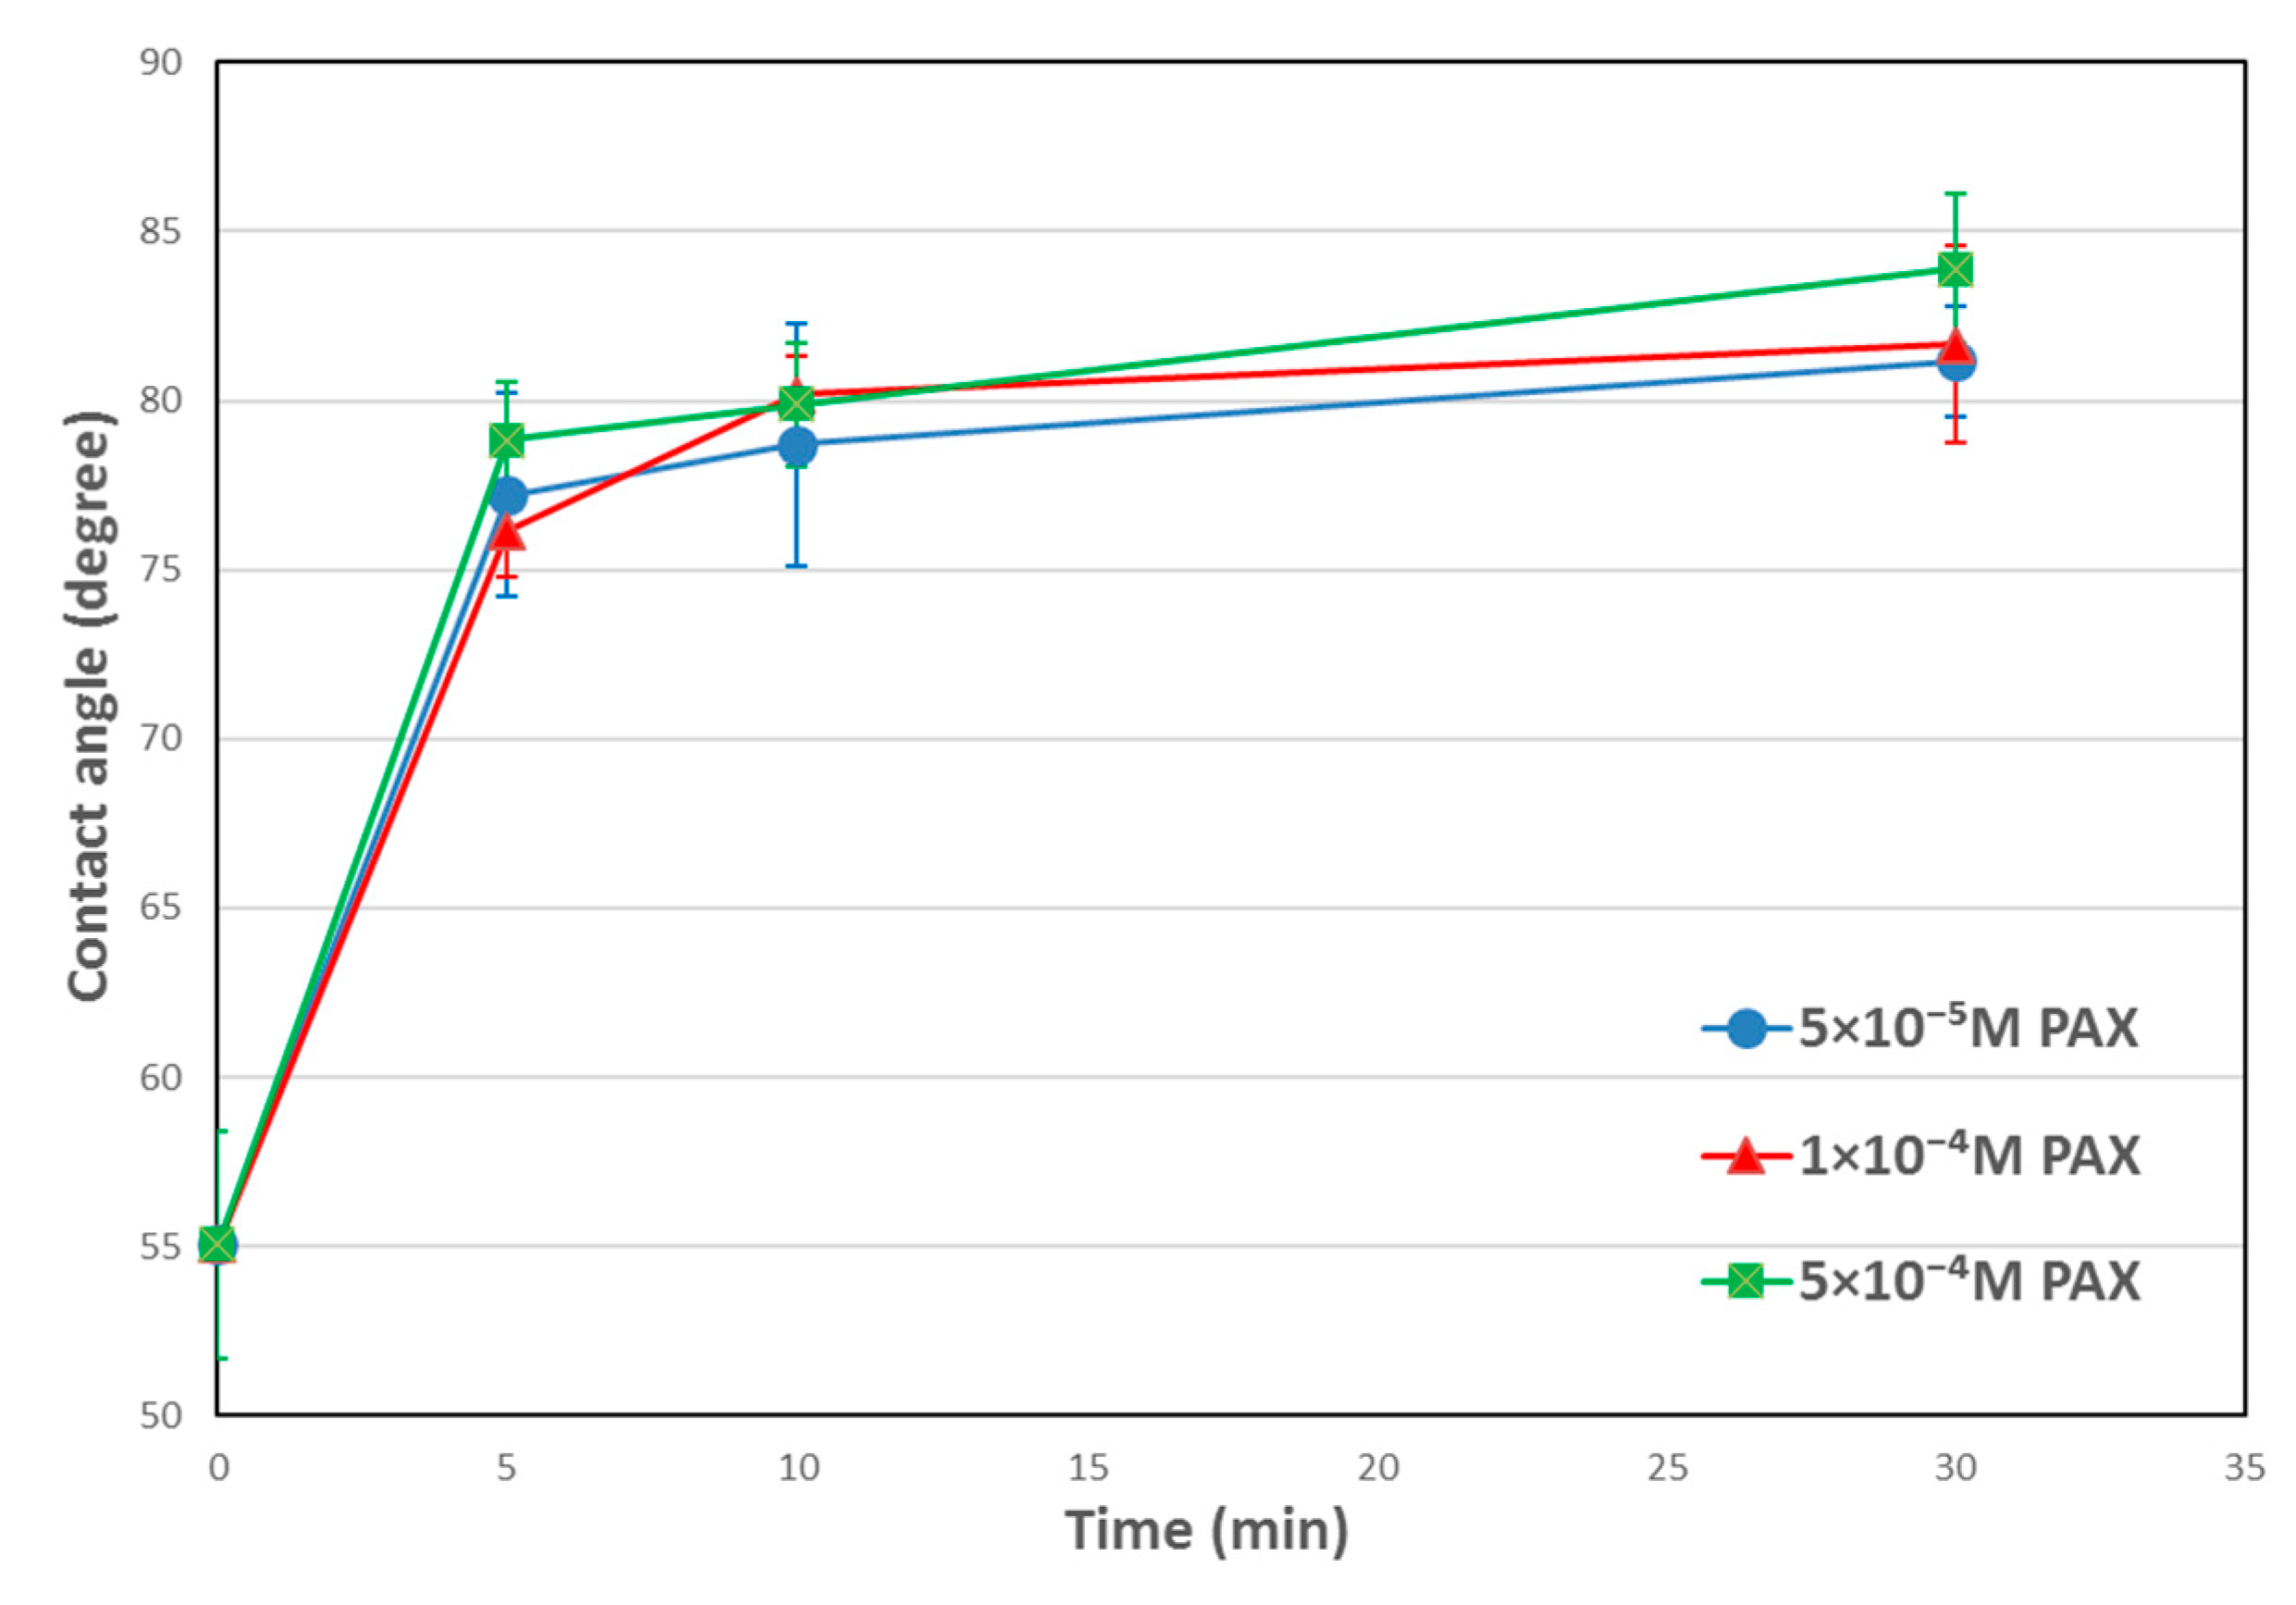
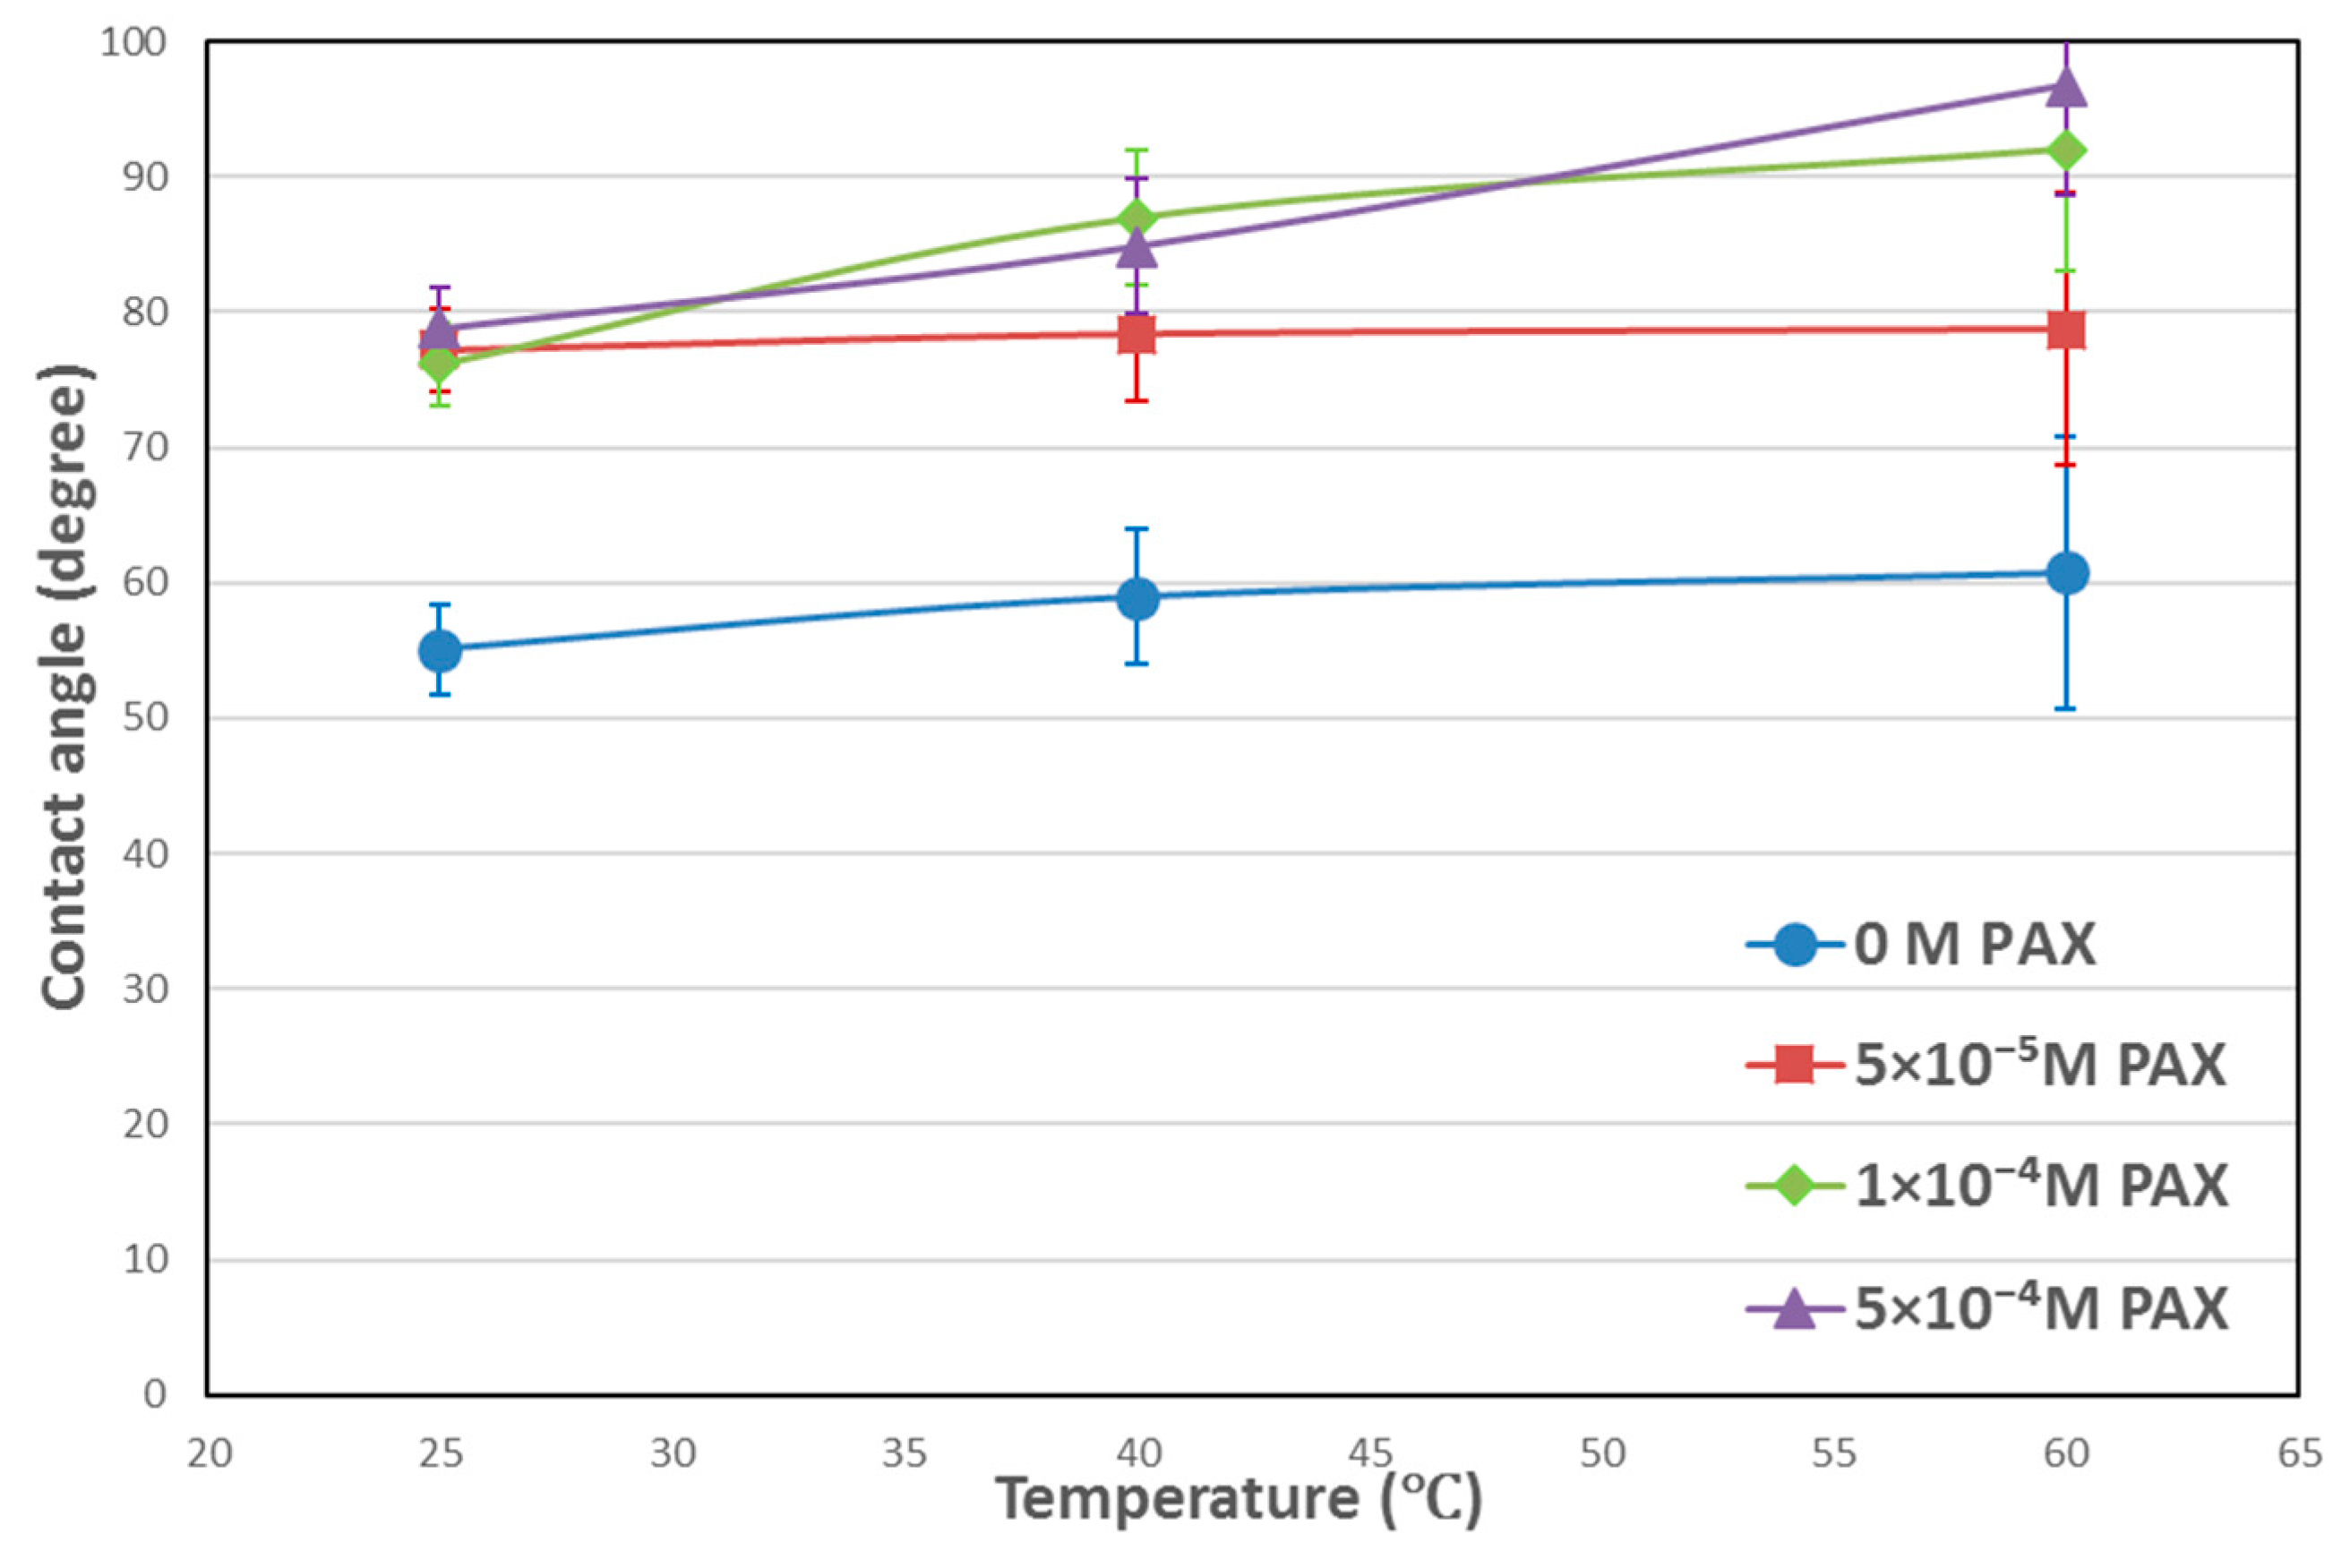
3.1. Contact Angle Results
3.2. Microflotation Results
3.3. FTIR Results
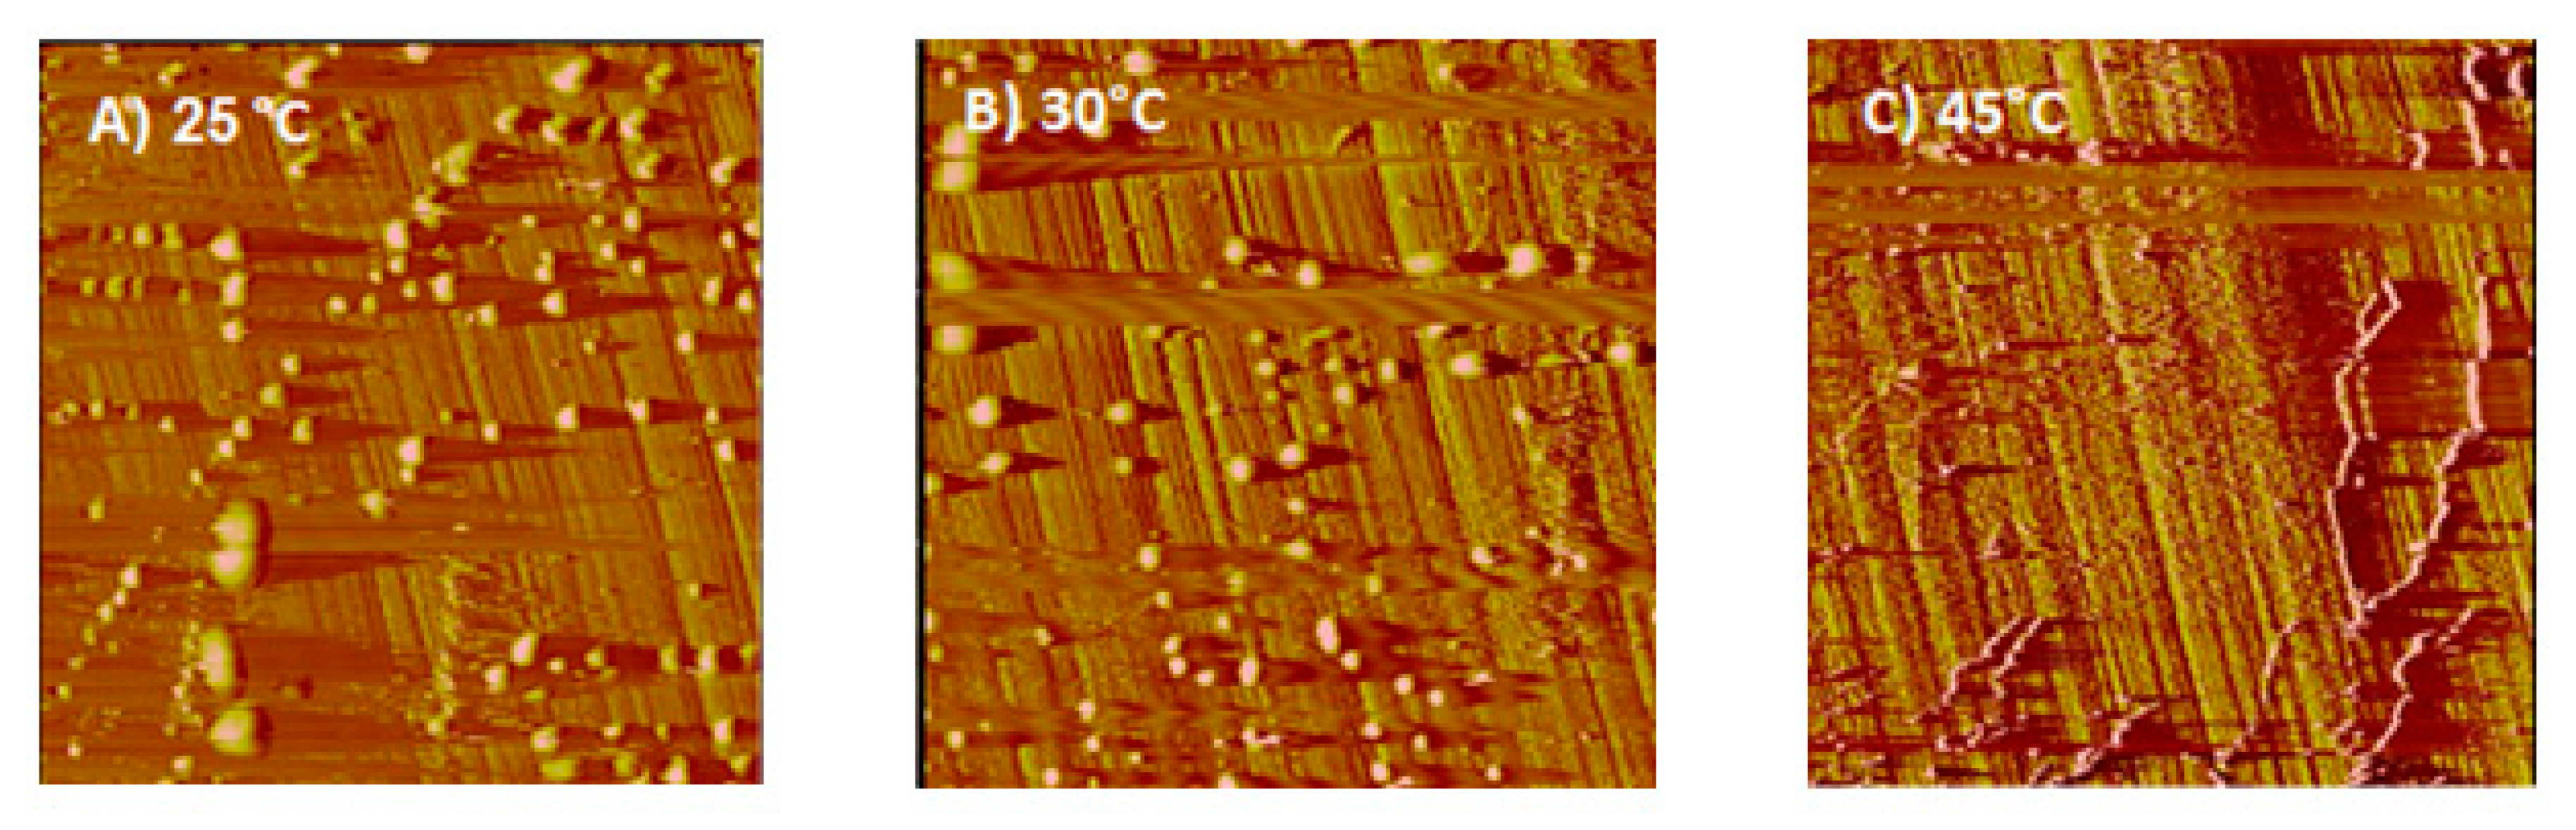
3.4. AFM Results
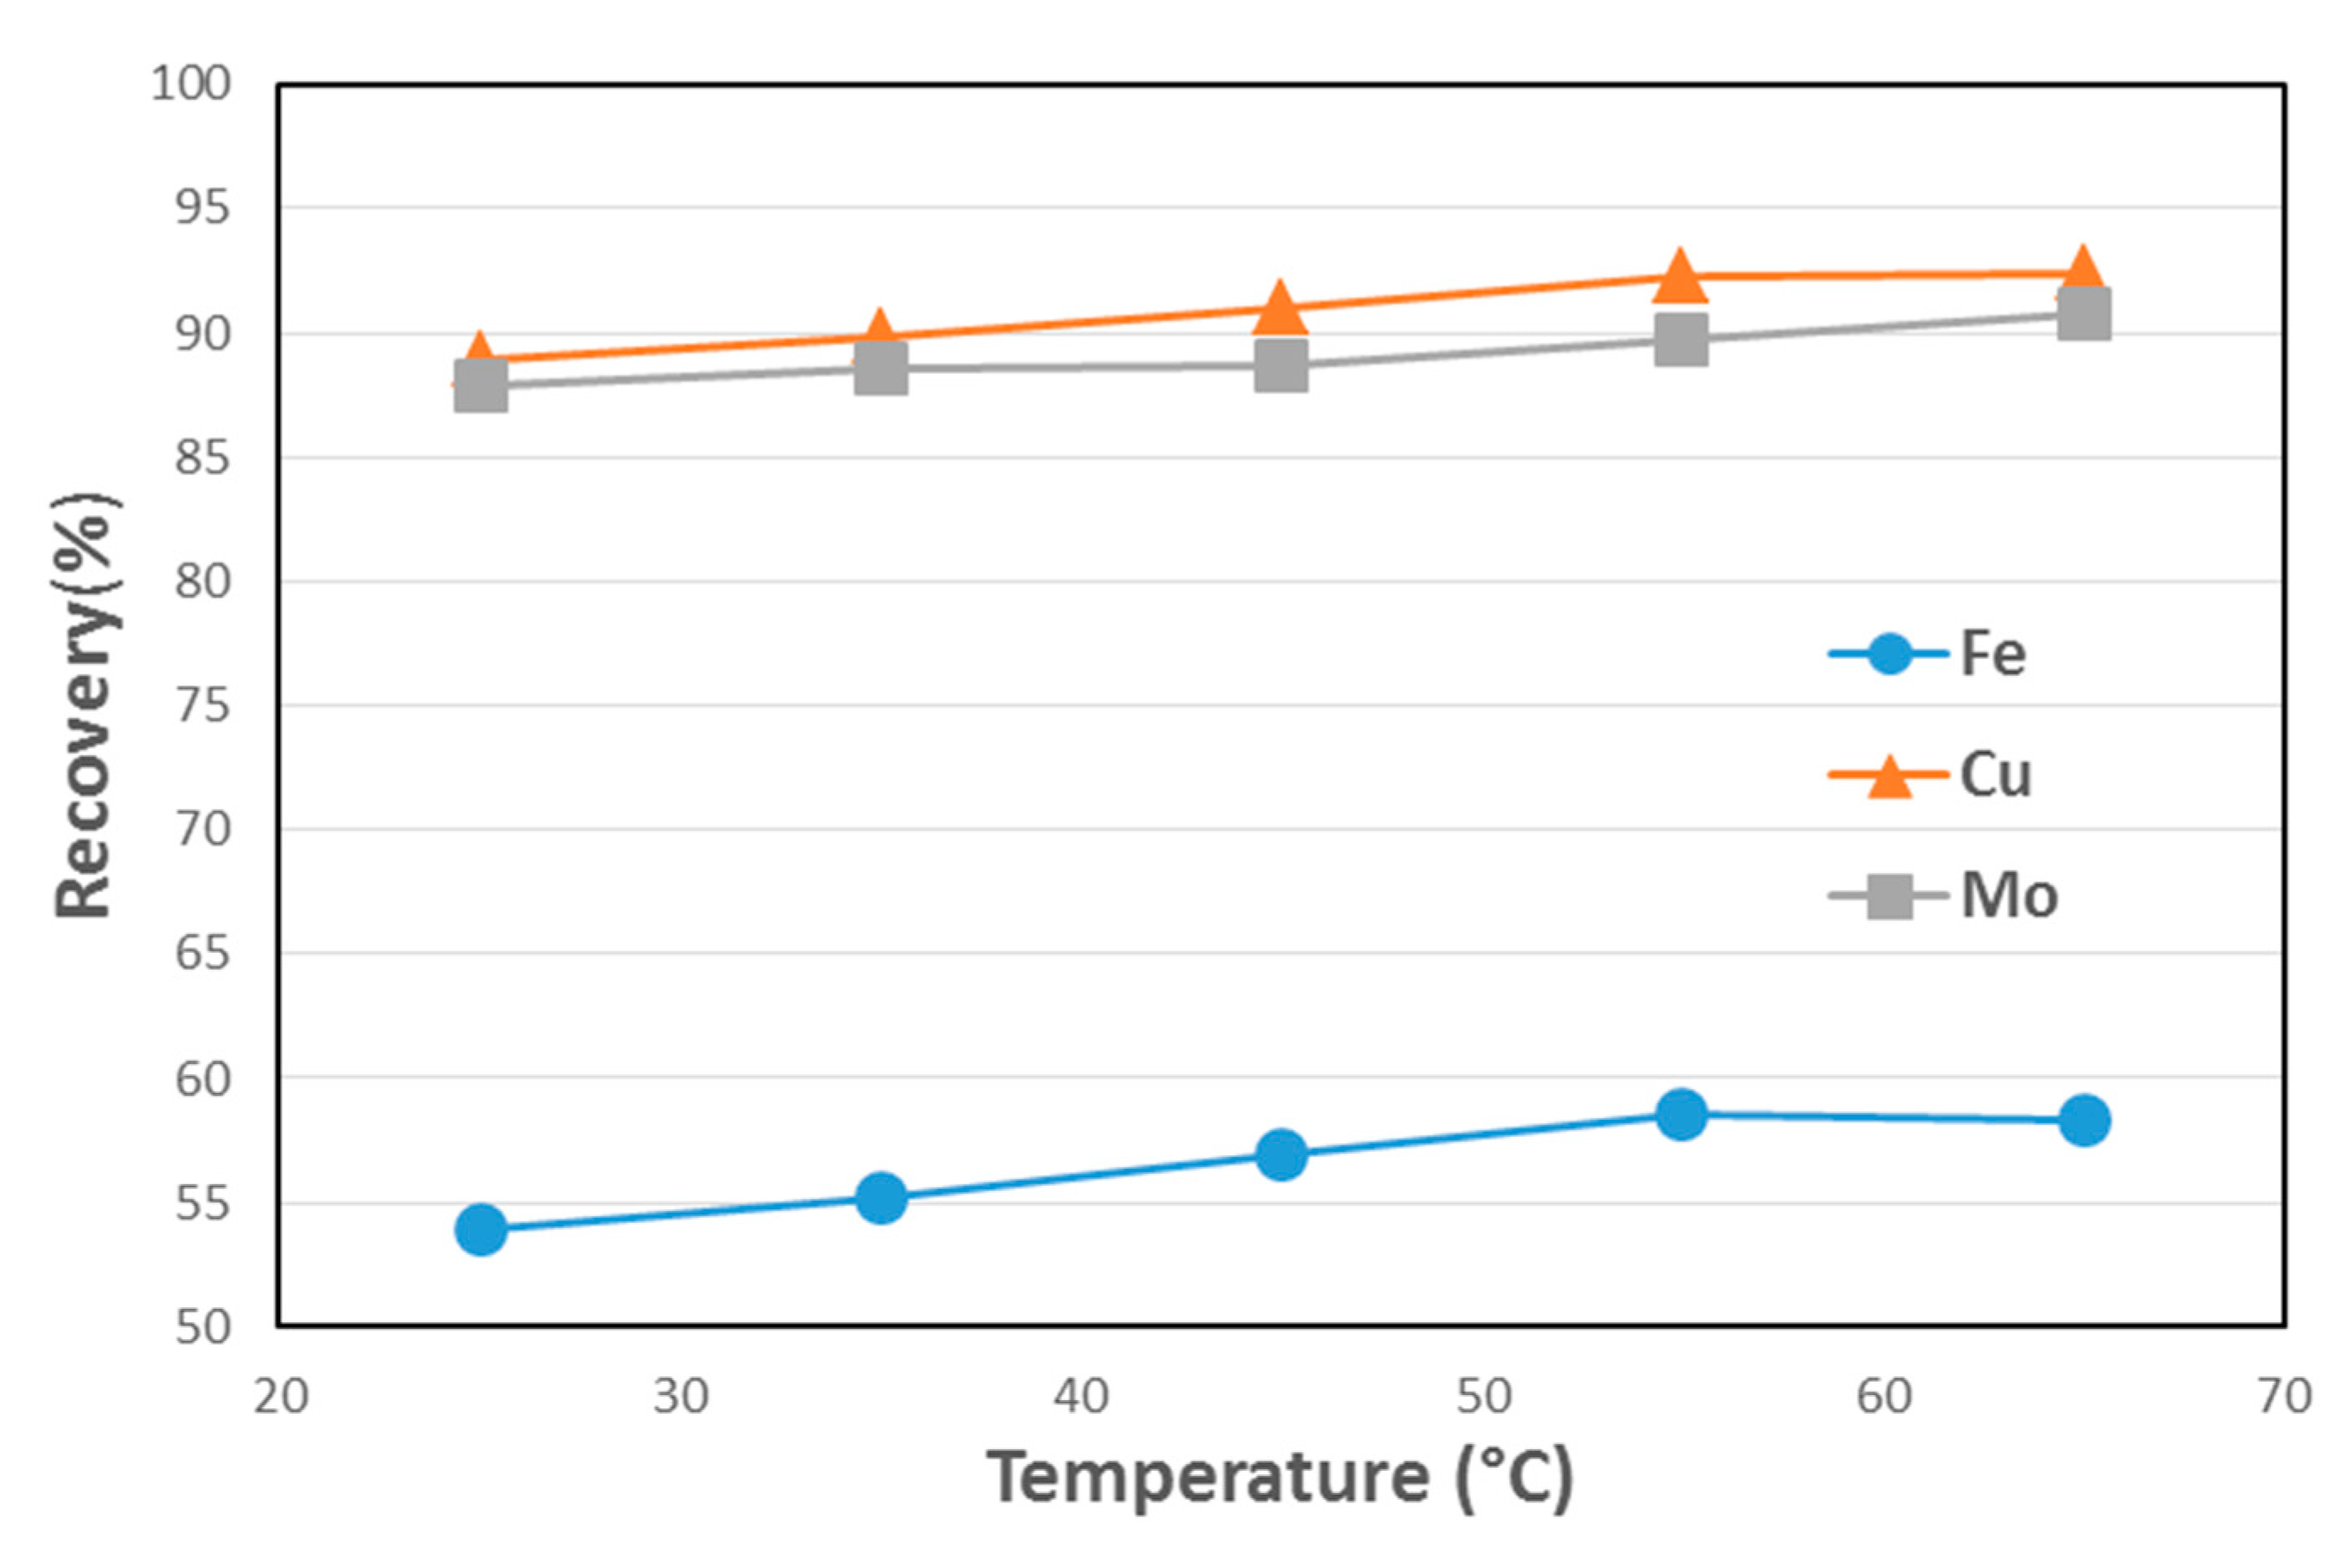
3.5. Lab-Scale Flotation Results
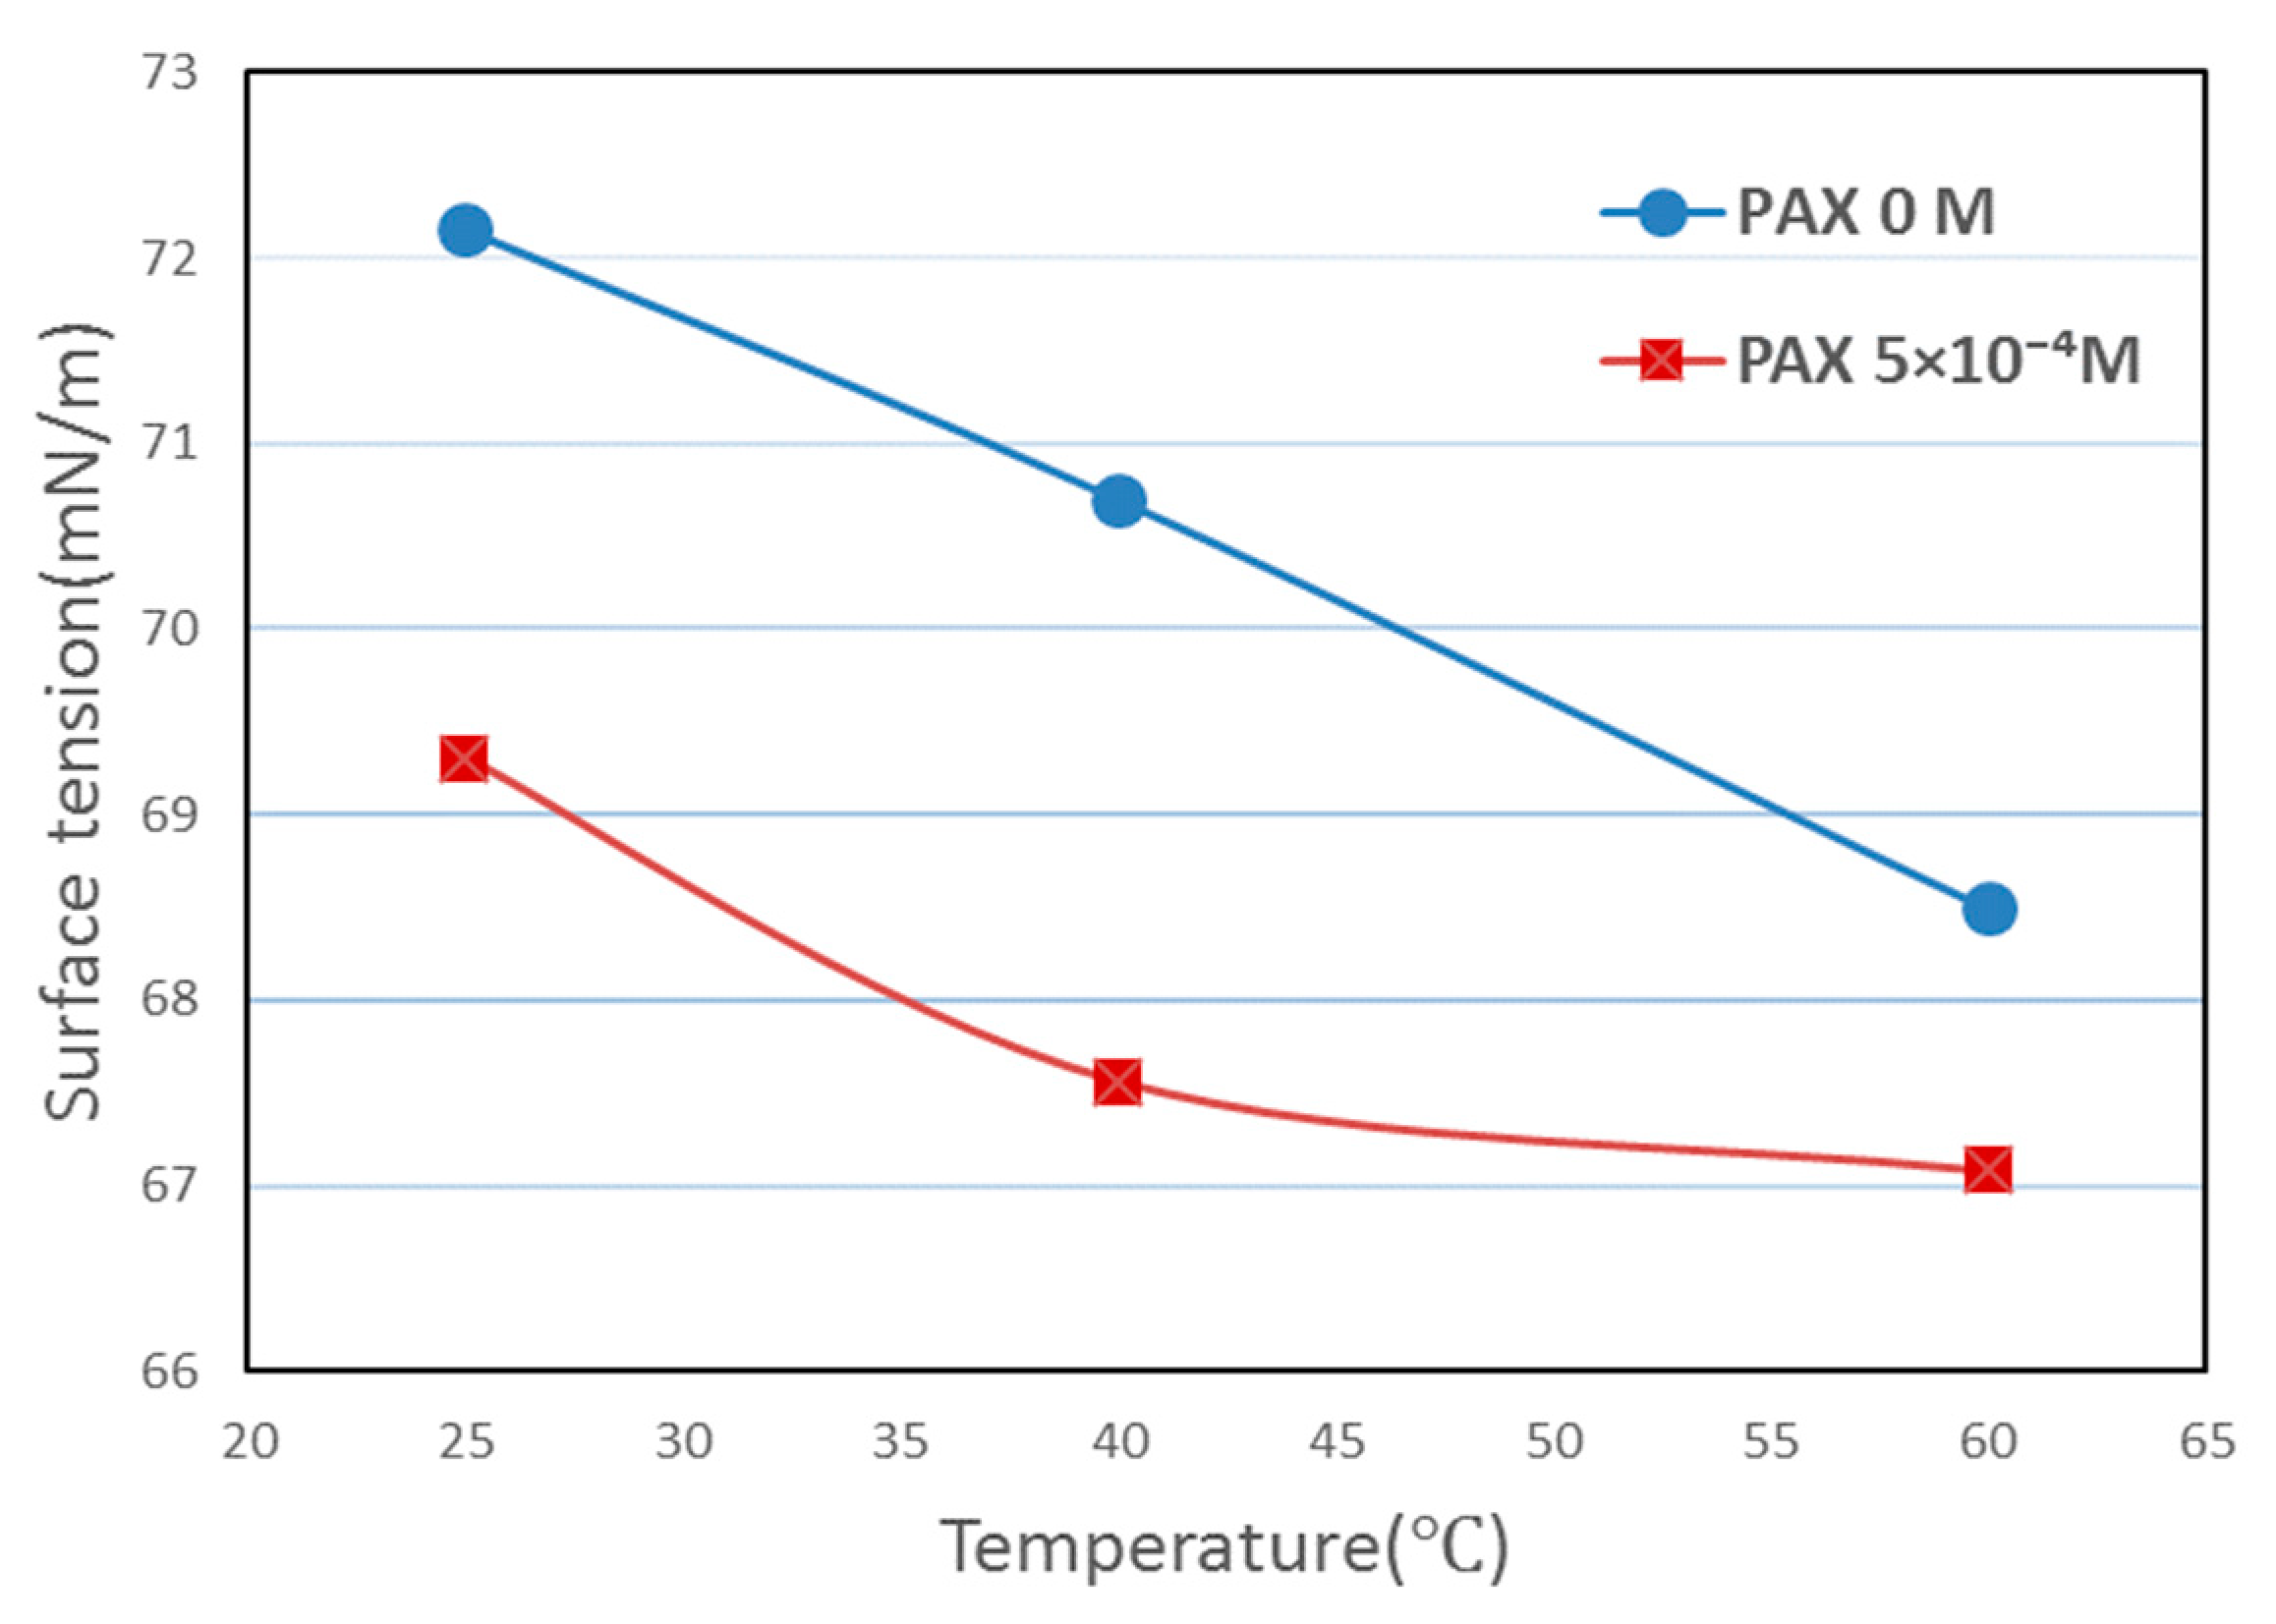
3.6. Surface Tension Results
4. Discussion
4.1. Temperature Effects on Hydrophobicity of Chalcopyrite Surface
4.2. Infrared Study of Xanthate Adsorption on Chalcopyrite Surface
4.3. Temperature Effect on Resolution Copper Ore Flotation Tests
5. Conclusions
Author Contributions
Funding
Acknowledgments
Conflicts of Interest
References
- Poling, G.W. Infrared Studies of Adsorbed Xanthates. Ph.D. Thesis, University of Alberta, Edmonton, AB, Canada, 1963. [Google Scholar]
- Guo, H.; Yen, W.T. Surface potential and dixanthogen stability on chalcopyrite surface. Int. J. Miner. Process. 2005, 76, 205–213. [Google Scholar] [CrossRef]
- Leppinen, J.O. FT-IR and flotation investigation of the adsorption of ethyl xanthate on activated and non-activated sulfide minerals. Int. J. Miner. Process. 1990, 30, 245–263. [Google Scholar] [CrossRef]
- Kartio, I.; Laajalehto, K.; Kaurila, T.; Suoninen, E. A study of galena (PbS) surfaces under controlled potential in pH 4.6 solution by synchrotron radiation excited photoelectron spectroscopy. Appl. Surf. Sci. 1996, 93, 167–177. [Google Scholar] [CrossRef]
- Zhang, J.; Zhang, W. An AFM study of chalcopyrite surface in aqueous solution. In Proceedings of the SME Annual Meeting, Phoenix, AZ, USA, 28 February–3 March 2010. [Google Scholar]
- Zhang, J.; Zhang, W. The adsorption of collectors on chalcopyrite surface studied by an AFM. In Proceedings of the Symposium, SME, Denver, CO, USA, 28 February–2 March 2011. [Google Scholar]
- Zhang, J.; Zhang, W. An AFM study of collectors’ adsorption on minerals in copper/molybdenum flotation. In Proceedings of the SME Annual Meeting, Seattle, WA, USA, 19–22 February 2012. [Google Scholar]
- Zhang, J.; Wiyono, S.; Lee, P.; Xiao, W. Surface characterization of xanthate adsorption on molybdenite. In Proceedings of the SME Annual Meeting, Denver, CO, USA, 22–25 February 2009. [Google Scholar]
- Vázquez-Sánchez, E.E.; Robledo-Cabrera, A.; Tong, X.; López-Valdivieso, A. Raman spectroscopy characterization of some Cu, Fe and Zn sulfides and their relevant surface chemical species for flotation. Physicochem. Probl. Miner. Process. 2020, 56, 483–492. [Google Scholar]
- Lin, I.J. The effect of seasonal variation in temperature on the performance of mineral processing plants. Miner. Eng. 1989, 2, 47–54. [Google Scholar] [CrossRef]
- O’Connor, C.T.; Mills, P.J.T. The effect of temperature on the pulp and froth phases in the flotation of pyrite. Miner. Eng. 1990, 3, 615–624. [Google Scholar]
- Mustafa, S.; Hamid, A.; Naeem, A. Temperature effect on xanthate sorption by chalcopyrite. J. Colloid. Interf. Sci. 2004, 275, 368–375. [Google Scholar] [CrossRef]
- Strong, A.; Yan, D.; Dunne, R. The detection of xanthate in solution and on sulfide surfaces to help understand and improve mineral separation on industrial plants. In Proceedings of the Centenary of Flotation Symposium, Brisbane, QLD, Australia, 6–9 June 2005. [Google Scholar]
- Rao, S.R. Xanthate and Related Compounds; Dekker: New York, NY, USA, 1971. [Google Scholar]
- Buckley, A.N.; Hope, G.A.; Woods, R. Metals from sulfide minerals: The role of adsorption of organic reagent in processing technologies. In Solid—Liquid Interfaces; Springer: Berlin/Heidelberg, Germany, 2003; pp. 63–98. [Google Scholar]
- Pyke, B.L.; Fornasiero, D.; Grano, S.R.; Ralston, J. Prediction of the flotation rate of chalcopyrite particles in a copper ore. In Proceedings of the Interactions in Mineral Processing, the Fourth UBC-McGill International Symposium on Fundamentals of Mineral Processing, Toronto, ON, Canada, 26–29 August 2001; pp. 47–58. [Google Scholar]
- Sharma, P.K.; Rao, K.H. Adhesion of paenibacillus polymyxa on chalcopyrite and pyrite: Surface thermodynamics and extended DLVO theory. Colloid. Surface. B. 2003, 29, 21–38. [Google Scholar] [CrossRef]
- Himawan, T.; Hirajima, T.; Sasaki, K.; Okamoto, H. Alternative techniques to separate tennantite from chalcopyrite: Single minerals and arseno copper ore flotation study. In Proceedings of the 26th International Mineral Processing Congress, Innovative Processing for Sustainable Growth-Conference Proceedings, New Delhi, India, 24–28 September 2012; pp. 2038–2051. [Google Scholar]
- Heyes, G.W.; Trahar, W.J. The natural floatability of chalcopyrite. Int. J. Miner. Process. 1977, 4, 317–344. [Google Scholar] [CrossRef]
- Chen, M.L.; Zhang, L.; Gu, G.H.; Hu, Y.H.; Su, L.J. Effects of microorganisms on surface properties of chalcopyrite and bioleaching. Trans. Nonferrous Met. Soc. China 2008, 18, 1421–1426. [Google Scholar] [CrossRef]
- Gu, G.H.; Hu, K.T.; Li, S.K. Surface Characterization of chalcopyrite interacting with leptospirillum ferriphilum. Trans. Nonferrous Met. Soc. China 2014, 24, 1898–1904. [Google Scholar] [CrossRef]
- Rao, S.R.; Patel, C.C. Flotation of chalcopyrite by xanthates and dixanthogens under oxidizing conditions. Trans. Am. Inst. Min. Met. Eng. 1963, 226, 243–247. [Google Scholar]
- Guo, H.; Yen, W.T. Pulp potential and floatability of chalcopyrite. Miner. Eng. 2003, 16, 247–256. [Google Scholar] [CrossRef]
- Muganda, S.; Zanin, M.; Grano, S.R. Influence of particle size and contact angle on the flotation of chalcopyrite in a laboratory batch flotation cell. Int. J. Miner. Process. 2011, 98, 150–162. [Google Scholar] [CrossRef]
- Fuerstenau, M.C.; Gutierrez, G.; Elgillani, D.A. The influence of sodium silicate in non-metallic flotation systems. Trans. Met. Soc. Aime. 1968, 241, 319–323. [Google Scholar]
- Allison, S.A.; Goold, L.A.; Nicol, M.J.; Granville, A. A determination of the products of reaction between various sulfide minerals and aqueous xanthate solution, and a correlation of the products with electrode rest potentials. Met. Trans. 1972, 3, 2613–2618. [Google Scholar] [CrossRef]
- Leppinen, J.O.; Basilio, C.I.; Yoon, R.H. In-situ FT-IR study of ethyl xanthate adsorption on sulfide minerals under conditions of controlled potential. Int. J. Miner. Process. 1989, 26, 259–274. [Google Scholar] [CrossRef]
- Mielczarski, J.A.; Cases, J.M.; Mielczarski, E.; Alnot, M.; Ehrhardt, J.J.; Franco, A. Surface products of water and xanthate interaction with copper sulfide minerals. In Proceedings of the Selective Separation, Proceedings of the XIXth International Minerals Processing Congress, San Francisco, CA, USA, 22–27 October 1995; pp. 29–34. [Google Scholar]
- Fornasiero, D.; Ralston, J. Cu (II) and Ni (II) activation in the flotation of quartz, lizardite and chlorite. Int. J. Miner. Process. 2005, 76, 75–81. [Google Scholar] [CrossRef]
- Chandra, A.P.; Puskar, L.; Simpson, D.J.; Gerson, A.R. Copper and xanthate adsorption onto pyrite surfaces: Implications for mineral separation through flotation. Int. J. Miner. Process. 2012, 114–117, 16–26. [Google Scholar] [CrossRef]
- Cases, J.M.; De Donato, P.; Kongolo, M.; Michot, L.J. Interaction between finely ground pyrite with potassium amyl xanthate in flotation: Influence of ph, grinding media and collector concentration. In Proceedings of the XVIII International Mineral Processing Congress, Sydney, Australia, 25–27 May 1994; pp. 663–668. [Google Scholar]
- Shuey, R.T. Semiconducting Ore Minerals; Elsevier: Amsterdam, The Netherlands, 1975. [Google Scholar]
- Persson, I.; Persson, P.; Valli, M.; Fözö, S.; Malmensten, B. Reactions on sulfide mineral surfaces in connection with xanthate flotation studied by diffuse reflectance FT-IR spectroscopy, atomic absorption spectrophotometry and calorimetry. Int. J. Miner. Process. 1991, 33, 67–81. [Google Scholar] [CrossRef]
- Bulut, G.; Atak, S. Role of dixanthogen on pyrite flotation: Solubility, adsorption studies and Eh, FT-IR measurements. Miner. Metall. Proc. 2002, 19, 81–86. [Google Scholar] [CrossRef]
- Cassie, A.B.D.; Baxter, S. Wettability of porous surfaces. T. Faraday. Soc. 1944, 40, 546–551. [Google Scholar] [CrossRef]
- Ackerman, P.K.; Harris, G.H.; Klimpel, R.R.; Aplan, F.F. Evaluation of flotation collectors for copper sulfides and pyrite, I. Common sulfhydryl collectors. Int. J. Miner. Process. 1987, 21, 105–127. [Google Scholar] [CrossRef]
- King, E.G.; Mah, A.D.; Pankratz, L.B. Thermodynamic properties of copper and its inorganic compounds. In National Standard Reference Data System; NIST: Gaithersburg, MD, USA, 1973. [Google Scholar]


| PAX Concentration | Recovery (%) | ||
|---|---|---|---|
| 25 °C | 40 °C | 60 °C | |
| 0 M | 77.97 | 83.03 | 83.44 |
| 5 × 10⁻⁵ M | 98.11 | 99.22 | 99.99 |
| 1 × 10⁻⁴ M | 97.38 | 98.29 | 99.98 |
| 5 × 10⁻⁴ M | 98.10 | 97.99 | 99.97 |
| Temperature (°C) | Cu Recovery (%) | Cu Grade (%) | Mo Recovery (%) | Mo Grade (%) | Fe Recovery (%) | Fe Grade (%) |
|---|---|---|---|---|---|---|
| 25 | 88.87 | 8.6 | 87.91 | 0.18 | 53.93 | 22.8 |
| 35 | 89.95 | 8.8 | 88.52 | 0.18 | 55.21 | 22.4 |
| 45 | 91.00 | 8.9 | 88.64 | 0.18 | 56.90 | 23.7 |
| 55 | 92.30 | 8.3 | 89.74 | 0.17 | 58.51 | 23.0 |
| 65 | 92.41 | 8.8 | 90.73 | 0.18 | 58.27 | 23.7 |
| Author | Treatment | Value (°) | Methods |
|---|---|---|---|
| Pyke et al. [16] | Bare surface | 40 | N/A |
| Sharma and Rao [17] | Bare surface | 70 | Sessile drop |
| Chen et al. [20] | Bare surface | 72 | Sessile drop |
| Himawan et al. [18] | Bare surface | 72 | Sessile drop |
| Gu et al. [21] | Bare surface | 78 | Sessile drop |
| Rao and Patel [22] | Dixanthogen | 55–100 | Captive bubble |
| Guo and Yen [23] | PAX 7 × 10⁻⁴ M | 20–80 | Bubble attachment |
| Muganda et al. [24] | PAX 1 × 10⁻⁴ M | 26–55 | Washburn |
| PAX 5 × 10⁻⁴ M | 78–90 |
| Author | Results | Method |
|---|---|---|
| Poling [1] | CuEX 1196 cm−1 (EX)2 1263 and 1238 cm−1 | KBr pellet |
| Fuerstenau et al. [25] | (AX)2 1021 and 1258 cm−1 | KBr pellet |
| Allison et al. [26] | CuAX 1260 and 1030 cm−1 (AX)2 1260 and 1020 cm−1 | KBr pellet |
| Leppinen et al. [27] | CuEX 1192 cm−1 (EX)2 1260 and 1240 cm−1 | ATR |
| Cases et al. [31] | (AX)2, 1025, 1260 cm−1 | Diffuse reflectance FT-IR |
| Persson et al. [33] | (EX)2 1242,1260 cm−1 | Diffuse reflectance FT-IR |
| Mielczarski et al. [28] | CuAX 1200, 1034 cm−1 (AX)2 1270 and 1035 cm−1 | Reflectance spectra Polarized beam |
| Bulut and Atak [34] | (EX)2 1032 and 1271 cm−1 | KBr pellet |
| Mustafa et al. [12] | CuEX 1010 cm−1 (EX)2 1037 cm−1 | KBr pellet |
© 2020 by the authors. Licensee MDPI, Basel, Switzerland. This article is an open access article distributed under the terms and conditions of the Creative Commons Attribution (CC BY) license (http://creativecommons.org/licenses/by/4.0/).
Share and Cite
An, D.; Zhang, J. A Study of Temperature Effect on the Xanthate’s Performance during Chalcopyrite Flotation. Minerals 2020, 10, 426. https://doi.org/10.3390/min10050426
An D, Zhang J. A Study of Temperature Effect on the Xanthate’s Performance during Chalcopyrite Flotation. Minerals. 2020; 10(5):426. https://doi.org/10.3390/min10050426
Chicago/Turabian StyleAn, Dongbo, and Jinhong Zhang. 2020. "A Study of Temperature Effect on the Xanthate’s Performance during Chalcopyrite Flotation" Minerals 10, no. 5: 426. https://doi.org/10.3390/min10050426
APA StyleAn, D., & Zhang, J. (2020). A Study of Temperature Effect on the Xanthate’s Performance during Chalcopyrite Flotation. Minerals, 10(5), 426. https://doi.org/10.3390/min10050426