Abstract
The Rare Earth Element (REE) mineralizations are not so “rare” in Sweden. They normally occur associated and hosted within granitic crystalline bedrock, and in mineral deposits together with other base and trace metals. Major REE-bearing mineral deposit types are the apatite-iron oxide mineralizations in Norrbotten (e.g., Kiruna) and Bergslagen (e.g., Grängesberg) ore regions, the various skarn deposits in Bergslagen (e.g., Riddarhyttan-Norberg belt), hydrothermal deposits (e.g., Olserum, Bastnäs) and alkaline-carbonatite intrusions such as the Norra Kärr complex and Alnö. In this study, analytical data of samples collected from REE mineralizations during the EURARE project are compared with bedrock and till REE geochemistry, both sourced from databases available at the Geological Survey of Sweden. The positive correlation between REE composition in the three geochemical data groups allows better understanding of REE distribution in Sweden, their regional discrimination, and genetic classification. Data provides complementary information about correlation of LREE and HREE in till with REE content in bedrock and mineralization. Application of principal component analysis enables classification of REE mineralizations in relation to their host. These results are useful in the assessment of REE mineral potential in areas where REE mineralizations are poorly explored or even undiscovered.
1. Introduction
The Rare Earth Element (REE) occurrences in Sweden are widely distributed all over the country but some regions are more endowed than others. Major REE-bearing mineral deposit types, found mainly in Norrbotten and Bergslagen ore regions, are the apatite-iron oxide mineralizations in Kiruna and Grängesberg, the skarn mineralizations of the Riddarhyttan-Norberg belt, the alkaline igneous rock-associated in Norra Kärr, and the hydrothermal mineralizations in Olserum and Alnö deposit areas [1] (see Figure 1). Distribution of REEs in Swedish soil and bedrock has previously been investigated by Sadeghi and Andersson [2] with the aim to identify the main changes in REE geochemistry related to geology and weathering, taking also into account the current baseline level for REE in soil and bedrock over Sweden. The Geochemical Atlas of Sweden provides a harmonized, countrywide database with modern baseline geochemical data from C horizon (element concentration in the weathered parent rock horizon of soil profile) in till [3] and REEs in different solid media (topsoil, subsoil, and stream sediments) have been investigated using the Forum of European Geological Surveys (FOREGS) database in order to identify the REEs regional background values [4]. In Sadeghi et al. [5], the Geochemical Mapping of Agricultural and Grazing Land Soil (GEMAS) project data were investigated with focus on REEs in two solid media (topsoil from agricultural (Ap) and grazing land (Gr) soil) to identify the background values of REEs both in Sweden and in Europe. The Ap samples were collected from regularly plowed fields at a depth interval of 0 to 20 cm and the Gr samples were collected from soil under permanent grass cover at a 0 to 10 cm depth range.
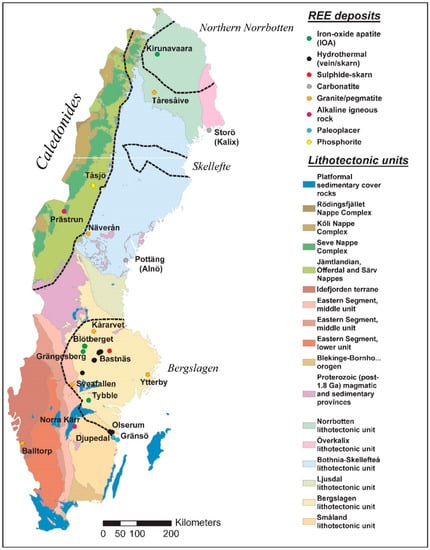
Figure 1.
Simplified map of major lithotectonic units and ore districts in Sweden, with a selection of Rare Earth Elements (REEs) deposits, prospects, and occurrences (modified from [1] and bedrock database at Geological Survey of Sweden)
REE deposits can be referred to regolith, basinal, metamorphic and magmatic associations based on a mineral-systems approach [6]. Various deposit types form either directly from the crystallization of the melt and/or fluids predominantly derived from the melt. The magmatic deposits can be divided into orthomagmatic and hydrothermal types. Basinal deposit types are inferred to be formed through mechanical (e.g., placer) and chemical (e.g., phosphorite) sedimentary processes, and from diagenetic fluids generated in sedimentary basins. Deposit types of the regolith association require an REE-bearing rock source to form feasible secondary contents of REE. The REE deposits are formed either due to enrichment of REE in the residual material and/or from local remobilization of REE. Deposit types of the metamorphic association are generated during regional and/or contact metamorphism and involve related metamorphic fluids.
This study analyzes, explores and evaluates the composition of REE mineralized samples collected during the EURARE project (2013–2017) enabling their genetic classification into specific deposit types. This information is integrated with the Geological Survey of Sweden (SGU)’s lithogeochemistry and till geochemistry databases to better approach and interpret the distribution of REE anomalous provinces at the scale of the country.
2. Overview of REE Mineralizations in Sweden
2.1. REE Mineralizations in Granitic Pegmatites and Granitoids
Partial melting of crustal material produces felsic melts that are enriched in REEs. Elements in pegmatites that can be enriched up to minable (ore) grades include Li, Cs, Be, Sn, Nb, Ta, U, Y, Zr, and REEs. This long and diverse list of elements, to which a significantly high content of B, P, F, Rb, Bi, Hf, etc., could be added, make fractionated pegmatites among the most mineralogically complex deposit types on the Earth [7]. Pegmatitic facies associated with syenite-alkaline granite complexes constitute important deposits of REEs, U, Nb and Zr, and less commonly, Be and P [7].
In Sweden, granitic pegmatites, typically of a moderately to highly fractionated character, often host variable amounts of minerals rich in trace elements, including Be, Li, Nb, Ta, Sn, U, Th, as well as REEs. [8,9]. One notable granitic pegmatite, that shows locally relatively high REE content, (a porphyritic granite to gneiss with age 1300 Ga so-called “RA-granite”) is located in Balltorp (Eastern Segment lithotectonic unit) (Figure 1) in southwestern Sweden [10]. The RA-granite is a Be-F-Nb-REE-Sn-Ta-Th-U-Zr-anomalous gneissic granite that does show some potential but has so far not been systematically explored (cf. [10] and references therein). Moreover, several other granitic to syenitic rocks in southern Sweden and elsewhere exhibit increased REE contents. The most important granitic pegmatites and granitoids with potential for REE mineralization are, Tåresåive (highest contents of REEtot = 94,900 ppm) in northern Sweden (Norrbotten lithotectonic unit), Näverån in Central Sweden (close to the Caledonides), as well as granitoids in Bergslagen (e.g., Ytterby; highest contents of REEtot = 30,624 ppm), and granite in the southwestern part of Sweden, (e.g., Balltorp; highest contents of REEtot = 8800 ppm), shown in Figure 1. A contrasting case to these primary enrichments is the granitoid-hosted but epigenetic, shear zone-related mineralization at Näverån (highest contents of REEtot = 6929 ppm) in central Sweden [1].
2.2. REE Mineralization in Alkaline Intrusive Rocks and Carbonatites
Several REE deposits associated with peralkaline complexes (syenitic rocks) are usually enriched in U and Th and have a relatively high Heavy Rare Earth Element (HREE) content when compared with carbonatites [11]. In Sweden, Norra Kärr deposit represents one of the most advanced and promising REE mining projects in northern Europe. This concentrically zoned alkaline intrusion, with nepheline-syenite, contains eudialyte-group minerals highly enriched in REEs with up to 8.5 wt% (La + Ca + Nd + Y) [1], showing also a strong resource potential in heavy REEs.
Carbonatites are common hosts of orthomagmatic-type REE mineralizations that tend to be variably enriched in REEs, Sr, Ba, U, Th, Nb, Ta, P, and F. Although the overall REE content of carbonatites may vary, their shape on the chondrite-normalized plot almost invariably displays high Light Rare Earth Element (LREE) content and no negative Eu anomalies [12]. Barium and Sr are generally abundant, whereas U, Th, Nb, and P, are variably abundant in the mineralized carbonatite. REE-bearing mineral phases have the highest REE content but major carbonate minerals, including calcite and dolomite, may also contain substantial contents of REEs [13]. Sövitic carbonatitic melts tend to show the highest levels of REE enrichment. They also show significant enrichment in LREE (LREE/HREE ratio of ~40, compared to ~7 of alkaline and felsic melts).
In Sweden, the Alnö complex consists of alkaline and carbonatite intrusive rocks located on the island of Alnö, in the Bothnian Bay and on the mainland north to northwest of Alnö, all along the coast of east-central Sweden [14,15,16]. The carbonatite, and specifically the calcite-dominated søvite, have significantly elevated total REE contents, between ca 500 and 1500 ppm [17]. Alnö intrusive complex and associated co-magmatic rocks on the mainland have also been the focus of exploration for REEs, including that carried out by the Boliden company in the 1970s. The main lithology ijolite contains clinopyroxene with LREEs up to 100 times chondritic values [18,19]. The Söråker intrusion located on the mainland north of Alnö comprises Ca- and Mg-carbonatite dikes and melilitolites. Another small carbonatite occurrence is known from the Middle Allochthon in the Caledonides where calc-silicate rocks at Prästrun in west-central Sweden host a REE-Nb-(U-Th) mineralization (highest contents of REEtot = 2300 ppm). This intrusive-hosted REE mineralization was first described at Prästrun.
Alkaline lamprophyre is another lithology that tends to have elevated REE contents. Chemically, potassic lamprophyre dikes are often characterized by relatively low SiO2 and TiO2, and high MgO and K2O contents. In addition, they show high content of large-ion lithophile trace elements (e.g., Rb, Sr, and Ba) and LREE, but low content of high-field-strength elements (e.g., Nb, Ta, Zr, Hf, and Ti) [20]. An example of the REE-enriched lamprophyre is the 1.1 Ga alkaline ultramafic dykes up to 1-metre-wide, outcropping along the northernmost part of the coast in the Gulf of Bothnia, (Kalix) known as Storön deposit (Figure 1; [20,21]). The dikes represent olivine- and mica-rich lamprophyres and silico-carbonatites [21].
2.3. REE Mineralization in Apatite-Iron Oxide Deposits
At present, over forty iron oxide apatite deposits are known in northern Sweden [22,23,24]. The main (at over 2000 Mt) deposit in the Norrbotten district is the famous Kiruna (Kiirunavaara) deposit and active mine (cf. [24]). A hydrothermal (including replacement) and (ortho-) magmatic origin of iron oxide apatite deposits in Norrbotten have been suggested in numerous studies (e.g., [25,26,27,28,29,30,31] and references therein). The main REE host minerals in this deposit are apatite, typically a fluorapatite, and monazite, occurring often as inclusions in apatite [32,33,34,35]. Apatite abundance and composition in the ore varies, e.g., at Kiruna, where the phosphorus content in the upper parts of the ore is ca. 2%, equivalent to almost 11% apatite. REE enrichment is represented mainly by LREEs, Ce and Y anomalies observed as early as the 1930s by Geijer [34]. REE geochemistry of the host rocks in the northern district shows two patterns, one with a negative Eu anomaly and strong enrichment in LREEs at Kiruna and area close to this mine and the second one without a well pronounced Eu anomaly e.g., at the Malmberget and the areas close to this mine (Figure 2) [36].

Figure 2.
REE spider plot [37] of host rocks from the northern districts; Kiruna mine and occurrences close to this area (red) display a distinct Eu trough and a relative enrichment in LREEs compared to the HREEs, and while the samples from the Malmberget mine and occurrences nearby show extensive metamorphism and deformation overprint compared to the Kiruna area (Blue). Data sources: SGU and [36].
In central Sweden, (the Bergslagen district), a number of iron oxide apatite deposits are known with the biggest being Grängesberg and Blötberget, which were mined in historical times (Grängesberg mine closed in 1989) and both represent Kiruna-type deposits. The previous studies reveal that they still constitute a rather important potential reserve of REEs and phosphorus, both from the main ore and from mining waste [38]. The deposits are predominantly hosted by 1.9 Ga volcanosedimentary rocks variably metamorphosed and deformed. The ore is usually enriched in LREEs and to a minor degree in U, Th, Sm, Tb, Yb, and Y. The majority of REE enrichment is located in phosphate minerals such as apatite, xenotime, and monazite and to a lesser degree in silicates such as allanite and epidote [1,30,33,35].
2.4. Fe-REE Hydrothermal (Bastnäs-Type) Mineralizations
Evaluation of the REE geochemistry of hydrothermal mineral deposits, and the processes by which they are concentrated, is a complex task [39]. However, these mineralizations can be grouped on the basis of their geochemical and mineralogical characteristics. The degree of REE enrichment in a deposit is a function of the concentration of REEs in the fluid, the water-rock ratio, the efficiency of the precipitation process and the nature and amount of co-precipitated phases [39]. Oreskes and Einaudi [40] suggested that the high abundance of fluorocarbonates and the lack of Ca minerals in REE deposits (e.g., Olympic Dam) indicated that the fluids behind hydrothermal REE mineralizations may have been F- and CO2-rich and that the REEs were transported as Cl and/or F complexes. Lottermoser [41] suggested that the association of REE with U minerals indicated that U and REE were complexed by the same ligands and inferred that those were CO3, F, or SO4.
The Bastnäs-type Fe-REE deposits in Sweden are early Proterozoic, skarn-hosted iron oxide (magnetite-dominated), locally polymetallic (±Cu, Au, Co, Bi, Mo) mineralizations that in part carry very REE-rich mineral assemblages (cf. [42]). They are located in the Bergslagen district and are characterized by the occurrence of locally abundant REE-rich silicate minerals such as cerite-(Ce) and allanite (sensu lato) but also include REE fluorocarbonates such as bastnäsite-(Ce).
3. Materials and Methods
In this study the lithogeochemical and till geochemistry databases have been used for re-interpretation of the REE baseline in different rock types and till in Sweden, and for the evaluation of REE mineral potential. More than 20,000 rock samples were collected and analyzed as part of the bedrock mapping program at the Geological Survey of Sweden (SGU; www.sgu.se). Within the EURARE project (www.eurare.org), field work activities were carried out in several REE-mineralized areas and were followed up by detailed investigations on selected mineralizations. The modal mineral composition, petrographical features and chemical compositions carried out for more than 200 rock samples [1]. The lithogeochemical analyses were carried out at the ACME Lab (Vancouver, BC, Canada) and ALS Scandinavia AB (Luleå, Sweden). At the ACME Lab the samples were analyzed for major, minor, and trace elements by ICP-emission spectrometry following a lithium metaborate/tetraborate fusion and dilute nitric digestion. At the ALS, trace elements including the full rare earth element suites were obtained from fused beads followed by acid digestion and measured by either ICP-AES or an inductively coupled plasma sector field mass spectrometer (ICP-SFMS).
The till database used in this study contains over 2500 samples analyzed by aqua regia digestion followed by ICP-MS. These national-wide results have been published as the Geochemical Atlas of Sweden [3] and are available for the public online (https://www.sgu.se/mineralnaring/geokemisk-kartlaggning/geokemisk-atlas/).
The open-source software Geochemical Data Toolkit in R (GCDKIT-version 4.1) [43] which is built using the freeware R language, has been applied for the data processing and biplot diagrams in this paper (http://www.gcdkit.org).
Principal component (PC) analysis is a conventional multivariate technique that is often used for studying geochemical data [4,44,45,46,47]. PC analysis reduces a large number of variables to a smaller number, allowing the user to determine the components (groups of variables) that account for variation in multivariate data [47]. PC analysis has often been used to process and interpret geochemical and other types of spatial data e.g., [4,5,47,48]. PC analysis builds on the correlation (covariance) matrix, which measures the interrelationships among multiple variables. The first PC (PC1) explains most of the variance within the original data, and each subsequent PC (PC2–n) explains progressively less of the variance. A multivariate dataset can usually be reduced to two or three PCs that account for the majority of the variance within the dataset. PC analysis was performed on average values of the different mineralization types as discussed above. Thirty-seven elements were chosen for PC analysis based on correlation coefficients. The Statistica software (version 13.2, Dell Software, Aliso Viejo, CA, USA) has been used for the principal component analysis (https://statistica.software.informer.com/).
The Geochemical Atlas of Sweden [3] is a country-wide harmonized database with modern baseline geochemical data from the C horizon in till. The database encompasses 2578 till samples from SGU archive as well as new sampled till collected mainly in the mountainous areas of western Sweden. Since the C horizon is considered as an anthropogenically undisturbed layer, the major geochemical signature in till should originate from underlying bedrock, its lithology, mineralogy, and potential mineralization. Secondary processes such as ice transport, leaching, and biological activity have minor impact on till chemical composition. During weathering, REEs are generally not very mobile, but this varies depending on the host mineral and local pH. REE mobility is further controlled by adsorption onto iron oxides, phosphates, and clay minerals [2,49]. In general, till can be used as proxy for the underlying bedrock in areas where outcrops are not available. Till can be treated then as composite rock material and its composition can be often interpolated to the average parent rock.
4. Results and Discussion
4.1. REE Content in Bedrock
Lithogeochemistry data from the SGU database have been used to examine links between REE contents in bedrock with known REE mineralizations. The main intention was to establish a tool for future exploration and predictive mapping surveys. Generally, primary REEs are associated with magmatic (granite and pegmatite) and alkaline rocks. Rocks enriched in monazite and zircon often contain higher contents of rare earth elements. In sedimentary rocks, higher contents of rare earth elements occur in shale and greywacke. There are no obvious differences in the geochemical distribution between the LREE group (La, Ce, Pr, Nd, and Sm) and the HREE group (Eu-Lu + Y) in the lithogeochemical data. However, their relative contents may differ for each element, probably due to the mineral composition and type of the host rock. For example, Eu is often found in rock-forming minerals such as plagioclase and in accessory minerals, mainly in allanite, bastnäsite, monazite, apatite, zircon, and fluorite. Typically, Eu can replace Sr and Ca in rock-forming minerals, therefore, its enrichment in plagioclase is common. This results in Eu enrichment in plagioclase-rich rocks in northernmost Sweden, such as gabbro and granodiorite.
The data with a higher content of the total REE and Y (above 500 ppm) were extracted from the database and compared with the extracted data with a content of Y more than 100 ppm (Figure 3). Our results show a linear correlation and match between the samples with a higher content of REE + Y in total with Y content, and more importantly, there is a direct link between Y content in samples with existing known mineralizations in Sweden (Figure 3).
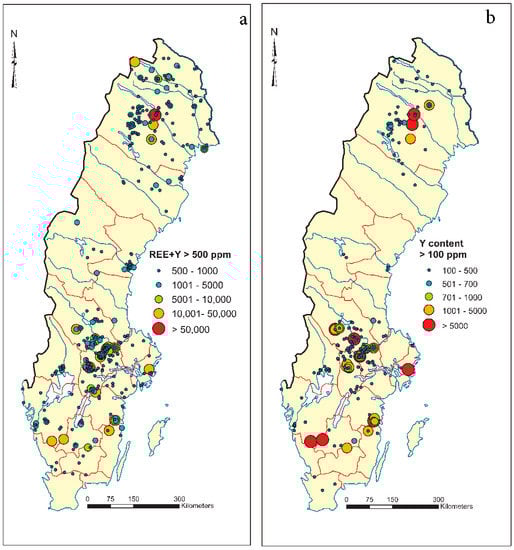
Figure 3.
Simplified map of lithogeochemical data in Sweden: (a) total REE + Y > 500 ppm and (b) Y content >100 ppm (source of data: lithogeochemical database at the Geological survey of Sweden).
4.2. Geochemistry of REE Mineralization in Sweden Inferred from the EURARE Project
During the EURARE field campaign, approximately 200 samples were taken for petrography and mineralogy studies and for geochemical analysis. The location of the samples and type of mineralization are shown in Figure 4, and the geochemical results are provided in Table 1.
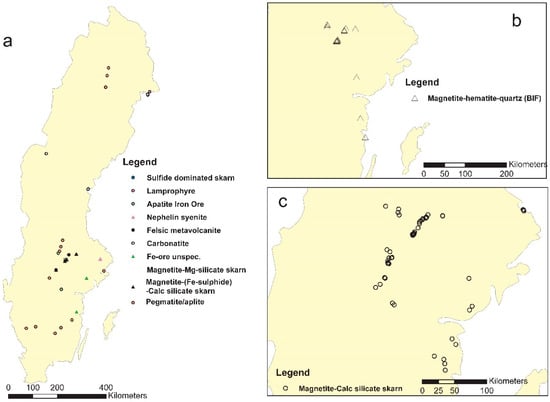
Figure 4.
Simplified location map of samples in the EURARE project: (a) an overview of sample locations and types, excluding magnetite-calc silicate skarn and BIF ones; (b) magnetite-hematite-quartz samples; (c) magnetite-calc silicate skarn samples.

Table 1.
Summary of samples analyzed with a total REE (TotREE) content above 1% (10,000 ppm). N and E are SwerefTM coordinates.
The geochemical analyses of the samples collected during the EURARE project show that 68 samples have a total REE content above 1000 ppm and of those 27 have more than 1% total REE.
The samples with more than 1% REEs represent mineralizations classified as: iron oxide apatite (1 sample), Fe-ore unspecified (3 samples), magnetite-calc-silicate skarn (9 samples), magnetite-(Fe-sulphide)-Calc silicate skarn (2 samples), and granitic pegmatite (12 samples). These results are summarised in Table 1.
A bivariate plot of total REE content vs. LREE (Figure 5a) and vs. HREE (Figure 5b) show that there is a general bimodal linear correlation between total REE and LREE (Figure 5a), one trend is characterized by LREE enrichment (for magnetite-skarn mineralization) and a second one by LREE depletion, especially in some late magmatic pegmatite REE mineralizations and some related to iron mineralizations. The comparison of total REEs with HREEs also shows clear decoupling between two groups, the first composed of low HREE mineralization types (e.g., various iron ores, skarn mineralizations, carbonatite, and sulphide-dominated skarn ores) and these with elevated HREE content are mainly represented by late magmatic pegmatites and unspecified iron ore types. It is unclear how the magmatic rocks differ in primary composition, so they host both low- and high-level HREE mineralizations. BIF deposits (magnetite-hematite-quartz) do not show a very high content of REEtot and generally are most likely to have elevated LREE rather than HREE. The number of two samples of sulfide dominated skarn is limited and, therefore, it is excluded from interpretation of the results to avoid any over interpretation.

Figure 5.
Bivariate diagrams of total REEs versus LREEs (a) and HREEs (b) for EURARE project samples.
A bivariate plot of La vs. La/Yb (Figure 6) shows a weak but overall positive correlation between the two variables, except for a few samples, which show higher HREE contents. This suggests that those samples with a high LREE content also have relatively high LREE/HREE ratios. They mostly represent REE mineralizations associated with granitic pegmatites. One sample from iron oxide-apatite deposits contains REE-bearing minerals such as xenotime and monazite and shows higher contents of HREEs (Figure 6).
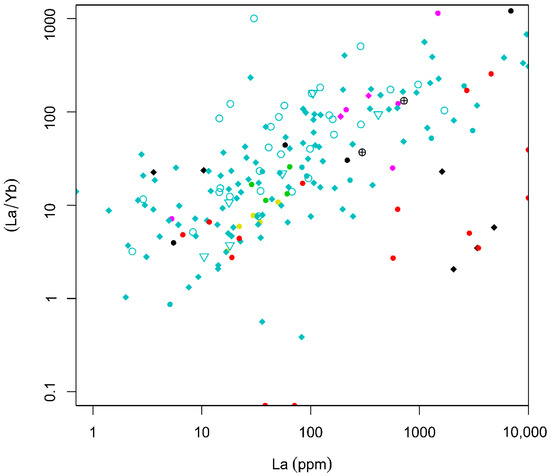
Figure 6.
Bivariate plot of La (ppm) versus La/Yb for the EURARE samples (see the legend in Figure 5).
Thorium and uranium content and their ratio are useful for recognizing geochemical facies and also the content of radioactive elements in different types of mineralization which may have an impact on future exploitation. Figure 7a shows Th content versus total REEs. In general, skarn and iron oxide-apatite mineralizations with higher contents of total REEs (REEtot > 1%) show a positive correlation with low contents of Th (Th < 50ppm). A few samples from iron oxide mineralizations show higher content of Th up to 200 ppm and total REE contents of up to 3.5%. Two samples of granitic pegmatites show higher contents of Th, whereas those of total REEs are low, which means that the content of Th in those samples is not directly related to REE-bearing minerals and may also correspond to the primary origin of the host rocks and its later deformation. For example, rocks with sedimentary origin have usually higher Th/U ratios than magmatic rocks, and these ratios can be further modified during regional metamorphism [11,12,49].
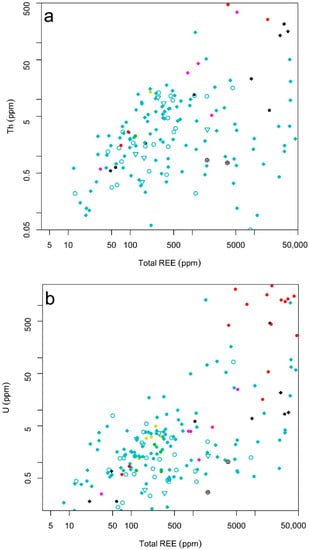
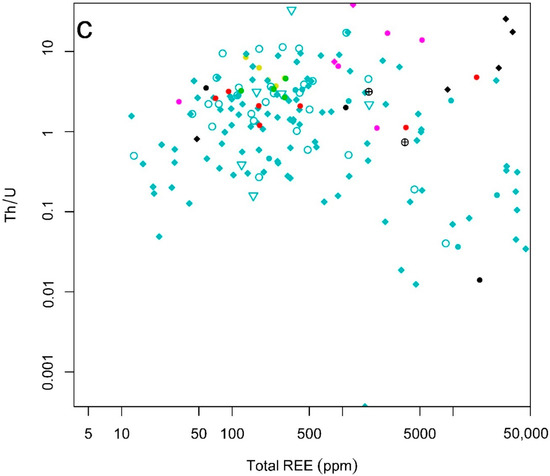
Figure 7.
Binary plots of (a) total REE vs. Th (ppm); (b) total REE vs. U (ppm); (c) total REE vs. Th/U; for the EURARE samples (see the legend in Figure 5).
The U/total REE (Figure 7b) of the EURARE samples shows that high U contents (U > 400 ppm) are typical of REE mineralization hosted in granitic pegmatites. An additional few samples collected from magnetite-calc silicate skarn type deposits show higher contents of U (>1000 ppm). In the sample from magnetite-calc silicate skarn, one sample shows a high content of total REE correlates with high U content which may indicate the U enrichment in REE-bearing minerals.
Comparison of total REE with Th/U ratios based on two analyzed samples from lamprophyres (Figure 7c) shows that the samples with low contents of total REE (REEtot < 400) typically have higher Th than U contents (Th/U > 20). The Th/U ratio is generally low in the samples from skarn and iron oxide-apatite REE mineralizations (Th/U < 10) with the exception of four samples from iron oxide-apatite REE mineralizations (at the Djupedalsgruvan) that show high contents of both Th and REE (and contain xenotime and allanite minerals) (Figure 7c).
Plots of quantitative values of selected REEs (Nd, Pr, and Y) and phosphorus compared to binary plots of LREE versus HREE show at least two contradicting trends. For example, in Figure 8a samples with high Nd contents show two opposite trends; one positive with well correlated LREE and Nd contents accompanied by low HREE and the second negative trend where samples with decreasing Nd contents plot towards a lower LREE content and a higher HREE. Few exceptions of samples with high content of HREE and Nd content (>4000 ppm) can also be observed (Figure 8a).
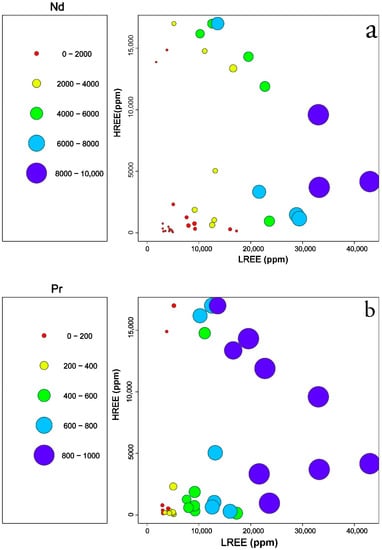
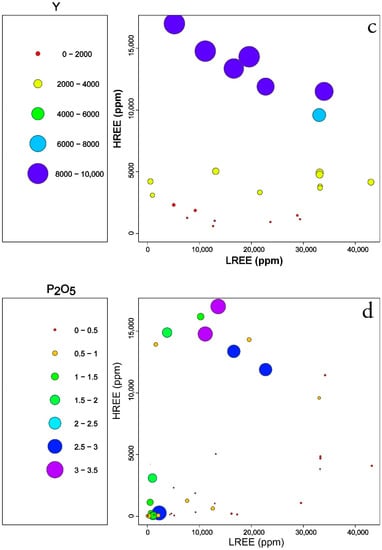
Figure 8.
Plots of quantitative values of selected elements compared to LREEs and HREEs in the EURARE samples: (a) Nd (ppm); (b) Pr (ppm); (c) Y (ppm); (d) P2O5 (wt%). Samples with contents less than background values are excluded.
In a similar type of plot, quantitative content of Pr in the samples shows a semi-concordant trend with Nd, and this may reflect that the minerals bearing Pr and Nd are the ones containing HREE, such as xenotime-(HREE) and fergusonite-(HREE) as well as gadolinite-(REE).
Figure 8c shows linear positive correlation of high Y samples with a higher content of HREE. Since Y has a similar geochemical behavior as HREE the low HREE contents follow low Y contents in EURARE samples. High LREE samples are less affected by Y content with weak negative correlation. Samples with low and high Y content when compared to LREE might reflect various degrees of host magma differentiation or secondary remobilization during regional metamorphism (competitive re-crystallization and crystallization of metamorphic minerals) [11,12,49].
Comparison of phosphorus content, indicative of the presence of phosphate minerals shows two different clusters (Figure 8d). The first cluster shows that some high P samples have low contents of both LREEs and HREEs, which can be interpreted as apatite mineralization in iron ore with no REE enrichment. The second cluster shows that samples with high P content correlate with high HREE content, which may indicate the presence of minerals other than apatite as a host of HREEs, such as xenotime.
Within the sample set collected during the EURARE project, there are several iron ore samples (Fe-ore unspec.) that cannot be easily classified (more mineralogical and petrological investigations are needed). In an attempt to classify them, the classical PM-normalized REE diagram has been used [37] (McDonough and Sun 1995) (Figure 9). At a first glance, their REE patterns suggest the presence of two genetic groups. The first group with REE enrichment (>100 ppm) shows a similar trend to the iron oxide-apatite- and skarn-type REE mineralizations, with a negative Eu anomaly and relative HREE enrichment. The second group shows a weak positive Eu anomaly and steep decreasing trends from LREEs to HREEs accompanied by a rather low total of REEs (<100 ppm). These two samples may have an alkaline or peralkaline origin but a more detailed study is needed (Figure 9).
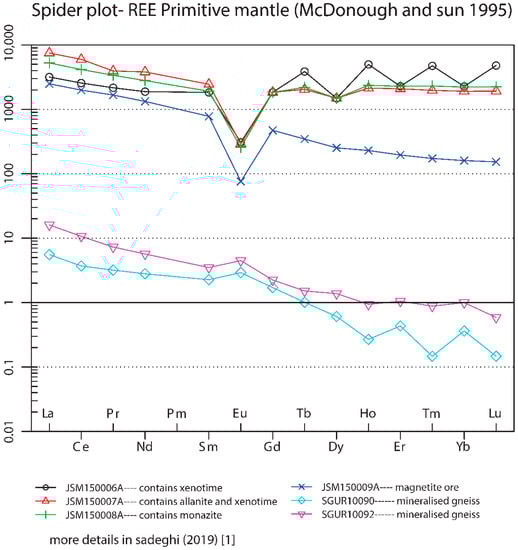
Figure 9.
Primitive mantle-normalized [37] REE diagram of iron oxides of unknown origin.
4.3. Principal Component (PC) Analysis
The results of PC analysis are reported in Table 2 for the PCs with eigenvalue >1 and show that PC1 and PC2 explain 30% and 17%, respectively, of the total variance among the REE-mineralized samples. It implies that in PC1 with an association of REEs, and Co, Fe, and Mn most likely represent magnetite calc-silicate skarn samples, while an association of Cs-Hf-Nb-Sr-Ta-Th-Zr-Al-Ba in PC2 likely indicates REE mineralizations related to granitic pegmatite bearing Nb-Ta mineralization.
Table 2.
Principal component loading, eigenvalues, % variance explained, and cumulative % variance for PC1 to PC8.
The PC3 defines an association of Cs-Rb-K-Li, which probably represents alkaline and/or felsic rocks including granitic pegmatite and related polymetallic mineralization (Table 3).
Table 3.
Explanation of the five principal components for elements analyzed, accounting for 65% of the total variance.
Plots of pairs of PCs show that it is likely possible to distinguish between some different types of REE mineralization or to distinguish between samples with a higher content of REEs and those with low one (Figure 10). For example, in the plot of PC1 versus PC2 (Figure 10) there are several clusters representing an association of REEs and granitic pegmatite bearing Nb-Ta mineralization. A plot of PC3 versus PC4 distinguishes between REE mineralization associated with magnetite calc-silicate skarn, alkaline, and/or granitic rocks and polymetallic mineralization (Figure 10).
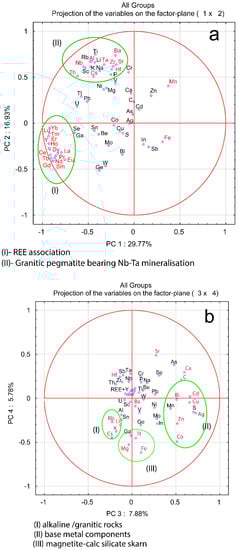
Figure 10.
Biplots of (a) PC1 vs. PC2; (b) PC3 vs. PC4.
4.4. Comparison of REE Till Geochemistry with Lithogeochemistry of Underlying Bedrock
Table 4 shows simple statistics of REE distribution in till. The median values are similar to upper crust values by Rudnick and Gao [49]. Due to the fact that Rudnick and Gao’s values are calculated for total contents and till results originate from aqua regia digestion, one of the conclusions is that the Swedish till is enriched in REEs in comparison to the global values.
Table 4.
Percentiles, minimum, and maximum values for the REE + Y + Sc from the till dataset. P50 is a median value. * abundance in the upper continental crust [49].
Maps of LREE and HREE contents in till (see [3]) show both similar and distinct distribution patterns. Generally, LREE (La-Sm) and HREE groups (Gd-Lu, Y) have similar distribution within the group, therefore, we use here the La till map as a representative for all LREEs and the Yttrium map as a representative for HREEs (Figure 11). Raster La and Y maps with regional anomalies show large-scale REE trends, while plotted lithogeochemistry results (circle symbols) underlie local spots and extreme values.
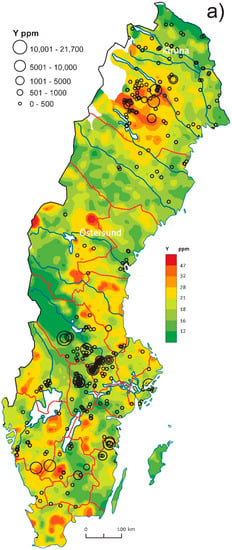
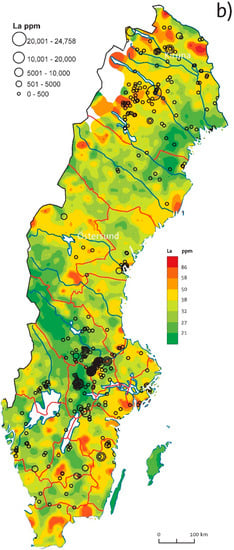
Figure 11.
Geochemical maps comparing till geochemistry (raster, after Andersson et al., 2014 [3]) with lithogeochemistry (circle symbols) in Sweden: (a) Y in till and bedrock; (b) La in till and bedrock.
LREEs and Eu have major anomalies in northernmost Sweden (outlying Archean lithologies of magmatic origin) while these anomalies are absent in HREEs. Minor enrichment in LREEs visible in lithogeochemistry data reflects possible LREE enrichment in granite-pegmatite bedrock and apatite-iron deposits near Kiruna.
Further south, in central Norrbotten (Figure 1 and Figure 11), the bedrock (granite-pegmatite and felsic metavolcanics rocks) and overlying till are highly enriched both in LREE and HREE and correlation with many REE (+W, Mn, and U) mineralizations, e.g., Tåresåive (REEs, Mo, U, Th, Nb, and Ta).
In central Sweden, LREE and HREE enrichment in till occurs in the Caledonides within the tectonic windows where many sulfide mineralizations and U deposits have been mapped. LREE enrichment at the Caledonian front and within the Lower Allochthon can be attributed to the REE enrichment in the fine-grained sedimentary rocks (black shale and phosphorite), e.g., Tåsjö deposit (Figure 1 and Figure 11). On the Fennoscandian Shield side, few REE mineralizations are known and they possibly may be reflected in till with its prominent anomaly south of Östersund, possibly in relation to the so-called Rätan granite. NE from Östersund, in central Sweden, -there is a prominent HREE anomaly and it is probably related to the outcrops of younger granite (so-called Revsund granite). The lithogeochemistry database has poor coverage in central Sweden, however, Alnö carbonatitic intrusion by the coast is both visible in till and few collected rock samples with elevated LREE contents. In the Ljusdal (Ljusdal lithotectonic unit, Figure 1), high HREE (and elevated LREE) contents can be noticed in till and several small REE (W, Mn, U, and Fe-Mn) mineralizations are known in direct relation to the anomaly extension. Lithogeochemistry data are missing in this region.
In the Bergslagen ore district, there is a general decoupling between REE lithogeochemistry and REE content in till. The known REE mineralization line in western Bergslagen is not visible in till geochemistry. Point REE till anomalies can be observed in the NW part of Bergslagen (often related to iron mineralizations) and LREE high contents in till occur in southern Bergslagen by the coast.
In southern Sweden, LREE anomalies in the bedrock are often related to mineralizations and granitic lithologies. Younger granites of the Blekinge lithotectonic unit (Figure 1) and fluorite mineralization in southern Sweden also seem to be well reflected in till geochemistry. High contents of Y in bedrock and till in southern Sweden, south and south-west of the lake Vättern (Figure 11) seem to correlate with occurrences of highly metamorphosed rocks including occurrences of eclogites with Y-enriched garnet and pyroxene. Minor REE (W, Mn, and U) occurrences are known north of the Y till anomaly.
The comparison of till geochemical maps with lithogeochemistry and mineralizations shows clear correlation between REE anomalies in surficial deposits and the underlying bedrock and the presence of mineralization. Therefore, till can be effectively used for REE mineral exploration and mineral potential studies in areas where there is no sufficient information about the bedrock and mineralizations.
5. Conclusions
The analysis of REE geochemistry in mineralized samples compared to bedrock lithogeochemistry and till geochemistry reveals several regional trends in REE distribution in Sweden, which may have practical implications for mineral exploration:
- Lithogeochemistry of the bedrock correlates with geochemical REE provinces and even single REE ore deposits;
- REE geochemistry of mineralized EURARE samples allows geochemical classification of various REE occurrences in Sweden;
- Till geochemistry presents the complex picture of REE distribution at the country scale. Many known REE locations are underlain by till anomalies. On the other hand, there are many high REE spots in till, which cannot be easily explained by known REE deposits. They may present interesting exploration targets;
- Taking into account favorable geological and metallogenetic conditions in Sweden, there is a good potential for discovering new REE deposits;
- Applied geochemical methods should be integrated in a multidisciplinary way with complementary data and methods, such as mineralogy, geophysics, and numerical modeling and statistics, to improve understanding of REE ore genesis and related geo-modeling. This holistic approach, also including ore geochemistry and mineralogy, will provide a well-documented REE mineral knowledge base, intelligence, and exploration methodology.
Author Contributions
Conceptualization, M.S. and N.A.; methodology, M.S. and A.L.; software, M.S. and A.L.; validation, M.S., A.L. and N.A. and.; formal analysis, M.S. and N.A.; investigation, M.S.; resources, M.S.; data curation, M.S.; writing—original draft preparation, M.S and A.L.; writing—review and editing, N.A. and A.L.; visualization, M.S and A.L. All authors have read and agreed to the published version of the manuscript.
Funding
The EURARE project was funded by the European Community Seventh Framework Programme (FP7/2007-2013) under grant agreement no. 309373. The project, number 35242, was co-funded by the Geological Survey of Sweden (SGU).
Acknowledgments
We thank Erik Jonsson, Torbjörn Bergman, Magnus Ripa, Per Nysten, Johan Söderhielm, and Dick Claeson for their contributions to the EURARE project. The EURARE project was funded by the European Community Seventh Framework Programme (FP7/2007–2013) under grant agreement no. 309373. The project, number 35242, was co-funded by the Geological Survey of Sweden (SGU). The authors thank two anonymous reviewers for their constructive and valuable comments and suggestions.
Conflicts of Interest
The authors declare no conflict of interest.
References
- Sadeghi, M. (Ed.) Rare earth elements distribution, mineralisation and exploration potential in Sweden. In Sveriges Geologiska Undersökning, Rapporter Och Meddelanden; Geological Survey of Sweden: Uppsala, Sweden, 2019; Volume 146, p. 184. [Google Scholar]
- Sadeghi, M.; Andersson, M. Sällsynta Jordartsmetaller i Sverige, Förekomst och Utbredning i berg och jord “the Rare Earth Element Distribution over Sweden” (in Swedish and English); Report No 2015-21; Geological Survey of Sweden: Uppsala, Sweden, 2015; p. 98. [Google Scholar]
- Andersson, M.; Carlsson, M.; Ladenberger, A.; Morris, G.; Sadeghi, M.; Uhlbäck, J. Geochemical Atlas of Sweden (Geokemisk Atlas over Sverige); Sveriges Geologiska Undersökning: Uppsala, Sweden, 2014; p. 210. ISBN 978-91-7403-258-1. [Google Scholar]
- Sadeghi, M.; Morris, G.A.; Carranza, E.J.M.; Ladenberger, A.; Andersson, M. Rare earth element distribution and mineralisation in Sweden: An application of principal component analysis to FOREGS soil geochemistry. J. Geochem. Exp. 2013, 133, 160–175. [Google Scholar] [CrossRef]
- Sadeghi, M.; Petrosino, P.; Ladenberger, A.; Albanese, S.; Andersson, M.; Morris, G.; Lima, A.; De Vivo, B. Ce, La and Y concentration in agricultural and grazing land soils of Europe—An exercise for mapping and exploration. J. Geochem. Exp. 2013, 133, 202–213. [Google Scholar] [CrossRef]
- Hudson, M. 2007: Drilling Expands Near-Surface Uranium at Tåsjö, Sweden; Mawson Resources Ltd.: Vancouver, BC, Canada, 2007. [Google Scholar]
- London, D. Rare-element granitic pegmatites. In Reviews in Economic Geology; Society of Economic Geologists, Inc.: Littleton, CO, USA, 2016; Volume 18, pp. 165–193. [Google Scholar]
- Sundius, N. Kvarts, fältspat och glimmer samt förekomster där av i Sverige. In Sveriges Geologiska Undersökning C; Geological Survey of Sweden: Uppsala, Sweden, 1952; Volume 520, p. 231. [Google Scholar]
- Lundegårdh, P.H. Nyttosten i Sverige; Almqvist & Wiksell: Stockholm, Sweden, 1971; p. 271. [Google Scholar]
- Holmqvist, A. Be-F-Nb-REE-Sn-Ta-Th-U-Zr-mineraliserad granit i Västsverige. In Sveriges Geologiska AB, Division Prospektering, PRAP-Rapport 89026; Geological Survey of Sweden: Uppsala, Sweden, 1989; p. 14 + appendices. [Google Scholar]
- Dostal, J. Rare metal deposits associated with alkaline/peralkaline igneous rocks. In Reviews in Economic Geology; Society of Economic Geologists, Inc.: Littleton, CO, USA, 2016; Volume 18, pp. 33–54. [Google Scholar]
- Verplanck, P.L.; Mariano, A.N.; Mariano, A., Jr. Rare earth element ore geology of carbonatites. In Reviews in Economic Geology; Society of Economic Geologists, Inc.: Littleton, CO, USA, 2016; Volume 18, pp. 5–32. [Google Scholar]
- Mariano, A.N. Nature of economic mineralization in carbonatites and related rocks. In Carbonatites: Genesis and Evolution; Bell, K., Ed.; Unwin Hyman: London, UK, 1989; pp. 149–176. [Google Scholar]
- Kresten, P. A magnetometric survey of the Alnö complex. Geol. Fören. Stockh. Förh. 1976, 98, 364–365. [Google Scholar] [CrossRef]
- Kresten, P. The Alnö complex: Discussion of the main features, bibliography and excursion guide. In Proceedings of the Nordic Carbonatite Symposium, Sundsvall, Sweden, 20–27 May 1979; p. 67. [Google Scholar]
- Kresten, P. The Alnö area (Alnöområdet). In Beskrivning till Berggrundskartan över Västernorrlands län; Lundqvist, T., Gee, D., Kumpulainen, R., Karis, L., Kresten, P., Eds.; Sveriges Geologiska Undersökning ser Ba nr 31: Uppsala, Sweden, 1990; pp. 238–278. [Google Scholar]
- Hornig-Kjarsgaard, I. Rare earth elements in sövitic carbonatites and their mineral phases. J. Petrol. 1998, 39, 2105–2121. [Google Scholar] [CrossRef]
- Svensson, U. Sällsynta Jordartsmetaller på Alnön. Boliden Mineral AB, Årsrapport 1971, Bilaga 36; Boliden Mineral AB: Boliden, Sweden, 1972; p. 5 + appendix (unpublished report). [Google Scholar]
- Chai, F.; Zhang, Z.; Mao, J.; Parat, A.; Wang, L.; Dong, L.; Ye, H.; Chen, l.; Zheng, R. Lamprophyre or Lamproite Dyke in the SW Tarim Block?—Discussion on the Petrogenesis of These Rocks and Their Source Region. J. China Univ. Geosci. 2006, 17, 13–24. [Google Scholar] [CrossRef]
- Kresten, P.; Åhman, E.; Brunfelt, A.O. Alkaline ultramafic lamprophyres and associated carbonatite dykes from the Kalix area, northern Sweden. Geol. Rundsch. 1981, 70, 1215–1231. [Google Scholar] [CrossRef]
- Kresten, P.; Rex, D.C.; Guise, P.G. 40Ar-39Ar ages of ultramafic lamprophyres from the Kalix area, northern Sweden. In Radiometric Dating Results 3. SGU C830; Lundqvist, T., Ed.; Geological Survey of Sweden: Uppsala, Sweden, 1997. [Google Scholar]
- Jonsson, E. Epigenetic REE-U-Th-anomalous Fe oxide mineralisation in the Narken area, NE Sweden. In Proceedings of the 33rd International Geological Congress, Oslo, Norway, 6–14 August 2008. Abstracts, MRD-11. [Google Scholar]
- Geijer, P. The Iron Ores of the Kiruna Type: Geographical Distribution, Geological Characters, and Origin; Sveriges Geologiska Undersökning C: Uppsala, Sweden, 1931; Volume 367, p. 39. [Google Scholar]
- Geijer, P. The Rektorn Ore Body at Kiruna; Sveriges Geologiska Undersökning C: Uppsala, Sweden, 1950; Volume 514, p. 18. [Google Scholar]
- Parák, T. Kiruna iron ores are not “intrusive-magmatic ores of the Kiruna type”. Econ. Geol. 1975, 70, 1242–1258. [Google Scholar] [CrossRef]
- Frietsch, R. On the magmatic origin of iron ores of the Kiruna type. Econ. Geol. 1978, 73, 478–485. [Google Scholar] [CrossRef]
- Hitzman, M.W.; Oreskes, N.; Einaudi, M.T. Geologic characteristics and tectonic setting of Proterozoic iron oxide (Cu-U-Au-REE) deposits. Precambrian Res. 1992, 58, 241–287. [Google Scholar] [CrossRef]
- Nyström, J.O.; Henriquez, F. Magmatic features of iron ores of the Kiruna type in Chile and Sweden: Ore textures and magnetite geochemistry. Econ. Geol. 1994, 89, 820–839. [Google Scholar] [CrossRef]
- Williams, P.J.; Barton, M.D.; Johnson, D.A.; Fontboté, L.; de Haller, A.; Mark, G.; Oliver, N.H.S.; Marschik, R. Iron oxide copper-gold deposits: Geology, space-time distribution, and possible modes of origin. In Economic Geology, 100th Anniversary Volume; Society of Economic Geologists: Littleton, CO, USA, 2005; pp. 371–405. [Google Scholar]
- Jonsson, E.; Troll, V.R.; Högdahl, K.; Harris, C.; Weis, F.; Nilsson, K.P.; Skelton, A. Magmatic origin of giant central Swedish ”Kiruna-type” apatite-iron oxide ores. Sci. Rep. 2013, 3, 1–8. [Google Scholar] [CrossRef] [PubMed]
- Bergman, S.; Kübler, L.; Martinsson, O. Description of Regional Geological and Geophysical Maps of Northern Norrbotten County (East of the Caledonian Orogen); Sveriges Geologiska Undersökning Ba: Uppsala, Sweden, 2001; Volume 56, p. 110. [Google Scholar]
- Harlov, D.E.; Andersson, U.B.; Förster, H.-J.; Nyström, J.O.; Dulski, P.; Broman, C. Apatite-monazite relations in the Kiirunavaara magnetite-apatite ore, northern Sweden. Chem. Geol. 2002, 191, 47–72. [Google Scholar] [CrossRef]
- Jonsson, E.; Harlov, D.; Majka, J.; Högdahl, K.; Persson-Nilsson, K. Fluorapatite-monazite-allanite relations in the Grängesberg apatite-iron oxide ore district, Bergslagen, Sweden. Am. Mineral. 2016, 101, 1769–1782. [Google Scholar] [CrossRef]
- Pan, Y.; Fleet, M.E. Composition of the fluorapatite-group minerals: Substitution mechanisms and controlling factors. Rev. Mineral. Geochem. 2002, 48, 13–49. [Google Scholar] [CrossRef]
- Jonsson, E.; Persson Nilsson, K.; Hallberg, A.; Högdahl, K. The Palaeoproterozoic apatite-iron oxide deposits of the Grängesberg area: Kiruna-type deposits in central Sweden. In NGF Abstracts and Proceedings, 29th Nordic Geological Winter Meeting, Oslo, Norway; Nakrem, H.A., Harstad, A.O., Haukdal, G., Eds.; Norsk Geologisk Forening: Trondheim, Norway, 2010; Volume 1, pp. 88–89. [Google Scholar]
- Lundh, J. A Lithogeochemical Study of Northern Sweden and the Kiruna and Malmberget Iron-Apatite Ore Deposits (Dissertation). 2014. Available online: http://urn.kb.se/resolve?urn=urn:nbn:se:uu:diva-227039 (accessed on 24 June 2014).
- McDonough, W.F.; Sun, S.S. The composition of the Earth. Chem. Geol. 1995, 120, 223–253. [Google Scholar] [CrossRef]
- Hallberg, A.; Albrecht, L.; Jonsson, E.; Olsson, A. The Grängesberg apatite-iron deposit—biggest in Bergslagen, Sweden. In Proceedings of the 27th Nordic Geological Winter Meeting, Bulletin of the Geological Society of Finland, Oulu, Finland, 9–12 January 2006; Special issue 1. p. 45. [Google Scholar]
- Samson, I.M.; Wood, S.A. The rare earth elements: Behavior in hydrothermal fluids and concentration in hydrothermal mineral deposits, exclusive of alkaline setting. In Rare elements Geochemistry and Mineral Deposits, Geological Association of Canada short course Notes; Linnen, R.I., Samson, I.M., Eds.; Society of Economic Geologists: Littleton, CO, USA, 2005; Volume 17, pp. 269–297. [Google Scholar]
- Oreskes, N.; Einaudi, M.T. Origin of rare earth element-enriched hematite breccias at the Olympic Dam Cu-U-Au-Ag deposit, Roxby Downs, South Australia. Econ. Geol. 1990, 85, 1–28. [Google Scholar] [CrossRef]
- Lottermoser, B.G. Rare earth elements in Australian uranium deposits. In Uranium–Past and Future Challenges, Proceeding of the 7th International Conference on Uranium Mining and Hydrogeology; Merkel, B.J., Arab, A., Eds.; Springer: Berlin, Germany, 1995; pp. 25–30. [Google Scholar]
- Holtstam, D.; Andersson, U.B. The REE minerals of the Bastnäs-type deposits, south-central Sweden. Can. Mineral. 2007, 45, 1073–1114. [Google Scholar] [CrossRef]
- Janoušek, V.; Farrow, C.M.; Erban, V. Interpretation of whole-rock geochemical data in igneous geochemistry: Introducing Geochemical Data Toolkit (GCDkit). J. Petrol. 2006, 47, 1255–1259. [Google Scholar] [CrossRef]
- Carranza, E.J.M. Geochemical Anomaly and Mineral Prospectivity Mapping in GIS. In Handbook of Exploration and Environmental Geochemistry; Elsevier: Amsterdam, The Netherlands, 2008; Volume 11. [Google Scholar]
- Grunsky, E.C. The interpretation of geochemical survey data. Geochem. Exp. Environ. Anal. 2010, 10, 27–74. [Google Scholar] [CrossRef]
- Güller, C.; Thyne, G.; McGray, J.E.; Turner, A.K. Evaluation of graphical and multivariate statistical methods for classification of water chemistry data. Hydrogeol. J. 2002, 10, 455–474. [Google Scholar] [CrossRef]
- Harris, J.R.; Grunsky, E.C.; Wilkinson, L. Developments in the effective use of lithogeochemistry in regional exploration programs: Application of GIS technology. In Proceedings of the Exploration 97, Fourth Decennial International Conference on Mineral Exploration; Gubins, A.G., Ed.; Prospectors and Developers Association of Canada: Toronto, ON, Canada, 1997; pp. 285–292. [Google Scholar]
- Hode Vuorinen, J.; Hålenius, U.; Whitehouse, M.J.; Mansfeld, J.; Skelton, A.D.L. Compositional variations (major and trace elements) of clinopyroxene and Ti-andradite from pyroxenite, ijolite and nepheline syenite, Alnö Island, Sweden. Lithos 2005, 81, 55–77. [Google Scholar] [CrossRef]
- Rudnick, R.L.; Gao, S. Composition of the Continental Crust. In The Crust; Rudnick, R.L., Ed.; Elsevier-Pergamon: Oxford, UK, 2003; pp. 1–64. [Google Scholar] [CrossRef]
© 2020 by the authors. Licensee MDPI, Basel, Switzerland. This article is an open access article distributed under the terms and conditions of the Creative Commons Attribution (CC BY) license (http://creativecommons.org/licenses/by/4.0/).