Article

Platinum Group Elements in Arsenopyrites and Pyrites of the Natalkinskoe Gold Deposit (Northeastern Russia)

by
Raisa G. Kravtsova
,
Vladimir L. Tauson
,
Artem S. Makshakov
*,
Nikolay V. Bryansky
and
Nikolay V. Smagunov
A.P. Vinogradov Institute of Geochemistry, Siberian Branch of Russian Academy of Sciences, Favorskiy str 1A, 664033 Irkutsk, Russia
*
Author to whom correspondence should be addressed.
Minerals 2020, 10(4), 318; https://doi.org/10.3390/min10040318
Submission received: 3 March 2020 / Revised: 27 March 2020 / Accepted: 30 March 2020 / Published: 31 March 2020

Abstract

:
The peculiarities of the distribution and binding forms of platinum group elements (Pt, Pd, Ru, Rh, Os and Ir) in the arsenopyrites and pyrites of the Natalkinskoe gold ore deposit (Northeastern Russia) were examined using atomic absorption spectrometry with analytical data selections for single crystals (AAS-ADSSC), a “phase” chemical analysis (PCA) based on AAS of different size-fractions of minerals, scanning electron microscopy with energy dispersive X-ray spectrometry (SEM-EDX) and laser ablation inductively coupled plasma mass spectrometry (LA-ICP-MS). The arsenopyrites and pyrites of the Natalkinskoe gold deposit were found to concentrate not only Au but also platinum group elements (PGEs) such as Pt, Pd, Ru and Rh. The PCA showed that the highest contents (in ppm) were found in the monofractions of arsenopyrite—Pt up to 128, Pd up to 20, Ru up to 86 and Rh up to 21—and comparably lower in monofractions of pyrite—Pt to 29, Pd to 15, Ru to 58 and Rh to 5.9. The AAS-ADSSC method revealed two forms of uniformly distributed Pt, Pd and Ru corresponding to the chemically bound element in the structure of the mineral and in the superficial non-autonomous phase (NAP). The superficially bound form dominates over the structural form and presumably exists in a very thin surface layer of the crystal (~100–500 nm). The maximum contents of these PGE, chemically bound in the structure of arsenopyrite, reached values of (in ppm) 48, 5.9 and 48; and in pyrite structure, 68, 5.2 and 34 for Pt, Pd and Ru respectively. The contents of Pt, Pd and Ru related to NAP on the surface of the crystal were significantly higher and amounted (in ppm) for arsenopyrite to 714, 114 and 1083; and for pyrite 890, 62 and 690 for Pt, Pd and Ru, respectively. Preliminary results for the Rh form in arsenopyrite crystals suggest that the surface-related form (154–678 ppm) is more abundant than the structural form (17–45 ppm). Data from studying the surfaces of sulphide minerals by SEM-EDX and LA-ICP-MS confirmed the presence of Pt, Pd, Ru and Rh on the surface of arsenopyrite and pyrite crystals. These methods generated primary data on the content of Os and Ir in arsenopyrite and pyrite in the surface layer. The maximum content of Os and Ir found in arsenopyrites was up to 0.7 wt%. PGE-enriched fluids (up to ~3 ppm Pt) may exist in the gold ore deposit. It is assumed that there is a common mechanism of impurities uptake associated with the active role of the crystal surface and surface defects for gold-bearing arsenopyrites and pyrites. The surface enrichment is due to peculiarities in the crystal growth mechanism through the medium of NAP and the dualism of the element distribution coefficient in the system of mineral–hydrothermal solution, which is higher for NAP, compared to the volume of the crystal. Although mineral forms of Pt, Pd, Ru, Rh, Os and Ir have not been found at the Natalkinskoe gold deposit, their existence in the form of nano-scale particles is not excluded. This follows from the evolutionary model of surficial NAPs, assuming their partial transformation and aggregation with the formation of nano- and micro-sized autonomous phases of trace elements. The presence of PGE in the ores and the possibility of their extraction significantly increase the quality and value of the extracted raw gold materials at the Natalkinskoe deposit, and adds to the list of known platiniferous ore formations.

Graphical Abstract

1. Introduction

Studying the platinum content of gold ore deposits and platinum group elements (PGEs) in general in the rocks of carbon-containing and black shale formations is currently a promising area of research, both in Russia and abroad. Many researchers see these deposits as a promising new mineral resource, although views on the presence and potential of extracting PGE from the ores of these deposits are somewhat contradictory [1,2,3,4,5,6,7,8,9,10,11,12,13]. The Natalkinskoe deposit (Northeastern Russia, Magadan region) is one of the largest gold deposits in Russia, and so is of particular interest. In addition to gold, there are quite high contents of Pt and Pd in the ores of the deposit. There are few data on other PGEs (Ru, Rh, Ir and Os). PGE contents and distribution studies are necessary to complete the most important tasks in the geochemistry of endogenous ore formation, such as the study of the material composition and the identification of genesis features of deposits, including giant and unique deposits. These studies are of great practical importance. The presence of Pt in ores and the possibility of its extraction would significantly complement the list of already known platiniferous ore formations and significantly increase the quality and value of the gold ore raw materials mined.
Work to detect platinum content at the Natalkinskoe deposit began in 1990 by a research group headed by V.I. Goncharov from the North–East Interdisciplinary Scientific Research Institute of the Far-East Branch of the Russian Academy of Sciences (Magadan, Russia) [1,2,3]. Much geochemical and mineralogical work has been performed over the years, but in terms of contents of PGE “…the obtained analytical results remain ambiguous, and often contradictory” [3] (p. 132). The reliability of previously obtained high Pt content in ores (tens of ppm) and Pd (several ppm) [3,14] is still questionable. It was concluded that “Minerals-concentrators of platinum group elements are not found in the deposit” [3] (p. 136) nor in native mineral forms of PGE.
Subsequently, and until now, questions relating to this issue have been raised repeatedly, but there has been no clear response. Plyusnina and co-authors [14] (p. 840) concluded that “…the industrial content of precious metals (Au and Pt) at the Natalkinskoe deposit is caused by metasomatic alteration and sulphidization of carbonaceous rocks”. Unlike Au, the involvement of the carbonaceous substance in the accumulation of Pt has not been established by the authors of this work: the connection between this metal and the organic component of rocks and ores has not been found. It was assumed that sulphide minerals concentrate not only Au [3,15], but also Pt [14]. Later arsenopyrite was found to act as an Au, Pt and Pd concentrator at the Natalkinskoe deposit [11]. According to preliminary data obtained at that time, Pt contents in monofractions of this sulphide ranged from 23 to 62 ppm, and Pd from 2.3 to 9.5 ppm. Two main non-mineral forms of Pt and Pd, structural and surface-related, were identified. The nature of high contents of non-mineral Pt and Pd forms in arsenopyrite was found to be mainly superficial. Distinct mineral forms of Pt and Pd were not observed.
Considering all the above, the study of the binding forms and concentration levels of PGE in the most common sulphide minerals at the Natalkinskoe deposit, arsenopyrite and pyrite, seems to be an interesting and important task. This paper presents new data on the content of Pt and Pd in arsenopyrite and pyrite. The concentration levels of Ru, Rh, Ir and Os in these minerals are estimated for the first time. It is shown that the ambiguity of the results of previous studies may have been caused by the presence of hidden (so-called “invisible”) forms of PGEs.

2. Research Objects

The Natalkinskoe gold ore deposit, where this research was conducted, is located in the territory of Northeastern Russia (see Figure 1, inset). It is part of the Omchak ore-placer cluster and one of the largest gold reserves in Russia. Structurally, the deposit is confined to the boundary part of the estimated granite pluton in the Tenka deep fault zone and is associated with the collision development stage of the Yana–Kolyma fold system. The primary objects of the study are arsenopyrites and pyrites selected from the most industrially significant vein, streaky-vein and veinlet-disseminated ores of the Natalkinskoe deposit, which belong to the productive gold-bearing quartz–pyrite–arsenopyrite (with native gold) mineral association.
The deposit falls under the category of orogenic gold–quartz ore formations, and it is characterized by a complex, long-term nature of development and, according to most researchers, by metamorphogenic-hydrothermal genesis. The ore hosted rocks are identified as late Palaeozoic (upper Permian), and ore mineralization is presumably Mesozoic (from late Jurassic to late Cretaceous) [3]. The ores of the Natalkinskoe gold deposit, unique in scale, despite the diversity, form a deposit with uniform internal structure consisting of zones of quartz, carbonate–quartz, sulphide–quartz veins and veinlets, surrounded by a wide halo of sulphidized rocks. They are generally characterized by the same elemental and mineral composition, differing only in the degree of their manifestation: the quantitative ratios. The host volcanogenic sedimentary strata include diamictites, argillites and siltstone shales with layers of sandstones and gravelites with high carbon content. The ores of the deposit, as already mentioned, demonstrate relatively high contents of Pt and Pd. Commercial ores emerged in the interaction of host rocks with low- and moderate-salinity water–bicarbonate fluids in the salinity range of 3–12 wt% eq. NaCl, at temperatures of 360–280 °C and pressures of approximately 2.4–1.1 kbar [16]. More details on the geology, mineralogy, geochemistry and conditions of formation of the Natalkinskoe giant gold deposit are available [1,2,3,4,11,14,15,16,17,18,19,20,21,22,23,24,25,26,27,28].
To study the distribution features and forms of occurrence of PGEs in arsenopyrites and pyrites, 35 large-volume ore samples were selected, each weighing up to 10 kg. The samples were taken from quarries and boreholes of different horizons of the deposit from those most rich in the number of sulphide mineral veins, veinlets and metasomatites classed as gold vein, streaky-vein and veinlet-disseminated ores (the areas named “Geological”, “North–West”, “Central” and “South–East”). The schematic geological map of the Natalkinskoe gold deposit with areas from which samples were taken is shown in Figure 1, ore types in Figure 2.
Non-metallic minerals such as quartz, carbonates, feldspar, sericite, chlorite and carbonaceous matter (micrographite) were found in the specimens characterizing these samples. Arsenopyrite and pyrite amounted to 95–99% of the ore minerals, with the former predominating. Ore minerals, along with arsenopyrite and pyrite, the amount of which in some areas reached ~7%, included galena, sphalerite, chalcopyrite, rutile and native gold (up to 1%). Native gold with a fineness from 750‰, to 900‰, less frequently electrum, mainly of large grain size, was located mainly in the vein quartz and intergrowths with sulphide minerals. Small quantities of pyrrhotite, sulphoarsenides of nickel and cobalt and ilmenite were identified. More than 70 minerals were found at the deposit in total [3,19,20].

3. Research Methods

All ore samples were analyzed for Au and PGEs using atomic absorption spectrometry (AAS) and inductively coupled plasma mass spectrometry (ICP-MS) [29,30,31]. Twenty-two monofractions of arsenopyrite and 14 monofractions of pyrite were selected from the 7 ore samples richest in amount of sulphides, Au and PGE. They were all subjected to AAS analysis for Au, as were the ore samples [29,30]. All sulphide minerals were found to be gold-bearing. The level of Au content in arsenopyrite was 1.4–1383 ppm, in pyrite 0.8–158 ppm.
Further study of these gold-bearing arsenopyrites and pyrites for PGE was carried out using “phase” chemical analysis (PCA) based on AAS, coupled with analytical data selections for single crystals (ADSSC) [32,33], scanning electron microscopy with energy dispersive X-ray spectrometry (SEM-EDX) and laser ablation inductively coupled plasma mass spectrometry (LA-ICP-MS). These methods best characterize the peculiarities of minerals such as internal parts and surface layers, microinclusions, the so-called “invisible” impurity elements, their forms, distribution and concentration levels.
This set of methods was applied because PGEs in many deposits are represented by at least two forms—a solid solution in a carrier mineral and the submicroscopic inclusions of a PGE-rich material in an invisible form, undetectable by optical and scanning electron microscopy [34]. The results of the experiment and theoretical analysis suggest that not only Au, but also other noble metals (PGE and Ag) can form chemically bound forms of impurities in pyrite and other sulphides and chalcogenides [35]. The presence of these forms (at least one of them—a solid solution of PGE in sulphide or sulphoarsenide matrix) is identified even in low-temperature (~100 °C) platinum-bearing associations [36].
Current methods of “phase” chemical analysis for the determination of PGE in monofractions of arsenopyrite and pyrite, as well as the analysis of individual crystals of these minerals by AAS-ADSSC, allow a reliable determination of the contents of only three PGEs: Pt, Pd and Ru. The Rh analysis is under development, and the data are preliminary. All PGE—Pt, Pd, Ru, Rh, Ir and Os—can be analyzed using SEM-EDX and LA-ICP-MC methods. Restrictions are related only to their detection limits. Requirements for the selection of the test material are discussed below.
Monomineral samples of different sizes (0.07–0.14, 0.14–0.2, 0.2–0.25, 0.25–0.5, 0.5–1.0 and 1.0–2.0 mm) are taken for “phase” chemical analysis: individual and cluster crystals of arsenopyrite represented by pseudo-orthorhombic and monoclinic prisms; individual and cluster crystals of pyrite of cubic, pentagon-dodecahedral and cuboctahedral habits (Figure 3).
In order to study PGEs in arsenopyrites and pyrites using the AAS-ADSSC method, euhedral individuals with well-defined morphology were selected from monomineral fractions of different sizes, from 0.25 to 2 mm. The crystals of arsenopyrite were predominantly shaped as pseudo-orthorhombic prisms, close to a slightly distorted parallelepiped, and less frequently as monoclinic prisms. Selected pyrite crystals generally had the shape of a cube or parallelepiped, although the samples were often complicated by pentagonal dodecahedron and octahedron facets (Figure 4). Shape is the characteristic required for calculation of the specific surface area of average crystal in size sample using the form coefficient for the true polyhedron. In our case, the coefficient was six for cubes and parallelepipeds. A total of 415 arsenopyrite crystals and 234 pyrite crystals were selected and studied.
Twenty arsenopyrite crystals and 14 pyrite crystals were selected and examined by SEM-EDX and LA-ICP-MS in order to study the PGE distribution in the surface layer. Euhedral pseudo-orthorhombic crystals of arsenopyrite and cubic crystals of pyrite 0.5–1 mm in size were used to study the surface of these minerals by SEM-EDX. Larger (1–2 mm) crystals of arsenopyrite and pyrite with at least one clearly manifested face belonging to certain simple form were selected for the LA-ICP-MS study (see Figure 4).

3.1. “Phase” Chemical Analysis

PCA was carried out with 10–20 mg samples with the view to determine the PGE in monofractions of arsenopyrite and pyrite. Monofractions were ground to powder and decomposed with Aqua Regia during heating. After decomposition, the material was treated with concentrated HCl and evaporation to dry state to remove nitric acid residues and convert the salts to chloride form. After cooling, the samples were diluted with 2M HCl to the condition required for the AAS method with electrothermal atomization on the M-503 device (Perkin-Elmer, Waltham, MA, USA) using graphite atomizer HGA-72 (Perkin-Elmer, Waltham, MA, USA) [29,30]. Au was determined in all the samples, along with Pt, Pd and Ru [29]. The accuracy of determination was ±10–12 rel. %.

3.2. AAS-ADSSC Method

The study of the so-called “invisible” uniformly distributed impurity component of PGE in arsenopyrites and pyrites was carried out using the AAS-ADSSC method. The method was developed by V.L. Tauson and co-authors for the study of structural and surface-bound forms of gold in ore minerals [32,33,37,38]. The method was further refined and successfully used to study structural and surface-bound forms of Pt, Pd, Ru and Rh [11,38,39]. The technique is designed to determine the content of the structural impurity of the element with an uncertainty of ±30 rel. % [40,41]. The determination of Pt, Pd, Ru and Rh in solutions obtained through the decomposition of individual crystals of arsenopyrite and pyrite was carried out following their preliminary extraction, concentration and separation from the matrix. Tristyrylphosphine, (С6Н5СН–CH)3P, was used as an extracting agent. Extraction was carried out using hydrochloric acid solutions (0.5 M HCl). The extracting agent concentration was 0.05 M (in toluene), and the phase contact time was 30 min. The ratio of aqueous to organic phases was 2:1. The extraction was carried out in static mode at room temperature and without labilising additives. The organic phase was used to measure element concentrations. Measurements were performed by AAS with electrochemical atomization on an М-503 (Perkin-Elmer, Waltham, MA, USA) device with graphite atomizer HGA-72 (Perkin-Elmer, Waltham, MA, USA) [29,30].
The data obtained were statistically processed according to the regulations of the distribution of different binding forms of the element [33,38]. We divided the dataset (>30–40 crystals with evenly distributed element) into the intervals of crystal masses (sizes), chosen to be as narrow as possible, although statistically representative, and determined the average crystal mass in every size fraction ( m ¯ ), average size ( r ¯ ), specific surface area ( S ¯ s p ) and element content ( C ¯ ). The more size fractions and number of crystals in the final samples, the more reliable the results obtained. When constructing the dependences C ¯ = f( S ¯ s p ), we usually obtained a number of points best approximated with an exponent. The extrapolation of these curves to a zero-specific surface, that is, to a virtual infinite crystal, gave the bulk element content. In our model, this was equal to the structurally bound element content ( C s t r ) because all other possible bulk forms were eliminated at the stage of initial dataset processing. The superficially bound element content ( C ¯ s u r ) characterizes an average crystal among all size samples, that is, the surface-related excess content of the element, and can be calculated with the equation given in [38]. It is important to note that in such an approach, the amount of the material is normalized to the whole crystal, and this allows a comparison of the contribution of surface and bulk related forms of the element to its total content.

3.3. SEM-EDX Method

The study of the “invisible” impurity content of the element on the surface of arsenopyrite and pyrite crystals by SEM-EDX was carried out on a Quanta 200 scanning electron microscope (FEI Company, Hillsboro, OR, USA) with energy-dispersive accessory EDAX (FEI Company, Hillsboro, OR, USA) with nitrogen-free cooling for X-ray spectral microanalysis. The maximum spatial resolution of the device with a tungsten cathode and a standard detector of secondary and backscattered electrons was 3.5 nm. In elemental analysis, the resolution maximally amounted to 2 μm. The EDAX accessory with EdaxGenesis software enables not only semiquantitative but also quantitative analysis of elements in a wide range (from Be to U) with a resolution of 127 eV and a minimum detection limit of 0.5 wt% for the elements considered. Microphotography and crystal surface analyses were performed under high-vacuum conditions, without sputtering and at an accelerating voltage of 30 kV. Elemental analysis was performed on a flat area with a side of at least 2 μm. The contents were calculated using the three-correction ZAF method (atomic number, absorption and fluorescence). The ZAF method is based on measuring the X-ray intensity of the i-th element of the sample (Ji) and the standard of the known composition containing this element (J(i)) under the same conditions, minus the intensity of the X-ray background radiation, followed by normalization by 100%. To study the chemical composition of the surface of arsenopyrite and pyrite crystals using the SEM-EDX method, the most “clean” areas, with virtually no inclusions or significant defects visible at maximum magnification were selected. It seems meaningless to use polished samples while examining natural surfaces. However, it is possible to minimize fluctuations of the probe current by selection of smooth-faced sections and their positioning in the SEM device. Sections with as little roughness as possible (2–3 nm, well comparable with ordinary polished surfaces) were selected using atomic force microscopy on a SMM-2000 scanning probe microscope (Proton-MIET, Moscow, Russia).

3.4. LA-ICP-MS Method

The study of the surface layer of arsenopyrite and pyrite crystals was continued using the LA-ICP-MS method. A quadrupole inductively coupled plasma mass spectrometer NexION 300D (Perkin-Elmer, Waltham, MA, USA) was used in combination with a laser ablation system NWR-213 (New Wave Research, Fremont, CA, USA) with a laser wavelength of 213 nm. The working and carrier gases were Ar and He, at 99.999% purity. The laser burned a continuous groove (track) no longer than 1.4 mm on the surface of the crystal. The diameter of the laser beam was 100 μm, the frequency was 10 Hz and the energy on the surface of the sample was 0.4 J/cm2. The laser movement speed was 70 µm/s, and the background measuring time was 20 s. The calibration graphs were constructed in compliance with the NISTSRM610, NISTSRM612, NISTSRM614, BHVO-2G, TB-1G and NKT-1G international standards. It was possible to verify the results for several elements (Au, Pd and Pt) using the in-house sulphide reference sample, which included highly homogeneous ferrous greenockite (α-CdS) crystals synthesized hydrothermally at 500 °C and 1 kbar pressure [42]. The instrument error determined for PGE did not exceed 10%. The contents of the elements in arsenopyrite and pyrite were calculated according to the depth of the track. The ablation depth was controlled by a Quanta 200 scanning electron microscope (FEI Company, Hillsboro, OR, USA). An analysis depth from 0.5 to 1 µm per laser pass was obtained for all samples. For one of the arsenopyrite crystals (sample M-129/10) selected for a detailed study, the laser parameters were adjusted in such a way as to achieve the burned layer of ~100 nm in depth in one pass. Depth was controlled using atomic force microscopy with a SMM-2000 scanning probe microscope (Proton-MIET, Moscow, Russia). In this case, the diameter of the laser beam was 5 μm, the frequency 20 Hz, and the energy on the surface of the sample was 10 J/cm2 with similar parameters. The instrument error for Pt and Pd did not exceed 30%.

4. Results and Discussion

This section presents data for the study of distribution features and forms of occurrence of PGE (Pt, Pd, Ru, Rh, Ir and Os) in arsenopyrite and pyrite from the Natalkinskoe gold deposit. The data were obtained through local (SEM-EDX and LA-ICP-MS) and, so to speak, “semi-local” analyses (PCA and ADSSC). That is, the methods are not exactly local but were by no means bulk analysis, with a resolution at the level of different size fractions (PCA) or the size of individual crystals (ADSSC). The combination of local analysis and statistics for the compositions of individual monocrystals of different sizes is a unique feature of our approach.

4.1. Pt, Pd, Ru and Rh Content in Monomineral Fractions of Arsenopyrite and Pyrite According to PCA

All studied arsenopyrites and pyrites from the deposit were found to be concentrators not only of Au, but also of such elements as Pt, Pd and Ru. Data on their content are given in Table 1. The highest contents (in ppm) were observed in arsenopyrite: Pt up to 128, Pd up to 20 and Ru up to 86, with lower values identified in pyrite: Pt up to 29, Pd up to 15 and Ru up to 58. The first, although preliminary, results on the content in the monofractions of the studied sulphides of another platinum group element, Rh, have been obtained (Table 2). Maximum contents of this element, up to 21 ppm, as well as for Pt, Pd and Ru are found in arsenopyrite, and lower levels up to 5.9 ppm were found in pyrite. Not only gold-bearing arsenopyrites, but also pyrites were shown to act as concentrators of these elements. It can be argued that the most platinum-rich ores have a sulphide–quartz composition. The data on PGE content in bulk ore samples are in favor of this argument. Relatively high contents (in ppm) were observed for Pt (up to 0.260) and Pd (up to 0.029), and elevated contents for Os (up to 0.003), Ru (up to 0.004), Rh (up to 0.0012) and Ir (up to 0.0006).

4.2. Results of the Study of Pt, Pd, Ru and Rh in Arsenopyrites and Pyrites by AAS-ADSSC

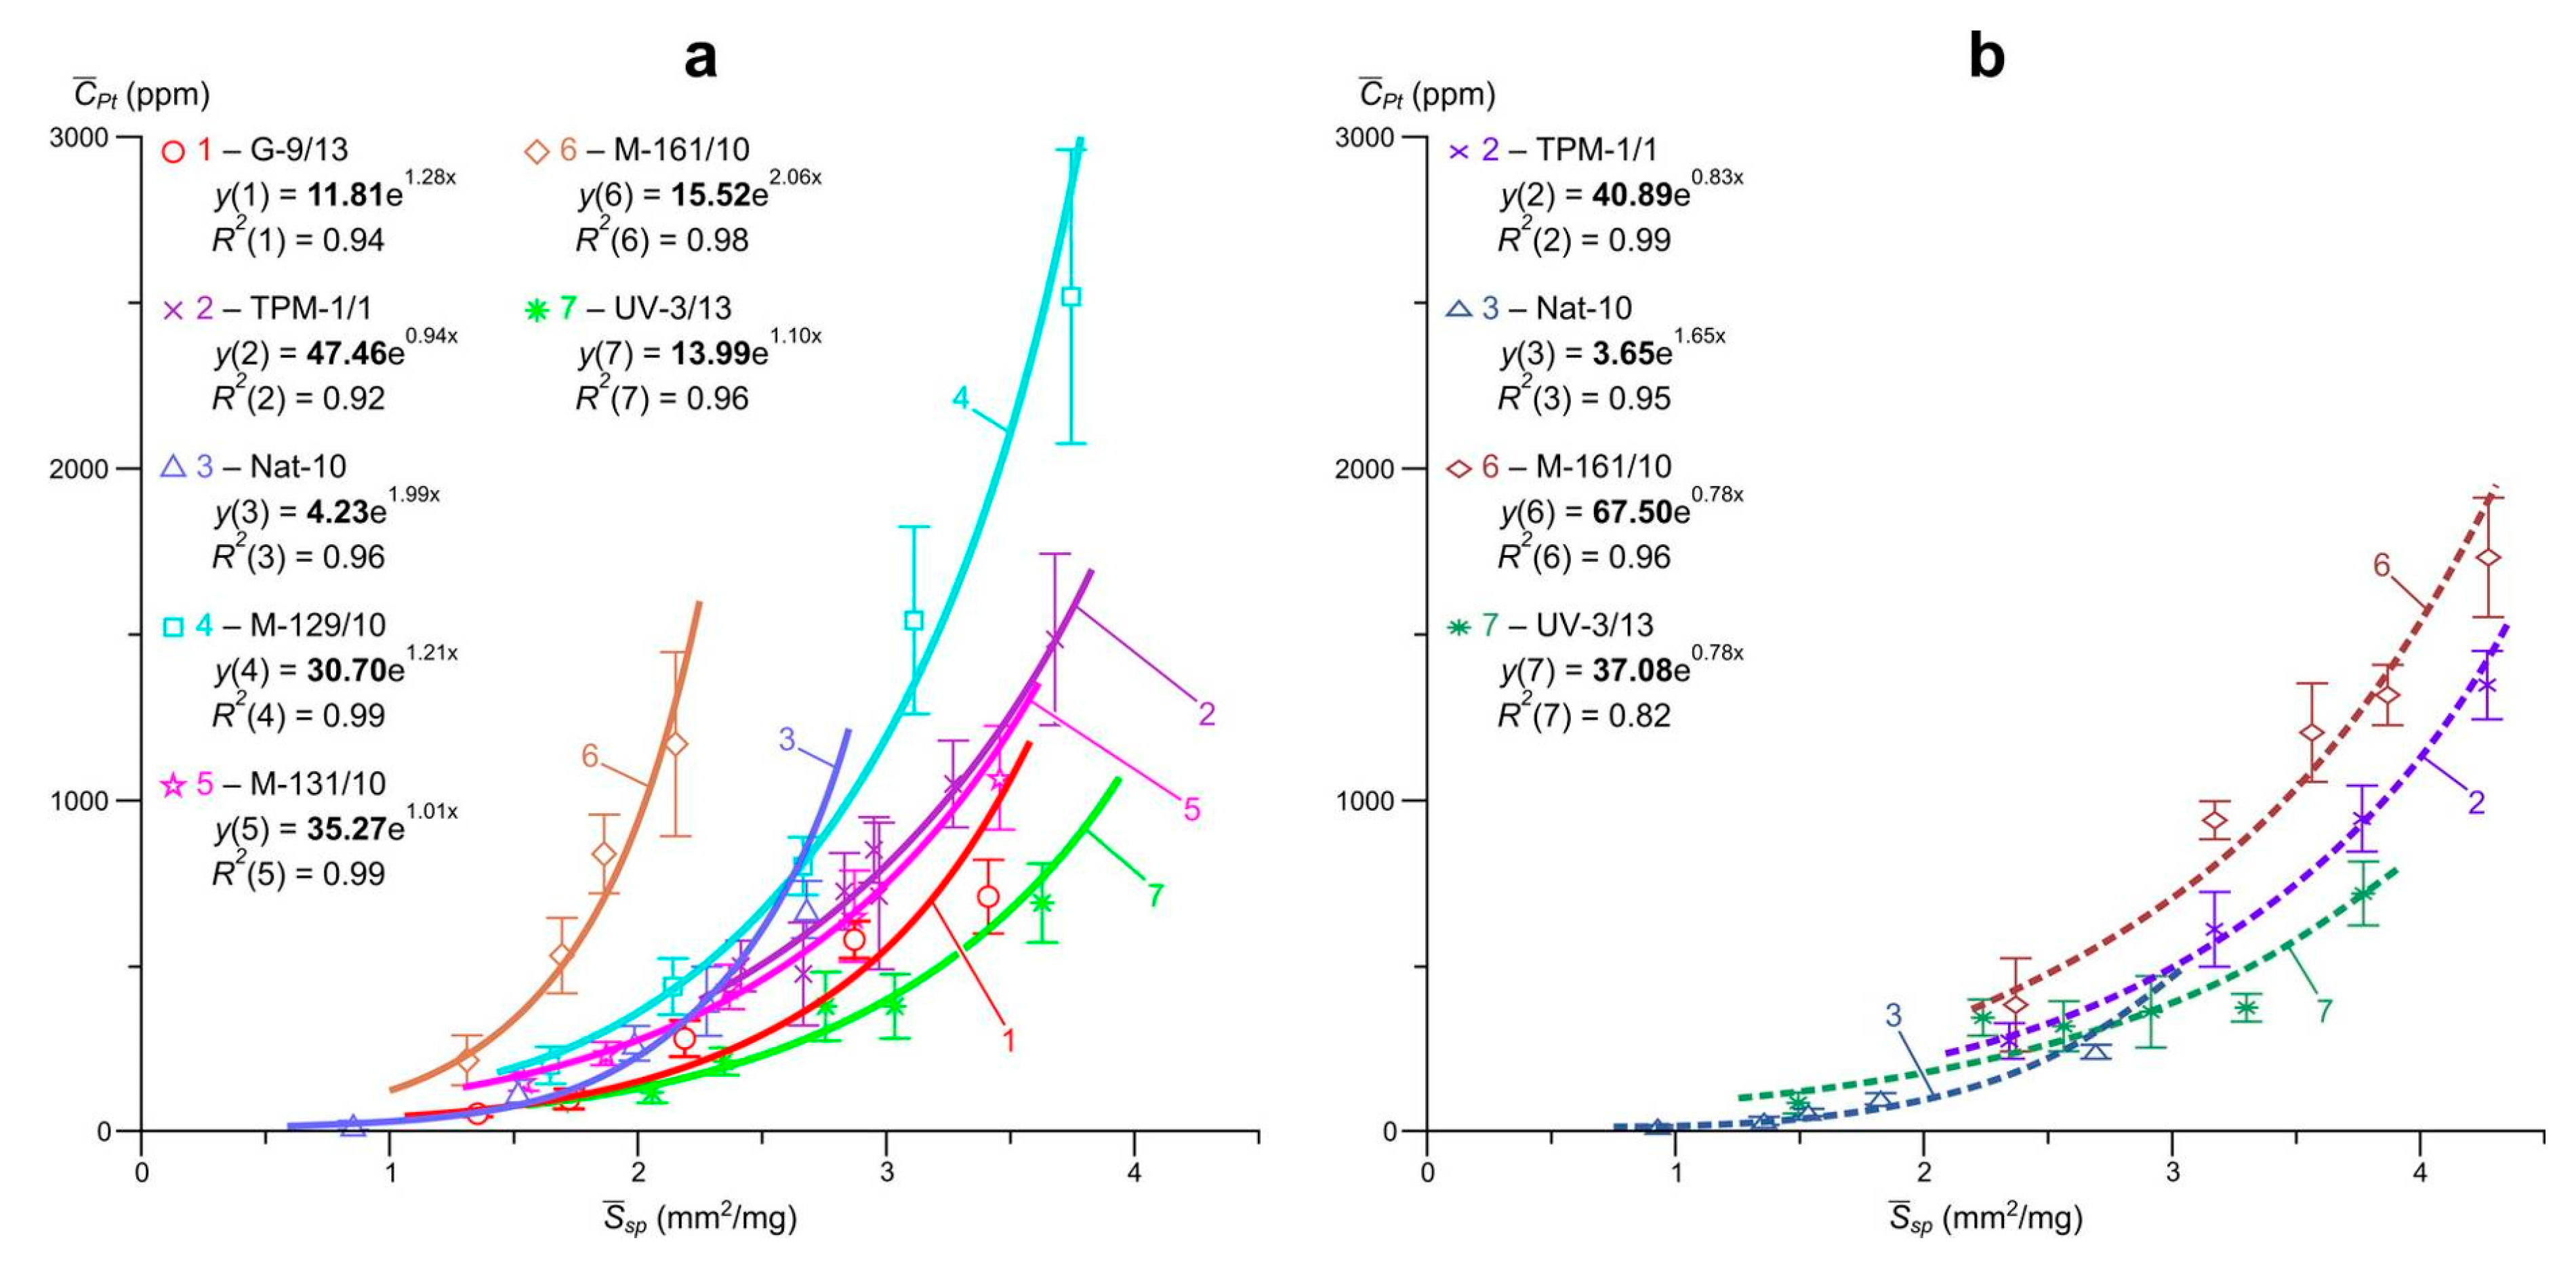
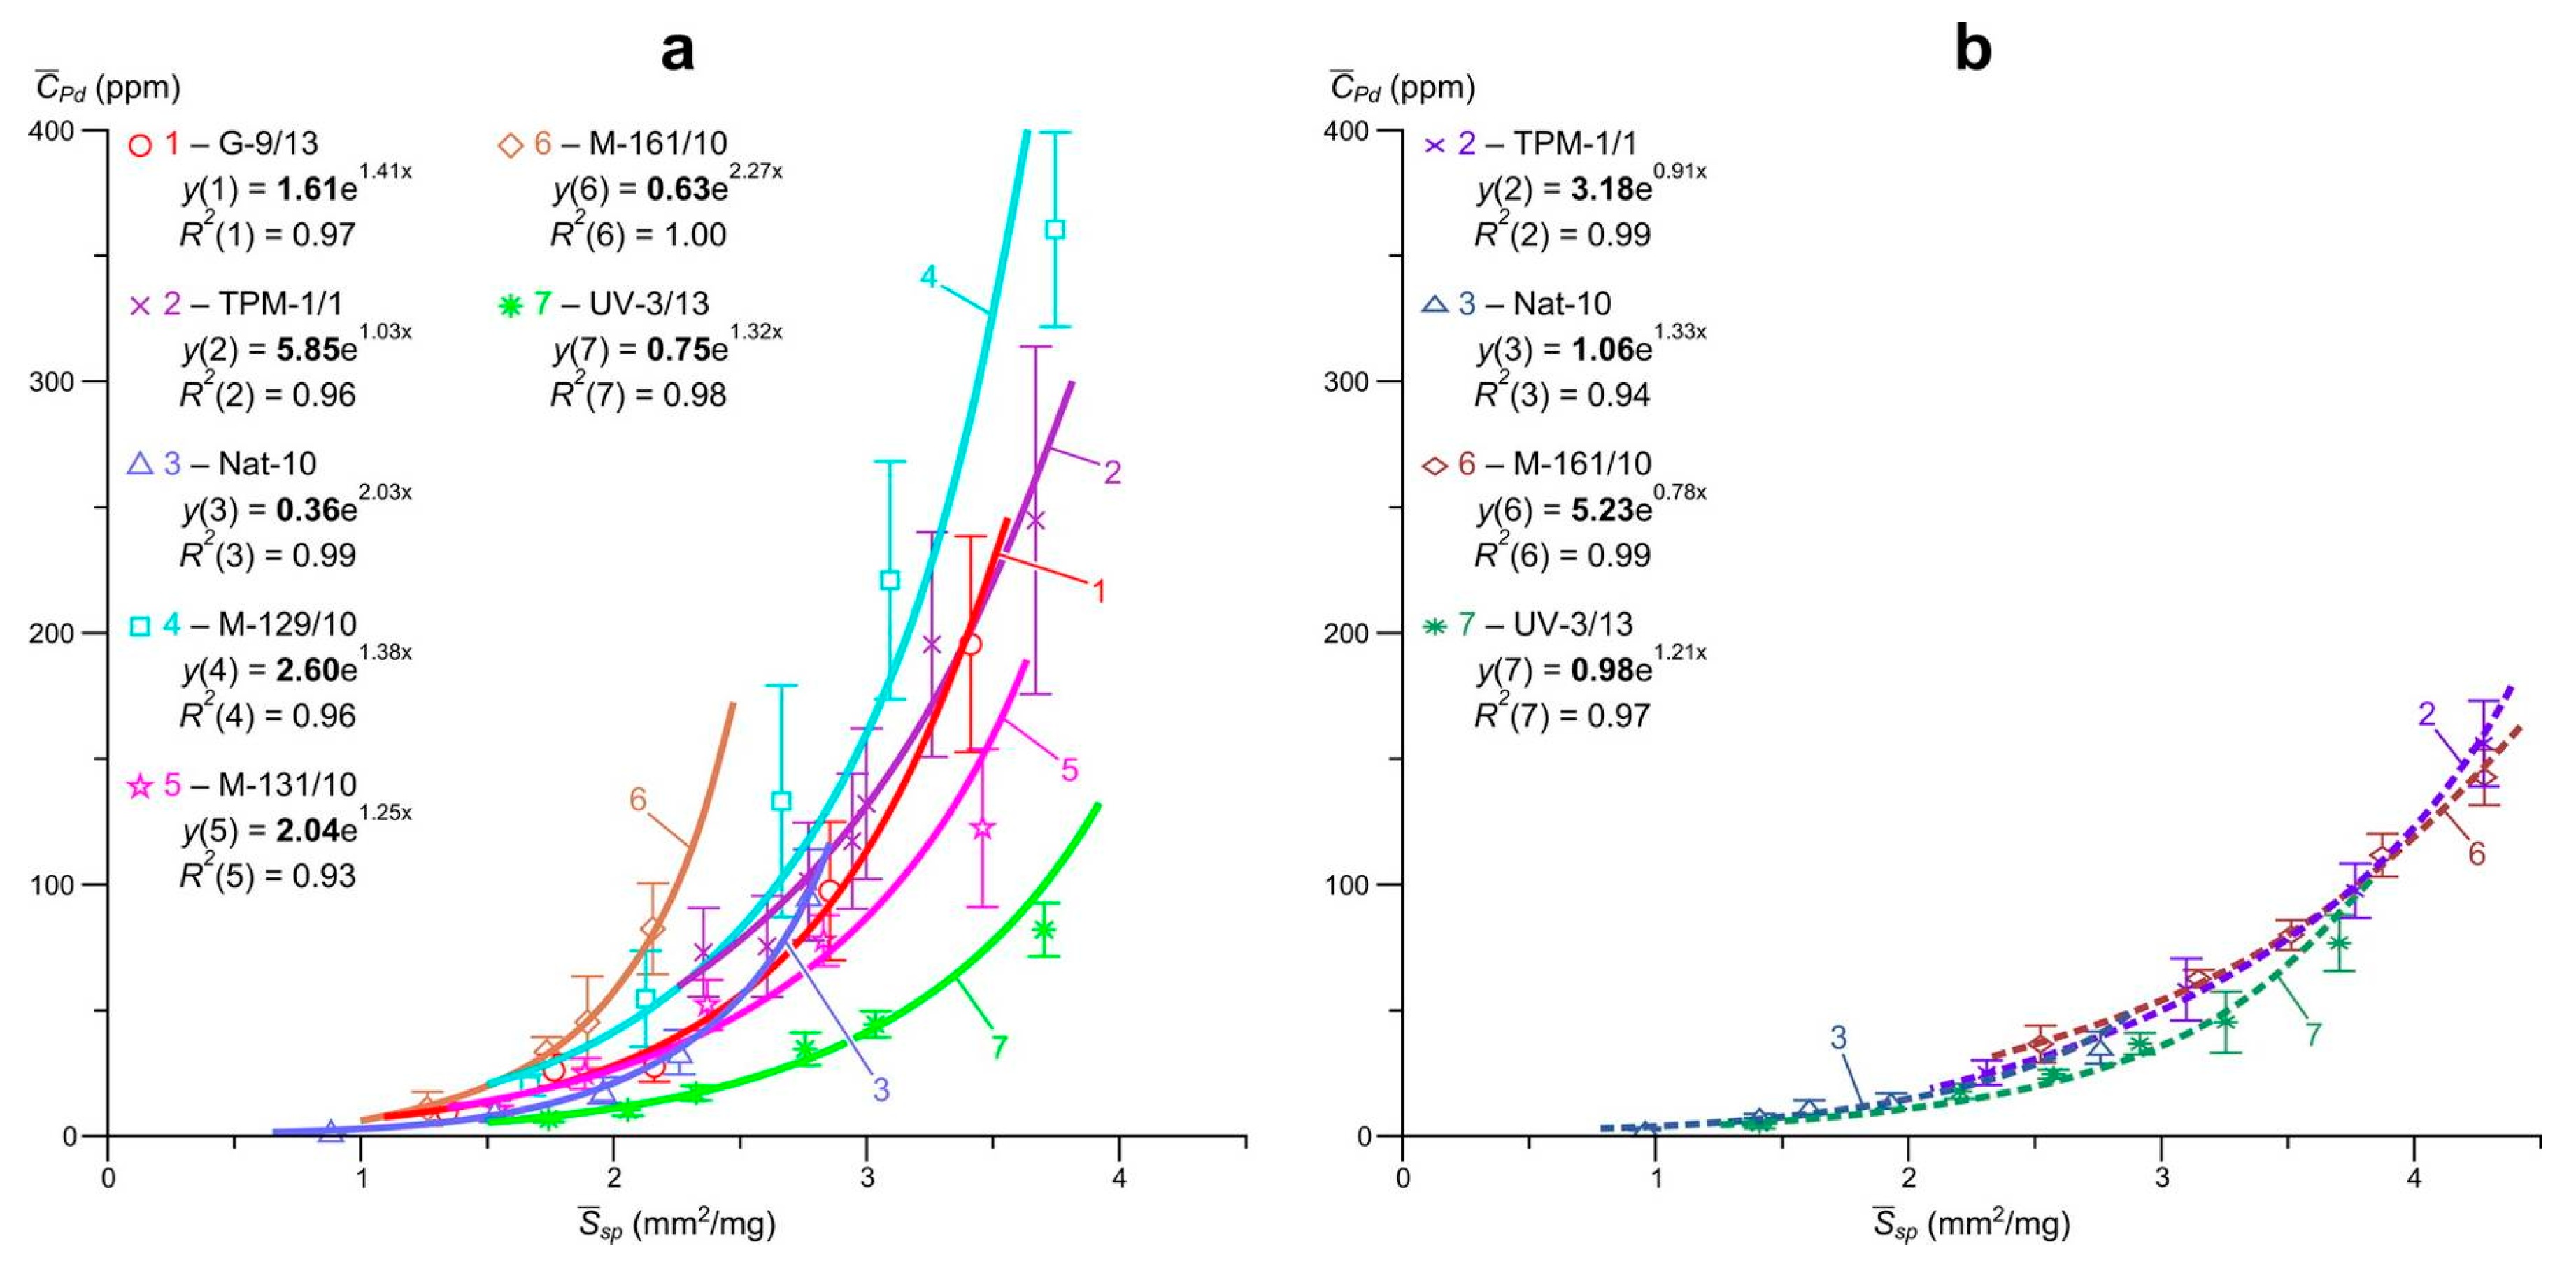
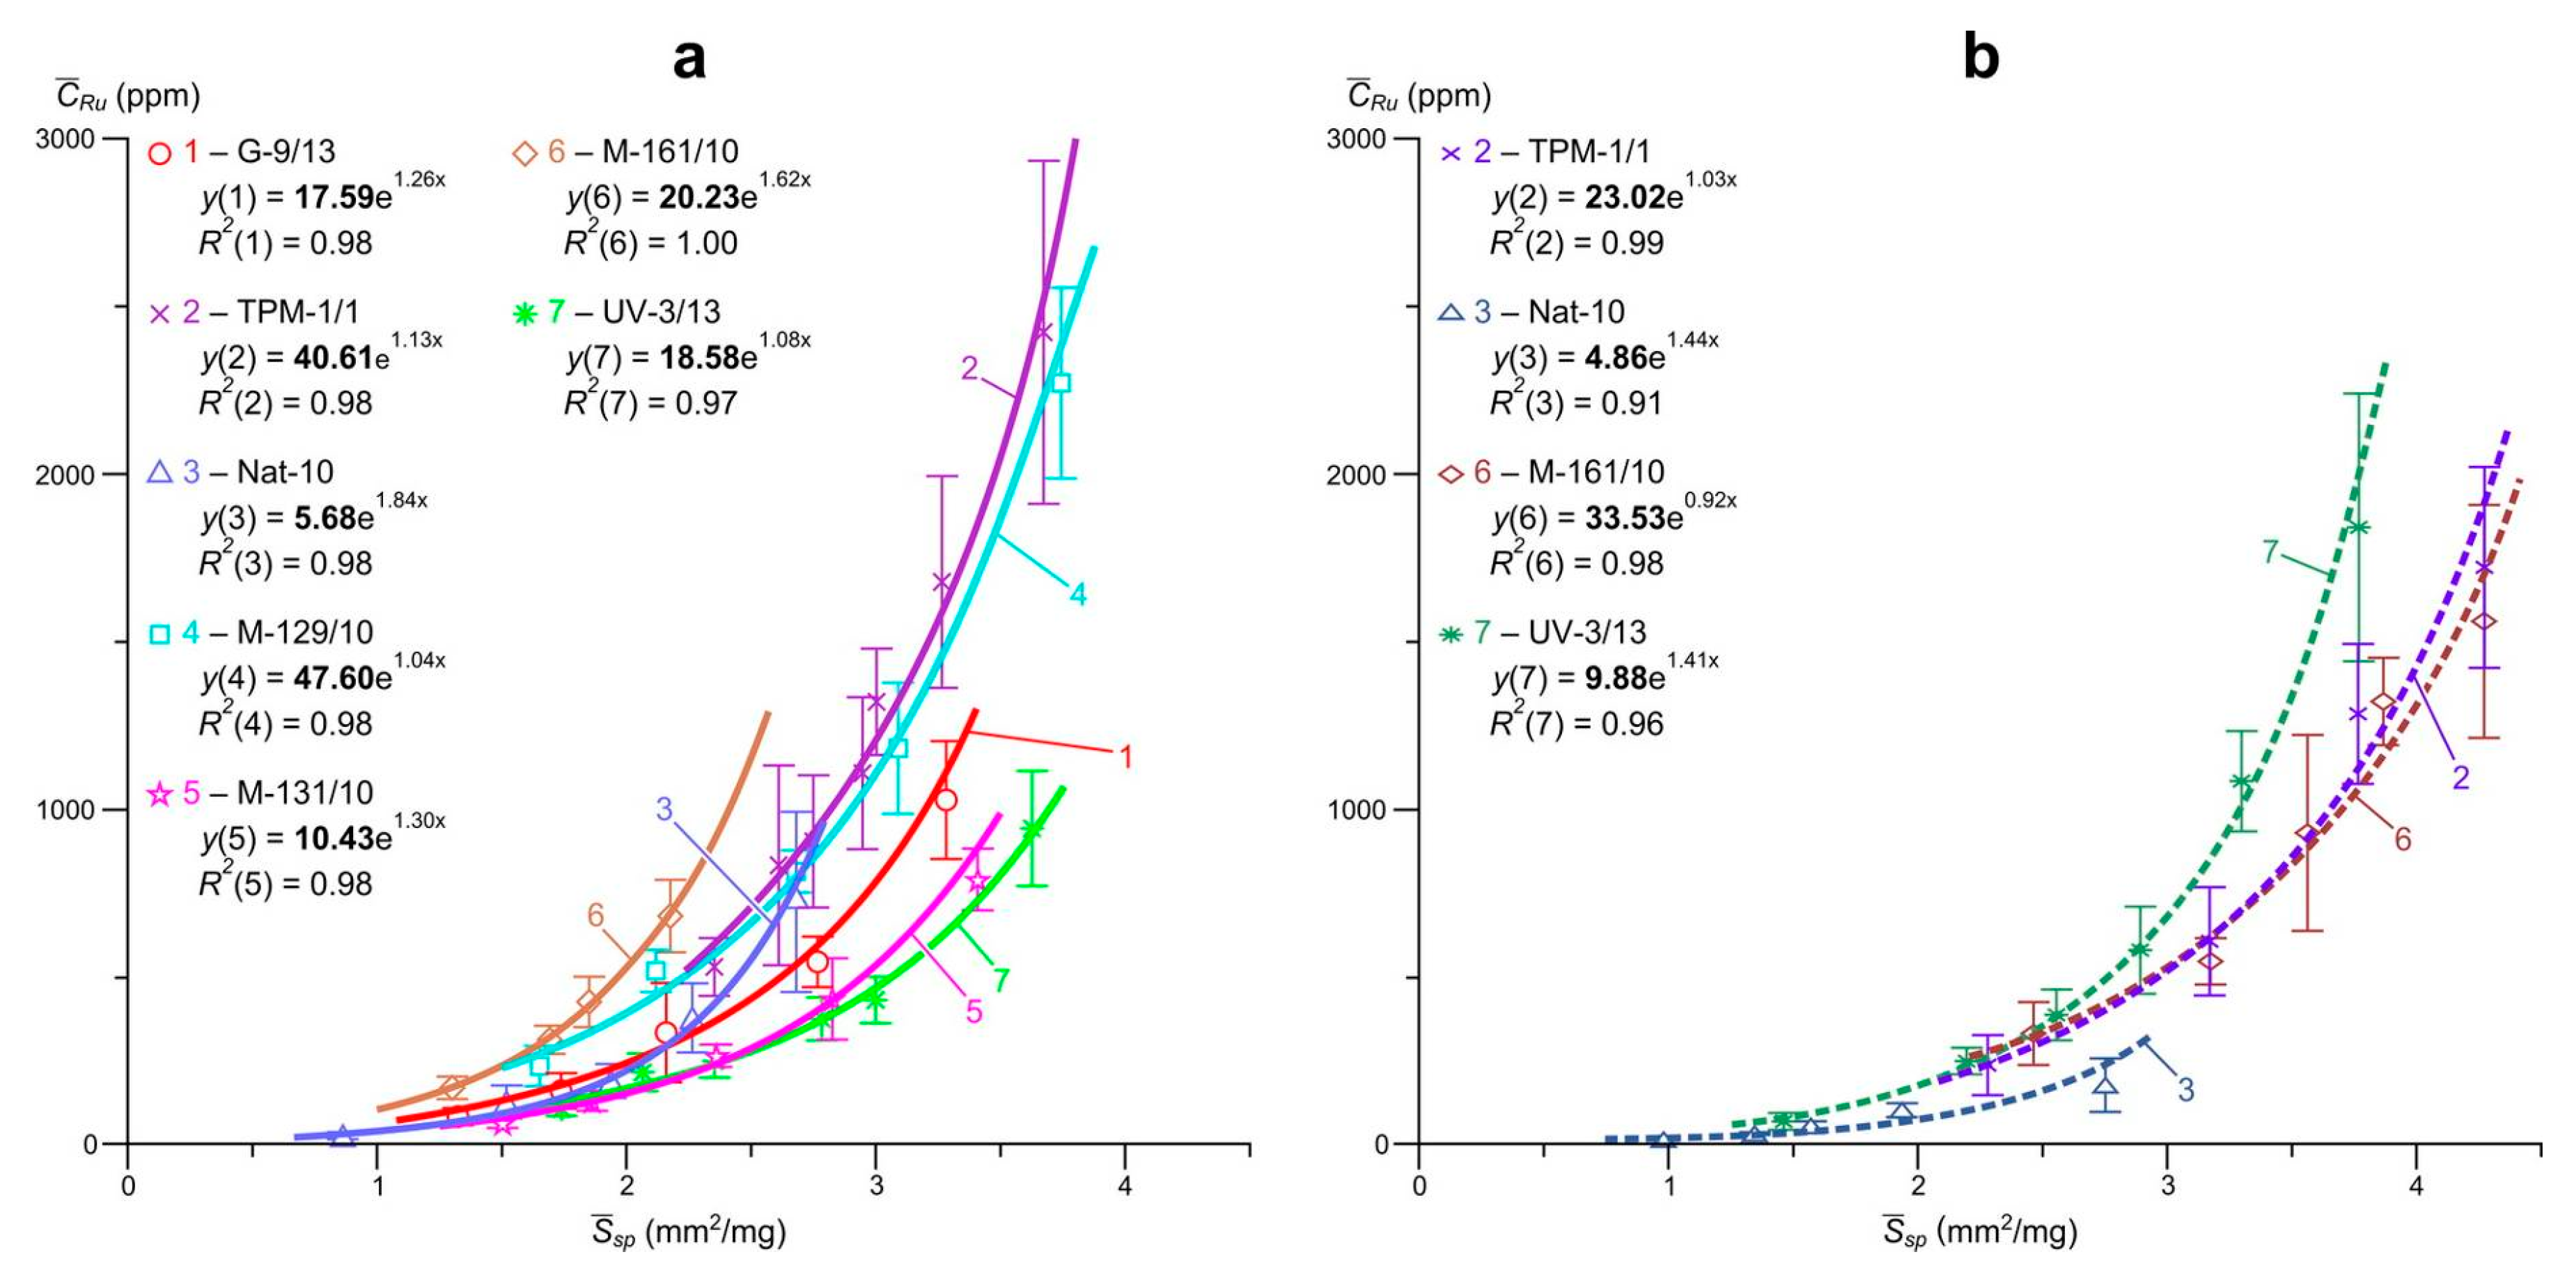
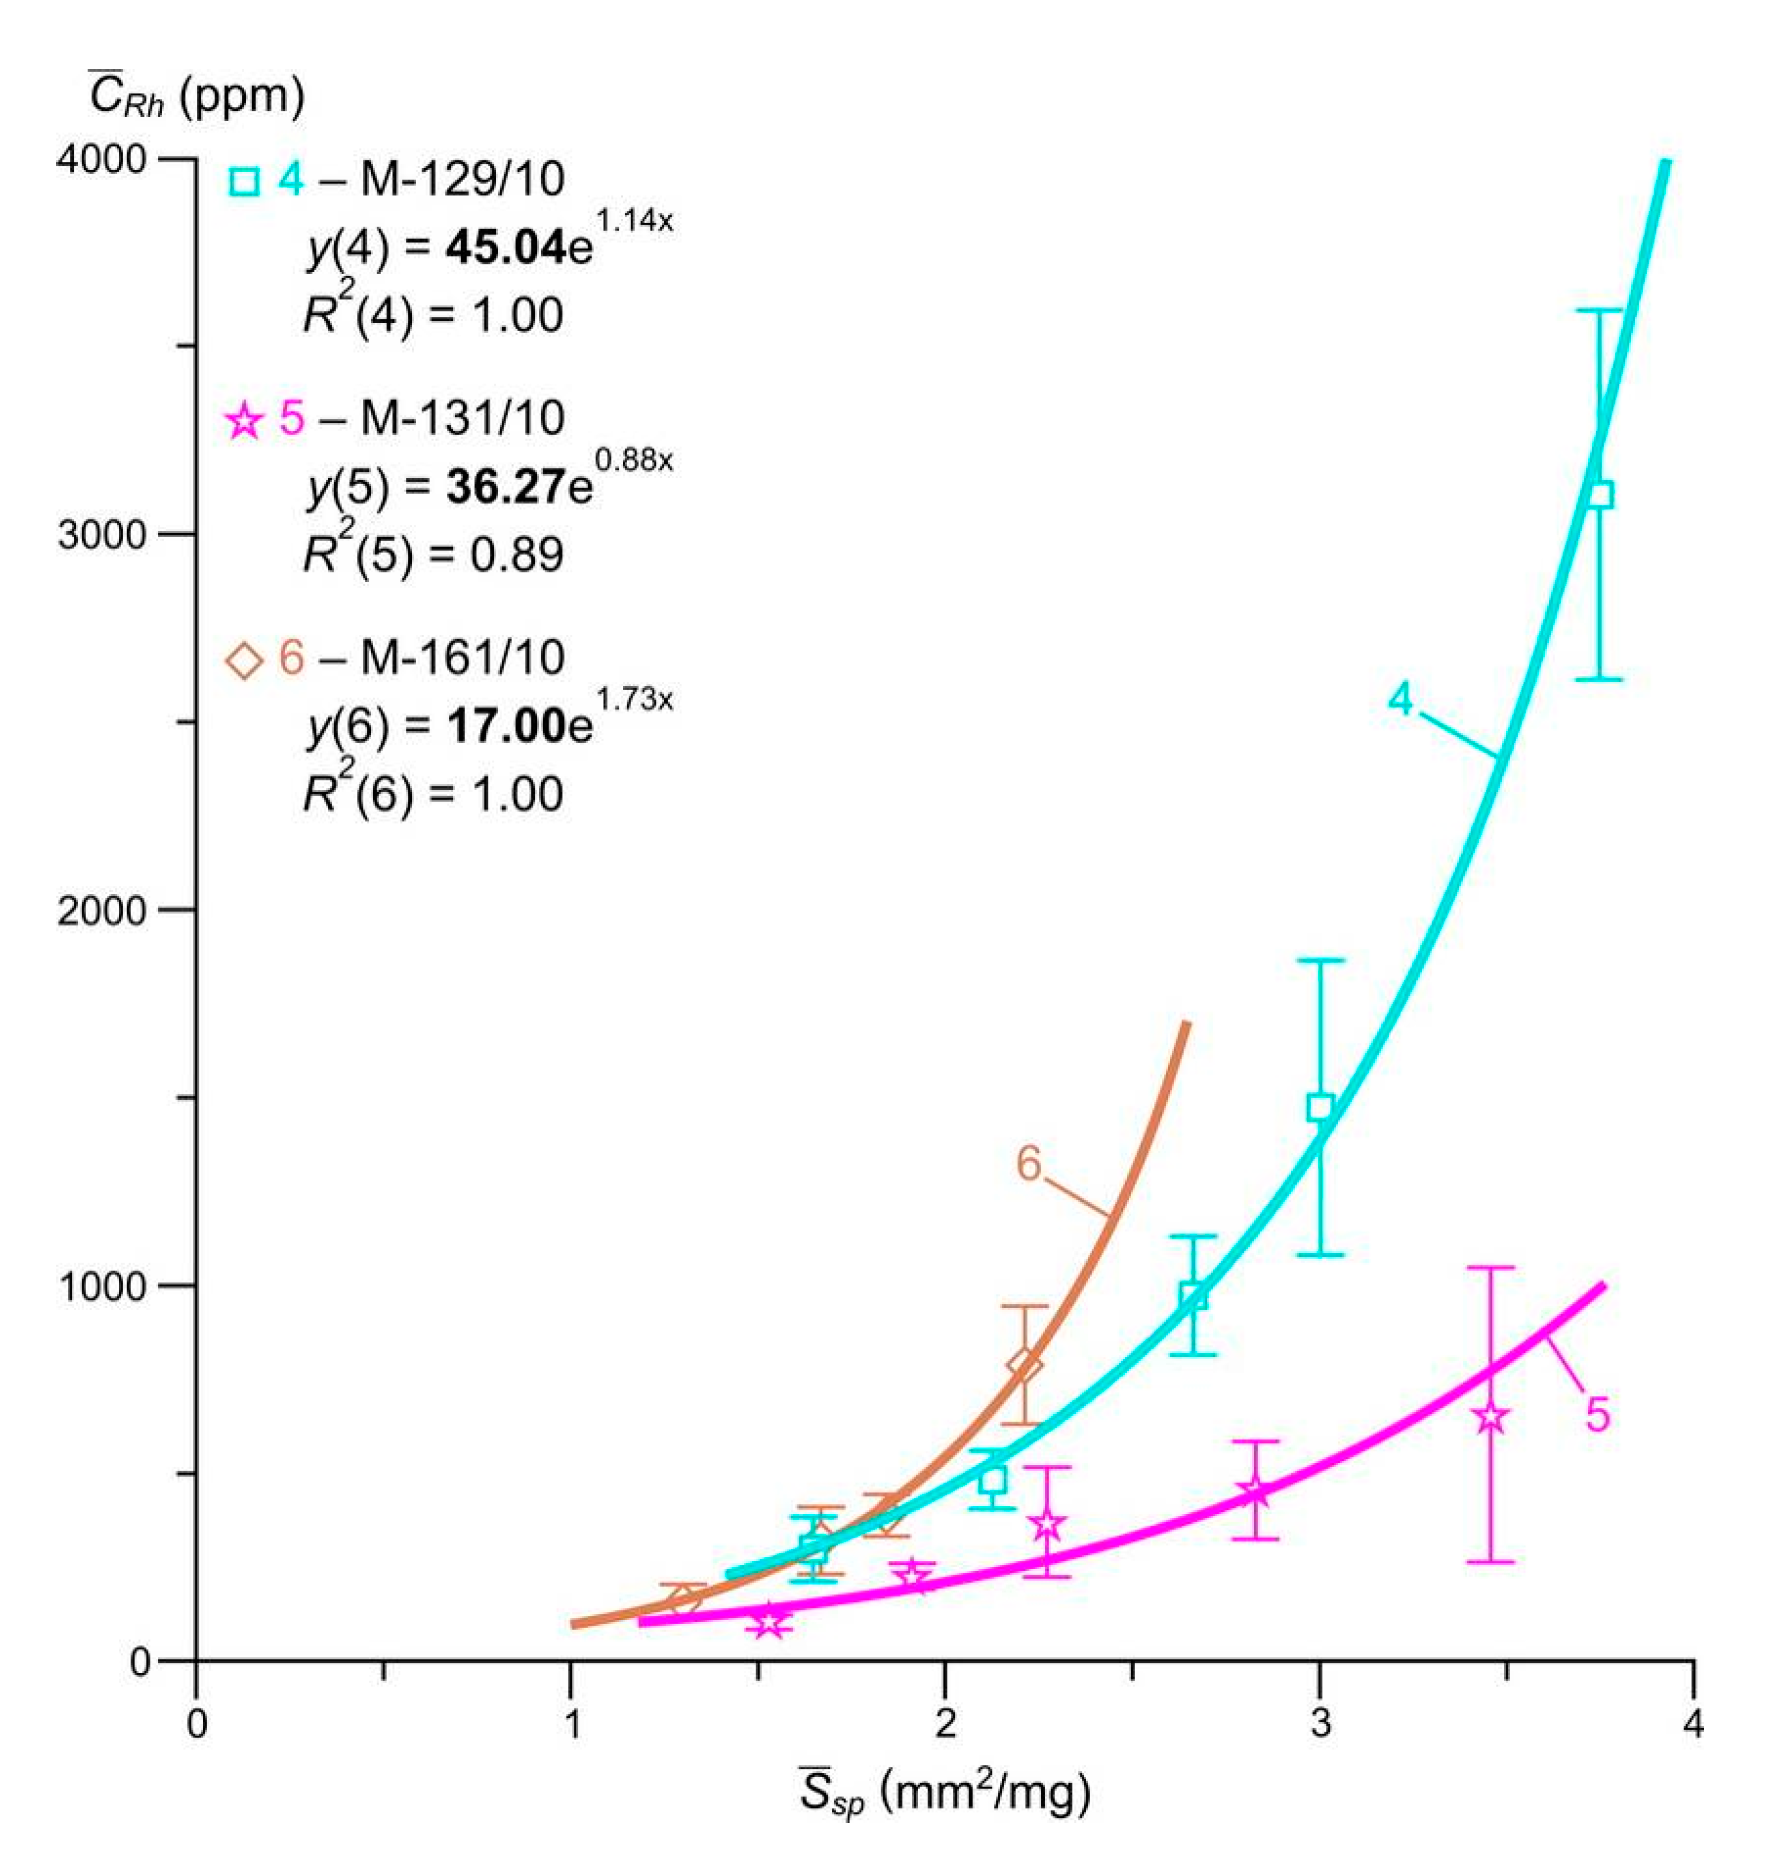
Data on the so-called “invisible” uniformly distributed impurity of Pt, Pd and Ru and the ratio of their structural and surface-bound forms in arsenopyrites and pyrites of the Natalkinskoe deposit are presented in Figure 5, Figure 6 and Figure 7 and Table 3, Table 4 and Table 5. In all cases, highly deterministic (R2 = 0.82–1.0) dependences of the average element content in the size sample on the specific surface area of the average crystal in it were obtained. The highest R2 values were set for arsenopyrite: Pt, 0.92–0.99; Pd, 0.93–1.0 and Ru, 0.97–1.0 and were slightly lower for pyrite: Pt, 0.82–0.99; Pd, 0.94–0.99 and Ru, 0.91–0.99.
Extrapolation of these dependences to zero specific surface area ( S ¯ s p , mm2/mg, Table 3, Table 4 and Table 5), i.e., on a conditionally infinite crystal in the first case of arsenopyrite, and in the second pyrite, yields the following estimates of the contents of the structural form of the elements ( C s t r , ppm): for arsenopyrite Pt, 4.2–48; Pd, 0.4–5.9 and Ru, 5.7–48; for pyrite Pt, 3.7–68; Pd, 1.0–5.2 and Ru 4.9–34 (Figure 5, Figure 6 and Figure 7). The average contents of surface-bound form of elements ( C ¯ s u r , ppm) are given in Table 3, Table 4 and Table 5 and for arsenopyrite amount to the following values: Pt, 89–714; Pd, 8.1–114 and Ru, 79–1083; for pyrite Pt, 35–890; Pd, 4.9–62 and Ru, 30–690.
By now, the range of PGE studied by the AAS-ADSSC method has expanded. The first results for the forms of occurrence of Rh, one more element of the platinum group in crystals of arsenopyrite, were obtained. These data are still limited and preliminary. The results of the study of the content of evenly distributed Rh and the ratio of its structural and surface-bound forms in arsenopyrites from vein and streaky-vein ores of the Natalkinskoe deposit are presented in Figure 8 and in Table 6. In all cases, as well as for Pt, Pd and Ru, highly deterministic (R2 = 0.89–1.0) dependences of the average Rh content in the size fraction on the specific surface area of the average arsenopyrite crystal in it were obtained. Extrapolation of these dependences to a zero-specific surface, i.e., to a conditionally infinite crystal, yielded estimates of the contents of the structural form of this element of 17–45 ppm. The average grades of the surface-associated forms were 154–678 ppm for arsenopyrite (see Table 6).
The data presented (PCA and AAS-ADSSC) suggest that arsenopyrite also acts as a concentrator mineral for Rh. Structural and surface-bound forms in arsenopyrite (as well as in pyrite), as the main uniformly distributed forms, are characteristic not only of Pt, Pd and Ru, but also Rh. The data obtained confirms that arsenopyrites and pyrites are major mineral concentrators of PGE at the Natalkinskoe gold ore deposit. It can also be assumed that the size dependence of the content of evenly distributed Pt, Pd, Ru and Rh, and the confinement of a significant part to the surface of the crystals, is not a unique phenomenon for sulphide minerals of ore deposits. Structurally and superficially bound forms, as the main uniformly distributed forms, may be typical of both the remaining PGE (Os and Ir) and of other noble metals—Au and Ag [11,37,38,39,41,42,43,44,45].
New data for Pt and Pd forms in arsenopyrites, both structural and surface-bound, confirmed earlier conclusions [11]. The uniformly distributed Pt, Pd and Ru and, as we believe, Rh in arsenopyrites and pyrites are forms of elements which are chemically bound in the structure of these minerals and in nanoscale nonautonomous phases (NAPs) on the surface of arsenopyrite and pyrite crystals. The latter usually dominates over the former according to the content of these elements. Recent experimental and natural data [37,38,46] suggest that Pt, Pd, Ru and Rh, as well as Au, can be incorporated into NAP formed on the surface of arsenopyrite and pyrite crystals in a very thin surface layer (~100–500 nm). These elements are absorbed by NAP from the hydrothermal solution even more efficiently than gold, which is incompatible in pyrite.
There is currently high demand for studies of the surface layer of sulphide minerals as possible hosts for “invisible” forms of trace elements, the nature of their distribution and concentration levels. Nanoscale NAPs enriched with Pt, Pd, Ru and Rh form a part of the so-called impurity component on the surface of arsenopyrite and pyrite crystals. The importance of its investigation is obvious. It is assumed that there is a common mechanism of absorption of all noble metals for the studied sulphides due to the active role of the surface during the growth of the crystal from a supersaturated hydrothermal solution [38,39]. This mechanism is closely related to the conditions of ore formation. This is an important point that must be taken into account in practical terms, for example, in the concentration of ores that include sulphides, in our case arsenopyrite and pyrite.
The structurally bound form of PGE, primarily Pt, despite a lower content compared to the surface form, is also extremely important. As shown earlier, data on the structural form of Au, Ag and Pt make it possible to make comparative estimates of the contents of these elements in the ore-forming fluids that form gold deposits. It is the only form of the element occurrence that can be used as an indicator of element activity in hydrothermal solution [37,46]. For example, the experimental data on the distribution and segregation of trace elements in crystals of ore minerals grown in hydrothermal systems were used to assess the content of Au and Pt in the ore-forming fluid ( C a q ) of the Natalkinskoe and Degdekan gold deposits. The content of the element in the structural form in natural pyrite, and the distribution coefficient ( D s t r ) for the same form between pyrite and hydrothermal solution according to experimental data, were used for estimating element content in the ore-forming fluid [38]. In Table 7 these results are supplemented by the data from the present work on samples M-161/10, TPM-1/1 and Nat-10.
The average value of D s t r is 0.1 for Au and 21 for Pt [41,46]. The evaluation of Au and Pt content in the ore-forming fluid showed that Au content in the fluids of the Degdekan and Natalkinskoe gold deposits was mainly at the level of 1.3–3.2 ppm, and it reached a maximum value of 18 ppm for the Nat-10 sample. Pt grade ranged from 0.1 to 3.2 ppm and, on average, was clearly elevated at the Natalkinskoe deposit compared to Degdekan. The fluid of the Natalkinskoe deposit was rich in both elements compared to the fluid of the Degdekan deposit. Au and Pt contents in solution were also comparable for most samples from the Natalkinskoe deposit (with the exception of the anomalous Au in sample Nat-10), whereas Au dominated over Pt in the Degdekan deposit. This is another argument in favor of studying platinum-bearing gold deposits, of which the Natalkinskoe deposit is no exception. Information about the Pt content in the fluid is of particular value in view of the complex behavior of Pt and the heterogeneity of its distribution under the capture of gas–liquid inclusions, the composition of which is determined by LA-ICP-MS as a proxy of the ore fluid composition [47].

4.3. Study of the Chemical Composition of the Surface of Crystals of Arsenopyrite and Pyrite Using the SEM-EDX Method

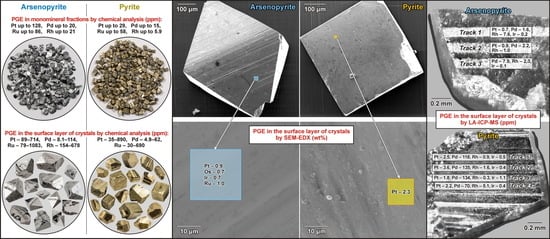
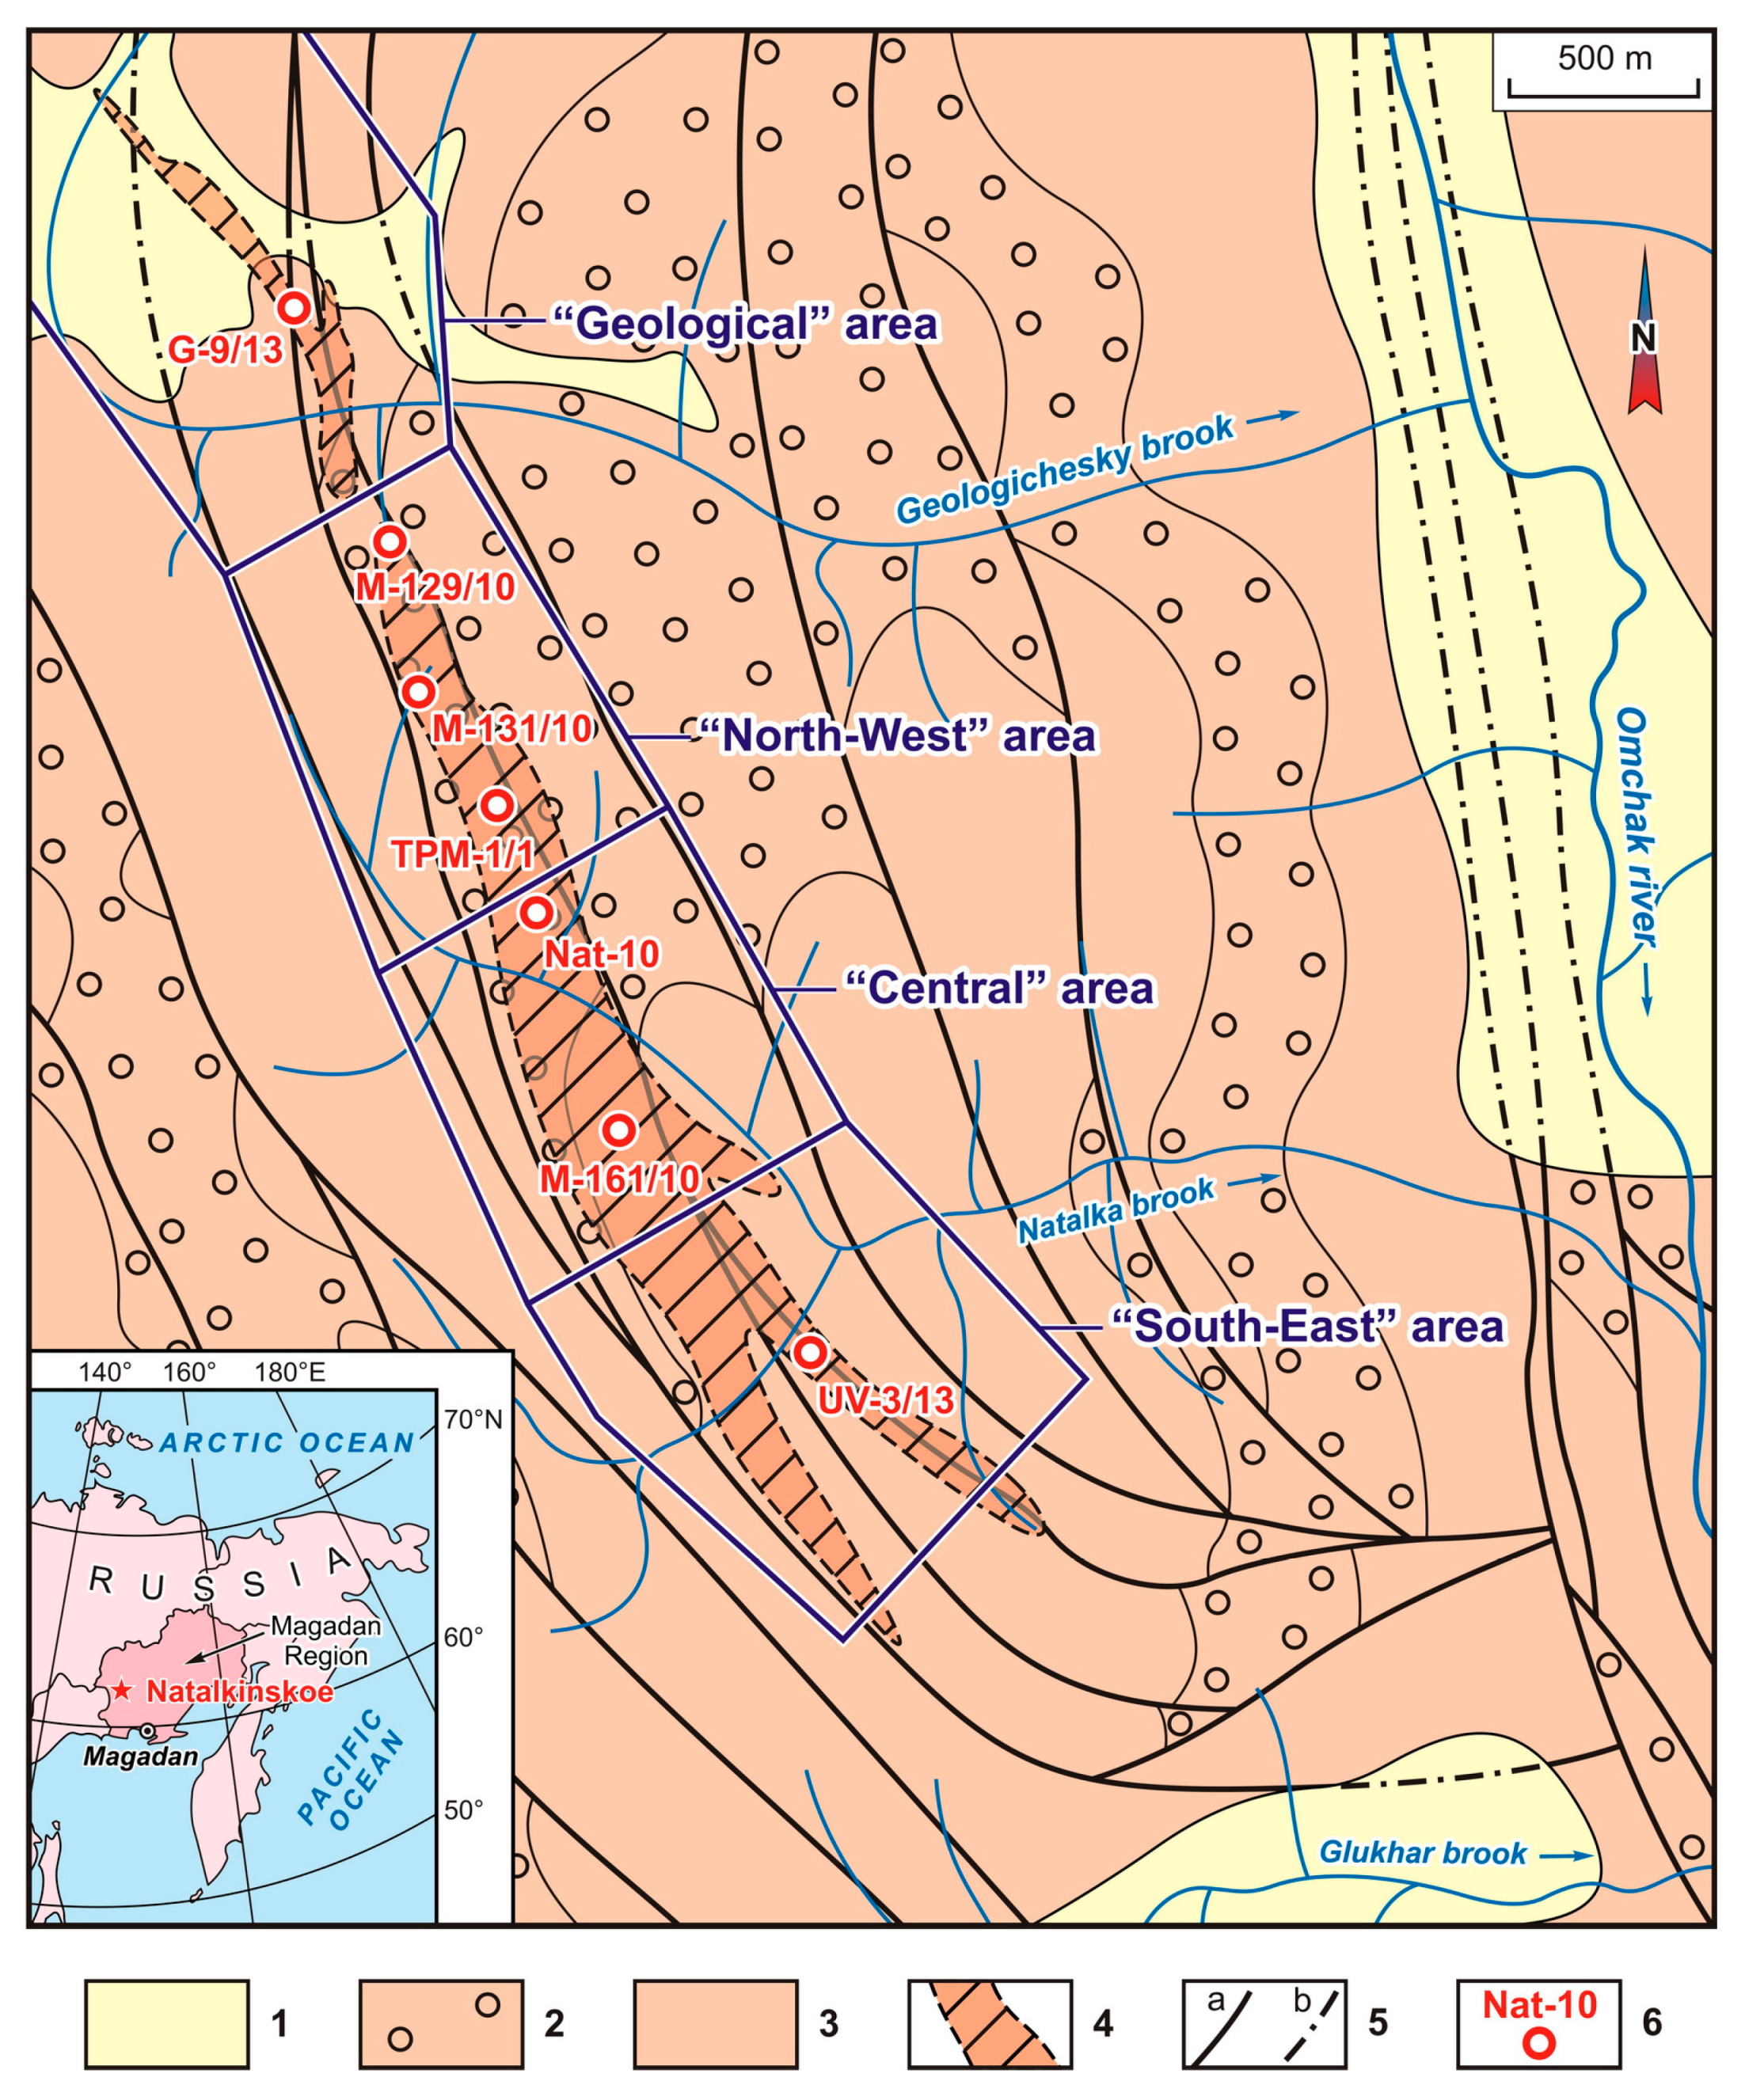
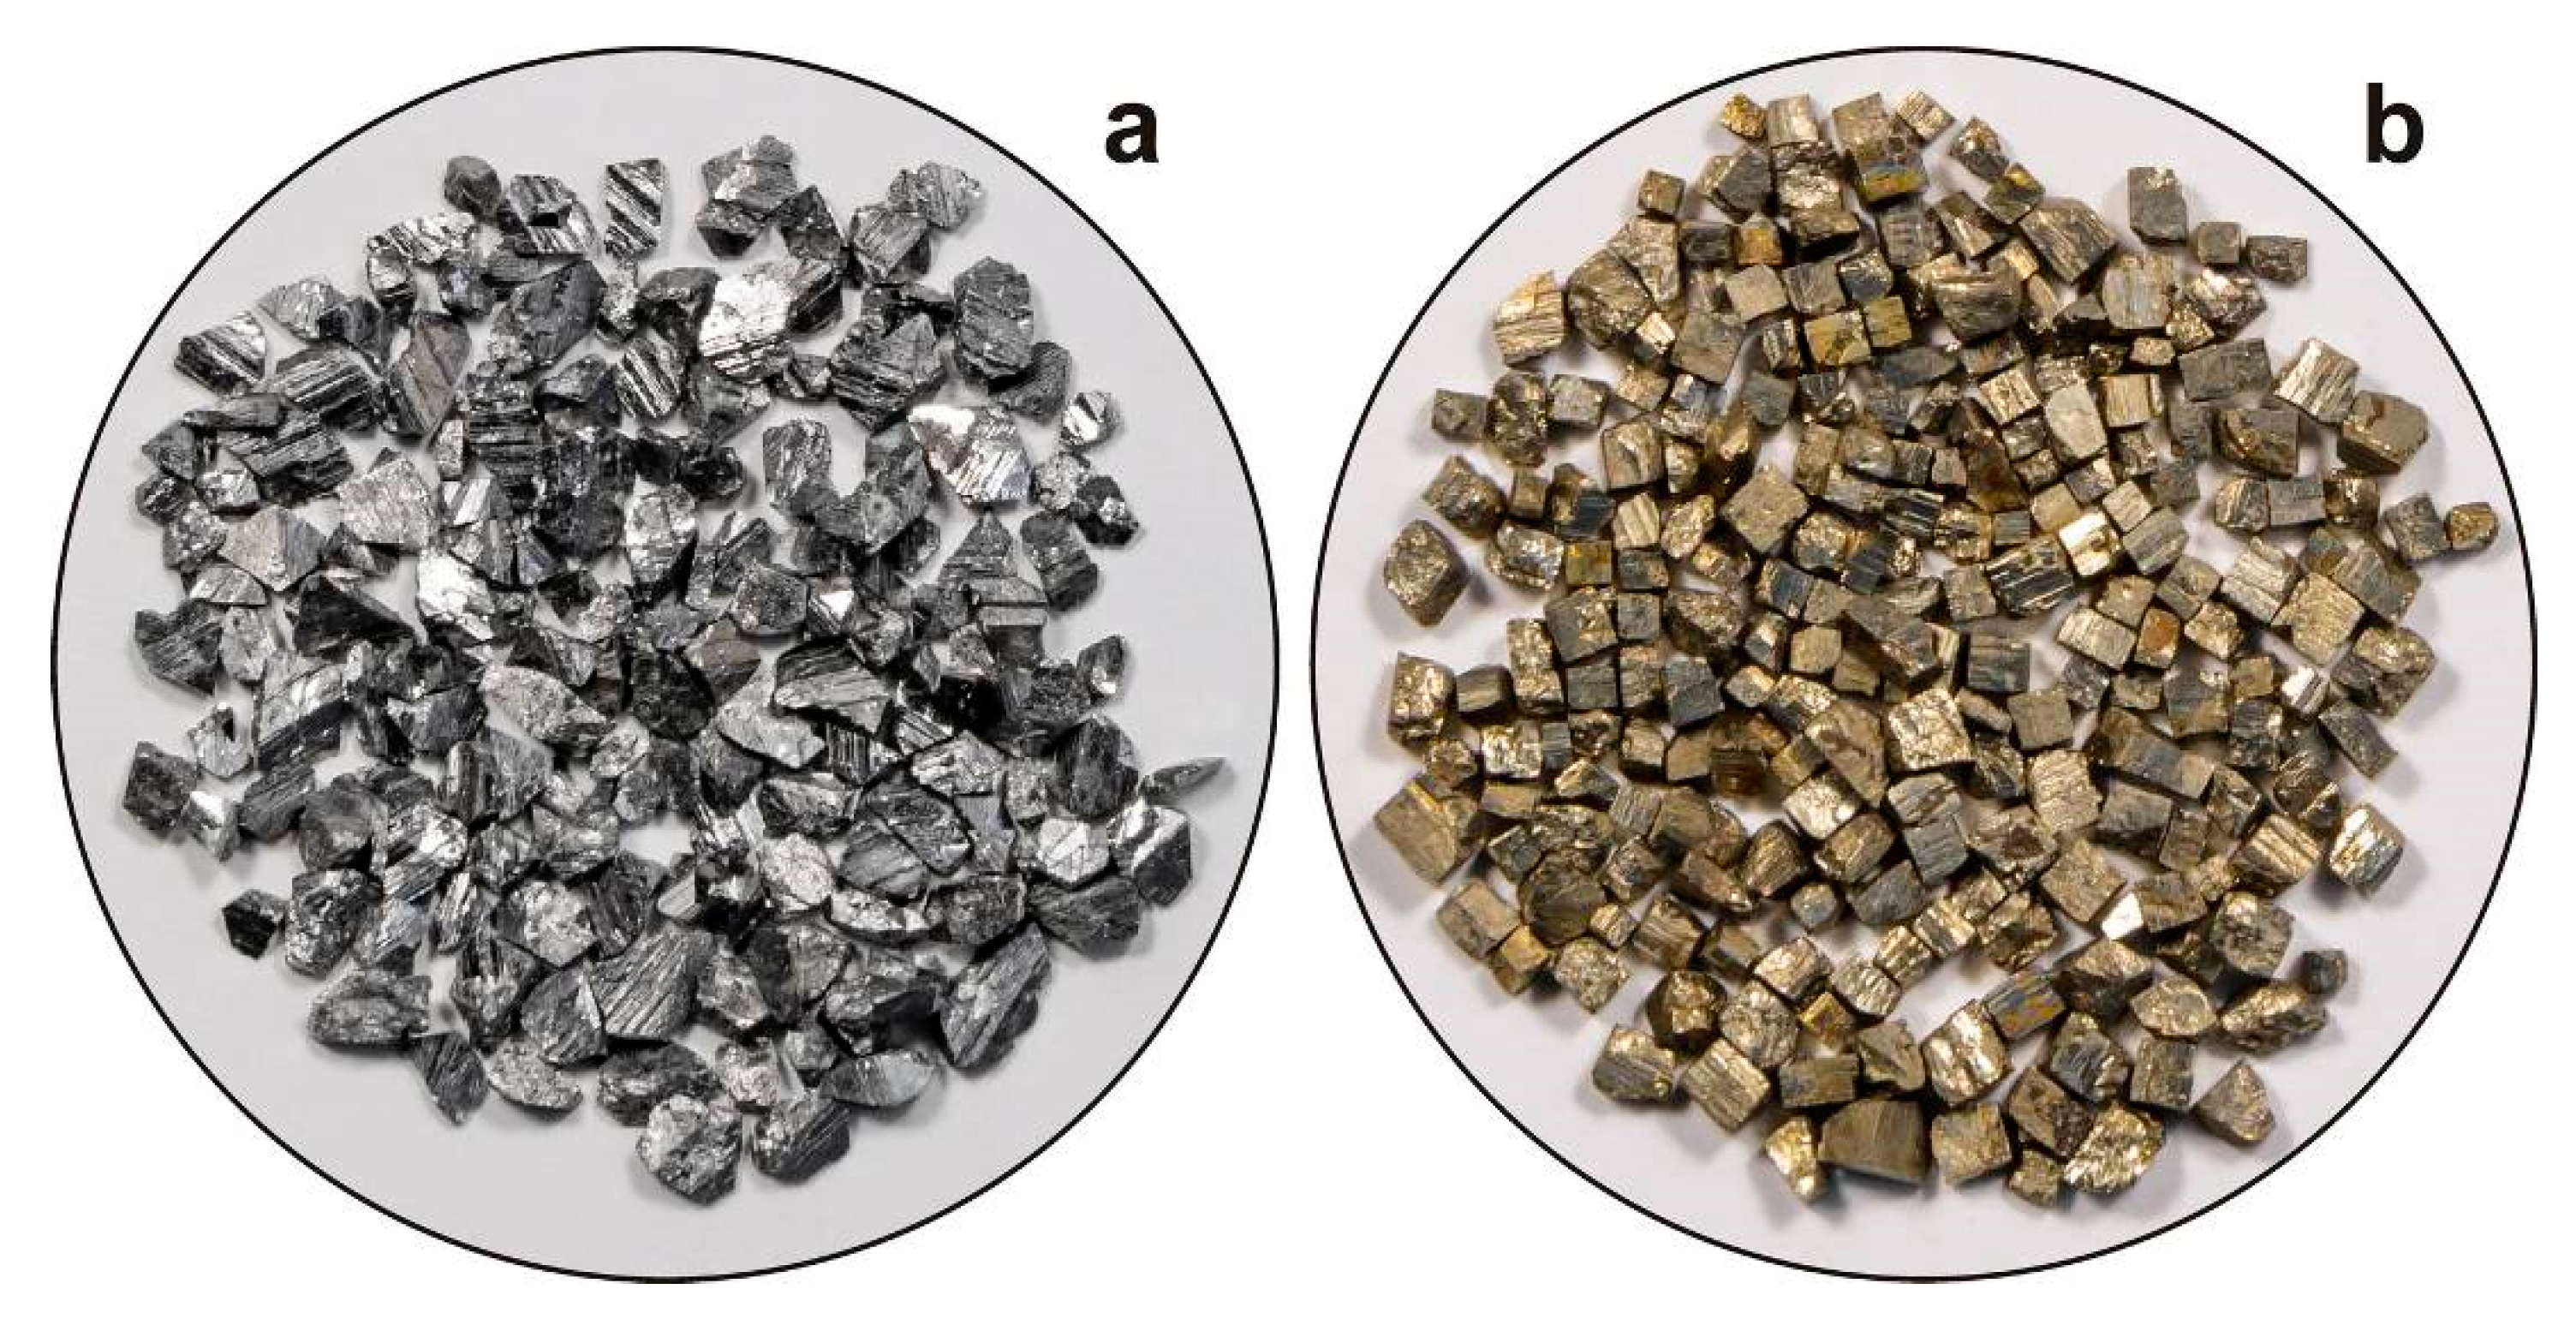
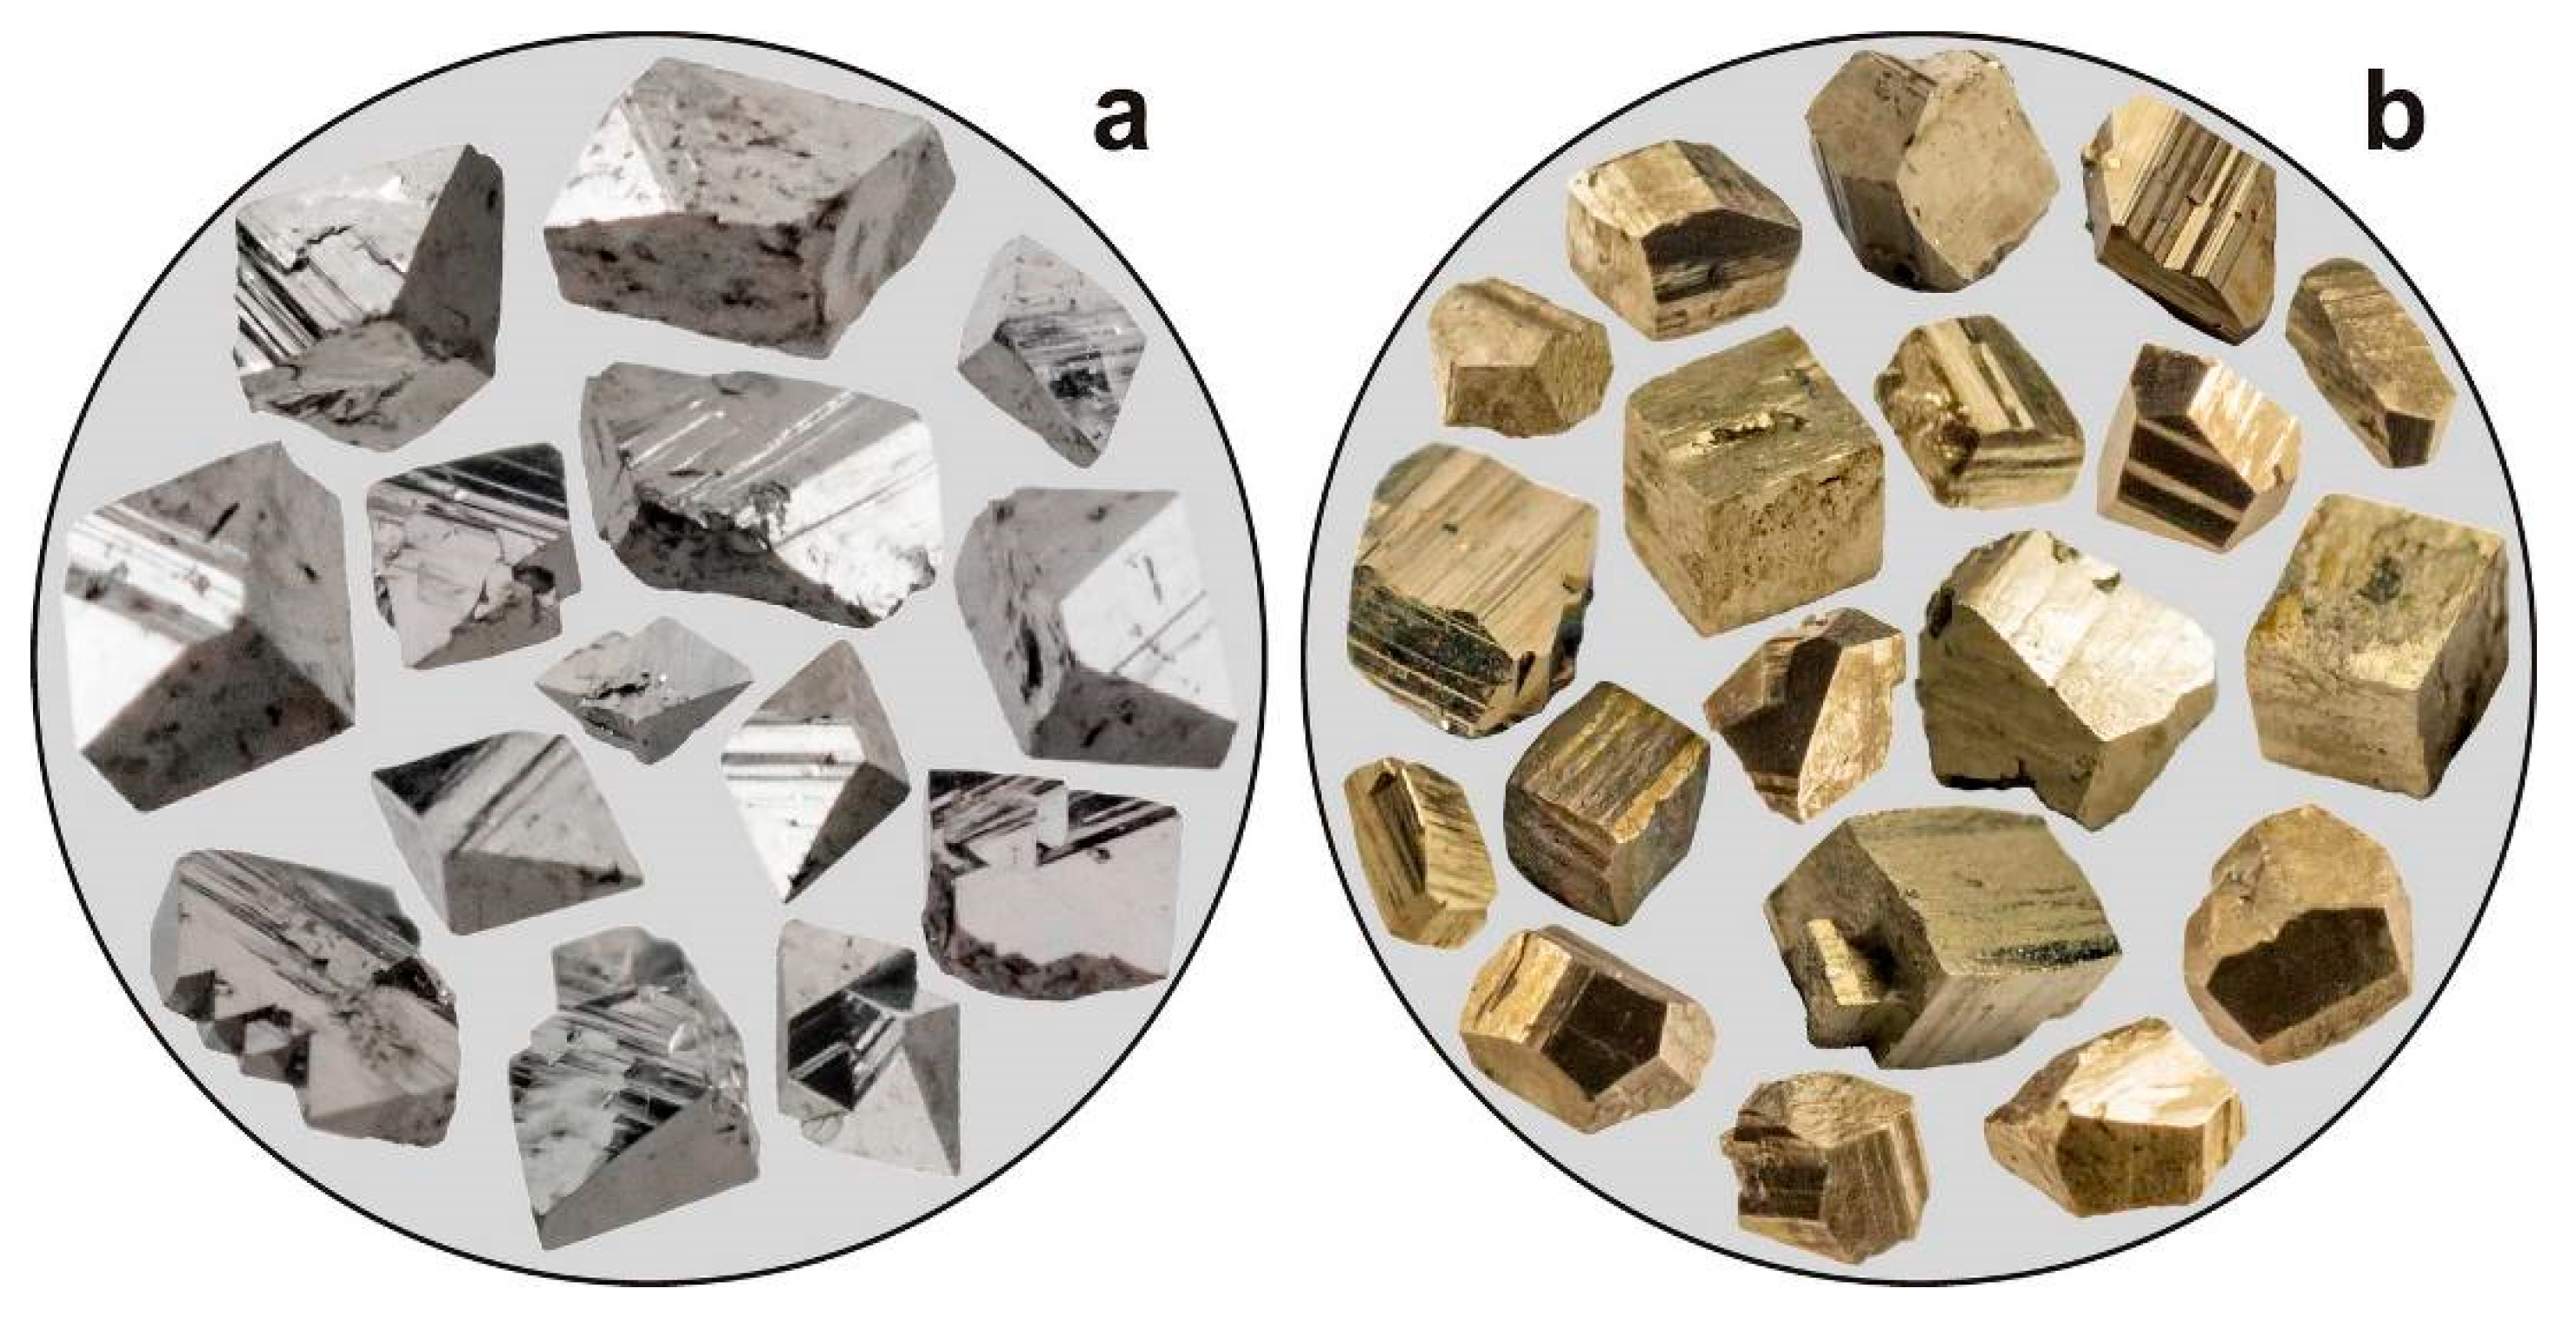
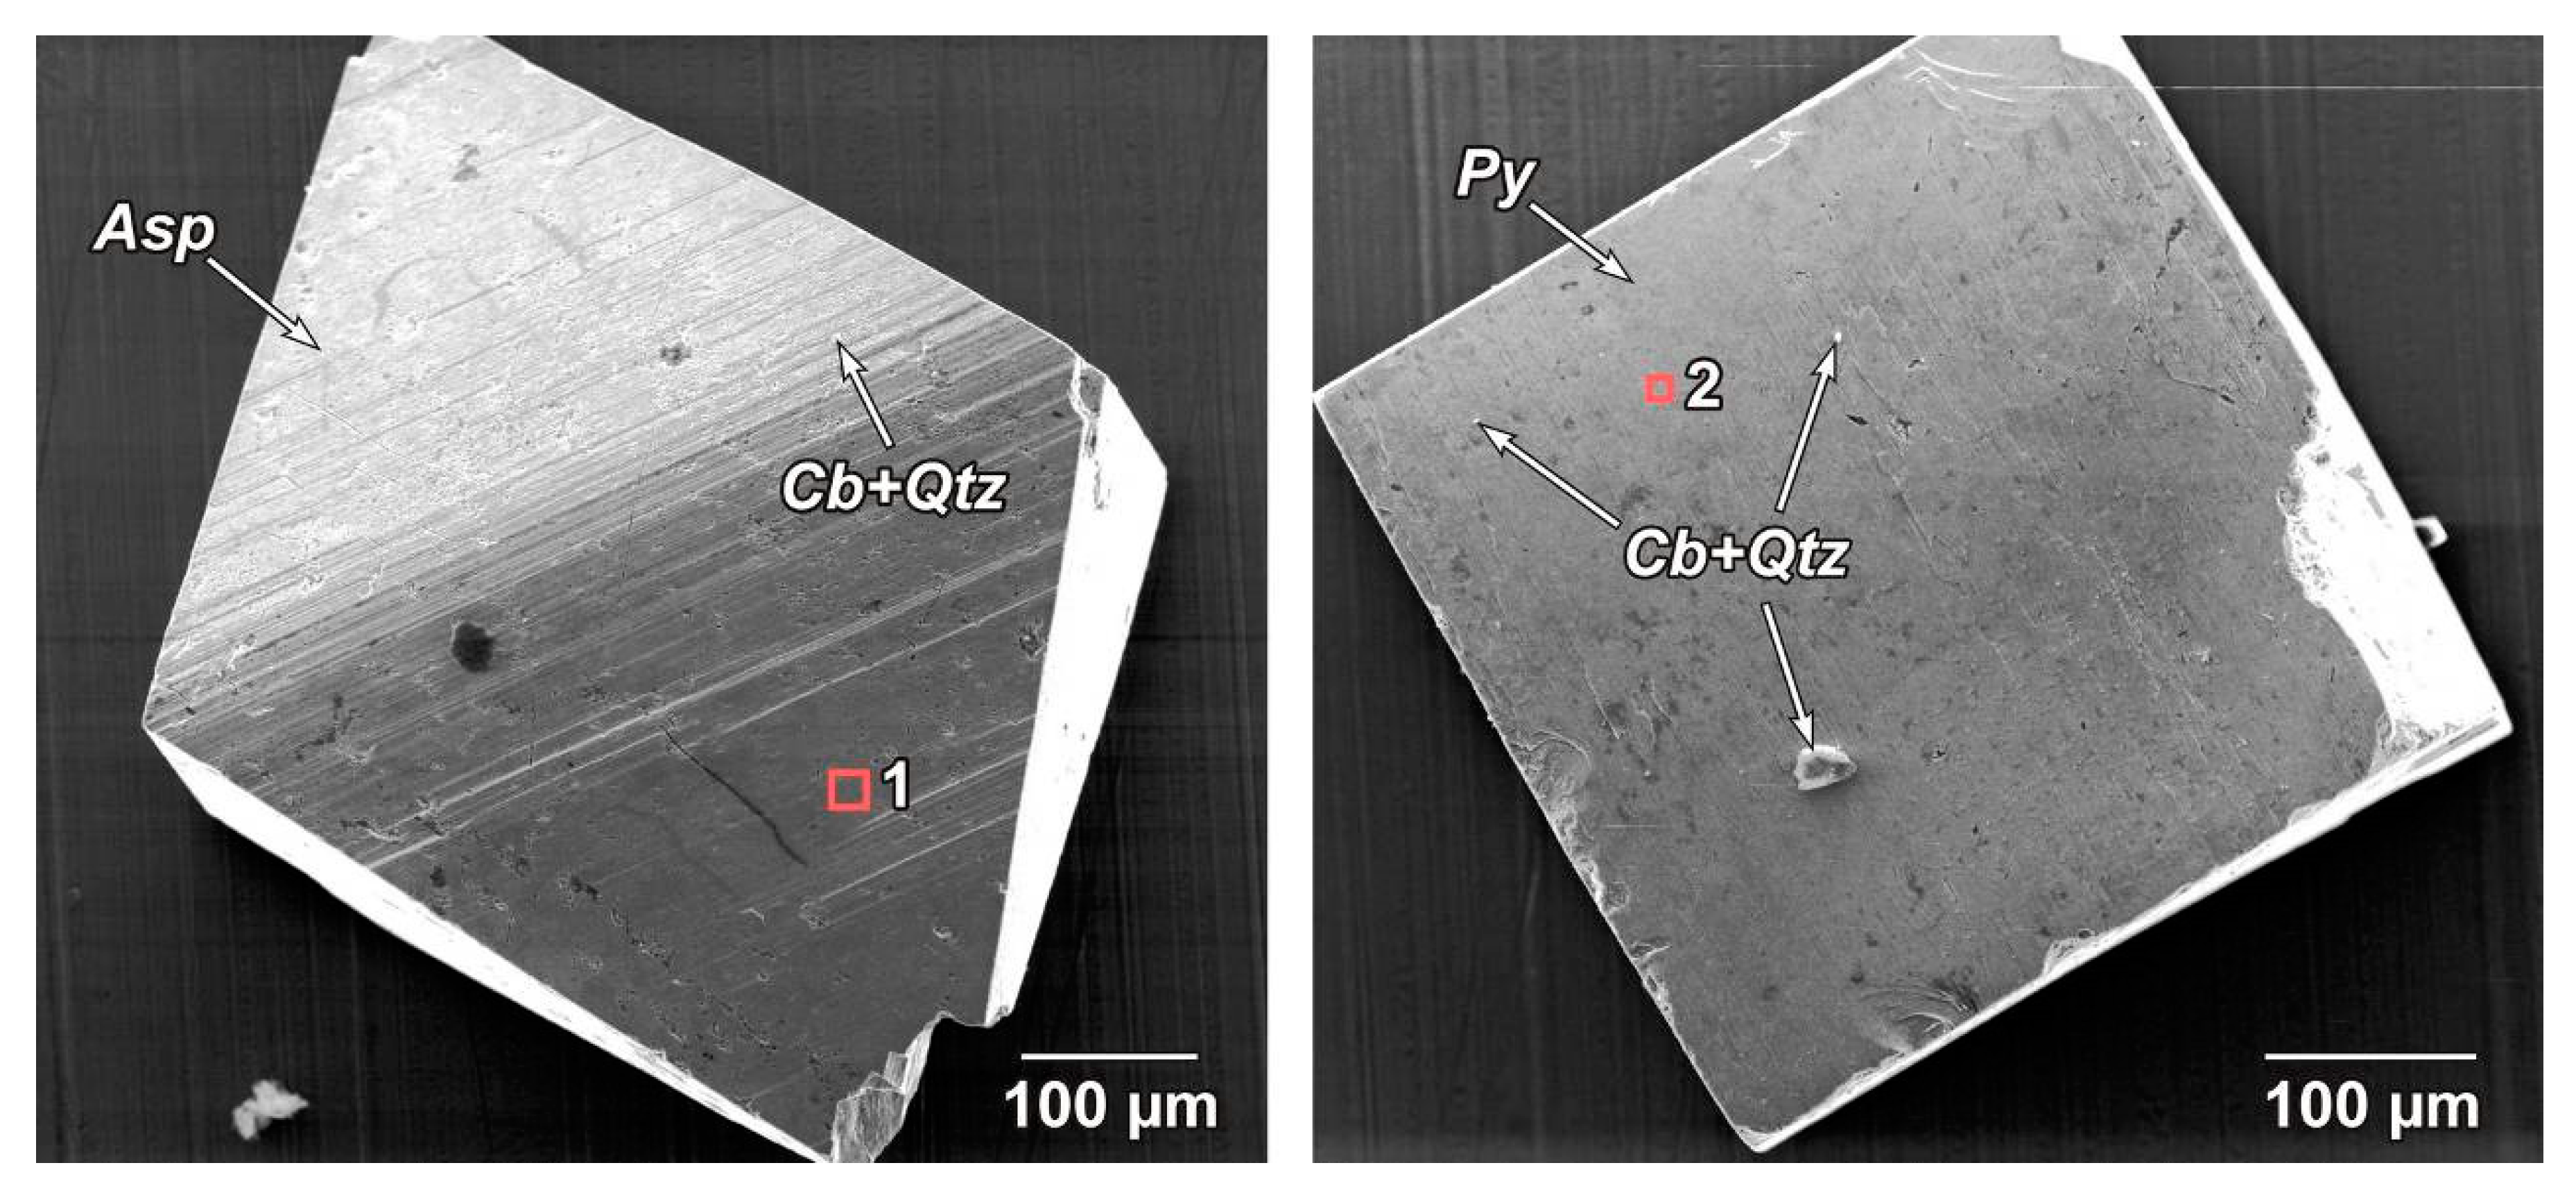
Nearly isometric pseudo-orthorhombic crystals of arsenopyrite and cubic crystals of pyrite without visible inclusions of ore minerals and with a minimum number of non-metallic microinclusions (mainly quartz and carbonate) were selected for the study (
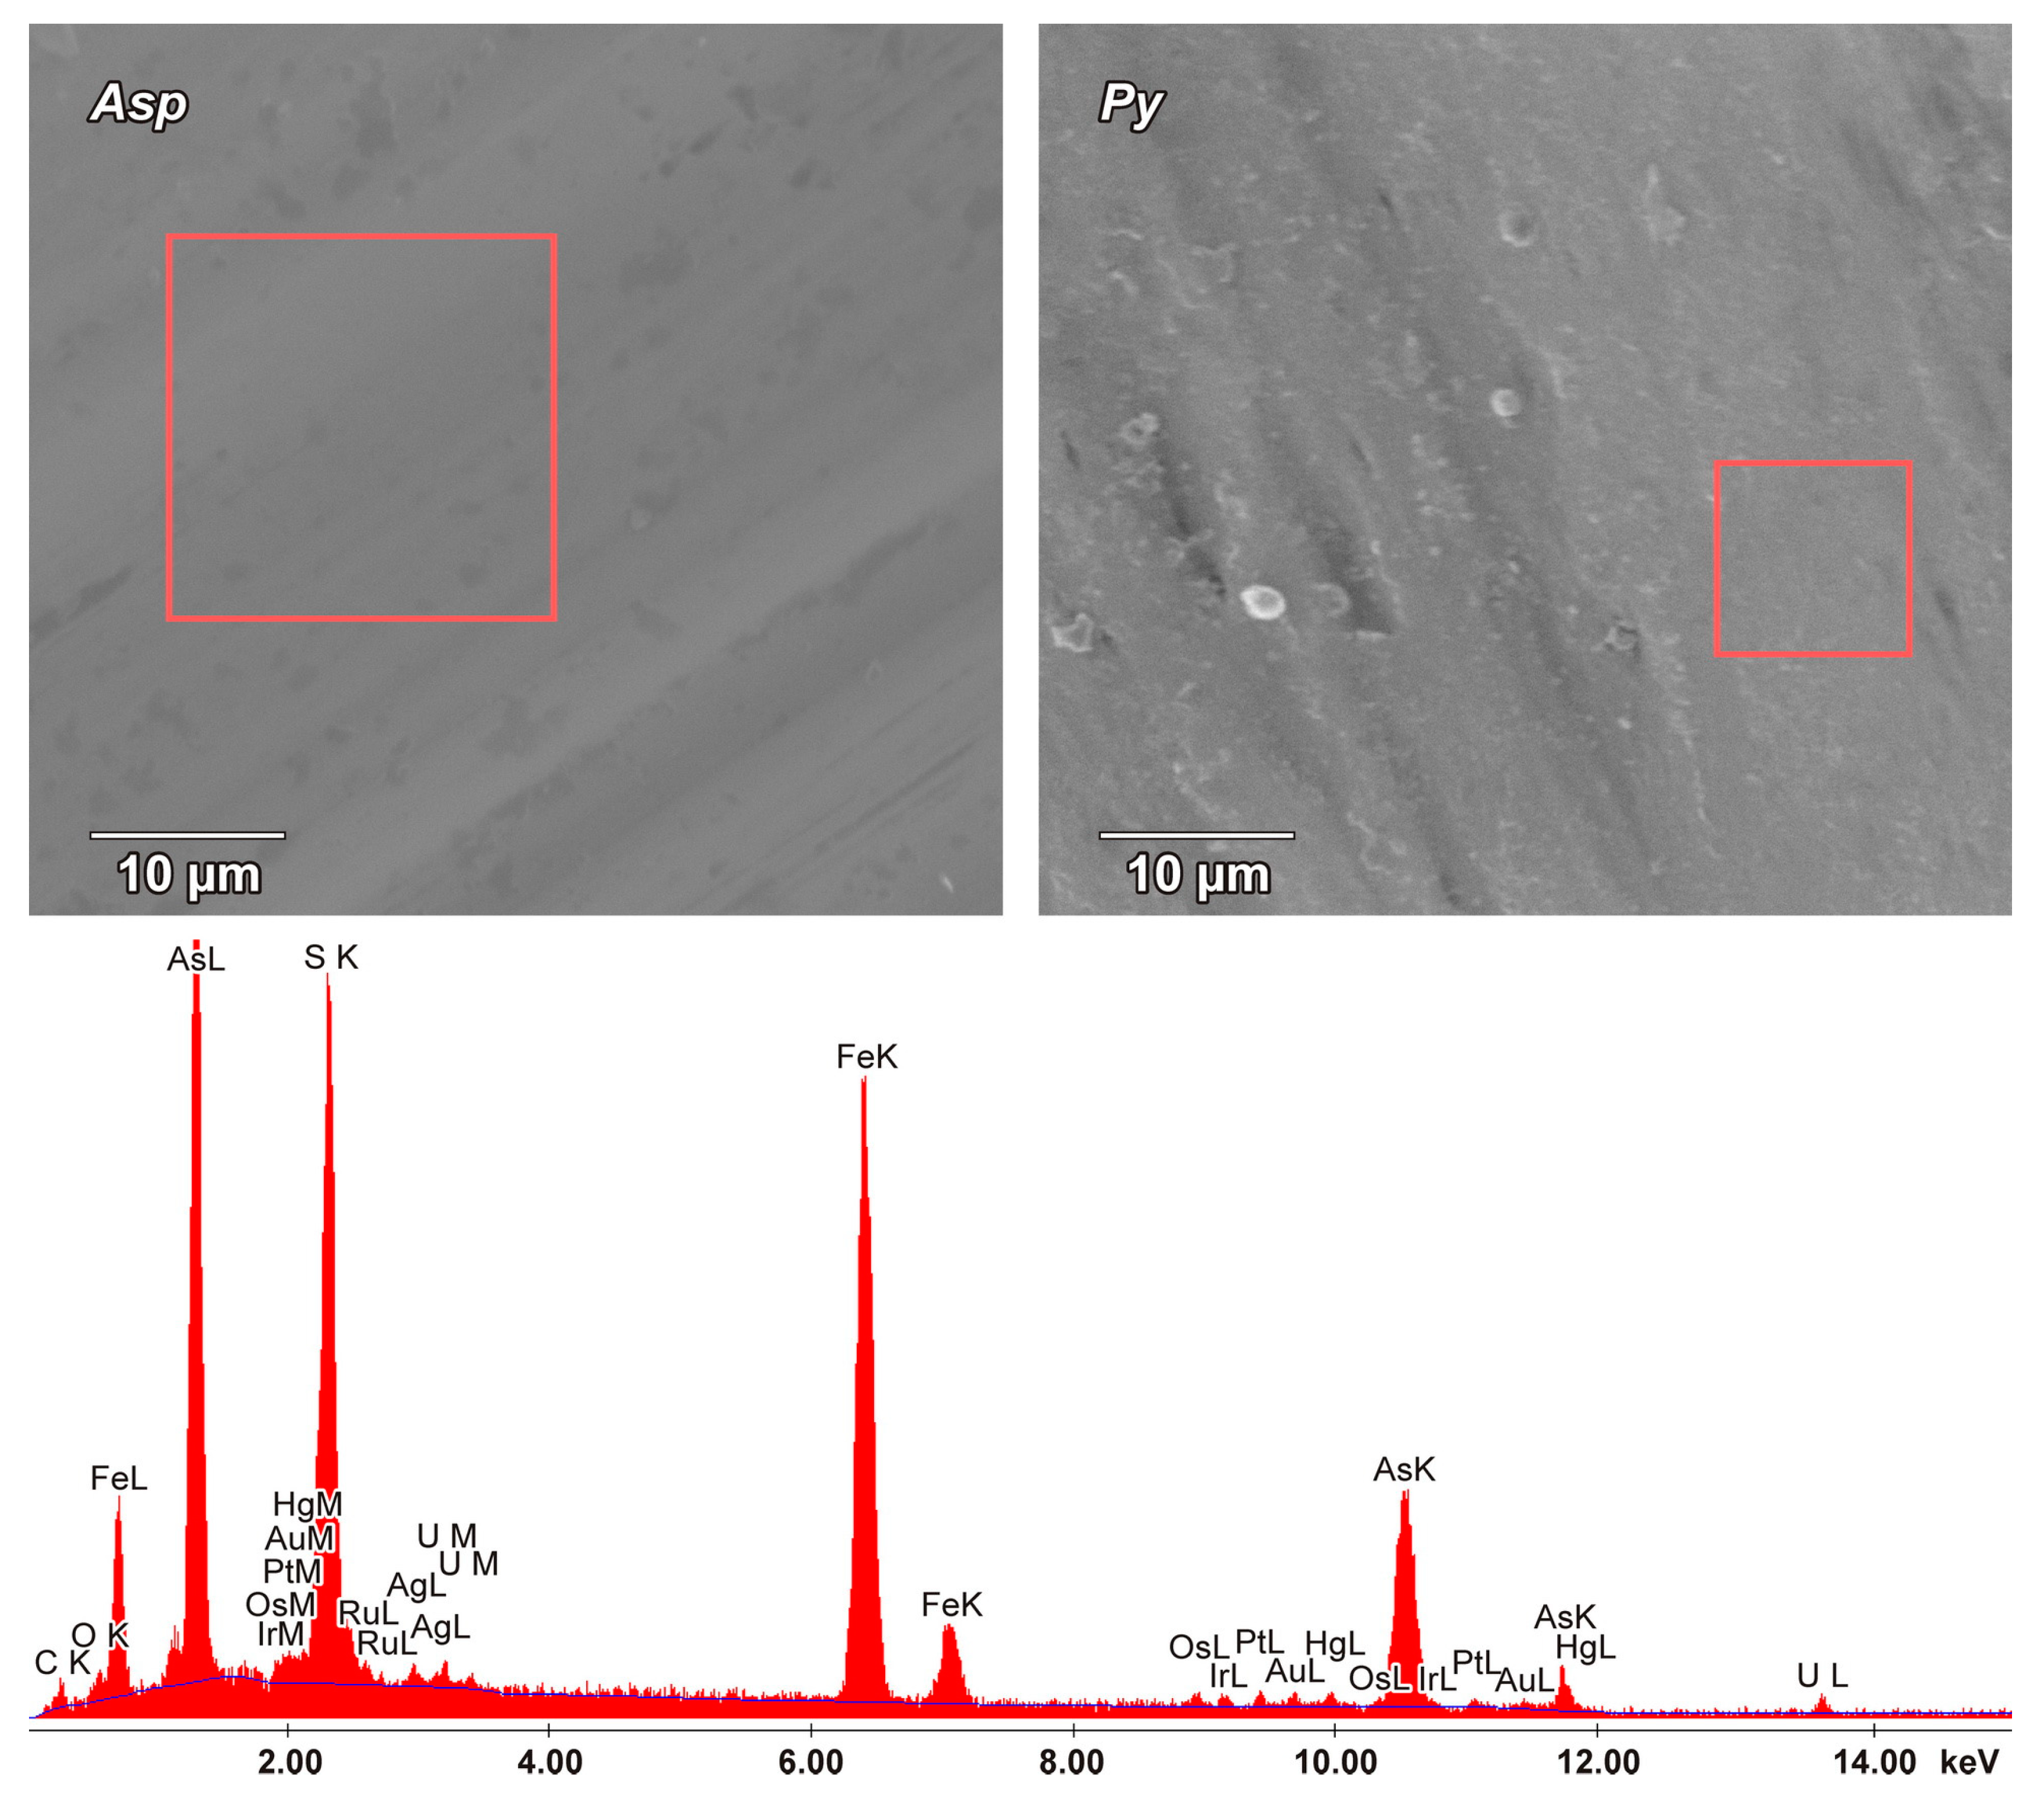
Figure 9). The so-called “clean” areas virtually lacking visible inclusions and significant defects were then selected to study the composition of the “invisible” impurity component on the surface of these crystals (Figure 10). The size (in μm) of such areas was 10 × 10, 20 × 20, and it was at least 30 × 30. Sections with low roughness were selected using the scanning probe microscopy technique (see above).
Faces with striation of the same crystallographic type were selected during scanning in order to eliminate the effect of capturing various impurities by faces of different crystallographic types during crystal growth: for arsenopyrite—prism {141}, for pyrite—cube {100}.
The surfaces of arsenopyrites and pyrites selected from the Natalkinskoe ore deposit (samples G-9/13, TPM-1/1, M-129/10, M-131/10, M-161/10 and Nat-10) clearly demonstrated the peculiarities of its elemental composition. On the “clean” surface of arsenopyrite, PGEs were thus represented by the following elements (in wt%): Pt (up to 2.1), Ru (1.4), Ir (up to 0.7) and Os (up to 0.7). Other ore elements were also determined (in wt%): U (up to 2.0), Hg (up to 1.1), Au (up to 1.0), rarely Ag (up to 0.7) and Cu (up to 0.6) (Table 8). The only PGE present on the “clean” surface of pyrite was Pt (up to 2.9 wt%), and other ore elements were represented by As (up to 2.2 wt%) and Cu (up to 0.7 wt%) (Table 9).
The SEM-EDX method confirmed the presence of Au and Pt on the surface of arsenopyrite crystals from the Natalkinskoe deposit, and high contents of them were detected earlier [11]. It is the first time such PGEs as Ru, Os, Ir and a number of ore elements—Ag, Hg, Cu and U—were detected on the surface of arsenopyrite. Pt and As are shown for the first time to be constantly present on the surface of pyrite crystals. Comparing the data from the AAS-ADSSC and SEM-EDX methods regarding the surface contents of Au, Pt and Ru, it is necessary to recall that the data on C ¯ s u r of AAS-ADSSC method are related to the entire average crystal, whereas the SEM-EDX method virtually defines local content of the element at the local area (“point”) on the surface. It would be more correct to compare these results with the content of the element within NAP, which can be calculated under certain assumptions [46]. According to such calculations, Au in NAP on pyrite amounts to 0.3–0.5 wt% [38], which is comparable by an order of magnitude to the data in Table 8 and Table 9 on Au and Pt. Increased platinum on pyrite (see Table 9) is qualitatively consistent with the fact that, according to AAS-ADSSC, C ¯ s u r Pt > C ¯ s u r Au (see Table 7).

4.4. Study of the Chemical Composition of the Surface of Arsenopyrite and Pyrite Crystals by LA-ICP-MS

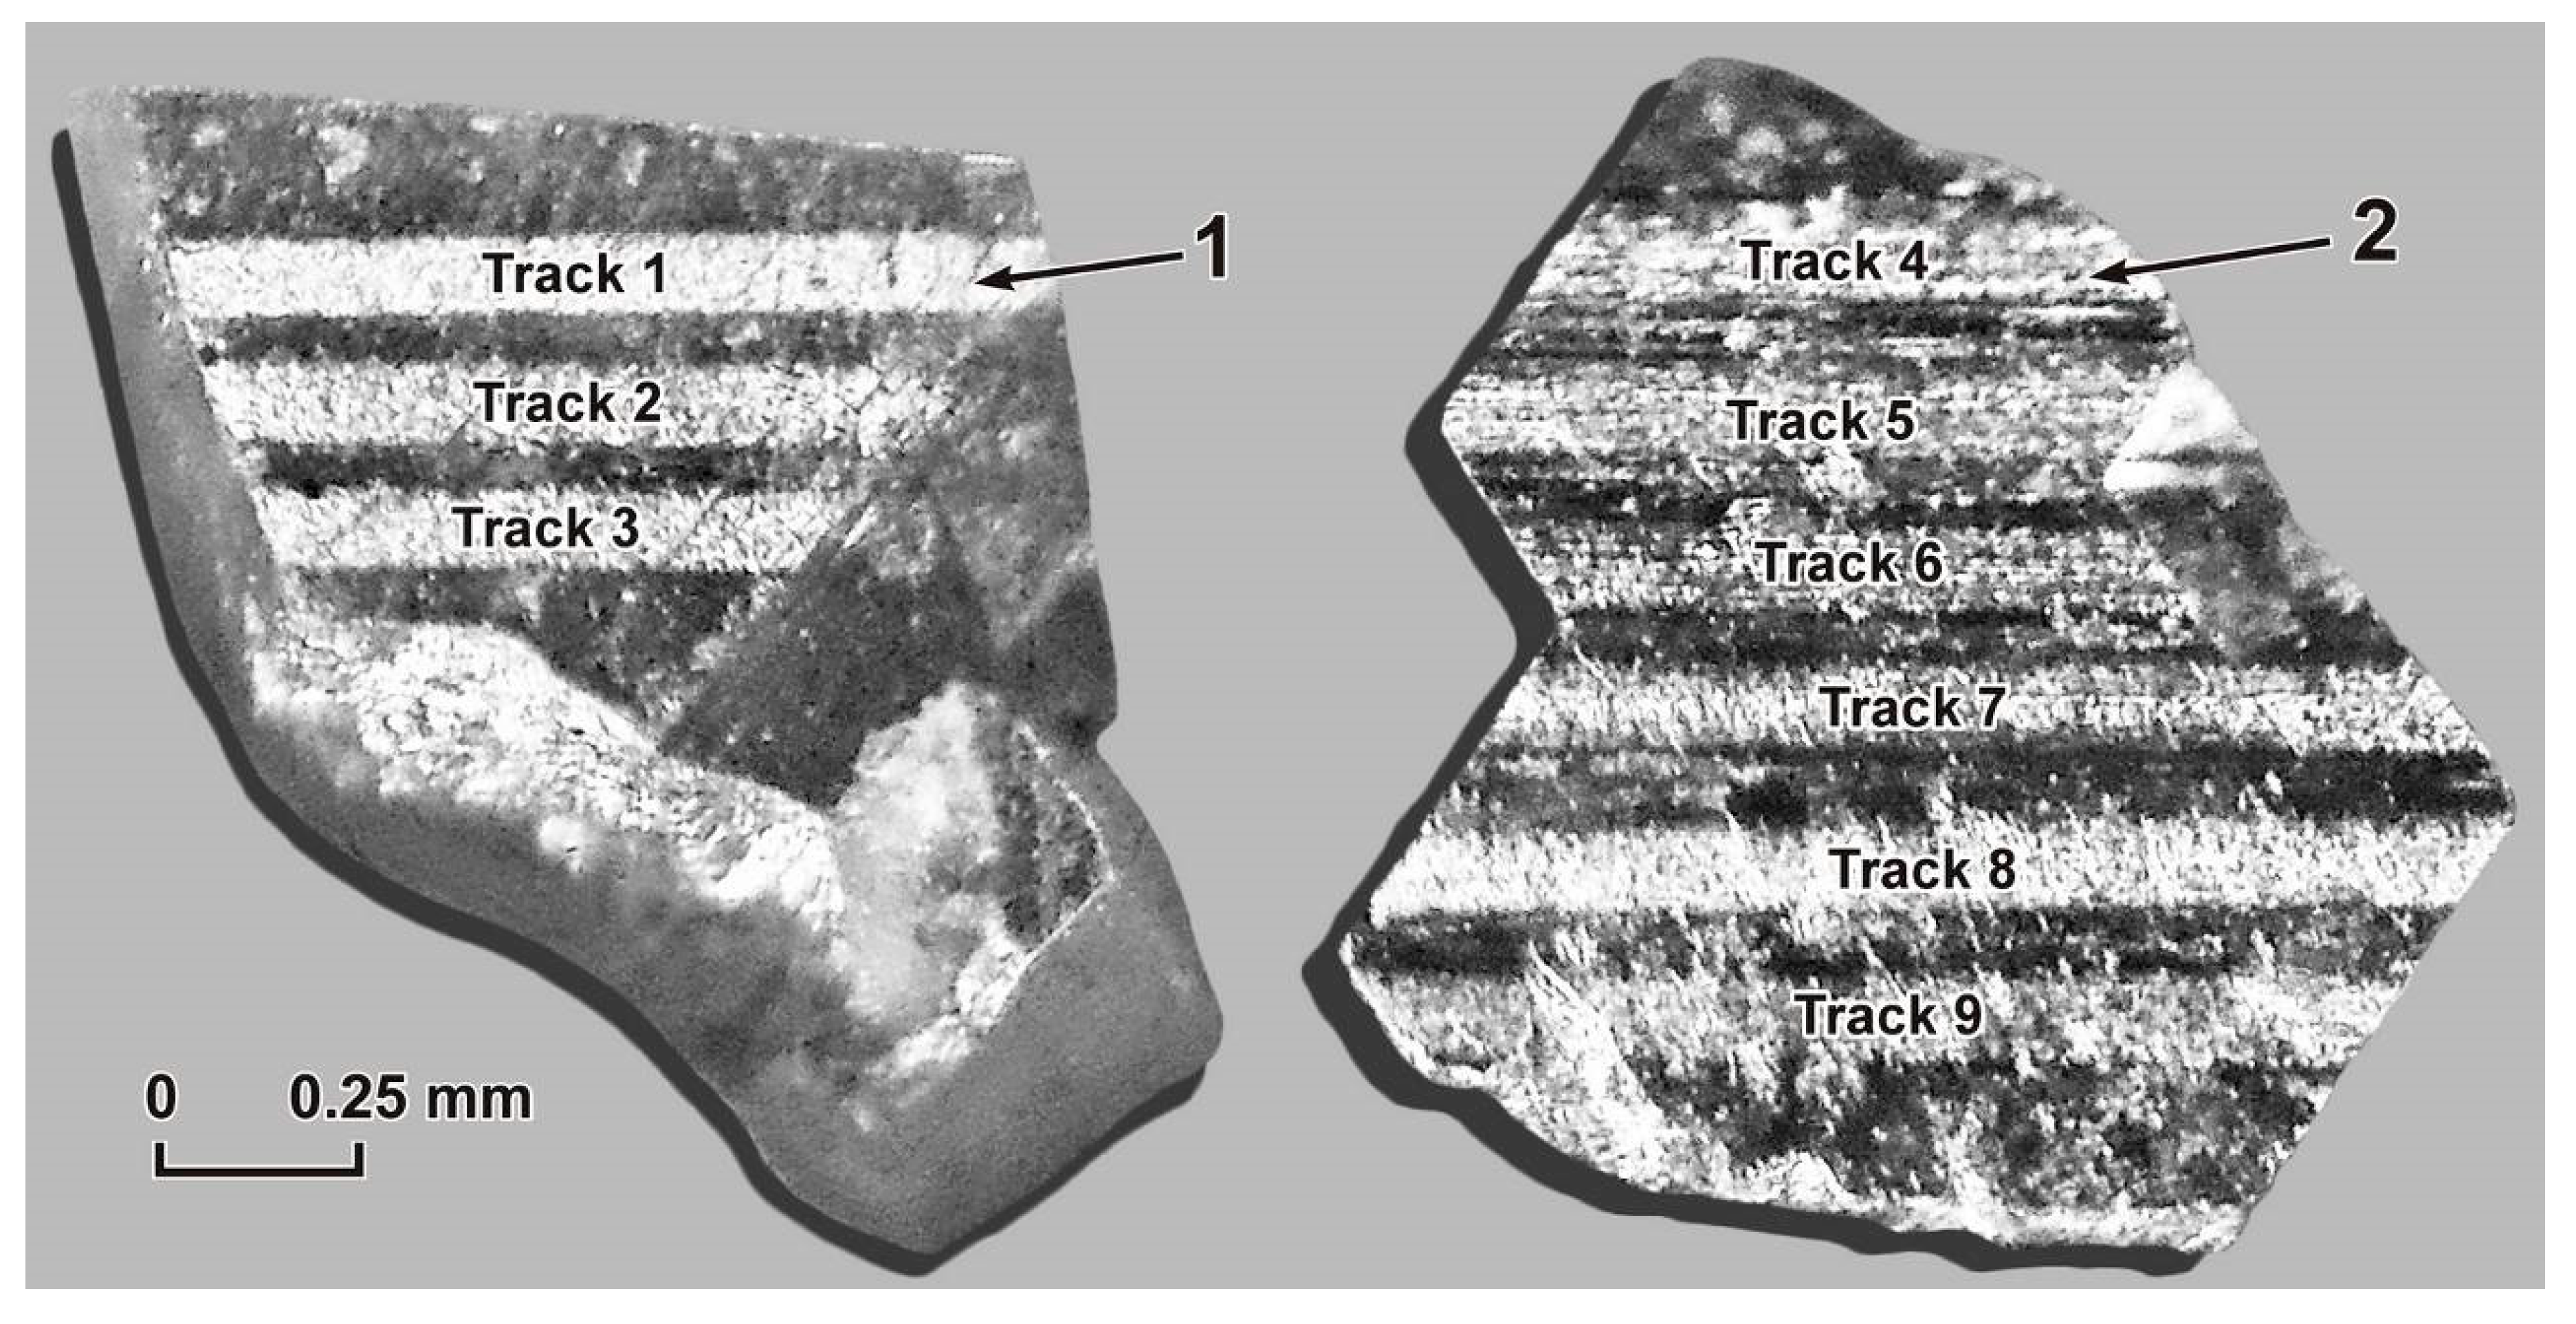
When studying the surface layers of arsenopyrite and pyrite crystals using the LA-ICP-MS method, attention was largely focused on Pt and Pd. Ten arsenopyrite crystals and six pyrite crystals were analyzed (Table 10 and Table 11). For all crystals of arsenopyrite (samples M-129/10, M-131/10, M-161/10 and TPM-1/1) and pyrite (samples M-161/10 and TPM-1/1) a track depth of 0.5–0.6 μm per laser pass was obtained. Unfortunately, we do not know the NAP thickness of the studied crystals. If we focus on the previously obtained data [44,48], the thickness of NAP on pyrite is ≤0.5 μm, and for arsenopyrite it is, according to preliminary data, much less [11]. The first pass of the laser thus best represents the composition of NAP, although significant “contamination” by the material underlying NAP is likely. The parameters of the laser were adjusted for one of the arsenopyrite crystals selected for detailed study (see 
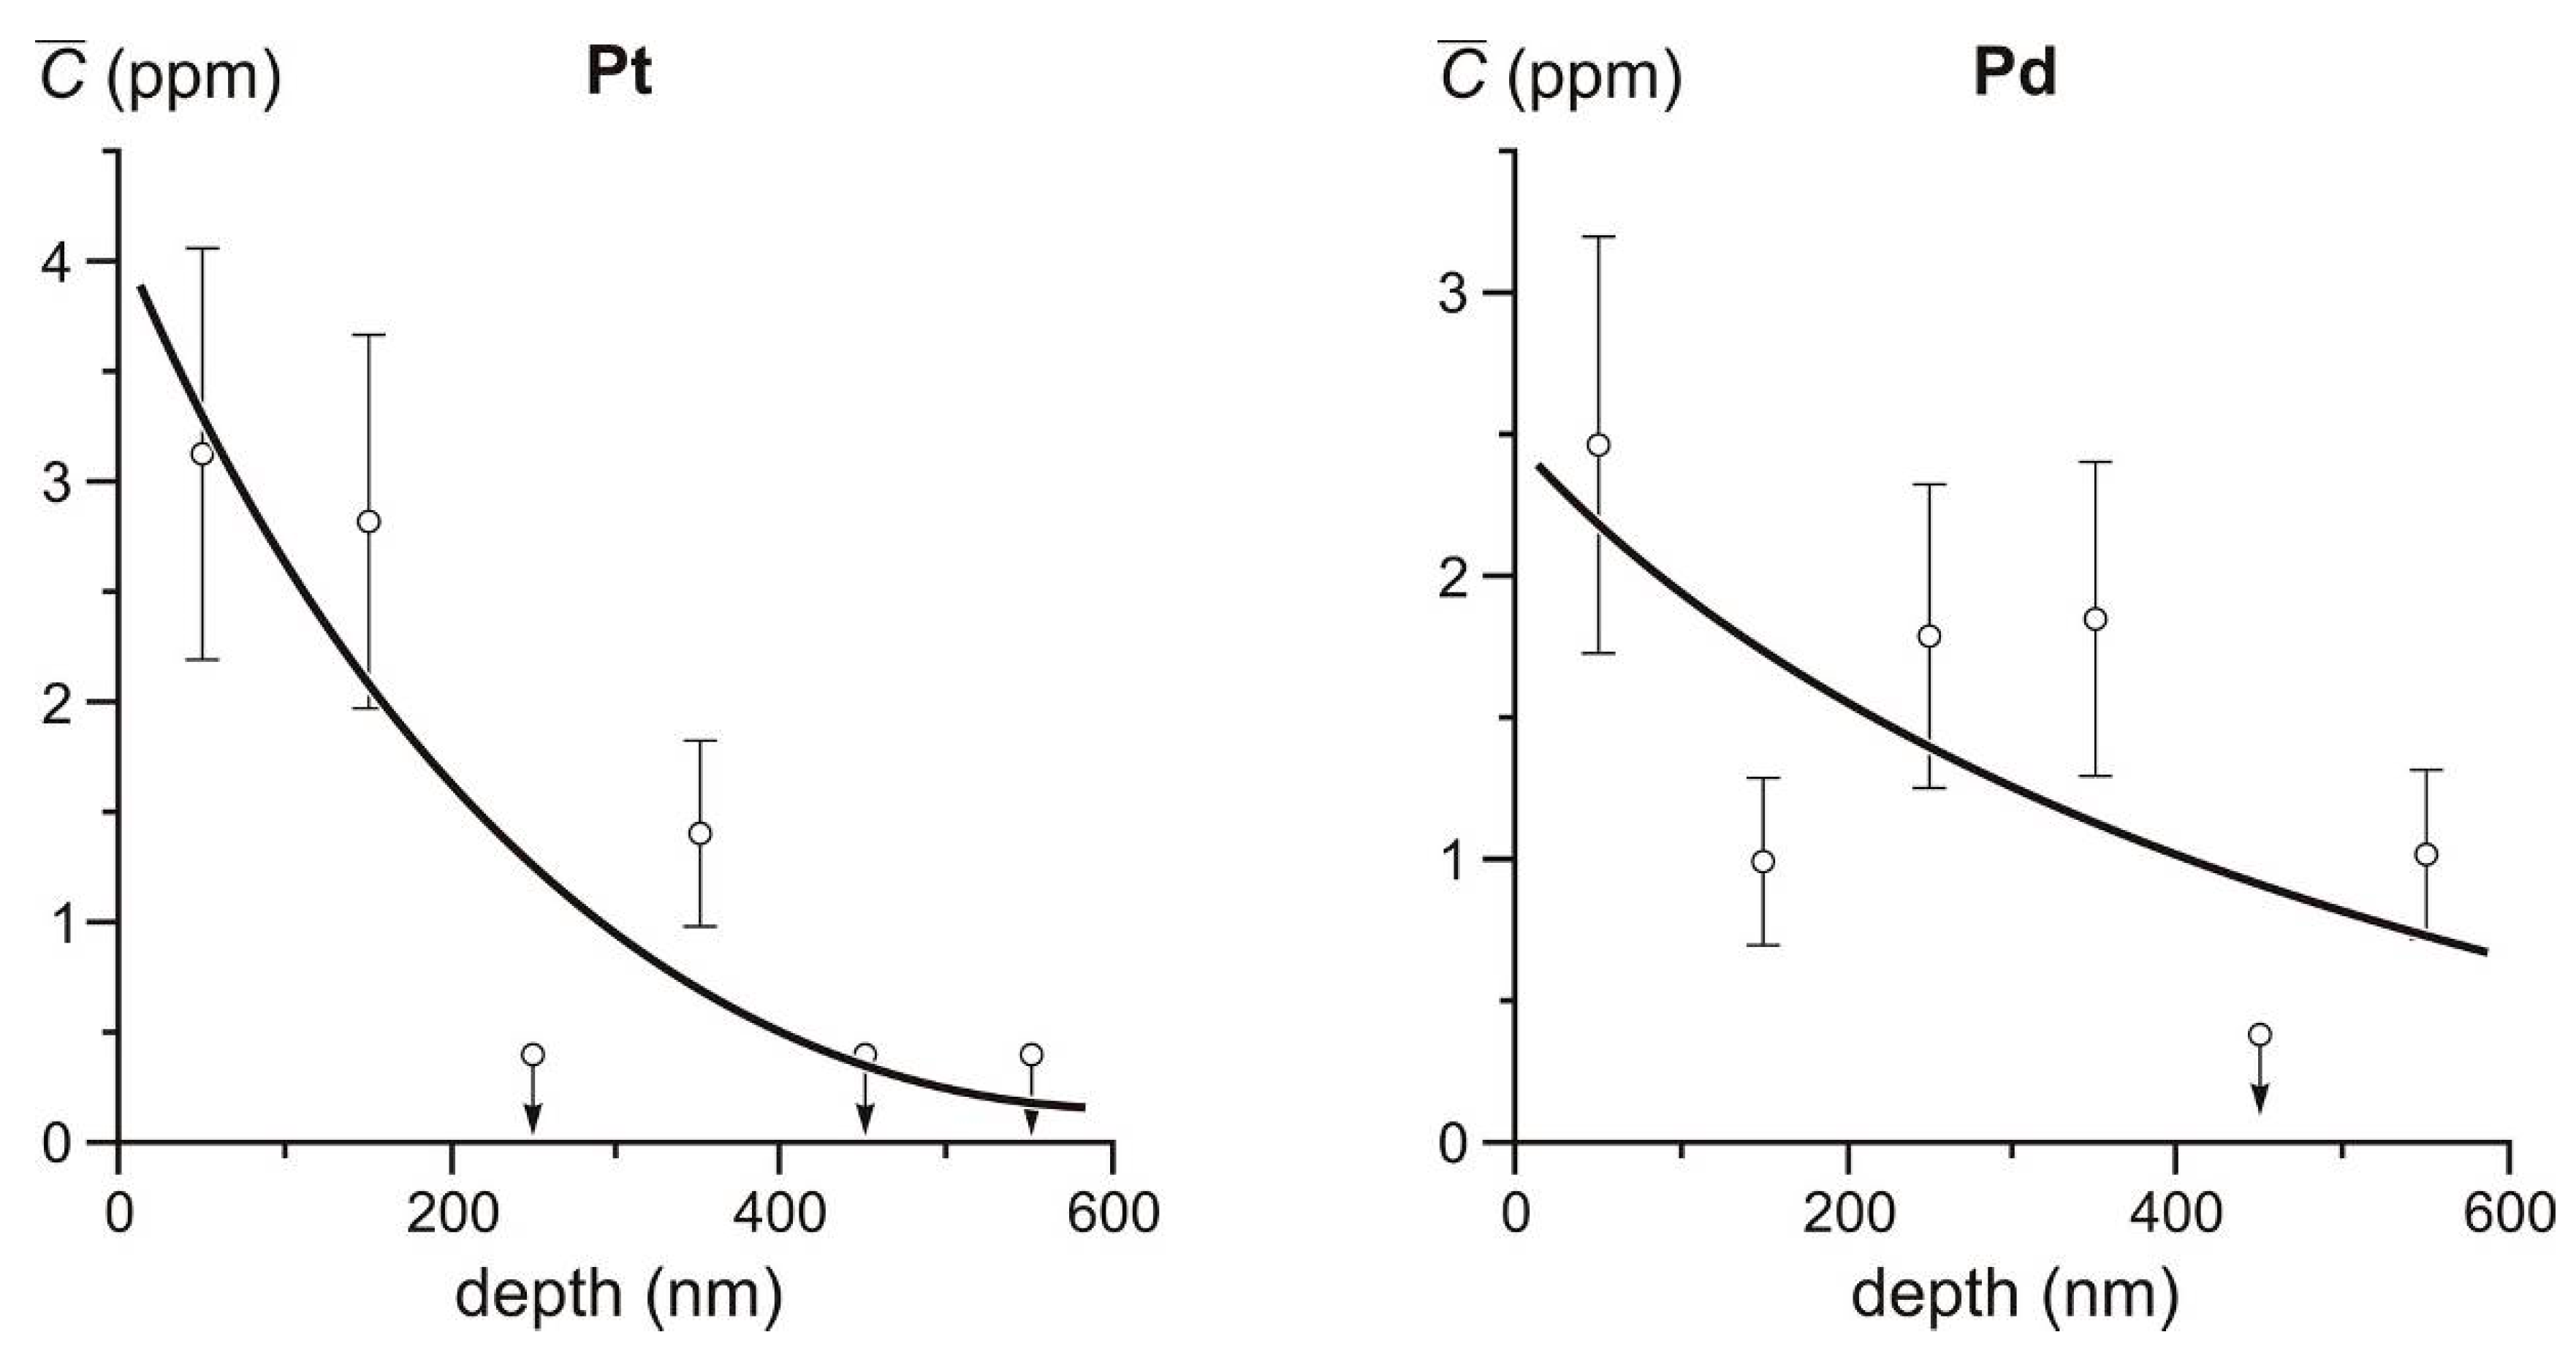
Table 10, sample M-129/10, crystal 2), in such a way that a layer of ~100 nm thick would be burned in one pass (see above). In this case, the maximum depth of the laser-dig groove was 600 nm. Figure 11 shows graphs of the detailed distribution of Pt and Pd contents in the surface layer of Crystal 2 from the M-129/10 sample.
A generalization of the results of previous studies [11] and the new data suggest that the increased content of Pt and Pd is confined to the surface layer of not only arsenopyrite crystals, but also pyrite. It can also be assumed that the tendency for a Pt and Pd concentration in the surficial layer at <500 nm thick is common for both minerals (see Figure 11 and Table 11). Several exceptions can be noted in Table 10, however, which may be due to inhomogeneity in the impurity distribution because of the evolution of NAP during crystal growth [39].
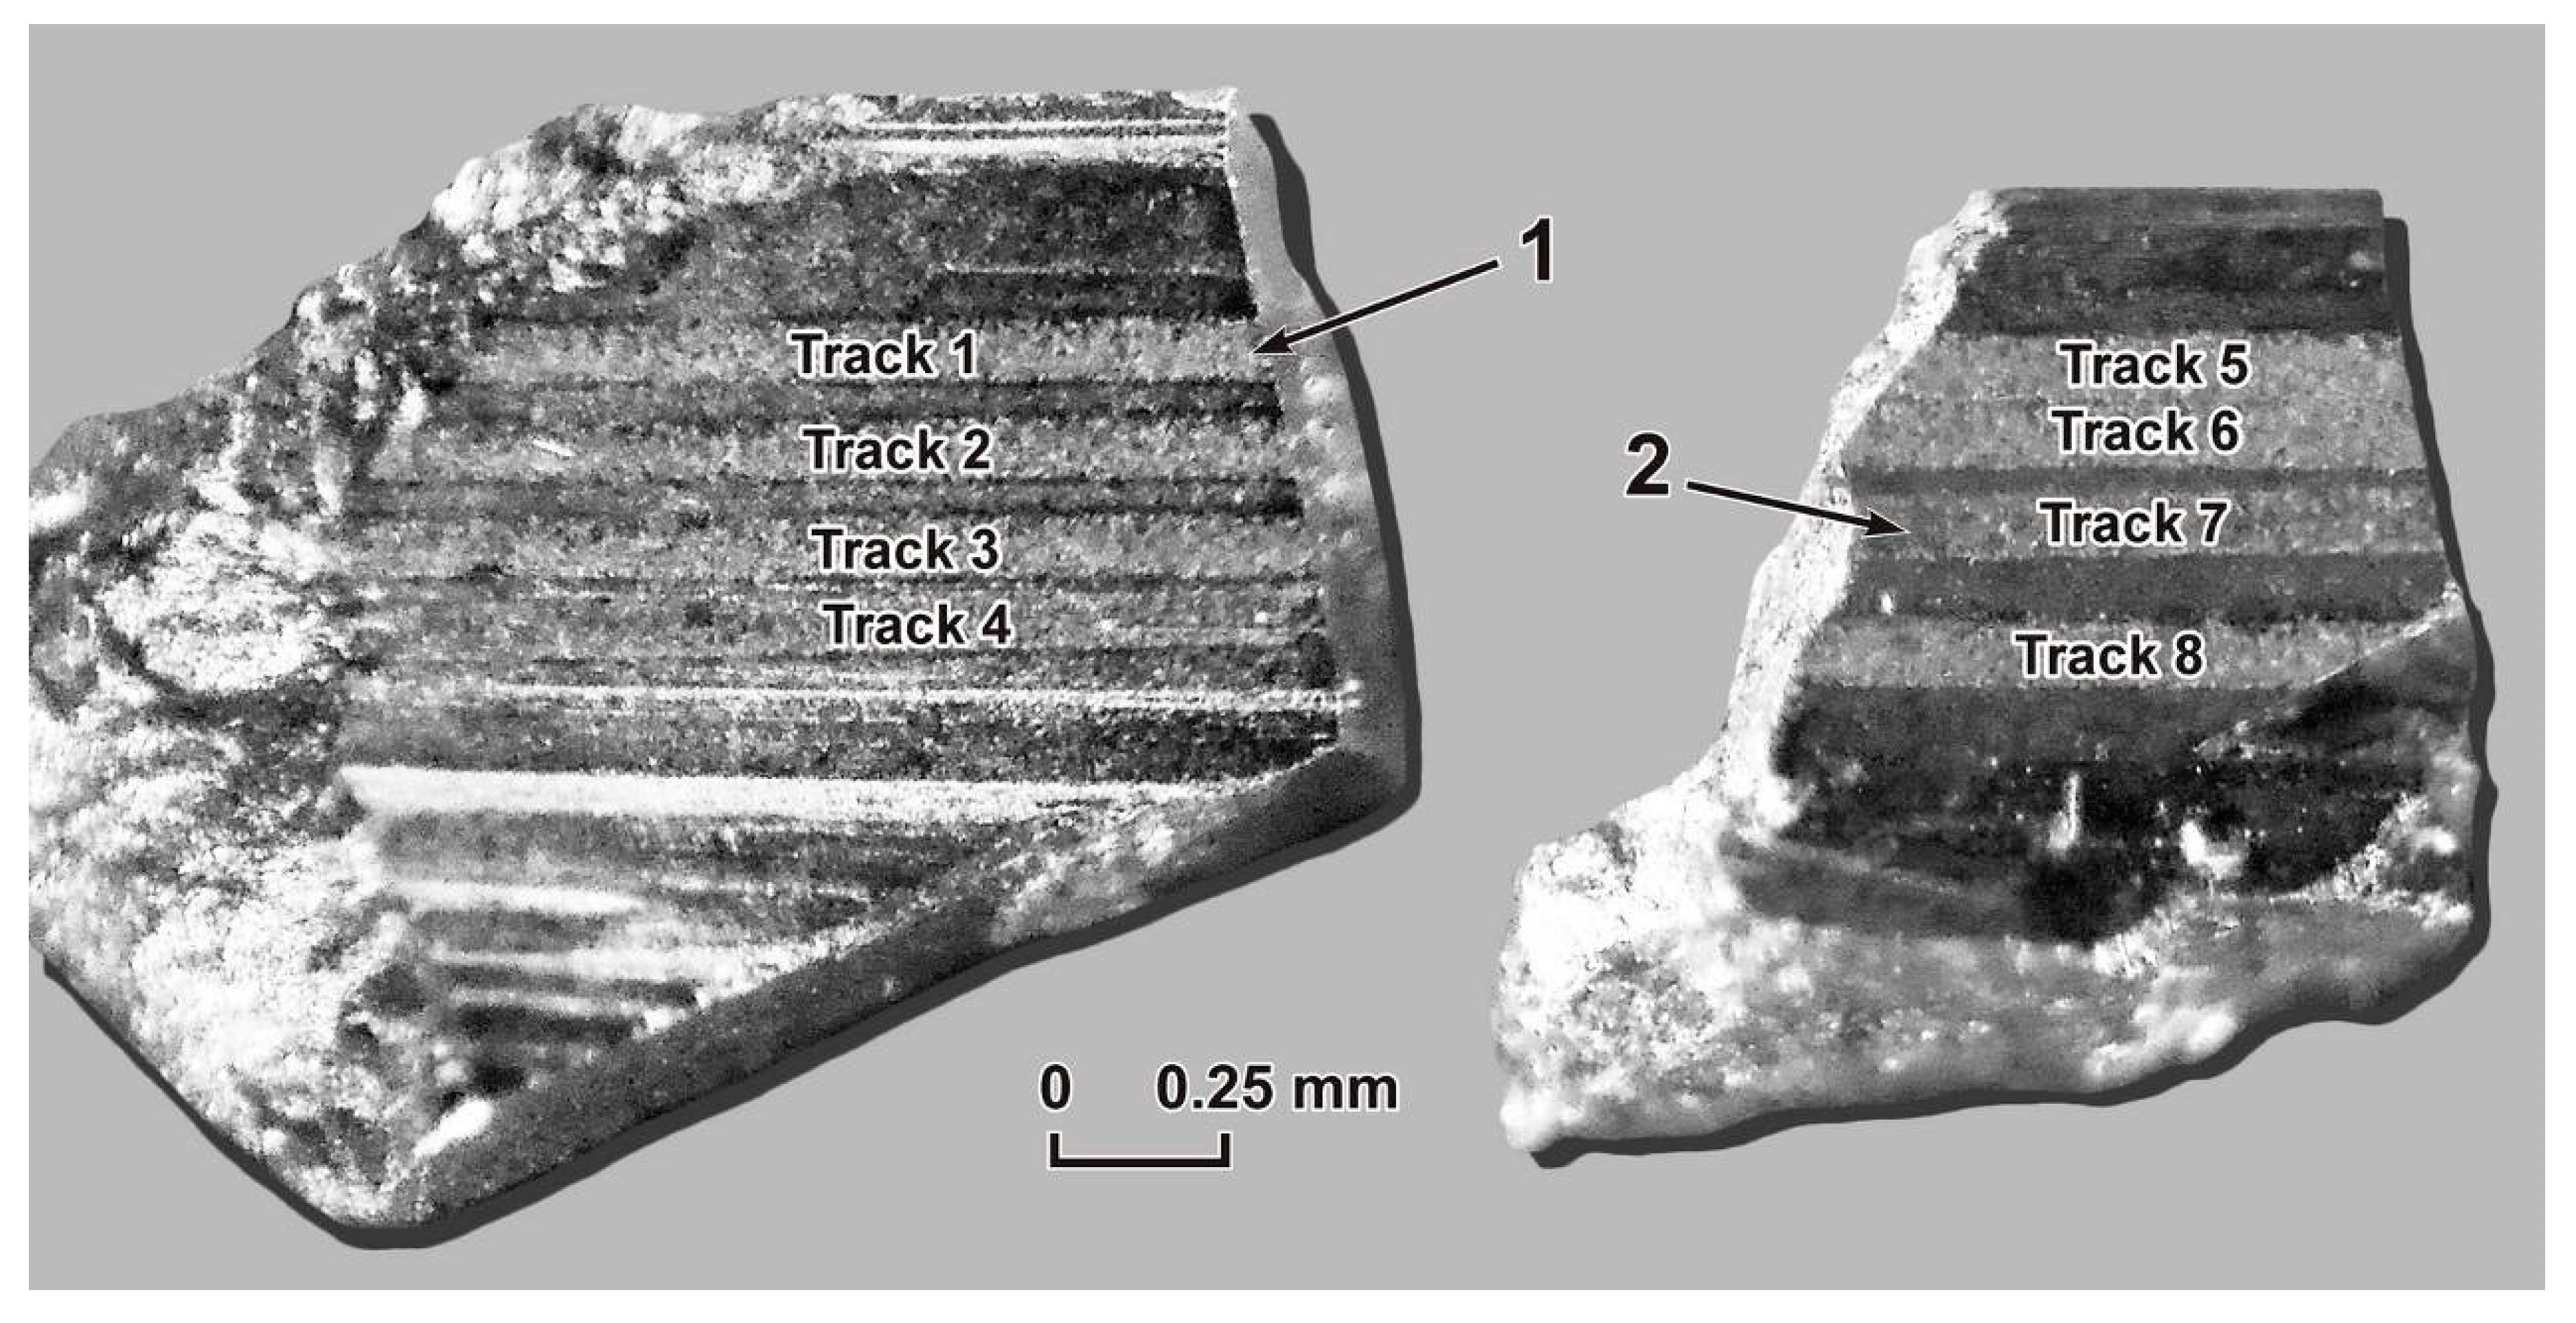
Determination of the contents of a wider range of elements belonging to the group of PGEs—Pt, Pd, Rh and Ir—was carried out in the example of studying the surfaces of arsenopyrite and pyrite crystals taken from the UV-3/13 sample (Figure 12 and Figure 13). The surface layer of these crystals was studied to a depth of 6 µm (depth per pass is 1 µm). Ru and Os contents were not determined due to their absence in the standards we used. According to LA-ICP-MS analysis, the surface layers of arsenopyrite and pyrite, along with Pt and Pd, concentrated PGEs such as Rh and Ir. The contents of elements (ppm) in the surface layers of arsenopyrite were Pt up to 5.2, Pd up to 8.4, Rh up to 8.9 and Ir up to 0.2, and in the surface layers of pyrite were Pt up to 13, Pd up to 896, Rh up to 6.7 and Ir up to 4.1. The maximum contents of Pt, Pd and Ir were established in pyrite, and Rh was established in arsenopyrite. Like Pt and Pd, all the highest contents of Rh and Ir were confined to the first removed layer (1 µm thick). There was a distinct tendency for the content of all these elements to decrease with depth (Table 12 and Table 13).
High Pd content and Pd/Pt ratios on the pyrite surface (see Table 13) contradict the AAS-ADSSC and SEM-EDX data presented above, according to which the Pt content was more than an order of magnitude higher than Pd. The reason for this contradiction requires special research and may be related to the existence of an unidentified surface form of Pd (for example, Pd nanoparticles), which is inhomogeneously distributed over crystals. The SEM-EDX method was also local (locality is even higher than for LA-ICP-MS), and therefore cannot serve to confirm this hypothesis. In the AAS-ADSSC method, crystals with such an excess of Pd over the average content simply will not be included in the final sample.
The maximum PGE contents at the Natalkinskoe deposit are currently known to be associated with sulphide minerals. High levels of PGE in the sulphide gravity concentrate of this deposit ore were established by sample decomposition using fluoro oxidants [49] and amounted to (in ppm) Pt, 12.9–92.8; Pd, 0.62–2.97; Ru, 0.11–3.27; Rh, 0.95–1.54 and Ir, 0.1–0.3. The speculation about the possible role of sulphide minerals as Pt concentrators at the Natalkinskoe gold deposit was previously made by L.P. Plyusnina and co-authors [14]; however, microprobe analysis did not reveal high content of noble metals in conventional preparations of arsenopyrite and pyrite [3]. Arsenopyrite concentrates of not only Au, but also Pt and Pd, were later demonstrated at the Natalkinskoe deposit [11]. The new data confirmed and supplemented the earlier conclusion. The highest contents of PGE (in ppm) observed in arsenopyrite were Pt up to 128, Pd up to 20, Ru up to 86 and Rh up to 21, and they were less high in pyrite: Pt up to 29, Pd up to 15, Ru up to 58 and Rh up to 5.9. AAS-ADSSC found that the high content of PGE largely was due to the existence of non-autonomous phases, causing their surface concentration. The fact that the nature of high contents of PGE in arsenopyrite and pyrite is mainly superficial was confirmed by the data obtained by SEM-EDX and (to some extent) LA-ICP-MS. If the data from the first two methods are comparable (taking into account the above considerations), the latter gives different results, which can be explained by the following reasons. First, there is some dispersion of the material on the surface after the first and each subsequent laser pass, which increases the error of determination. Second, the analysis of surface areas of several crystals does not have the necessary statistical reliability for determining the average contents, as is the case in the analytical technology of AAS-ADSSC. It is quite possible to meet with an “empty” crystal or, conversely, a crystal with the surface strongly enriched with impurity. This is all the more likely because the heterogeneity of the distribution of PGE is well known. For example, in pyrite from the intercumulus sulphide phases of the main sulphide zone of Great Dyke (Zimbabwe), the ion-microprobe analysis revealed a strong heterogeneity in the Pt distribution—from 0.4 to 244 ppm in different grains of the same sample [50]. Thirdly, significant errors can occur due to the lack of external calibration on such surface structures, for example, deposited on the crystal films of sulphide material with a certain content of admixture of the studied element. In the current state of the study of the surface composition of sulphides by LA-ICP-MS, although the history of such studies seems to date back 12 years [51], it is possible to speak only about the general tendency consisting of the enrichment of PGE of a surface of pyrite and arsenopyrite crystals; however, this trend is fully confirmed by other methods.
The reason for this phenomenon involves the features of the crystal growth mechanism and the dualism of the element distribution coefficient in the mineral-hydrothermal solution system, which is an order of magnitude higher for NAP compared to the crystal volume [38,39]. Non-autonomous phases are extremely important, but they are still rarely considered components of synthetic materials and minerals, the geochemical role of which lies in their ability to accumulate impurity elements in ultra-high contents [52]. Such phases occur on the surface of a growing crystal due to the chemical modification and structural reconstruction of its surface layer, which is in local equilibrium with a supersaturated solution. NAP contain defects, chemical bonds and valence states of elements unusual for crystal volume, for example AsV, AsIII, AsII and FeIII on pyrite [41], which provides additional opportunities for the incorporation of minor and trace elements, especially incompatible, into their structures. Since the stability field of arsenopyrite is adjacent to the pyrite field, according to the principle of continuity of phase formation on mineral surfaces and the correspondence of chemical forms of elements on them [53], the surface NAP on arsenopyrite can have a defective pyrite structure. Since platarsite Pt(As,S)2 has the structure of pyrite Pa3, we should therefore expect an increase in the solubility of Pt in the surficial phase compared to the volume of the crystal.
Gold and PGE nanoparticles are increasingly, especially recently, found in ores of different genesis deposits [7,8,54,55,56]. Although no PGE mineral forms were identified at the Natalkinskoe deposit, the need to continue research in this direction is obvious. This may be demonstrated by the Degdekan deposit, another gold project in the northeast of Russia, which is in the territory of Pre Kolyma. Its ores, classed as black shale formation, yielded the first findings of a number of platinum group minerals of submicron dimensions: native osmium, routheniridosmine, osmirid, ruthenosmirid, laurite, iridarsenite, ruthenium arsenide and arsenide of osmium and iridium [8]. The studies by [5,6] established the existence of different mineral forms of platinum metals, including native platinum, phases of Pt–Cu–Fe system, sperrylite, cooperite, and minerals of the Pd–Bi system in gold ores of the Sukhoi Log deposit (Lena ore district, Irkutsk region, Russia). Their size mainly ranges within 1–10 μm. Later, native Pt nanoparticles, with a dominant size of 0.5–20 nm, were found in the concentrates of insoluble carbonaceous matter of shales containing ore mineralization [7]. It follows that there is a high probability of nanoscale mineral forms of PGE existing at the Natalkinskoe deposit, according to the model of surface NAP evolution in sulphide minerals, suggesting their partial transformation and aggregation with the formation of nano- and microinclusions of separate (autonomous) phases of trace elements [39]. The possibility of finding nano-sized particles of PGE in sulphides is confirmed by experimental data. For example, nanometer-size PtS2 inclusions in synthetic Pt-containing pyrite were detected with high-resolution transmission electron microscopy [57].

5. Conclusions

Arsenopyrites and pyrites of the Natalkinskoe gold deposit selected from vein, streaky-vein and veinlet-disseminated ores belonging to the most productive gold-rich hydrothermal mineral formations concentrated not only Au, but also platinum group elements. The highest contents (in ppm) were detected in monofractions of arsenopyrite: Pt up to 128, Pd up to 20, Ru up to 86 and Rh up to 21, and less high in monofractions of pyrite: Pt up to 29, Pd up to 15, Ru up to 58 and Rh up to 5.9.
The original AAS-ADSSC analytical technology in arsenopyrites and pyrites from the deposit established that there were two forms of uniformly distributed Pt, Pd, Ru and Rh—structural and surface-bound chemically bound in the structure of these minerals and in non-autonomous phases located on the surface of arsenopyrite and pyrite crystals. The surficially bound form dominates and probably exists in a very thin surface layer of the crystal (~100–500 nm). This phenomenon arises due to the features of the crystal growth mechanism and the dualism of the element distribution coefficient in the mineral-hydrothermal solution system, which is an order of magnitude higher for NAP compared to the crystal volume. It is assumed that for gold-bearing arsenopyrites and pyrites there is a common mechanism of impurity absorption associated with the active role of the crystal surface and surface defects. Structural forms of Pt, Pd, Ru and Rh, despite a lower content of the associated element compared to the surface, are also extremely important. They are a reliable indicator of element activity in ore-forming fluids forming gold deposits and a criterion of their potential ore content.
Restoration of the ore-forming fluid composition using the content of the structural admixture of Au and Pt in pyrite and experimentally established coefficients of their distribution in the pyrite–hydrothermal solution system showed that ore-forming fluid that deposited pyrite locally contained comparable concentrations of gold and platinum. Unlike gold, which mostly occurred in visible native form, the majority of PGEs are in so-called hidden or invisible forms. Previously, they were not recognized due to the inability to establish the nature of the carrier without the use of methods to determine the surficial and structural forms of the element.
The data resulting from studying the surface of sulphide minerals from the Natalkinskoe deposit using SEM-EDX and LA-ICP-MS methods confirmed the surface presence on arsenopyrite and pyrite crystals of Pt, Pd, Ru and Rh and such PGE as Os and Ir, as well as other ore trace elements including Ag, Hg, Pb, Cu and U. The maximum contents of invisible forms of PGE, as in the case of gold, are confined to the surface of crystals. An early assumption that surface-bound forms, as the main uniformly distributed form of elements in ore minerals, can be characteristic not only for Au, Pt and Pd was confirmed [11]. They are typical of other PGE (Ru, Rh, Os and Ir) and, in general, for ore trace elements.
The contradiction of LA-ICP-MS data with other methods with respect to the distribution of Pt and Pd in pyrite was revealed. This is assumed to be due to the presence of an unknown surface form of Pd, inhomogeneously distributed over crystals (Pd nanoparticles or any of its compounds). Although no proper mineral forms of PGE (Pt, Pd, Ru, Rh, Ir and Os) were established at the Natalkinskoe gold deposit, the probability of nano- or micro-sized mineral forms of PGE at this deposit is very high. This conclusion is based on the model of the evolution of surface NAP, assuming their partial transformation and aggregation with the formation of nano- and microinclusions of separate (autonomous) phases of trace elements.
The results obtained through the study of PGEs in sulphide minerals are of interest both theoretically and practically. Data on the nature of distribution, concentration level and forms of Pt, Pd, Ru, Rh, Ir and Os in arsenopyrites and pyrites significantly supplement existing ideas concerning peculiarities in the composition of gold mineralization, and they serve as a criterion for assessing the potential ore content of fluids forming gold deposits. The association of maximum contents of invisible forms of PGEs with the surface of sulphide mineral crystals can be used to develop methods of PGE recovery, primarily Pt, without destruction of the mineral structure, through transformation and dissolution of the surface layer only. This is an important point that must be taken into account in the concentration of ores, which includes sulphides, and in our case arsenopyrite and pyrite. The presence of PGE in ores and the possibility of their extraction significantly enhances the value of the gold ore mined, thereby increasing the prospects of the deposit under study.

Author Contributions

Conceptualization, R.G.K.; methodology, R.G.K. and V.L.T.; validation, R.G.K.; formal analysis, V.L.T., A.S.M., N.V.B. and N.V.S.; investigation, R.G.K. and V.L.T.; resources, R.G.K. and A.S.M.; writing—original draft preparation, R.G.K. and V.L.T.; writing—review and editing, R.G.K., V.L.T., A.S.M. and N.V.B.; visualization, R.G.K., A.S.M. and N.V.S. All authors have read and agreed to the published version of the manuscript.

Funding

The work was carried out within the framework of the execution of the state task for the projects IX.125.3.4. (0350-2019-0003) and IX.130.3.1. (0350-2019-0010) with the financial support of the RFBR (projects Nos. 20-05-00142 and 18-05-00077) and using scientific equipment of the shared research centre “Isotopic-geochemical investigations” IGC SB RAS (Irkutsk, Russia) and the shared research centre “Ultramicroanalysis” LIN SB RAS (Irkutsk, Russia).

Acknowledgments

The authors thank T.M. Pastushkova, I.Yu. Voronova, V.N. Vlasova, G.A. Shcherbakova, S.V. Lipko and K.Yu. Arsent’ev for their assistance in analytical studies. We would like to express our special gratitude to all geological services of the JSC “RiM” (Magadan, Russia), its chief geologist R.N. Ovsov and leading geologist E.M. Nikitenko, for comprehensive assistance in conducting fieldwork in the period from 2008 to 2016.

Conflicts of Interest

The authors declare no conflict of interest.

References

  1. Goncharov, V.I.; Voroshin, S.V.; Sidorov, V.A. Platinum mineralization of gold ore deposits in black shale sediments of the North–East of Russia: Challenges and prospects. In Platinum of Russia. Possibilities of Development of the Raw Material Base of Platinum Metals (Third meeting of the Scientific-methodical Council of the program “Platinum of Russia”); Orlov, V.P., Ed.; Geoinformmark: Moscow, Russia, 1995; Volume 2, Part 2; pp. 156–161. (In Russian) [Google Scholar]
  2. Goncharov, V.I.; Sidorov, V.A.; Pristavko, V.A. Platinum metal mineralization of the Natakinskoye gold ore deposit: Research findings. Kolyma 2000, 2, 49–53. (In Russian) [Google Scholar]
  3. Goncharov, V.I.; Voroshin, S.V.; Sidorov, V.A. Natalkinskoe Gold Lode Deposit; NEISRI FEB RAS: Magadan, Russia, 2002; p. 250. (In Russian) [Google Scholar]
  4. Voroshin, S.V.; Sidorov, V.A.; Tyukova, E.E. Geology, geochemistry and prospects of platinum mineralization at the Natakinskoye gold ore deposit (North–East of Russia). In Platinum of Russia. Possibilities of Development of the Raw Material Base of Platinum Metals (Third meeting of the Scientific-Methodical Council of the Program “Platinum of Russia”); Orlov, V.P., Ed.; Geoinformmark: Moscow, Russia, 1995; Volume 2, Part 2; pp. 161–176. (In Russian) [Google Scholar]
  5. Distler, V.V.; Mitrofanov, G.L.; Nemerov, V.K.; Kovalenker, V.A.; Mokhov, A.V.; Semeikina, L.K.; Yudovskaya, M.A. Forms of occurrence of platinum group metals and their genesis in the Sukhoi Log gold ore deposit (Russia). Geologiya Rudnykh Mestorozhdenij 1996, 38, 467–484. (In Russian) [Google Scholar]
  6. Distler, V.V.; Yudovskaya, M.A.; Razvozzhaeva, E.A.; Mokhov, A.V.; Trubkin, N.V.; Mitrofanov, G.L.; Nemerov, V.K. New data on PGE mineralization in gold ores of the Sukhoi Log deposit, Lensk gold-bearing district, Russia. Dokl. Earth Sci. 2003, 393, 1265–1267. [Google Scholar]
  7. Nemerov, V.K.; Razvozzhaeva, E.A.; Spiridonov, A.M.; Sukhov, B.G.; Trofimov, B.A. Nanodispersed state of metals and their migration in carbonaceous natural media. Dokl. Earth Sci. 2009, 425, 334–337. [Google Scholar] [CrossRef]
  8. Goryachev, N.A.; Sotskaya, O.T.; Goryacheva, E.M.; Mikhalitsyna, T.I.; Man’shin, A.P. The first discovery of platinum group minerals in black shale gold ores of the Degdekan deposit, Northeast Russia. Dokl. Earth Sci. 2011, 439, 902–905. [Google Scholar] [CrossRef]
  9. Khanchuk, A.I.; Plyusnina, L.P.; Nikitenko, E.M.; Kuzmina, T.V.; Barinov, N.N. The noble metal distribution in the black shales of the Degdekan gold deposit in northeast Russia. Russ. J. Pac. Geol. 2011, 5, 89–96. [Google Scholar] [CrossRef]
  10. Liu, J.; Chen, Y.; Liao, Z.; Zhan, Y.; Guan, Y. Progress in platinum group element (PGE) in black shale series. Appl. Mech. Mater. 2013, 353–356, 1183–1186. [Google Scholar] [CrossRef]
  11. Kravtsova, R.G.; Tauson, V.L.; Nikitenko, E.M. Modes of Au, Pt, and Pd occurrence in arsenopyrite from the Natalkinskoe deposit, NE Russia. Geochem. Int. 2015, 53, 964–972. [Google Scholar] [CrossRef]
  12. Pasava, J.; Ackerman, L.; Halodova, P.; Pour, O.; Durisova, J.; Zaccarini, F.; Aiglsperger, T.; Vymazalova, A. Concentrations of platinum-group elements (PGE), Re and Au in arsenian pyrite and millerite from Mo–Ni–PGE–Au black shales (Zunyi region, Guizhou Province, China): Results from LA-ICPMS study. Eur. J. Mineral. 2017, 29, 623–633. [Google Scholar] [CrossRef]
  13. Vasil’eva, I.E.; Shabanova, E.V.; Goryacheva, E.M.; Sotskaya, O.T.; Labusov, V.A.; Neklyudov, O.A.; Dzyuba, A.A. Determination of precious metals in geological samples from four gold ore deposits of the north–east of Russia. J. Anal. Chem. 2018, 73, 539–550. [Google Scholar] [CrossRef]
  14. Plyusnina, L.P.; Khanchuk, A.I.; Goncharov, V.I.; Sidorov, V.A.; Goryachev, N.A.; Kuz’mina, T.V.; Likhoidov, G.G. Gold, platinum, and palladium in ores of the Natalkinskoe deposit, upper Kolyma region. Dokl. Earth Sci. 2003, 391A, 836–840. [Google Scholar]
  15. Volkov, A.V.; Genkin, A.D.; Goncharov, V.I. The forms of the presence of gold in the ores of the Natalka and May deposits (Northeast Russia). Tikhookeanskaya Geol. 2006, 25, 18–29. (In Russian) [Google Scholar]
  16. Goryachev, N.A.; Vikent’eva, O.V.; Bortnikov, N.S.; Prokof’ev, V.Y.; Alpatov, V.A.; Golub, V.V. The world-class Natalka gold deposit, northeast Russia: REE patterns, fluid inclusions, stable oxygen isotopes, and formation conditions of ore. Geol. Ore Depos. 2008, 50, 362–390. [Google Scholar] [CrossRef]
  17. Eremin, R.A.; Osipov, A.P. On genesis of the Natalkinskoe gold ore deposit. Kolyma 1974, 6, 41–43. (In Russian) [Google Scholar]
  18. Kalinin, A.I.; Kanishchev, V.K.; Orlov, A.G.; Gashtol’d, V.V. Structure of the Natalkinskoe ore field. Kolyma 1992, 10–11, 10–14. (In Russian) [Google Scholar]
  19. Voroshin, S.V.; Shakhtyrov, V.G.; Tyukova, E.E.; Gashtold, V.V. Geology and genesis of the Natakinskoe gold ore deposit. Kolyma 2000, 2, 22–23. (In Russian) [Google Scholar]
  20. Goryachev, N.A.; Sidorov, V.A.; Litvinenko, I.S.; Mikhalitsyna, T.I. Mineral composition and petrogeochemical peculiarities of ore zones of the Natalkinskoe deposit deep horizons. Kolyma 2000, 2, 38–49. (In Russian) [Google Scholar]
  21. Mezhov, S.V. Geological structure of the Natalkinskoe gold ore deposit. Kolymskie Vesti 2000, 9, 8–17. (In Russian) [Google Scholar]
  22. Pristavko, V.A.; Sidorov, V.A.; Mikhalitsyna, T.I.; Burova, A.S.; Krasnaya, E.N. Geological-geochemical model the Natalkinskoe gold ore deposit. Kolymskie Vesti 2000, 9, 18–24. (In Russian) [Google Scholar]
  23. Grigorov, S.A. Genesis and formation dynamics of the Natalkinskoe gold ore deposit according to the system analysis of the geochemical field. Rudy Met. 2006, 3, 44–48. (In Russian) [Google Scholar]
  24. Struzhkov, S.F.; Natalenko, M.N.; Chekvaidze, V.B.; Isaakovich, I.Z.; Golubev, S.Y.; Danil’chenko, V.A.; Obuskhov, A.V.; Zaitsev, M.A.; Kryazhev, S.G. Multi-factor model of the Natalkinskoe gold ore deposit. Rudy Met. 2006, 3, 34–44. (In Russian) [Google Scholar]
  25. Volkov, A.V.; Murashov, K.Y.; Sidorov, A.A. Geochemical peculiarities of ores from the largest Natalka gold deposit in Northeastern Russia. Dokl. Earth Sci. 2016, 466, 161–164. [Google Scholar] [CrossRef]
  26. Grigorov, S.A.; Vorozhbenko, V.D.; Kushnarev, P.I.; Markevich, V.Y.; Tokarev, V.N.; Chichev, V.I.; Yagubov, N.P.; Mikhailov, B.К. Geology and key signatures of the Natalkinskoe gold deposit. Otechestvennaya Geol. 2007, 3, 43–50. (In Russian) [Google Scholar]
  27. Sharafutdinov, V.M.; Khasanov, I.M.; Mikhalitsyna, T.I. Petrophysical zoning of the Natalka ore field. Russ. J. Pac. Geol. 2008, 2, 441–453. [Google Scholar] [CrossRef]
  28. Sotskaya, O.; Goryachev, N.; Goryacheva, E.; Nikitenko, E. Micromineralogy of “Black Shale” Disseminated-Sulphide Gold Ore Deposits of the Ayan-Yuryakh Anticlinorium (North–East of Russia). J. Earth Sci. Eng. 2012, 2, 744–753. [Google Scholar]
  29. Bunakova, N.Y.; Zakharenko, V.M. Gold, Platinum, Palladium, Rhodium, Iridium and Ruthenium Detection in Rocks of Various Composition by Atomic Absorption with Electrothermal Atomization Following Concentration; NSAM No 430-Kh Methods; VIMS: Moscow, Russia, 2005; p. 24. (In Russian) [Google Scholar]
  30. Lebedeva, M.I.; Rogozhin, A.A. Gold Determination in Rocks, Ores and Their Processed Products by Extraction–Atomic–Absorption Method with Organic Sulfides; NSAM No 237-S Methods; VIMS: Moscow, Russia, 2016; p. 18. (In Russian) [Google Scholar]
  31. Men’shikov, V.I.; Vlasova, V.N.; Lozhkin, V.I.; Sokol’nikova, I.V. Determination of platinum-group elements in rocks by ICP-MS with external calibration after cation exchange separation of matrix elements by KU-2-8 resin. Anal. Kontrol 2016, 20, 190–201. (In Russian) [Google Scholar]
  32. Tauson, V.L.; Bessarabova, O.I.; Kravtsova, R.G.; Pastushkova, T.M.; Smagunov, N.V. Separation of forms of gold occurrence in pyrites by studying statistic samples of analytical data. Russ. Geol. Geophys. 2002, 43, 57–67. [Google Scholar]
  33. Tauson, V.L.; Lustenberg, E.K. Quantitative determination of modes of gold occurrence in minerals by the statistical analysis of analytical data samplings. Geochem. Int. 2008, 46, 423–428. [Google Scholar] [CrossRef]
  34. Ripley, E.M.; Chryssoulis, S.L. Ion microprobe analysis of platinum-group elements in sulfide and arsenide minerals from the Babbitt Cu–Ni deposit, Duluth Complex, Minnesota. Econ. Geol. 1994, 89, 201–210. [Google Scholar] [CrossRef]
  35. Trigub, A.L.; Tagirov, B.R.; Kvashnina, K.O.; Chareev, D.A.; Nickolsky, M.S.; Shiryaev, A.A.; Baranova, N.N.; Kovalchuk, E.V.; Mokhov, A.V. X-ray spectroscopy study of the chemical state of “invisible” Au in synthetic minerals in the Fe–As–S system. Am. Mineral. 2017, 102, 1057–1065. [Google Scholar] [CrossRef]
  36. Parviainen, A.; Gervilla, F.; Melgarejo, J.-C.; Johanson, B. Low-temperature, platinum-group elements-bearing Ni arsenide assemblages from the Atrevida mine (Catalonian Coastal Ranges, NE Spain). Neues Jahrb. Mineral. Abh. 2008, 185, 33–49. [Google Scholar] [CrossRef]
  37. Tauson, V.L.; Kravtsova, R.G.; Smagunov, N.V.; Spiridonov, A.M.; Grebenshchikova, V.I.; Budyak, A.E. Structurally and superficially bound gold in pyrite from deposits of different genetic types. Russ. Geol. Geophys. 2014, 55, 273–289. [Google Scholar] [CrossRef]
  38. Tauson, V.L.; Lipko, S.V.; Smagunov, N.V.; Kravtsova, R.G. Trace element partitioning dualism under mineral-fluid interaction: Origin and geochemical significance. Minerals 2018, 8, 282. [Google Scholar] [CrossRef] [Green Version]
  39. Tauson, V.L.; Lipko, S.V.; Smagunov, N.V.; Kravtsova, R.G.; Arsent’ev, K.Y. Distribution and segregation of trace elements during the growth of ore mineral crystals in hydrothermal systems: Geochemical and mineralogical implications. Russ. Geol. Geophys. 2018, 59, 1718–1732. [Google Scholar] [CrossRef]
  40. Tauson, V.L.; Babkin, D.N.; Akimov, V.V.; Lipko, S.V.; Smagunov, N.V.; Parkhomenko, I.Y. Trace elements as indicators of the physicochemical conditions of mineral formation in hydrothermal sulfide systems. Russ. Geol. Geophys. 2013, 54, 526–543. [Google Scholar] [CrossRef]
  41. Tauson, V.L.; Lipko, S.V.; Arsent’ev, K.Y.; Mikhlin, Y.L.; Babkin, D.N.; Smagunov, N.V.; Pastushkova, T.M.; Voronova, I.Y.; Belozerova, O.Y. Dualistic distribution coefficients of trace elements in the system mineral–hydrothermal solution. IV. Platinum and silver in pyrite. Geochem. Int. 2017, 55, 753–774. [Google Scholar] [CrossRef]
  42. Tauson, V.; Lipko, S.; Kravtsova, R.; Smagunov, N.; Belozerova, O.; Voronova, I. Distribution of “invisible” noble metals between pyrite and arsenopyrite exemplified by minerals coexisting in orogenic Au deposits of North–Eastern Russia. Minerals 2019, 9, 660. [Google Scholar] [CrossRef] [Green Version]
  43. Tauson, V.L.; Kravtsova, R.G. Evaluation of the gold admixture in structure of pyrite of epithermal gold-silver ore deposits (the North–East Russia). Zap. Ross. Mineral. Obshch. 2002, 131, 1–11. (In Russian) [Google Scholar]
  44. Tauson, V.L.; Kravtsova, R.G. Chemical typomorphism of mineral surfaces: Surface composition specifics (by the example of gold-bearing pyrite from epithermal deposit). Russ. Geol. Geophys. 2004, 45, 204–209. [Google Scholar]
  45. Tauson, V.L.; Kravtsova, R.G.; Grebenshchikova, V.I. Chemical typomorphism of the surface of pyrite crystals of gold ore deposits. Dokl. Earth Sci. 2004, 399, 1291–1295. [Google Scholar]
  46. Tauson, V.L.; Babkin, D.N.; Pastushkova, T.M.; Krasnoshchekova, T.S.; Lustenberg, E.E.; Belozerova, O.Y. Dualistic distribution coefficients of elements in the system mineral-hydrothermal solution. I. Gold accumulation in pyrite. Geochem. Int. 2011, 49, 568–577. [Google Scholar] [CrossRef]
  47. Zhitova, L.M.; Kinnaird, J.A.; Gora, M.P.; Shevko, E.P. Magmatogene fluids of metal-bearing reefs in the Bushveld Complex, South Africa: Based on research data on fluid inclusions in quartz. Geol. Ore Depos. 2016, 58, 58–81. [Google Scholar] [CrossRef]
  48. Tauson, V.L.; Kravtsova, R.G.; Grebenshchikova, V.I.; Lustenberg, E.E.; Lipko, S.V. Surface typochemistry of hydrothermal pyrite: Electron spectroscopic and scanning probe microscopic data. II. Natural pyrite. Geochem. Int. 2009, 47, 231–243. [Google Scholar] [CrossRef]
  49. Mitkin, V.N.; Galizky, A.A.; Korda, T.M. Some observations on the determination of gold and the platinum-group elements in black shales. Geostandard Newslett. 2000, 24, 227–240. [Google Scholar] [CrossRef]
  50. Oberthür, T.; Cabri, L.J.; Weiser, T.W.; McMahon, G.; Müller, P. Pt, Pd and other trace elements in sulfides of the main sulfide zone, Great Dyke, Zimbabwe: A reconnaissance study. Can. Mineral. 1997, 35, 597–609. [Google Scholar]
  51. Öhlander, B.; Müller, B.; Axelsson, M.; Alakangas, L. An attempt to use LA-ICP-SMS to quantify enrichment of trace elements on pyrite surfaces in oxidizing mine tailings. J. Geochem. Explor. 2007, 92, 1–12. [Google Scholar] [CrossRef]
  52. Kovalenko, A.N.; Tugova, E.A. Thermodynamics and kinetics of non-autonomous phase formation in nanostructured materials with variable functional properties. Nanosyst. Phys. Chem. Math. 2018, 9, 641–662. [Google Scholar] [CrossRef]
  53. Tauson, V.L. The principle of continuity of phase formation at mineral surfaces. Dokl. Earth Sci. 2009, 425, 471–475. [Google Scholar] [CrossRef]
  54. Palenik, C.S.; Utsunomiya, S.; Reich, M.; Kesler, S.E.; Wang, L.; Ewing, R.C. “Invisible” gold revealed: Direct imaging of gold nanoparticules in a Carlin-type deposit. Am. Mineral. 2004, 89, 1359–1366. [Google Scholar] [CrossRef]
  55. Gonzalez-Jimenez, J.M.; Reich, M. An overview of the platinum-group element nanoparticles in mantle-hosted chromite deposits. Ore Geol. Rev. 2017, 81, 1236–1248. [Google Scholar] [CrossRef]
  56. Gonzalez-Jimenez, J.M.; Deditius, A.; Gervilla, F.; Reich, M.; Suvorova, A.; Roberts, M.P.; Roque, J.; Proenza, J.A. Nanoscale partitioning of Ru, Ir, and Pt in base-metal sulfides from the Caridad chromite deposit, Cuba. Am. Mineral. 2018, 103, 1208–1220. [Google Scholar] [CrossRef]
  57. Filimonova, O.N.; Nickolsky, M.S.; Trigub, A.L.; Chareev, D.A.; Kvashnina, K.O.; Kovalchuk, E.V.; Vikentyev, I.V.; Tagirov, B.R. The state of platinum in pyrite studied by X-ray absorption spectroscopy of synthetic crystals. Econ. Geol. 2019, 114, 1649–1663. [Google Scholar] [CrossRef]
Figure 1. The schematic geological map of the Natalkinskoe gold deposit with areas from which ore samples were taken. Constructed by the authors of the present paper using the data [3,19,21,24,26]. Legend: 1—Quaternary sediments; 2 and 3—upper Permian ore hosted volcanogenic sedimentary rocks: 2—diamictites, 3—argillites and siltstone shales with layers of sandstones and gravelites with high carbon content; 4—ore deposit; 5—faults (a—reliable, b—estimated); 6—sampling points and their numbers. The inset map shows the location of the Natalkinskoe deposits in the territory of Northeastern Russia.
Minerals 10 00318 g001
Figure 2. Types of ores in the Natalkinskoe deposit (a–c—vein, d–f—streaky-vein, g–i—veinlet-disseminated): (a) a massive quartz vein with a small number of fragments containing siltstones, nests and inclusions of arsenopyrite (”North–West” area, borehole DH-20/11n, interval 566–569 m); (b) quartz vein of laminated texture (bands are composed of completely silicificated siltstones) with the impregnations of small grains of arsenopyrite (”Central” area, quarry, elevation 810 m); (c) massive quartz–sulphide vein of breccia structure with fragments of host diamictites and enclaves of arsenopyrite and pyrite crystals (“North–West” area, quarry, elevation 900 m); (d) siltstones dissected by a net of quartz and carbonate–quartz veinlets with nests and individual crystals of arsenopyrite and pyrite, on the border with a massive quartz vein (”Central” area, mine, elevation 600 m); (e) silicificated diamictites dissected by quartz and carbonate–quartz veins with enclaves of arsenopyrite and pyrite crystals on the border with a massive quartz vein (“South–East” area, borehole DH50/12n, interval 452.0–454.9 m); (f) massive quartz vein on the border with diamictites, dissected by the carbonate–quartz veinlets, with fragments of sandy argillites of gravel size with enclaves of crystals and clusters of arsenopyrite and pyrite (“South–East” area, borehole DH50/12n, interval 460.8–463.8 m); (g) diamictites with fragments of argillites of gravel size dissected by a dense net of quartz and carbonate–quartz veins, with enclaves of arsenopyrite and pyrite crystals (”Central” area, borehole DH30/29, interval 273.5–276.5 m); (h) diamictites with enclaves of crystals, clusters and crosscuts of arsenopyrite and pyrite, from the zone of intense quartz and quartz–carbonate streaking (“South–East” area, borehole DH50/12n, interval 428.1–431.0 m); (i) diamictites dissected by transverse quartz and quartz–carbonate veins with fragments of argillites of gravel size and enclaves of arsenopyrite and pyrite crystals and clusters (“South–East” area, borehole DH50/12n, interval 528.4–531.4 m).
Minerals 10 00318 g002
Figure 3. Monomineral fractions: (a) arsenopyrite, (b) pyrite.
Minerals 10 00318 g003
Figure 4. Crystals: (a) arsenopyrite, (b) pyrite.
Minerals 10 00318 g004
Figure 5. Dependences of the average content of evenly distributed platinum on the specific surface area of an average crystal in size fractions of arsenopyrite (a) and pyrite (b) from vein, streaky-vein and veinlet-disseminated ores of the Natalkinskoe deposit. The expressions for approximate curves are shown here and in Figure 6, Figure 7 and Figure 8, in which the pre-exponential factor (in bold) is an estimate of the content of the structural form of the element. The contents of structurally and surface-bound forms of Pt, Pd, Ru and Rh in arsenopyrite and pyrite are given in Table 3, Table 4, Table 5 and Table 6. Points 1–7 here and in Figure 6, Figure 7 and Figure 8 correspond to the ore samples described in Table 1.
Minerals 10 00318 g005
Figure 6. Dependences of the average content of evenly distributed palladium on the specific surface area of an average crystal in size fractions of arsenopyrite (a) and pyrite (b) from vein, streaky-vein and veinlet-disseminated ores of the Natalkinskoe deposit.
Minerals 10 00318 g006
Figure 7. Dependences of the average content of evenly distributed ruthenium on the specific surface area of an average crystal in size fractions of arsenopyrite (a) and pyrite (b) from vein, streaky-vein and veinlet-disseminated ores of the Natalkinskoe deposit.
Minerals 10 00318 g007
Figure 8. Dependences of the average content of evenly distributed rhodium on the specific surface area of an average crystal in size fractions of arsenopyrite from vein and streaky-vein ores of the Natalkinskoe deposit.
Minerals 10 00318 g008
Figure 9. Crystals of arsenopyrite (Asp) and pyrite (Py) with microinclusions of carbonate (Cb) and quartz (Qtz). Surface areas of arsenopyrite (1) and pyrite (2) crystals, where measurements were carried out. Their enlarged fragments are shown in Figure 10.
Minerals 10 00318 g009
Figure 10. Enlarged fragments of arsenopyrite (Asp) and pyrite (Py) crystals with “clean” areas, where measurements were carried out (see Table 8, sample М-129/10, N 3, n 3 and Table 9, sample М-129/10, N 1, n 2). The bottom of the Figure 9 shows the X-ray energy spectra of arsenopyrite (see Table 8, N 3, n 3).
Minerals 10 00318 g010
Figure 11. Distribution of the average content ( C ¯ ) of platinum and palladium in the surface layer of arsenopyrite crystal (sample M-129/10, Crystal 2) according to the results of LA-ICP-MS analysis (the Natalkinskoe deposit).
Minerals 10 00318 g011
Figure 12. Arsenopyrite Crystals 1 and 2 (sample UV-3/13) from ores of the Natalkinskoe deposit. Tracks 1–9, numbers of laser passes over the crystal surface. The results of LA-ICP-MS analysis are presented in Table 12.
Minerals 10 00318 g012
Figure 13. Pyrite Crystals 1 and 2 (sample UV-3/13) from ores of the Natalkinskoe deposit. Tracks 1–8, numbers of laser passes over the crystal surface. The results of LA-ICP-MS analysis are presented in Table 13.
Minerals 10 00318 g013
Table 1. Platinum, palladium and ruthenium content in different-sized monofractions of arsenopyrite and pyrite selected from vein, streaky-vein and veinlet-disseminated ores of the Natalkinskoe deposit.
Fraction No.Sample No.*Characteristics of Samples for Selection of MonofractionsFraction (mm)Pt (ppm)Pd (ppm)Ru (ppm)
Arsenopyrite
1G-9/13Veinlet-disseminated ore type. Diamictites dissected by a dense net of quartz and carbonate–quartz veinlets with inclusions of arsenopyrite and pyrite crystals. Arsenopyrite crystals shaped as pseudo-orthorhombic and monoclinic prisms predominate.0.5–1601244
20.25–0.5702055
30.2–0.251285.425
40.14–0.2641453
50.07–0.14631786
6TPM-1/1Streaky-vein ore type. Veins and veinlets of quartz and carbonate–quartz in diamictites, with inclusions of crystals and nodules of arsenopyrite, less frequently—pyrite. The crystals of arsenopyrite are shaped as pseudo-orthorhombic and monoclinic prisms. 0.25–0.5404.031
70.14–0.25731154
80.07–0.141206.767
9M-129/10Vein ore type. Sulphidized quartz vein on contact with diamictites dissected by a dense net of quartz and carbonate–quartz veins. Sulphides are mainly represented by arsenopyrite dominated by crystals in the form of pseudo-orthorhombic and monoclinic prisms.0.5–1233.518
100.25–0.5253.921
110.2–0.25274.124
12M-131/10Streaky-vein ore type. Offset subparallel quartz and carbonate–quartz veins and veinlets in diamictite. Sulphides are mainly represented by arsenopyrite. The crystals are shaped as pseudo-orthorhombic and monoclinic prisms.0.5–1242.816
130.25–0.5262.324
140.14–0.25293.617
15M-161/10Vein ore type. Massive sulphide–quartz vein with a small number of fragments of diamictites, with nodes and inclusions of arsenopyrite, rarely pyrite. Arsenopyrite crystals shaped as monoclinic prisms dominate.1–2273.719
160.5–1476.333
170.25–0.5629.531
180.14–0.25446.228
19Nat-10Veinlet-disseminated ore type. Diamictites interspersed with pyrite, rarely arsenopyrite, dissected by a dense net of quartz and carbonate veins from hair-thick to 5 mm. The crystals of arsenopyrite are shaped as pseudo-orthorhombic and monoclinic prisms.0.2–0.25 **203.420
201.917
20UV-3/13Veinlet-disseminated ore type. Diamictites interspersed with arsenopyrite and pyrite, dissected by a dense net of quartz and carbonate veins. Arsenopyrite crystals shaped as pseudo-orthorhombic and monoclinic prisms predominate.0.5–1153.53.7
210.25–0.5 **5.90.75.4
8.00.44.0
220.2–0.25100.74.2
Arsenopyrite
23TPM-1/1Streaky-vein ore type. Veins and veinlets of quartz and carbonate–quartz in diamictites, with inclusions of crystals and nodules of arsenopyrite, less frequently—pyrite. Pyrite forms cubic and pentagon-dodecahedral crystals.0.25–0.51.00.54.4
240.14–0.253.30.32.9
250.07–0.141.10.44.2
26M-161/10Vein ore type. Massive sulphide–quartz vein with a small number of fragments of diamictites, with nodules and inclusions of arsenopyrite, rarely pyrite. Cubic pyrite crystals predominate.0.5–1141224
270.25–0.5251533
280.2–0.25271441
29Nat-10Veinlet-disseminated ore type. Diamictites interspersed with pyrite, rarely arsenopyrite, dissected by a dense net of quartz and carbonate veins from hair-thick to 5 mm. Pyrite forms cubic, pentagon-dodecahedral, rarely cuboctahedral crystals and their combined forms.1–2 **254.721
101.028
300.5–1 **151.057
151.039
310.25–0.5 **122.158
105.848
320.2–0.25 **102.822
133.611
330.14–0.2184.917
34UV-3/13Veinlet-disseminated ore type. Diamictites interspersed with arsenopyrite and pyrite, dissected by a dense net of quartz and carbonate veins. Pyrite forms cubic, pentagon-dodecahedral, rarely cuboctahedral crystals.0.5–1 **151.016
8.00.52.8
350.25–0.5 **111.028
171.016
360.2–0.25291.714
Note: The data for the “phase” chemical analysis are presented here and in Table 2. Here: elev.—elevation relative to sea level. * Ore sampling location: G-9/13—“Geological” area, borehole DH329n, interval 151.6–154.6 m (elev. 750 m); TPM-1/1—“North–West” area, quarry (elev. 860 m); M-129/10—“North–West” area, ore zone 33, surface (elev. 920 m); M-131/10—“North–West” area, ore zone 33, surface (elev. 900 m); M-161/10—“Central” area, mine (elev. 600 m, crosscut 11); Nat-10—“Central” area, quarry (elev. 790 m); UV-3/13—“South–East” area, borehole DH70/5n, interval 160.1–163.1 m (elev. 590 m). ** Measurements of Pt, Pd and Ru were carried out on two parallel samples.
Table 2. The content of rhodium in the differently sized monofractions of arsenopyrite and pyrite selected from vein and streaky-vein ores of the Natalkinskoe deposit.
Fraction No.Sample No.Monofraction (mm)Rh (ppm)
Arsenopyrite
1M-131/100.5–113
20.25–0.510
30.14–0.2511
4M-161/101–29.0
50.5–121
60.25–0.521
70.14–0.2512
Pyrite
8TPM-1/10.25–0.55.9
90.14–0.253.4
100.07–0.144.8
Note: Ore sampling location and brief characteristics are presented in Table 1.
Table 3. Results of platinum analysis of single crystal size selections of arsenopyrite and pyrite from vein, streaky-vein and veinlet-disseminated ores of the Natalkinskoe deposit.
Sample No.Number of Crystals (Initial–Final Sample)Characteristics of the Final SampleContents (ppm)
Number of CrystalsInterval of Masses (mg) m ¯ (mg) r ¯ (mm) S ¯ s p (mm2/mg) C ¯ ± Δ (ppm) C ¯ t o t C ¯ e v C s t r C ¯ s u r
Arsenopyrite
G-9/1366–4880.12–0.180.150.2923.411710 ± 10918414512140
120.19–0.280.240.3392.873579 ± 56
110.29–0.690.550.4482.189281 ± 54
70.79–1.321.140.5721.722100 ± 30
101.34–3.642.340.7271.35555 ± 9
TPM-1/176–58120.10–0.140.120.2713.6721488 ± 25984472848714
100.15–0.200.170.3043.2621052 ± 130
60.21–0.220.220.332.97713 ± 221
50.23–0.230.230.3362.945852 ± 98
100.24–0.280.260.352.827727 ± 115
60.29–0.330.310.3712.664477 ± 156
90.34–0.460.410.4062.412502 ± 77
M-129/1042–3590.10–0.120.110.2623.7452519 ± 44366953631581
70.13–0.240.190.3143.1141543 ± 282
60.27–0.370.310.3712.664802 ± 87
80.48–0.730.590.4592.143438 ± 86
51.01–1.451.30.5971.645202 ± 58
M-131/1053–3990.10–0.170.140.2843.4561067 ± 15732028835244
60.18–0.320.240.3392.873649 ± 136
80.34–0.520.430.4122.369436 ± 67
70.54–1.050.880.5241.872236 ± 35
91.07–2.151.580.6371.541152 ± 28
M-161/1040–3170.40–0.620.580.4562.1511168 ± 27856549916494
80.66–1.010.90.5291.866838 ± 118
91.03–1.391.20.5821.694532 ± 114
71.42–4.312.580.7511.312216 ± 75
Nat-1060–3980.21–0.410.30.3662.679669 ± 85135784.289
80.42–0.560.490.4312.275397 ± 102
90.58–0.980.740.4951.987272 ± 51
81.17–2.311.650.6461.518125 ± 38
63.73–14.339.211.1470.85717 ± 14
UV-3/1378–50110.11–0.240.180.333.63688 ± 11925218814190
80.25–0.350.310.3963.035375 ± 97
80.36–0.510.410.4342.756375 ± 104
90.52–0.750.670.5122.348210 ± 41
70.76–1.100.990.5832.06115 ± 31
71.19–2.161.70.6981.7290 ± 22
Pyrite
TPM-1/143–3380.10–0.120.110.284.2761350 ± 10057453441462
90.13–0.180.160.3173.768940 ± 100
60.21–0.330.270.3783.175610 ± 110
100.41–1.650.670.5122.348272 ± 54
M-161/1058–45120.10–0.120.110.284.2761730 ± 18099094068890
100.13–0.160.150.3113.8691320 ± 90
80.17–0.210.190.3363.5651200 ± 150
100.22–0.310.270.3783.175940 ± 57
50.34–1.130.650.5072.373380 ± 140
Nat-1054–3480.30–0.550.450.4482.676239 ± 2156333.735
80.60–1.961.460.6631.80697 ± 17
72.24–2.712.510.7951.51156 ± 11
62.84–4.143.650.91.33231 ± 12
54.48–16.211.51.320.90913 ± 5
UV-3/1379–52100.10–0.180.160.3173.768716 ± 9732220837189
100.20–0.290.240.3633.294372 ± 42
80.31–0.390.350.4122.91360 ± 107
90.41–0.580.520.472.549316 ± 75
80.60–1.000.780.5382.227342 ± 54
71.05–3.602.690.8131.47484 ± 31
Note: Here and in Table 4, Table 5 and Table 6: m ¯ , the average mass of the crystal in size fraction; r ¯ , the average size of the crystal in size fraction; S ¯ s p , the specific surface area of average crystal in size fraction; C ¯ ± Δ , the average content of evenly distributed element ± one standard deviation; C ¯ t o t , average total content, C i m i m i ; C ¯ e v , average evenly distributed element content for all size fractions; C s t r , structurally bound form content (C extrapolation to zero S ¯ s p ); C ¯ s u r , average content of surface-associated form.
Table 4. Results of palladium analysis of single crystal size selections of arsenopyrite and pyrite from vein, streaky-vein and veinlet-disseminated ores of the Natalkinskoe deposit.
Sample No.Number of Crystals (Initial–Final Sample)Characteristics of the Final SampleContents (ppm)
Number of CrystalsInterval of Masses (mg) m ¯ (mg) r ¯ (mm) S ¯ s p (mm2/mg) C ¯ ± Δ (ppm) C ¯ t o t C ¯ e v C s t r C ¯ s u r
Arsenopyrite
G-9/1366–4290.12–0.180.150.2923.411195 ± 4340271.626
90.19–0.280.250.3452.85797 ± 27
70.29–0.690.570.4532.1627 ± 6
90.79–1.321.050.5561.76626 ± 6
81.34–3.642.420.7351.3399.5 ± 3.5
TPM-1/188–63100.10–0.140.120.2713.672245 ± 691421145.9114
110.15–0.190.170.3043.262196 ± 45
80.20–0.220.210.3243132 ± 30
100.23–0.240.230.3362.945117 ± 27
90.25–0.290.270.3532.769101 ± 23
70.30–0.340.320.3732.60975 ± 20
80.35–0.650.440.4162.3673 ± 18
M-129/1041–3190.10–0.120.110.2623.745361 ± 3997832.682
60.13–0.240.20.3213.091221 ± 47
50.27–0.370.310.3712.664133 ± 46
60.48–0.730.60.4612.12554 ± 19
51.01–1.451.250.591.67120 ± 4
M-131/1052–3880.10–0.170.140.2843.456122 ± 313230227
60.18–0.320.260.352.82777 ± 10
80.34–0.520.430.4122.36952 ± 10
80.54–1.050.870.5231.88625 ± 6
81.07–2.151.580.6371.54110 ± 2
M-161/1040–2480.40–0.620.580.4562.15183 ± 1839310.631
50.66–0.980.850.5181.89446 ± 18
61.00–1.321.120.5691.73434 ± 6
51.38–4.312.870.7771.26211 ± 7
Nat-1060–3990.21–0.410.270.3532.76996 ± 18127.70.48.1
80.42–0.560.510.4382.25733 ± 9
80.58–0.980.770.5011.95618 ± 5
71.17–2.311.640.6461.5279.8 ± 4.2
73.73–14.338.421.1130.8831.9 ± 0.8
UV-3/1376–58120.11–0.240.170.3243.70582 ± 1121180.825
100.25–0.350.310.3963.03544 ± 5
90.35–0.510.410.4342.75635 ± 6
100.52–0.750.680.5142.33117 ± 3
80.76–1.100.990.5832.0610 ± 2
91.19–2.161.610.6851.7496.7 ± 1.1
Pyrite
TPM-1/143–33100.10–0.120.110.284.276156 ± 1758533.250
80.13–0.180.160.3173.76897 ± 11
60.21–0.330.290.3783.09958 ± 12
90.41–1.650.70.5192.30925 ± 5
M-161/1054–44100.10–0.120.110.284.276142 ± 1173675.262
90.13–0.170.150.3113.869111 ± 8
70.18–0.220.20.3423.50980 ± 6
90.24–0.310.280.3833.14362 ± 3
90.34–1.130.540.4762.51837 ± 7
Nat-1060–4180.29–0.510.420.4382.74135 ± 68.76.31.14.9
70.55–1.631.240.6281.90814 ± 3
81.72–2.572.170.7571.58411 ± 3
92.66–4.143.230.8641.3877.9 ± 0.8
94.48–16.210.661.2870.9322.7 ± 0.5
UV-3/1379–56100.10–0.180.170.3243.70577 ± 112215118
90.20–0.290.250.3683.2545 ± 12
110.31–0.390.350.4122.9137 ± 4
120.41–0.580.510.4672.56625 ± 2
90.60–1.000.830.552.18718 ± 3
51.05–3.603.20.8621.3934.2 ± 1.2
Table 5. Results of ruthenium analysis of single crystal size selections of arsenopyrite and pyrite from vein, streaky-vein and veinlet-disseminated ores of the Natalkinskoe deposit.
Sample No.Number of Crystals (Initial–Final Sample)Characteristics of the Final SampleContents (ppm)
Number of CrystalsInterval of Masses (mg) m ¯ (mg) r ¯ (mm) S ¯ s p (mm2/mg) C ¯ ± Δ (ppm) C ¯ t o t C ¯ e v C s t r C ¯ s u r
Arsenopyrite
G-9/1364–42120.12–0.200.160.2963.2861034 ± 17728319318190
90.22–0.330.270.3532.769547 ± 76
60.40–0.690.570.4532.16339 ± 149
70.79–1.341.10.5651.741160 ± 53
81.39–3.642.490.7421.32782 ± 26
TPM-1/185–6190.10–0.140.120.2713.6722424 ± 51213181129411083
120.15–0.190.170.3043.2621678 ± 316
100.20–0.220.210.32431321 ± 159
90.23–0.240.230.3362.9451108 ± 225
80.25–0.290.280.3582.746904 ± 197
60.30–0.340.320.3732.609832 ± 298
70.35–0.650.450.422.352530 ± 86
M-129/1043–3390.10–0.120.110.2623.7452269 ± 28565653748520
60.13–0.240.20.3213.0911179 ± 196
50.27–0.370.30.3662.679812 ± 63
70.48–0.730.610.4642.118516 ± 63
61.01–1.451.270.5921.656231 ± 59
M-131/1040–2960.10–0.170.150.2923.411789 ± 9217916510162
50.18–0.320.260.352.827432 ± 121
70.34–0.520.440.4162.36263 ± 33
60.54–1.050.90.5291.866129 ± 30
51.07–2.151.70.651.50563 ± 15
M-161/1040–3390.40–0.620.560.4512.179667 ± 10733129720290
80.66–1.010.910.531.852422 ± 75
91.03–1.391.20.5821.694309 ± 42
71.42–4.312.620.7551.305166 ± 33
Nat-1059–3550.21–0.410.30.3662.679729 ± 262128795.779
80.42–0.560.50.4342.26375 ± 103
80.58–0.980.80.5081.936187 ± 51
81.17–2.311.650.6461.518124 ± 49
63.73–14.339.071.1410.86124 ± 10
UV-3/1378–58100.11–0.240.180.333.63941 ± 17232923819218
90.25–0.350.320.43428 ± 69
100.36–0.510.40.4312.787372 ± 65
100.52–0.750.660.5092.355245 ± 49
90.76–1.100.980.5812.067211 ± 56
101.19–2.161.630.6881.742103 ± 20
Pyrite
TPM-1/143–2980.10–0.120.110.284.2761720 ± 30068657423577
80.13–0.180.160.3173.7681280 ± 210
60.21–0.330.270.3783.175605 ± 160
70.41–1.650.730.5272.283235 ± 90
M-161/1058–43100.10–0.120.110.284.2761560 ± 35085070034690
100.13–0.160.150.3113.8691320 ± 130
60.17–0.210.190.3363.565930 ± 290
100.22–0.310.270.3783.175540 ± 70
70.34–1.130.580.4882.464330 ± 90
Nat-1058–4060.29–0.550.420.4382.741189 ± 8648354.930
100.60–1.721.230.6271.918109 ± 22
71.81–2.662.320.7741.54958 ± 15
92.71–4.483.580.8951.34333 ± 5
85.78–16.29.911.2560.95514 ± 4
UV-3/1379–55100.10–0.180.160.3173.7681840 ± 4004542729.9330
110.20–0.290.240.3633.2941085 ± 149
100.31–0.390.360.4162.884577 ± 129
90.41–0.580.520.472.549384 ± 74
90.60–1.000.830.5582.187248 ± 39
61.05–3.602.90.8341.43967 ± 23
Table 6. Results of rhodium analysis of size selections of arsenopyrite single crystals from vein and streaky-vein ores of the Natalkinskoe deposit.
Sample No.Number of Crystals (Initial–Final Sample)Characteristics of the Final SampleContents (ppm)
Number of CrystalsInterval of Masses (mg) m ¯ (mg) r ¯ (mm) S ¯ s p (mm2/mg) C ¯ ± Δ (ppm) C ¯ t o t C ¯ e v C s t r C ¯ s u r
M-129/1043–3190.10–0.120.110.2623.7453108 ± 49180171545678
50.13–0.240.210.3243.0001473 ± 394
60.27–0.370.310.3712.664973 ± 159
60.48–0.730.600.4612.125483 ± 78
51.01–1.451.290.5951.647296 ± 85
M-131/1038–2850.10–0.170.140.2843.456653 ± 39121119036154
40.18–0.310.260.3502.827453 ± 130
40.34–0.520.490.4312.275368 ± 146
70.54–1.040.830.5141.910224 ± 34
81.07–2.151.640.6501.527103 ± 19
M-161/1040–2880.40–0.620.540.4462.210782 ± 15536030917299
70.66–1.010.930.5341.840387 ± 55
71.03–1.391.260.5921.669320 ± 89
61.42–4.312.650.7571.297158 ± 46
Table 7. Evaluation of gold and platinum grade in ore-forming fluids by pyrite composition using experimental distribution coefficients D s t r .
Sample No.DepositNumber of Crystals (Initial–Final Sample)Element C s t r (ppm) C ¯ s u r (ppm) C a q (ppm) A u / P t a q
M-163/10Degdekan95–59Au0.20.52.121
92–71Pt2.07.10.1
DG-10/1467–44Au0.11.11.36.5
34–22Pt5.11020.2
UV-3/13Natalkinskoe80–52Au0.31.42.91.6
79–52Pt371891.8
M-161/1058–40Au0.23.61.80.6
58–45Pt688903.2
TPM-1/143–30Au0.33.43.21.6
43–33Pt414622.0
Nat-1060–39Au1.82.71890
54–34Pt3.6350.2
Note: C s t r , structurally bound element content; C ¯ s u r , superficially bound element content; C a q , element content in the ore-forming fluid.
Table 8. Chemical composition (in wt%) of arsenopyrite crystal surfaces with micron-size rare inclusions of non-metallic minerals. Samples from vein ores of the Natalkinskoe deposit.
Sample No.NnFeAsSCOAlSiHgAuAgCuTiPtOsIrRuU
M-129/101131.636.023.42.82.01.20.20.70.70.2--0.4---0.8
232.435.620.23.42.51.30.21.10.90.3--0.6---1.5
331.936.820.83.71.50.60.11.00.90.3--0.8---1.6
2130.036.320.44.32.51.20.11.10.90.1--1.1---2.0
228.939.020.64.62.50.50.20.90.80.2--0.4---1.4
3132.641.816.13.91.5--1.00.7---0.50.60.4-0.9
232.143.414.22.31.4--0.91.00.2--0.90.60.71.01.3
332.443.115.41.11.0--0.90.90.7--0.90.70.71.01.2
M-161/104134.040.215.14.62.7--0.40.3---0.40.20.31.40.4
234.741.513.84.81.8--0.40.4---0.40.20.21.20.6
5130.841.217.13.93.21.00.1---0.6-2.1----
231.941.719.01.92.11.40.1--0.10.50.21.1----
6133.342.419.01.01.10.60.2--0.30.20.20.60.20.30.30.3
233.242.919.10.60.80.50.2--0.10.20.11.20.20.30.30.3
333.143.219.10.40.50.50.1--0.60.60.10.80.20.30.20.3
Note: Pd, Rh, F, Cl, Pb, Zn, Mo, W, Bi and REE were not detected. Analytical lines: FeKα, AsKα, SKα, CKα, OKα, AlKα, SiKα, HgLα, AuLα, AgLα, CuKα, TiKα, PtLα, OsLα, IrLα, RuLα and ULα. Here and in Table 9: N—the serial number of the crystal, n—the serial number of the measurement area on the crystal surface; hyphen—element is not detected; italics—the elements content below the detection limit (<0.5 wt%), so their presence is problematic but without taking them into account the sum total does not reach 100%; the main composition is in bold.
Table 9. Chemical composition (in wt%) of pyrite crystal surfaces with micron-size rare inclusions of non-metallic minerals. Samples from vein ores of the Natalkinskoe deposit.
Sample No.NnFeSCOAlSiCaNaAsCuTiPt
M-129/101138.543.15.37.71.20.2--1.30.70.31.7
236.939.27.010.71.30.3--1.20.70.42.3
341.047.92.92.61.40.2--1.70.50.21.6
2139.844.15.16.81.10.2--1.0-0.21.7
235.942.75.610.20.81.1--1.00.60.12.0
338.847.03.36.20.90.9--1.10.30.11.4
3137.038.34.313.20.90.70.20.31.80.6-2.7
239.548.42.33.00.80.10.10.22.20.5-2.9
M-161/104137.437.53.116.41.31.0--1.10.40.11.7
240.546.53.65.61.40.1-0.21.40.2-0.5
5141.747.22.63.30.90.1--2.00.3-1.9
240.747.53.04.00.90.2--2.00.2-1.5
Note: Au, Ag, Hg, Pd, Os, Ir, Ru, Rh, U, F, Cl, Pb, Zn, Mo, W, Bi and REE were not detected. Analytical lines: FeKα, SKα, CKα, OKα, AlKα, SiKα, CaKα, NaKα, AsKα, CuKα, TiKα and PtLα.
Table 10. Results of LA-ICP-MS analysis of the surface of arsenopyrite crystals for Pt and Pd (the Natalkinskoe deposit).
Sample No.Crystal No. (Size, mm)Track No.Contents of Elements (ppm)
PtPd
M-129/101 (1.0)12.91.8
21.41.8
2 (1.1)13.12.5
2.81.0
-1.8
1.41.8
--
-1.0
M-131/101 (1.3)10.40.7
20.40.5
2 (1.3)1-0.1
2-0.2
3 (1.0)1<0.40.1
2-0.1
M-161/101 (1.0)10.40.4
2233.8
30.40.2
4<0.40.1
56.21.4
2 (1.2)1<0.4<0.1
2-0.6
TPM-1/11 (1.3)10.40.8
2 (1.5)10.41.2
3 (1.5)1<0.40.9
20.44.8
Note: Here and in Table 11, Table 12 and Table 13:hyphen—element not detected; sign “<”—below detection limit. Bold—results of a detailed study of Pt and Pd contents to the depth of 600 nm with a step of 100 nm (see Figure 11).
Table 11. Results of LA-ICP-MS analysis of the surface of pyrite crystals for Pt and Pd (the Natalkinskoe deposit).
Sample No.Crystal No. (Size, mm)Track No.Contents of Elements (ppm)
PtPd
M-161/101 (1.0)11.65.9
20.40.1
3-0.2
4-0.1
2 (1.2)1<0.40.9
2<0.40.2
3<0.40.4
3 (1.5)1-0.2
2-0.4
TPM-1/11 (1.8)10.43.8
2-0.1
2 (1.7)1-0.7
2-0.1
3 (1.9)10.40.1
2-0.7
Table 12. Results of LA-ICP-MS analysis (in ppm) of the surface of arsenopyrite crystals (1 and 2) for Pt, Pd, Rh and Ir (sample UV-3/13) (the Natalkinskoe deposit).
nPtPdRhIrPtPdRhIrPtPdRhIr
Crystal1
Track 1Track 2Track 3
10.71.67.60.2<0.75.21.6-<0.77.92.30.1
2-<0.22.5<0.10.92.21.0--3.40.5-
3-0.30.2--7.60.3--3.51.6<0.1
4-0.4<0.2--3.20.5<0.1-2.90.4-
5-0.20.3--2.00.4<0.1-1.40.3-
6-<0.20.2--2.00.6--1.5--
Crystal2
Track 4Track 5Track 6
1<0.70.81.20.15.22.90.6-0.75.87.5-
2-0.20.50.1-1.20.2--4.30.7-
3-0.20.2--<0.20.2--1.70.5-
4-0.30.5--1.40.7--1.50.2-
5-<0.2<0.2--0.40.4--1.32.1-
6--<0.2--0.9<0.2--0.70.2-
Track 7Track 8Track 9
11.38.21.9-<0.72.86.4<0.11.58.48.9-
2-0.61.7--1.50.5--3.73.6-
3<0.7<0.20.8-<0.71.80.8--2.53.7-
4-0.40.9--<0.20.3--3.71.1-
5-<0.20.4--0.20.9--3.61.5-
6-0.4<0.2--<0.2---2.70.7<0.1
Note: Here and in Table 13: n—numbers of laser passes along the track (depth per pass is 1.0 µm).
Table 13. Results of LA-ICP-MS analysis (in ppm) of the surface of pyrite crystals (1 and 2) for Pt, Pd, Rh and Ir (sample UV-3/13) (the Natalkinskoe deposit).
nPtPdRhIrPtPdRhIrPtPdRhIrPtPdRhIr
Crystal1
Track 1Track 2Track 3Track 4
12.51180.90.53.61351.60.41.81340.31.12.2705.10.4
21.054-0.31.1108<0.20.41.1890.30.52.21091.70.2
30.5260.70.1<0.7540.30.6<0.741-0.21.1470.4-
40.310--0.956<0.2<0.2-18<0.2<0.2<0.7630.7-
5-7.71.8-0.728<0.2--14--<0.7310.50.2
6-2.6--0.939<0.2--17<0.2--340.2-
Crystal2
Track 5Track 6Track 7Track 8
1114532.41.8138552.93.1138966.74.17.76931.23.0
25.38200.53.69.18451.14.18.46242.41.95.37150.43.0
32.75031.20.75.95210.91.82.83780.51.58.34610.42.8
41.11010.40.54.73650.21.33.82101.60.80.9301<0.20.7
50.8500.20.43.12061.00.62.51300.20.52.61350.60.5
60.535<0.20.51.3890.30.70.91120.20.52.2143<0.21.1

