The Use of Precise Survey Techniques to Find the Connection between Discontinuities and Surface Morphologic Features in the Laže Quarry in Slovenia
Abstract
1. Introduction
1.1. The Study Area
1.2. Geological Setting of the Area
2. Materials and Methods
2.1. Materials
2.1.1. Digital Terrain Model
- A digitization of the original terrain of the topographic map M 1:5000 and construction of 5 × 5 m mesh;
- LIDAR terrain record data from 2014, including intensity images created from LIDAR recorded in the area. The data are available in the Environmental atlas of Slovenia [59]. A more precise (1 × 1 m) digital terrain model (DTM) was created;
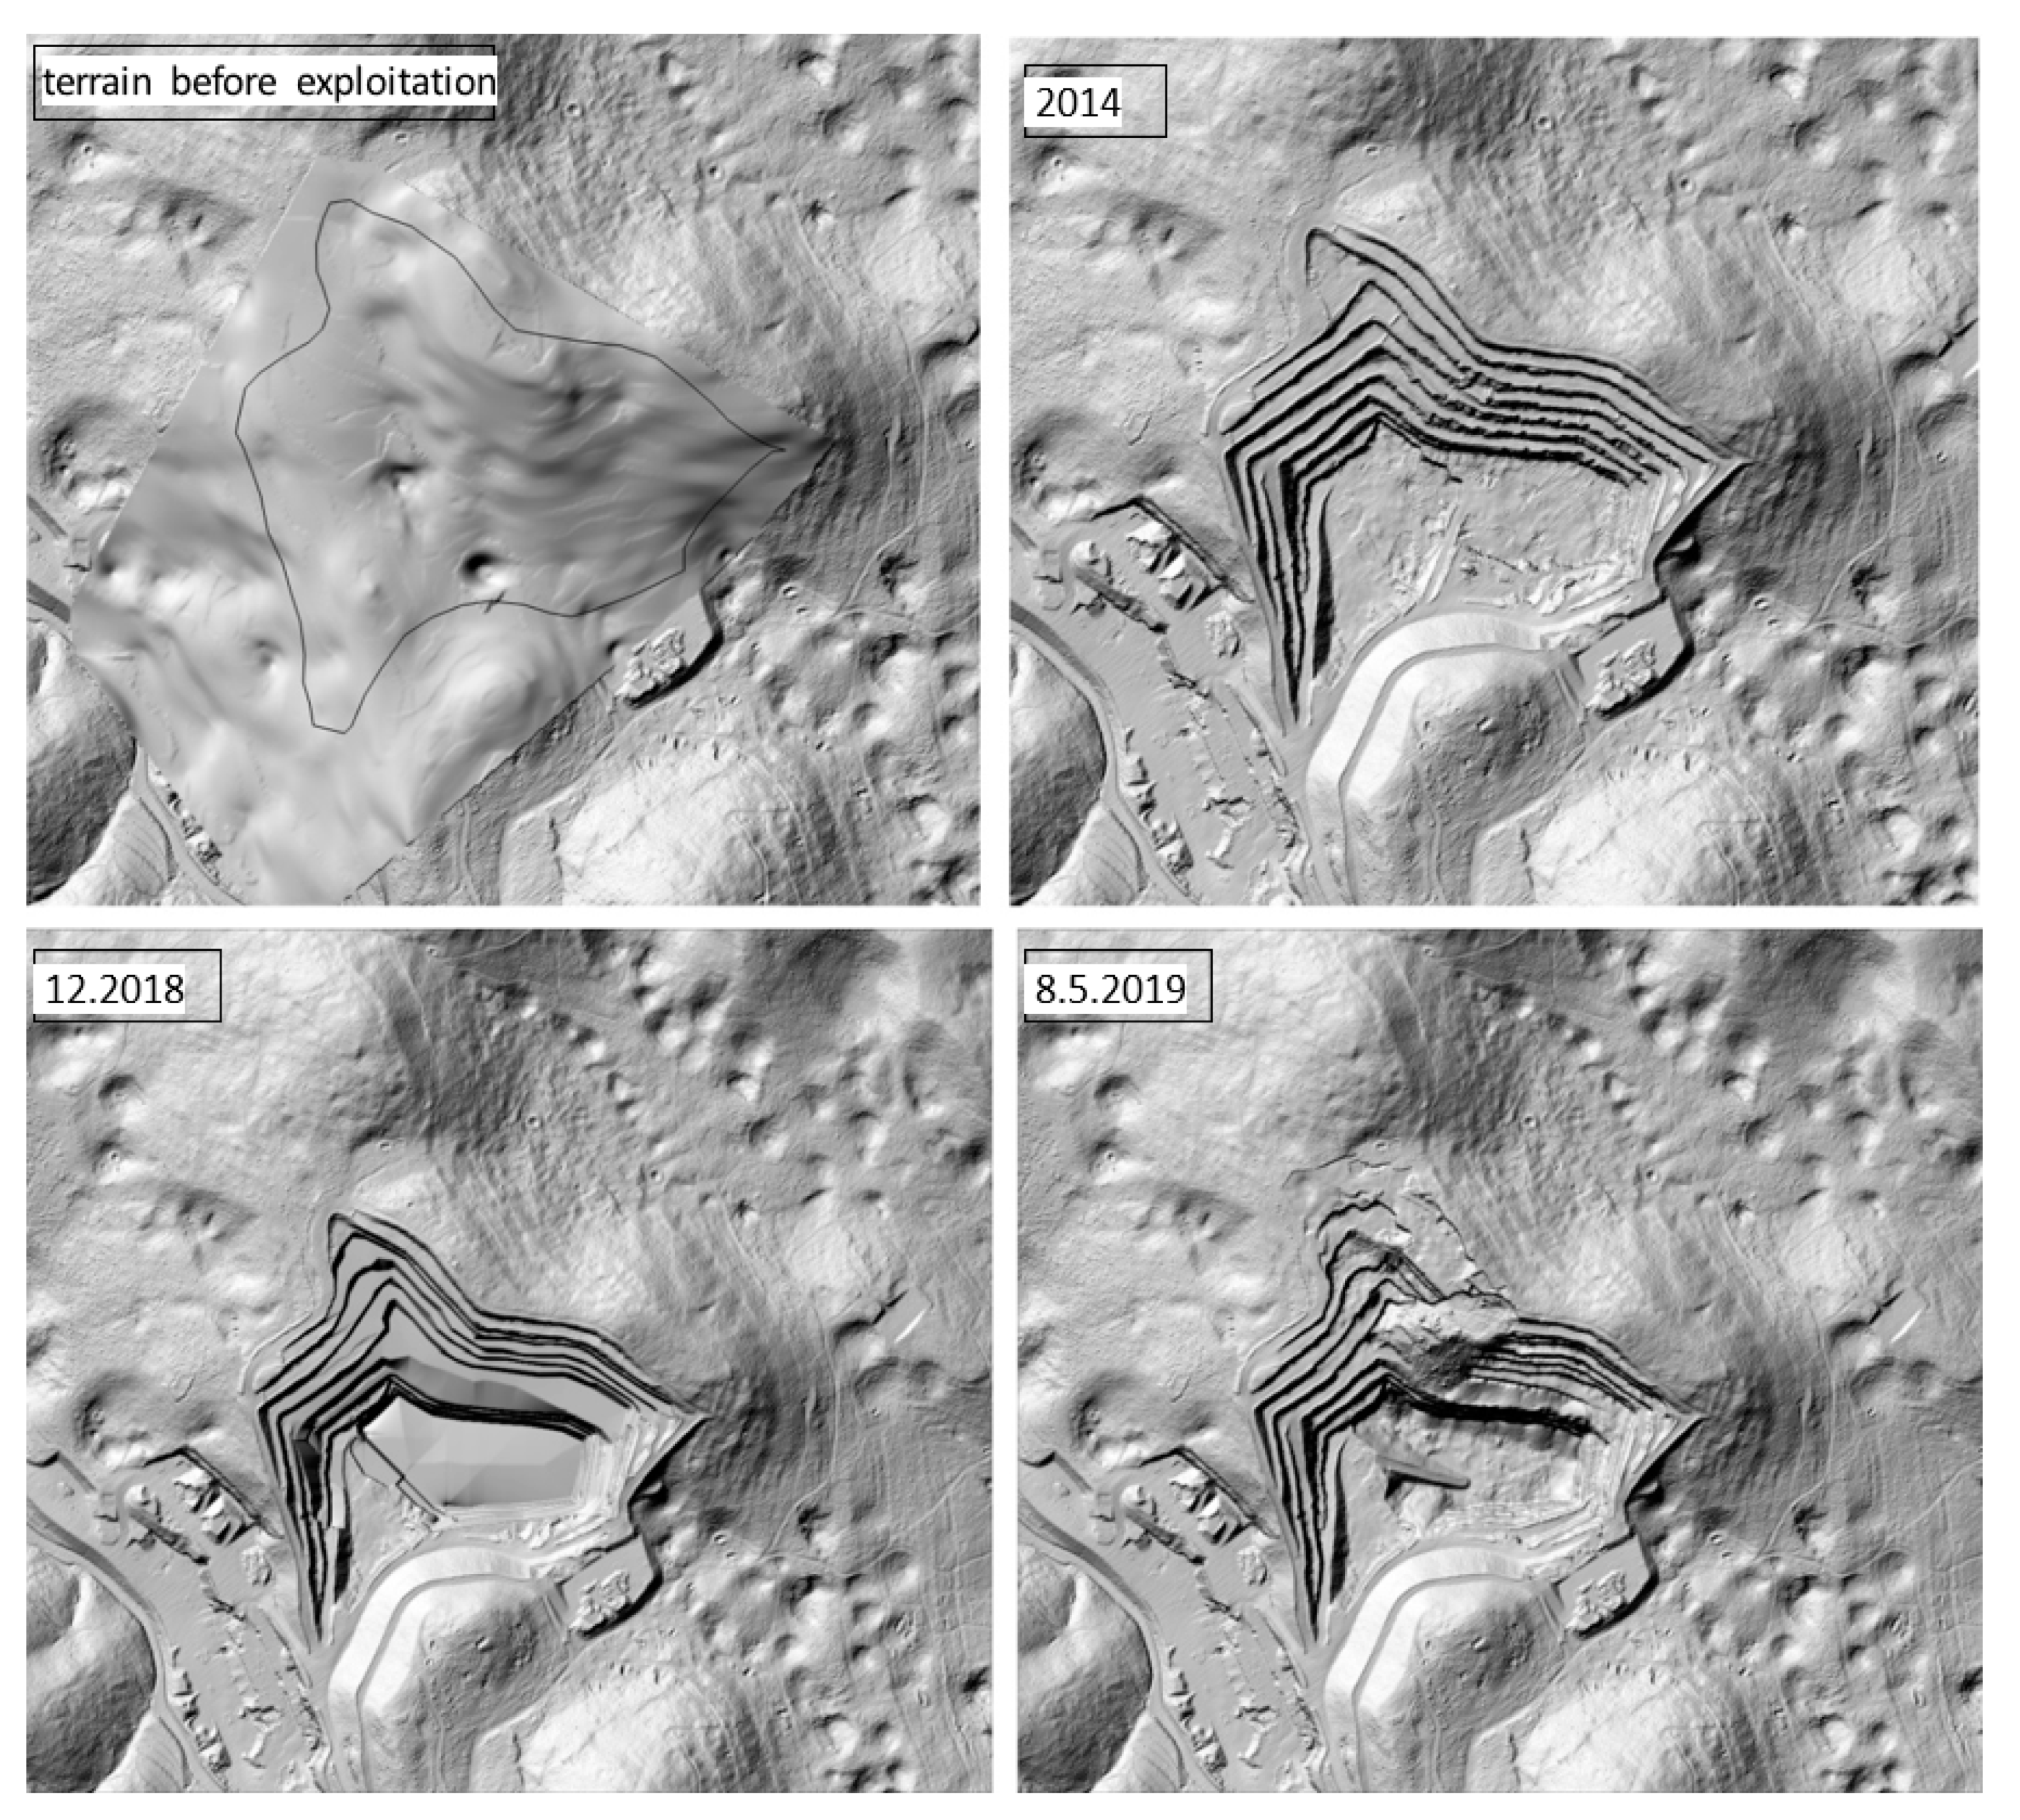
- A digitalization of existing quarry products on a geodetic map. The map had been constantly updated by quarry management. Using the map from December 2018, we digitized the benches and created a digital model of the quarry. This model showed the benches before the collapse;
- A review and comparison of old aerial photographs as well as occasional quarry recordings; and
- Unmanned aerial photography data from 8 May 2019.
2.1.2. Topography and Geomorphological Analysis of the Relief
2.2. Methods
2.2.1. Sliding Surface
2.2.2. Quarry Mapping
2.2.3. Stability Analysis
3. Results
3.1. Digital Relief Model with a Photorealistic Raster Graphic Base
- a terrain model of the quarry before exploitation;
- a quarry model using 2014 LIDAR data;
- a model of the quarry from December 2018; and
- a quarry model with data from 8 May 2019, i.e., after the rockslide.
3.2. Mapping of Discontinuities
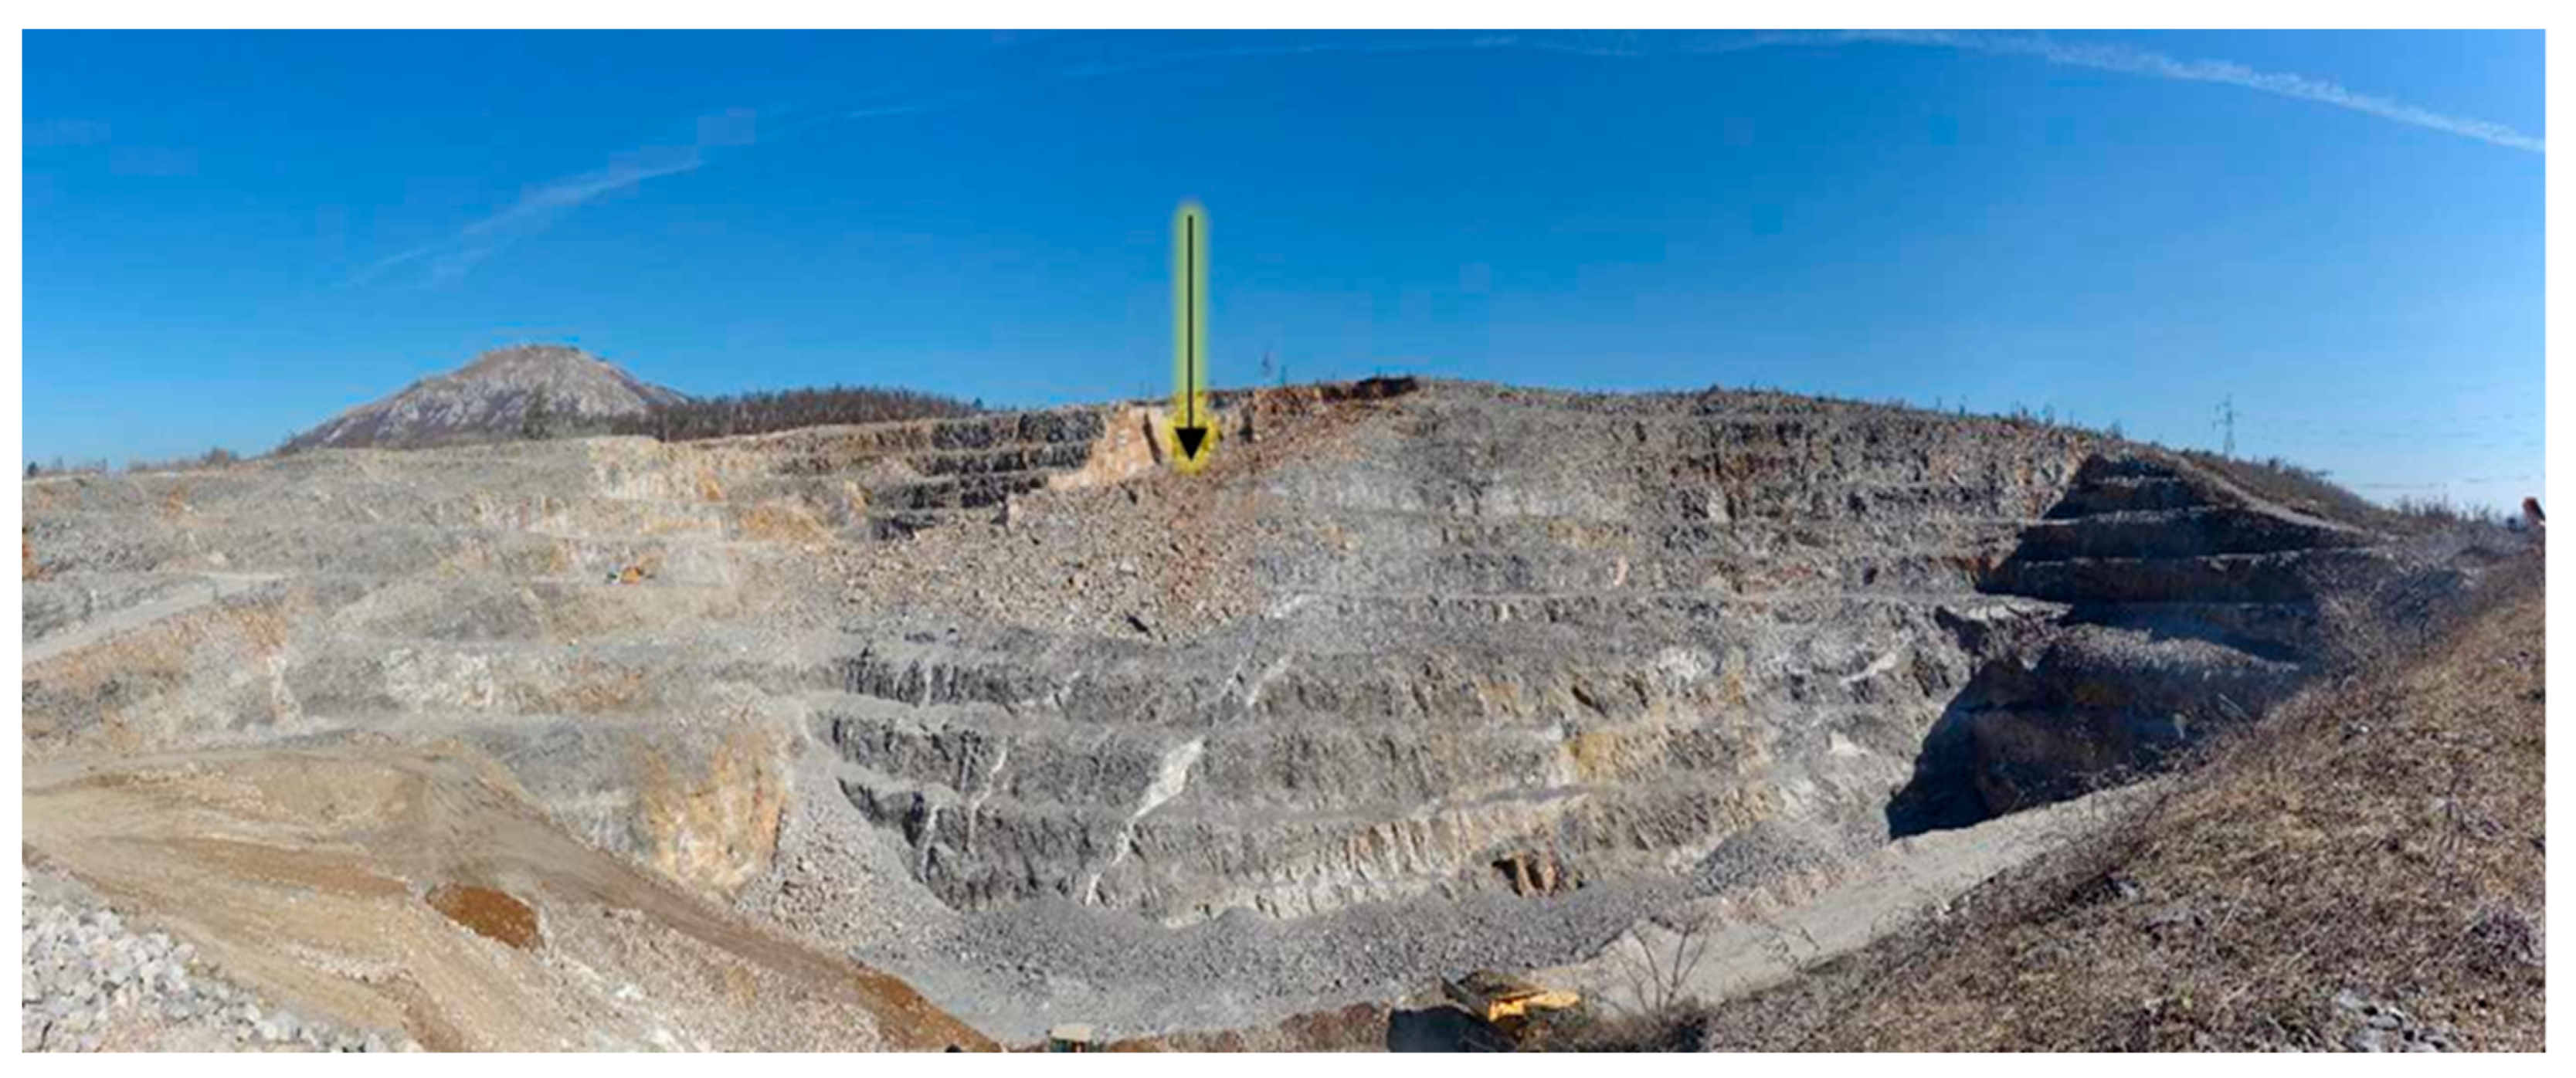
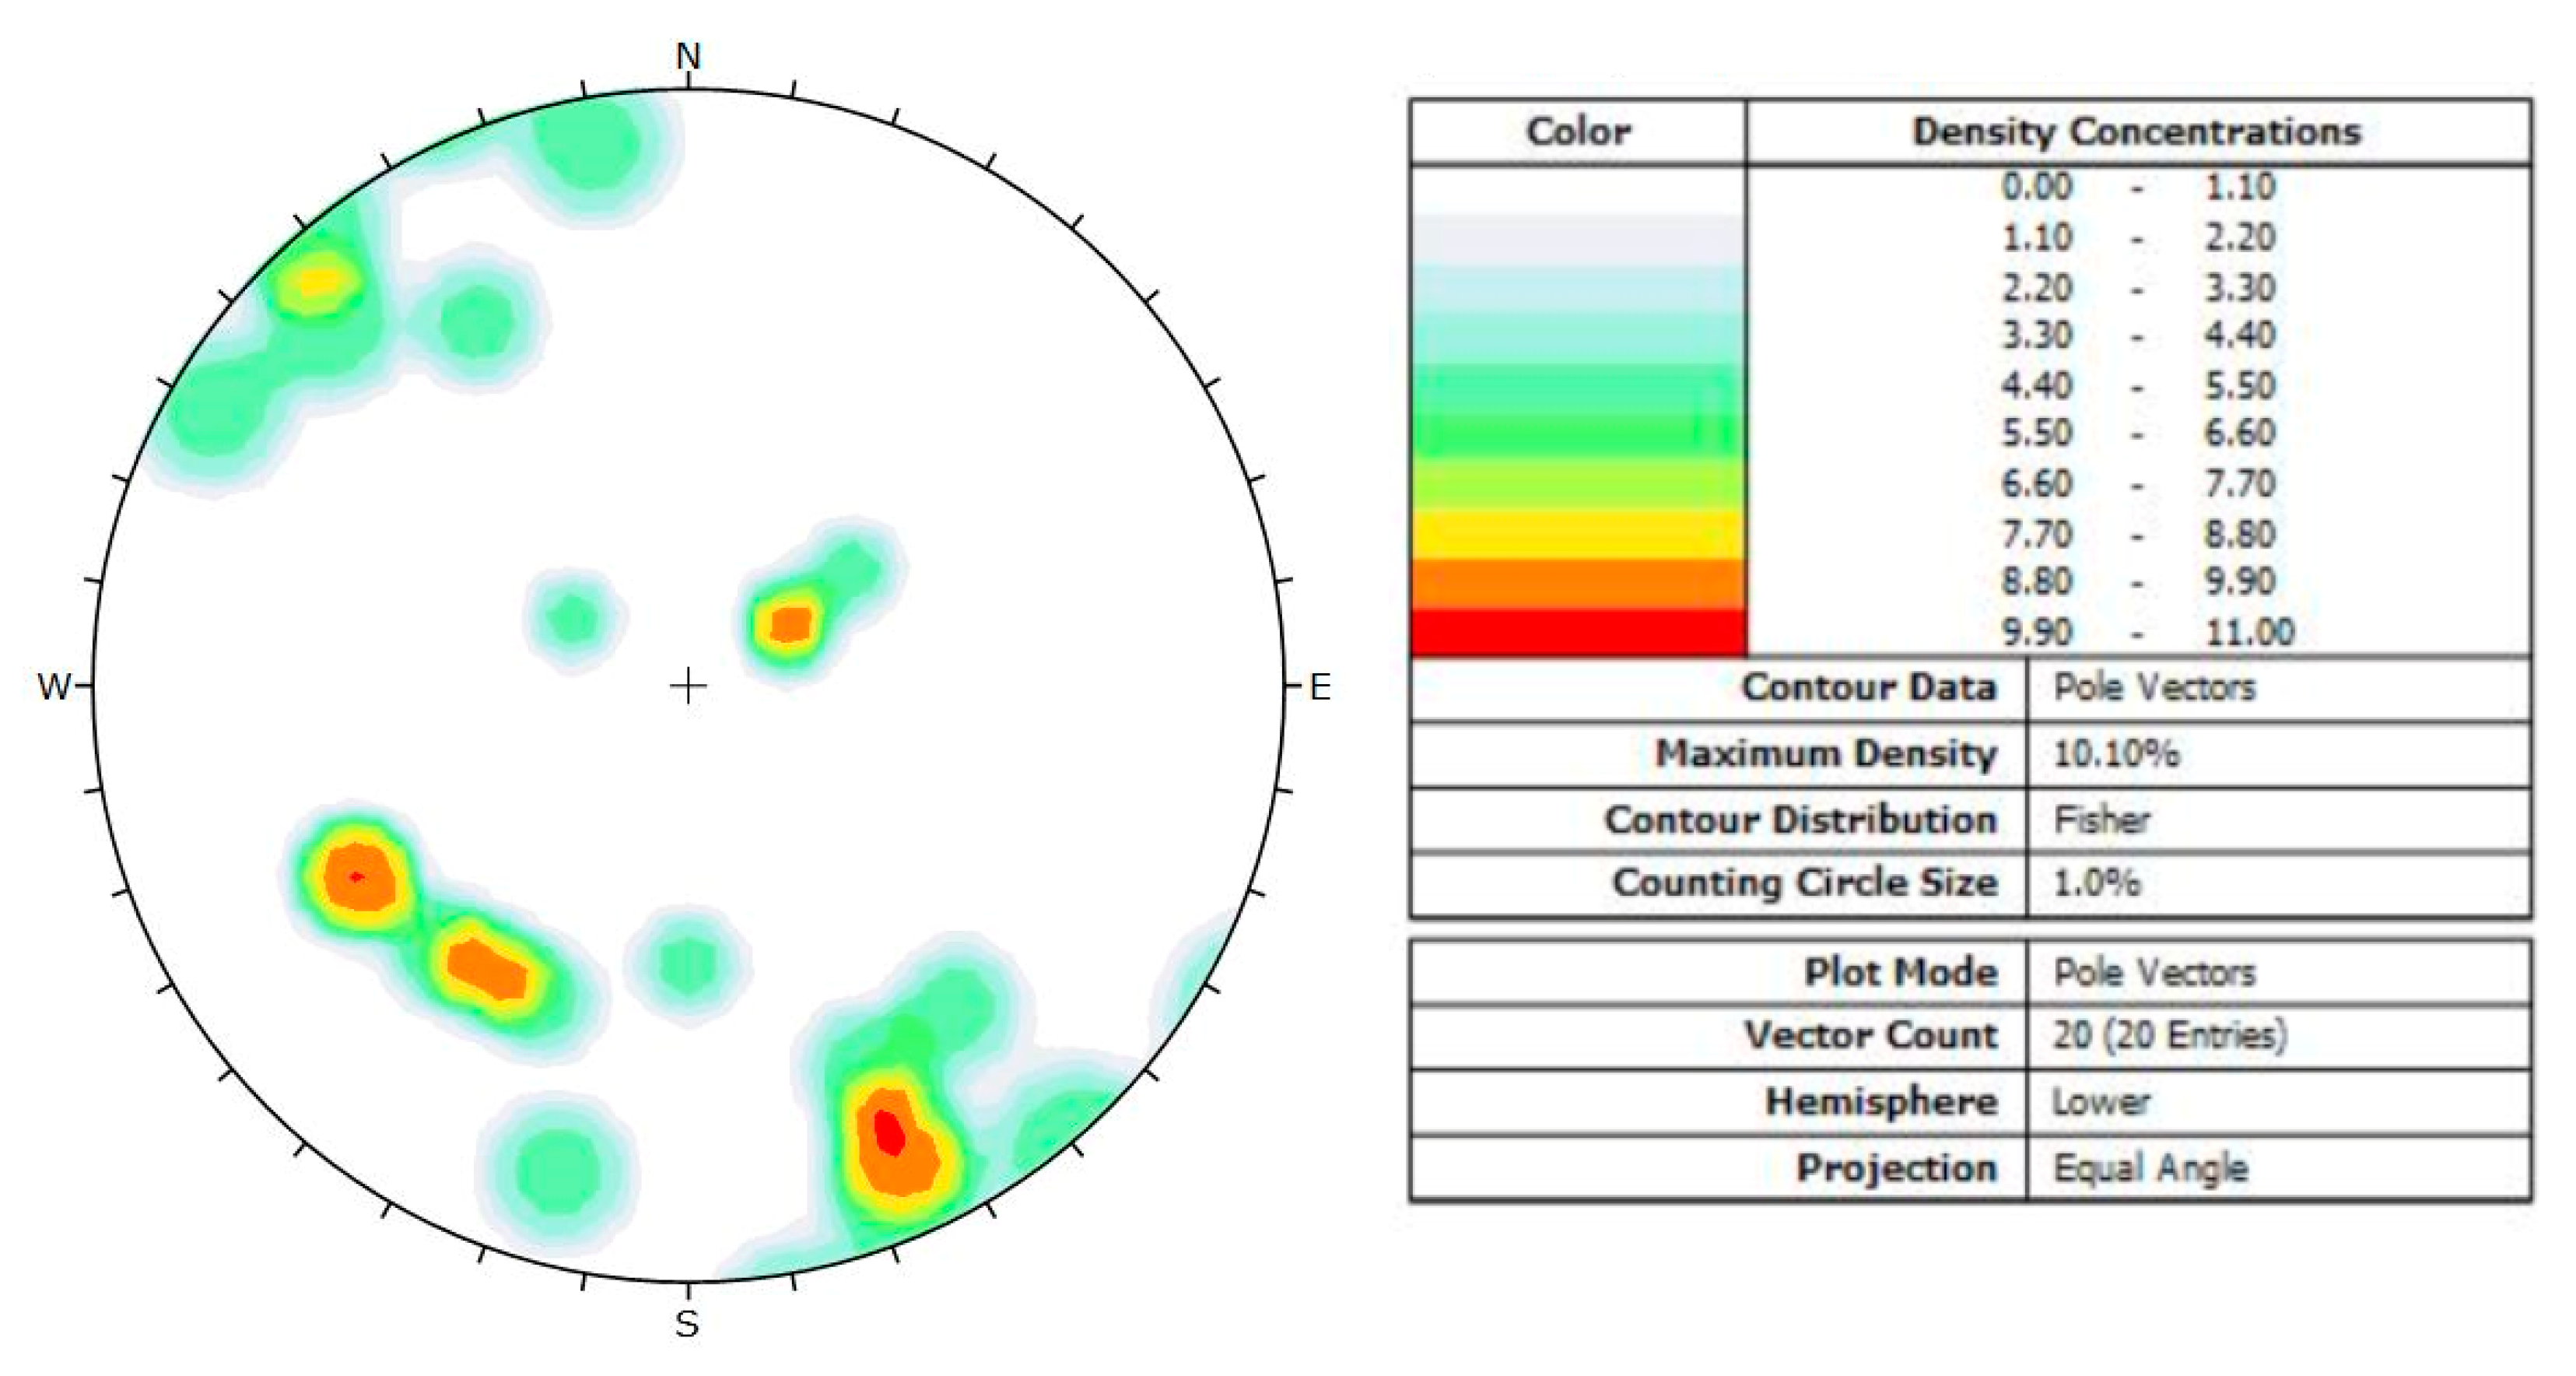
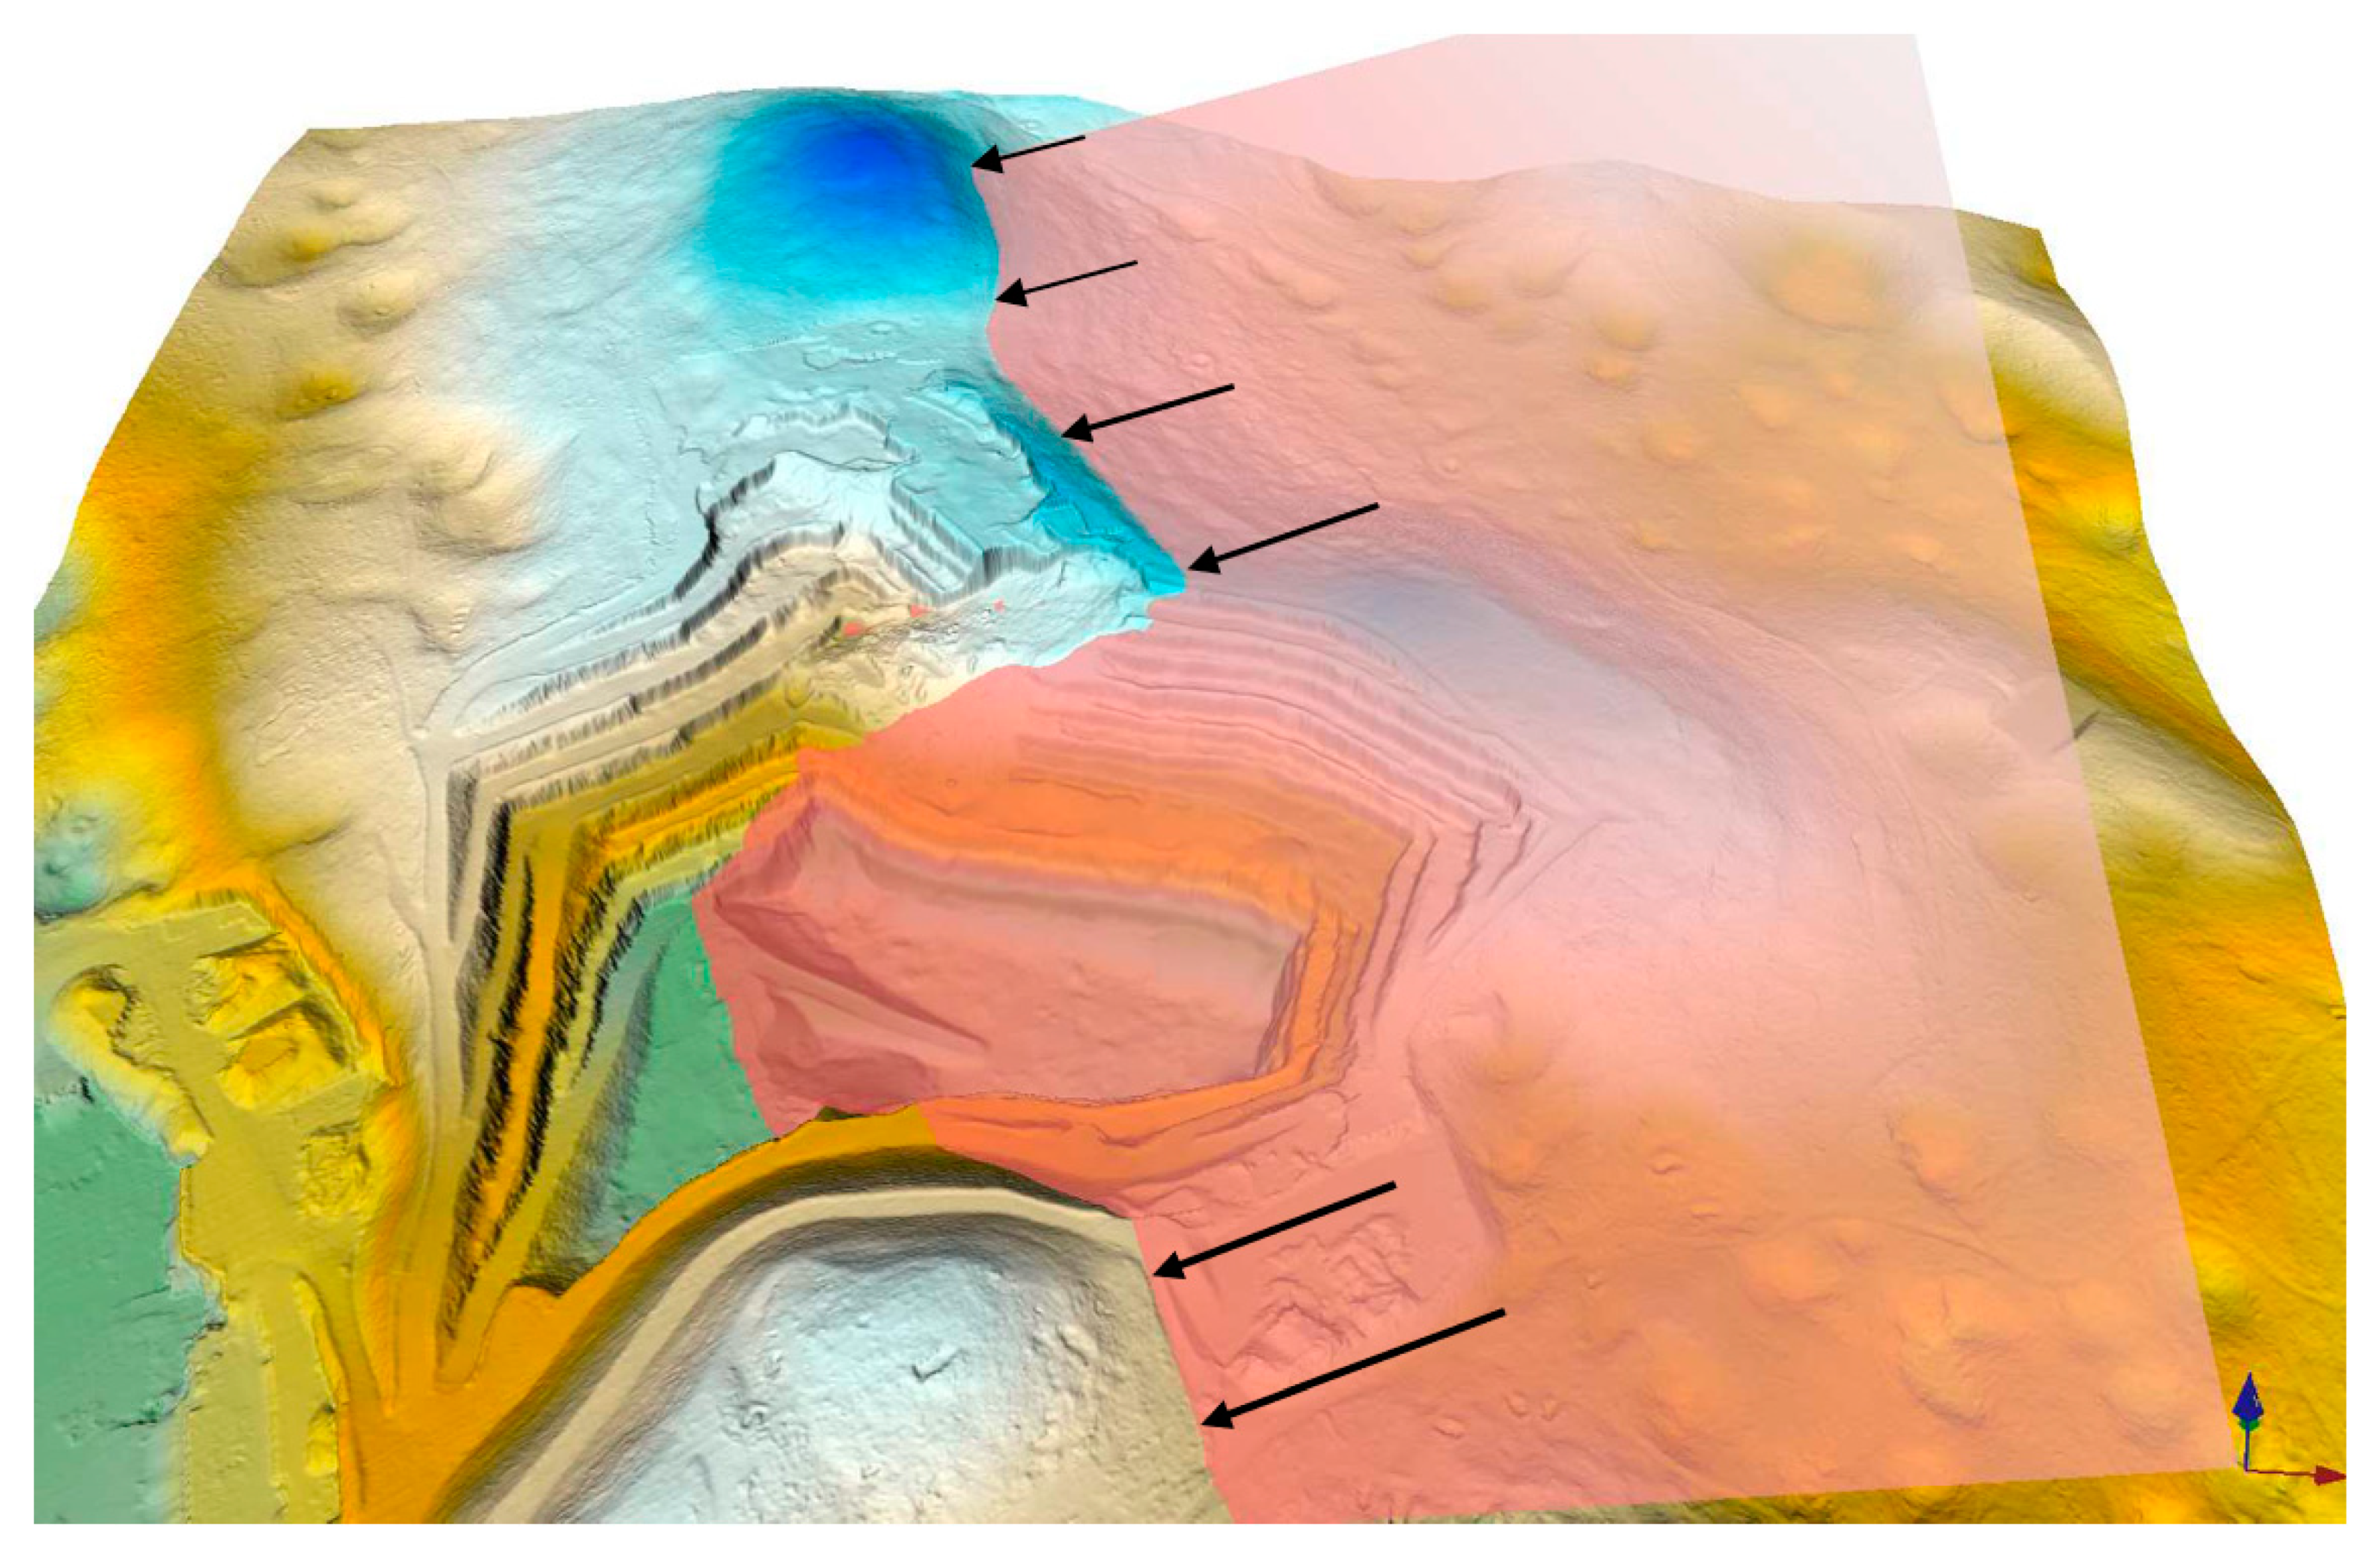
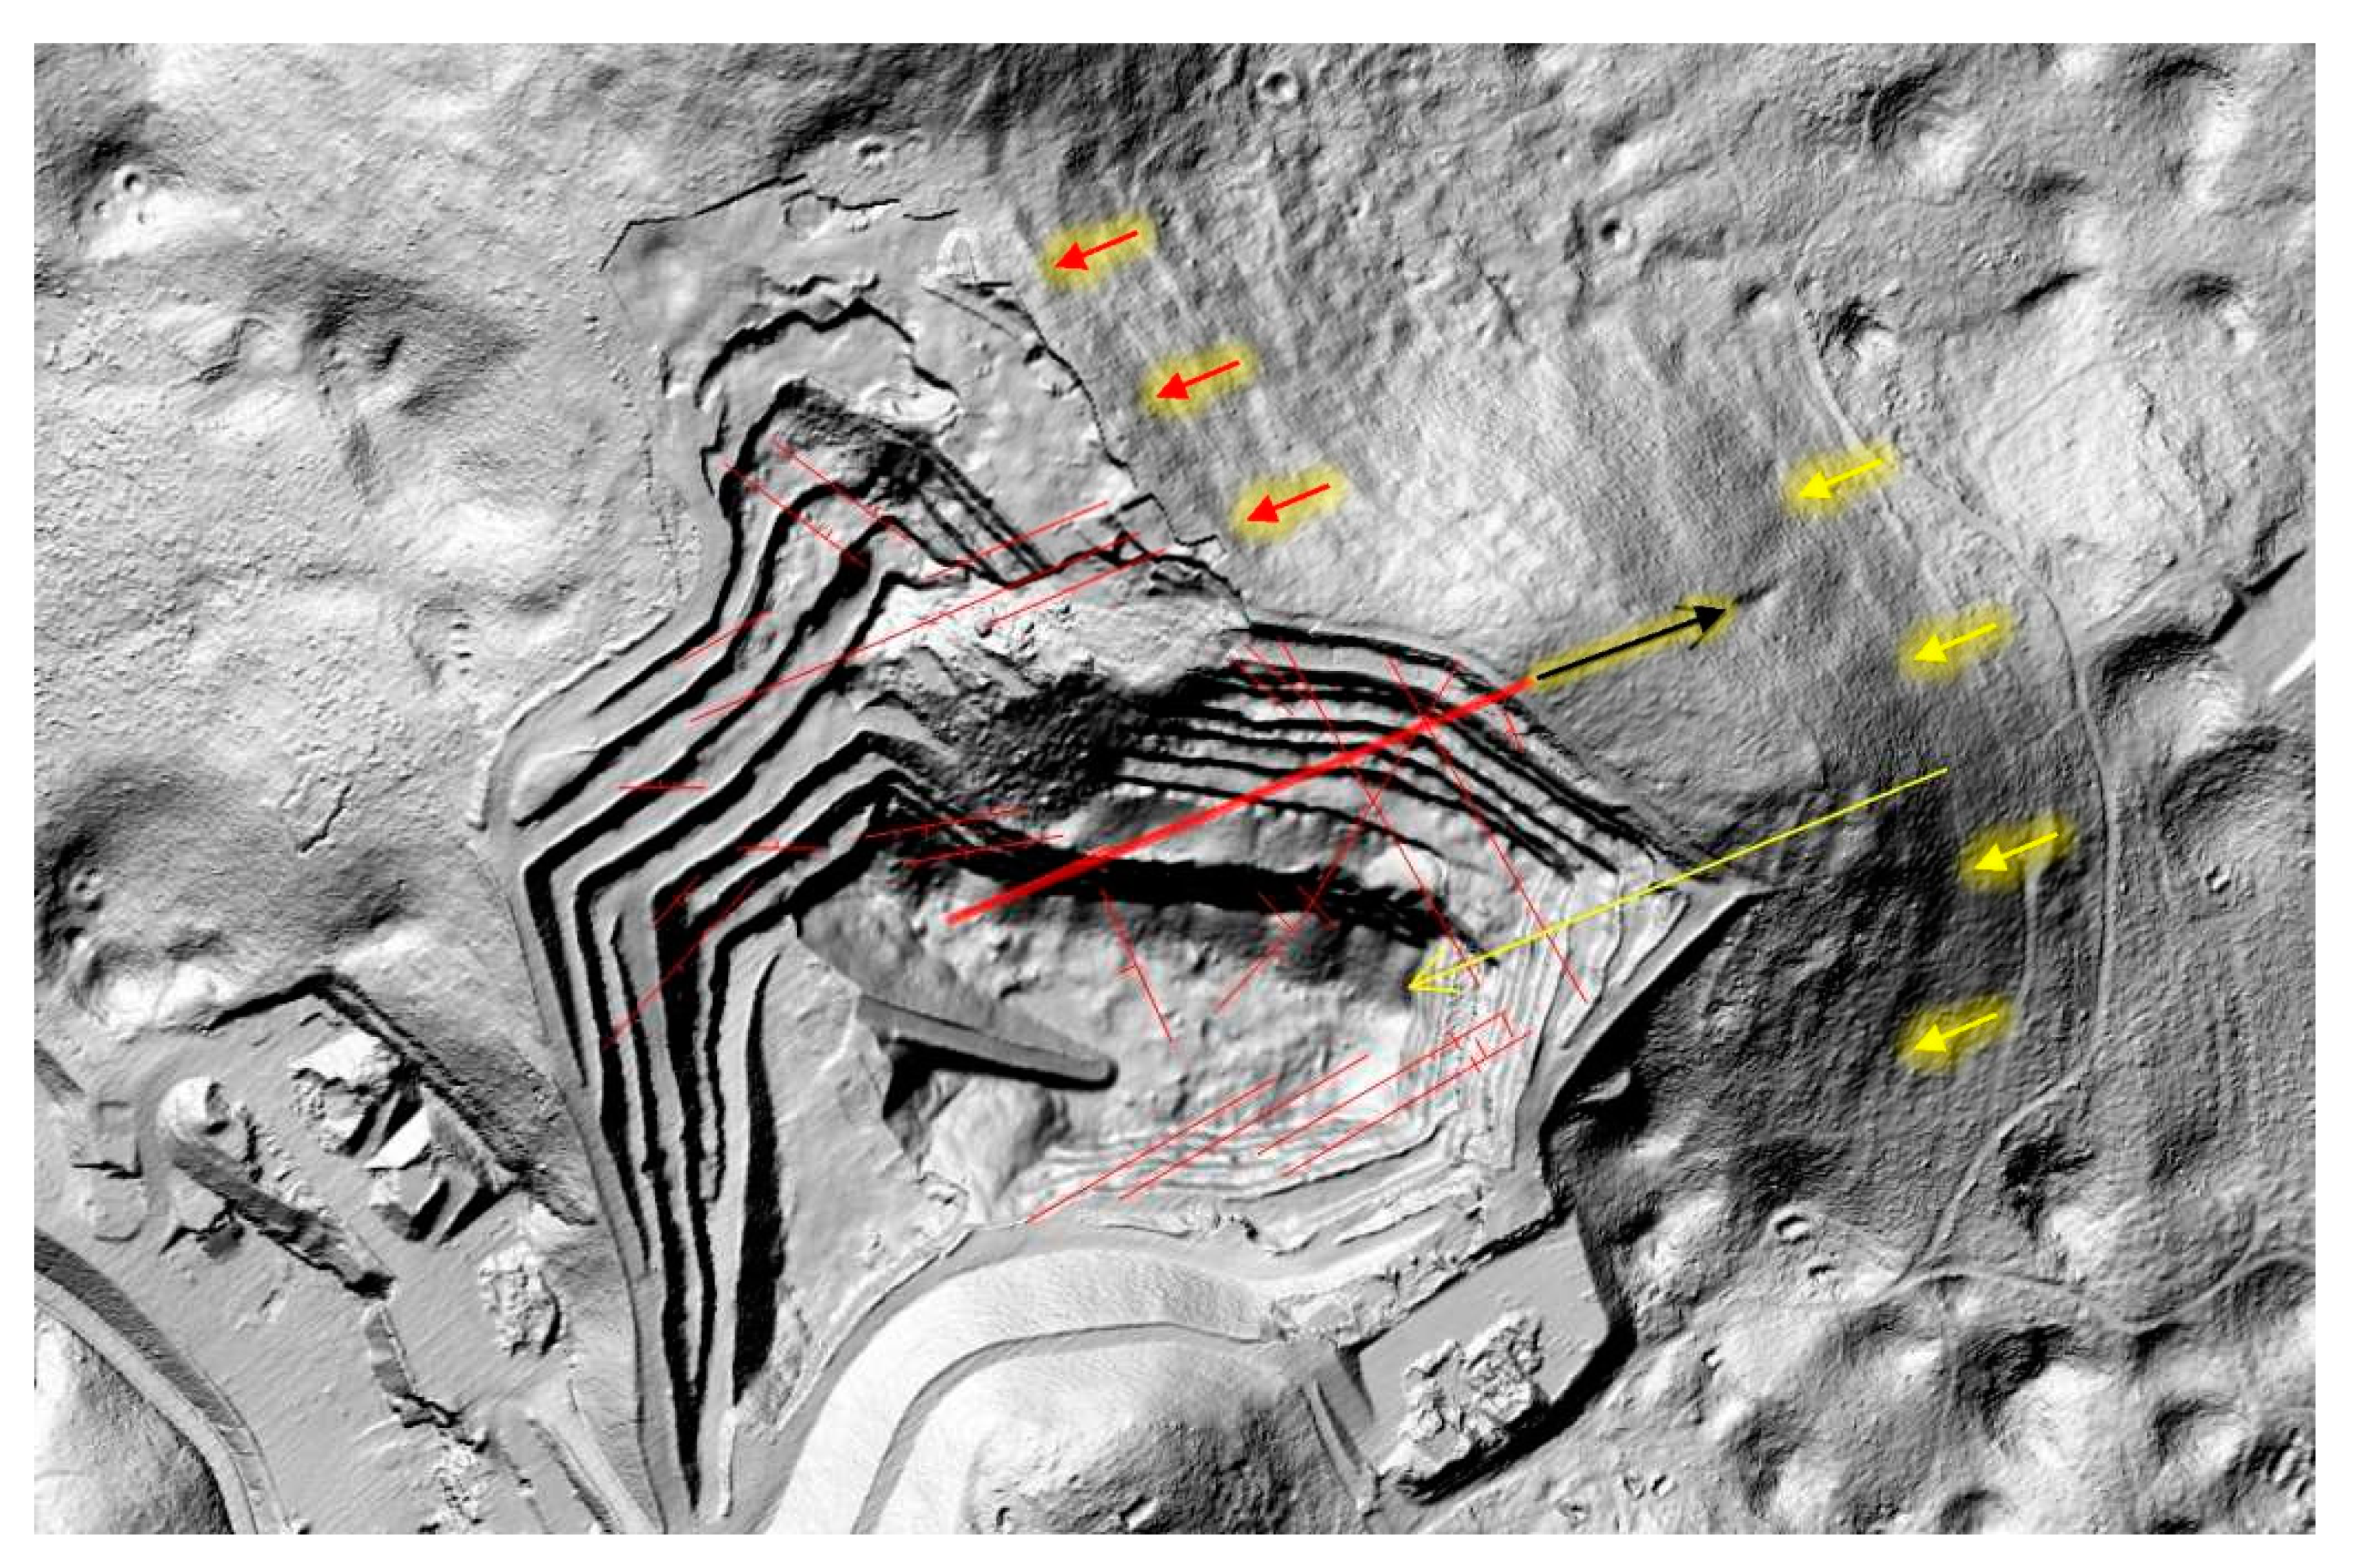
- Cracks facing southwest at 20°–40°. These included the major discontinuity due to the rockslide (245/21). This crack was perfectly straight and was the main crack (see Figure 2). This also included a crack that was parallel to the main crack (9.57 m), right above it. On the benches at 730 and 700 a.s.l., tension cracks spread from these benches to several other benches (234/23). In the eastern part of the quarry, the cracks were filled with calcite. Along these cracks, we noticed major sliding;
- Cracks perpendicular to the main crack system 40–60/60–65: these cracks occurred throughout the quarry and were clearly visible in the area of the rockslide;
- Vertical and subvertical cracks with a strike running from northeast–southwest;
- Other crack systems that did not belong to any of the above crack systems.
3.3. Structurally Connecting Tectonic Elements and Projections
4. Discussion
4.1. Laže Quarry Stability Assessment: Crack Projections
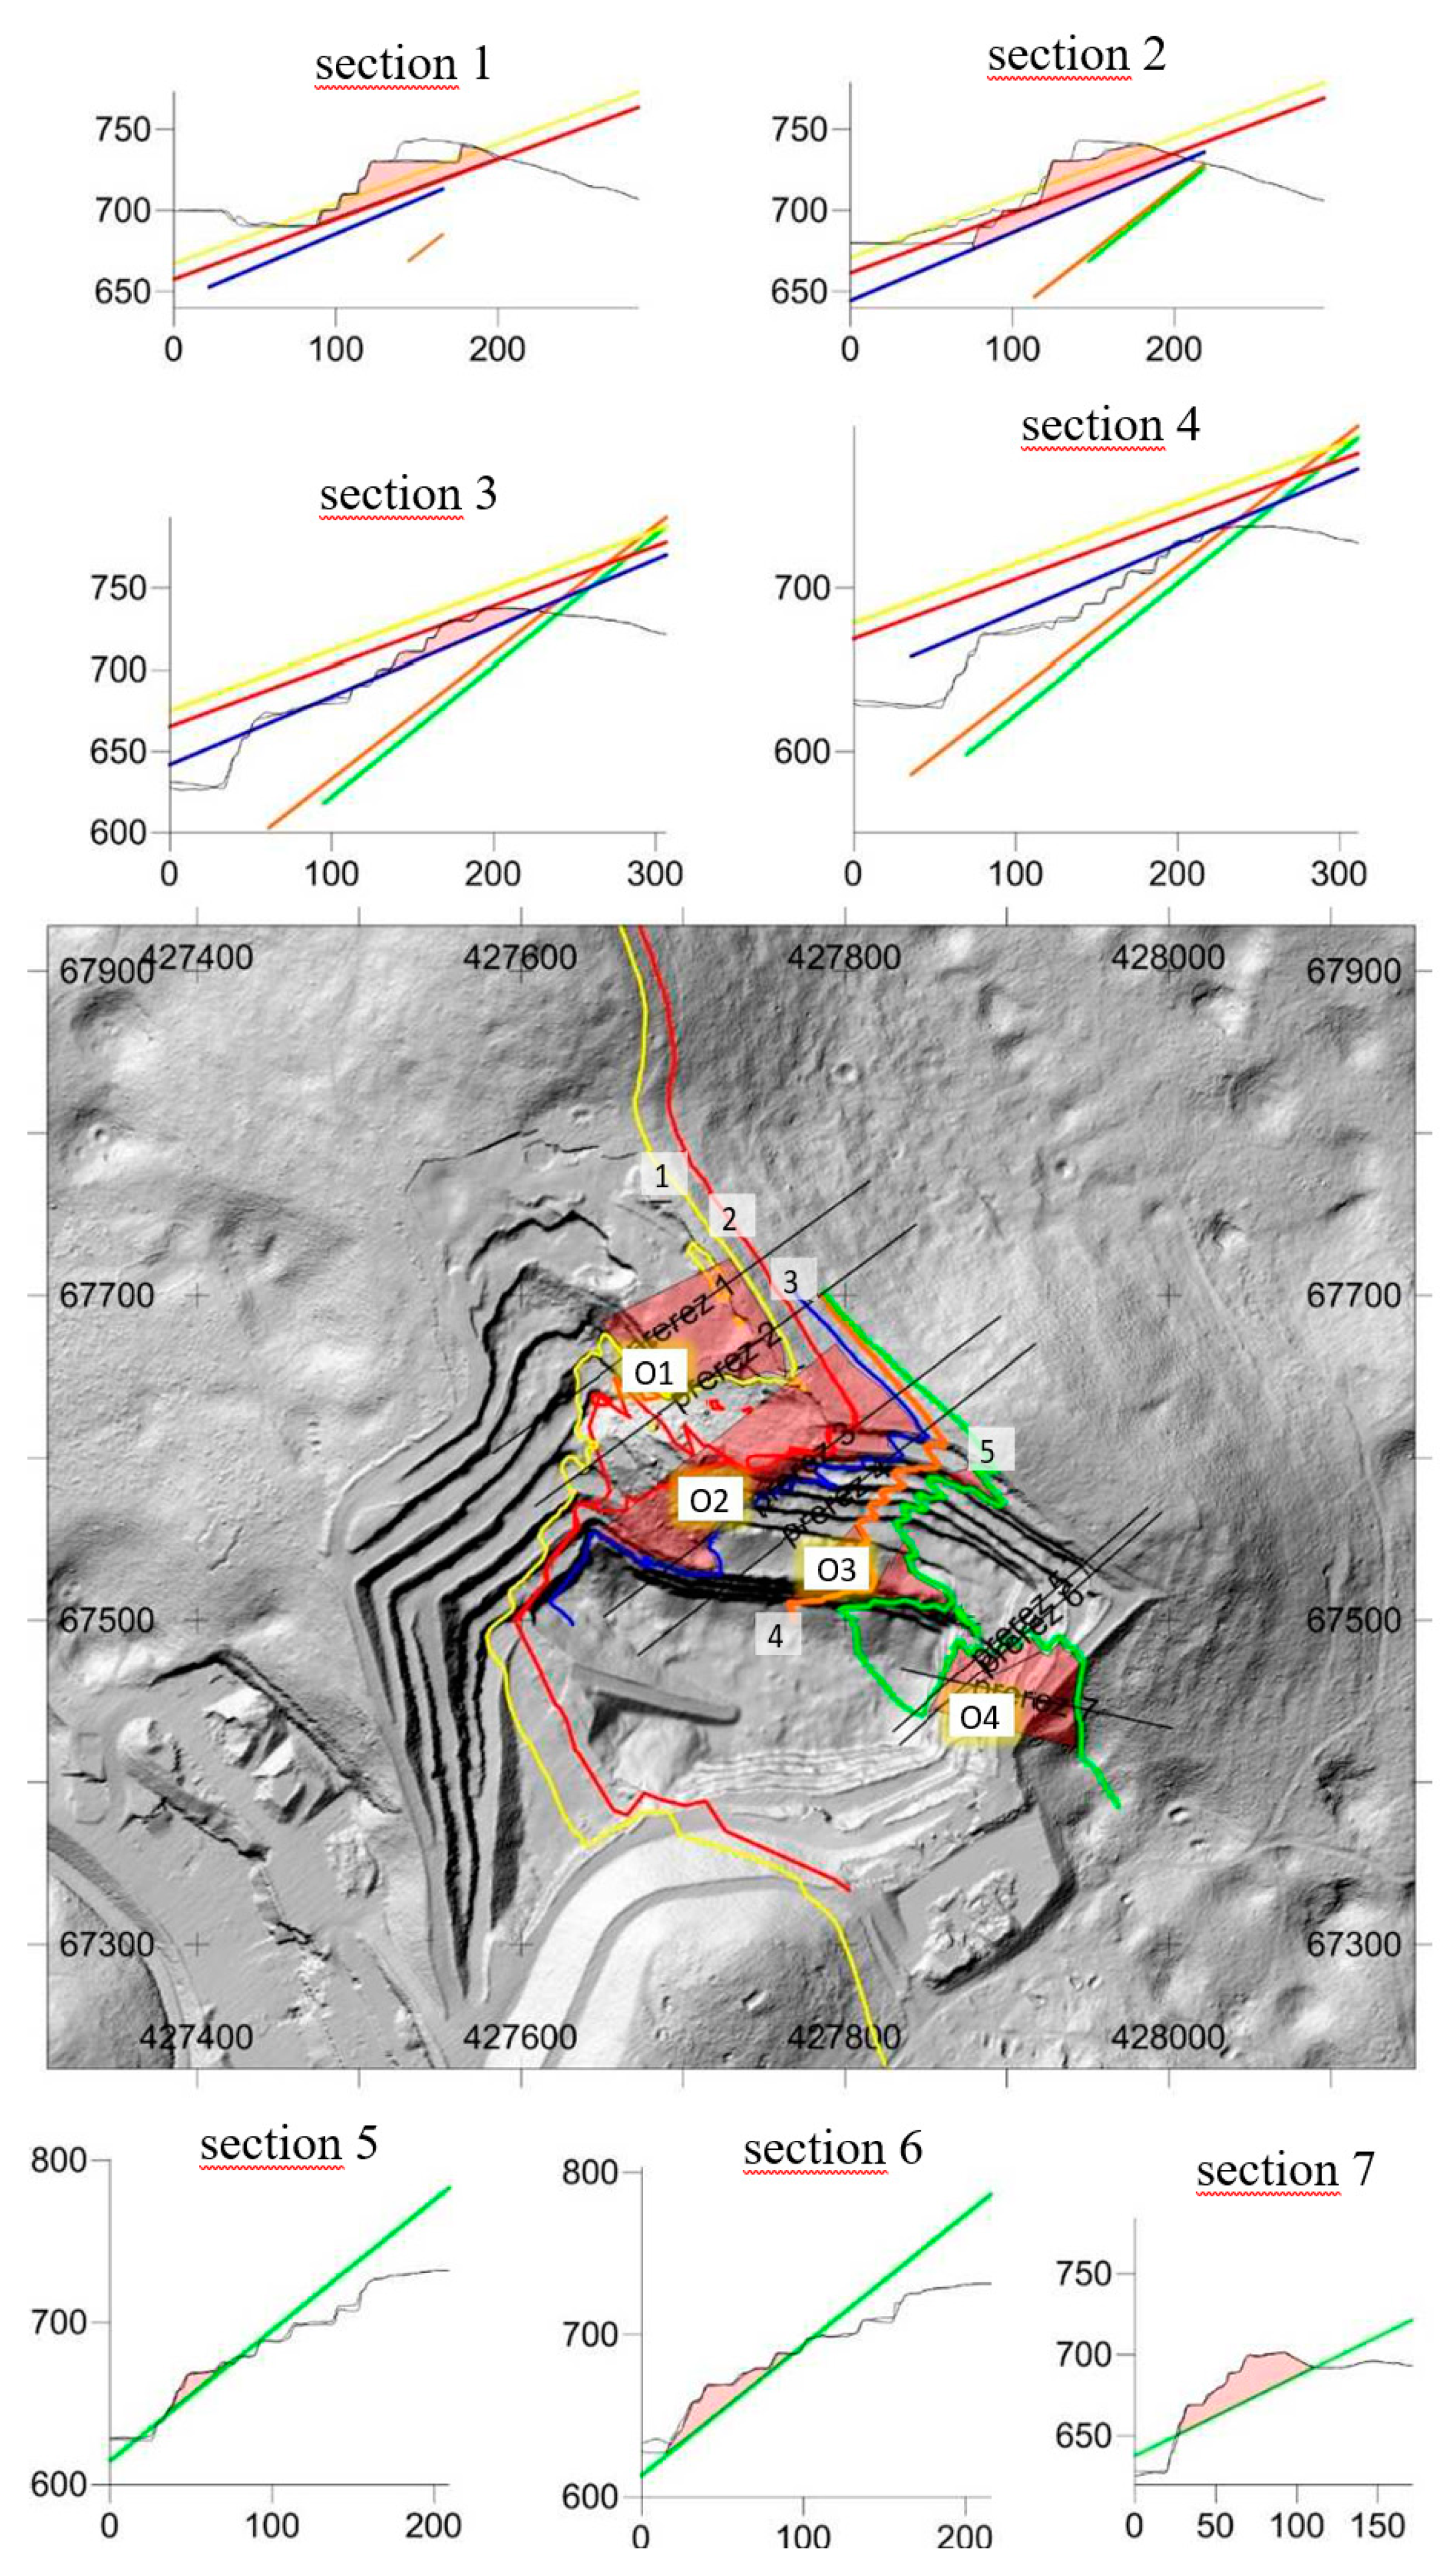
- A crack that was visible in the collapsed area in the vertical wall was parallel to the crack that led to the rockslide. It was 9.72 m away (height-wise) and is indicated as Number 1 (pictured in yellow) below;
- The crack that caused the collapse was by far the most susceptible to sliding. It was completely flat and extended over a large portion of the open quarry. We refer to it here as the main crack (Number 2, shown in red). This crack was clearly visible in surface anomalies;
- On the benches at 720 and 710 a.s.l., an intense crack from the same system was observed. It presented over several benches (234/23) and was clearly parallel to cracks a1 and a2 (Number 3, pictured in blue);
- A steeper crack that ran across multiple benches (235/37, pictured in orange, Number 4);
- In the eastern part of the quarry, on bench 680 (a.s.l.), more calcite-filled cracks were found (230/38). Along these cracks, the banks of the benches were falling off. The projections were dragged along the benches for analysis (pictured in green, Number 5).
- The first area, in the western part of the quarry, was due to cracks 1 and 2. One slide had already occurred at crack number 2, but the cracks were clearly still spreading westward in such a way that a similar situation could occur again. The likelihood of collapse is high;
- The second area was at crack number 3. This crack had the same free path as the first two cracks;
- The third area was by crack number 4, which had a larger vertical drop than the first three cracks did. The vertical crack, which was observed to run through all of the quarry benches on this slope, created a wedge between benches 680 and 622 (a.s.l.);
- The fourth area, which was in the eastern part of the quarry, had the same combination of cracks as did crack number 5 in area number 3.
4.2. Morphography and Surface Morphology
5. Conclusions
Author Contributions
Funding
Acknowledgments
Conflicts of Interest
References
- Dai, F.C.; Lee, C.F.; Ngai, Y.Y. Landslide risk assessment and management: An overview. Eng. Geol. 2002, 1, 65–87. [Google Scholar] [CrossRef]
- Đurović, B.; Ribičič, M.; Mikoš, M. RHDM postopek analize potencialne ogroženosti zaradiodlomne nevarnosti. Geologija 2005, 48, 33–51. [Google Scholar] [CrossRef]
- Capitani, M.; Ribolini, A.; Bini, M. The slope aspect: A predisposing factor for landsliding? C. R. Geosci. 2014, 345, 427–438. [Google Scholar] [CrossRef]
- Baillifard, F.; Jaboyedoff, M.; Sartori, M. Rockfall hazard mapping along a mountainous road in Switzerland using a GIS-based parameter rating approach. Nat. Hazards Earth Syst. Sci. 2003, 3, 431–438. [Google Scholar] [CrossRef]
- Tarchi, D.; Casagli, N.; Moretti, S.; Leva, D.; Sieber, A.J. Monitoring landslide displacements by using ground-based synthetic aperture radar interferometry: Application to the Ruinon landslide in the Italian Alps. J. Geophys. Res. 2003, 108, 88. [Google Scholar] [CrossRef]
- Antonello, G.; Casagli, N.; Farina, P.; Leva, D.; Nico, G.; Sieber, A.J.; Tarchi, D. Ground-based SAR interferometry for monitoring mass movements. Landslides 2004, 1, 21–28. [Google Scholar] [CrossRef]
- Haberler-Weber, M. Analysis and interpretation of geodetic landslide monitoring data based on fuzzy systems. Nat. Hazards Earth Syst. Sci. 2005, 5, 755–760. [Google Scholar] [CrossRef]
- Dewitte, O.; Jasselette, J.C.; Cornet, Y.; Van Den Eeckhaut, M.; Collignon, A.; Poesen, J.; Demoulin, A. Tracking landslide displacements by multi-temporal DTMs: A combined aerial stereophotogrammetric and LIDAR approach in western Belgium. Eng. Geol. 2008, 99, 11–22. [Google Scholar] [CrossRef]
- Stumpf, A.; Malet, J.P.; Kerle, N.; Niethammer, U.; Rothmund, S. Image-based mapping of surface fissures for the investigation of landslide dynamics. Geomorphology 2013, 186, 12–27. [Google Scholar] [CrossRef]
- Bardi, F.; Frodella, W.; Ciampalini, A.; Bianchini, S.; Del Ventisette, C.; Gigli, G.; Fanti, R.; Moretti, S.; Basile, G.; Casagli, N. Integration between ground based and satellite SAR data in landslide mapping: The San Fratello case study. Geomorphology 2014, 223, 45–60. [Google Scholar] [CrossRef]
- Scaioni, M.; Longoni, L.; Melillo, V.; Papini, M. Remote Sensing for Landslide Investigations: An Overview of Recent Achievements and Perspectives. Remote Sens. 2014, 6, 9600–9652. [Google Scholar] [CrossRef]
- Peternel, T.; Kumelj, Š.; Oštir, K.; Komac, M. Monitoring the Potoška planina landslide (NW Slovenia) using UAV photogrammetry and tachymetric measurements. Landslides 2017, 14, 395–406. [Google Scholar] [CrossRef]
- Harwin, S.; Lucieer, A. Assessing the Accuracy of Georeferenced Point Clouds Produced via Multi-View Stereopsis from Unmanned Aerial Vehicle (UAV) Imagery. Remote Sens. 2012, 4, 1573–1599. [Google Scholar] [CrossRef]
- Scholtz, A.; Kaschwich, C.; Krüger, A.; Kufieta, K.; Schnetter, P.; Wilkens, C.-S.; Krüger, T.; Vörsmann, P. Developement of a new multi-purpose UAS for scientific application. ISPRS Int. Arch. Photogramm. Remote Sens. Spat. Inf. Sci. 2012, XXXVIII-1/C22, 149–154. [Google Scholar] [CrossRef]
- Nex, F.; Remondino, F. UAV for 3D mapping applications: A review. Appl. Geomat. 2014, 6, 1–15. [Google Scholar] [CrossRef]
- Colomina, I.; Molina, P. Unmanned aerial systems for photogrammetry and remote sensing: A review. ISPRS J. Photogramm. Remote Sens. 2014, 92, 79–97. [Google Scholar] [CrossRef]
- Chen, J.; Dowman, I.; Li, S.; Li, Z.; Madden, M.; Mills, J.; Paparoditis, N.; Rottensteiner, F.; Sester, M.; Toth, C.; et al. Information from imagery: ISPRS scientific vision and research agenda. ISPRS J. Photogramm. Remote Sens. 2016, 115, 3–21. [Google Scholar] [CrossRef]
- Comba, L.; Biglia, A.; Ricauda Aimonino, D.; Gay, P. Unsupervised detection of vineyards by 3D point-cloud UAV photogrammetry for precision agriculture. Comput. Electron. Agric. 2018, 155, 84–95. [Google Scholar] [CrossRef]
- Török, Á.; Bögöly, G.; Somogyi, Á.; Lovas, T. Application of UAV in Topographic Modelling and Structural Geological Mapping of Quarries and Their Surroundings—Delineation of Fault-Bordered Raw Material Reserves. Sensors 2020, 2, 489. [Google Scholar] [CrossRef]
- Fritz, A.; Kattenborn, T.; Koch, B. UAV-based photogrammetric point clouds-tree stem mapping in open stands in comparison to terrestrial laser scanner point clouds. ISPRS Int. Arch. Photogramm. Remote Sens. Spat. Inf. Sci. 2013, XL-1/W2, 141–146. [Google Scholar] [CrossRef]
- Margottini, C.; Antidze, N.; Corominas, J.; Crosta, G.B.; Frattini, P.; Gigli, G.; Giordan, D.; Iwasaky, I.; Lollino, G.; Manconi, A.; et al. Landslide hazard, monitoring and conservation strategy for the safeguard of Vardzia Byzantine monastery complex, Georgia. Landslides 2015, 12, 193–204. [Google Scholar] [CrossRef][Green Version]
- Boccardo, P.; Chiabrando, F.; Dutto, F.; Tonolo, F.; Lingua, A. UAV Deployment Exercise for Mapping Purposes: Evaluation of Emergency Response Applications. Sensors 2015, 15, 15717–15737. [Google Scholar] [CrossRef] [PubMed]
- Campana, S. Drones in Archaeology. State-of-the-art and Future Perspectives: Drones in Archaeology. Archaeol. Prospect. 2017, 24, 275–296. [Google Scholar] [CrossRef]
- Ong, W.; Chiu, W.; Kuen, T.; Kodikara, J. Determination of the State of Strain of Large Floating Covers Using Unmanned Aerial Vehicle (UAV) Aided Photogrammetry. Sensors 2017, 17, 1731. [Google Scholar] [CrossRef]
- Agüera-Vega, F.; Carvajal-Ramírez, F.; Martínez-Carricondo, P.; Sánchez-Hermosilla López, J.; Mesas-Carrascosa, F.J.; García-Ferrer, A.; Pérez-Porras, F.J. Reconstruction of extreme topography from UAV structure from motion photogrammetry. Measurement 2018, 121, 127–138. [Google Scholar] [CrossRef]
- Cappelletti, C.; Boniardi, M.; Casaroli, A.; De Gaetani, C.I.; Passoni, D.; Pinto, L. Forensic engineering surverys with UAV photogrammetry and laser scanning techniques. ISPRS Int. Arch. Photogramm. Remote Sens. Spat. Inf. Sci. 2019, XLII-2/W9, 227–234. [Google Scholar] [CrossRef]
- Escobar Villanueva, J.R.; Iglesias Martínez, L.; Pérez Montiel, J.I. DEM Generation from Fixed-Wing UAV Imaging and LiDAR-Derived Ground Control Points for Flood Estimations. Sensors 2019, 19, 3205. [Google Scholar] [CrossRef]
- D’Oleire-Oltmanns, S.; Marzolff, I.; Klaus, D.P.; Ries, B.J. Unmanned Aerial Vehicle (UAV) for Monitoring Soil Erosion in Morocco. Remote Sens. 2012, 11, 3390–3416. [Google Scholar] [CrossRef]
- Nex, F.; Rupnik, E.; Toschi, I.; Remondino, F. Automated processing of high resolution airborne images for earthquake damage assessment. ISPRS Int. Arch. Photogramm. Remote Sens. Spat. Inf. Sci. 2014, XL–1, 315–321. [Google Scholar] [CrossRef]
- Niedzielski, T.; Witek, M.; Spallek, W. Observing river stages using unmanned aerial vehicles. Hydrol. Earth Syst. Sci. 2016, 20, 3193–3205. [Google Scholar] [CrossRef]
- Neugirg, F.; Stark, M.; Kaiser, A.; Vlacilova, M.; Della Seta, M.; Vergari, F.; Schmidt, J.; Becht, M.; Haas, F. Erosion processes in calanchi in the Upper Orcia Valley, Southern Tuscany, Italy based on multitemporal high-resolution terrestrial LiDAR and UAV surveys. Geomorphology 2016, 269, 8–22. [Google Scholar] [CrossRef]
- Langhammer, J.; Lendzioch, T.; Miˇrijovský, J.; Hartvich, F. UAV-Based Optical Granulometry as Tool for Detecting Changes in Structure of Flood Depositions. Remote Sens. 2017, 9, 240. [Google Scholar] [CrossRef]
- Langhammer, J. UAV Monitoring of Stream Restorations. Hydrology 2019, 6, 29. [Google Scholar] [CrossRef]
- Dering, G.M.; Micklethwaite, S.; Thiele, S.T.; Vollgger, S.A.; Cruden, A.R. Review of drones, photogrammetry and emerging sensor technology for the study of dykes: Best practises and future potential. J. Volcanol. Geotherm. Res. 2019, 373, 148–166. [Google Scholar] [CrossRef]
- Shahbazi, M.; Sohn, G.; Théau, J.; Menard, P. Development and Evaluation of a UAV-Photogrammetry System for Precise 3D Environmental Modeling. Sensors 2015, 15, 27493–27524. [Google Scholar] [CrossRef]
- Zekkos, D.; Greenwood, W.; Lynch, J.; Manousakis, J.; Athanasopoulos-Zekkos, A.; Clark, M.; Saroglou, C. Lessons Learned from The Application of UAV-Enabled Structure-From-Motion Photogrammetry in Geotechnical Engineering. Int. J. Geoeng. Case Hist. 2018, 4, 254–274. [Google Scholar] [CrossRef]
- Francioni, M.; Salvini, R.; Stead, D.; Litrico, S. A case study integrating remote sensing and distinct element analysis to quarry slope stability assessment in the Monte Altissimo area, Italy. Eng. Geol. 2014, 183, 290–302. [Google Scholar] [CrossRef]
- Tannant, D. Review of Photogrammetry-Based Techniques for Characterization and Hazard Assessment of Rock Faces. Int. J. Geohazards Environ. 2015, 1, 76–87. [Google Scholar] [CrossRef]
- Tannant, D.; Giordan, D.; Morgenroth, J. Characterization and analysis of a translational rockslide on a stepped-planar slip surface. Eng. Geol. 2017, 220, 144–151. [Google Scholar] [CrossRef]
- Török, Á.; Barsi, Á.; Bögöly, G.; Lovas, T.; Somogyi, Á.; Görög, P. Slope stability and rockfall assessment of volcanic tuffs using RPAS with 2-D FEM slope modelling. Nat. Hazards Earth Syst. Sci. 2018, 18, 583–597. [Google Scholar] [CrossRef]
- Bartolo, S.D.; Salvini, R. Multitemporal Terrestrial Laser Scanning for Marble Extraction Assessment in an Underground Quarry of the Apuan Alps (Italy). Sensors 2019, 19, 450. [Google Scholar] [CrossRef] [PubMed]
- Giordan, D.; Allasia, P.; Dematteis, N.; Dell’Anese, F.; Vagliasindi, M.; Motta, E. A Low-Cost Optical Remote Sensing Application for Glacier Deformation Monitoring in an Alpine Environment. Sensors 2016, 16, 1750. [Google Scholar] [CrossRef] [PubMed]
- Giordan, D.; Hayakawa, Y.; Nex, F.; Remondino, F.; Tarolli, P. Review article: The use of remotely piloted aircraft systems (RPASs) for natural hazards monitoring and management. Nat. Hazards Earth Syst. Sci. 2018, 18, 1079–1096. [Google Scholar] [CrossRef]
- Mancini, F.; Dubbini, M.; Gattelli, M.; Stecchi, F.; Fabbri, S.; Gabbianelli, G. Using Unmanned Aerial Vehicles (UAV) for High-Resolution Reconstruction of Topography: The Structure from Motion Approach on Coastal Environments. Remote Sens. 2013, 5, 6880–6898. [Google Scholar] [CrossRef]
- Saroglou, C.; Kallimogiannis, V.; Bar, N.; Manousakis, G.; Zekkos, D. Analysis of slope instabilities in the Corinth Canal using UAV-enabled mapping. In Proceedings of the ICONHIC 2nd International Conference on Natural Hazards & Infrastructure, Chania, Greece, 23–26 June 2019. [Google Scholar]
- Salvini, R.; Mastrorocco, G.; Seddaiu, M.; Rossi, D.; Vanneschi, C. The use of an unmanned aerial vehicle for fracture mapping within a marble quarry (Carrara, Italy): Photogrammetry and discrete fracture network modelling. Geomat. Nat. Hazards Risk 2017, 8, 34–52. [Google Scholar] [CrossRef]
- Martin, P.G.; Payton, O.D.; Fardoulis, J.S.; Richards, D.A.; Scott, T.B. The use of unmanned aerial systems for the mapping of legacy uranium mines. J. Environ. Radioact. 2015, 143, 135–140. [Google Scholar] [CrossRef]
- Török, Á. Controls on development of Mid-Triassic ramps: Examples from southern Hungary. Geol. Soc. Lond. Spec. Publ. 1998, 149, 339–367. [Google Scholar] [CrossRef]
- Götz, A.E.; Török, Á. Correlation of Tethyan and Peri-Tethyan long-term and high-frequency eustatic signals (Anisian, Middle Triassic). Geol. Carpathica 2008, 59, 307–317. [Google Scholar]
- Kenner, R.; Bühler, Y.; Delaloye, R.; Ginzler, C.; Phillips, M. Monitoring of high alpine mass movements combining laser scanning with digital airborne photogrammetry. Geomorphology 2014, 206, 492–504. [Google Scholar] [CrossRef]
- Gao, M.; Xu, X.; Klinger, Y.; van der Woerd, J.; Tapponnier, P. High-resolution mapping based on an Unmanned Aerial Vehicle (UAV) to capture paleoseismic o sets along the Altyn-Tagh fault, China. Sci. Rep. 2017, 7, 8281. [Google Scholar] [CrossRef]
- Menegoni, N.; Meisina, C.; Perotti, C.; Crozi, M. Analysis by UAV Digital Photogrammetry of Folds and Related Fractures in the Monte Antola Flysch Formation (Ponte Organasco, Italy). Geosciences 2018, 8, 299. [Google Scholar] [CrossRef]
- Sayab, M.; Aerden, D.; Paananen, M.; Saarela, P. Virtual Structural Analysis of Jokisivu Open Pit Using ‘Structure-from-Motion’ Unmanned Aerial Vehicles (UAV) Photogrammetry: Implications for Structurally-Controlled Gold Deposits in Southwest Finland. Remote Sens. 2018, 10, 1296. [Google Scholar] [CrossRef]
- Michoud, C.; Abellan, A.; Derron, M.H.; Jaboyedoff, M. Review of techniques for landslide detection, fast characterization, rapid mapping and long-term monitoring. In SafeLand Deliverable 4.1 (7th Framework Programme); Lausanne, Université de Lausanne (UNIL), Institut de Géomatique at d’Analyse du Risque: Lausanne, Switzerland, 2012. [Google Scholar]
- Pappalardo, G.; Mineo, S.; Rapisarda, F. Rockfall hazard assessment along a road on the Peloritani Mountains (northeastern Sicily, Italy). Nat. Hazards Earth Syst. Sci. 2014, 14, 2735–2748. [Google Scholar] [CrossRef]
- Götz, A.E.; Török, Á. Muschelkalk Ramp Cycles Revisited. In Stratigraphy & Timescales; Elsevier: Amsterdam, The Netherlands, 2018; Volume 3, pp. 265–284. ISBN 978-0-12-815098-6. [Google Scholar] [CrossRef]
- Mazzanti, P.; Schilirò, L.; Martino, S.; Antonielli, B.; Brizi, E.; Brunetti, A.; Margottini, C.; Scarascia Mugnozza, G. The Contribution of Terrestrial Laser Scanning to the Analysis of Cliff Slope Stability in Sugano (Central Italy). Remote Sens. 2018, 10, 1475. [Google Scholar] [CrossRef]
- Vanneschi, C.; Di Camillo, M.; Aiello, E.; Bonciani, F.; Salvini, R. SfM-MVS Photogrammetry for Rockfall Analysis and Hazard Assessment Along the Ancient Roman Via Flaminia Road at the Furlo Gorge (Italy). ISPRS Int. J. Geo-Inf. 2019, 8, 325. [Google Scholar] [CrossRef]
- Environmental atlas of Slovenia, Slovenian Environment Agency (ARSO). 2019. Available online: http://gis.arso.gov.si/atlasokolja (accessed on 23 September 2019).
- Pleničar, M.; Buserr, S.; Grad, K. Tolmač osnovne geološke karte SFRJ 1:100.000, list Postojna. Official geological map of Slovenia, sheet Postojna. 1963. Zvezni geološki zavod, Beograd, 62 pg. Available online: https://biotit.geo-zs.si/ogk100/ (accessed on 23 September 2019).
- Bieniawski, Z.T. Rock Mechanics Design in Mining and Tunneling; Balkema, A.A., Ed.; Springer: Berlin/Heidelberg, Germany, 1984; p. 272. [Google Scholar]
- Wyllie, D.C.; Mah, C.W. Rock Slope Engineering: Civil and Mining, 4th ed.; Spoon Press: London, UK; New York, NY, USA, 2001; p. 456. [Google Scholar]
- Hoek, E. Practical Rock Engineering; Institution of Mining and Metallurgy: London, UK, 2002; p. 325. [Google Scholar]


© 2020 by the authors. Licensee MDPI, Basel, Switzerland. This article is an open access article distributed under the terms and conditions of the Creative Commons Attribution (CC BY) license (http://creativecommons.org/licenses/by/4.0/).
Share and Cite
Lazar, A.; Vižintin, G.; Beguš, T.; Vulić, M. The Use of Precise Survey Techniques to Find the Connection between Discontinuities and Surface Morphologic Features in the Laže Quarry in Slovenia. Minerals 2020, 10, 326. https://doi.org/10.3390/min10040326
Lazar A, Vižintin G, Beguš T, Vulić M. The Use of Precise Survey Techniques to Find the Connection between Discontinuities and Surface Morphologic Features in the Laže Quarry in Slovenia. Minerals. 2020; 10(4):326. https://doi.org/10.3390/min10040326
Chicago/Turabian StyleLazar, Aleš, Goran Vižintin, Tomaž Beguš, and Milivoj Vulić. 2020. "The Use of Precise Survey Techniques to Find the Connection between Discontinuities and Surface Morphologic Features in the Laže Quarry in Slovenia" Minerals 10, no. 4: 326. https://doi.org/10.3390/min10040326
APA StyleLazar, A., Vižintin, G., Beguš, T., & Vulić, M. (2020). The Use of Precise Survey Techniques to Find the Connection between Discontinuities and Surface Morphologic Features in the Laže Quarry in Slovenia. Minerals, 10(4), 326. https://doi.org/10.3390/min10040326


