Article

Low-Temperature Crystal Chemistry of Hingganite-(Y), from the Wanni Glacier, Switzerland

by
Liudmila Gorelova
1,*,
Oleg Vereshchagin
1,
Stéphane Cuchet
2,
Vladimir Shilovskikh
3 and
Dmitrii Pankin
4
1
Institute of Earth Sciences, Saint-Petersburg State University, University Emb. 7/9, 199034 St. Petersburg, Russia
2
ch. des Bruyères 14, CH-1007 Lausanne, Switzerland
3
Geomodel Resource Center, Saint Petersburg State University, Ulyanovskaya str. 1, 198504 St. Petersburg, Russia
4
Center for Optical and Laser Materials Research, Saint Petersburg State University, Ulyanovskaya str. 1, 198504 St. Petersburg, Russia
*
Author to whom correspondence should be addressed.
Minerals 2020, 10(4), 322; https://doi.org/10.3390/min10040322
Submission received: 10 March 2020 / Revised: 2 April 2020 / Accepted: 2 April 2020 / Published: 4 April 2020

Abstract

:
Hingganite from the Wanni glacier (Switzerland) was studied by means of energy dispersive and wavelength-dispersive spectroscopy, Raman spectroscopy, and low-temperature single-crystal X-ray diffraction. According to its chemical composition, the investigated mineral should be considered as hingganite-(Y). It showed a relatively high content of Gd, Dy, and Er and had limited content of lighter rare-earth element (REE), which is typical for Alpine gadolinite group minerals. The most intense Raman bands were 116, 186, 268, 328, 423, 541, 584, 725, 923, 983, 3383, and 3541 cm−1. Based on data of low-temperature [(−173)–(+7) °C] in situ single-crystal X-ray diffraction, it was shown that the hingganite-(Y) crystal structure was stable in the studied temperature range and no phase transitions occurred. Hingganite-(Y) demonstrated low volumetric thermal expansion (αV = 9(2) × 10−6 °C−1) and had a high thermal expansion anisotropy up to compression along one of the directions in the layer plane. Such behavior is caused by the shear deformations of its monoclinic unit cell.

Graphical Abstract

1. Introduction

According to the Commission on New Minerals, Nomenclature, and Classification of the International Mineralogical Association, 76 beryllosilicate minerals are currently known. The beryllosilicates can be divided into five distinct groups based on their tetrahedral building blocks connections [1,2,3]: Unconnected tetrahedra and finite clusters of tetrahedra (both 0D), infinite chains of tetrahedra (1D), infinite sheets of tetrahedra (2D), and infinite frameworks of tetrahedra (3D). Layered (with infinite sheets of tetrahedra) structures are the most common: Almost 1/3 of beryllosilicates (27 out of 76) are represented by this structure type. Members of the gadolinite subgroup in the gadolinite supergroup form a big group within layered beryllosilicates (8 out of 27 minerals).
According to the modern nomenclature [4], the general formula of the gadolinite supergroup is A2MQ2T2O8ϕ2, where A = Ca, rare-earth element (REE) (Y and lanthanoides), Bi; M = Fe2+, ▯ (vacancy), Mg, Mn, Zn, Cu, Al, Fe3+; Q = B, Be, Li; T = Si, B, Be, S, P, and ϕ = O, OH, F. The monoclinic (P21/c) structure of the gadolinite-supergroup minerals can be described as layered, consisting of two different layers parallel to (100) and alternating along the (100) direction. Anion layers of [QTO4(ϕ)]3– are formed by four- and eight-membered rings of corner sharing QO4 and TO4 tetrahedra and cation layers formed by AO8 polyhedra with square antiprism geometry and MO6 octahedra. The gadolinite supergroup is subdivided into two groups: the gadolinite (silicates) and the herderite group (phosphate and arsenates). Based on the B:Be:Li ratio, the gadolinite group is further divided into three subgroups: The gadolinite (Q2 = Be2), the datolite (Q2 = B2), and one hypothetical subgroups (Q2 = BeLi). There are 8 minerals in the gadolinite subgroup: gadolinite-(Y), gadolinite-(Ce), gadolinite-(Nd), minasgeraisite-(Y), hingganite-(Y), hingganite-(Yb), hingganite-(Ce), and the recently discovered hingganite-(Nd) [4,5,6,7,8,9,10,11,12]. Mineral species can be identified based on the ACa/sum of the A-site cations ratio [4] and the prevailed REE.
Hingganites have been found in various types of geological settings: Granitic pegmatites [7,13], granodiorites [14], syenite gneisses [15], skarns [16], different types of metasomatites [6,17,18], and REE-rich Alpine-type hydrothermal mineralization [19].
Numerous studies have been performed on the effects of pressure and temperature on the crystal structures of minerals from the gadolinite supergroup as many of them show interesting crystal-chemical effects (such as recrystallization and phase transitions). Datolite was studied at low [20] and high temperatures [21,22,23,24] and at high pressures [25,26]. High temperature transformation of datolite to okayamalite [21,22,23,24]; high pressure phase transitions at 2 GPa and room temperature and at 5 GPa and 90 °C [25]; and high pressure phase transition above 33 GPa with the formation of a high pressure modification, containing silicon in a fivefold coordination [26] were revealed. In addition, numerous works have studied the recrystallization effect in metamict gadolinites after annealing [27,28,29,30,31,32].
The crystal structure of hingganite-(Y), Y2□Be2Si2O8(OH)2, at ambient conditions was firstly solved and refined by Yakubovich et al. [9] by analogy with datolite and gadolinite and later refined by Demartin et al. [33] and Miyawaki et al. [11]. Previously, we studied the high pressure behavior of hingganite-(Y) [34], but no phase transitions up to 50 GPa were detected.
The aims of the present study were to determine chemical and spectroscopic features of hingganite-(Y) from the Wanni glacier (Switzerland), report the results of its study by single-crystal X-ray diffraction at low temperature, and analyze its temperature behavior in comparison with other beryllosilicates (including minerals of the gadolinite supergroup).

2. Materials and Methods

The hingganite sample in the present study was found by Stéphane Cuchet in the so-called “Ganter-Gneis”, a banded augen gneiss belonging to the Monte Leone nappe. This metamorphic rocks has been exhumed from the Wanni glacier (Switzerland) by its melting a few years before the collection of the samples. The mineral assemblage of metamorphic rocks, exposed in the Wanni glacier area, which is located in the Binn Valley, Valais (Wallis), Switzerland, is unique and is the locality of eight rare-earth element (REE) arsenates and arsenites [35,36,37,38,39,40,41,42]. Its geology has been studied in detail [43,44,45,46,47,48]. Hingganites from this area occur in fissures of an alpine-type hydrothermal mineralization [49] and form crystals of different colors (greenish, yellow, or colorless), various forms (prismatic, rose-like), and up to 2 mm in size [50]. The total mineral assemblage of hingganite from the Wanni glacier is very close to that of gadolinites from the same region described by Demartin et al. [19]. The hingganite used for this particular study was the colorless prismatic transparent crystal 0.05 mm in size (Figure 1), which was found in a fissure in close association with titanite aggregate, abundant muscovite, some rare tabular colorless bertrandite, minor arsenates, and probably datolite.
Thermal behavior of hingganite under cooling in air was studied in situ by low-temperature single crystal X-ray diffraction (SCXRD) using a Rigaku Oxford Diffraction Xcalibur diffractometer (Oxford, UK), operated with monochromated MoKα radiation (λ[MoKα] = 0.71073 Å) at 50 kV and 40 mA and equipped with an Eos CCD area detector with a low-temperature Oxford Cryosystems Cryostream. Diffraction data were collected at different temperatures without changing orientation of the crystal in the range of −173 to +7 °C with temperature steps of 30 °C. The frame width was 1.0° in ω and ϕ, with exposure of 30 s per each frame. The data were integrated and corrected for background, Lorentz, and polarization effects. An empirical absorption correction based on spherical harmonics implemented in the SCALE3 ABSPACK algorithm was applied in the CrysAlisPro program [51]. The unit-cell parameters were refined using the least-square techniques. The SHELXL program package [52] was used for all structural calculations. The crystal structure of hingganite-(Y) was refined at seven temperature points. The positions of H atoms were determined using restrictions. The anisotropic approximation was used for all atoms except Be. Further details of data processing and refinement are given in the Supplementary Information (Crystallographic Information File (CIF)).
The temperature dependencies of the unit-cell parameters were described by quadratic and linear (for comparison with other minerals) polynomial functions in the whole temperature range. Visualization and calculation of the thermal-expansion parameters tensor were performed using the TTT program package [53].
The elemental composition of hingganite crystal (which was previously used for X-ray studies) from the Wanni glacier was analyzed on the epoxy-mounted, polished, and carbon-coated sample in five different spots by means of a Hitachi S-3400N scanning electron microscope equipped with AzTec Energy X-Max 20 energy dispersive (EDX) and INCAWAVE 500 wavelength-dispersive (WDX) spectrometers. A series of natural (albite for Si, Al, wollastonite for Ca, fayalite for Fe, rhodonite for Mn), and synthetic standards (MgO for Mg, UO2 for U, and glasses for REE, Th, and Y) were employed. EDX spectra were obtained under the following conditions: 20 kV accelerating voltage, 1 nA beam current, and matrix correction by the extended Pouchou and Pichoir (XPP) method [54]. The empirical formula was calculated by two methods suggested for the gadolinite supergroup by Bačík et al. [4]: (1) sum of cations at the A site equals 2 or (2) sum of cations at the T site equals 2 (Table 1). Content of BeO and B2O3 was calculated according to recommendations [4]. The B:Be ratio was calculated based on Demartin et al. [33] using bond lengths data of the QO4 (Q = B, Be) tetrahedra obtained from SCRXD analysis. The number of (OH)-groups has been charge balanced to keep the empirical formula electroneutral.
Raman spectra of the hingganite, collected from uncoated polished sections, were recorded with a Horiba Jobin-Yvon LabRAM HR800 spectrometer equipped with an Olympus BX-41 microscope in backscattering geometry. Since Raman spectra of REE-bearing minerals are commonly obscured by laser-induced luminescence [14,55,56], the He-Ne laser was used as in the case of gadolinite-(Nd) [5]. Raman spectra were excited by a He-Ne laser (632.8 nm) with actual power of 2 mW under the 50× objective with a numerical aperture equal to 0.75. The spectra were obtained with a 600 gr/mm diffraction grating and 150 μm aperture diameter. The spectra were obtained in the range of 40–4000 cm−1 with 100 sec acquisition time at a resolution of 2 cm−1 at room temperature. To improve the signal-to-noise ratio, the number of acquisitions was set to 10. The spectra were processed using Labspec and Origin software.

3. Results

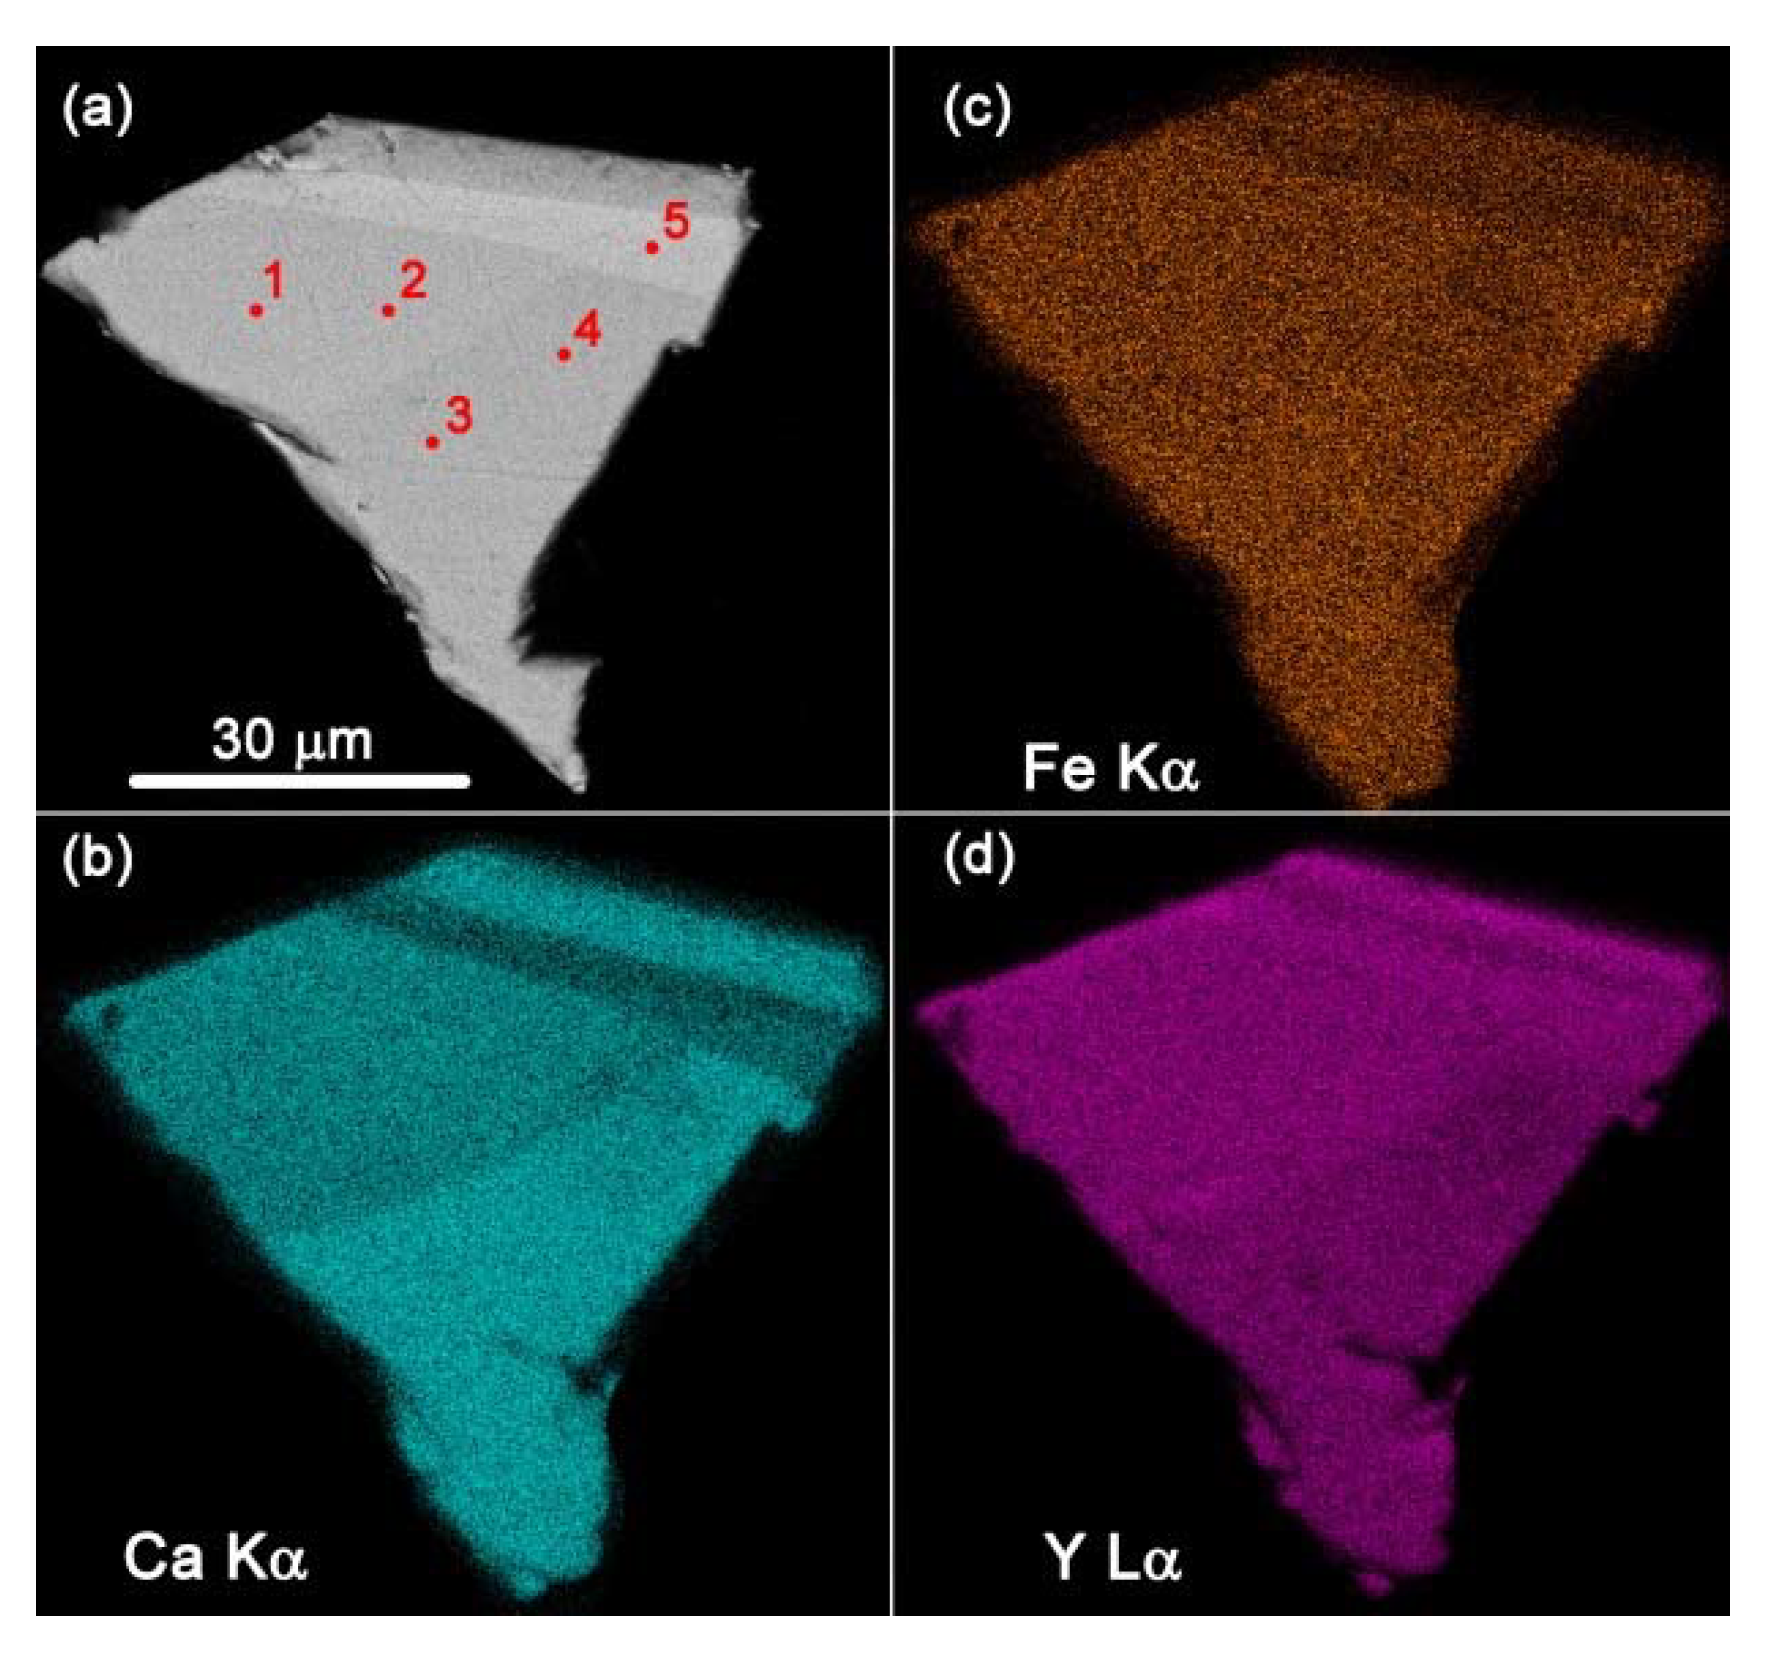
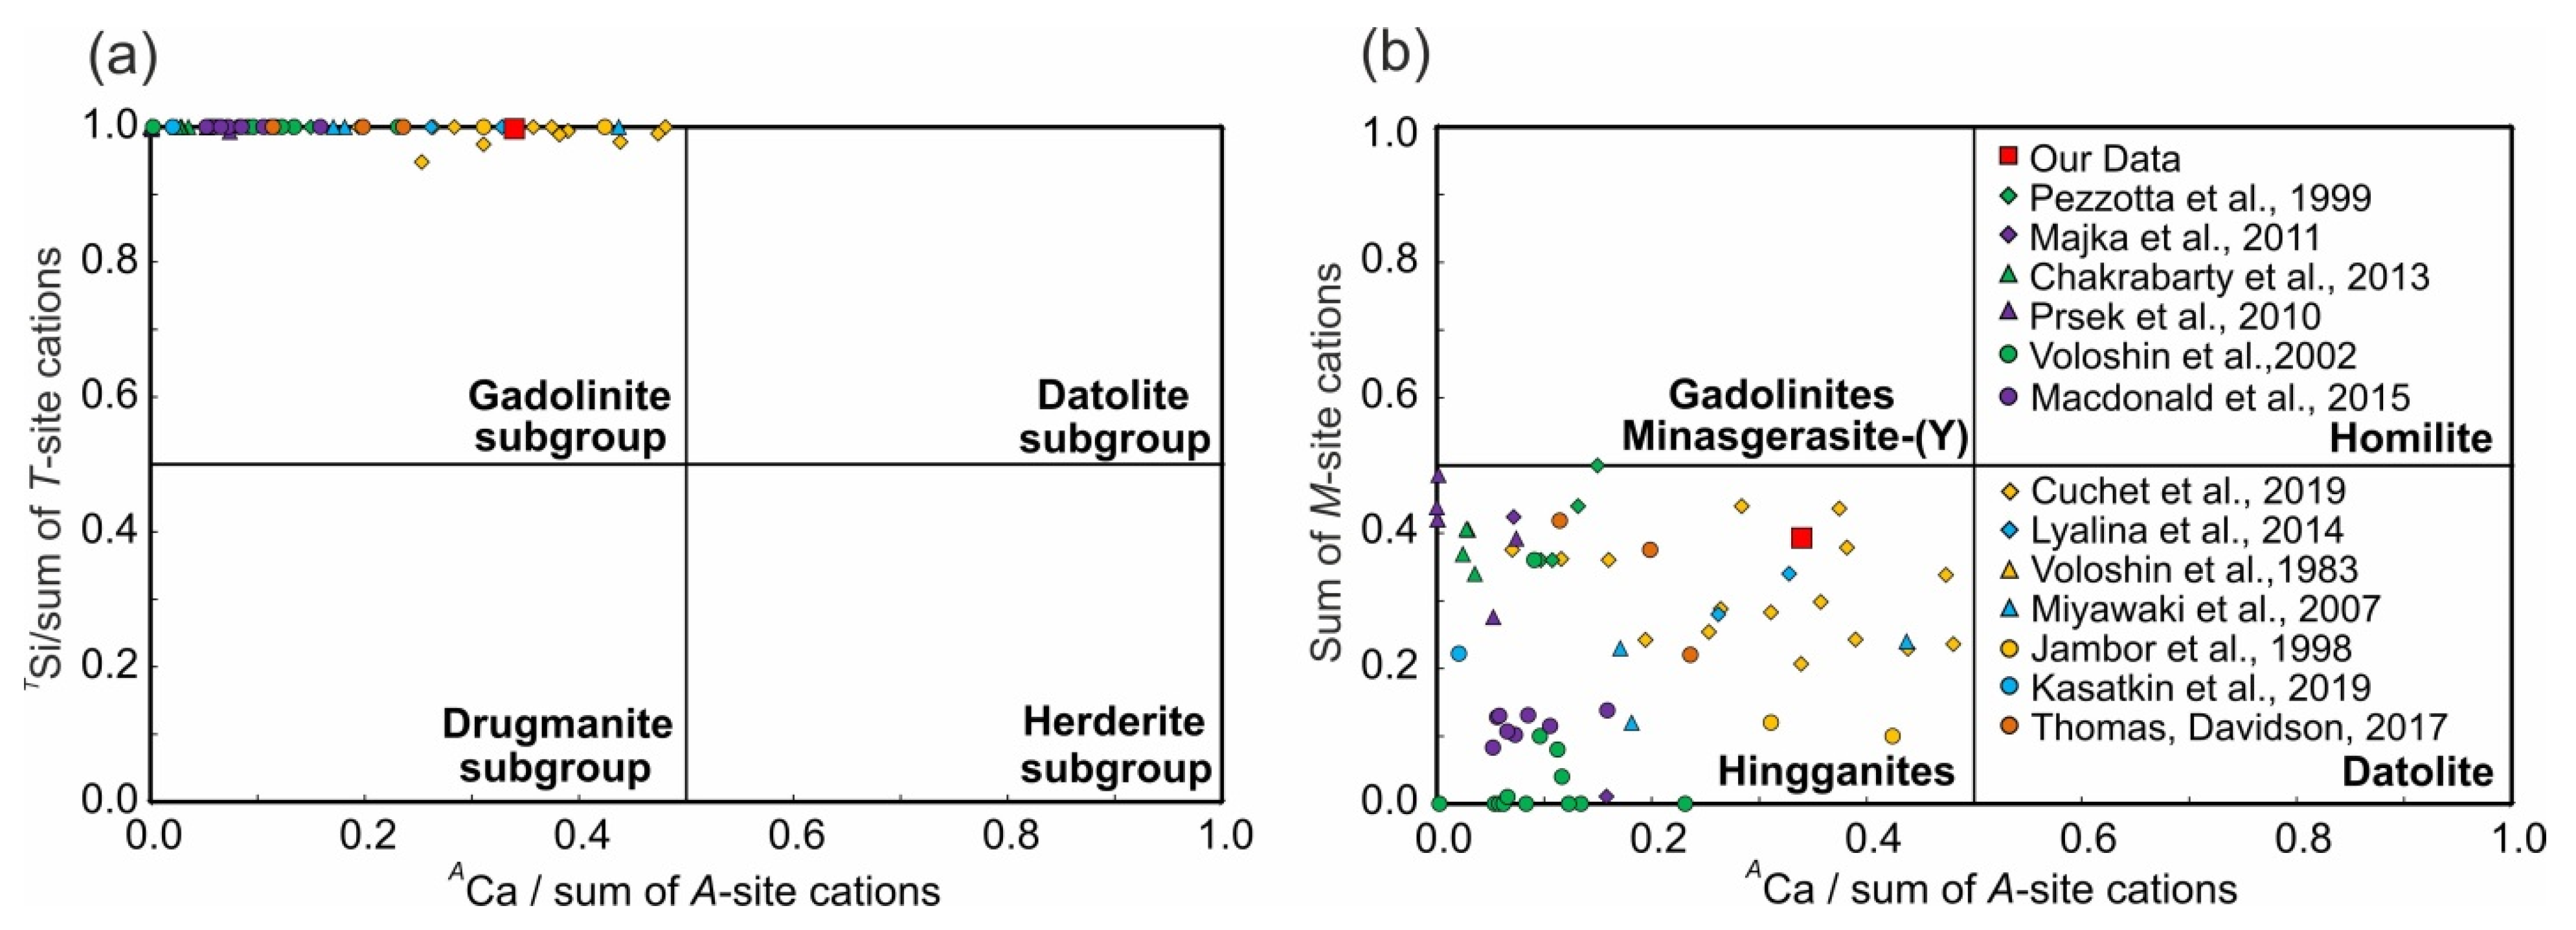
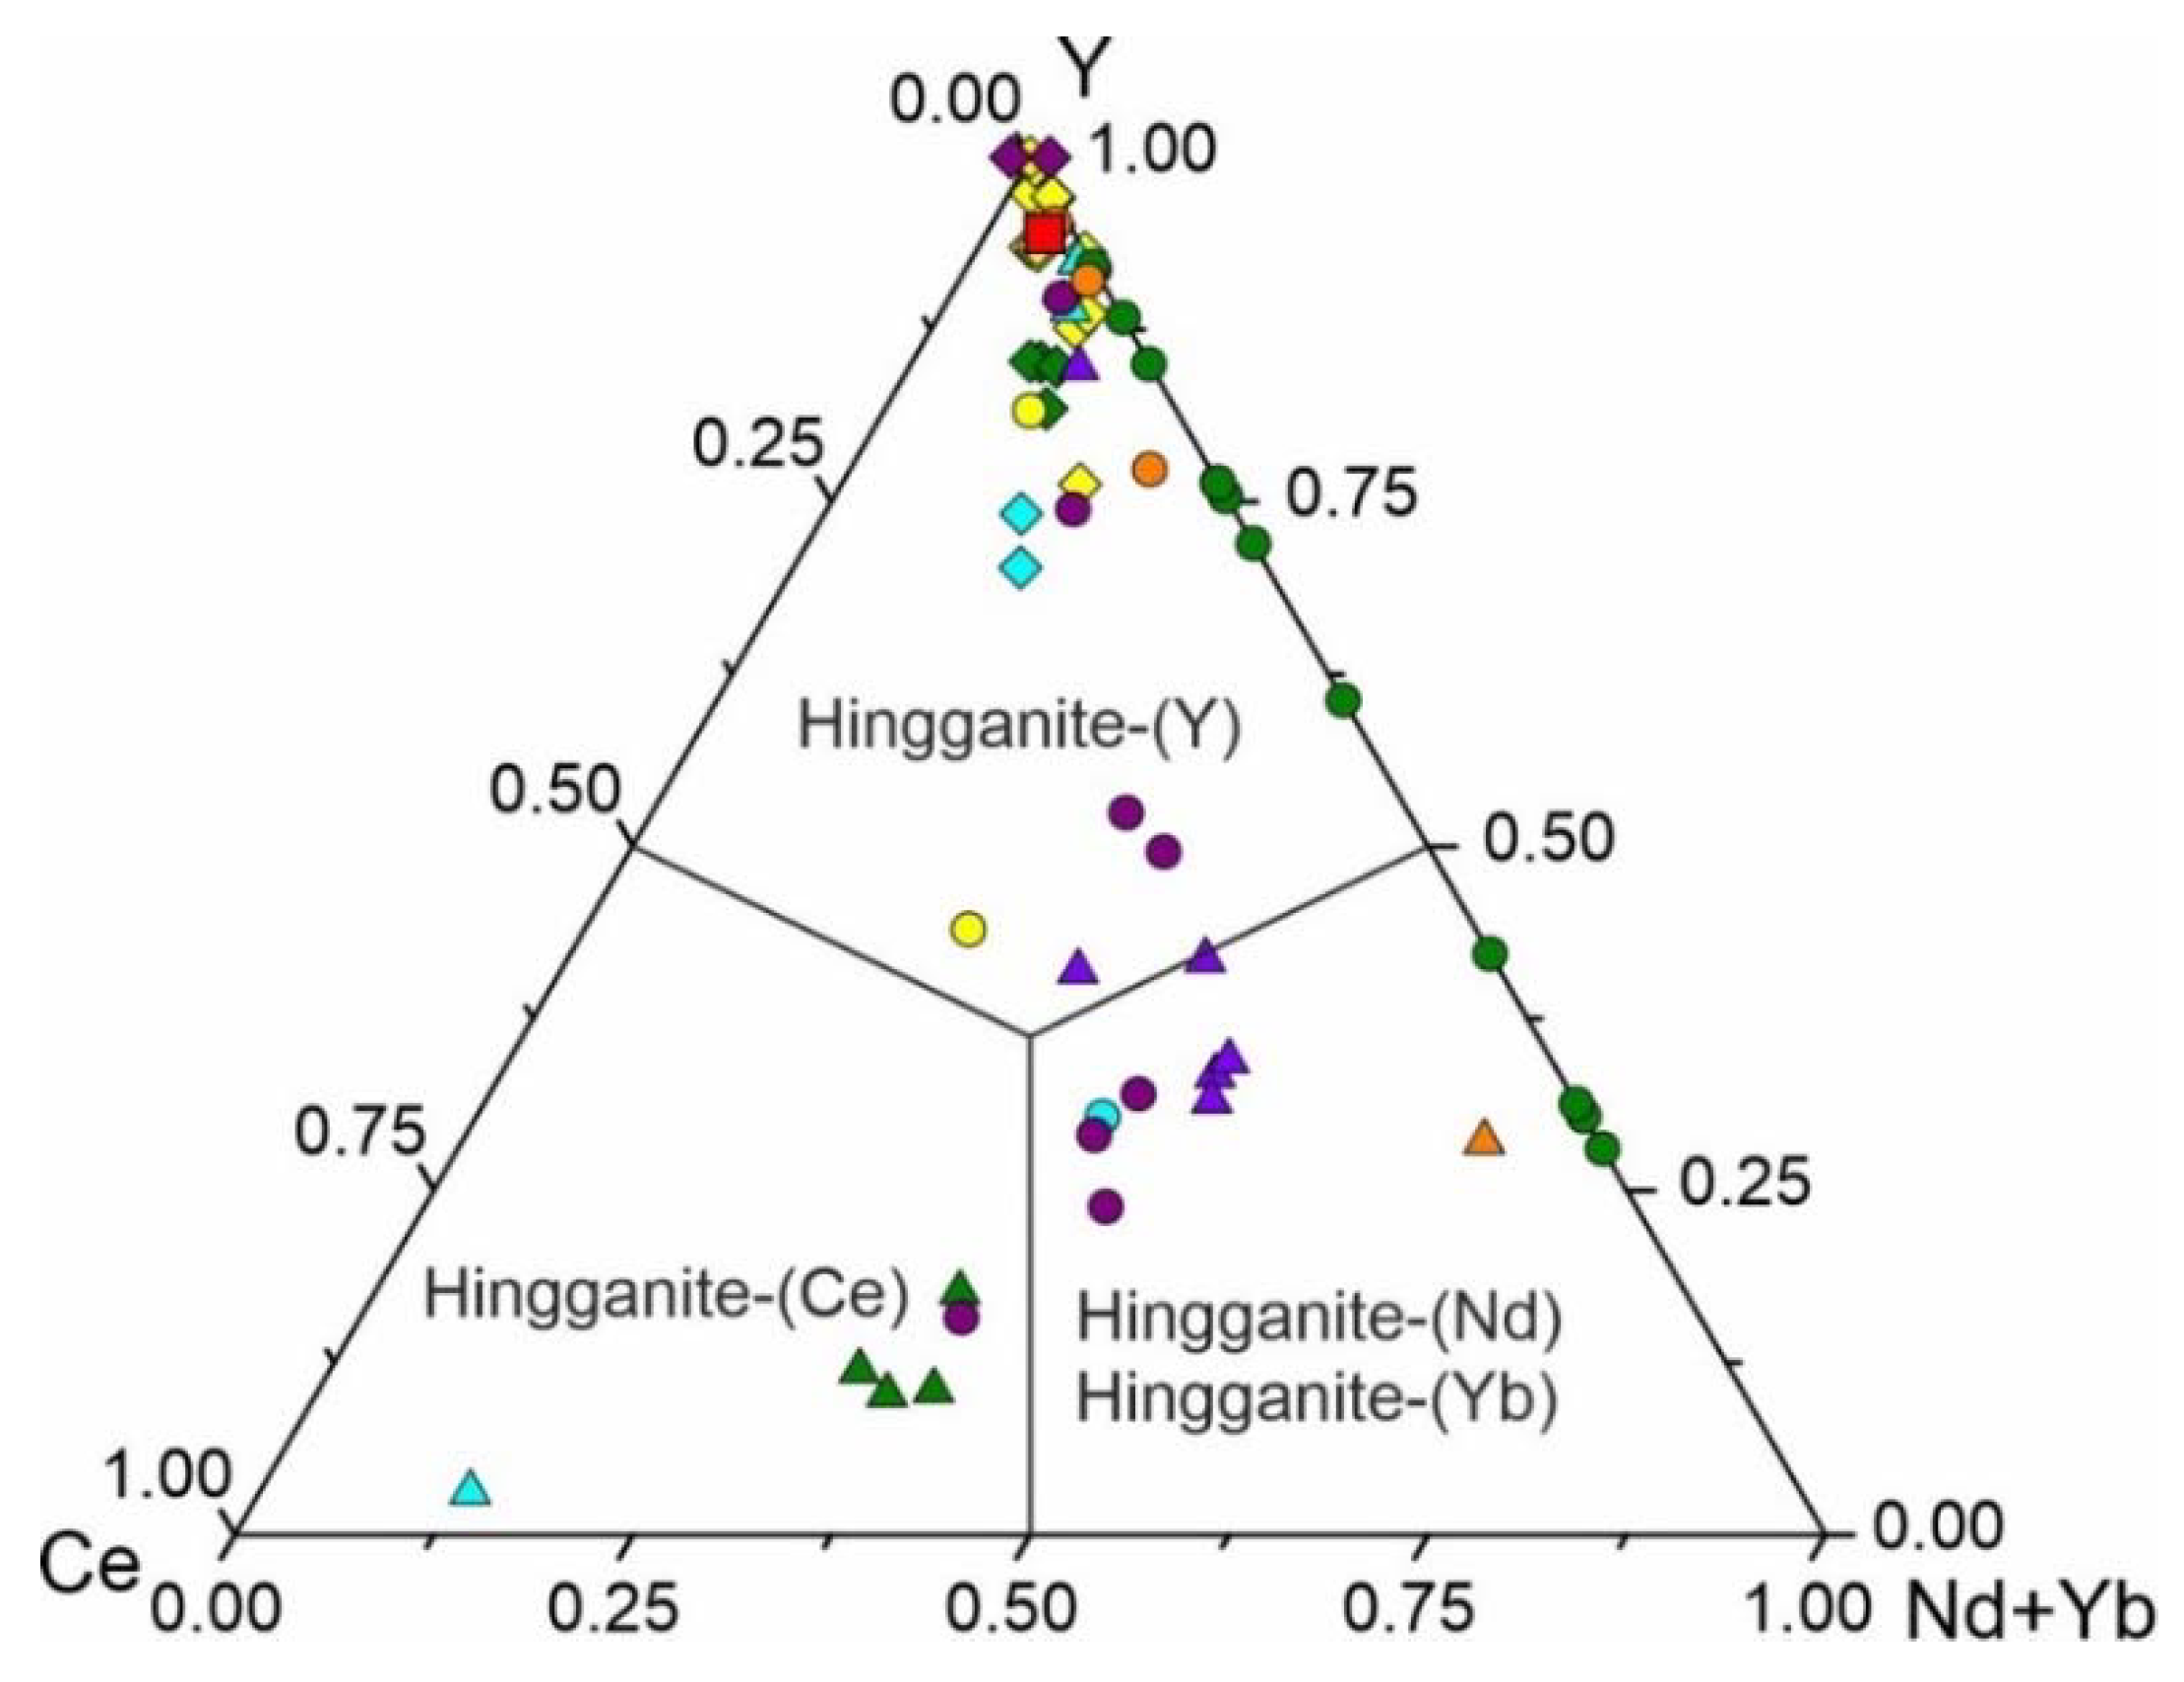
3.1. Chemical Composition

The chemical analysis for hingganite from the Wanni glacier is shown in Table 1. EDX mapping showed that crystal contains several zones, which mainly differ in Ca and Y content. However, according to WDX (Table 1, Figure 2) the observed chemical zonation was insignificant and all “zones” of the studied crystal belong to the same mineral species.
According to the nomenclature of the gadolinite supergroup [4], the investigated mineral should be considered as hingganite-(Y) (Figure 3 and Figure 4): All five analyses belong to the Y-dominant group (ACa/sum of A-site cations = 0.3; Table 1), the T-site is exclusively occupied by Si (TSi/sum of T-site cations = 1), and the M-site is mostly vacant (sum of M-site cations = 0.39). The amounts of Al, Mn, U, F, and Lu were below the detection limit. Both formula calculation methods (sum of cations at the A site equals 2/sum of cations at the T site equals 2) gave similar and reasonable results. As Si equals 2, the (Th + U) content is negligible and no lithium was found in the gadolinite supergroup minerals from this area [19,50], no lithium was suspected in the studied crystal.
The proportion of Y vs. other REE shows that the hingganite studied by us is Y-dominant (compared to other hingganites; Figure 4). Interestingly, it has a relatively high amount of Fe (gadolinite component). Hingganites form solid solutions between all four known species (hingganite-(Y), hingganite-(Yb), hingganite-(Ce), hingganite-(Nd) [4]) and are known to form solid solutions with gadolinites [57] and datolites [33]. It is noteworthy to mention that our sample contains a small amount of As, that together with previous studies [50] could be a possible sign of a presence of a hingganite–berslagite solid solution.
Hingganite-(Y) from the Wanni glacier shows relatively high content of Gd, Dy, and Er and has a limited amount of lighter REE. Such REE distribution was previously described for Alpine gadolinites [19] and is atypical for many non-Alpine occurrences.
The investigated hingganite-(Y) has a number of bands in the 40–1000 cm−1 region (Figure 5). The most intense are 116, 186, 268, 328, 423, 541, 584, 725, 923, and 983 cm−1. Unlike isostructural datolite, herderite, and gadolinite [5,25,58,59] the Raman bands of hingganite-(Y) in the 40–1000 cm−1 range have almost similar intensities. The Raman bands at 923 and 983 cm−1 are assigned to stretching vibrations of Si–O in tetrahedral coordination [5,25,58,59]. Be–O stretching vibrations are in the range of 650–800 cm−1 [60]. The bands in the region of 450–650 cm−1 are assigned to bending vibrations of the layer constituted by SiO4 and BeO4 tetrahedra, while 300–450 cm−1 are attributed to stretching vibrations of the AO8 polyhedra and MO6 octahedra [5,7]. The bands at 3383 and 3541 cm−1 are attributed to stretching vibrations of (OH)-units in the crystal structure of hingganite-(Y). No Raman bands were observed in the range from 1000 to 3200 cm−1, which confirms the absence of CO32– and H2O groups (typically the most intense, totally symmetric vibration, ν1, of CO32− is in the range of 1000–1100 cm−1 with a bending vibration of H2O 1500–1700 cm−1).

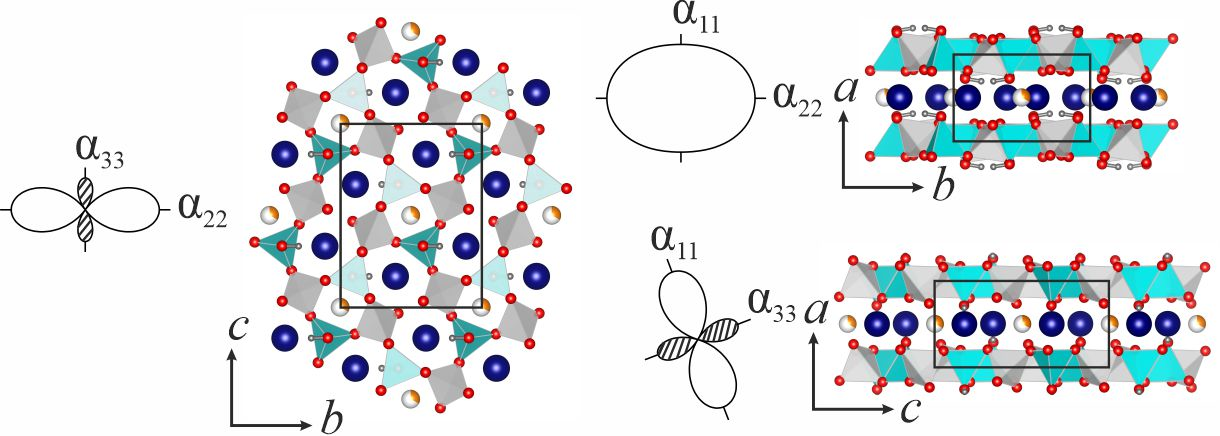
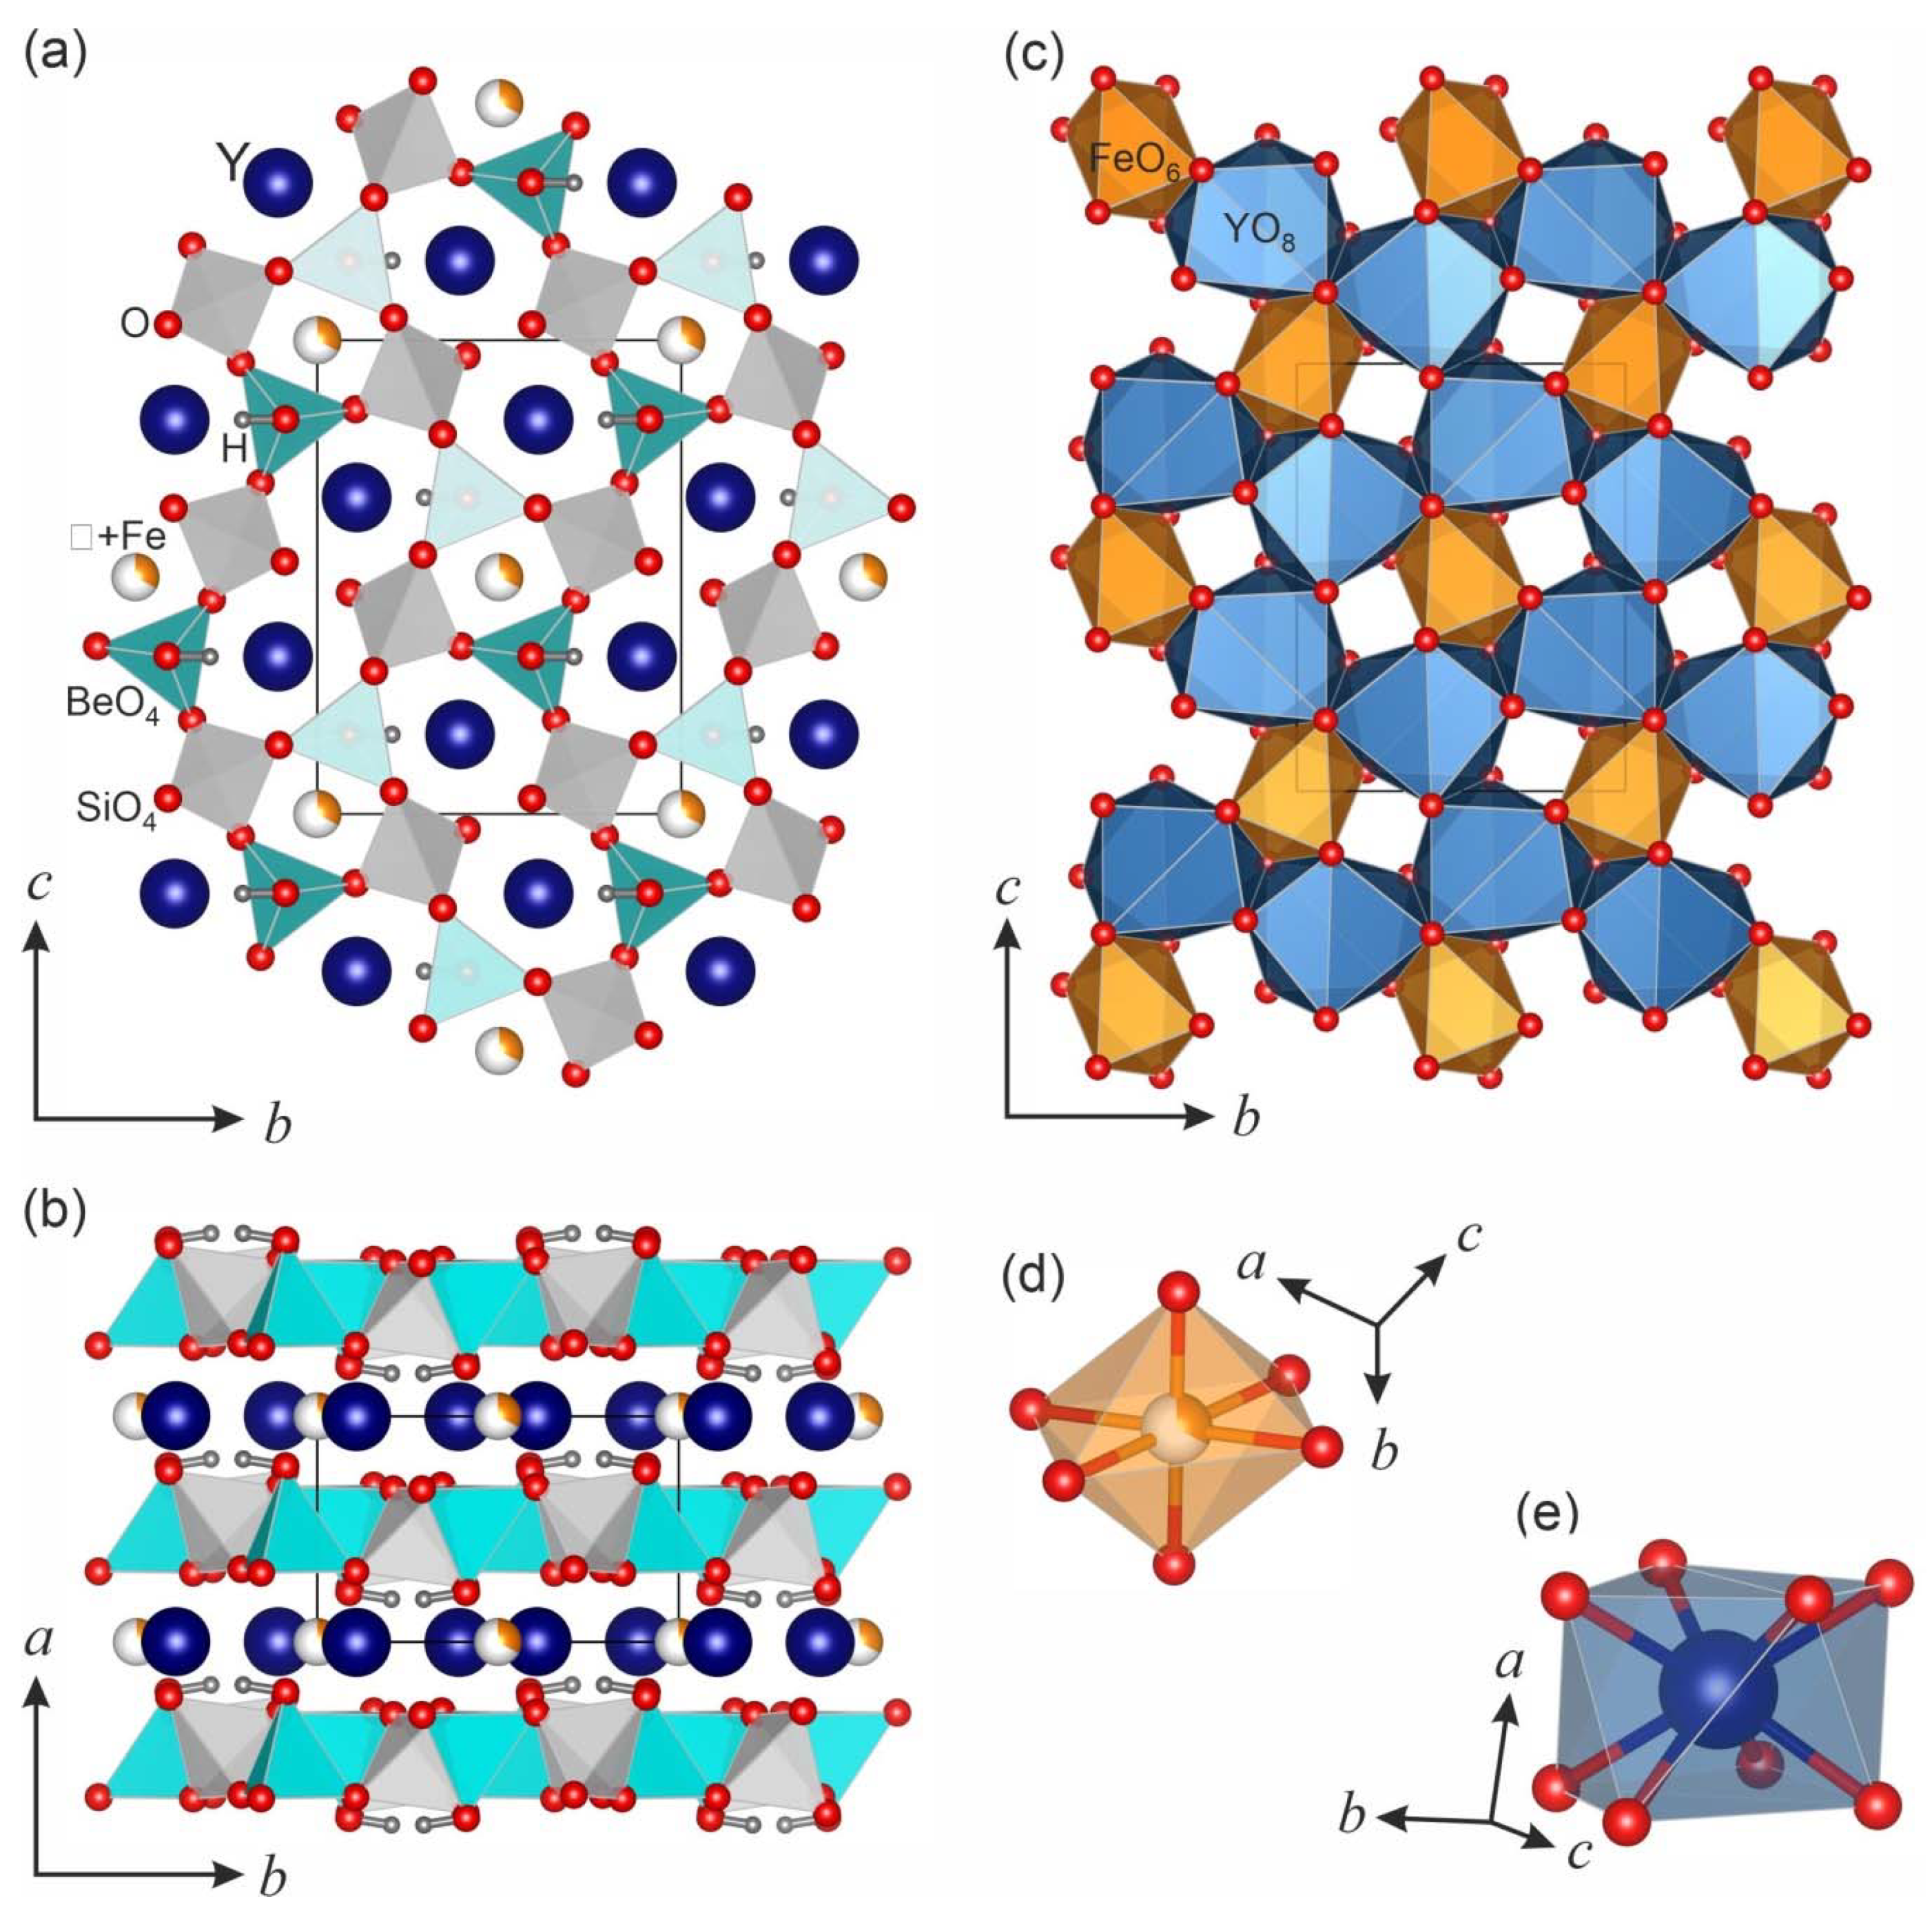
3.2. Crystal Structure Refinement

As was mentioned above, the monoclinic (P21/c) crystal structure of hingganite-(Y) (Figure 6) could be described as a juxtaposition of two layers parallel to (100): One layer is an apophyllite-type, containing corner-sharing SiO4 and BeO4 tetrahedra, whereas the other layer consists of edge-sharing YO8 polyhedra. Hydrogen atoms are usually connected to the apical oxygen atoms in the BeO4 tetrahedron (Figure 6).
The data of the crystal structure refinements and selected bond distances at all seven temperature points are shown in Table 2; Table 3.
As multiple solid solution trends exist in the gadolinite supergroup, hingganite-(Y) had a very complex composition; refinement of its crystal structure was very difficult.
The chemical analysis revealed a significant amount of Fe2+, which according to the previous crystal structure refinements [9,11,33] could partially occupy the M site. SCXRD analysis of our sample confirmed that Fe is located in the M site with occupancy about 1/3. Thus, in the structure of hingganite-(Y) from the Wanni glacier, the cation layers are formed not only by YO8 polyhedra, but also by FeO6 distorted octahedra. These octahedra occupy central positions inside six-fold rings, formed by YO8 polyhedra, and are located in the channels, formed by four-fold rings of BeO4 and SiO4 tetrahedra (Figure 6).
According to the Bačíks’ recommendations for formula calculation [61], the Be:B ratio could be calculated on the basis of bond length in the QO4 (Q = B, Be) tetrahedra. In the studied structure near room temperature (7 °C) <Q–O> = 1.595(9) Å (Table 3), which corresponds approximately to the Be:B ≈ 1:1. Refined occupancy of the Q site by Be and B atoms showed a Be:B ratio of approximately 1:4, which contradicts previous studies [19,33,62]. Due to difficulties in the determination of the Be:B ratio experimentally, the final crystal structure was refined using only the Be atom in the Q site.

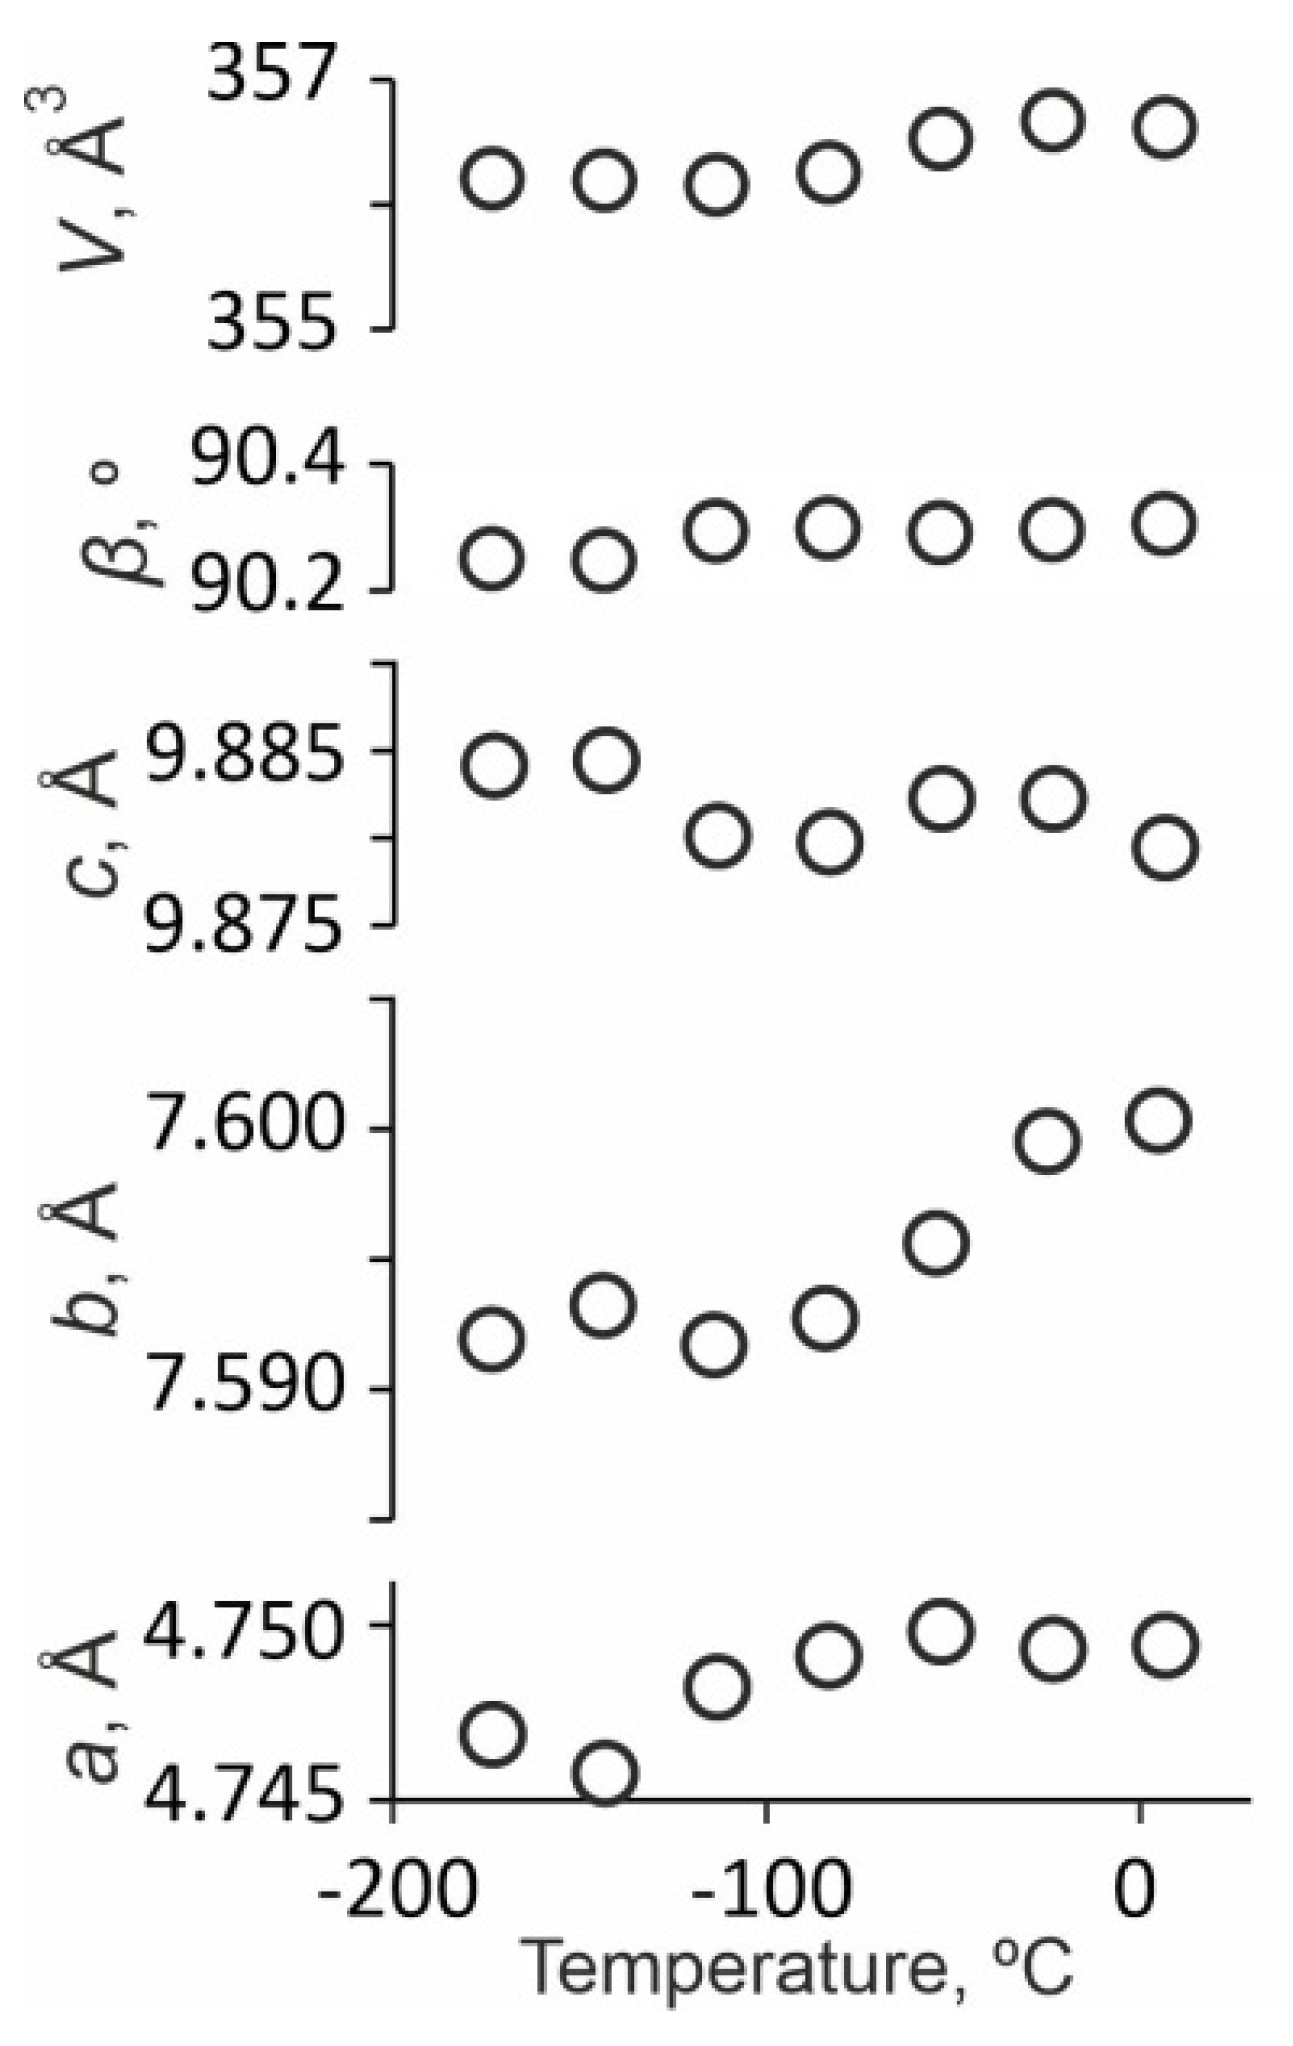
3.3. Thermal Behavior of Hingganite-(Y)
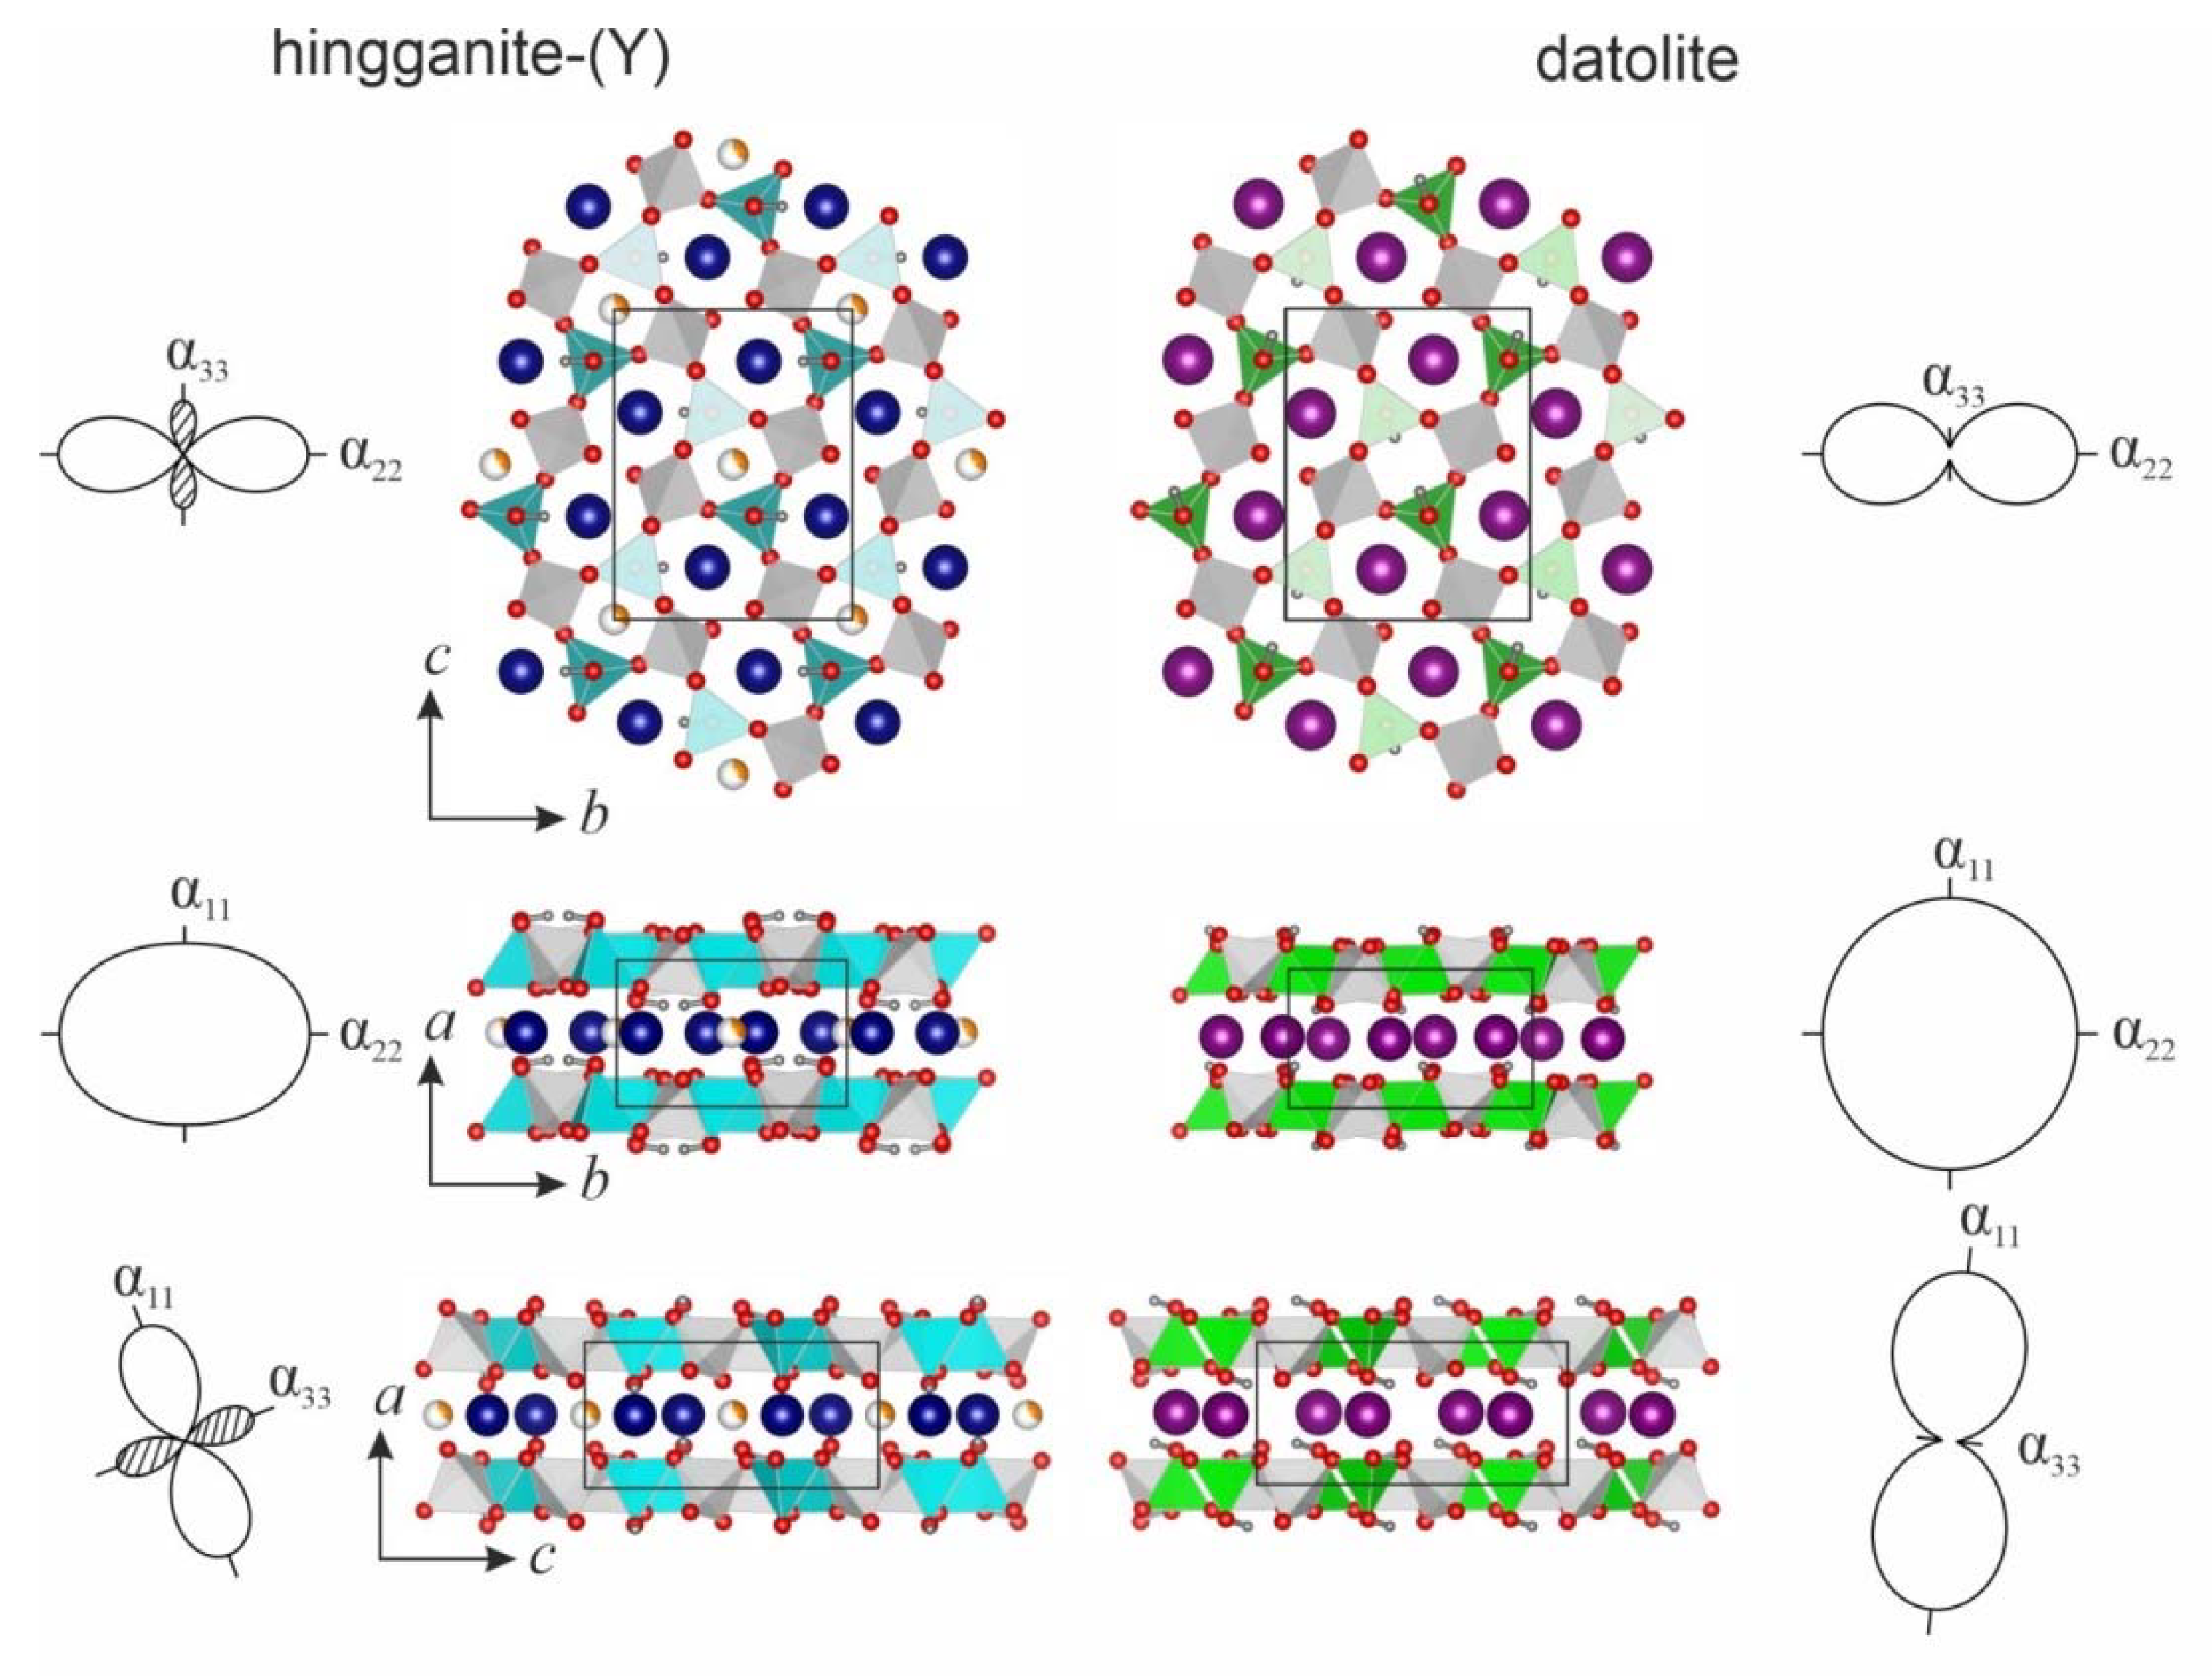
The temperature dependencies for the unit-cell parameters are shown in Figure 7. The changing of the unit-cell parameters is relatively linear, so no phase transitions were observed at low temperatures.
Thermal expansion coefficients (TECs) calculated both with the linear and second-order polynomial approximation of temperature dependencies of the unit-cell parameters are listed in Table 4. Regardless of the approximation method, the thermal expansion of hingganite-(Y) has extremely anisotropic character. The maximum and minimum expansion was observed along the b and c axes, correspondingly, i.e., within the layer plane (Figure 6 and Figure 7). Such a behavior is not typical for a layered crystal structure, in which the direction of maximal expansion is usually perpendicular to the layer plane. Such a result could be explained by non-linear changing of the TECs. The thermal expansion changes with the temperature increases (Table 4): At the lowest temperatures, the crystal structure of hingganite-(Y) demonstrates the maximal thermal expansion along the a axis, i.e., perpendicular to the layer plane, whereas the expansion along the b and c axes are quite small or even negative. As temperature increases, αa decreases, whereas αb and αc increase becoming positive at −143 and −23 °C, respectively. At ambient conditions, the hingganite-(Y) crystal structure hardly changes along the a and c axes and undergoes significant expansion along the b axis.
Such sharply anisotropic behavior until compression in some individual directions of the crystal structure of hingganite-(Y) could be explained using the so-called shear deformation of the monoclinic plane [63]: With increasing β angle, the structure is compressed along the diagonal of the blunt angle of the ac parallelogram (α33) and expands along the diagonal of the acute angle of the same parallelogram (α11) (see Table 4 and Figure 8).

4. Discussion

Since thermal expansion is an important physical characteristic of crystalline materials, over the last century there have been numerous studies of this characteristic. However, there are only a few studies of beryllosilicate minerals under extreme conditions: only 6 of 76 minerals have been studied under high temperature to date (Table 5). Previously studied minerals are mostly framework (3D), whereas the layered (2D) and chain (1D) minerals have not been studied at all.
Based on literature and our data, the average value of volumetric TECs for beryllosilicates were calculated (<αV>6 = 19 ×10−6 °C−1) (Table 5). These values are much closer to silicates (23) than to alumino- and borosilicates (36 × 10−6 °C−1) [70], which have been studied more thoroughly. To make the assumption about the reasons of such behavior of beryllosilicates in comparison with other silicate minerals, further experiments are needed. The beryllosilicate mineral hingganite-(Y) and borosilicate mineral datolite demonstrate a similar trend at low temperatures (our data; [20]): αV = 9(2) and 15(2) × 10−6 °C−1, respectively (Figure 8 and Figure 9). Moreover the directions of maximum and minimum expansion of both minerals are almost the same. The most important difference is in the ac plane, which could be explained by the increasing β angle in hingganite-(Y) (from 90.249(3)° at −173 °C to 90.304(4)° at +7 °C (Table 2)) and its decrease in datolite with increasing temperature (from 90.180(2)° to 90.159(2)° in the same temperature range [20]). As the changing of the β angle in the layered structures is usually the cause of a shift relative to each other, such differences could be explained by different filling of the cation layers. In hingganites, the A site is mostly occupied by REE and could contain a significant amount of Ca, whereas the vacant M site could be partly (not more than 50%) occupied by Fe [19] and contain trace amounts of Ca [18,19,61,62,71,72,73]. Datolite is usually more stoichiometric and its A site is occupied by Ca with a little admixture of Fe (up to 0.16 Fe apfu) and lower amounts of other elements [74], whereas its M site is completely vacant. As the M site in our sample of hingganite-(Y) contains significant amounts of Fe (~1/3 of the site), the cation layer of the studied hingganite-(Y) is denser than that of datolite. This could be considered as the main reason for different behaviors of the two isotypical minerals.
Another argument in favor of large cations having the most intense effect on the thermal expansion is the following: According to Hazen and Finger [75] it is possible to predict the behavior of the crystal structure under high temperature using the average volume TEC (αV) for each type of polyhedron, which could be estimated using iconicity factor, atomics charge, and coordination number. According to this approach, in the crystal structure of hingganite-(Y), αV = 64 and 72 × 10−6 °C−1 for YO8 and FeO6 polyhedra while in datolite [20], αV = 96 × 10−6 °C−1 for CaO8. Based on that, we can conclude that the expansion of the large cations layers in datolite should be more intense than in hingganite-(Y).
The comparison of low-temperature behavior of hingganite-(Y) with its previously studied high-pressure behavior [34] reveals the same schemes of deformations, i.e., αb > αa > αc and βb > βa > βc, that are in accordance with the general rules of comparative crystal chemistry [76]: The effect of increasing temperature upon the crystal structure is generally similar, (but oppositely directed) to the effect of pressure increases.

5. Conclusions

Low-temperature behavior of hingganite-(Y) from the Wanni glacier was studied using single-crystal X-ray diffraction. Though the crystal structure was preserved in the whole studied temperature range [(−173)–(+7)] °C), the thermal deformations were sharply anisotropic up to compression along one of the directions, which could be explained by the shear deformation mechanism. Such behavior is close to the low-temperature behavior of isotypic datolite [20]. The differences of the low-temperature behaviors of hingganite-(Y) and datolite may be explained by the different filling of the interlayer cation sites.

Supplementary Materials

The CIF-files at all temperature points are available online at https://www.mdpi.com/2075-163X/10/4/322/s1.

Author Contributions

L.G. performed low-temperature X-ray experiments and analysis. O.V., S.C., and V.S. performed the chemical analysis, O.V. and D.P. obtained the Raman data. The manuscript was written through contributions of all authors. All authors have given approval to the final version of the manuscript.

Funding

This research was funded by the Russian Science Foundation, grant number 19-77-00038 (to L.G.).

Acknowledgments

We are grateful A.A. Zolotarev (Jr.) for help with low-temperature single-crystal X-ray experiment and N.S. Vlasenko for help with chemical analysis. We are particularly grateful to Ate van der Burgt (Wageningen, The Netherlands) for help with the field work, Nicolas Meisser (State Geological Museum, University of Lausanne, Switzerland) for preliminary X-Ray studies, and Mischa Crumbach (Visp, Switzerland, www.designbyearth.com) for providing the picture of a hingganite-(Y) crystal. We also thank three anonymous reviewers for their constructive comments. The authors thank X-ray Diffraction Centre, Geomodel Center and Center for Optical and Laser Materials Research of Resource Centre of Saint Petersburg State University for providing instrumental and computational resources.

Conflicts of Interest

The authors declare no conflict of interest.

References

  1. Machatschki, F. Zur Frage der Struktur und Konstitution der Feldspate. Zentralbl. Mineral. 1928, A, 97–100. [Google Scholar]
  2. Bragg, W.L. The structure of silicates. Z. Kristallogr. 1930, 74, 237–305. [Google Scholar] [CrossRef]
  3. Hawthorne, F.C.; Huminicki, D.M.C. The crystal chemistry of beryllium. In Beryllium: Mineralogy, Petrology and Geochemistry; Grew, E.S., Ed.; Reviews in Mineralogy & Geochemistry; de Gruyter GmbH: Berlin, Germany, 2002; Volume 50, pp. 333–403. [Google Scholar]
  4. Bačík, P.; Miyawaki, R.; Atencio, D.; Camara, F.; Fridrichová, J. Nomenclature of gadolinite supergroup. Eur. J. Mineral. 2017, 29, 1067–1082. [Google Scholar] [CrossRef] [Green Version]
  5. Škoda, R.; Plasil, J.; Copjakova, R.; Novak, M.; Jonsson, E.; Vasinova Galiova, M.; Holtstam, D. Gadolinite-(Nd), a new member of the gadolinite supergroup from the Fe-REE deposits of Bastnas-type, Sweden. Min. Mag. 2018, 82, 133–145. [Google Scholar] [CrossRef] [Green Version]
  6. Pršek, J.; Ondrejka, M.; Bačík, P.; Budzyń, B.; Uher, P. Metamorphic-hydrothermal REE minerals in the Bacuch magnetite deposit, Western Carpathians, Slovalia: (Sr,S)-rich monacite-(Ce) and Nd-dominant hingganite. Can. Mineral. 2010, 48, 81–94. [Google Scholar] [CrossRef] [Green Version]
  7. Kasatkin, A.V.; Nestola, F.; Skoda, R.; Chukanov, N.V.; Agakhanov, A.A.; Belakovsky, D.I.; Lanza, A.; Hola, M. Hingganite-(Nd), IMA 2019-028. CNMNC Newsletter Min. Mag. 2019, 50, 619. [Google Scholar]
  8. Voloshin, A.V.; Pakhomovskii, Y.A.; Men’shikov, Y.P.; Povarennykh, A.S.; Matvienko, E.N.; Yakubovich, O.V. Ytterbium hingganite—A new mineral from amazonite pegmatites of the Kola Peninsula. Dokl Akad Nauk SSSR 1983, 270, 1188–1192. (In Russian) [Google Scholar]
  9. Yakubovich, O.V.; Matvienko, E.N.; Voloshin, A.V.; Simonov, M.A. The crystal structure of hingganite-(Yb) (Y0.51Ln0.36Ca0.13)Fe0.065Be(SiO4)(OH). Sov. Phys. Crystallogr. 1983, 28, 269–271. [Google Scholar]
  10. Raade, G.; Kolitsch, U.; Husdal, T.A. Si-rich bergslagite from a granitic pegmatite at Tennvatn, north Norway. GFF 2006, 128, 65–68. [Google Scholar] [CrossRef]
  11. Miyawaki, R.; Matsubara, S.; Yokoyama, K.; Okamoto, A. Hingganite-(Ce) and hingganite-(Y) from Tahara, Hirukawa-mura, Gifu Prefecture, Japan: The description on a new mineral species of the Ce-analogue of hingannite-(Y) with a refinement of the crystal structure of hingganite-(Y). J. Miner. Petrol. Sci. 2007, 102, 1–7. [Google Scholar] [CrossRef] [Green Version]
  12. Lyalina, L.M.; Selivanova, E.A.; Savchenko, Y.E.; Zozulya, D.R.; Kadyrova, G.I. Minerals of the gadolinite-(Y)-hingganite-(Y) series in the alkali granite pegmatites of the Kola Peninsula. Geol. Ore Depos. 2014, 56, 675–684. [Google Scholar] [CrossRef]
  13. Pezzotta, F.; Diella, V.; Guastoni, A. Chemical and paragenetic data on gadolinite-group minerals from Baveno and Cuasso al Monte, southern Alps, Italy. Am. Mineral. 1999, 84, 782–789. [Google Scholar] [CrossRef]
  14. Thomas, R.; Davidson, P. Hingganite-(Y) from a small aplite vein in granodiorite from Oppach, Lusatian Mts., E-Fermany. Miner. Petrol. 2017, 111, 821–826. [Google Scholar] [CrossRef]
  15. Chakrabarty, A.; Mitchell, R.H.; Ren, M.; Sen, A.K.; Pruseth, K.L. Rinkite, cerianite-(Ce), and hingganite-(Ce) in syenite gneisses from the Sushina Hill Complex, India: Occurrence, compositional data and petrogenetic significance. Min. Mag. 2013, 77, 3137–3153. [Google Scholar] [CrossRef]
  16. Holtstam, D.; Anderson, U.B. The REE minerals pf the Bastnas-type deposits, south-central Sweden. Can. Mineral. 2007, 45, 1523–1527. [Google Scholar] [CrossRef]
  17. Macdonald, R.; Baginski, B.; Kartashov, P.; Zozulia, D.; Dzierzanowski, P. Interaction of rare-metal minerals with hydrothermal fluids: Evidence from quartz-epidote metasomatites of the Haldzan Buragtag massif, Mongolian Altai. Can. Mineral. 2015, 53, 1015–1034. [Google Scholar] [CrossRef]
  18. Majka, J.; Pršek, J.; Budzyń, B.; Bačík, P.; Barker, A.K.; Łodzinski, M. Fluorapatite-hingganite-(Y) coronas as products of fluid induced xenotime-(Y) breakdown in the Skoddefjellet pegmatite, Svalbard. Mineral. Mag. 2011, 75, 159–167. [Google Scholar] [CrossRef]
  19. Demartin, F.; Pilati, T.; Diella, V.; Gentile, P.; Gramaccioli, C.M. A crystal-chemical investigation of Alpine gadolinite. Can. Mineral. 1993, 31, 127–136. [Google Scholar]
  20. Rinaldi, R.; Gatta, G.D.; Angel, R.J. Crystal chemistry and low-temperature behavior of datolite: A single crystal X-ray diffraction study. Am. Mineral. 2010, 95, 1413–1421. [Google Scholar] [CrossRef]
  21. Tarney, J.; Nicol, A.W.; Marriner, G.F. The thermal transformation of datolite, CaBSiO4(OH), to boron-melilite. Min. Mag. 1973, 39, 158–175. [Google Scholar] [CrossRef] [Green Version]
  22. Kimata, M. Boron behavior in the thermal decomposition of datolite. Neues Jahrb. Mineral. Monatsh. 1978, 58–70. [Google Scholar]
  23. Perchiazzi, N.; Gualtieri, A.F.; Merlino, S.; Kampf, A.R. The atomic structure of bakerite and its relationship to datolite. Am. Mineral. 2004, 89, 767–776. [Google Scholar] [CrossRef]
  24. Krzhizhanovskaya, M.G.; Gorelova, L.A.; Bubnova, R.S.; Pekov, I.V.; Krivovichev, S.V. High-temperature crystal chemistry of layered calcium borosilicates: CaBSiO4(OH) (datolite), Ca4B5Si3O15(OH)5 (‘bakerite’) and Ca2B2SiO7 (synthetic analogue of okayamalite). Phys. Chem. Miner. 2018, 45, 463–473. [Google Scholar] [CrossRef]
  25. Goryainov, S.V.; Krylov, A.S.; Vtyurin, A.N.; Pan, Y. Raman study of datolite CaBSiO4(OH) at simultaneously high pressure and high temperature. J. Raman Spectr. 2015, 46, 177–181. [Google Scholar] [CrossRef]
  26. Gorelova, L.A.; Pakhomova, A.S.; Aprilis, G.; Dubrovinsky, L.; Krivovichev, S. Pentacoordinated silicon in the high-pressure modification of datolite, CaBSiO4(OH). Inorg. Chem. Front. 2018, 5, 1653–1660. [Google Scholar] [CrossRef]
  27. Gibson, S.J.; Ehlmann, A.J. Annealing characteristics of metamict gadolinite from Rode Ranch Texas. Am. Mineral. 1970, 55, 288–291. [Google Scholar]
  28. Janeczek, J.; Eby, R.K. Annealing of radiation damage in allanite and gadolinite. Phys. Chem. Miner. 1993, 19, 343–356. [Google Scholar] [CrossRef]
  29. Malczewski, D. 57Fe Moessbauer Spectroscopy of the Thermally Recrystallized Fully Metamict Gadolinites; University of Silesia in Katowice: Katowice, Poland, 1999; pp. 68–122. [Google Scholar]
  30. Malczewski, D.; Janeczek, J.; Popiel, E. Moessbauer studies of fully metamict gadolinite annealed in air. Mol. Phys. Rep. 1998, 22, 111–116. [Google Scholar]
  31. Malczewski, D.; Janeczek, J. Activation energy of annealed metamict gadolinite from 57Fe Moessbauer spectroscopy. Phys, Chem. Miner. 2002, 29, 226–232. [Google Scholar] [CrossRef]
  32. Malczewski, D. Structural analysis of radiation in Precambrian gadolinite from Ytterby by 57Fe Moessbauer spectroscopy, transmission electron microscopy and X-ray diffraction. Mat. Sci. Eng. A 2004, 375–377, 1259–1262. [Google Scholar] [CrossRef]
  33. Demartin, F.; Minaglia, A.; Gramaccioli, C.M. Characterization of gadolinite-group minerals using crystallographic data only: The case of hingganite-(Y) from Cuasso al Monte, Italy. Can. Mineral. 2001, 39, 1105–1114. [Google Scholar] [CrossRef]
  34. Gorelova, L.A.; Pakhomova, A.S.; Krivovichev, S.V.; Kasatkin, A.V.; Dubrovinsky, L.S. Compressibility of hingganite-(Y): High-pressure single crystal X-ray diffraction study. Phys. Chem. Miner. 2020, in press. [Google Scholar] [CrossRef]
  35. Graeser, S. Asbecasit und Cafarsit, zwei neue Mineralien aus dem Binnatal (Kt. Wallis). Schweiz. Mineral. Petrogr. Mitt. 1966, 46, 367–375. [Google Scholar]
  36. Graeser, S.; Schwander, H. Gasparite-(Ce) and monazite-(Nd): Two new minerals to the monazite group from the Alps. Schweiz. Mineral. Petrogr. Mitt. 1987, 67, 101–113. [Google Scholar]
  37. Armbruster, T.; Buhler, C.; Graeser, S.; Stalder, H.A.; Amthauer, G. Cervandonite-(Ce), (Ce,Nd,La)(Fe3+,Fe2+,Ti4+,Al)3SiAs(Si,As)O13, a new Alpine fissure mineral. Schweiz. Mineral. Petrogr. Mitt. 1988, 68, 125–132. [Google Scholar]
  38. Demartin, F.; Gramaccioli, C.M.; Pilati, T. Paraniite-(Y), a new tungstate arsenate mineral from Alpine fissures. Schweiz. Mineral. Petrogr. Mitt. 1994, 74, 155–160. [Google Scholar]
  39. Graeser, S.; Schwander, H.; Demartin, F.; Gramaccioli, C.M.; Pilati, T.; Reusser, E. Fetiasite (Fe2+, Fe3+,Ti)3O2[As2O5], a new arsenite mineral: Its description and structure determination. Am. Mineral. 1994, 79, 996–1002. [Google Scholar]
  40. Guastoni, A.; Pezzota, F.; Vignola, P. Characterization and genetic inferences of arsenates, sulfates and vanadates of Fe, Cu, Pb, Zn from Mount Cervadone (Western Alps, Italy). Period Mineral. 2006, 75, 141–150. [Google Scholar]
  41. Guastoni, A.; Nestola, F.; Gentile, P.; Zorzi, F.; Alvaro, M.; Lanza, A.; Peruzzo, L.; Schiazza, M.; Casati, N.M. Deveroite-(Ce): A new REE-oxalate from Mount Cervandone, Devero Valley, Western-Central Alps, Italy. Min. Mag. 2013, 77, 3019–3026. [Google Scholar] [CrossRef]
  42. Vereshchagin, O.S.; Britvin, S.N.; Perova, E.N.; Brusnitsyn, A.I.; Polekhovsky, Y.S.; Shilovskikh, V.V.; Bocharov, V.N.; van der Burgt, A.; Cuchet, S.; Meisser, N. Gasparite-(La), La(AsO4), a new mineral from Mn ores of the Ushkatyn-III deposit, Central Kazakhstan, and metamorphic rocks of the Wanni glacier, Switzerland. Am. Mineral. 2019, 104, 1469–1480. [Google Scholar] [CrossRef]
  43. Streckeisen, A.; Wenk, E.; Frey, M. On steep isogradic surfaces in the Simplon area. Contrib. Mineral. Petrol. 1974, 47, 8l–95. [Google Scholar] [CrossRef]
  44. Steck, A. Le massif du Simplon. Reflexions sur la cinematique des nappes de gneiss. Schweiz. Mineral. Petrogr. Mitt. 1987, 67, 27–45. [Google Scholar]
  45. Knill, M.D. Geochemistry and Genesis of the Metadolomite-Hosted Pb-Zn-As-Tl-Ba-Deposit and Lengenbach, Binn Valley, Switzerland. Ph.D. Thesis, Swiss Federal Institute of Technology (ETH) Zurich, Zurich, Switzerland, 1995. [Google Scholar]
  46. Klemm, L.; Pettke, T.; Graeser, S.; Mullis, J.; Kouzmanov, K. Fluid mixing as the cause of sulphide precipitation at Albrunpass, Binn Valley, Central Alps. Schweiz. Mineral. Petrogr. Mitt. 2004, 84, 189–212. [Google Scholar]
  47. Hettmann, K.; Kreissig, K.; Rehkämper, M.; Wenzel, T.; Mertz-Kraus, R.; Markl, G. Thallium geochemistry in the metamorphic Lengenbach sulfide deposit, Switzerland: Thallium-isotope fractionation in a sulfide melt. Am. Mineral. 2014, 99, 793–803. [Google Scholar] [CrossRef]
  48. Bergomi, M.A.; Dal Piaz, G.V.; Malusà, M.G.; Monopoli, B.; Tunesi, A. The Grand St Bernard-Briançonnais nappe system and the Paleozoic inheritance of the Western Alps unraveled by zircon U-Pb dating. Tectonics 2017, 36, 2950–2972. [Google Scholar] [CrossRef] [Green Version]
  49. Stalder, H.A.; Wagner, A.; Graeser, S.; Stuker, P. Mineralienlexicon der Schweiz; Verlag Wepf & Co. AG: Basel, Switzerland, 1998; 608p. [Google Scholar]
  50. Cuchet, S.; Crumbach, M.; van der Burgt, A.; Vanini, F.; Loranth, C.; Mestrom, P.; Antonysen, E.; Meisser, N.; Roth, P. Mineralogische Topografie der Schweiz und angrenzender Regionen. 1. Teil—Binntal (CH)—Veglia (I)—Devero (I). Schweiz. Strahler. 2019, 1, 2–17. [Google Scholar]
  51. Agilent. CrysAlis PRO; Agilent Technologies: Yarnton, UK, 2012. [Google Scholar]
  52. Sheldrick, G.M. A short history of SHELX. Acta Crystallogr. 2008, A64, 112. [Google Scholar] [CrossRef] [Green Version]
  53. Bubnova, R.S.; Firsova, V.A.; Filatov, S.K. Software for determining the thermal expansion tensor and the graphic representation of its characteristic surface (Theta to Tensor-TTT). Glass Phys. Chem. 2013, 39, 347–350. [Google Scholar] [CrossRef]
  54. Pouchou, J.L.; Pichoir, F. Quantitative analysis of homogeneous or stratified microvolumes applying the model BPAP. In Electron Probe Quantitation; Heinrich, K.F.J., Newbury, D.E., Eds.; Springer Verlag: New York, NY, USA, 1991. [Google Scholar]
  55. Nasdala, L.; Beyssac, O.; Schopf, J.W.; Bleisteiner, B. Application of Raman-based images in the Earth sciences. In Raman Imaging—Techniques and Applications; Zoubrir, A., Ed.; Springer Series in Optical Sciences; Springer: Berlin/Heidelberg, Germany, 2012; pp. 145–187. [Google Scholar]
  56. Lenz, C.; Nasdala, L.; Talla, D.; Hauzenberger, C.; Seitz, R.; Kolitsch, U. Laser-induced REE3+ photoluminescence of selected accessory minerals –An “advantageous artefact” in Raman spectroscopy. Chem. Geol. 2015, 415, 1–16. [Google Scholar] [CrossRef] [Green Version]
  57. Chukanov, N.V.; Aksenov, S.M.; Rastsvetaeva, R.K.; Kristiansen, R.; Pekov, I.V.; Belakovskiy, D.I.; Van, K.V.; Bychkova, Y.V.; Britvin, S.N. Crystal structure of the OH-dominant gadolinite-(Y) analogue (Y,Ca)2(Fe,□)Be2Si2O8(OH,O)2 from Heftetjern pegmatite. Acta Crystallogr. 2017, B73, 899–906. [Google Scholar]
  58. Frost, R.L.; Xi, Y.; Scholz, R.; Lima, R.M.F.; Horta, L.F.C.; Lopez, A. Thermal analysis and vibrational spectroscopic characterization of the boro silicate mineral datolite–CaBSiO4(OH). Spectrochim. Acta A 2013, 115, 376–381. [Google Scholar] [CrossRef] [PubMed] [Green Version]
  59. Frost, R.L.; Scholz, R.; López, A.; Xi, Y.; de Siqueira Queiroz, C.; Belotti, F.M.; Cândido Filho, M. Raman, infrared and near-infrared spectroscopic characterization of the herderite–hydroxylherderite mineral series. Spectrochim. Acta A 2014, 118, 430–437. [Google Scholar] [CrossRef] [PubMed] [Green Version]
  60. Hofmeister, A.M.; Hoering, T.C.; Virgo, D. Vibrational spectroscopy of beryllium aluminosilicates: Heat capacity calculations from band assignments. Phys. Chem. Mineral. 1987, 14, 205–224. [Google Scholar] [CrossRef]
  61. Bačík, P.; Fridrichová, J.; Uher, P.; Pršek, J.; Ondrejka, M. The crystal chemistry of gadolinite-datolite group silicates. Can. Mineral. 2014, 52, 625–642. [Google Scholar] [CrossRef]
  62. Camara, F.; Oberti, R.; Ottolini, L.; Della Ventura, G.; Bellatreccia, F. The crystal chemistry of Li in gadolinite. Am. Mineral. 2008, 93, 996–1004. [Google Scholar] [CrossRef]
  63. Bubnova, R.S.; Filatov, S.K. Strong anisotropic thermal expansion in borates. Phys. Stat. Sol. 2008, 245, 2469–2476. [Google Scholar] [CrossRef]
  64. Morosin, B. Structure and thermal expansion of beryl. Acta Cryst. 1972, B28, 1899–1903. [Google Scholar] [CrossRef]
  65. Antao, S.M.; Hassan, I.; Parise, J.B. The structure of danalite at high temperature obtained from synchrotron radiation and Rietveld refinements. Can. Mineral. 2003, 41, 1413–1422. [Google Scholar] [CrossRef]
  66. Tang, J.-J.; Liu, X.; Xiong, Z.-H.; He, Q.; Sean, R.S.; Wang, H.-J. High temperature X-ray diffraction, DSC-TGA, polarized FTIR and high pressure Raman spectroscopy studies on euclase. Bull. Mineral. Petrol. Geochem. 2014, 33, 289–298. [Google Scholar]
  67. Hazen, R.M.; Finger, L.W. High-temperature crystal chemistry of phenakite (Be2SiO4) and chrysoberyl (BeAl2O4). Phys. Chem. Miner. 1987, 14, 426–434. [Google Scholar] [CrossRef]
  68. Henderson, C.M.B.; Taylor, D. Thermal expansion behavior of beryllonite [Na(BePO4)] and trimerite [CaMn(BeSiO4)3]. Min. Mag. 1984, 48, 431–436. [Google Scholar] [CrossRef]
  69. Antao, S.M.; Hassan, I.; Parise, J.B. Tugtupite: High-temperature structures obtained from in situ synchrotron diffraction and Rietveld refinements. Am. Mineral. 2004, 89, 492–497. [Google Scholar] [CrossRef]
  70. Bubnova, R.S.; Filatov, S.K. Vysokotemperaturnaya Kristallokhimiya Boratov i Borosilikatov (High Temperature Crystal Chemistry of Borates and Borosilicates); Nauka: St. Petersburg, Russia, 2008. (In Russian) [Google Scholar]
  71. Uher, P.; Ondrejka, M.; Konečný, P. Magmatic and post-magmatic Y-REE-Th phosphate, silicate and Nb-Ta-Y-REE oxide minerals in A-type metagranite: An example from the Turcok massif, the Western Carpathians, Slovakia. Mineral. Mag. 2009, 73, 1009–1025. [Google Scholar] [CrossRef]
  72. Jambor, J.L.; Roberts, A.C.; Griece, J.D.; Birkett, T.C.; Groat, L.A.; Zajac, S. Gerenite-(Y), (Ca,Na)2(Y,REE)3Si6O18·2H2O, a new mineral species, and an associated Y-bearing gadolinite-group mineral, from the Strange Lake peralkaline complex, Quebec-Labrador. Can. Mineral. 1998, 36, 793–800. [Google Scholar]
  73. Pekov, I.V.; Voloshin, A.V.; Pushcharovskii, D.Y.; Rastsvetaeva, R.K.; Chukanov, N.V.; Belokovskii, D.I. New data on calcybeborosilite-(Y) (REE,Ca)2(B,Be)2(SiO4)2(OH,O)2. Vestnik Moskovskogo Universiteta Geologiya 2000, 55, 62–70. [Google Scholar]
  74. Grew, E.S. Borosilicates (exclusive of tourmaline) and boron in rock-forming minerals in metamorphic enviroments. In Boron: Mineralogy, Petrology and Geochemistry; Grew, E.S., Anowitz, L.M., Eds.; Reviews in Mineralogy and Geochemistry; Mineralogical Society of America: Chantilly, VA, USA, 1996; Volume 33, pp. 387–502. [Google Scholar]
  75. Hazen, R.M.; Finger, L.W. Comparative Crystal Chemistry: Temperature, Pressure, Composition and the Variation of Crystal Structure; John Wiley and Sons Ltd.: London, UK, 1982; p. 231. [Google Scholar]
  76. Filatov, S.K. Vysokotemperaturnaya Kristallokhimiya (High Temperature Crystal Chemistry); Nedra: Leningrad, Russia, 1990. (In Russian) [Google Scholar]
Figure 1. Crystals of hingganite-(Y) from the Wanni glacier.
Minerals 10 00322 g001
Figure 2. Back-scatter electron detector (BSE) image, analyzed by WDX spots (1–5) and elemental maps (EDX), of studied crystals: (a) BSE image, (b) FeKα elemental map, (c) CaKα elemental map, (d) YLα elemental map.
Minerals 10 00322 g002
Figure 3. Published data on hingganites from different deposits plotted on classification diagrams of the gadolinite supergroup: (a) for determination of groups and subgroups, (b) for species determination. The legend for both graphs is given on the (b) graph.
Minerals 10 00322 g003
Figure 4. Classification diagram of the hingganites. Symbols are the same as in Figure 2.
Minerals 10 00322 g004
Figure 5. Raman spectrum (632.8 nm) of hingganite-(Y) from the Wanni glacier, Switzerland.
Minerals 10 00322 g005
Figure 6. Crystal structure of hingganite-(Y): (a) in the cb plane, (b) in the ab plane; (c) large cations layer in cb plane; (d) FeO6 in a ball-and-stick representation, (e) YO8 polyhedra in a ball-and-stick representation. BeO4 and SiO4 tetrahedra are given in light blue and grey, respectively; Y and H atoms are shown as dark blue and grey spheres, respectively; vacancy and Fe2+ in the M site demonstrated as a percentage by white and orange, respectively.
Minerals 10 00322 g006
Figure 7. The unit-cell parameters of hingganite-(Y) at different temperatures. The errors are smaller than symbols.
Minerals 10 00322 g007
Figure 8. Crystal structures of hingganite-(Y) and datolite at −173 °C with the section of the averaged thermal expansion. The sections of thermal expansion for datolite were calculated using the data of Rinaldi et al. [20]. SiO4 tetrahedra are given in grey; O atoms are shown as red spheres, H atoms as grey spheres, Y as dark blue sphere, and Ca as violet spheres. QO4 tetrahedra are shown in light blue (Q = Be for hingganite-(Y)) and green (Q = B for datolite). Vacancy and Fe2+ in the M site are shown as a percentage by white and orange, respectively.
Minerals 10 00322 g008
Figure 9. Normalized unit-cell parameters (a) and volumes (b) for hingganite-(Y) (filed symbols) and datolite (open symbols). Blue symbols demonstrate a parameters, red: b, green: c. The normalized parameters for datolite were calculated using data from [20].
Minerals 10 00322 g009
Table 1. Elemental composition (WDX) and coefficients in the formula of hingganite-(Y) from the Wanni glacier, Switzerland.
ConstituentMean,
wt.%
Range,
wt.%
SiteConstituent*A = 2*T = 2
Mean,
apfu
Mean,
apfu
CaO8.87(5)8.20–9.35ACa0.680.68
Y2O326.70(30)26.48–27.12Y1.021.02
La2O30.75(4)0.69–0.78La0.020.02
Ce2O30.64(8)0.31–0.90Ce0.020.02
Pr2O30.15(3)0.03–0.23Pr0.000.00
Nd2O31.15(3)0.78–1.52Nd0.030.03
Sm2O30.87(4)0.64–1.15Sm0.020.02
Eu2O30.07(2)0.06–0.09Eu0.000.00
Gd2O31.74(5)1.25–2.27Gd0.040.04
Tb2O30.82(4)0.67–0.96Tb0.020.02
Dy2O32.15(2)1.98–2.31Dy0.050.05
Ho2O30.61(4)0.42–0.69Ho0.010.01
Er2O31.15(3)1.00–1.34Er0.030.03
Tm2O30.20(3)0.05–0.28Tm0.000.00
Yb2O30.56(3)0.47–0.73Yb0.010.01
ThO22.79(7)2.16–3.45Th0.050.05
FeO6.55(9)6.42–6.79MFe0.390.39
MgO0.03(1)0.01–0.05Mg0.000.00
SiO227.83(10)27.32–28.27T + QSi1.992.00
As2O50.13(5)0.080.16As0.000.00
BeOcalc **6.64 Be1.141.15
B2O3calc **6.97 B0.860.86
H2Ocalc ***1.98 ϕOH ****0.951.03
O ****1.050.97
ACa/sum of A-site cations0.340.34
TSi/sum of T-site cations1.001.00
Total99.36 sum of M-site cations0.390.39
Note: * atom per formula unit (apfu) calculated according to Bačík et al. [4] based on (1) sum of cations at the A site equals 2 or (2) sum of cations at the T site equals 2; ** BeO/B2O3 content calculated according to Bačík et al. [4], their ratio calculated using X-ray data (see Table 2 and Table 3) and based on Demartin et al. [33]; *** Calculated on the basis of stoichiometry by assuming (OH) + O2– + F = 2 apfu, **** O/(OH) ratio calculated based on the charge balance.
Table 2. Crystallographic data and refinement parameters for hingganite-(Y).
Temperature, °C−173−143−113−83−53−23+7
Temperature pointT01T02T03T04T05T06T07
Space group, ZP21/c, 2
a, Å4.7469(2)4.7458(2)4.7482(3)4.7491(3)4.7498(3)4.7493(3)4.7494(3)
b, Å7.5919(3)7.5932(3)7.5917(3)7.5927(3)7.5956(3)7.5995(3)7.6003(3)
c, Å9.8841(3)9.8844(3)9.8801(4)9.8789(4)9.8822(4)9.8822(3)9.8794(4)
β, ˚90.249(3)90.246(3)90.293(4)90.297(4)90.290(4)90.294(4)90.304(4)
Volume, Å3356.20(2)356.19(2)356.15(3)356.25(3)356.52(3)356.67(3)356.61(3)
Data collection
Wavelength, Å 0.71073
Max. θ°32.03632.03332.43332.09032.41832.40732.407
Index ranges−4 ≤ h ≤ 7
−11 ≤ k ≤ 9
−13 ≤ l ≤ 14
−7 ≤ h ≤ 4
−11 ≤ k ≤ 9
−14 ≤ l ≤ 13
−7 ≤ h ≤ 5
−11 ≤ k ≤ 4
−13 ≤ l ≤ 14
−7 ≤ h ≤ 5
−11 ≤ k ≤ 4
−13 ≤ l ≤ 14
−7 ≤ h ≤ 5
−11 ≤ k ≤ 4
−13 ≤ l ≤ 14
−7 ≤ h ≤ 5
−11 ≤ k ≤ 4
−13 ≤ l ≤ 14
−7 ≤ h ≤ 5
−11 ≤ k ≤ 4
−13 ≤ l ≤ 14
No. meas. refl.1960191920341985202220222018
No. uniq. refl.1125112511161107111611171113
No. obs. refl
(I > 2σ(I))
10201029101510081014998985
Refinement of the structure
No. of variables81797979797979
Rint0.03720.03790.03620.03820.03820.03790.0360
R1, all data0.05370.05370.05430.05400.05590.05540.0556
R1, I > 2σ(I)0.04710.04850.04850.04850.04930.04810.0478
wR2, all data0.09650.10000.10850.10590.10830.10490.1080
wR2, I > 2σ(I)0.09420.09780.10640.10330.10580.10230.1046
GooF1.3671.3491.3431.2981.3281.3571.258
Table 3. Bond distances (Å) and polyhedral volumes (Å3) in the crystal structure of hingganite-(Y).
Temperature, °C−173−143−113−83−53−23+7
Temperature pointT01T02T03T04T05T06T07
SiO4 tetrahedra
Si–O31.592(6)1.593(6)1.596(6)1.594(5)1.589(6)1.590(6)1.591(5)
Si–O41.647(6)1.649(6)1.644(6)1.648(5)1.646(6)1.644(5)1.649(5)
Si–O11.637(6)1.637(6)1.638(6)1.639(6)1.639(5)1.635(6)1.634(5)
Si–O51.644(6)1.639(6)1.635(6)1.630(6)1.634(6)1.636(6)1.629(6)
<Si–O>1.6301.6291.6281.6281.6271.6261.626
Volume2.2102.2082.1202.2012.1972.1942.195
BeO4 tetrahedra
Be–O21.573(9)1.581(9)1.573(10)1.570(9)1.572(10)1.571(10)1.574(9)
Be–O51.603(10)1.597(10)1.595(10)1.600(9)1.606(10)1.600(10)1.603(9)
Be–O11.598(9)1.594(10)1.613(10)1.612(10)1.611(10)1.607(10)1.598(9)
Be–O41.602(10)1.598(10)1.602(9)1.591(8)1.598(9)1.607(9)1.605(8)
<Be–O>1.5941.5921.5961.5931.5971.5961.595
Volume2.0642.0582.0702.0602.0732.0742.068
YO8 polyhedra
Y–O12.501(5)2.501(6)2.510(6)2.505(5)2.508(6)2.511(6)2.512(5)
Y–O42.366(5)2.366(6)2.364(6)2.364(5)2.363(5)2.363(5)2.361(5)
Y–O32.308(5)2.306(5)2.302(5)2.304(5)2.308(5)2.305(5)2.306(5)
Y–O22.537(6)2.537(6)2.527(6)2.535(5)2.532(6)2.531(6)2.534(5)
Y–O22.446(6)2.444(6)2.453(6)2.448(5)2.452(6)2.458(6)2.450(5)
Y–O32.309(6)2.310(6)2.312(5)2.313(5)2.316(6)2.316(6)2.314(5)
Y–O12.658(6)2.660(6)2.649(6)2.657(5)2.655(6)2.657(6)2.661(5)
Y–O52.374(6)2.380(6)2.376(5)2.382(5)2.373(6)2.377(5)2.380(5)
<Y–O>2.4372.4382.4362.4382.4382.4402.440
Volume24.66824.68124.65524.71824.71624.75524.747
FeO6 octahedra
Fe–O2 (×2)2.061(5)2.061(5)2.058(6)2.063(5)2.062(6)2.061(6)2.064(5)
Fe–O4 (×2)2.222(5)2.221(5)2.229(6)2.222(5)2.223(5)2.223(5)2.222(5)
Fe–O5 (×2)2.264(5)2.267(6)2.274(5)2.274(5)2.279(6)2.276(5)2.282(5)
<Fe–O>2.1822.1832.1872.1862.1882.1872.190
Volume12.98012.98513.06413.05513.10213.07813.121
H–O contact
H–O20.90(6)0.90(6)0.90(4)0.91(4)0.90(4)0.91(4)0.90(4)
Table 4. Thermal expansion coefficients (TECs) (×106 °C−1) of hingganite-(Y) along the principal axes of the thermal expansion tensor and along crystallographic axes.
T, °Cα11α22α33μ (α33^c)αaαbαcαβαV
Linear approximation
(−173)–(+7)5(1)6(1)−3(1)21(1)4(1)7(1)−2(1)3(1)9(2)
Quadratic polynomial approximation
−17311(2)−2(2)−7(2)22(2)9(2)−2(2)−5(2)8(2)1(3)
−1439(2)1(2)−6(2)22(2)7(2)1(2)−4(2)6(2)4(3)
−1137(1)4(1)−4(1)21(1)6(1)4(1)−3(1)5(1)6(2)
−835(1)6(1)−3(1)21(1)4(1)7(1)−2(1)3(1)9(2)
−533(1)10(1)−2(1)20(1)3(1)9(1)−1(1)2(1)11(2)
−231(2)12(2)0(2)14(2)1(2)12(2)0(2)0(2)13(3)
7−1(2)15(2)1(2)27(2)0(2)15(2)1(2)−1(2)16(3)
Table 5. TECs (×106 °C−1) of beryllium silicate minerals along the principal axes of the thermal expansion tensor and along the crystallographic axes.
Mineral, FormulaDimensionαa11αb22αc33αVΔt, °CRef.
Beryl, Be3Al2Si6O180D3/33/33/3825–800[64]
Danalite, Be3Fe2+4(SiO4)3S3D5/55/55/51633–1035[65] *
Euclase, BeAlSiO4(OH)3D7/410/109/112425–950[66] *
Phenakite, Be2SiO43D5/55/56/61725–690[67]
Trimerite, CaMn2(BeSiO4)33D9/912/129/92925–800[68] *
Tugtupite, Na4BeAlSi4O12Cl3D11/1111/118/83133–982[69] *
Notes: * Thermal expansion coefficients calculated using the data on the unit-cell parameters from the original articles.

