Thermoelastic Properties of K0.7Na0.3AlSi3O8 Hollandite and NaAlSi2O6 Jadeite: Implication for the Fate of the Subducted Continental Crust in the Deep Mantle

 ,
, 
Abstract
:1. Introduction
2. Materials and Methods
2.1. Starting Material
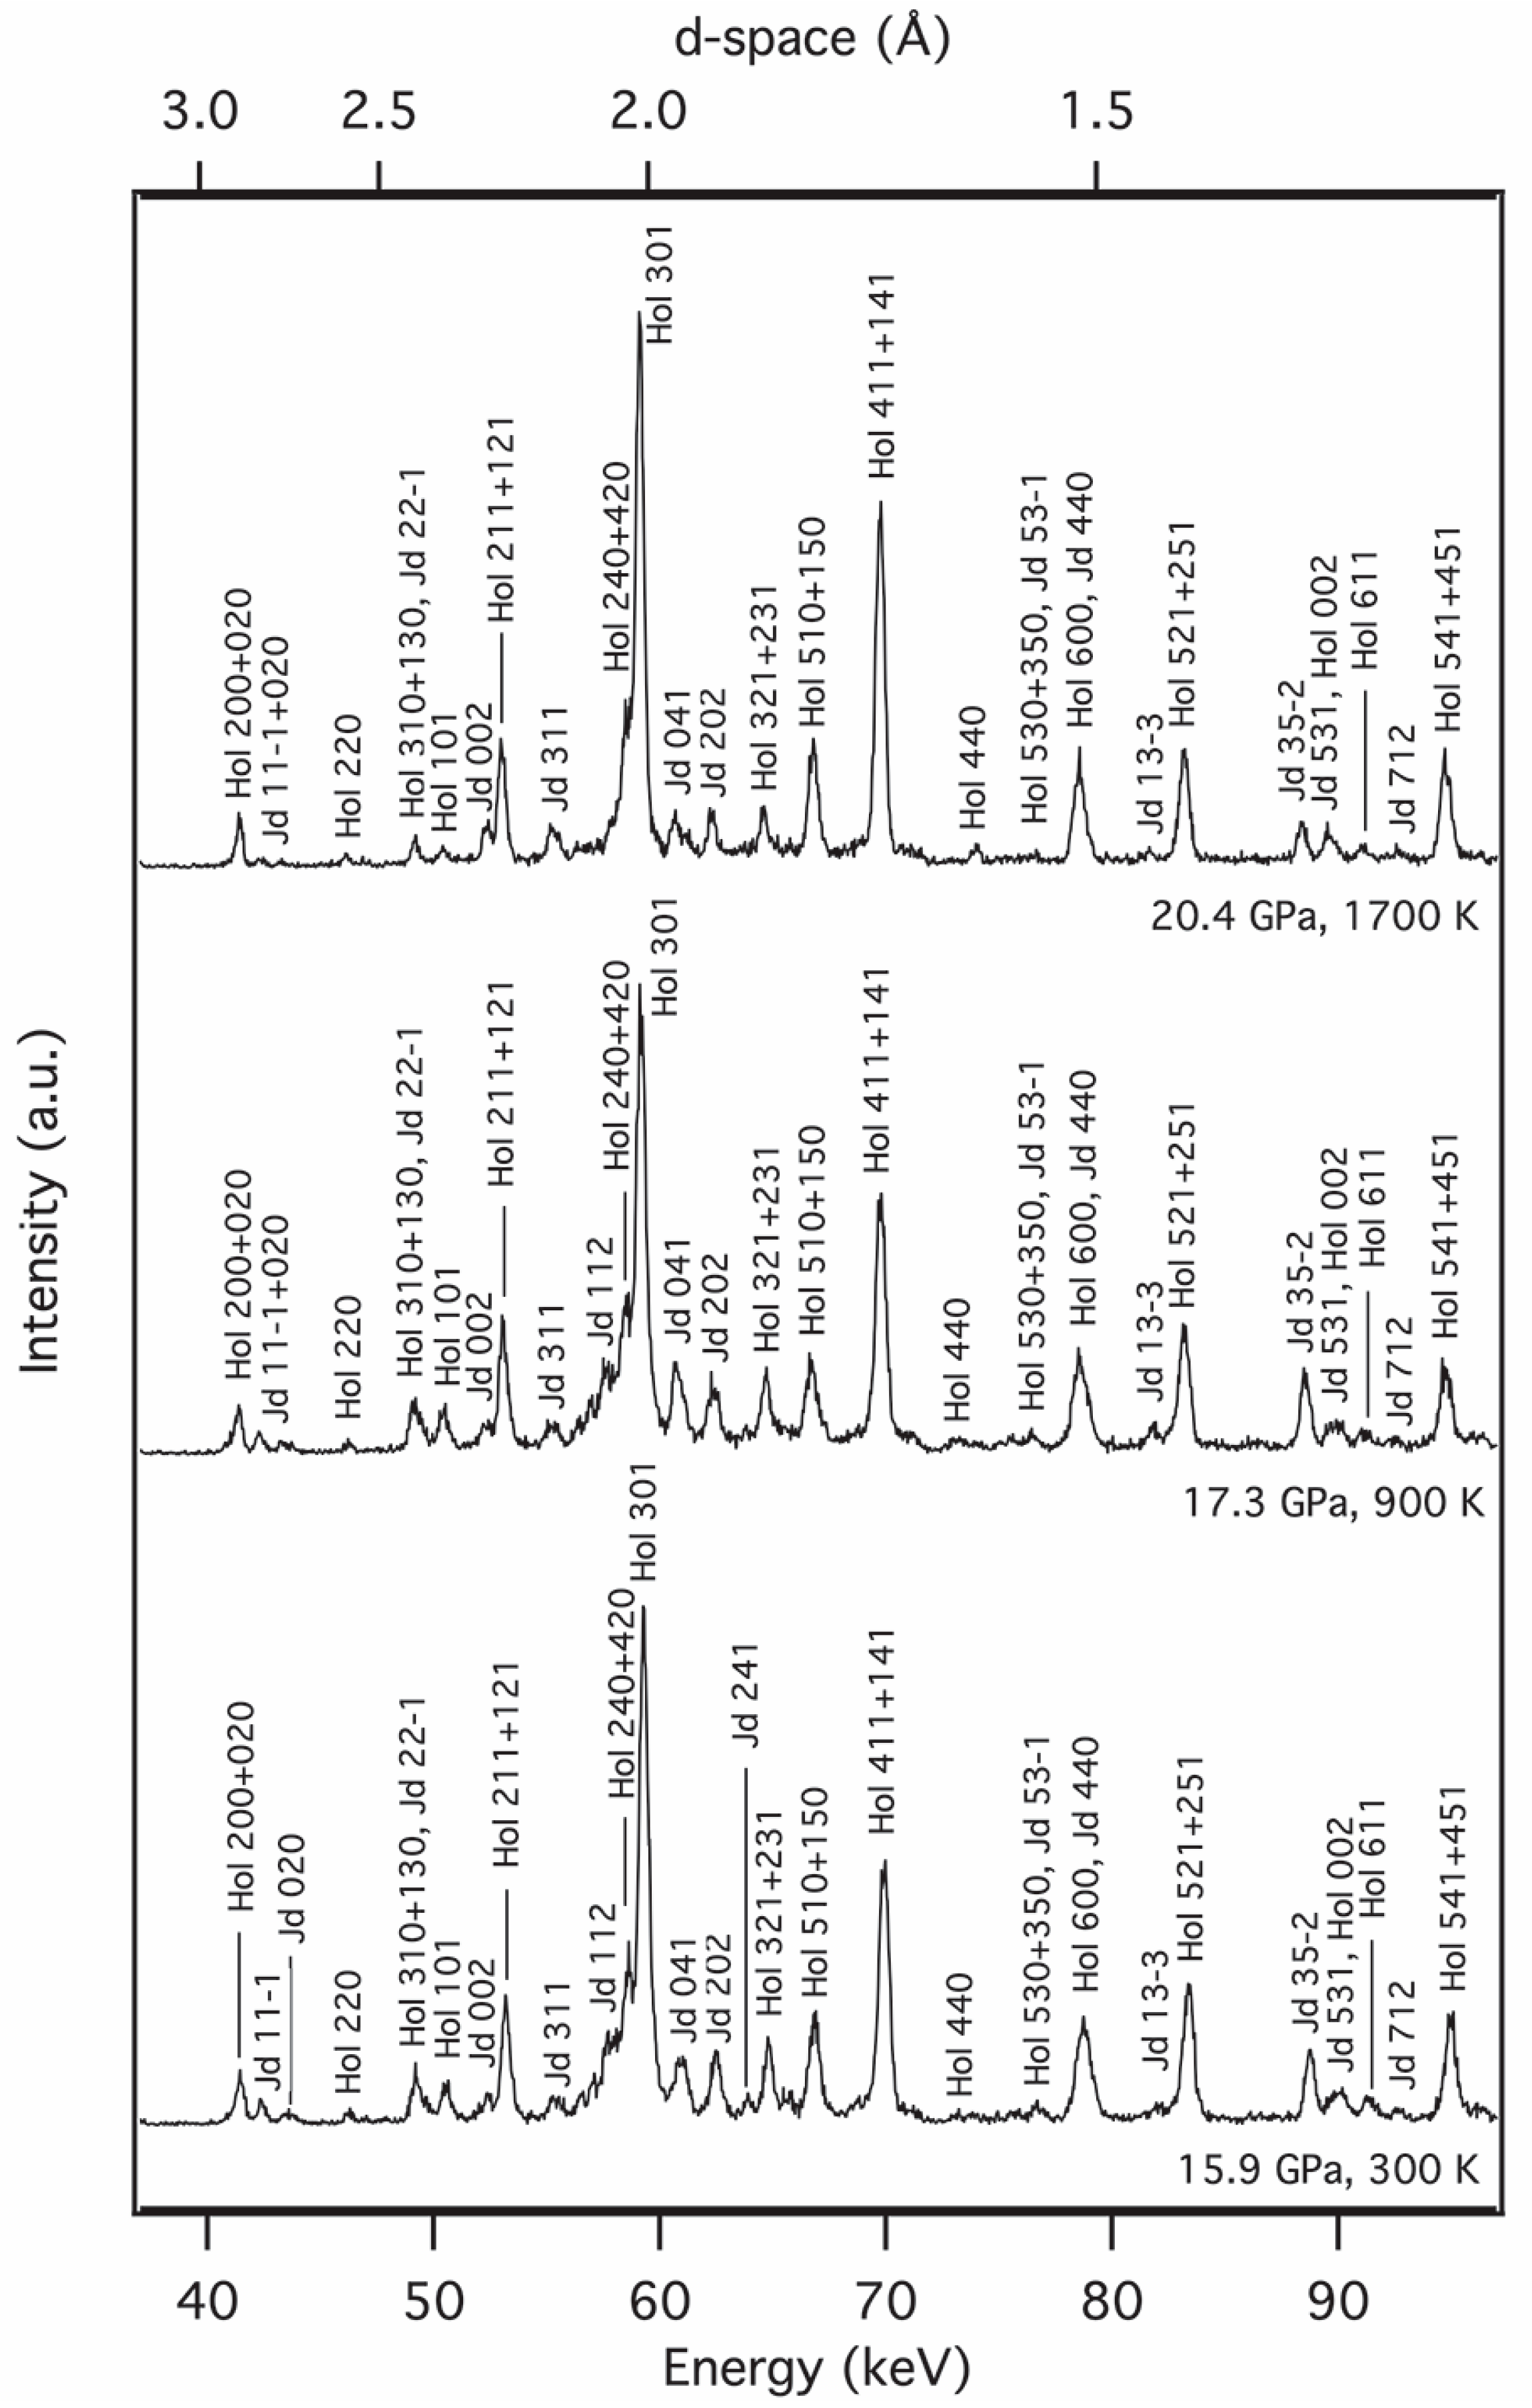
2.2. High Pressure Synchrotron Experiments
2.3. Data Reduction and EoS Procedure
3. Results
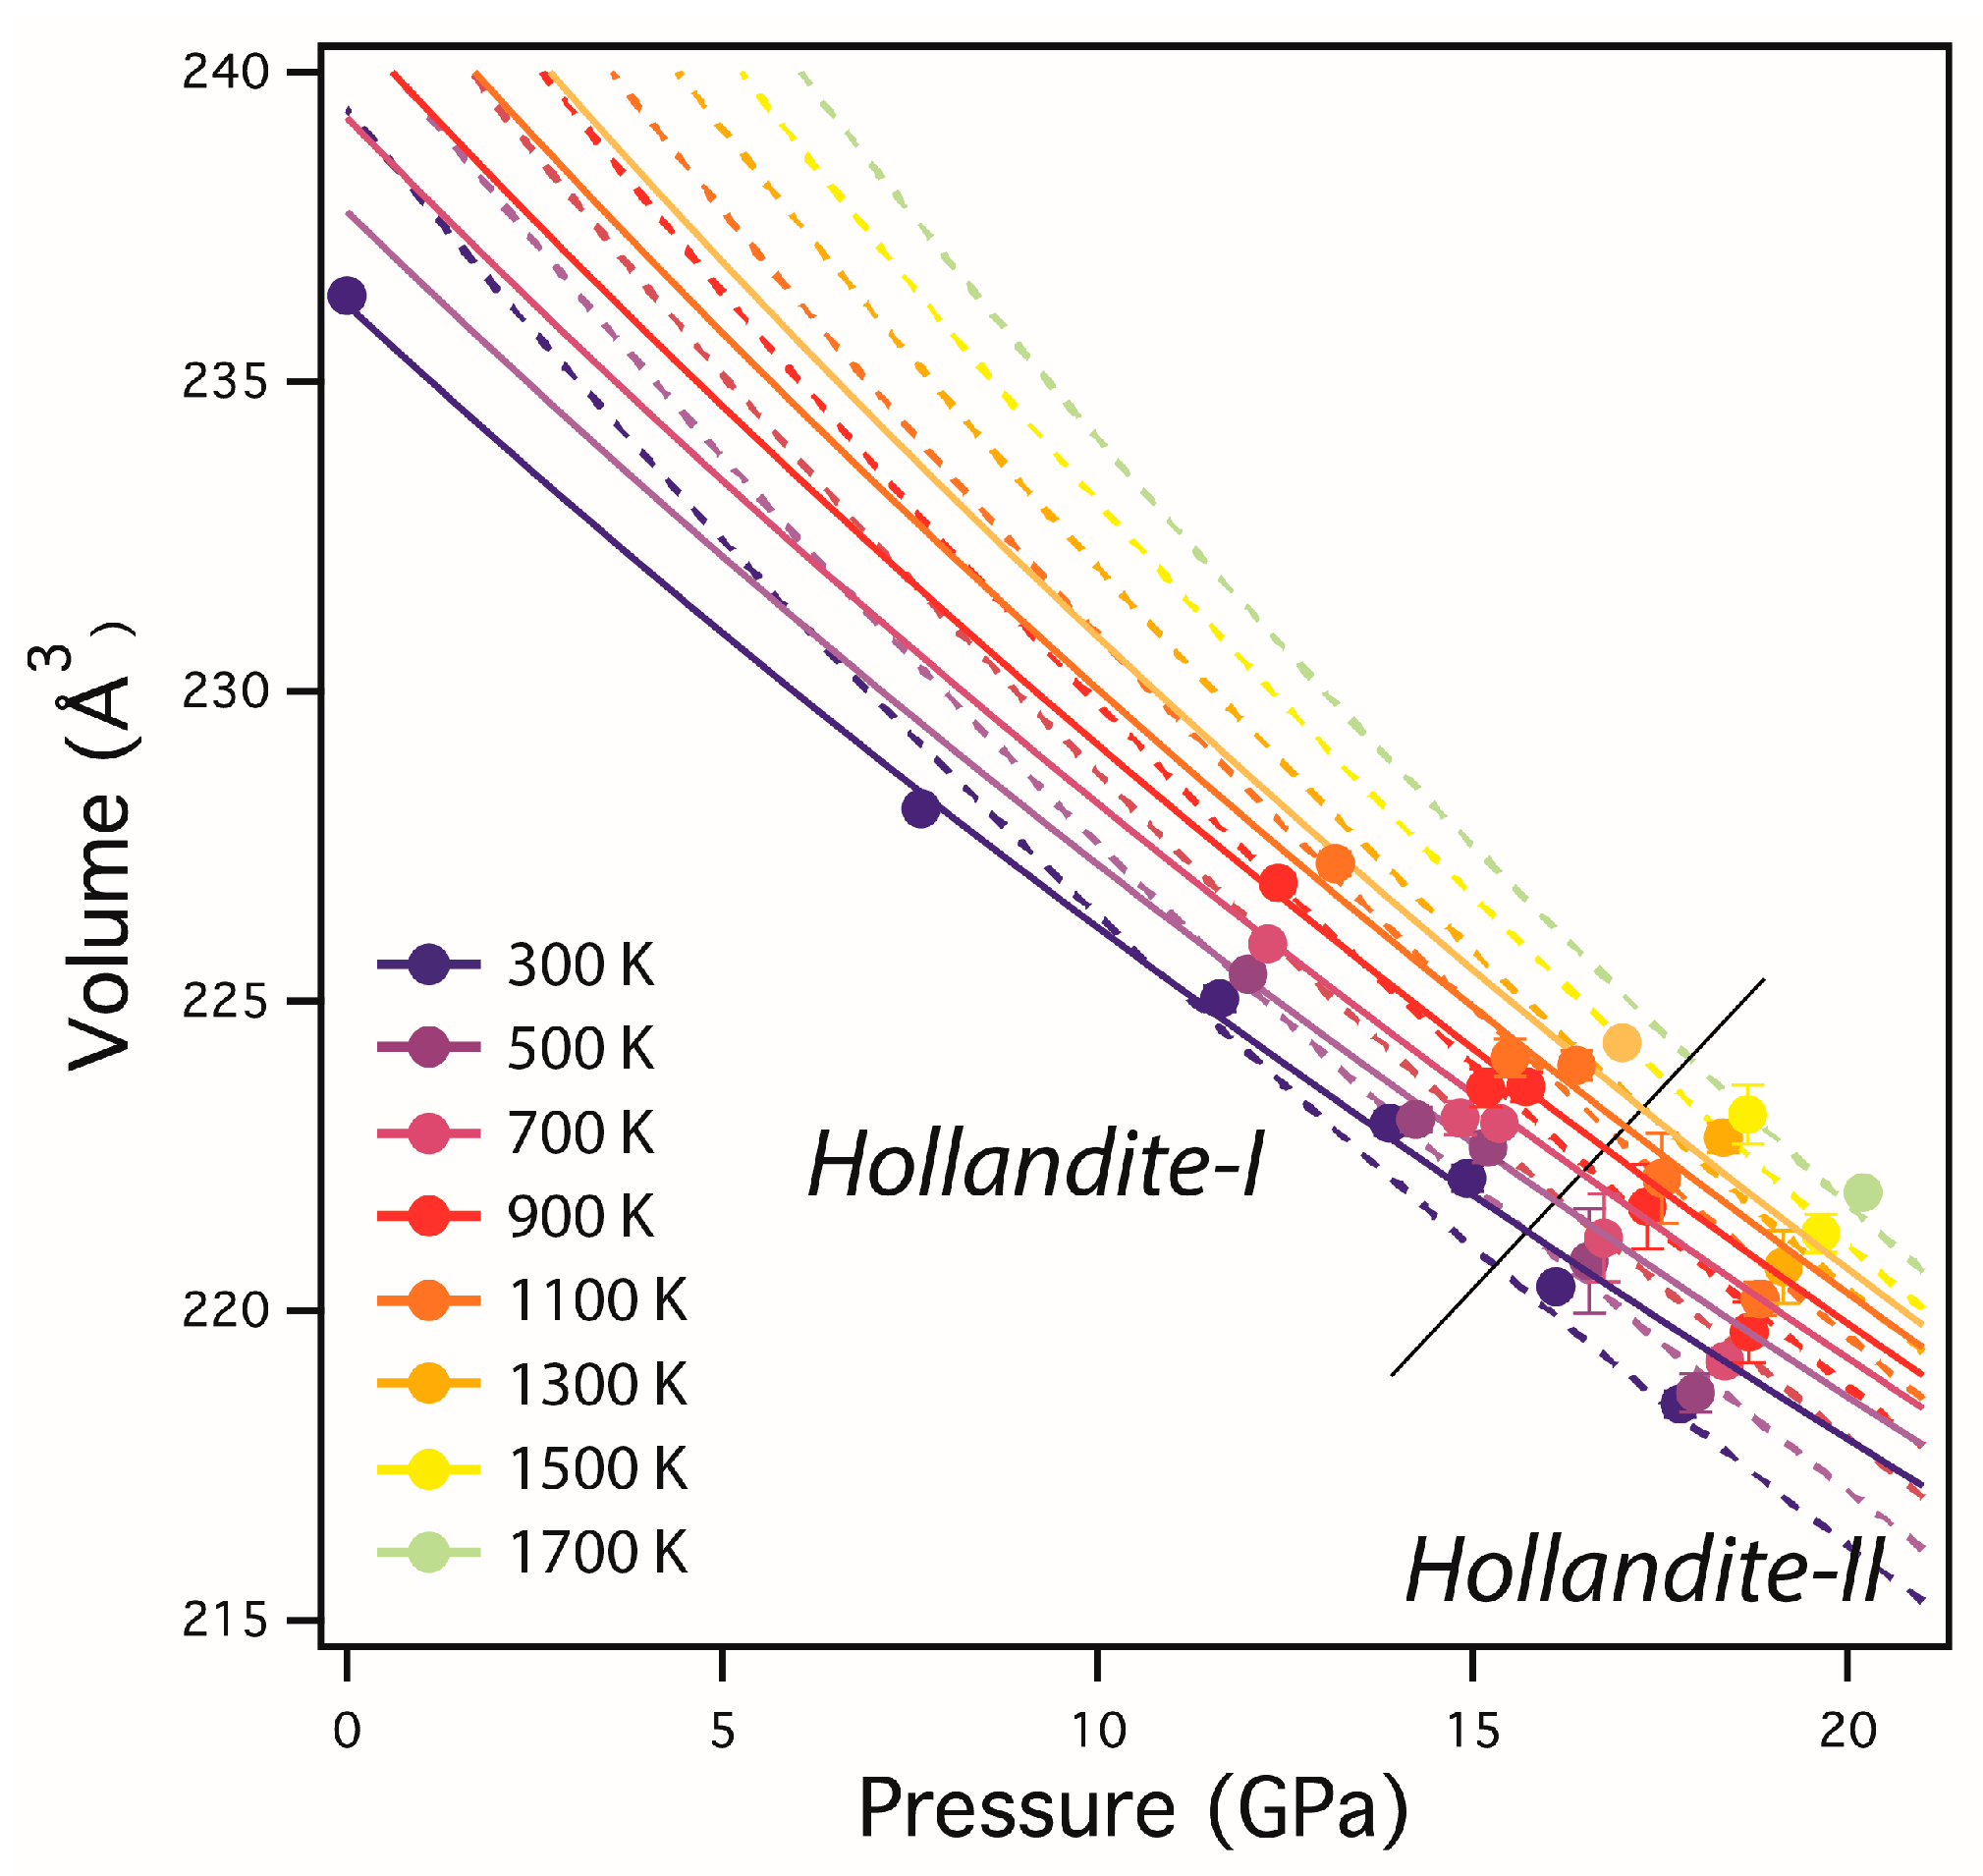
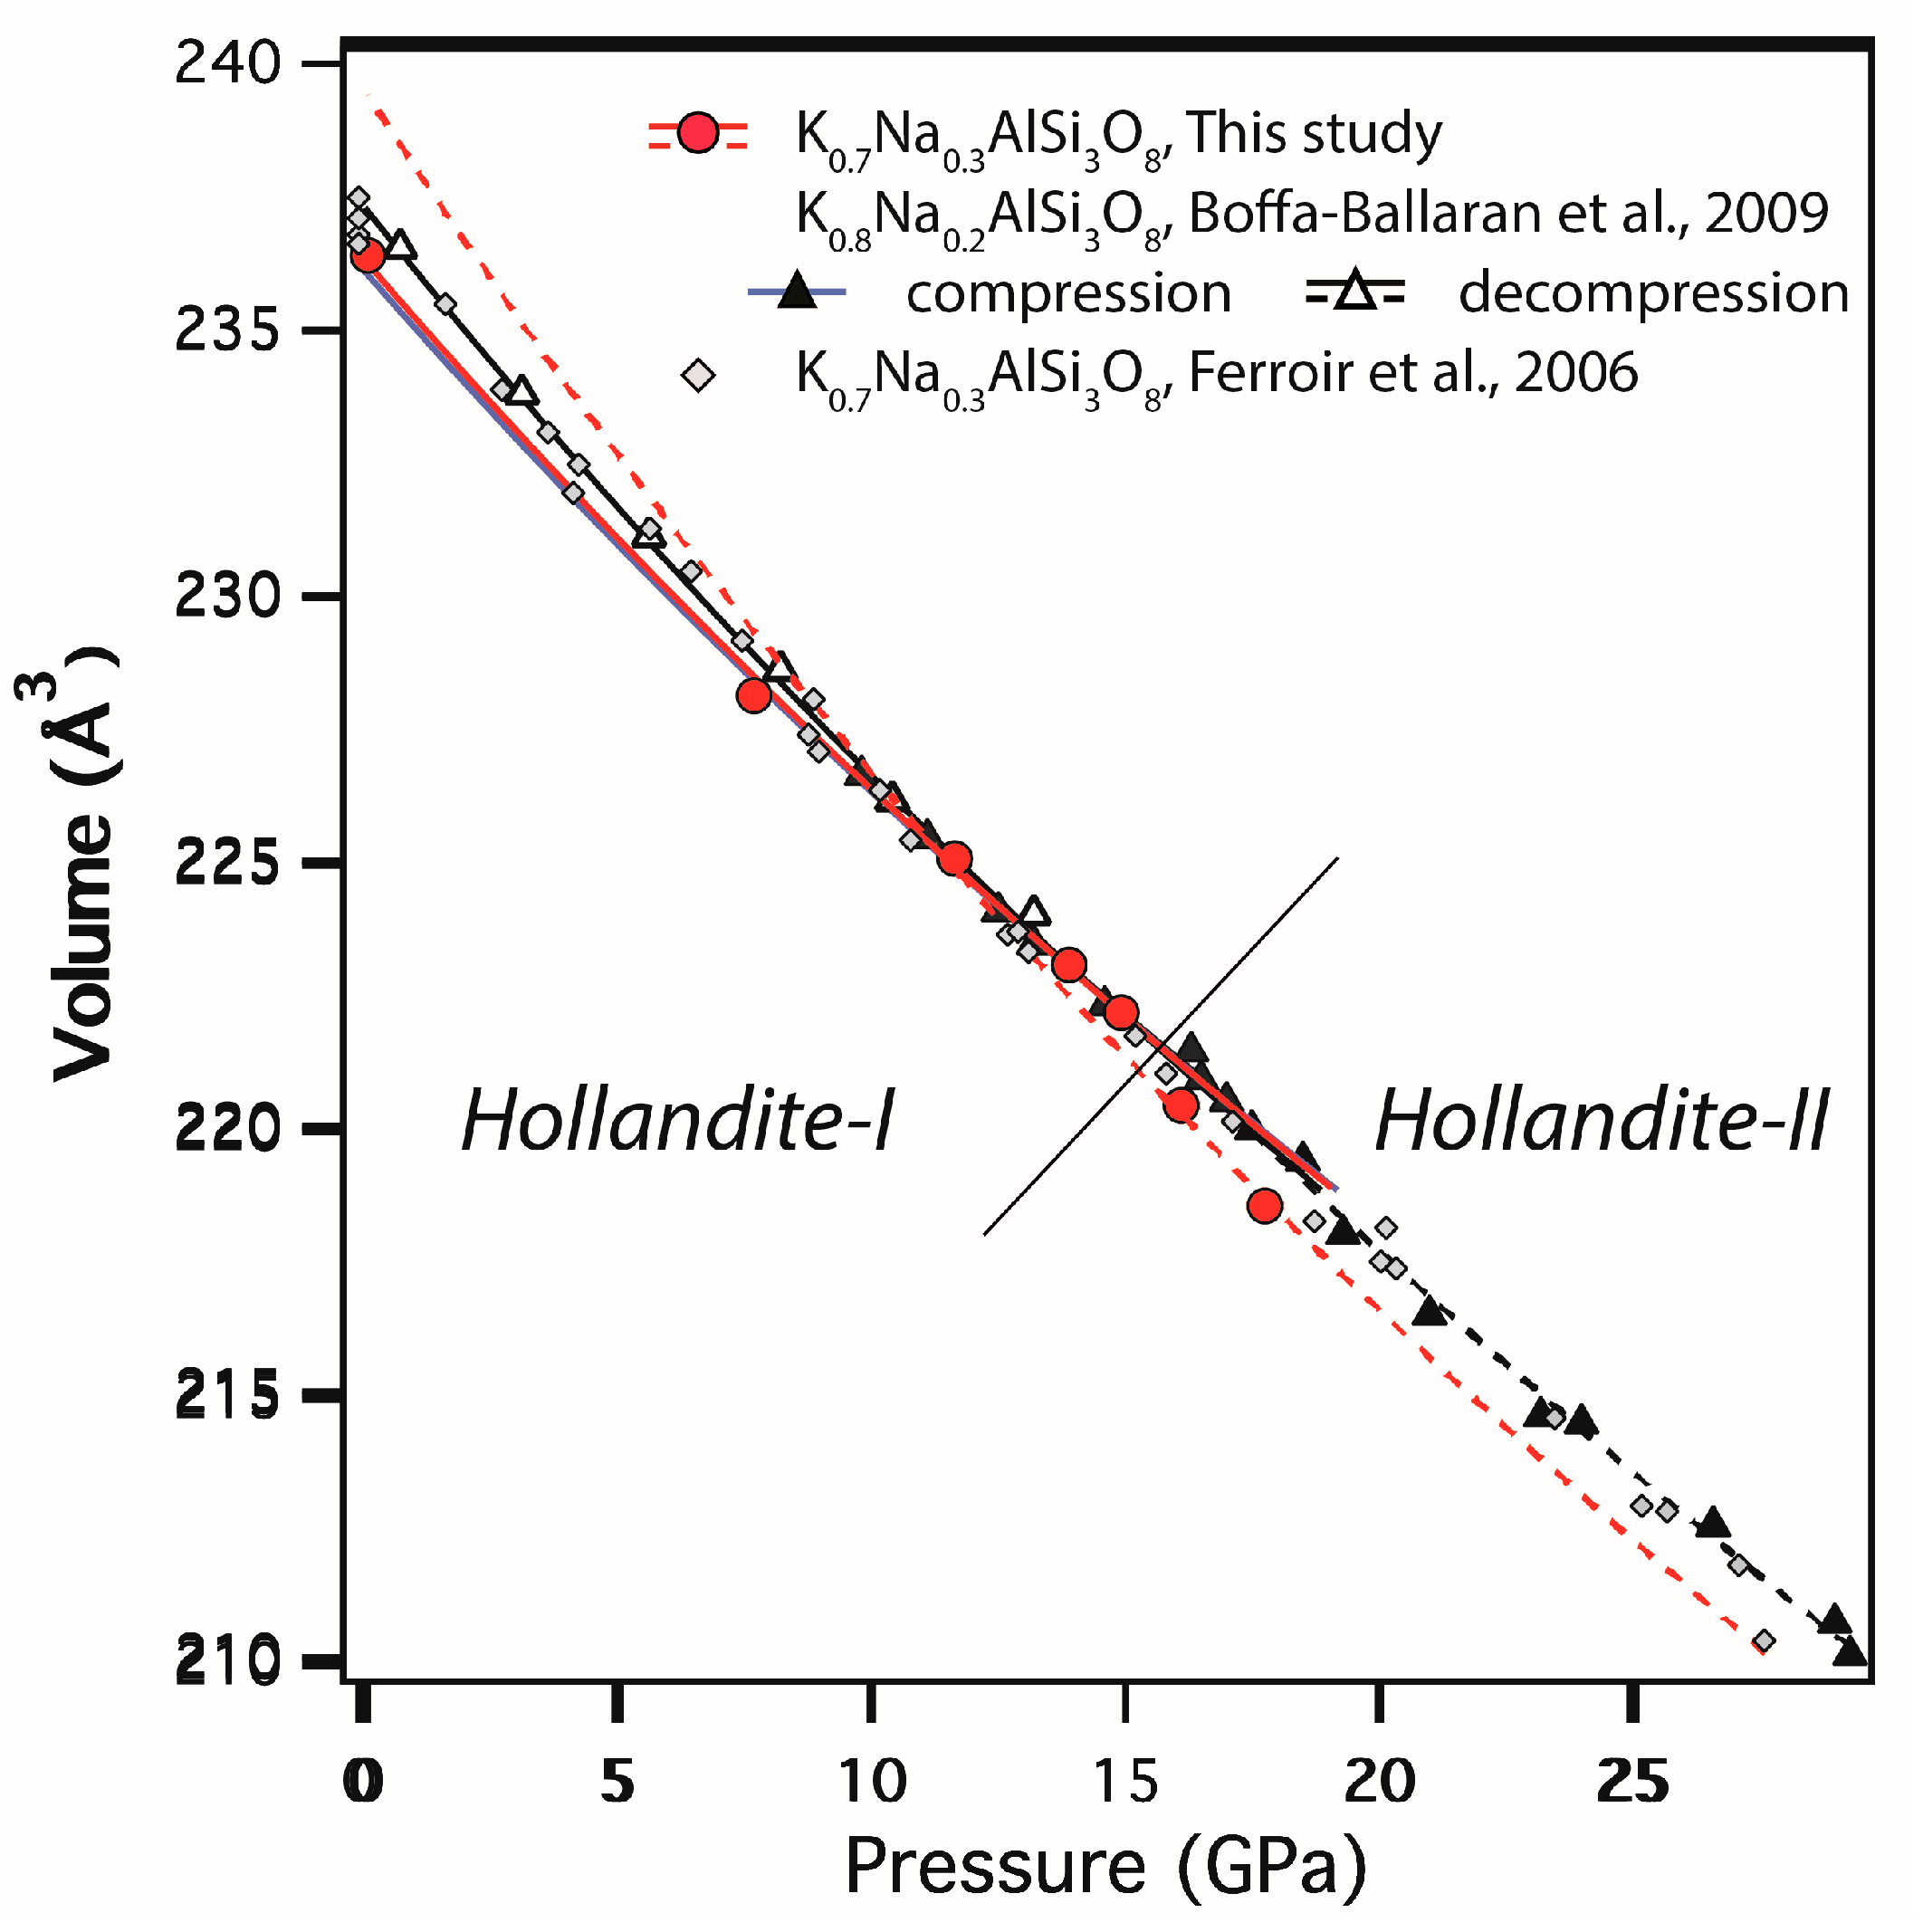
3.1. P–V–T EoS of K0.7Na0.3AlSi3O8 Liebermannite
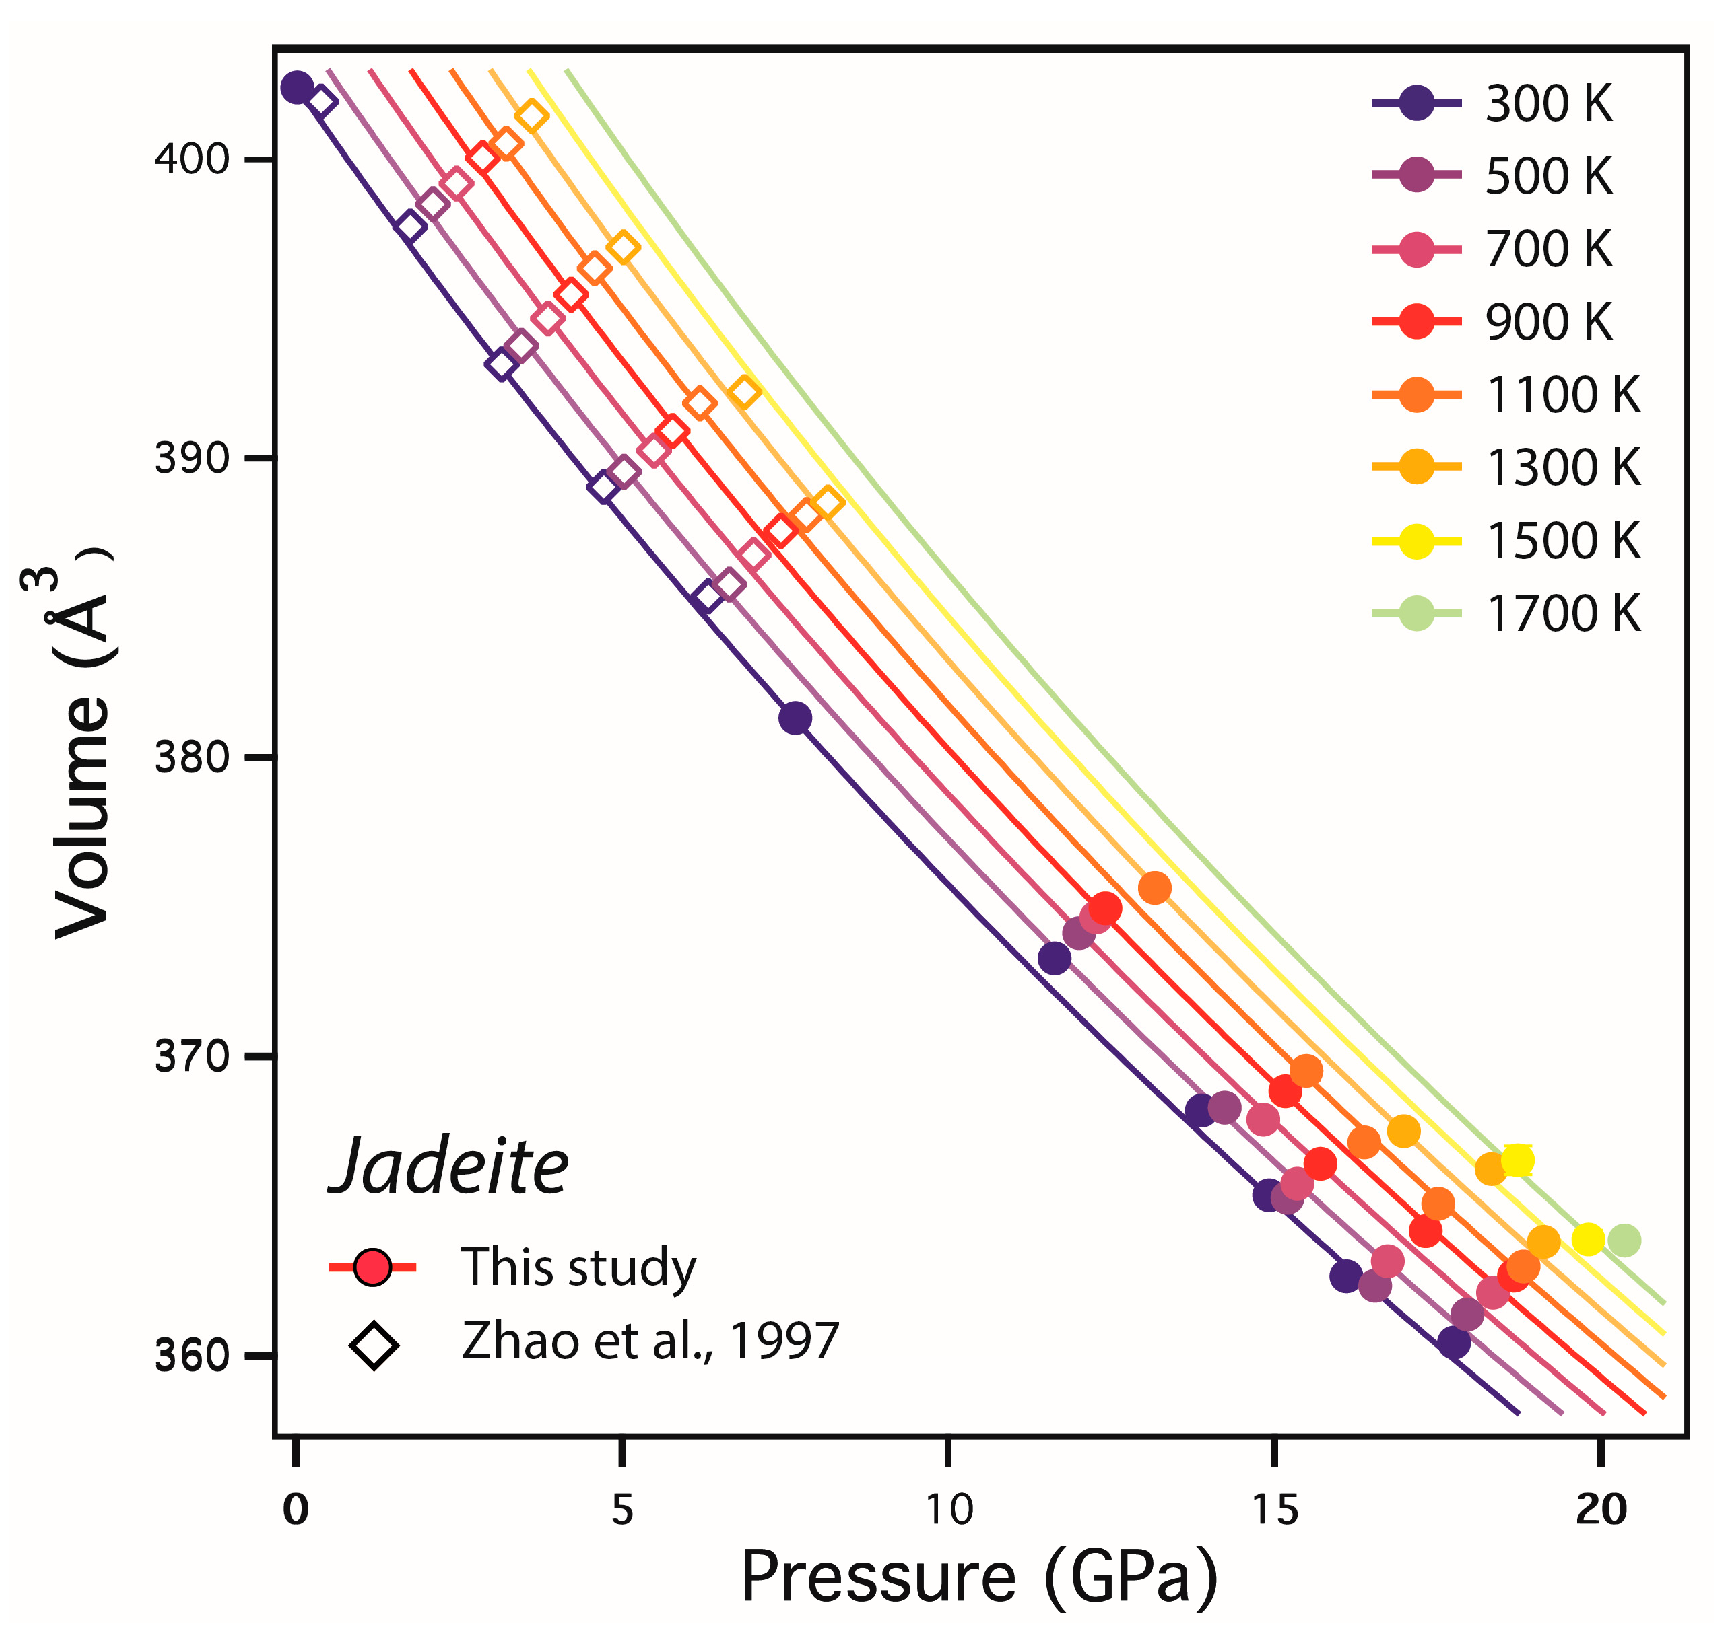
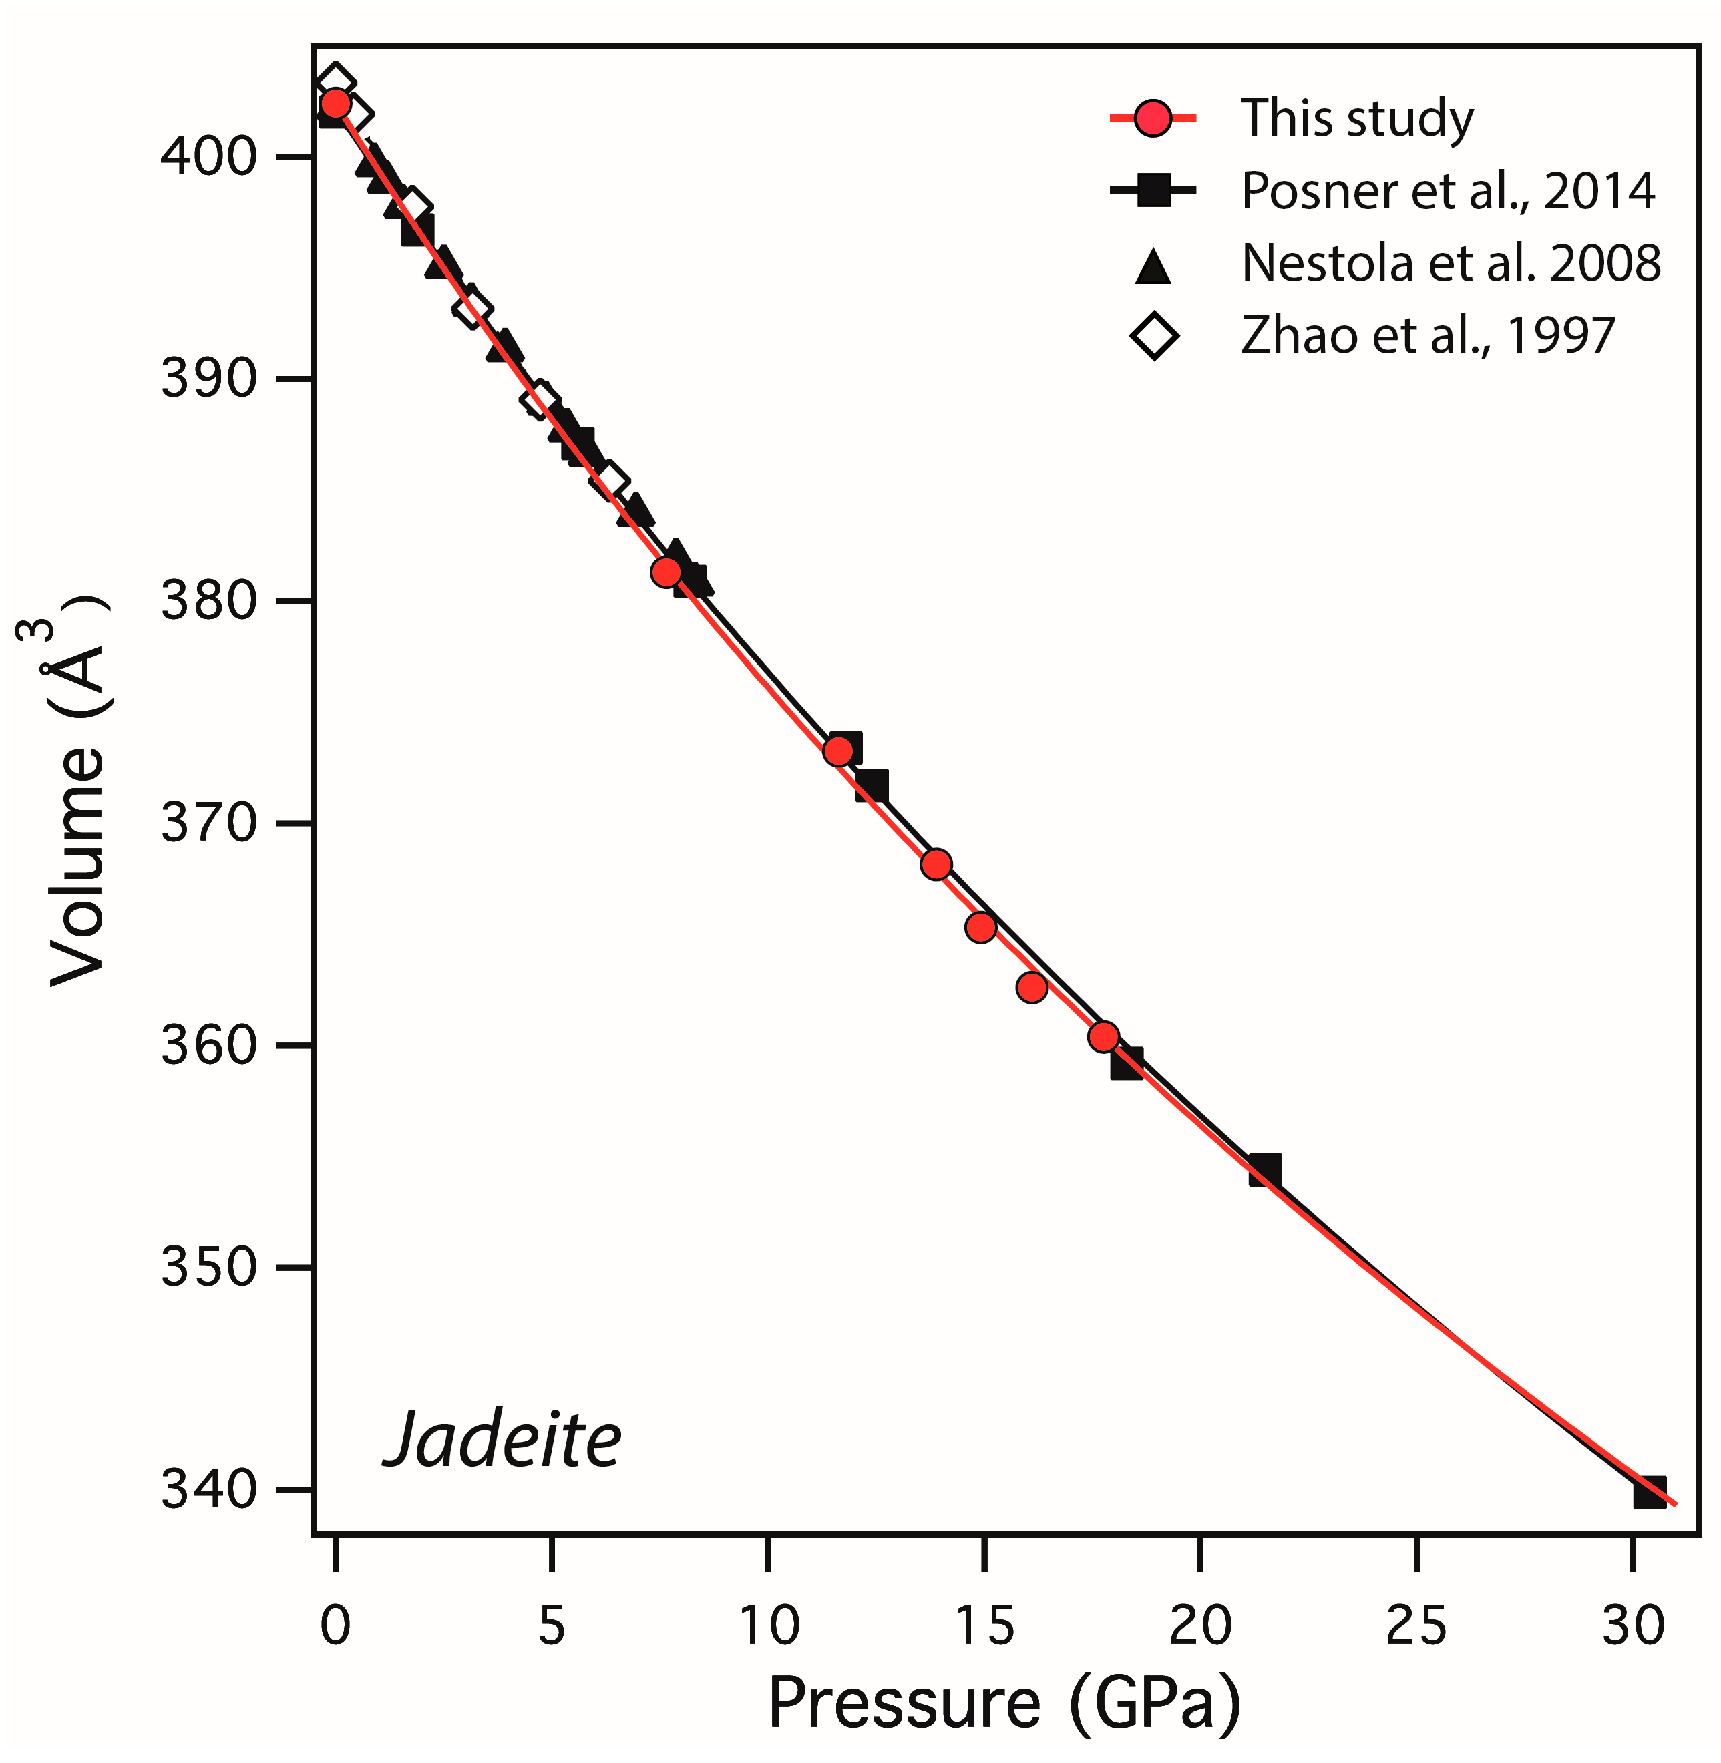
3.2. P–V–T EoS of Jadeite
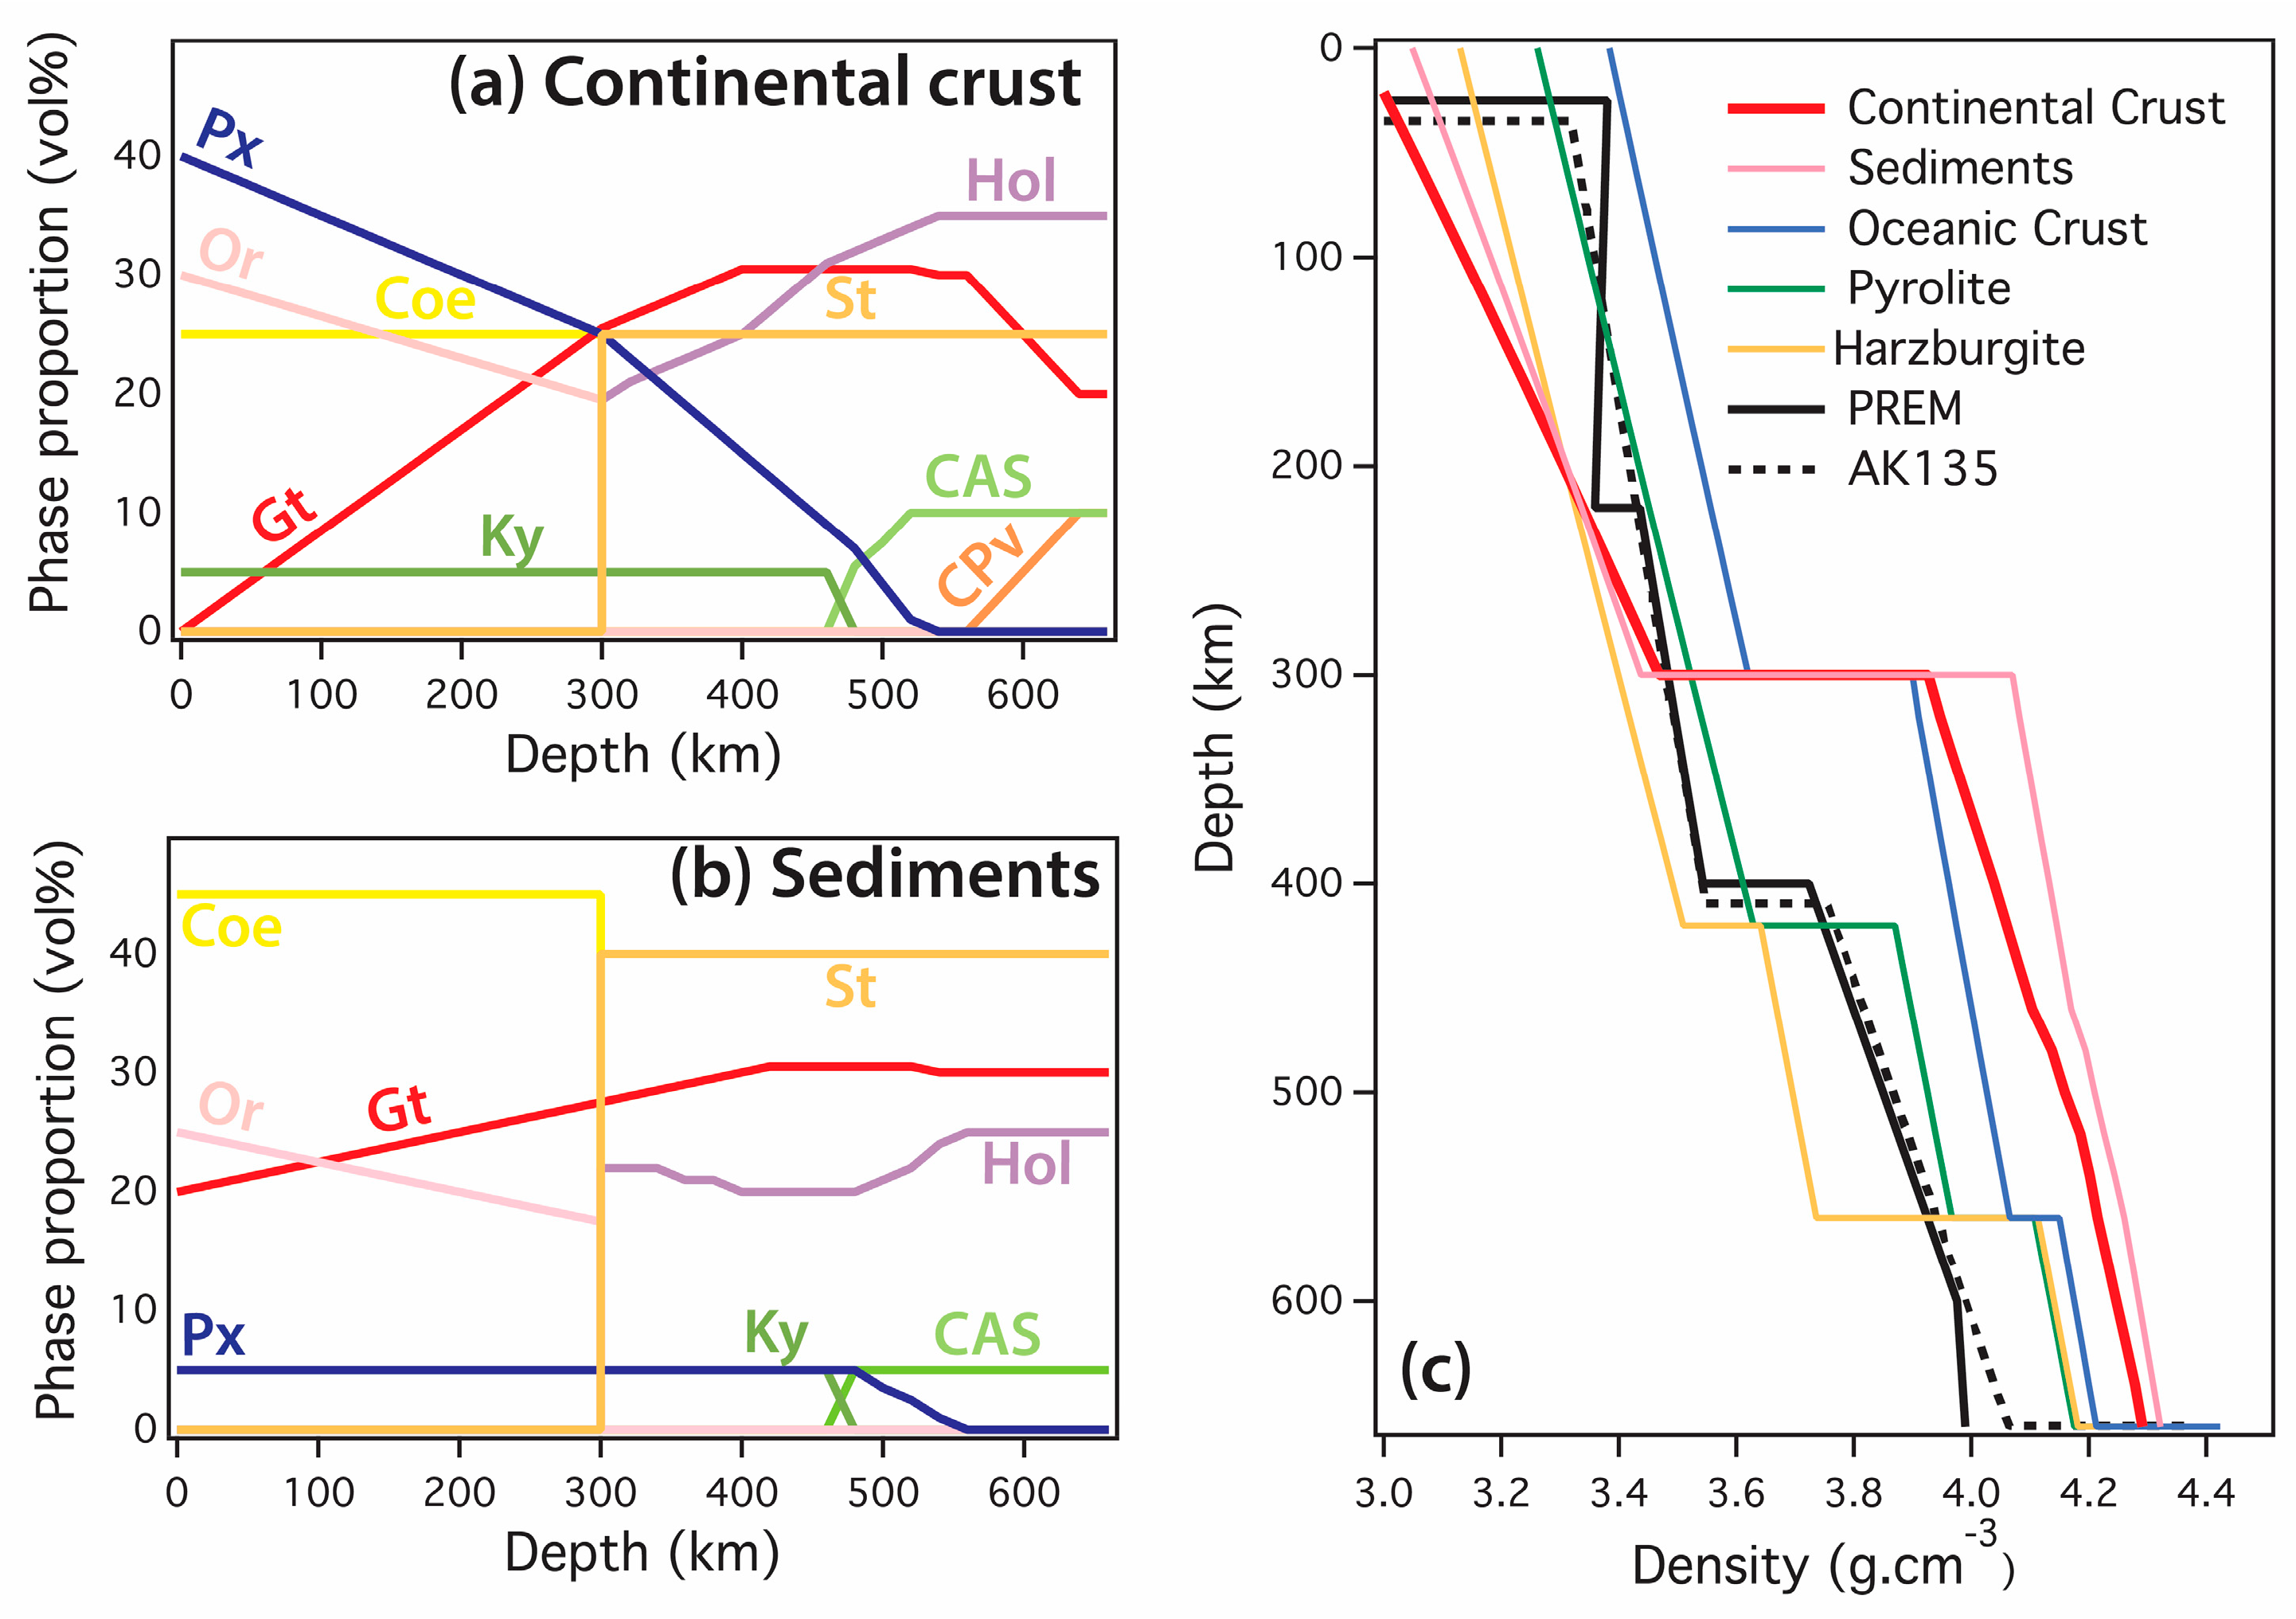
4. Discussion
Supplementary Materials
Author Contributions
Funding
Acknowledgments
Conflicts of Interest
References
- Yamamoto, S.; Senshu, H.; Rino, S.; Gondwana, S.O. 2009 Granite subduction: Arc subduction, tectonic erosion and sediment subduction. Gondwana Res. 2009, 15, 443–453. [Google Scholar] [CrossRef] [Green Version]
- Bulanova, G.P.; Walter, M.J.; Smith, C.B.; Kohn, S.C.; Armstrong, L.S.; Blundy, J.; Gobbo, L. Mineral inclusions in sublithospheric diamonds from Collier 4 kimberlite pipe, Juina, Brazil: Subducted protoliths, carbonated melts and primary kimberlite magmatism. Contrib. Mineral. Petro. 2010, 160, 489–510. [Google Scholar] [CrossRef]
- Cid, J.P.; Nardi, L.V.S.; Cid, C.P.; Gisbert, P.E.; Balzaretti, N.M. Acid compositions in a veined-lower mantle, as indicated by inclusions of (K,Na)-Hollandite + SiO2 in diamonds. LITHOS 2014, 196–197, 42–53. [Google Scholar]
- Irifune, T.; Ringwood, A.E.; Hibberson, W.O. Subduction of continental crust and terrigenous and pelagic sediments: An experimental study. Earth Planet. Sci. Lett. 1994, 126, 351–368. [Google Scholar] [CrossRef]
- Ishii, T.; Kojitani, H.; Akaogi, M. High-pressure phase transitions and subduction behavior of continental crust at pressure–temperature conditions up to the upper part of the lower mantle. Earth Planet. Sci. Lett. 2012, 357, 31–41. [Google Scholar] [CrossRef]
- Plank, T.; van Keken, P.E. Geodynamics: The ups and downs of sediments. Nat. Geosci. 2008, 1, 17–18. [Google Scholar] [CrossRef]
- Ichikawa, H.; Kawai, K.; Yamamoto, S.; Kameyama, M. Supply rate of continental materials to the deep mantle through subduction channels. Tectonophysics 2013, 592, 46–52. [Google Scholar] [CrossRef]
- Kawai, K.; Tsuchiya, T.; Tsuchiya, J.; Maruyama, S. Lost primordial continents. Gondwana Res. 2009, 16, 581–586. [Google Scholar] [CrossRef]
- Helffrich, G.R.; Wood, B.J. The Earth’s mantle. Nature 2001, 412, 501–507. [Google Scholar] [CrossRef]
- Turcotte, D.L.; Paul, D.; White, W.M. Thorium-uranium systematics require layered mantle convection. J. Geophys. Res. 2001, 106, 4265–4276. [Google Scholar] [CrossRef]
- Li, B.; Rigden, S.M.; Liebermann, R.C. Elasticity of stishovite at high pressure. Phys. Earth Planet. Inter. 1996, 96, 113–127. [Google Scholar] [CrossRef]
- Li, B.; Neuville, D.R. Elasticity of diopside to 8 GPa and 1073K and implications for the upper mantle. Phys. Earth Planet. Inter. 2010, 183, 398–403. [Google Scholar] [CrossRef]
- Ma, C.; Tschauner, O.; Beckett, J.R.; Rossman, G.R.; Prescher, C.; Prakapenka, V.B.; Bechtel, H.A.; MacDowell, A. Liebermannite, KAlSi3O8, a new shock-metamorphic, high-pressure mineral from the Zagami Martian meteorite. Meteorit. Planet. Sci. 2017, 53, 50–61. [Google Scholar] [CrossRef] [Green Version]
- Liu, L.G.; El Gorsey, A. High-pressure phase transitions of the feldspars, and further characterization of lingunite. Int. Geol. Rev. 2007, 49, 854–860. [Google Scholar] [CrossRef]
- Ringwood, A.E. Phase transformations and their bearing on the constitution and dynamics of the mantle. Geochim. Cosmochim. Acta 1991, 55, 2083–2110. [Google Scholar] [CrossRef]
- Irifune, T.; Ringwood, A.E. Phase transformations in subducted oceanic crust and buoyancy relationships at depths of 600–800 km in the mantle. Earth Planet. Sci. Lett. 1993, 117, 101–110. [Google Scholar] [CrossRef]
- Ishii, T.; Kojitani, H.; Akaogi, M. Phase relations and mineral chemistry in pyrolitic mantle at 1600–2200 °C under pressures up to the uppermost lower mantle: Phase transitions around the 660-km discontinuity and dynamics of upwelling hot plumes. Phys. Earth Planet. Inter. 2018, 274, 127–137. [Google Scholar] [CrossRef]
- Nishiyama, N.; Rapp, R.P.; Irifune, T.; Sanehira, T.; Yamazaki, D.; Funakoshi, K.-I. Stability and P–V–T equation of state of KAlSi3O8-hollandite determined by in situ X-ray observations and implications for dynamics of subducted continental crust material. Phys. Chem. Miner. 2005, 32, 627–637. [Google Scholar] [CrossRef]
- Ferroir, T.; Onozawa, T.; Yagi, T.; Merkel, S.; Miyajima, N.; Nishiyama, N.; Irifune, T.; Kikegawa, T. Equation of state and phase transition in KAlSi3O8 hollandite at high pressure. Am. Mineral. 2006, 91, 327–332. [Google Scholar] [CrossRef]
- Hirao, N.; Ohtani, E.; Kondo, T.; Sakai, T.; Kikegawa, T. Hollandite II phase in KAlSi3O8 as a potential host mineral of potassium in the Earth’s lower mantle. Phys. Earth Planet. Inter. 2008, 166, 97–104. [Google Scholar] [CrossRef]
- Boffa Ballaran, T.; Liu, J.; Dubrovinsky, L.S.; Caracas, R.; Crichton, W. High-pressure ferroelastic phase transition in aluminosilicate hollandite. Phys. Rev. B 2009, 80, 214104. [Google Scholar] [CrossRef]
- Zhao, Y.; Von Dreele, R.B.; Shankland, T.J.; Weidner, D.J.; Zhang, J.; Wang, Y.; Gasparik, T. Thermoelastic equation of state of jadeite NaAlSi2O6: An energy-dispersive Reitveld Refinement Study of low symmetry and multiple phases diffraction. Geophys. Res. Lett. 1997, 24, 5–8. [Google Scholar] [CrossRef]
- Nestola, F.; Boffa Ballaran, T.; Liebske, C.; Bruno, M.; Tribaudino, M. High-pressure behaviour along the jadeite NaAlSi2O6–aegirine NaFeSi2O6 solid solution up to 10 GPa. Phys. Chem. Miner. 2006, 33, 417–425. [Google Scholar] [CrossRef]
- Posner, E.S.; Dera, P.; Downs, R.T.; Lazarz, J.D.; Irmen, P. High-pressure single-crystal X-ray diffraction study of jadeite and kosmochlor. Phys. Chem. Miner. 2014, 41, 695–707. [Google Scholar] [CrossRef]
- McCarthy, A.; Downs, R.; Thompson, R. Compressibility trends of the clinopyroxenes, and in-situ high-pressure single-crystal X-ray diffraction study of jadeite. Am. Mineral. 2008, 93, 198–209. [Google Scholar] [CrossRef]
- Zhou, Y.; Irifune, T.; Ohfuji, H.; Shinmei, T.; Du, W. Stability region of K0.2Na0.8AlSi3O8 hollandite at 22 GPa and 2273 K. Phys. Chem. Miner. 2016, 44, 33–42. [Google Scholar] [CrossRef]
- Lakshtanov, D.L.; Litasov, K.D.; Sinogeikin, S.V.; Hellwig, H.; Li, J.; Ohtani, E.; Bass, J.D. Effect of Al3+ and H+ on the elastic properties of stishovite. Am. Mineral. 2007, 92, 1026–1030. [Google Scholar] [CrossRef]
- Tsuchiya, T. First-principles prediction of the P-V-T equation of state of gold and the 660-km discontinuity in Earth’s mantle. J. Geophys. Res. Solid Earth 2003, 108. [Google Scholar] [CrossRef]
- Matsui, M.; Higo, Y.; Okamoto, Y.; Irifune, T.; Funakoshi, K.I. Simultaneous sound velocity and density measurements of NaCl at high temperatures and pressures: Application as a primary pressure standard. Am. Mineral. 2012, 97, 1670–1675. [Google Scholar] [CrossRef]
- Larson, A.C.; Von Dreele, R.B. GSAS General Structure Analysis System. Operation Manual; LAUR 86-748; Los Alamos National Laboratory: Los Alamos, NM, USA, 2000; pp. 1–179.
- Toby, B.H. EXPGUI, a graphical user interface for GSAS. J. Appl. Crystallogr. 2001, 34, 210–213. [Google Scholar] [CrossRef] [Green Version]
- Le Bail, A.; Duroy, H.; Fourquet, J.L. Ab-initio structure determination of LiSbWO6 by X-ray powder diffraction. Mater. Res. Bull. 1988, 23, 447–452. [Google Scholar] [CrossRef]
- Sueda, Y.; Irifune, T.; Nishiyama, N.; Rapp, R.P.; Ferroir, T.; Onozawa, T.; Yagi, T.; Merkel, S.; Miyajima, N.; Funakoshi, K.-I. A new high-pressure form of KAlSi3O8 under lower mantle conditions. Geophys. Res. Lett. 2004, 31. [Google Scholar] [CrossRef]
- Mookherjee, M.; Steinle-Neumann, G. Detecting deeply subducted crust from the elasticity of hollandite. Earth Planet. Sci. Lett. 2009, 288, 349–358. [Google Scholar] [CrossRef]
- Kawai, K.; Tsuchiya, T. First-principles study on the high-pressure phase transition and elasticity of KAlSi3O8 hollandite. Am. Mineral. 2012, 98, 207–218. [Google Scholar] [CrossRef]
- Zhang, J.; Ko, J.; Hazen, R.H.; Prewitt, C.T. High-pressure crystal chemistry of KAlSi3O8 hollandite. Am. Mineral. 1993, 78, 493–499. [Google Scholar]
- Brown, J.M.; Shankland, T.J. Thermodynamic parameters in the Earth as determined from seismic profiles. Geophys. J. Int. 1981, 66, 579–596. [Google Scholar] [CrossRef]
- Saikia, A.; Frost, D.J.; Rubie, D.C. Splitting of the 520-kilometer seismic discontinuity and chemical heterogeneity in the mantle. Science 2008, 319, 1515–1518. [Google Scholar]
- Dziewonski, A.M.; Anderson, D.L. Preliminary reference Earth model. Phys. Earth Planet. Inter. 1981, 25, 297–356. [Google Scholar] [CrossRef]
- Kennett, B.L.N.; Engdahl, E.R.; Buland, R. Constraints on seismic velocities in the Earth from traveltimes. Geophys. J. Int. 1995, 122, 108–124. [Google Scholar] [CrossRef]
- Ichikawa, H.; Gréaux, S.; Azuma, S. Subduction of the primordial crust into the deep mantle. Geosci. Front. 2017, 8, 347–354. [Google Scholar] [CrossRef] [Green Version]
- Ono, S.; Hirose, K.; Kikegawa, T.; Saito, Y. The compressibility of a natural composition calcium ferrite-type aluminous phase to 70 GPa. Phys. Earth Planet. 2002, 131, 311–318. [Google Scholar] [CrossRef]
- Gréaux, S.; Irifune, T.; Higo, Y.; Tange, Y.; Arimoto, T.; Liu, Z.; Yamada, A. Sound velocity of CaSiO3 perovskite suggests the presence of basaltic crust in the Earth’s lower mantle. Nature 2019, 565, 218–221. [Google Scholar] [CrossRef] [PubMed]


| Run No. | P (GPa) | T (K) | Duration (h) | Phase Assemblages |
|---|---|---|---|---|
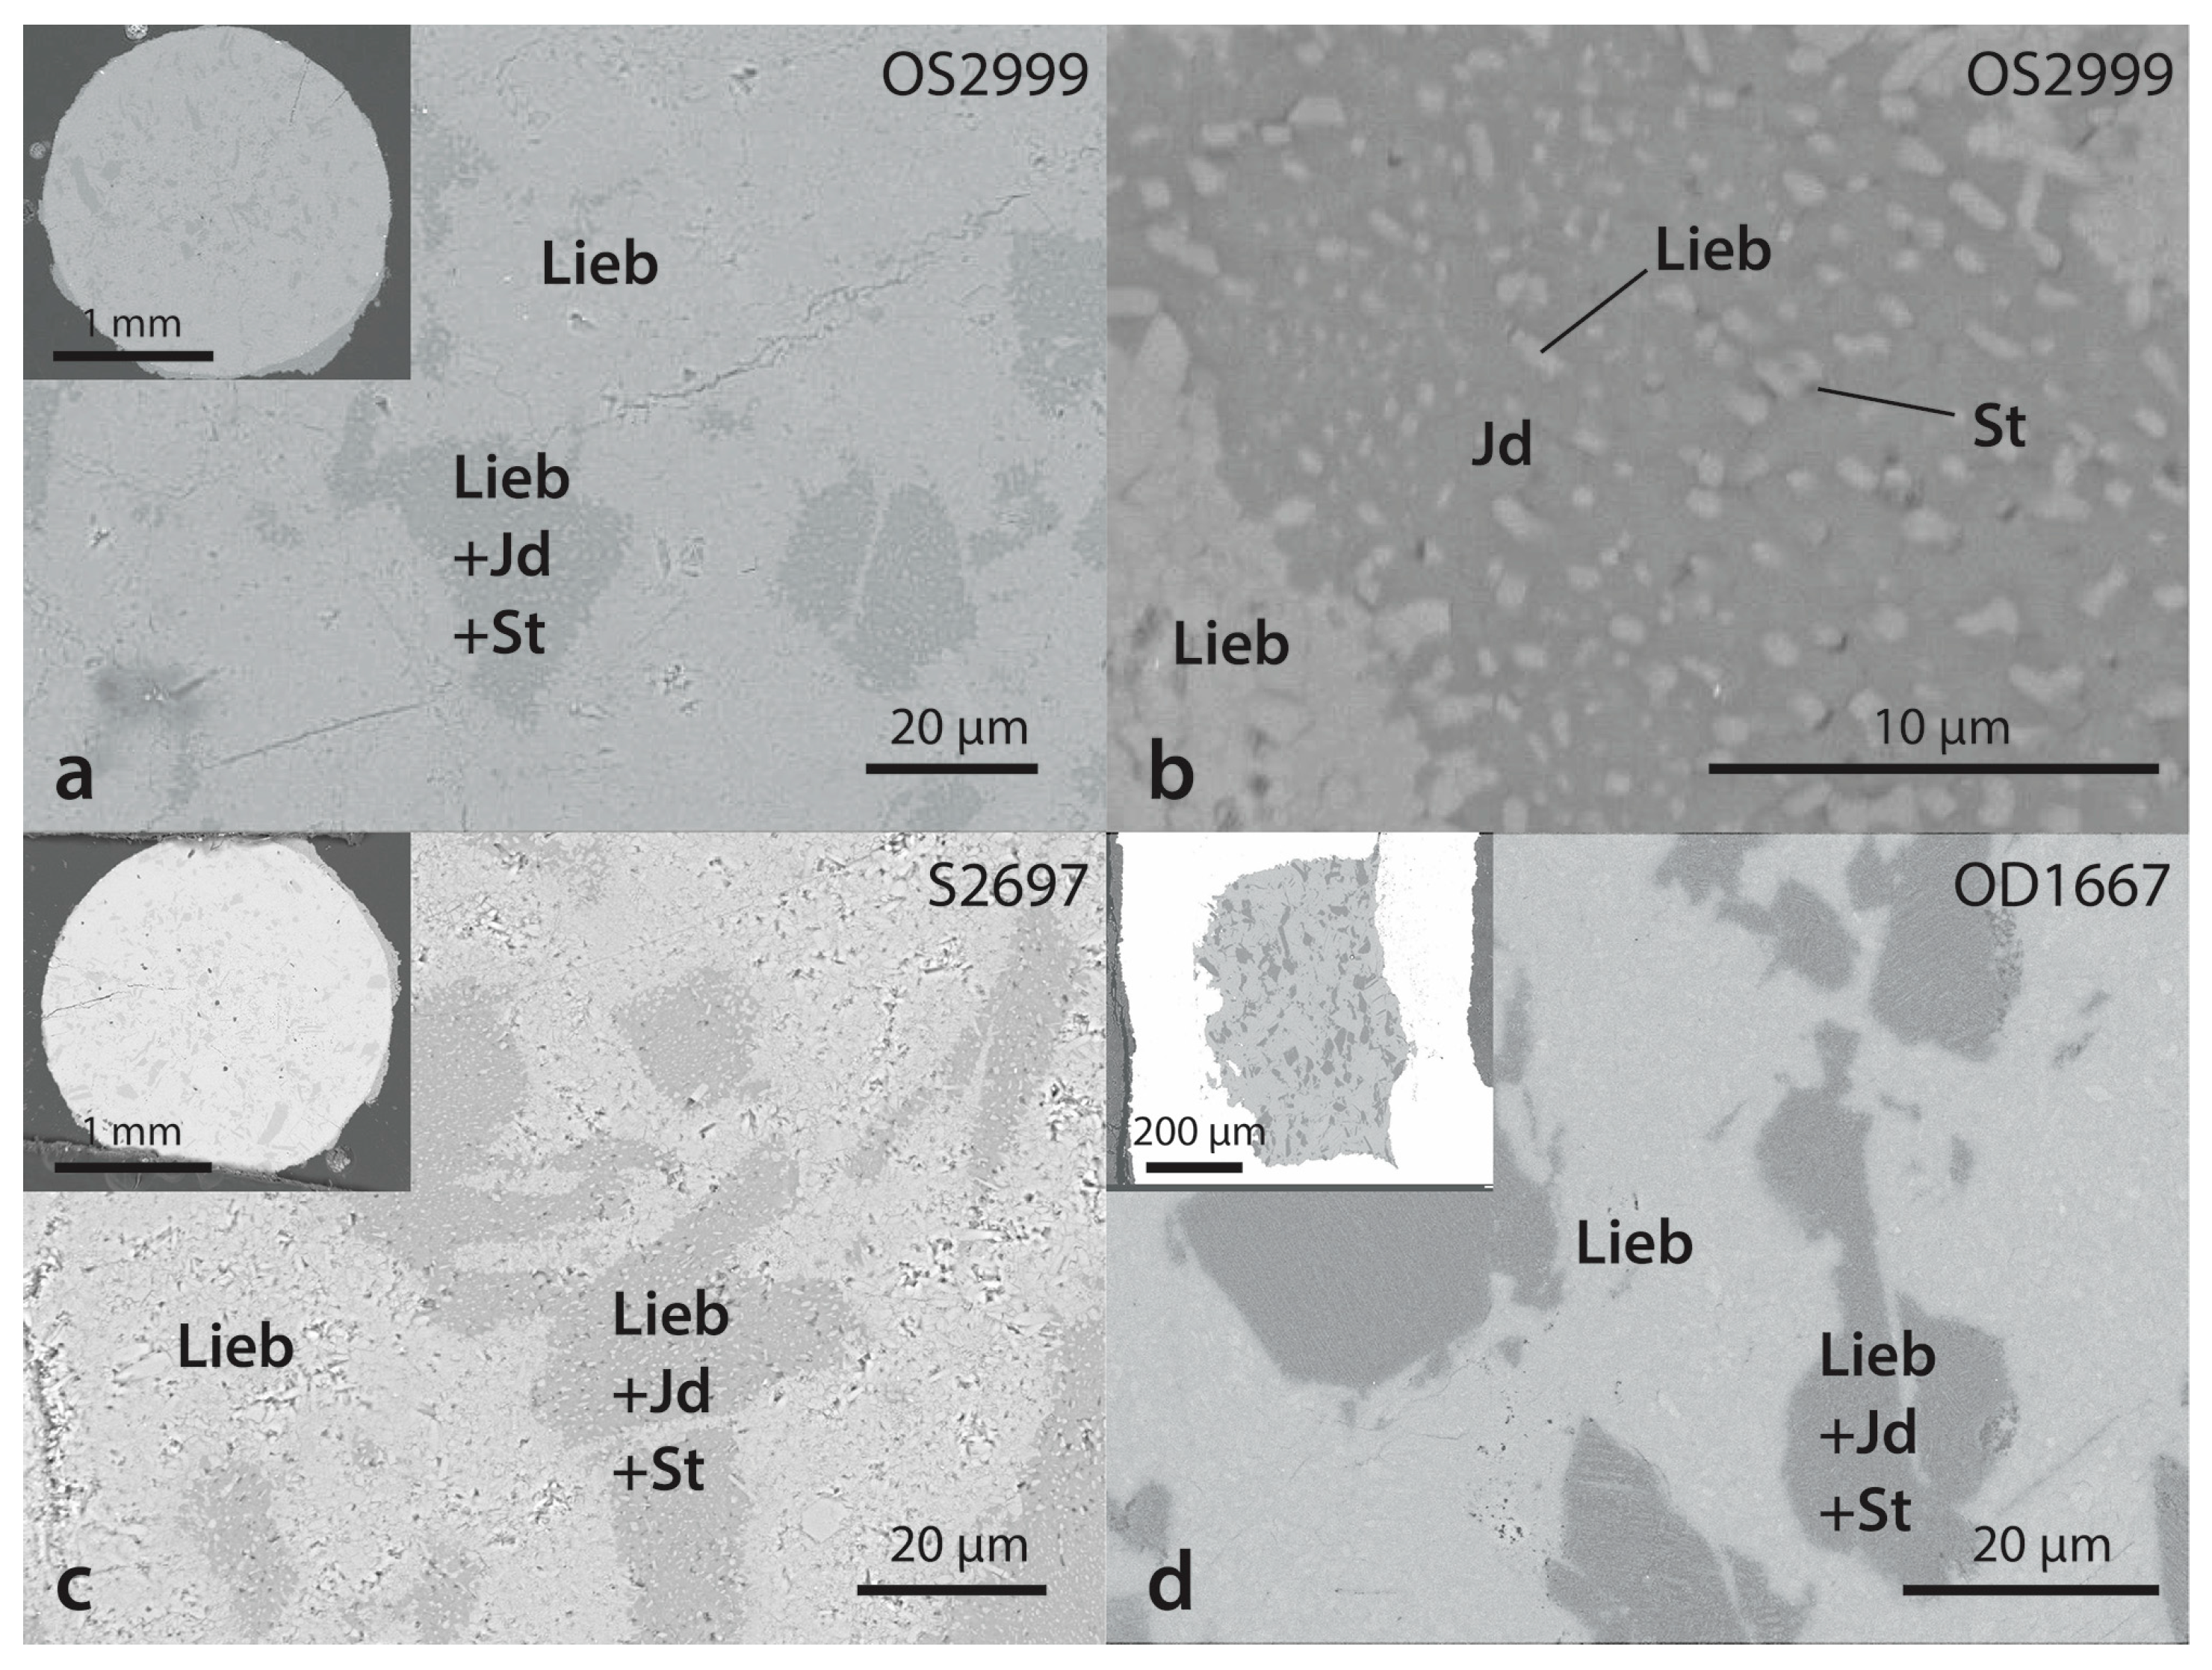
| OS2999 | 15.0 | 1500 | 0.5 | Na-lieb, Jd, St |
| S2697 | 7.0–20.4 | 300–1700 | * | Na-lieb, Jd, St |
| OD1667 | 21.4 | 1700 | 12 | Na-lieb, Jd, St |
| Glass Starting Material * | Hollandite | Jadeite + Stishovite | |||||
|---|---|---|---|---|---|---|---|
| Element (wt.%) | OS2999 | S2697 | OD1667 | OS2999 | S2697 | OD1667 | |
| Na | 1.48 | 2.4(2) | 2.2(1) | 1.5(1) | 9.1(3) | 9.2(1) | 8.6(2) |
| K | 9.96 | 10.1(3) | 10.4(2) | 10.9(2) | 0.0(1) | 0.0(0) | 0.0(0) |
| Al | 10.43 | 9.7(1) | 9.6(1) | 9.5(1) | 10.6(4) | 10.4(1) | 10.1(1) |
| Si | 30.15 | 30.6(2) | 30.8(2) | 31.4(1) | 32.1(9) | 32.0(2) | 32.5(3) |
| O | 46.40 | 46.4(4) | 46.5(3) | 47.0(1) | 49.2(2) | 48.9(2) | 49.1(2) |
| Total | 98.4 | 99.1(9) | 99.4(7) | 100.5(2) | 100.1(7) | 100.5(3) | 100.4(4) |
| Element (p.f.u.) | |||||||
| Na | 0.28(2) | 0.26(1) | 0.18(1) | 0.77(5) | 0.78(1) | 0.73(3) | |
| K | 0.71(2) | 0.73(2) | 0.76(2) | - | - | - | |
| Al | 0.99(1) | 0.98(1) | 0.96(1) | 0.77(5) | 0.75(1) | 0.74(1) | |
| Si | 3.01(1) | 3.02(1) | 3.05(1) | 2.23(6) | 2.24(1) | 2.27(1) | |
| O | 8 | 8 | 8 | 6 | 6 | 6 | |
| sum cations | 4.99(1) | 4.99(1) | 4.95(1) | 3.77(5) | 3.78(1) | 3.73(1) | |
| Na-Liebermannite | Jadeite | |||||
|---|---|---|---|---|---|---|
| OS2999 | S2697 | OD1667 | OS2999 | S2697 | OD1667 | |
| Unit-cell parameters | ||||||
| a (Å) | 9.3207(2) | 9.3159(2) | 9.3110(4) | 9.431(5) | 9.433(2) | 9.405(1) |
| b (Å) | 9.3207(2) | 9.3159(2) | 9.3110(4) | 8.569(1) | 8.563(1) | 8.563(5) |
| c (Å) | 2.7193(1) | 2.7243(1) | 2.7313(3) | 5.219(3) | 5.226(1) | 5.227(8) |
| α (°) | 90 | 90 | 90 | 90 | 90 | 90 |
| β (°) | 90 | 90 | 90 | 107.43(3) | 107.52(1) | 107.31(7) |
| γ (°) | 90 | 90 | 90 | 90 | 90 | 90 |
| V (Å3) | 236.2(2) | 236.4(2) | 236.8(4) | 402.4(4) | 402.6(1) | 401.9(1) |
| KT0 (GPa) | KT’ | V0 (Å3) | ∂KT/∂T (GPa·K−1) | a0 (10−5 K−1) | b0 (10−8 K−2) | χ2 | Reference | |
|---|---|---|---|---|---|---|---|---|
| Hollandite-I | ||||||||
| K0.7Na0.3AlSi3O8 | 220(1) | 3* | 236.20(5) | 0.031 | a | |||
| 214(1) | 4* | 236.24(5) | 0.023 | a | ||||
| 207(1) | 5* | 236.27(5) | 0.018 | a | ||||
| 211(2) | 4* | 236.24* | −0.043(20) | 2.9(7) | 0.122 | a | ||
| K0.8Na0.2AlSi3O8 | 198(3) | 4 | 237.3(2) | b | ||||
| 217(4) | 4* | 236.1(2) | c | |||||
| KAlSi3O8 | 183(3) | 4 | 237.6(2) | −0.033(2) | 3.32(5) | 1.09(1) | d | |
| KAlSi3O8 | 201.4(7) | 4 | 237.01(33) | e | ||||
| KAlSi3O8 | 180(3) | 4 | 236.26(36) | f | ||||
| Hollandite-II | ||||||||
| K0.7Na0.3AlSi3O8 | 163.2(3) | 4 | 239.4* | 0.008 | a | |||
| 188.2(4) | 4 | 237.01* | 0.003 | a | ||||
| 160(2) | 4 | 239.4* | −0.023(16) | 3.2(11) | 0.124 | a | ||
| 184(3) | 4 | 237.01* | −0.031(19) | 3.3(12) | 0.184 | a | ||
| K0.8Na0.2AlSi3O8 | 174(7) | 4 | 239.4(9) | b | ||||
| KAlSi3O8 | 204(2) | 4 | 237.01* | g |
| Reference | KT0 (GPa) | KT’ | V0 (Å3) | ∂KT/∂T (GPa·K−1) | a0 (10−5 K−1) | b0 (10−8 K−2) | χ2 |
|---|---|---|---|---|---|---|---|
| This study | 133.6(2) | 3.3* | 402.4* | 0.014 | |||
| 129.2(2) | 4* | 402.4* | 0.015 | ||||
| 126.7(2) | 4.4* | 402.4* | 0.017 | ||||
| 123.3(2) | 5* | 402.4* | 0.023 | ||||
| 132(1) | 3.3* | 402.4* | −0.007(11) | 2.3(8) | 0.284 | ||
| 127(1) | 4* | 402.4* | −0.012(11) | 2.6(9) | 0.259 | ||
| Posner et al. [23] | 136(3) | 3.3(2) | 402.5(4) | ||||
| McCarthy et al. [22] | 136(1) | 3.4(4) | 402.03(2) | ||||
| Nestola et al. [21] | 134.0(7) | 4.4(1) | 402.26(2) | ||||
| Zhao et al. [20] | 127(5) | 4 | 403 | −0.014(5) | 2.5(2) | 0.2(2) | |
| 125(4) | 5 | 403 | −0.016(5) | 2.6(2) | 0.3(2) |
© 2020 by the authors. Licensee MDPI, Basel, Switzerland. This article is an open access article distributed under the terms and conditions of the Creative Commons Attribution (CC BY) license (http://creativecommons.org/licenses/by/4.0/).
Share and Cite
Gréaux, S.; Zhou, Y.; Kono, Y.; Yamada, A.; Higo, Y.; Irifune, T. Thermoelastic Properties of K0.7Na0.3AlSi3O8 Hollandite and NaAlSi2O6 Jadeite: Implication for the Fate of the Subducted Continental Crust in the Deep Mantle. Minerals 2020, 10, 261. https://doi.org/10.3390/min10030261
Gréaux S, Zhou Y, Kono Y, Yamada A, Higo Y, Irifune T. Thermoelastic Properties of K0.7Na0.3AlSi3O8 Hollandite and NaAlSi2O6 Jadeite: Implication for the Fate of the Subducted Continental Crust in the Deep Mantle. Minerals. 2020; 10(3):261. https://doi.org/10.3390/min10030261
Chicago/Turabian StyleGréaux, Steeve, Youmo Zhou, Yoshio Kono, Akihiro Yamada, Yuji Higo, and Tetsuo Irifune. 2020. "Thermoelastic Properties of K0.7Na0.3AlSi3O8 Hollandite and NaAlSi2O6 Jadeite: Implication for the Fate of the Subducted Continental Crust in the Deep Mantle" Minerals 10, no. 3: 261. https://doi.org/10.3390/min10030261
APA StyleGréaux, S., Zhou, Y., Kono, Y., Yamada, A., Higo, Y., & Irifune, T. (2020). Thermoelastic Properties of K0.7Na0.3AlSi3O8 Hollandite and NaAlSi2O6 Jadeite: Implication for the Fate of the Subducted Continental Crust in the Deep Mantle. Minerals, 10(3), 261. https://doi.org/10.3390/min10030261