Abstract
The Raman spectra of barite and celestine were recorded from 25 to 600 °C at ambient pressure and both minerals were stable over the entire temperature range. Most of the Raman bands of barite decreased in wavenumber with increasing temperature with the exception of the ν2 modes and the ν4 band at 616 cm−1, which did not exhibit a significant temperature dependence. These vibrations may be constrained by the lower thermal expansion along the a-axis and b-axis of barite. Similar to barite, most of the Raman bands of celestine also decreased in wavenumber with increasing temperature, with the exception of the ν2 modes and the ν4 band at 622 cm−1, which showed very little variation with increasing temperature. Variations of Raman shift as a function of temperature and FWHM (full width at half maximum) as a function of Raman shift for the main, ν1 modes of barite and celestine show that both minerals have almost identical linear trends with a slope of −0.02 cm−1/°C and −0.5, respectively, which allows for the prediction of Raman shifts and FWHM up to much higher temperatures. The calculated isobaric and isothermal mode Grüneisen parameters and the anharmonicity parameters show that the M–O modes (M = Ba2+ and Sr2+) in barite and celestine exhibit much higher values of both mode Grüneisen parameters and anharmonicity than the SO4 tetrahedra. This indicates that the S–O distances and S–O–S angles are less sensitive to pressure and temperature increase than the M–O distances in the structure. Furthermore, the generally higher anharmonicity in celestine is due to the smaller size of the Sr2+ cation, which causes the celestine structure to be more distorted than the barite structure.
1. Introduction
Barite (BaSO4) and celestine (SrSO4) are essential for many modern industries. The high density and low oil absorption properties of barite make it useful in many industrial applications [1]. Barite is used in the plastics industry to improve the stiffness, intensity, and abrasive strength of plastics and in the paper-making industry to improve the whiteness of paper products. It is used in the paint industry for increasing the stability of the paint and adding more brightness to the paint and in the rubber industry to make the rubber acid- and alkali-proof. It is also used in the pharmaceutical industry in diagnostic medical tests as barium meal is very effective in blocking x-ray and gamma-ray emissions and also in the cosmetic industry because of its mild effect on the skin. In addition, celestine is the most important chemical raw material for extracting strontium, which is widely used in producing permanent ceramic magnets and in fireworks, marine flares, and tracer ammunition because strontium burns with a brilliant red flame [2]. Therefore, investigation of the detailed variation in the structure of barite and celestine with temperature may be beneficial for industrial applications.
Natural barite and celestine occur in various evaporitic and non-evaporitic sedimentary environments [3,4]. Barite is also a common mineral in base metal sulfide deposits, associated with alkali volcanic rocks [5,6], in volcanic sequences [7], in stratiform barite deposits [8,9], and in carbonatite and rare earth element (REE) deposits [10,11]. Celestine is also found in volcanic-sedimentary environments [12] and in hydrothermal deposits, where it is commonly accompanied by fluorite, barite, calcite, lead, and zinc sulfides [13].
Barite and celestine are isostructural and their crystal structures were initially determined by James and Wood [14]. The barite structure was refined by Colville and Staudhammer [15] and the structure of celestine was refined by Garske and Peacor [16] and Hawthorne and Ferguson [17]. A further refinement of the structure of both minerals and calculation of the force constants for the SO4 tetrahedron was later carried out by Miyake et al. [18]. The structural parameters are correlated with the effective sizes of the Ba2+ and Sr2+ cations. In celestine, the small Sr2+ cation forms a short average Sr–O distance, so the charge on the O atoms is less and the average S–O distance is longer. In barite, the larger Ba2+ cation forms a longer average Ba–O distance, and hence, the charge on the O atoms is larger and the average S–O distance is shorter. This results in the celestine structure being more distorted than the barite structure [19].
Barite was one of the first crystals to be studied shortly after the discovery of Raman spectroscopy [20,21,22,23]. More recently, studies of both barite and celestine were carried out by Buzgar et al. [24]. Raman spectroscopy has also been used to investigate the behavior of barite and celestine at high pressures [25,26,27,28]. The influence of temperature at ambient pressure on barite was first reported in 1948 by Narayanaswamy [29]. Since this preliminary investigation over 70 years ago, there appears to have been no further studies on the influence of temperature on the Raman spectra of barite or celestine at ambient pressure. Therefore, in this paper, we report the Raman spectra of barite and celestine at temperatures up to 600 °C at atmospheric pressure and consider how temperature effects the crystal structure of barite and celestine.
2. Experimental
The barite sample is from Jinkouhe, Sichuan Province, China and the celestine sample is from Sakoany, Mahajanga District, Madagascar. Both the samples were analyzed using a JEOL JXA-8530F-plus field emission electron microprobe equipped with wavelength dispersive spectrometers (WDS) at the Institute of Geochemistry, Chinese Academy of Sciences, Guiyang, China. The SPI (Structure Probe, Inc.) standards of calcite, celestine, and barite were used for Ca, Sr, Ba and S, respectively. The operating conditions were 25 kV accelerating voltage, 10 nA beam current, and a beam diameter of 10 μm. Table 1 gives a list of the analytical results for barite and celestine. The averaged results of the barite sample are as follows (wt%): BaO 64.30, SrO 0.02, SO3 35.78, and the calculated crystal-chemical formula is Ba0.95S1.02O4. The averaged results of the celestine sample are as follows (wt%): CaO 0.01, BaO 0.02, SrO 55.58, SO3 43.61, and the calculated crystal-chemical formula is Sr0.99S1.00O4. These results show that both barite and celestine are very pure with compositions close to the end members.

Table 1.
Electron microprobe analysis results, expressed as wt.% oxide, for barite and celestine.
A Renishaw inVia Reflex spectrometer system equipped with a standard confocal microscope was used for Raman spectral analysis. A Renishaw diode-pumped solid-state laser provided 532 nm laser excitation with 5 mW power at the sample. An 1800 grooves/mm grating was used giving a spectral resolution of 1.2 cm−1. Depolarized Raman spectra were obtained using a 10 s integration time with 5 accumulations and a 50× Leica long working distance microscope objective, which focused the beam to a spot size of 1.6 μm. Wavenumber calibration was carried out using a silicon standard.
A Linkam MDSG600 heating stage was mounted on the microscope stage of the Renishaw Raman spectrometer. The Linkam stage was heated by a resistance heater in a silver block, and small crystals of barite and celestine (typically less than 1 mm high) were then placed on a sapphire disk which rested on top of the silver block. Sapphire was used as it has high thermal conductivity. A silver lid with a small hole to allow the laser beam to pass through was placed on top of the sample to form an enclosed homogeneous thermal oven [30]. The stage was calibrated by measuring the H2O triple point and the H2O critical point in synthetic fluid inclusions. A heating rate of 50 °C/minute was used to heat the crystals and then the stage was held at the desired temperature while recording the Raman spectra. Repeated measurements over a period of 30 min at constant temperature showed no changes in the Raman spectra and confirmed that the crystals reached thermal equilibrium. After heating to the maximum temperature of the stage (600 °C), the stage was allowed to cool to room temperature where further Raman spectra were acquired to check for any possible modifications or phase changes due to the heating process.
3. Results and Discussion
3.1. Ambient Raman Spectra
The Raman spectra of barite and celestine at room temperature are shown in Figure 1. The structures of barite and celestine are identical and both belong to the orthorhombic system with space group Pbnm [18]. Each S atom coordinates with four oxygen atoms and forms the SO4 tetrahedron while the cation (Ba2+ or Sr2+) coordinates with 12 oxygen atoms. The SO4 tetrahedron has Cs site group symmetry which theoretically has 9 degrees of vibrational freedom [31] (i.e., one nondegenerate (ν1), one doubly degenerate (ν2), and two triply degenerate modes (ν3 and ν4)). Note that, in the crystalline structure, the symmetry of the perfect tetrahedron is lowered, resulting in splitting of the ν2, ν3, and ν4 modes. Furthermore, some additional modes, which arise from distortion of the SO4 tetrahedra, remained unassigned in this study. Raman peaks below 400 cm−1 were assigned to M–O12 vibrations. The observed modes were in good agreement with those previously reported in the literature [32,33,34] and are listed in Table 2.
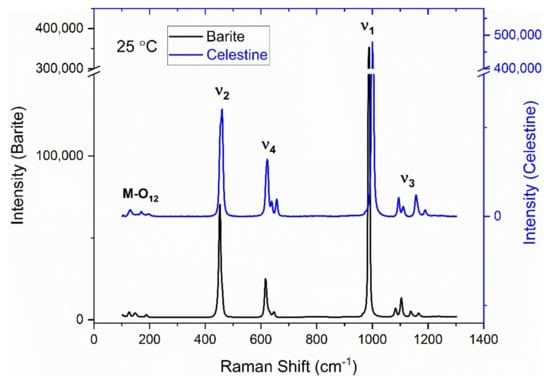
Figure 1.
Raman spectra at ambient temperature of barite and celestine.
Table 2.
Observed Raman vibrational modes (in cm−1) of crystalline barite and celestite at room temperature.
3.2. Barite Temperature Dependence
Raman spectra of a barite crystal were recorded at 50 °C intervals from room temperature to 600 °C and selected spectra are shown in Figure 2. Data on the detailed variation of Raman shift with temperature are shown in Figure 3 and equations of fit are listed in Table 3. For comparison with the previous study on the effect of temperature on barite by Narayanaswamy [29], the proportional change of each observable Raman band is also shown in Table 3. There is relatively good agreement between the two studies, which verifies the current results and shows that the early studies, conducted under challenging conditions and before the advent of lasers, also produced reliable data.
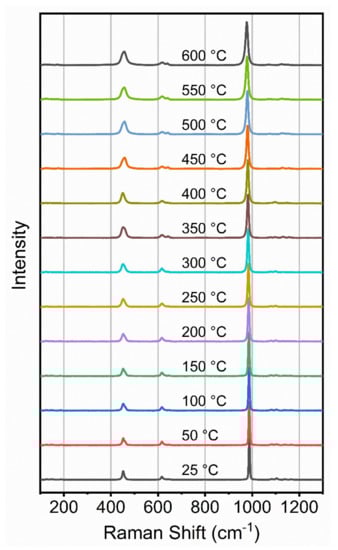
Figure 2.
Raman spectra of barite as a function of temperature at atmospheric pressure.
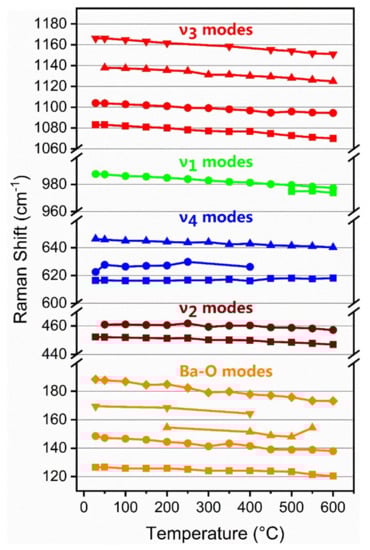
Figure 3.
Temperature dependence of the wavenumber of the observed Raman bands of barite at atmospheric pressure.
Table 3.
Ambient wavenumbers (ω), temperature dependencies, proportional change, and full width at half maximum (FWHM) variation of the Raman bands of barite.
The main ν1 band of barite decreases in wavenumber with increasing temperature with a slope of approximately −0.02 cm−1/°C (Table 3). At temperatures above 450 °C, the peak becomes slightly asymmetric in shape and is more accurately fitted by a mixed Gaussian and Lorentzian curve (Figure 4). Although this splitting is not apparent at room temperature, Kloprogge et al. [35] reported the splitting of the ν1 band of celestine at 77 K and Girard et al. [36] reported the appearance of a shoulder on the low wavenumber side of celestine with increasing pressure. The ν3 bands of barite all show a systematic decrease in wavenumber with increasing temperature with the 1138 cm−1 band exhibiting a non-linear temperature dependence (Table 3). It is also interesting to note that the ν2 bands at 452 and 461 cm−1 and the ν4 band at 616 cm−1 are almost unaffected by temperature up to 400 °C (Figure 3) and exhibit very small slopes (Table 3).
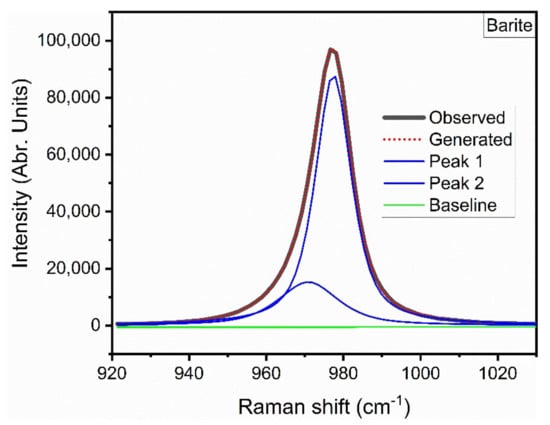
Figure 4.
Results of the curve fitting of the ν1 Raman band of barite at 600 °C. Peak 1 has a maximum at 977.4 cm−1 and peak 2 has a maximum at 973.8 cm−1. The dotted red curve shows the overall band fit to the observed spectrum.
The observed ν4 bands were all assigned to the stretching and bending of the S–O bonds and appeared less sensitive to changes of Ba–O distances. Ye et al. [37] reported that the axial thermal expansion coefficients of BaSO4 are 1.18 × 10⁻⁵ K−1, 1.37 × 10⁻⁵ K−1, and 1.67 × 10⁻⁵ K−1 along a-, b-, and c-axes, respectively. Therefore, the behavior of the ν4 bands may be due to vibrational restrictions arising from the lower thermal expansion along the a-axis and b-axis.
Finally, the Ba–O modes all show a decrease in wavenumber with increasing temperature (Figure 3) but the 188 cm−1 band has a greater negative slope than the other bands, and hence, may vibrate parallel to the c-axis. The largest bond distance of Ba–O is parallel to the c-axis in the barite structure, and hence, the bonding force between Ba–O in this direction is the weakest and results in the fact that the c-axis is the most compressible axis [38].
It is well known that the Raman bands of minerals commonly broaden with increasing temperature [39,40,41]. Recently, Nesbitt et al. [40] expanded the theory of Balkanski et al. [42] to include Heisenberg lifetimes. In this theory, Raman shifts are dependent on thermal expansion and the Grüneisen parameter [43]. This theory predicts that FWHM plotted against Raman shift should produce a linear trend provided temperatures are greater than about 25 °C. The variation of FWHM as a function of the Raman shift of the ν1 mode of barite is shown in Figure 5. A linear regression of the data shows that it has a slope of approximately −0.5. As discussed by Nesbitt et al. [40] this procedure allows prediction of Raman shifts and FWHM of barite up to much higher temperatures, which may find application in various industrial processes.
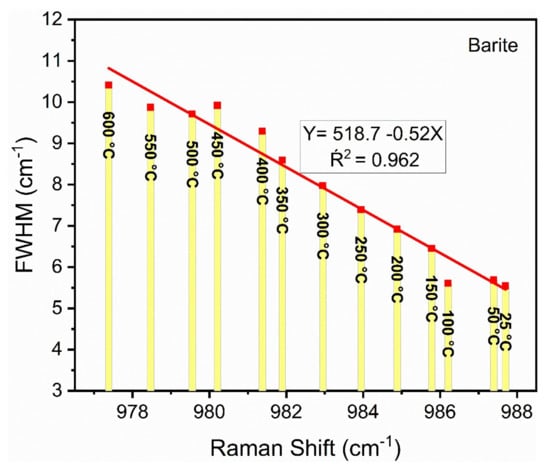
Figure 5.
A plot of the FWHM versus Raman shift for the ν1 mode of barite. The equation gives the results of a linear regression through the data. Note that the temperature increases from the far bottom right to the far upper left.
3.3. Celestine Temperature Dependence
As for barite, the Raman spectra of the celestine crystal were recorded at 50 °C intervals from room temperature to 600 °C and selected spectra are shown in Figure 6. Plots of the detailed variation with temperature are shown in Figure 7 and equations of fit are listed in Table 4.
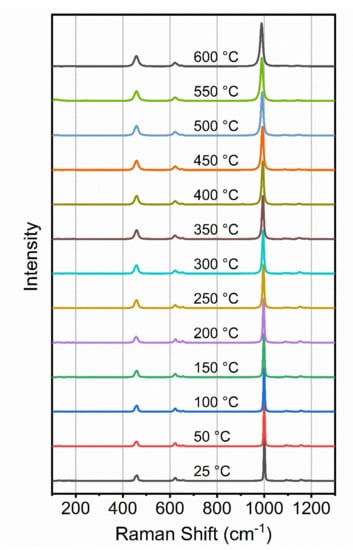
Figure 6.
Raman spectra of celestine as a function of temperature at atmospheric pressure.
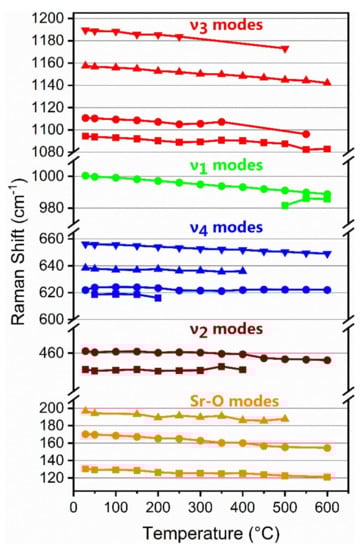
Figure 7.
Temperature dependence of the observed Raman bands of celestine at atmospheric pressure.
Table 4.
Ambient wavenumbers (ω) and temperature dependencies of the various Raman bands of celestine.
The main ν1 band of celestine decreased in wavenumber with increasing temperature with a slope of approximately −0.02 cm−1/°C (Table 4), almost the same as that of barite and the reported results of anhydrite II [44]. The ν1 band split into two bands above 450 °C in agreement with previous observations of splitting of this band by Kloprogge et al. [35] and Girard et al. [36]. All the ν3 bands also showed a non-linear decrease in wavenumber with increasing temperature. The ν4, 622 cm−1 band showed very little variation with increasing temperature, while the 639 cm−1 and 656 cm−1 bands showed a linear decrease in wavenumber with increasing temperature (Figure 7). A weak ν4 band, also reported by Griffith [33], was observed at 618 cm−1 but could not be observed at temperatures above 200 °C. The ν2 (454 and 461 cm−1) bands did not show any significant variation with temperature up to 400 °C but exhibited a slight wavenumber decrease above that temperature (Figure 7). The Sr–O12 modes all decreased in wavenumber with increasing temperature.
As mentioned above, relative to the Ba2+ cation, the smaller size of the Sr2+ cation caused the celestine structure to be more distorted than the barite structure, which may be the reason why some of the Raman bands of celestine exhibited a non-linear temperature dependence. The smaller Sr2+ cation also results in a shorter average Sr–O bond distance than for the corresponding Ba–O bond in barite. This results in less charge on the O atoms in celestine and longer average S–O bond distances [19]. These effects lead to the observation of Raman bands at higher wavenumbers in celestine when compared with barite. Furthermore, the shorter Sr–O bond distances in celestine have a marked effect on the upper M–O12 mode which shifts from 188 cm−1 in barite to 197 cm−1 in celestine.
The variation of the FWHM as a function of the Raman shift of the ν1 mode of celestine is shown in Figure 8. A linear regression of the data shows that it has a slope of approximately −0.5 which is almost identical to that of barite (see Figure 5). This is in good agreement with the theory proposed by Nesbitt et al. [40] and suggests that the ν1 mode of other M2+SO4 crystals may also exhibit the same slope. The FWHM variations as a function of temperature for the other Raman modes of celestine are listed in Table 4.
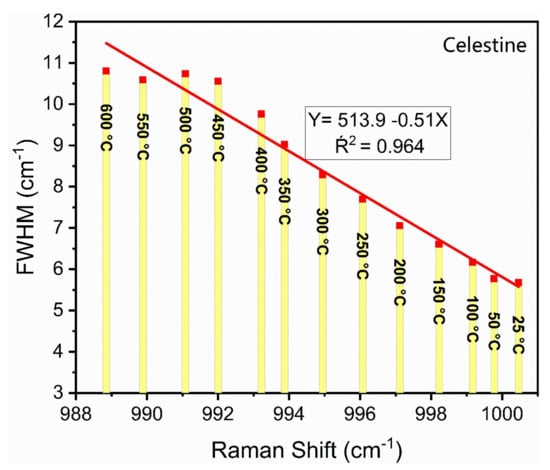
Figure 8.
A plot of the FWHM versus Raman shift for the ν1 mode of celestine. The equation gives the results of a linear regression through the data. Note that the temperature increases from the far bottom right to the far upper left.
3.4. Mode Grüneisen Parameters and Intrinsic Anharmonicity for Barite and Celestine
Gillet [45] and Mernagh [41] previously showed that logarithmic plots as a function of volume can be used to compare the effects of pressure, temperature, and volume on Raman mode frequencies. The isobaric mode Grüneisen parameter (γiP) measures the effect of temperature on the vibrational frequencies, and is defined by
where νi is the wavenumber of the ith Raman mode, V is the molar volume and γiP is given by the slopes of the ln(ν) – ln(V) curves in the high-temperature region of the plots.
The isothermal mode Grüneisen parameter (γiT), which is a measure of the effect of pressure on vibrational frequency, is calculated following the procedure of Chopelas [46] as follows:
where K0 is the bulk modulus at ambient pressure and δνi/δP is the pressure derivative at constant temperature.
The intrinsic anharmonicity parameter, ai, in barite and celestine was determined from plots of δ lnνi versus temperature. A list of the isobaric and isothermal mode Grüneisen parameters and the intrinsic anharmonicity for barite and celestine is given in Table 5. These results can be clearly divided into two groups: those associated with the M–O12 lattice vibrations and those associated with the SO4 tetrahedra. The lattice vibrations in barite and celestine exhibit much higher values of both mode Grüneisen parameters and anharmonicity than the SO4 tetrahedra. This is due to the fact that the S–O distance decreases linearly with increasing cation ionic radius, the magnitude of the S–O distance variation is smaller than that of M–O distance variation, and the average of S–O–S angles of barite and celestine is nearly constant (109.46° for BaSO4 and 109.5° for SrSO4 [18]). Therefore, S–O distances and S–O–S angles are less sensitive to pressure and temperature increase than the M–O distances in the structure.
Table 5.
Isobaric and isothermal mode Grüneisen (γiP and γiT) and anharmonic parameters (ai) of barite and celestine.
The corresponding intrinsic anharmonicity for celestine is generally higher than that of barite (Table 5). The intrinsic anharmonicity parameters are correlated with effective size of the cations. In celestine, the small Sr2+ cation forms a short average Sr–O distance, which results in the celestine structure being more distorted than the barite structure [19]. Furthermore, the results of Ye et al. [37] also inferred that bond length may be a major factor affecting the volumetric thermal expansion of barite-group minerals. The volumetric thermal expansion coefficients decrease within an increasing ionic radius (1.44 Å for Sr2+ and 1.61 Å for Ba2+) and the corresponding average M–O distances for SrSO4 and BaSO4 are 2.827 Å and 2.953 Å, respectively [19]. Therefore, the axial thermal expansion along the a-axis of SrSO4 is larger than that of BaSO4, while the corresponding axial thermal expansion along the c-axis of BaSO4 is smaller than that of SrSO4 [36,37]. This results in the axial thermal expansion of BaSO4 and SrSO4 both being slightly anisotropic.
4. Conclusions
The Raman spectra of barite and celestine have been studied from 25 to 600 °C at ambient pressure and both minerals remained stable over the entire temperature range. Plots of temperature variation of the Raman bands of barite show that most of the Raman bands decreased in wavenumber with increasing temperature with the exception of the ν2 modes observed at 452 cm−1 and 461 cm−1 and the ν4 band at 616 cm−1, which did not exhibit a significant temperature dependence. This different trend suggests that the vibrations are constrained by the lower thermal expansion along the a-axis and b-axis of barite. Similarly, most of the Raman bands of celestine also decreased in wavenumber with increasing temperature, with the exception of the ν2 modes at 454 cm−1 and 461 cm−1 and the ν4 band at 622 cm−1, which is the same as for barite. Variations of Raman shift as a function of temperature and FWHM as a function of Raman shift for the main ν1 modes of barite and celestine show that both minerals have almost identical linear trends with a slope of −0.02 cm−1/°C and −0.5, respectively, which allows for prediction of Raman shifts and FWHM for these minerals at much higher temperatures.
The results of this study and recent high pressure studies of barite and celestine [36,37] also allow for the determination of the isobaric and isothermal mode Grüneisen parameters and anharmonicity parameters. The calculations show that the M–O modes in barite and celestine exhibit much higher values of both mode Grüneisen parameters and anharmonicity than the SO4 tetrahedra. This indicates that the S–O distances and S–O–S angles are less sensitive to pressure and temperature increase than the M–O distances in the structure. Furthermore, the generally higher anharmonicity in celestine is due to the smaller size of the Sr2+ cation, which causes the celestine structure to be more distorted than the barite structure.
Author Contributions
Conceptualization, L.Z. and T.P.M.; Formal analysis, L.Z.; Funding acquisition, L.Z.; Investigation, L.Z. and T.P.M.; Methodology, L.Z., T.P.M., B.M., L.W., S.Z., and C.W.; Resources, B.M., L.W., S.Z. and C.W.; Validation, B.M., L.W., S.Z., and C.W.; Writing—Review and editing, L.Z. and T.P.M. All authors have read and agreed to the published version of the manuscript.
Funding
This work was financially supported by the Key Research Program of Frontier Sciences, CAS (QYZDB-SSW-DQC008), the National Natural Science Foundation of China (41773058, 91962108, 41931077), the Science and Technology Foundation of Guizhou Province ([2007]2197, [2013]3083), and the Chinese Academy of Sciences President’s International Fellowship Initiative (Grant No. 2017VCB0018) to T.M.
Acknowledgments
We thank the Editors and the anonymous reviewers whose comments helped improve and clarify this manuscript. Lyn Mernagh is thanked for mathematical assistance.
Conflicts of Interest
The authors declare no conflicts of interest.
References
- Barite Market by Deposit Type (Residual, Bedding, Vein, and Cavity Filling), by Grade (Up to grade 3.9, Grade 4.0, Grade 4.1, Grade 4.2, Grade 4.3, and Grade above 4.3) by Color (White & Off-White, Grey, Brown, and Others) and by End User Industry (Oil & drilling, Paints & coatings, Pharmaceuticals, Rubber & plastics, Textiles, Adhesives, and Others)—Global Opportunity Analysis and Industry Forecast, 2020-2027. Available online: https://www.alliedmarketresearch.com/barite-market (accessed on 12 March 2020).
- Kogel, J.E.; Trivedi, N.C.; Barker, J.M.; Krukowski, S.T. Industrial Minerals & Rocks: Commodities, Markets, and Uses, 7th ed.; Society for Mining, Metallurgy and Exploration: Littleton, CO, USA, 2006. [Google Scholar]
- Zimmermann, R.A. Stratabound barite deposits in Nevada. Miner. Depos. 1969, 4, 401–409. [Google Scholar] [CrossRef]
- Zhongcheng, W.; Guizhi, L. Barite and witherite deposits in Lower Cambrian shales of South China; stratigraphic distribution and geochemical characterization. Econ. Geol. 1991, 86, 354–363. [Google Scholar] [CrossRef]
- Samson, I.M.; Russell, M.J. Genesis of the Silvermines Zinc-Lead-Barite Deposit, Ireland Fluid Inclusion and Stable Isotope Evidence. Econ. Geol. 1987, 82, 371–394. [Google Scholar] [CrossRef]
- Fernandes, N.A.; Gleeson, S.A.; Magnall, J.M.; Creaser, R.A.; Martel, E.; Fischer, B.J.; Sharp, R. The origin of Late Devonian (Frasnian) stratiform and stratabound mudstone-hosted barite in the Selwyn Basin, Northwest Territories, Canada. Mar. Pet. Geol. 2017, 85, 1–15. [Google Scholar] [CrossRef]
- Collins, J. Summary of Kinoshita’s kuroko deposits of Japan. Econ. Geol. 1950, 45, 363–376. [Google Scholar] [CrossRef]
- Cortecci, G.; Fontes, J.C.; Maiorani, A.; Perna, G.; Pintus, E.; Turi, B. Oxygen, sulfur, and strontium isotope and fluid inclusion studies of barite deposits from the Iglesiente-Sulcis mining district, Southwestern Sardinia, Italy. Miner. Depos. 1989, 24, 34–42. [Google Scholar] [CrossRef]
- Piestrzyński, A.; Kowalik, K. Argentopentlandite from barite vein in Zagórze Śląskie, Lower Silesia; a first occurrence in Poland. Mineralogia 2015, 45, 13–25. [Google Scholar] [CrossRef]
- Fan, H.-R.; Hu, F.-F.; Wang, K.-Y.; Xie, Y.-H. Aqueous-carbonic-REE fluids in the giant Bayan Obo deposit, China: Implications for REE mineralization. In Mineral Deposit Research: Meeting the Global Challenge; Springer: Berlin/Heidelberg, Germany, 2005; pp. 945–948. [Google Scholar]
- Zaitsev, A.N.; Wall, F.; Le Bas, M.J. REE-Sr-Ba minerals from the Khibina carbonatites, Kola Peninsula, Russia: Their mineralogy, paragenesis and evolution. Mineral. Mag. 1998, 62, 225–250. [Google Scholar] [CrossRef]
- Phalen, W.C. Celestite Deposits in California and Arizona; U.S. Geological Survey: Reston, VA, USA, 1914; pp. 521–533.
- Krieger, P. The occurrence of strontianite at Sierra Mojada, Mexico. Am. Mineral. 1933, 18, 345–350. [Google Scholar]
- James, R.W.; Wood, W.A. The crystal structure of barytes, celstine and anglesite. Proc. R. Soc. Lond. 1925, 109, 598–620. [Google Scholar]
- Colville, A.A.; Staudhammer, K. A refinement of the structure of barite. Am. Mineral. 1967, 52, 1877–1880. [Google Scholar]
- Garske, D.; Peacor, D.R. Refinement of the structure of celestite SrSO4. Zeitschrift Für Kristallographie 1965, 121, 204–210. [Google Scholar] [CrossRef]
- Hawthorne, F.C.; Ferguson, R.B. Anhydrous sulphates. I. Refinement of the crystal structure of celestite with an appendix on the structure of thenardite. Can. Mineral. 1975, 13, 181–187. [Google Scholar]
- Miyake, M.; Minato, I.; Morikawa, H.; Iwai, S.-H. Crystal structures and sulphate force constants of barite celestite and anglesite. Am. Mineral. 1978, 63, 506–510. [Google Scholar]
- Antao, S.M. Structural trends for celestite (SrSO4), anglesite (PbSO4), and barite (BaSO4): Confirmation of expected variations within the SO4 groups. Am. Mineral. 2012, 97, 661–665. [Google Scholar] [CrossRef]
- Rasetti, F. The Raman effect in crystals. Nuovo Cim. 1932, 9, 72–75. [Google Scholar] [CrossRef]
- Balakrishnan, T.A.S. Effect of crystal orientation on the raman spectrum of barytes. Proc. Indian Acad. Sci. 1941, A14, 257–264. [Google Scholar] [CrossRef]
- Krishnan, K.S. Raman spectra of the second order in crystals. Part IV Barytes. Proc. Indian Acad. Sci. 1946, 23A, 288–295. [Google Scholar] [CrossRef]
- Kishore, R. Raman spectra of crystals excited by the mercury resonance radiations. Proc. Indian Acad. Sci. 1942, A16, 36–44. [Google Scholar] [CrossRef]
- Buzgar, N.; Buzatu, A.; Sanislav, I.V. The Raman Study of Certain Sulphates. Analele Stintifice Ale Univ. Al. I. Cuza 2009, 55, 5–23. [Google Scholar]
- Lee, P.-L.; Huang, E.; Yu, S.-C. High-pressure Raman and X-ray studies of barite, BaSO4. High Press. Res. 2003, 23, 439–450. [Google Scholar] [CrossRef]
- Liu, C.; Wang, D.; Zheng, H. In Situ Raman Spectroscopic Study of Barite as a Pressure Gauge Using a Hydrothermal Diamond Anvil Cell. Appl. Spectrosc. 2016, 70, 347–354. [Google Scholar] [CrossRef] [PubMed]
- Chen, Y.-H.; Huang, E.; Yu, S.-C. High-pressure Raman study on the series. Solid State Commun. 2009, 149, 2050–2052. [Google Scholar] [CrossRef]
- Kuang, Y.; Xu, J.; Zhao, D.; Fan, D.; Li, X.; Zhou, W.; Xie, H. The high-pressure elastic properties of celestine and the high-pressure behavior of barite-type sulphates. High Temp. High Press. 2017, 46, 481–495. [Google Scholar]
- Narayanaswamy, P.K. Influence of Temperature on the Raman Spectra of Crystals. Indian Acad. Sci. 1948, A28, 40–45. [Google Scholar] [CrossRef]
- Liu, L.; Mernagh, T.P.; Lin, C.C.; Irifune, T. Raman spectra of phase E at various pressures and temperatures with geophysical implications. Earth Planet. Sci. Lett. 1997, 149, 57–65. [Google Scholar] [CrossRef]
- Ross, S.D. Inorganic Infrared and Raman Spectra; McGraw-Hill Book Company Ltd.: London, UK, 1972; p. 414. [Google Scholar]
- Dimova, M.; Panczer, G.; Michael, G. Spectroscopic study of barite from the Kremikovtsi deposit (Bulgaria) with implication for its origin. Geol. Ann. Balk. Penins. 2006, 67, 101–108. [Google Scholar] [CrossRef]
- Griffith, W.P. Advances in the Raman and infrared spectroscopy of minerals. Adv. Spectrosc. 1987, 14, 119–186. [Google Scholar]
- Griffith, W.P. Raman studies on rock-forming minerals. Part II. Minerals containing MO3, MO4, and MO6 groups. J. Chem. Soc. A 1970, 286–291. [Google Scholar] [CrossRef]
- Theo Kloprogge, J.; Ruan, H.; Duong, L.V.; Frost, R.L. FT-IR and Raman microscopic study at 293 K and 77 K of celestine, SrS04, from the middle triassic limestone (Muschelkalk) in Winterswijk, The Netherlands. Neth. J. Geosci. 2016, 80, 41–47. [Google Scholar] [CrossRef]
- Girard, A.; Stekiel, M.; Spahr, D.; Morgenroth, W.; Wehinger, B.; Milman, V.; Tra, N.-T.; Mirone, A.; Minelli, A.; Paolasini, L.; et al. Structural, elastic and vibrational properties of celestite, SrSO4, from synchrotron x-ray diffraction, thermal diffuse scattering and Raman scattering. J. Phys. Condens. Matter 2019, 31, 055703. [Google Scholar] [CrossRef] [PubMed]
- Ye, Z.; Li, B.; Chen, W.; Tang, R.; Huang, S.; Xu, J.; Fan, D.; Zhou, W.; Ma, M.; Xie, H. Phase transition and thermoelastic behavior of barite-group minerals at high-pressure and high-temperature conditions. Phys. Chem. Miner. 2019, 46, 607–621. [Google Scholar] [CrossRef]
- Bridgman, P.W. Linear Compressions to 30,000 Kg/Cm2, including Relatively Incompressible Substances. Proc. Am. Acad. Arts Sci. 1949, 77, 226–229. [Google Scholar] [CrossRef]
- Suda, J.; Zverev, P.G. Temperature dependence of Raman frequency shift in SrWO4 crystal studied by lattice dynamical calculations. Crystals 2019, 9, 197. [Google Scholar] [CrossRef]
- Nesbitt, H.W.; Bancroft, G.M.; Henderson, G.S. Temperature dependence of Raman shifts and line widths for Q0 and Q2 crystals of silicates, phosphates, and sulfates. Am. Mineral. 2018, 103, 966–976. [Google Scholar] [CrossRef]
- Mernagh, T.P.; Liu, L.G.; Lin, C.C. Raman spectra of chondrodite at various temperatures. J. Raman Spectrosc. 1999, 30, 963–969. [Google Scholar] [CrossRef]
- Balkanski, M.; Wallis, R.F.; Haro, T. Anharmonic effects in light scattering due to optical phonons in silicon. Phys. Rev. 1983, 23, 1928–1934. [Google Scholar] [CrossRef]
- McMillan, P.F.; Wolfe, G.H. Vibrational spectroscopy of silicate liquids. Rev. Mineral. Geochem. 1995, 32, 191–246. [Google Scholar]
- Schmid, T.; Jungnickel, R.; Dariz, P. Insights into the CaSO4–H2O system: A Raman-spectroscopic study. Minerals 2020, 10, 115. [Google Scholar] [CrossRef]
- Gillet, P. Raman spectroscopy at high pressure and high temperature. Phase transitions and thermodynamic properties of minerals. Phys. Chem. Miner. 1996, 23, 263–275. [Google Scholar] [CrossRef]
- Chopelas, A. Thermal properties of forsterite at mantle pressures derived from vibrational spectroscopy. Phys. Chem. Miner. 1990, 17, 149–156. [Google Scholar] [CrossRef]
© 2020 by the authors. Licensee MDPI, Basel, Switzerland. This article is an open access article distributed under the terms and conditions of the Creative Commons Attribution (CC BY) license (http://creativecommons.org/licenses/by/4.0/).