Abstract
Environmental contamination due to human activities is a worldwide problem that has led to the development of different remediation techniques, including biotechnological approaches such as phytoextraction and phytostabilization. These techniques take advantage of pioneer plants that naturally develop tolerance mechanisms to survive in extreme environments. A multi-technique and multi-disciplinary approach was applied for the investigation of Helichrysum microphyllum subsp. tyrrhenicum samples, bulk soil, and rhizospheres collected from a metal-extreme environment (Zn-Pb mine of Campo Pisano, SW Sardinia, Italy). Zinc, Pb, and Cd are the most abundant metals, with Zn attaining 3 w/w% in the rhizosphere solid materials, inducing oxidative stress in the roots as revealed by infrared microspectroscopy (IR). X-ray diffraction (XRD), scanning electron microscopy (SEM), and chemical analysis coupled with synchrotron radiation-based (SR) techniques demonstrate that quartz, dolomite, and weddellite biominerals precipitate in roots, stems, and leaves, likely as a response to environmental stress. In the rhizosphere, Zn chemical speciation is mainly related to the Zn ore minerals (smithsonite and hydrozincite) whereas, in plant tissues, Zn is primarily bound to organic compounds such as malate, cysteine, and histidine molecules that act as metal binders and, eventually, detoxification agents for the Zn excess. These findings suggest that H. microphyllum subsp. tyrrhenicum has developed its own adaptation strategy to survive in polluted substrates, making it a potential candidate for phytostabilization aimed at mitigating the dispersion of metals in the surrounding areas.
1. Introduction
Anthropogenic activities, such as the production of municipal wastes, burning of fossil fuels, mining activities, use of pesticides, and fertilizers in agricultural practice, etc., [1], are a source of contamination by harmful elements that can disperse into the atmospheric, terrestrial, and aquatic ecosystems [2,3,4]. This environmental threat has resulted in the institution of different legislation controls and in the development of several types of remediation actions that include chemical, physical, and biological methods [5,6,7,8]. Among the bio-techniques, phytoremediation exploits the ability of plants to concentrate harmful elements in their tissues (phytoextraction) or to stabilize them into new mineral forms in the soil and root tissues (phytostabilization) [1,9].
The cost-effective application of phytoremediation methods requires an accurate understanding of the processes ruling metal distribution and their chemical speciation in the soil-plant system. The rhizosphere is the narrow soil zone acting as the interface between soil, plant roots, microbes, water, and air [10]. Processes occurring at the rhizosphere depend on several factors, both biotic and abiotic, and can deeply affect metal mobility. The mechanisms by which plants can tolerate excess of metals have been investigated with an increasing interest in the last decades, and the research is often focused on pioneer plants that grow on low-function (lack of nutrients and organic matter) and heavily polluted soils. To support their resilient behavior, pioneer plants could be able to: (i) sequester metals in organs or subcellular compartments (i.e., vacuoles) with little or no sensitive metabolic activity; (ii) chelate metals with exudates, phytochelatins, and peptides; (iii) mediate biomineral formation [11,12,13,14].
Several types of biominerals related to physiological needs and environmental stresses, i.e., phytoliths, cystoliths, and mineralized trichomes [15], can form in plant tissues [11,16]. Biominerals in plants belong to many different classes; the most common are Ca oxalate, Ca carbonate, and silica ([11] and references therein). Calcium [17], Sr and Ba [18] sulfates, Ca phosphate [19], and Mg and Sr oxalates [20] have been observed in some plant species. Other biominerals found in plants grown on polluted substrates are jarosite (KFe3(OH)6(SO4)2) [21], Fe oxides [22], hemimorphite-like phase [23], Zn-rich phyllomanganate [24], Fe plaques composed mainly of Fe, S, and K [25], Zn and Cd incorporated in calcite [26], or Cd incorporated in vaterite [27].
Besides the chemical composition, plant biominerals respond to specific physiological functions changing their shape, size, and localization [11]. For example, several studies have demonstrated the role of Ca oxalate in Al and metal (e.g., Sr, Cd, and Pb) detoxification [28]. However, in leaves of common bean (Phaseolus vulgaris L.), addition of metals such as Zn may decrease the number of Ca oxalate crystals, without showing incorporation of metals in crystals, suggesting that deposition of metals in Ca oxalate is both metal- and plant species-specific [11]. Coprecipitation of Al and other metals with Si may be responsible for the alleviation of their toxicity [11] via: (i) the complexation or co-precipitation of metals with Si; (ii) the immobilization of metals in growth media; (iii) the compartmentation of metals within plants; (iv) uptake processes [29,30,31,32]. Beyond Ca-oxalate and silica, organic molecules (e.g., cysteine, histidine, organic acids, etc.), Ca carbonate and sulfate biominerals may play a role in detoxifying metals [11,18,20].
During the 19th and the 20th centuries, Sardinia (Italy) was one of the most prominent mining poles in Europe [33], and after the closure of mines, only few remediation actions were applied. The largest amount of mine wastes in Sardinia occurs in the Rio San Giorgio catchment basin (Sulcis-Iglesiente district, SW Sardinia), where about 17 million m3 of open-pit excavations and 13 million m3 of dumps and tailings have been stored in dams characterized by inadequate containment control or dispersed into the rivers and lagoons [4,34,35,36,37]. These wastes have a highly contamination potential due to the high concentrations of metals [38] and the predominantly thin size of their particles that facilitate the aeolian dispersion [39].
In Sardinia, several autochthonous vascular plants are able to spontaneously colonize mine wastes and tolerate high concentrations of metals, such as Pistacia lentiscus L. [40], Euphorbia pithyusa subsp. cupanii (Guss. ex Bertol.) Radcl.-Sm. [9], Phragmites australis (Cav.) Trin. ex Steud., Helichrysum microphyllum Cambess. subsp. tyrrhenicum Bacch., Brullo, and Giusso [41] (hereafter referred to H. tyrrhenicum), and Epipactis helleborine (L.) Crantz subsp. tremolsii (Pau) E. Klein [42]. Helichrysum tyrrhenicum is an endemic perennial shrub of Sardinia and Corsica. It grows on different ecological conditions and substrates, especially muddy and sandy soils. This plant species is able to grow on metal contaminated substrates, and it is a pioneer plant in mine tailings [43,44], forming many plant assemblages typical of mine environments [45], and making it a potential candidate for phytostabilization techniques [39,46,47,48].
Despite the development of our researches, the microscopic biomineralization processes ruling Zn bioavailability at the soil-root interface and in the tissues of H. tyrrhenicum are still poorly known. The goal of this paper is to study the mineralogical evolution from soil to H. tyrrhenicum tissues harvested from the mine dump of Campo Pisano (SW, Sardinia, Italy). Synchrotron radiation-based techniques represent the state of the art tools used to investigate the microscopic processes occurring in plant-soil systems [49,50,51,52]. The most commonly applied techniques in environmental sciences include X-ray diffraction (XRD), X-ray imaging, and X-ray absorption spectroscopy (XAS), providing the finest complementary details about the atomic and crystallographic structure, distribution of elements, their chemical speciation, and their valence state [53]. Specifically, our investigation was carried out using a multi-method approach exploiting laboratory (chemical analysis, XRD, and scanning electron microscopy) and synchrotron radiation-based techniques (XAS, Infrared microspectroscopy, and soft X-ray microscopy combined with low energy X-ray fluorescence mapping) in order to achieve insight into the understanding of composition and structure of biomineralizations in H. tyrrhenicum.
2. Materials and Methods
2.1. Investigated Area and Sampling
Samples for this study were collected in the Campo Pisano area (Iglesiente mining district, Sardinia), hosted in the Rio San Giorgio valley (Figure 1). The geology of the investigated area is dominated by Paleozoic (mainly Cambro-Ordovician) successions, belonging to the external zones of the Variscan orogen [54,55]. The Lower Cambrian succession is represented by the Nebida Group and the Gonnesa Group, consisting of siliciclastic sedimentary rocks with carbonate intercalations and of tidal dolomites and limestones, respectively [55]. The Middle and Upper Cambrian to Lower Ordovician successions are subdivided into the Campo Pisano Formation and the Cabitza Formation (Iglesias Group), represented by nodular limestones and slates, respectively.
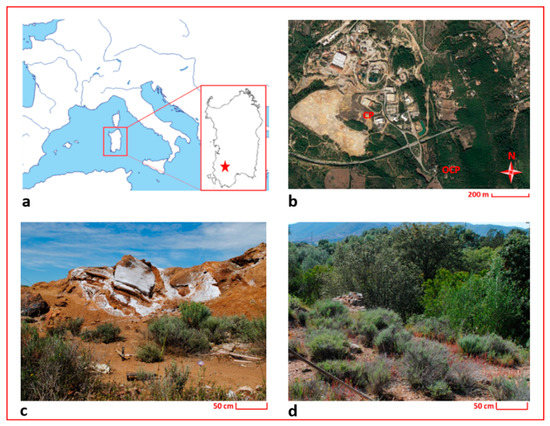
Figure 1.
Maps and photos of the investigated area; (a) localization of Sardinia in the Mediterranean basin (the red star indicates the localization of the study area); (b) localization of the sampling sites; (c) detail of the sampling site in the Campo Pisano mine dump (CP); (d) detail of the sampling site outside the Campo Pisano mine dump (OCP).
Mineralizations consist both of pre-Variscan primary sulfide deposits (ZnS and PbS), hosted in the Lower Cambrian carbonate rocks, and secondary non-sulfide deposits belonging to the carbonate-hosted “calamine” category [56], characterized by the presence of smithsonite (ZnCO3), hydrozincite (Zn5(CO3)2(OH)6), and hemimorphite (Zn4Si2O7(OH)2·(H2O)) as principal Zn-bearing minerals. The main gangue minerals are calcite (CaCO3), dolomite (CaMg(CO3)2), quartz (SiO2), iron-oxyhydroxides, and barite (BaSO4) [57,58].
The area is characterized by a Mediterranean pluviseasonal bioclimate, with thermotypes ranging between the upper thermo-Mediterranean and the lower meso-Mediterranean, with ombrotypes between the upper dry and the lower sub-humid [59]. Due to the lack of rainfall during the summer, typical of the Mediterranean climate, combined with the absence of a plant canopy, exposed mine wastes are subject to aeolian dispersion and water erosion amplifying the impact of the contamination [60].
For the aim of this study, specimens of H. tyrrhenicum were sampled in May 2016 from the Campo Pisano mine dump (CP) and from an area located approximately 2 km far away from the mine dump (OCP) (see Figure 1). The Campo Pisano mine dump is made up of fine flotation tailings produced by the metal extraction treatment applied to ZnS and PbS minerals and characterized by high metal contents (mainly Zn, Pb, and Cd). OCP is characterized by the same geochemical frame, but it was not subjected to mine activities (i.e., ore extraction or disposal of mine waste materials).
Three plants having similar size (50–70 cm height) were randomly selected and sampled on CP and OCP sites (CP1, CP2, CP3 and OCP1, OCP2, OCP3, respectively), and their bulk soils and rhizosphere materials were jointly collected. The main characters of the sampling sites are reported in Table S1 in Supplementary Materials. After harvesting, bulk soil (i.e., the material that was not tightly adhered to the plant roots) was separated from the plants by shaking the roots. The rhizosphere was subsequently recovered by putting the roots into a bag and shaking and gently wiping the roots.
For chemical analysis, each plant specimen was divided into roots and epigean organs (defined here as the aboveground portion of the plant, consisting of stems plus leaves), and they were vigorously washed several times (>6) with deionized water in order to remove soil particles. Every plant specimen was measured in terms of plant total height, root and stem length, and root and epigean organ dry biomass.
Different portions of the plant, namely roots, stems, and leaves, were selected for X-ray diffraction analysis (XRD) and X-ray absorption spectroscopy (XAS) analysis, after a vigorous washing with deionized water.
2.2. Mineralogical, Morphological, and Chemical Analysis
For XRD and chemical analysis, bulk soil and rhizosphere samples were oven-dried (Binder GmbH, Tuttlingen, Germany) at 40 °C for one week, and ground to an impalpable powder in an agate mortar. Plant samples (roots and epigean organs) were oven-dried at 40 °C for four days and finely ground (<40 µm) with an electric grinder (Ultra Centrifugal Mill ZM 200, Retsch GmbH, Haan, Germany). X-ray diffraction was performed using an X’pert Pro diffractometer (Panalytical, Almelo, The Netherlands) with θ-θ geometry, operating at 40 kV and 40 mA with Cu Kα radiation (λ = 1.54060 Å) and using the X′Celerator detector (Panalytical, Almelo, The Netherlands). The obtained diffraction spectra were qualitatively analyzed with X’Pert HighScore Plus 2.1 (Panalytical, Almelo, The Netherlands) using PDF-2 database of the International Centre for Diffraction Data. For XRD results, we reported selected samples, considered as representative, because no significant variations were observed in mineral composition among the samples collected in triplicate. Results are reported in Table 1.

Table 1.
Minerals detected in the bulk soil, rhizosphere and different plant tissues of selected samples (CP1 from the mine dump, and OCP1 outside the mine dump). ● indicates minerals detected in the investigated samples.
Microscopic characteristics and element distribution of root samples were investigated by scanning electron microscopy (SEM) imaging and energy dispersive spectroscopy (EDS, Thermo Scientific™ UltraDry EDS Detector, Pathfinder, Waltham, MA, USA) analysis using an environmental scanning electron microscope (ESEM QUANTA 200, FEI, NE Dawson Creek Drive, Hillsboro, OR, USA).
For chemical analysis, acid digestion was performed in duplicate on 0.5 g of each sample collected in triplicate (bulk soils, rhizospheres, roots, and epigean organs) by microwave oven (Start D, Milestone, Sorisole, Italy) using the Environmental Protection Agency (EPA) method 3052 (see details in Supplementary Materials, SM1). Zinc, Pb, and Cd concentrations were determined in filtered solutions by inductively coupled plasma-optical emission spectroscopy (ICP-OES, Perkin Elmer Optima DV 7000, Waltham, MA, USA). To evaluate the precision and accuracy of chemical analysis and to evaluate the quality of data, the EnviroMAT-Drinking Water High (EP-H-3, SCP Science, ref.140-025-032, Quebec, QC, Canada) reference solution was used. In the results section, we reported the mean values and the standard errors calculated according to [61] (see Section 2.7, statistical analysis).
2.3. Biological Concentration Factor, Biological Accumulation Coefficient, and Translocation Factor
In order to evaluate the mobility of the investigated metals from soil and rhizosphere to plant tissues, three different indexes were calculated: the biological concentration factor (BCF), the biological accumulation coefficient (BAC) and the translocation factor (TF). The BCF [62,63,64] was evaluated to determine the uptake of metals from the substrate (bulk soil or rhizosphere) to plant roots, according to Equation (1):
where Mroot and Msoil or Mrhizo are the metal concentration (mg/kg) into clean roots and bulk soil or rhizosphere, respectively.
The BAC (Equation (2)) was calculated to estimate the uptake of metals from the bulk soil or the rhizosphere to epigean organs, according to Marchiol et al. [65]:
where Mepi and Msoil or Mrhizo are the metal concentration (mg/kg) in clean epigean organs and bulk soil or rhizosphere, respectively.
The TF [66] was calculated to evaluate the translocation of metals (mg/kg) from clean roots (Mroot) to epigean organs (Mepi) as reported in Equation (3):
2.4. Soft X-Ray Microscopy Combined with Low Energy XRF Mapping
Root samples were analyzed by soft X-ray microscopy combined with low energy X-ray fluorescence (LEXRF) mapping analyses at the TwinMic beamline [67] at the Elettra-Sincrotrone Trieste (experiment number 20152020). Samples of roots were prepared by dehydration in a graded series of ethanol solutions (50, 75, 90, and 100%) followed by xylene. All steps were carried out at room temperature (~20 °C) for 30 min each. The samples were infiltrated overnight in liquid paraffin wax at 60 °C and the infiltrated roots were then embedded into paraffin blocks. Sections of 14 µm were cut with a microtome (Reichert-Jung Ultracut E, Biocut, Nussloch, Germany) and collected on 4 µm-thick ultralene films.
The TwinMic microscope was operated in scanning transmission mode. See SM2 in Supplementary Materials for a thorough presentation [68,69,70,71]. For the present investigation, the X-ray beam energy (E = 1.985 keV) was chosen to ensure the best excitation and detection of Si, Al, and Zn, with a spatial resolution (X-ray spot size) of 1 µm × 1 µm, as a compromise between good XRF signal and dimension of the features of interest. The XRF elemental maps were deconvolved and analyzed with PyMCA software (version 5.3.1, ESRF, Grenoble, France) [72]. For scanning transmission X-ray microscopy (STXM) results, we reported maps of selected samples, since the overall element distribution was similar for all investigated plant specimens.
2.5. X-Ray Absorption Spectroscopy
The Zn K-edge (9.659 keV) XAS measurements were carried out at the XAFS beamline at Elettra-Sincrotrone Trieste (experiment number 20160254) [73]. The dried and ground rhizosphere samples were mixed with a PVP (polyvinyl pyrrolidone) matrix (1:1 weight ratio) and pressed in thin solid pellets. The dried and ground plants were pressed (without the addition of other matrix) in solid pellets. The Zn K-edge absorption spectra were measured in transmission geometry for rhizospheres and roots (through gas-filled ionization chambers, Oxford Instruments, Abingdon-on-Thames, UK), and in fluorescence geometry for stems and leaves (using a Silicon Drift Detector AXAS-M, Ketek, Munich, Germany), keeping the samples at the liquid nitrogen temperature. XAS spectra for each sample were collected at least in triplicate for averaging and statistics. According to literature data [23,26,50,52,74,75,76,77,78], in the soil-plant system, Zn can occur in different coordination environments, both bound to organic compounds (e.g., organic acids, phytochelatins, metallothioneins, etc.) and to inorganic molecules (e.g., sulfur, sulfate, carbonate, etc.) [79,80], thus an ample set of reference compounds (Figure S1 in Supplementary Materials) was measured in transmission geometry. A Zn foil was used to calibrate sample spectra. Zinc K-edge raw XAS data were treated following the standard methods [81,82] for background subtraction and edge-jump normalization. After a preliminary investigation, we observed that in the analyzed samples, Zn lied in different mineral and/or organic phases, thus we decided to perform a linear combination analysis (LCA) of XANES (X-ray absorption near edge structure) [83] to quantitatively understand the main Zn-phases in the samples. Because of the complex Zn phase composition (see LCA in Section 3.3, Element Distribution and Zn Chemical Speciation), the quantitative analysis of the EXAFS (extended X-ray absorption fine structure) signal, mainly providing the average Zn-coordination, cannot add further details, therefore we focused on the XANES region. In order not to burden the discussion, we selected XAS results for some representative plant samples from specific sampling areas.
2.6. Infrared Microspectroscopy
FTIR (Fourier transform infrared) spectroscopy measurements were performed at the Chemical and Life Science branch of the SISSI beamline [84] at Elettra-Sincrotrone Trieste (experiment number 20152020). Fourteen micrometers thin sections, prepared as for soft X-ray microscopy, embedded in cutting medium and supported on ultralene, were transferred on CaF2 optical windows. For the measurements, the Hyperion 3000 microscope coupled with the Bruker Vertex 70v in vacuum interferometer was used (Bruker Optik GmbH, Ettlingen, Germany). Data were acquired in transmission mode (15× condenser/objective) by using both synchrotron radiation (SR) and conventional sources. FTIR images were recorded using a focal plane array detector (FPA) (Lockheed Martin Santa Barbara Focalplane, Goleta, CA, USA); whereas for IRSR maps, samples were raster scanned and single point spectra were measured by a mercury cadmium telluride detector (MCT) (Infrared Associates, Inc., Stuart, FL, USA). Spectra were acquired averaging 512 scans for each measure, with a spectral resolution of 4 cm−1. Pixel size of FTIR images have a native lateral resolution of 2.6 × 2.6 microns/pixel, whereas IRSR maps were acquired setting the knife-edge apertures of the microscope, thus limiting the IRSR beam to 10 × 10 microns.
A data analysis pipeline including hierarchical cluster analysis (HCA) and Principal component analysis (PCA) was exploited for data interpretation. More detail on the data analysis workflow are described in SM3 (Supplementary Materials) [85,86,87]. Here we mention the most characteristic spectral bands exploited for data interpretation: C=O band of hemicellulose and pectin 1775–1700 cm−1, Amide I of proteins 1680–1565 cm−1, aromatic rings of lignin 1530–1495 cm−1, COH deformations and CCO stretching at 1295–1190 cm−1, C–O–C from polysaccharides 1190–970 cm−1 [88].
2.7. Statistical Analysis
Statistical analysis has been carried out on experimental data and the standard errors were calculated accordingly to [61]. The average () values (Table 2, Table 3 and Table 4) were measured on independent samples and the standard uncertainties were calculated as . The LCA of Zn K-edge XANES was carried out applying a non-linear least squares refinement procedure implemented in the Athena program [89]. The program uses the χ2 as a quality factor to compare the results of LCA obtained with different component sets. For each spectrum the number of components statistically significant for the LCA was individuated using an F-test [61].
Table 2.
Mean values (n = 3 for each site) and standard error (%) of Zn, Pb, and Cd contents in the soils, rhizosphere, roots, and epigean organs of H. tyrrhenicum in CP and OCP.
Table 3.
Mean values (n = 3 for each site) and standard error of biological concentration factor (BCF), biological accumulation coefficient (BAC), and translocation factor (TF) considering metal concentration in soil and in the rhizosphere.
Table 4.
Mean values (n = 3 for each site) and standard error of biometric parameters measured on H. tyrrhenicum.
3. Results
3.1. Mineralogical Composition and Metal Contents
Table 1 shows mineral phases detected in some selected samples (CP1 and OCP1) that can be considered as representative, because no significant variations were observed in mineral composition. Quartz and dolomite were observed both in the bulk soil and rhizosphere samples from CP (Campo Pisano mine dump) and OCP (outside the mine dump of Campo Pisano), and they represent the gangue minerals of the ore deposits. Pyrite (FeS2) was detected in soils and rhizospheres from CP and not in OCP samples, whereas gypsum (CaSO4) and jarosite (KFe3+3(SO4)2(OH)6) were found in soil samples collected in the mine dump (CP). Smithsonite was found only in the soils collected outside the mine dump (OCP samples), probably resulting from the oxidation of the primary Zn sulfides [57]. In plant samples, quartz, dolomite, weddellite (Ca(C2O4)·2(H2O)), and amorphous cellulose were detected.
Figure 2 shows SEM analysis performed on some selected samples of the roots of H. tyrrhenicum grown on the mine dump (CP). Plant roots embed mineral particles (Figure 2a) that strongly adhere to their surface. We mainly recognized quartz and Al-silicates (Figure 2a, points 1 and 2); also, Zn, Pb, and Fe were detected by EDS analysis in the rhizosphere grains located on the surface of the roots (Figure 2b, points 3 and 4). In detail, Figure 2c shows a longitudinal section of a plant root, where we can observe a mineral rim mainly made up of Si, Al, and O (Figure 2c, point 5). In the inner part of the roots, we mainly detected Si, Al, O, and K (Figure 2c, point 6).
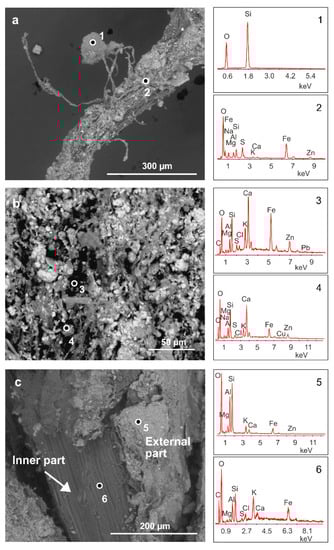
Figure 2.
Energy dispersive spectroscopy-scanning electron microscopy (EDS-SEM) analysis of H. tyrrhenicum roots from the Campo Pisano mine dump (CP1). (a) Quartz grain embedded by plant roots, (b) mineral rim covering the roots, and (c) longitudinal section of H. tyrrhenicum root. Numbers from 1 to 6 indicate the points where EDS spectra were acquired.
Table 2 reports the mean values of Zn, Pb, and Cd concentrations measured in three specimens of H. tyrrhenicum (roots and epigean organs), in the respective bulk soils and in the related rhizosphere materials. For comparison purposes, the (i) threshold contamination levels established for an industrial use of soil by the Italian laws (D.lgs 152/2006) [90], and (ii) background values for the area are also reported. Zinc is the most abundant metal in the bulk soils (24,900CP–32,700OCP mg/kg), rhizospheres (26,300CP–27,300OCP mg/kg) and in the plant tissues (890OCP–3290CP mg/kg), followed by Pb (1240OCP–5000CP mg/kg in the soils, 1600OCP–5030CP mg/kg in the rhizospheres, and 50OCP–1020CP mg/kg in the plant tissues) and Cd (100CP–340OCP mg/kg in the soils, 170CP–280OCP mg/kg in the rhizospheres, and 13OCP–31OCP mg/kg in the plant tissues). It should be noted that metal contents detected in this work are of the same order of magnitude as in previous studies [39,41,46,91], in which relevant local variations due to heterogeneities of the mine tailings can be highlighted.
BCF, BAC, and TF (Table 3) were calculated to investigate the transfer of metals from geosphere to plant tissues and their translocation from the roots to the epigean organs. BCF may be an indicator of the accumulation and phytostabilization potentialities of H. tyrrhenicum. BCFsoil and BCFrhizo values calculated in relation to Zn (Zn-BCFsoil-CP 0.13, Zn-BCFrhizo-CP 0.13) and Pb (Pb-BCFsoil-CP 0.14, Pb-BCFrhizo-CP 0.13) for samples collected inside the mining areas are higher than those calculated for the samples collected outside the mining site (Zn-BCFsoil-OCP 0.04, Zn-BCFrhizo-OCP 0.05, Pb-BCFsoil-OCP 0.05, Pb-BCFrhizo-OCP 0.04). Cadmium is characterized by very similar values of BCFrhizo (Cd-BCFrhizo-CP 0.14, Cd-BCFrhizo-OCP 0.11) for the two sampling areas, whereas BCFsoil is higher in the CP samples (Cd-BCFsoil-CP 0.26) than in the OCP samples (Cd-BCFsoil-OCP 0.09). Considering the standard errors reported in Table 3, the calculated values show no significant differences between BCFsoil and BCFrhizo.
BAC values show that H. tyrrhenicum has a low capability (BAC ≤ 0.2) to accumulate the investigated metals in epigean organs. At the Campo Pisano mine, the highest value of BAC was observed for Pb (Pb-BACsoil-CP 0.2, Pb-BACrhizo-CP 0.2), followed by Zn (Zn-BACsoil-CP 0.12, Zn-BACrhizo-CP 0.12) and Cd (Cd-BACsoil-CP 0.16, Cd-BACrhizo-CP 0.09). OCP samples have lower BAC than CP samples, and they are characterized by very similar values for Zn, Pb, and Cd (Zn-BACOCP 0.03, Pb-BACOCP 0.03–0.04, Cd-BACOCP 0.04–0.05). As for the BCF values, Cd-BACsoil-CP (0.16) is higher than Cd-BACsoil-OCP (0.04), and no significant differences were observed between BACsoil and BACrhizo for the investigated areas.
TF values decrease in the order Pb-TF > Zn-TF > Cd-TF both for CP (Pb-TFCP 1.5, Zn-TFCP 0.93, Cd-TFCP 0.64) and OCP samples (Pb-TFOCP 0.76, Zn-TFOCP 0.63, Cd-TFOCP 0.42). H. tyrrhenicum specimens harvested inside the mining area show the highest translocation for Pb (Pb-TFCP 1.5).
Measurement of plant biomass (Table 4) indicates that the root biomass is always lower than epigean biomass, in particular for OCP, where specimens show an important epigean development. From Zn concentrations in plant tissues (Table 2), and assuming that 5 specimens of H. tyrrhenicum can fit in 1 m2, we estimated that this species could accumulate from 6 to 11 kg/ha of Zn (Table 5).
Table 5.
Zn’s yield of accumulation of H. tyrrhenicum.
3.2. Chemical Characterization of the Plant Tissues
Several sections of each H. tyrrhenicum tissue were imaged and results of selected samples are shown in Figure 3 and Figure 4 (a larger view of the slices is presented in Figure S2 in Supplementary Materials). At first, the different areas of the plant were roughly identified through a visual inspection. In Figure 3a, the optical image of a stem section is shown. This section was one of the best preserved, though some areas of the outer endothelium broke and folded on top of the other. Since the image was not clear, a cluster analysis was used to support the identification of the different areas of the plant section and to remove the background pixels as well as those containing mainly paraffin.
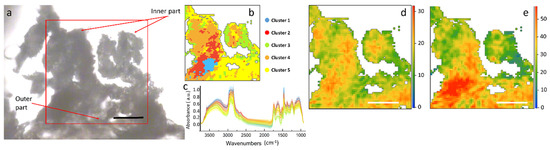
Figure 3.
(a) Optical image of a stem section of H. tyrrhenicum from the Campo Pisano mine dump; (b) false color map depicting the distribution of the different spectral clusters identified by hierarchical cluster analysis (HCA), the main areas of the plant; (c) centroids of the different clusters (solid line), plus minus standard deviation (shaded area); (d) false color map representing the hemicellulose distribution; (e) ring in plane vibrations of polysaccharides. Scale bar: 50 µm.
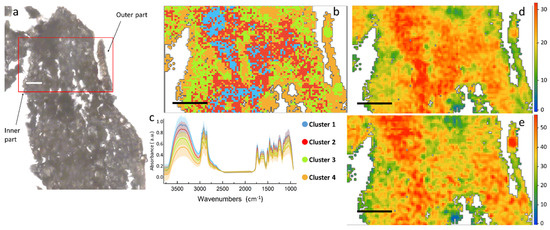
Figure 4.
(a) Optical image of a root section of H. tyrrhenicum from the Campo Pisano mine dump; (b) false color map depicting the distribution of the spectral clusters identified by HCA, the main areas of the plant; (c) centroids of the different clusters (solid line), plus minus standard deviation (shaded area); (d) false color map representing the hemicellulose distribution; (e) ring in plane vibrations of polysaccharides. Scale bar: 50 µm.
The results of the HCA are presented in Figure 3b,c. From the color map, we can identify three main areas within the inspected sample: one represented by the yellow cluster, closer to the outer part of the section, could be the epidermis/cortex; one, orange, could be assigned to the endodermis; the red and blue clusters, almost in the inner part, could be the phloem and xylem, since they result also in aromatic polysaccharides.
The heat maps obtained by integrating the peaks of the main components of the plant cell wall, such as hemicellulose and ring in plane vibrations of aromatics, are presented in Figure 3d,e. These maps represent the spatial distribution of the different macromolecules within the stem section. Assuming a constant thickness of the thin section, the intensity of the colors in the maps is proportional to the chemical concentration. From the chemical profiles in Figure 3, it can be seen that aromatics have a hot spot in the center of the xylem. In almost all of the stem sections of this set of samples the external layer of epidermis was heavily affected by the paraffin.
Similar information on the chemical distribution of the main cell wall components can be obtained by the analysis of Figure 4, which represents a cross section of the root. Differently from stem, aromatics and C=O signals for root in panels 5d and 5e tend to co-localize, presenting a similar spatial distribution in the left part of the section. From the HCA map it is possible to identify two macro areas, one represented by cluster 1 and 2, mostly present in the center of the map, and a second district characterized by the presence of clusters 3 and 4. Tentatively, we can assign it to the outer right part of the epidermis (clusters 3 and 4), and the central part more rich in proteins (clusters 1 and 2).
Comparing the centroid plots in Figure 3c (for stem) and Figure 4c (for root), it is possible to appreciate some spectral differences. The root is richer than the stem in carbohydrates, since both the –OH stretching at 3500 cm−1 and the C–O–C stretching at ~1180–1000 cm−1 are more intense that the C=O at 1750 cm−1 in the root. On the contrary, if we compare the same signals in the stem, the C=O results almost as high as the OH and C–O–C. From the maps in Figure 3d and Figure 4d it can be seen that even though the maximum value of the C=O band is comparable between the two regions of the plant, this chemical moiety is more diffused into the overall root section, whereas in the stem it is limited only to a small area in the inner part. This can be a symptom of higher oxidative stress within the root in respect to the stem [93,94].
In order to better highlight the chemical differences between root and stem, the data were normalized and then subjected to PCA. Figure 5a shows the scatter plot resulting from the PCA; the root and stem spectra do not differ much from the chemical point of view and only a partial separation can be achieved along PC1 (which accounts for ~54% of the variance) and PC8 (~1% of the variance). In Figure 5b the loadings vectors of PC1 and PC8 are presented. PC1 mainly takes into account the variation in carbohydrates that was discussed in the previous paragraph, when comparing the centroids of the HCA. Summarizing, the roots are richer in carbohydrates than the stems.
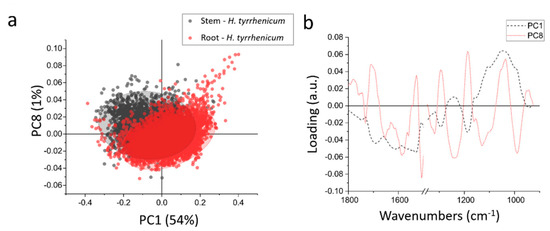
Figure 5.
(a) Scatterplot representing the projection of the principal component (PC) scores in the PC1-PC8 bi-dimensional space, red the root and black the stem; (b) line plot of the loading vectors PC1(dot black line) and PC8 (continuous red line), 1500–1350 cm−1 region is omitted because of the presence of fixative peak.
PC8 accounts only for 1% of the variance, thus the spectral variations that it represents can be barely appreciated in the average spectra from the samples. It is a quite complex loading, with 5 main positive peaks and 6 main negative peaks: 1710 cm−1, 1525 cm−1, 1290 cm−1, 1185 cm−1, and 1036 cm−1 are the positive peaks, whereas 1652 cm−1, 1580 cm−1, 1508 cm−1, 1239 cm−1, 1129 cm−1, and 968 cm−1 are negative ones. The negative peaks like 1652 and 1508 cm−1, can be interpreted as a minor content of alpha helix proteins in the root in respect of the stem. The same can be seen in the signals at 1239–1129 cm−1 that can be due to a decrease in phosphates. The positive peaks, instead, represent a higher amount of those specific chemical moieties in the roots in respect to the stem. Like the band at 1710 cm−1, that represents some more oxidized species, that are more widespread in the roots, or the peaks at 1290 cm−1, 1185 cm−1, and 1036 cm−1, that can be assigned to cellulose.
3.3. Element Distribution and Zn Chemical Speciation
Thin cross sections of roots were analyzed by STXM coupled with LEXRF to investigate the distribution of Si, Al, Zn and Fe (Figure 6). Silicon and Al are mainly concentrated on the root surface, forming a rim on the epidermis according to SEM observations. Generally, their content decreases from the external part toward the inner zone, and also, they can occur as concentrated spots in the internal part of the roots. Zinc and Fe are mainly located in the external part of the root but their variation in distribution is less marked than Al and Si.
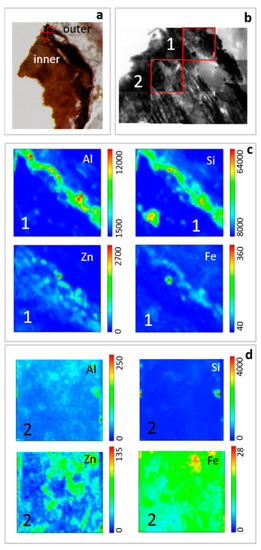
Figure 6.
Thin cross section of H. tyrrhenicum roots collected in Campo Pisano mine dump. Ordinary light stereo-microscope image with location of acquired maps (a), brightfield (absorption) images (b), and low energy X-ray fluorescence (LEXRF) maps (c and d) of Si, Al, Zn, Fe in outer (1) and inner part (2) of roots. Maps 1 and 2: size 80 × 80 μm2, scan 48 × 48 pixels.
Zn K-edge XANES analysis was performed to investigate the average chemical environment of Zn. The quantitative analysis of the XANES region of biological samples is a complex task and the comparison of experimental spectra with reference compounds can help to shed light on their average mineralogical environment. Figure S1 and Figure 7 show the Zn-K edge absorption spectra in the XANES region of the reference compounds and selected rhizosphere and plant samples, respectively. XANES spectra of the rhizospheres and plant tissues are smoother and broader than the reference compounds, suggesting that in the investigated samples Zn occurs in a more disordered chemical/coordinative environment. Also, the XANES spectral features are more pronounced in the rhizosphere spectra than in the plant samples, indicating that the local structure around Zn becomes progressively more disordered during its transfer from the geosphere to the biosphere.
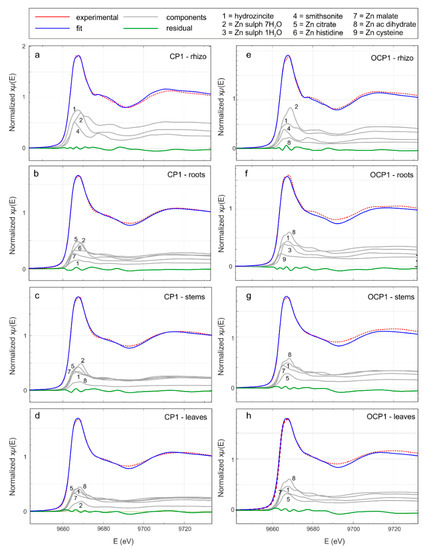
Figure 7.
Zn K-edge X ray absorption near edge structure (XANES) spectra (red) and linear combination analysis (LCA, blue) of the rhizosphere and H. tyrrhenicum of selected samples (CP1—from a to d—from the mine dump, and OCP1 outside the mine dump—from e to h). In gray the fractional contribution of the principal components and in green the residual (experimental data minus LCA best fit).
Qualitative comparison of the XANES spectra (Figure S1 and Figure 7) suggests that in rhizosphere and plant samples, Zn probably occurs in different chemical environments. To obtain information about the average Zn coordination chemistry, we performed a LCA, using the reference compounds from Figure S1. A trial and error procedure allowed the selection of a minimal subset of reference compounds; the results are shown in Figure 7 and Table 6. In all the rhizosphere samples (Figure 7a,e), the main contribution comes from smithsonite, hydrozincite, and Zn sulfate heptahydrate. In the fitting procedure, the contribution of Zn acetate dihydrate proved to be relevant in the rhizosphere solid materials from the OCP site. Moving toward the roots (Figure 7b,f), stems (Figure 7c,g), and leaves (Figure 7d,h), the contribution of smithsonite disappears and the addition of Zn organic compounds (Zn citrate, Zn histidine, Zn acetate dihydrate, Zn malate, and Zn cysteine) becomes necessary to achieve a good fit.
Table 6.
Results of linear combination analysis of X-ray absorption near edge structure (XANES) spectra for the rhizosphere and H. tyrrhenicum of selected samples (CP1 from the mine dump, and OCP1 outside the mine dump). The sum of contribute fractions is fixed to 100%, the incertitude on the fraction values is around 5–8%.
4. Discussion and Conclusions
4.1. Metal Content and Mineralogy
The chemical analysis of bulk soils and rhizosphere materials (Table 2) from the mine dump (CP samples) showed that metal contents (Zn 24,900–26,300 mg/kg, Pb 5000–5030 mg/kg, Cd 100–170 mg/kg) are extremely well above the threshold limits imposed by Italian laws (D.lgs. 152/2006 [90]) for sites for industrial use (Zn 1500 mg/kg, Pb 1000 mg/kg, Cd 15 mg/kg), supporting previous works carried out in the same study area and confirming the high Zn, Pb, and Cd contamination [39,41,46,91]. Also values from OCP samples exceed the Italian pollution thresholds probably due to the aeolian dispersion of fine particles from the nearby tailing dump. Indeed, Zn and Pb concentrations in these area (Zn 27,300–32,700 mg/kg, Pb 1240–1600 mg/kg) are higher than median values estimated on stream sediments of the Iglesiente mining district by Boni et al. [92], that can be actually assumed as the local post-mining geochemical-baseline-values.
The investigated indexes for bioconcentration, bioaccumulation and translocation (BCF, BAC and TF in Table 3) indicated that, overall, H. tyrrhenicum has a low capability to accumulate and translocate metals in epigean organs, and there were no significant differences between BCFsoil (or BACsoil) and BCFrhizo (or BACrhizo). In this work we depict the geo-bio-microscopic processes driving or resulting from the interaction among H. tyrrhenicum and the investigated soil minerals. Mineralogical investigation (Table 1) showed that some ore-forming or ore-derived minerals were detectable in the bulk soil and rhizosphere. Quartz, dolomite, and pyrite were detected in CP samples. Pyrite is commonly associated with sulfide deposits in SW Sardinia [92], and it represents a residue of the mining activities. Jarosite and gypsum were found due to weathering of pyrite and dolomite [95,96,97]. In OCP, smithsonite and phyllosilicates were observed instead of gypsum plus jarosite. We attribute this difference to the absence or a low amount (below the XRD detection limit) of pyrite in OCP, resulting in a lower acidity of pore water for this substrate [98].
Quartz and dolomite were found in roots, stems, and leaves of H. tyrrhenicum. These minerals can occur in roots as residual grains not completely dissolved by plant physiological activities [23,99]. However, their occurrence in leaves and stems has to be ascribed to a biologically-driven mineralization [11,100,101]. Silica, both amorphous and crystalline, is known to occur in different plant tissues [102] and it can have a protective function (e.g., against herbivores) and/or it may alleviate the toxicity of Al and other metals in plants [32,103]. Alkaline earth elements are absorbed by plants in their ionic form and during the soil-to-plant transfer, Mg follows Ca closely [104], and probably it may precipitate in plants similarly to Ca. Calcium and Mg are essential for plant growth, and plants may not be able to reduce their uptake beyond the requirement for the plant metabolism, and the excess may be stored in crystalline phases [20]. These mechanisms could explain the presence of dolomite in H. tyrrhenicum samples from CP, where soluble Ca sulfate minerals are abundant in soils due to the dissolution of pyrite and Ca carbonate minerals.
In roots of H. tyrrhenicum from CP, the Ca oxalate weddellite was detected. Calcium oxalate is the most common biomineral in higher plants [11,105] and its role is still controversial. The main functions recognized in Ca-oxalate biomineralization have been ascribed to (i) regulation of the ionic equilibrium and osmotic pressure in cells; (ii) control of Ca and oxalic acid concentrations [106]; (iii) storage of essential ions [107]; (iv) mechanical support and plant defense [105]; (v) incorporation of metals and alleviation of their toxic effects [106,108]. The latter mechanism could explain the presence of weddellite in polluted samples (CP) of our study.
4.2. Mineral Rim at the Root-Rhizosphere Interface and Zn Chemical Speciation
In this study, SEM and EDS analysis showed the presence of a mineral rim made up of Al-silicates coating the epidermis of H. tyrrhenicum roots (Figure 2), as previously observed in other autochthonous plant species growing in similar environments, like E. pithyusa subsp. cupanii, P. lentiscus, P. australis, and J. acutus [23,76,77,78,109]. This structure was also detected by STXM (Figure 6), also showing that Zn is mainly stored in the root epidermis. Moreover, the presence of Zn in the epidermis is consistent with previous study carried out on this plant species [39,46,47] that demonstrated its tolerance towards Zn via a metal exclusion strategy. In the rhizosphere, XAS analysis showed that Zn is mainly present as smithsonite, hydrozincite, and Zn sulfate, resulting from the oxidation of the primary Zn sulfides [110,111,112]. These phases were not detected by XRD, possibly because their concentration lies below the instrumental detection limit (~1% by volume). Nevertheless, we must stress that the XAFS technique highlights the different phases on the basis of the local coordination chemistry around the absorber: hence, the large structural and compositional disorder inherent in natural samples may prevent the local order to be long range coherent, worsening the diffraction signals. The detection of Zn acetate dihydrate in the rhizosphere can be due to the presence of root exudates that chelate metals in soils [12]. In roots and epigean tissues of H. tyrrhenicum, the contribution of smithsonite disappears and organo-Zn compounds as Zn histidine, Zn cysteine, Zn citrate, Zn acetate dihydrate, and Zn malate become predominant.
Accordingly, FTIR analysis identified some organic compounds (lignin, hemicellulose, and esters) and carboxylic groups. It was not possible to detect any Zn complexes within the samples with FTIR, first because of the small amount of them in comparison with the organic matter, second because of the strong overlap of the signals that hindered a straightforward detection. Nonetheless, FTIR was demonstrated some of the effects of the presence of the heavy metals within the roots, as detected by XRF (Figure 6), like the higher presence of oxidized species, in agreement with previous investigations conducted on plants exposed to high metal concentrations [113]. Indeed, Zn is an essential trace element, required in small amounts to perform various coenzyme and regulatory functions [114]. Excessive amounts cause toxic effects, inhibiting root and shoot growth and reducing the leaf chlorophyll content [115]. Organic molecules (e.g., amino acids like histidine, and organic acids like malic acid and citric acid) play an important role in metal tolerance because they have a strong affinity to metals [116,117], preventing their intracellular accumulation. In different plant species, Zn in roots is mainly coordinated by O and N ligands, modeled as the free amino acid histidine [50,114,118]. Then, Zn may be transported to the stem, either as a hydrated cation or as a metal organic acid complex [50,119], where it is accumulated in the vacuoles. Other detoxifying agents detected in plant roots are COOH/OH groups, oxalate, phosphate [74,120,121], and malate molecules [121]. Our STXM, XAS, and IR results support previous synchrotron-based studies ([114] and references therein) demonstrating that plant species evolve adaptive strategies to tolerate metals via transport, chelation, and sequestration processes that involve specialized molecules [74].
Finally, we argue that H. tyrrhenicum has developed its own built-in mechanism of metal tolerance as response to metal stress, as already pointed out in previous studies on plant species pioneering highly-contaminated Zn mine waste [13]. Zinc phytomining by using excluders pioneer plants is far below the economic cut off. In fact, we estimated that the amount of Zn that can be recovered by H. tyrrhenicum tissues and other pioneer plants is around few kilograms per hectare (6–11 kg/ha). Zn phytomining, given the actual price of Zn, does not provide economic sustainability. Nevertheless, insights from this study are of relevant interest to develop sustainable phytoremediation techniques. Helichrysum tyrrhenicum is an unquestioned candidate for phytostabilization [39,47,48] mainly because (i) it offers a long-term plant canopy, (ii) it can reduce the erosion processes and the release of pollutants in soil and air, and (iii) it can reactivate the pedological and vegetational dynamics. Further investigations will be needed to better elucidate the plant-microbe interactions, their impact on vegetational dynamics, and the potential role of plant growth-promoting bacteria on metal accumulation.
Supplementary Materials
The following are available online at https://www.mdpi.com/2075-163X/10/3/259/s1, Figure S1: Zn K-edge X-ray absorption near edge structure (XANES) spectra of the reference compounds; Figure S2: Optical images of a stem (a) and a root (b) section of H. tyrrhenicum from the Campo Pisano mine dump; Table S1: Coordinates (WGS84) and characteristics of the sampling sites.; Section SM1: Chemical Analysis; Section SM2: TwinMic Microscope; Section SM3: Infrared Microspectroscopy.
Author Contributions
Conceptualization, D.M. and G.D.G.; Data curation, M.E.B., D.M., G.B. (Giovanni Birarda), A.G., C.M., M.P. (Martina Piredda), and L.V.; Funding acquisition, C.M., G.C., and G.D.G.; Investigation, M.E.B., D.M., G.B. (Gianluigi Bacchetta), G.B. (Giovanni Birarda), G.C., I.C., A.G., C.M., F.P., M.P. (Martina Piredda), V.R., L.V., and G.D.G.; Project administration, G.D.G.; Resources, M.E.B., G.A., G.B. (Gianluigi Bacchetta), G.B. (Giovanni Birarda), G.C., I.C., M.A.C., A.G., M.P. (Martina Piredda), F.P., M.P. (Marco Porceddu), L.V., and G.D.G.; Supervision, G.D.G.; Validation, D.M., G.B. (Giovanni Birarda), A.G., M.P. (Martina Piredda), and L.V.; Visualization, M.E.B. and V.R.; Writing—original draft, M.E.B., D.M., G.B. (Giovanni Birarda), A.G., V.R., L.V., and G.D.G.; Writing—review and editing, M.E.B., D.M., G.A., G.B. (Gianluigi Bacchetta), G.B. (Giovanni Birarda), G.C., I.C., M.A.C., A.G., C.M., M.P. (Martina Piredda), F.P., M.P. (Marco Porceddu), V.R., L.V., and G.D.G. All authors have read and agreed to the published version of the manuscript.
Funding
The authors acknowledge CESA (grant number: E58C16000080003) from RAS and RAS/FBS (grant number: F72F16003080002) grants, Fondazione di Sardegna and Regional Sardinian Government (grant number: F72F16003160002), and FP7 ERANETMED2 72094 SUPREME. The authors acknowledge the CERIC-ERIC Consortium (grant number: 20152020) for the access to experimental facilities and financial support. CM and IC acknowledge the Grant of Excellence Departments, MIUR (ARTICOLO 1, COMMI 314−337 LEGGE 232/2016).
Acknowledgments
We acknowledge XAFS (Elettra, Trieste, Italy) 20160254 beamtime, TwinMic (Elettra, Trieste, Italy) 20152020 beamtime, the CeSAR (Centro Servizi d’Ateneo per la Ricerca) of the University of Cagliari, Italy, for SEM analysis, and the University of Cagliari for the financial support of the Ph.D. scholarship of Maria Enrica Boi (years 2015–2018).
Conflicts of Interest
The authors declare no conflict of interest.
References
- Salt, D.E.; Blaylock, M.; Kumar, N.P.B.A.; Dushenkov, V.; Ensley, B.D.; Chet, I.; Raskin, I. Phytoremediation: A novel strategy for the removal of toxic metals from the environment using plants. Bio/Technol. 1995, 13, 468–474. [Google Scholar] [CrossRef]
- Passariello, B.; Giuliano, V.; Quaresima, S.; Barbaro, M.; Caroli, S.; Forte, G.; Carelli, G.; Iavicoli, I. Evaluation of the environmental contamination at an abandoned mining site. Microchem. J. 2002, 73, 245–250. [Google Scholar] [CrossRef]
- Li, X.; Thornton, I. Multi-element contamination of soils and plants in old mining areas, U.K. Appl. Geochem. 1993, 8, 51–56. [Google Scholar] [CrossRef]
- De Giudici, G.; Medas, D.; Cidu, R.; Lattanzi, P.; Rigonat, N.; Frau, I.; Podda, F.; Marras, P.A.; Dore, E.; Frau, F.; et al. Assessment of origin and fate of contaminants along mining-affected Rio Montevecchio (SW Sardinia, Italy): A hydrologic-tracer and environmental mineralogy study. Appl. Geochem. 2019, 109, 104420. [Google Scholar] [CrossRef]
- Khalid, S.; Shahid, M.; Niazi, N.K.; Murtaza, B.; Bibi, I.; Dumat, C. A comparison of technologies for remediation of heavy metal contaminated soils. J. Geochem. Explor. 2017, 182, 247–268. [Google Scholar] [CrossRef]
- Dore, E.; Frau, F.; Cidu, R. Antimonate removal from polluted mining water by calcined layered double hydroxides. Crystals 2019, 9, 410. [Google Scholar] [CrossRef]
- Dore, E.; Frau, F. Calcined and uncalcined carbonate layered double hydroxides for possible water defluoridation in rural communities of the East African Rift Valley. J. Water Process Eng. 2019, 31, 100855. [Google Scholar] [CrossRef]
- Hamby, D.M. Site remediation techniques supporting environmental restoration activities—A review. Sci. Total Environ. 1996, 191, 203–224. [Google Scholar] [CrossRef]
- Jiménez, M.N.; Bacchetta, G.; Casti, M.; Navarro, F.B.; Lallena, A.M.; Fernández-Ondoño, E. Potential use in phytoremediation of three plant species growing on contaminated mine-tailing soils in Sardinia. Ecol. Eng. 2011, 37, 392–398. [Google Scholar] [CrossRef]
- Gregory, P.J. Roots, rhizosphere and soil: The route to a better understanding of soil science? Eur. J. Soil Sci. 2006, 57, 2–12. [Google Scholar] [CrossRef]
- He, H.; Veneklaas, E.J.; Kuo, J.; Lambers, H. Physiological and ecological significance of biomineralization in plants. Trends Plant Sci. 2014, 19, 166–174. [Google Scholar] [CrossRef]
- Chen, Y.T.; Wang, Y.; Yeh, K.C. Role of root exudates in metal acquisition and tolerance. Curr. Opin. Plant Biol. 2017, 39, 66–72. [Google Scholar] [CrossRef]
- Ernst, W.H.O. Evolution of metal tolerance in higher plants. For. Snow Landsc. Res. 2006, 80, 251–274. [Google Scholar]
- Marescotti, P.; Roccotiello, E.; Zotti, M.; De Capitani, L.; Carbone, C.; Azzali, E.; Mariotti, M.G.; Lucchetti, G. Influence of soil mineralogy and chemistry on fungi and plants in a waste-rock dump from the Libiola mine (eastern Liguria, Italy). Period. Mineral. 2013, 82, 141–162. [Google Scholar]
- Ensikat, H.J.; Mustafa, A.; Weigend, M. Complex patterns of multiple biomineralization in single-celled plant trichomes of the Loasaceae. Am. J. Bot. 2017, 104, 195–206. [Google Scholar] [CrossRef]
- Vierling, E.; Kimpel, J.A. Plant responses to environmental stress. Curr. Opin. Biotechnol. 1992, 3, 164–170. [Google Scholar] [CrossRef]
- Pérez Cuadra, V.; Hermann, P. Characterization and macropattern of calcium oxalate phytoliths in Argentinean endemic species of Chenopodioideae (Amaranthaceae). Quat. Int. 2013, 287, 83–88. [Google Scholar] [CrossRef]
- Krejci, M.R.; Wasserman, B.; Finney, L.; McNulty, I.; Legnini, D.; Vogt, S.; Joester, D. Selectivity in biomineralization of barium and strontium. J. Struct. Biol. 2011, 176, 192–202. [Google Scholar] [CrossRef]
- Weigend, M.; Mustafa, A.; Ensikat, H.J. Calcium phosphate in plant trichomes: The overlooked biomineral. Planta 2018, 247, 277–285. [Google Scholar] [CrossRef]
- He, H.; Bleby, T.M.; Veneklaas, E.J.; Lambers, H.; Kuo, J. Precipitation of calcium, magnesium, strontium and barium in tissues of four Acacia species (Leguminosae: Mimosoideae). PLoS ONE 2012, 7, 41563. [Google Scholar] [CrossRef]
- Rodríguez, N.; Menéndez, N.; Tornero, J.; Amils, R.; de la Fuente, V. Internal iron biomineralization in Imperata cylindrica, a perennial grass: Chemical composition, speciation and plant localization. New Phytol. 2005, 165, 781–789. [Google Scholar] [CrossRef]
- de la Fuente, V.; Rufo, L.; Sánchez-Gavilán, I.; Ramírez, E.; Rodríguez, N.; Amils, R. Plant Tissues and Embryos Biominerals in Sarcocornia pruinosa, a Halophyte from the Río Tinto Salt Marshes. Minerals 2018, 8, 505. [Google Scholar] [CrossRef]
- De Giudici, G.; Medas, D.; Meneghini, C.; Casu, M.A.; Gianoncelli, A.; Iadecola, A.; Podda, S.; Lattanzi, P. Microscopic biomineralization processes and Zn bioavailability: A synchrotron-based investigation of Pistacia lentiscus L. roots. Environ. Sci. Pollut. Res. 2015, 22, 19352–19361. [Google Scholar] [CrossRef]
- Lanson, B.; Marcus, M.A.; Fakra, S.; Panfili, F.; Geoffroy, N.; Manceau, A. Formation of Zn Ca phyllomanganate nanoparticles in grass roots. Geochim. Cosmochim. Acta 2008, 72, 2478–2490. [Google Scholar] [CrossRef][Green Version]
- Franco, A.; Rufo, L.; Rodríguez, N.; Amils, R.; de la Fuente, V. Iron absorption, localization, and biomineralization of Cynodon dactylon, a perennial grass from the Río Tinto basin (SW Iberian Peninsula). J. Plant Nutr. Soil Sci. 2013, 176, 836–842. [Google Scholar] [CrossRef]
- Sarret, G.; Harada, E.; Choi, Y.E.; Isaure, M.P.; Geoffroy, N.; Fakra, S.; Marcus, M.A.; Birschwilks, M.; Clemens, S.; Manceau, A. Trichomes of Tobacco Excrete Zinc as Zinc-Substituted Calcium Carbonate and Other Zinc-Containing Compounds. Plant Physiol. 2006, 141, 1021–1034. [Google Scholar] [CrossRef]
- Isaure, M.P.; Sarret, G.; Harada, E.; Choi, Y.E.; Marcus, M.A.; Fakra, S.C.; Geoffroy, N.; Pairis, S.; Susini, J.; Clemens, S.; et al. Calcium promotes cadmium elimination as vaterite grains by tobacco trichomes. Geochim. Cosmochim. Acta 2010, 74, 5817–5834. [Google Scholar] [CrossRef]
- Mazen, A.M.A. Calcium oxalate deposits in leaves of Corchorus olitorius as related to accumulation of toxic metals. Russ. J. Plant Physiol. 2004, 51, 281–285. [Google Scholar] [CrossRef]
- Liang, Y.; Sun, W.; Zhu, Y.G.; Christie, P. Mechanisms of silicon-mediated alleviation of abiotic stresses in higher plants: A review. Environ. Pollut. 2007, 147, 422–428. [Google Scholar] [CrossRef]
- Hodson, M.J.; Sangster, A.G. The Interaction Between Silicon and Aluminium in Sorghum bicolor (L.) Moench: Growth Analysis and X-ray Microanalysis. Ann. Bot. 1993, 72, 389–400. [Google Scholar] [CrossRef]
- Neumann, D.; zur Nieden, U. Silicon and heavy metal tolerance of higher plants. Phytochemistry 2001, 56, 685–692. [Google Scholar] [CrossRef]
- Hodson, M.J.; Evans, D.E. Aluminium/silicon interactions in higher plants. J. Exp. Bot. 1995, 46, 161–171. [Google Scholar] [CrossRef]
- Cidu, R.; Fanfani, L. Overview of the environmental geochemistry of mining districrs in the southwestern Sardinia, Italy. Geochem. Explor. Environ. Anal. 2002, 2, 243–251. [Google Scholar] [CrossRef]
- Varrica, D.; Tamburo, E.; Milia, N.; Vallascas, E.; Cortimiglia, V.; De Giudici, G.; Dongarrà, G.; Sanna, E.; Monna, F.; Losno, R. Metals and metalloids in hair samples of children living near the abandoned mine sites of Sulcis-Inglesiente (Sardinia, Italy). Environ. Res. 2014, 134, 366–374. [Google Scholar] [CrossRef]
- Atzori, G.; Aru, V.; Marincola, F.C.; Chiarantini, L.; Medas, D.; Sarais, G.; Cabiddu, S. Sediments distribution of trace metals in a coastal lagoon (Southern Sardinia, Mediterranean Sea): Assessment of contamination and ecological risk. Chem. Ecol. 2018, 34, 727–746. [Google Scholar] [CrossRef]
- De Giudici, G.; Medas, D.; Cidu, R.; Lattanzi, P.; Podda, F.; Frau, F.; Rigonat, N.; Pusceddu, C.; Da Pelo, S.; Onnis, P.; et al. Application of hydrologic-tracer techniques to the Casargiu adit and Rio Irvi (SW-Sardinia, Italy): Using enhanced natural attenuation to reduce extreme metal loads. Appl. Geochem. 2017, 96, 42–54. [Google Scholar] [CrossRef]
- De Giudici, G.; Wanty, R.B.; Podda, F.; Kimball, B.A.; Verplanck, P.L.; Lattanzi, P.; Cidu, R.; Medas, D. Quantifying biomineralization of zinc in the Rio Naracauli (Sardinia, Italy), using a tracer injection and synoptic sampling. Chem. Geol. 2014, 384, 110–119. [Google Scholar] [CrossRef]
- Fernández-Ondoño, E.; Bacchetta, G.; Lallena, A.M.; Navarro, F.B.; Ortiz, I.; Jiménez, M.N. Use of BCR sequential extraction procedures for soils and plant metal transfer predictions in contaminated mine tailings in Sardinia. J. Geochem. Explor. 2017, 172, 133–141. [Google Scholar] [CrossRef]
- Bacchetta, G.; Boi, M.E.; Cappai, G.; De Giudici, G.; Piredda, M.; Porceddu, M. Metal tolerance capability of Helichrysum microphyllum Cambess. subsp. tyrrhenicum Bacch., Brullo & Giusso: A candidate for phytostabilization in abandoned mine sites. Bull. Environ. Contam. Toxicol. 2018, 101, 758–765. [Google Scholar]
- Concas, S.; Lattanzi, P.; Bacchetta, G.; Barbafieri, M.; Vacca, A. Zn, Pb and Hg contents of Pistacia lentiscus L. grown on heavy metal-rich soils: Implications for phytostabilization. Water Air Soil Pollut. 2015, 226, 226–340. [Google Scholar] [CrossRef]
- Bacchetta, G.; Cappai, G.; Carucci, A.; Tamburini, E. Use of native plants for the remediation of abandoned mine sites in mediterranean semiarid environments. Bull. Environ. Contam. Toxicol. 2015, 94, 326–333. [Google Scholar] [CrossRef] [PubMed]
- De Agostini, A.; Caltagirone, C.; Caredda, A.; Cicatelli, A.; Cogoni, A.; Farci, D.; Guarino, F.; Garau, A.; Labra, M.; Lussu, M.; et al. Heavy metal tolerance of orchid populations growing on abandoned mine tailings: A case study in Sardinia Island (Italy). Ecotoxicol. Environ. Saf. 2020, 189, 110018. [Google Scholar] [CrossRef] [PubMed]
- Angiolini, C.; Bacchetta, G.; Brullo, S.; Casti, M.; del Giusso Galdo, G.; Guarino, R. The vegetation of mining dumps in SW-Sardinia. Feddes Reper. 2005, 116, 243–276. [Google Scholar] [CrossRef]
- Bacchetta, G.; Brullo, S.; Mossa, L. Note tassonomiche sul genere Helichrysum Miller (Asteraceae) in Sardegna. Inf. Bot. Ital. 2003, 35, 217–225. [Google Scholar]
- Bacchetta, G.; Casti, M.; Mossa, L.; Piras, M.L. La flora del distretto minerario di Montevecchio (Sardegna sud-occidentale. Webbia 2007, 62, 27–52. [Google Scholar] [CrossRef]
- Cao, A.; Carucci, A.; Lai, T.; Bacchetta, G.; Casti, M. Use of native species and biodegradable chelating agents in the phytoremediation of abandoned mining areas. J. Chem. Technol. Biotechnol. 2009, 84, 884–889. [Google Scholar] [CrossRef]
- Bacchetta, G.; Boi, M.E.; Cappai, G.; De Giudici, G.; Piredda, M. Phytoremediation of Sardinian abandoned mine site: A preliminary study on the use of Helichrysum microphyllum Cambess. subsp. tyrrhenicum Bacch., Brullo & Giusso. In Proceedings of the 15th International Conference on Environmental Science and Technology, Rhodes, Greece, 31 August–2 September 2017; p. 01066. [Google Scholar]
- Boi, M.E.; Porceddu, M.; Cappai, G.; De Giudici, G.; Bacchetta, G. Effects of zinc and lead on seed germination of Helichrysum microphyllum subsp. tyrrhenicum, a metal-tolerant plant. Int. J. Environ. Sci. Technol. 2019. [Google Scholar] [CrossRef]
- De Giudici, G.; Lattanzi, P.; Medas, D. Synchrotron Radiation and Environmental Sciences; Springer: Berlin/Heidelberg, Germany, 2015. [Google Scholar]
- Salt, D.E.; Prince, R.C.; Baker, A.J.M.; Raskin, I.; Pickering, I.J. Zinc Ligands in the Metal Hyperaccumulator Thlaspi caerulescens As Determined Using X-ray Absorption Spectroscopy. Environ. Sci. Technol. 1999, 33, 713–717. [Google Scholar] [CrossRef]
- Sarret, G.; Manceau, A.; Spadini, L.; Roux, J.C.; Hazemann, J.L.; Soldo, Y.; Eybert-BÉrard, L.; Menthonnex, J.J. Structural Determination of Zn and Pb Binding Sites in Penicillium chrysogenum Cell Walls by EXAFS Spectroscopy. Environ. Sci. Technol. 1998, 32, 1648–1655. [Google Scholar] [CrossRef]
- Zhao, F.J.; Moore, K.L.; Lombi, E.; Zhu, Y.G. Imaging element distribution and speciation in plant cells. Trends Plant Sci. 2014, 19, 183–192. [Google Scholar] [CrossRef]
- Lombi, E.; Susini, J. Synchrotron-based techniques for plant and soil science: Opportunities, challenges and future perspectives. Plant Soil 2009, 320, 1–35. [Google Scholar] [CrossRef]
- Boni, M.; Mondillo, N.; Balassone, G.; Joachimski, M.; Colella, A. Zincian dolomite related to supergene alteration in the Iglesias mining district (SW Sardinia). Int. J. Earth Sci. 2013, 102, 61–71. [Google Scholar] [CrossRef]
- Bechstädt, T.; Boni, M. Sedimentological, Stratigraphical and Ore Deposits Field Guide of the Autochthonous Cambro-Ordovician of Southwestern Sardinia: Servizio Geologico d’Italia Memorie Descritive Carta Geologica d’Italia; Istituto Superiore per la Protezione e la Ricerca Ambientale: Roma, Italy, 1994; Volume 48, p. 434. [Google Scholar]
- Large, D. The geology of non-sulphide zinc deposits, an overview. Erzmetall 2001, 54, 264–276. [Google Scholar]
- Boni, M.; Gilg, H.A.; Aversa, G.; Balassone, G. The “Calamine” of Southwest Sardinia: Geology, mineralogy, and stable isotope geochemistry of supergene Zn mineralization. Econ. Geol. 2003, 98, 731–748. [Google Scholar] [CrossRef]
- Aversa, G.; Balassone, G.; Boni, M.; Amalfitano, C. The mineralogy of the «calamine» Ores in SW Sardinia (Italy): Preliminary results. Period. Mineral. 2002, 71, 201–218. [Google Scholar]
- Bacchetta, G.; Bagella, S.; Biondi, E.; Farris, E.; Filigheddu, R.; Mossa, L. Vegetazione forestale e serie di vegetazione della Sardegna (con rappresentazione cartografica alla scala 1:350.000). Fitosociologia 2009, 46, 3–82. [Google Scholar]
- Mendez, M.O.; Maier, R.M. Phytostabilization of mine tailings in arid and semiarid environments--an emerging remediation technology. Environ. Health Perspect. 2008, 116, 278–283. [Google Scholar] [CrossRef]
- JCGM. Guide to the Expression of Uncertainty in Measurement; JCGM: Sevres, France, 2008. [Google Scholar]
- Fellet, G.; Marchiol, L.; Perosa, D.; Zerbi, G. The application of phytoremediation technology in a soil contaminated by pyrite cinders. Ecol. Eng. 2007, 31, 207–214. [Google Scholar] [CrossRef]
- Antonangelo, J.A.; Zhang, H. Heavy metal phytoavailability in a contaminated soil of northeastern Oklahoma as affected by biochar amendment. Environ. Sci. Pollut. Res. 2019, 26, 33582–33593. [Google Scholar] [CrossRef]
- Sarwar, T.; Shahid, M.; Natasha Khalid, S.; Shah, A.H.; Ahmad, N.; Naeem, M.A.; Ul Haq, Z.; Murtaza, B.; Bakhat, H.F. Quantification and risk assessment of heavy metal build-up in soil-plant system after irrigation with untreated city wastewater in Vehari, Pakistan. Environ. Geochem. Health 2019. [Google Scholar] [CrossRef]
- Marchiol, L.; Felle, G.; Boscutti, F.; Montella, C.; Mozzi, R.; Guarino, C. Gentle remediation at the former B. pertusola Sud zinc smelter: Evaluation of native species for phytoremediation purposes. Engineering 2013, 53, 343–353. [Google Scholar] [CrossRef]
- Brooks, R. Plants that hyperaccumulate heavy metals. In Plants and the Chemical Elements: Biochemistry, Uptake, Tolerance and Toxicity; Wiley: Hoboken, NJ, USA, 2008; pp. 87–105. [Google Scholar]
- Gianoncelli, A.; Kourousias, G.; Merolle, L.; Altissimo, M.; Bianco, A. Current status of the TwinMic beamline at Elettra: A soft X-ray transmission and emission microscopy station. J. Synchrotron Radiat. 2016, 23, 1526–1537. [Google Scholar] [CrossRef]
- Gianoncelli, A.; Morrison, G.R.; Kaulich, B.; Bacescu, D.; Kovac, J. Scanning transmission X-ray microscopy with a configurable detector. Appl. Phys. Lett. 2006, 89, 251117–251119. [Google Scholar] [CrossRef]
- Morrison, G.R.; Gianoncelli, A.; Kaulich, B.; Bacescu, D.; Kovac, J. A fast readout CCD system for configured-detector imaging in STXM. In Proceedings of the 8th International Conference on X-ray Microscopy IPAP Conference Series, Egret Himeji, Japan, 26–30 July 2005; Volume 7, pp. 277–379. [Google Scholar]
- Gianoncelli, A.; Kourousias, G.; Stolfa, A.; Kaulich, B. Recent developments at the TwinMic beamline at ELETTRA: An 8 SDD detector setup for low energy X-ray Fluorescence. J. Phys. Conf. Ser. 2013, 425, 182001. [Google Scholar] [CrossRef]
- Gianoncelli, A.; Kaulich, B.; Alberti, R.; Klatka, T.; Longoni, A.; de Marco, A.; Marcello, A.; Kiskinova, M. Simultaneous soft X-ray transmission and emission microscopy. Nucl. Instrum. Methods Phys. Res. Sect. A Accel. Spectrometers Detect. Assoc. Equip. 2009, 608, 195–198. [Google Scholar] [CrossRef]
- Solé, V.A.; Papillon, E.; Cotte, M.; Walter, P.; Susini, J. A multiplatform code for the analysis of energy-dispersive X-ray fluorescence spectra. Spectrochim. Acta Part B At. Spectrosc. 2007, 62, 63–68. [Google Scholar] [CrossRef]
- Di Cicco, A.; Aquilanti, G.; Minicucci, M.; Principi, E.; Novello, N.; Cognigni, A.; Olivi, L. Novel XAFS capabilities at ELETTRA synchrotron light source. J. Phys. Conf. Ser. 2009, 190, 12043. [Google Scholar] [CrossRef]
- Saraswat, S.; Rai, J.P.N. Complexation and detoxification of Zn and Cd in metal accumulating plants. Rev. Environ. Sci. Bio/Technol. 2011, 10, 327–339. [Google Scholar] [CrossRef]
- Kopittke, P.M.; Wang, P.; Lombi, E.; Donner, E. Synchrotron-based X-Ray Approaches for Examining Toxic Trace Metal(loid)s in Soil–Plant Systems. J. Environ. Qual. 2017, 46, 1175–1189. [Google Scholar] [CrossRef]
- Medas, D.; De Giudici, G.; Casu, M.A.; Musu, E.; Gianoncelli, A.; Iadecola, A.; Meneghini, C.; Tamburini, E.; Sprocati, A.R.; Turnau, K.; et al. Microscopic processes ruling the bioavailability of Zn to roots of Euphorbia Pithyusa L. Pioneer plant. Environ. Sci. Technol. 2015, 49, 1400–1408. [Google Scholar] [CrossRef]
- Medas, D.; De Giudici, G.; Pusceddu, C.; Casu, M.A.; Birarda, G.; Vaccari, L.; Gianoncelli, A.; Meneghini, C. Impact of Zn excess on biomineralization processes in Juncus acutus grown in mine polluted sites. J. Hazard. Mater. 2019, 370, 98–107. [Google Scholar] [CrossRef] [PubMed]
- De Giudici, G.; Pusceddu, C.; Medas, D.; Meneghini, C.; Gianoncelli, A.; Rimondi, V.; Podda, F.; Cidu, R.; Lattanzi, P.; Wanty, R.B.; et al. The role of natural biogeochemical barriers in limiting metal loading to a stream affected by mine drainage. Appl. Geochem. 2017, 76, 124–135. [Google Scholar] [CrossRef]
- Caldelas, C.; Weiss, D.J. Zinc homeostasis and isotopic fractionation in plants: A review. Plant Soil 2017, 411, 17–46. [Google Scholar] [CrossRef]
- Parsons, J.G.; Aldrich, M.V.; Gardea-Torresdey, J.L. Environmental and biological application of extended X-ray absorption fine structure (EXAFS) and X-ray absorption near edge structure (XANES) spectroscopies. Appl. Spectrosc. Rev. 2002, 37, 187–222. [Google Scholar] [CrossRef]
- Meneghini, C.; Di Matteo, S.; Monesi, C.; Neisius, T.; Paolasini, L.; Mobilio, S.; Natoli, C.R.; Metcalf, P.A.; Honing, J.M. Structural dichroism in the antiferromagnetic insulating phase of V2O3. Phys. Rev. B 2005, 72, 33111. [Google Scholar] [CrossRef]
- Meneghini, C.; Bardelli, F.; Mobilio, S. ESTRA-FitEXA: A software package for EXAFS data analysis. Nucl. Instrum. Methods Phys. Res. Sect. B Beam Interact. Mater. Atoms 2012, 285, 153–157. [Google Scholar] [CrossRef]
- Benfatto, M.; Meneghini, C. A close look into the low energy region of the XAS spectra: The XANES region. In Synchrotron Radiation, Basic, Methods and Applications; Mobilio, S., Boscherini, F., Meneghini, C., Eds.; Springer: Berlin, Germany, 2014; pp. 213–240. [Google Scholar]
- Lupi, S.; Nucara, A.; Perucchi, A.; Calvani, P.; Ortolani, M.; Quaroni, L.; Kiskinova, M. Performance of SISSI, the infrared beamline of the ELETTRA storage ring. J. Opt. Soc. Am. B 2007, 24, 959–964. [Google Scholar] [CrossRef]
- Mazerolles, G.; Devaux, M.F.; Dufour, E.; Qannari, E.M.; Courcoux, P. Chemometric methods for the coupling of spectroscopic techniques and for the extraction of the relevant information contained in the spectral data tables. Chemom. Intell. Lab. Syst. 2002, 63, 57–68. [Google Scholar] [CrossRef]
- Available online: http://quasar.codes (accessed on 22 December 2019).
- Toplak, M.; Birarda, G.; Read, S.; Sandt, C.; Rosendahl, S.M.; Vaccari, L.; Demšar, J.; Borondics, F. Infrared Orange: Connecting Hyperspectral Data with Machine Learning. Synchrotron Radiat. News 2017, 30, 40–45. [Google Scholar] [CrossRef]
- Shindo, H.; Brown, T.L. Infrared Spectra of Complexes of L-Cysteine and Related Compounds with Zinc(II), Cadmium(II), Mercury(II), and Lead(II)1. J. Am. Chem. Soc. 1965, 87, 1904–1909. [Google Scholar] [CrossRef]
- Ravel, B.; Newville, M. ATHENA, ARTEMIS, HEPHAESTUS: Data analysis for X-ray absorption spectroscopy using IFEFFIT. J. Synchrotron Radiat. 2005, 12, 537–541. [Google Scholar] [CrossRef] [PubMed]
- GURI. Norme in Materia Ambientale; Decreto Legislativo 3 Aprile 2006, n. 152, Supplemento Ordinario n.96; Gazzetta Ufficiale: Roma, Italy, 2006. (In Italian) [Google Scholar]
- Bacchetta, G.; Cao, A.; Cappai, G.; Carucci, A.; Casti, M.; Fercia, M.L.; Lonis, R.; Mola, F. A field experiment on the use of Pistacia lentiscus L. and Scrophularia canina L. subsp. bicolor (Sibth. et Sm.) Greuter for the phytoremediation of abandoned mining areas. Plant Biosyst. Int. J. Deal. Asp. Plant Biol. 2012, 146, 1054–1063. [Google Scholar]
- Boni, M.; Costabile, S.; De Vivo, B.; Gasparrini, M. Potential environmental hazard in the mining district of southern Iglesiente (SW Sardinia, Italy). J. Geochem. Explor. 1999, 67, 417–430. [Google Scholar] [CrossRef]
- Khan, S.; Liu, X.; Li, H.; Fan, W.; Shah, B.; Li, J.; Zhang, L.; Chen, S.; Khan, S. Organ specific antioxidant defenses and FT-IR spectroscopy of muscles in Crucian carp (Carassius auratus gibelio) exposed to environmental Pb 2+. Turk. J. Biol. 2015, 39, 427–437. [Google Scholar] [CrossRef]
- Neagoe, A.D.; Păun, A.; Păun, M.L.; Baciu, I.; Iordache, V.A. Response of Oxidative Stress Variables, Proteins, and Chlorophyll in Three Plant Species Caused by Moderate Soil Pollution with Toxic Elements. Pol. J. Environ. Stud. 2015, 24, 1219–1234. [Google Scholar] [CrossRef]
- Nordstrom, D.K. Aqueous Pyrite Oxidation and the Consequent Formation of Secondary Iron Minerals. In Acid Sulfate Weathering; SSSA Special Publication SV-10; Soil Science Society of America: Madison, WI, USA, 1982; pp. 37–56. [Google Scholar]
- Ritsema, C.J.; Groenenberg, J.E. Pyrite Oxidation, Carbonate Weathering, and Gypsum Formation in a Drained Potential Acid Sulfate Soil. Soil Sci. Soc. Am. J. 1993, 57, 968–976. [Google Scholar] [CrossRef]
- Cogram, P. Jarosite. Ref. Modul. Earth Syst. Environ. Sci. 2018. [Google Scholar] [CrossRef]
- Letowski, F.; Niemiec, J.; Serkies, J. Application of potential-pH diagrams for determination of the occurrence forms of trace elements in some economic mineral deposits. Econ. Geol. 1966, 61, 1272–1279. [Google Scholar] [CrossRef]
- Cary, E.E.; Grunes, D.L.; Dallyn, S.L.; Pearson, G.A.; Peck, N.H.; Hulme, R.S. Plant Fe, Al and Cr concentrations in vegetables as influenced by soil inclusion. J. Food Qual. 1994, 17, 467–476. [Google Scholar] [CrossRef]
- Monje, P.V.; Baran, E.J. First evidences of the bioaccumulation of α-quartz in cactaceae. J. Plant Physiol. 2000, 157, 457–460. [Google Scholar] [CrossRef]
- Dietrich, D.; Hinke, S.; Baumann, W.; Fehlhaber, R.; Baucker, E.; Ruhle, G.; Wienhaus, O.; Marx, G. Silica accumulation in Triticum aestivum L. and Dactylis glomerata L. Anal. Bioanal. Chem. 2003, 376, 399–404. [Google Scholar] [CrossRef] [PubMed]
- Skinner, H.C.W.; Jahren, A.H. Biomineralization. Treatise Geochem. 2007, 8, 1–69. [Google Scholar]
- Kopittke, P.M.; Gianoncelli, A.; Kourousias, G.; Green, K.; McKenna, B.A. Alleviation of Al Toxicity by Si is associated with the formation of Al-Si complexes in root tissues of Sorghum. Front. Plant Sci. 2017, 8, 2189. [Google Scholar] [CrossRef] [PubMed]
- Bowen, J.M.H.; Dymond, A.J. Strontium and Barium in Plants and Soils. Proc. R. Soc. London. Ser. B Biol. Sci. 1955, 144, 355–368. [Google Scholar]
- Monje, P.V.; Baran, E.J. Characterization of calcium oxalates generated as biominerals in cacti. Plant Physiol. 2002, 128, 707–713. [Google Scholar] [CrossRef]
- Franceschi, V.R.; Horner, H.T. Calcium oxalate crystals in plants. Bot. Rev. 1980, 46, 361–427. [Google Scholar] [CrossRef]
- Lane, B.G. Oxalate, germin, and the extracellular matrix of higher plants. FASEB J. 1994, 8, 294–301. [Google Scholar] [CrossRef]
- Mazen, A.M.A.; El Maghraby, O.M.O. Accumulation of cadmium, lead and strontium, and a role of calcium oxalate in water hyacinth tolerance. Biol. Plant. 1997, 40, 411–417. [Google Scholar] [CrossRef]
- Fancello, D.; Scalco, J.; Medas, D.; Rodeghero, E.; Martucci, A.; Meneghini, C.; De Giudici, G. XRD-thermal combined analyses: An approach to evaluate the potential of phytoremediation, phytomining, and biochar production. Int. J. Environ. Res. Public Health 2019, 16, 1976. [Google Scholar] [CrossRef]
- Boni, M.; Mondillo, N. The “Calamines” and the “Others”: The great family of supergene nonsulfide zinc ores. Ore Geol. Rev. 2015, 67, 208–233. [Google Scholar] [CrossRef]
- Medas, D.; Podda, F.; Meneghini, C.; De Giudici, G. Stability of biological and inorganic hemimorphite: Implications for hemimorphite precipitation in non-sulfide Zn deposits. Ore Geol. Rev. 2017, 89, 808–821. [Google Scholar] [CrossRef]
- Borg, G. A Review of Supergene Nonsulphide Zinc (SNSZ) Deposits-the 2014 Update. In Current Perspectives on Zinc Deposits; Irish Association for Economic Geology: Dublin, Ireland, 2015; pp. 123–147. [Google Scholar]
- Cuypers, A.; Vangronsveld, J.; Clijsters, H. The redox status of plant cells (AsA and GSH) is sensitive to zinc imposed oxidative stress in roots and primary leaves of Phaseolus vulgaris. Plant Physiol. Biochem. 2001, 39, 657–664. [Google Scholar] [CrossRef]
- Salt, D.E.; Prince, R.C.; Pickering, I.J. Chemical speciation of accumulated metals in plants: Evidence from X-ray absorption spectroscopy. Microchem. J. 2002, 71, 255–259. [Google Scholar] [CrossRef]
- Terzano, R.; Al Chami, Z.; Vekemans, B.; Janssens, K.; Miano, T.; Ruggiero, P. Zinc Distribution and Speciation within Rocket Plants (Eruca vesicaria L. Cavalieri) Grown on a Polluted Soil Amended with Compost as Determined by XRF Microtomography and Micro-XANES. J. Agric. Food Chem. 2008, 56, 3222–3231. [Google Scholar] [CrossRef] [PubMed]
- Sharma, R.K.; Agrawal, M. Biological effects of heavy metals: An overview. J. Environ. Biol. 2005, 26, 301–313. [Google Scholar]
- Singh, S.; Parihar, P.; Singh, R.; Singh, V.P.; Prasad, S.M. Heavy Metal Tolerance in Plants: Role of Transcriptomics, Proteomics, Metabolomics, and Ionomics. Front. Plant Sci. 2016, 6, 1143. [Google Scholar] [CrossRef]
- Monsant, A.C.; Kappen, P.; Wang, Y.; Pigram, P.J.; Baker, A.J.M.; Tang, C. In vivo speciation of zinc in Noccaea caerulescens in response to nitrogen form and zinc exposure. Plant Soil 2011, 348, 167. [Google Scholar] [CrossRef]
- Küpper, H.; Jie Zhao, F.; McGrath, S.P. Cellular Compartmentation of Zinc in Leaves of the Hyperaccumulator Thlaspi caerulescens. Plant Physiol. 1999, 119, 305–312. [Google Scholar] [CrossRef]
- Straczek, A.; Sarret, G.; Manceau, A.; Hinsinger, P.; Geoffroy, N.; Jaillard, B. Zinc distribution and speciation in roots of various genotypes of tobacco exposed to Zn. Environ. Exp. Bot. 2008, 63, 80–90. [Google Scholar] [CrossRef]
- Sarret, G.; Saumitou-Laprade, P.; Bert, V.; Proux, O.; Hazemann, J.L.; Traverse, A.; Marcus, M.A.; Manceau, A. Forms of Zinc Accumulated in the Hyperaccumulator Arabidopsis halleri. Plant Physiol. 2002, 130, 1815–1826. [Google Scholar] [CrossRef]


© 2020 by the authors. Licensee MDPI, Basel, Switzerland. This article is an open access article distributed under the terms and conditions of the Creative Commons Attribution (CC BY) license (http://creativecommons.org/licenses/by/4.0/).