Article

Melting Curve of Potassium Chloride from in situ Ionic Conduction Measurements

1
Department of Earth and Environmental Sciences, University of Michigan, Ann Arbor, MI 48109, USA
2
School of Earth and Space Sciences, University of Science and Technology of China, Hefei 230026, China
3
Department of Earth and Planetary Sciences, Harvard University, Cambridge, MA 02138, USA
4
Hawaii Institute of Geophysics and Planetology, University of Hawaii at Mānoa, Honolulu, HI 96822, USA
*
Author to whom correspondence should be addressed.
Minerals 2020, 10(3), 250; https://doi.org/10.3390/min10030250
Submission received: 31 January 2020 / Revised: 4 March 2020 / Accepted: 5 March 2020 / Published: 9 March 2020
(This article belongs to the Special Issue Mineral Physics—In Memory of Orson Anderson)

Abstract

:
We report experimental constraints on the melting curve of potassium chloride (KCl) between 3.2 and 9 GPa from in situ ionic conduction measurements using a multi-anvil apparatus. On the basis of concurrent measurements of KCl and sodium chloride (NaCl) at 1 bar using the differential thermal analysis (DTA) method and Pt sphere marker, we show that the peak rate of increase in ionic current with temperature upon heating coincides with latent heat ledge and fall of Pt sphere, thus establishing the criterion for melting detection from ionic conduction measurements. Applying this criterion to high pressures, we found that the melting point of KCl rose steeply with increasing pressure to exceed 2443 ± 100 K at 9 GPa. Fitting the results of this study together with existing data at pressures below 4 GPa and above 20 GPa, we obtained the Simon’s melting equation for KCl in the simple cubic B2 structure between 1.8 and 50 GPa: T m = 1323 ( P 1.87 2.2 ( 1 ) + 1 ) 1 2.7 ( 1 ) , where T is in K and P is in GPa. Starting at 1 bar, the melting point of KCl increases at an average rate of ~150 K/GPa to cross that of Pt near 9 GPa. The highly refractory nature of KCl makes it a sensitive pressure calibrant for the large-volume pressure at moderate pressures and a potential sample container for experiments at moderate pressures and very high temperatures.

1. Introduction

Potassium chloride (KCl) occurs in nature as sylvite and is widely used as a pressure transmitting medium and thermal insulating material in high-pressure experiments with the diamond-anvil cells [1]. The systematic melting behavior of alkali halides has been used to test theories on interatomic forces in solids and liquids, including long-range Coulomb interaction and short-range potential [2]. Existing data on the melting point of compressed KCl include piston-cylinder results at pressures up to 4 GPa [3] and several diamond-anvil cell data points at pressures above 20 GPa [2]. Because the maximum pressure of standard piston-cylinder apparatus is limited to ~5 GPa and the melting point of KCl rises steeply with pressure to approach or exceed the graphitization temperature of diamonds, experimental constraints on the melting curve of KCl at moderate pressures are challenging to obtain and are currently unavailable.
The high-pressure ionic conduction method was developed recently and applied to investigate the melting behavior of ionic compounds NaCl [4], sodium carbonate (Na2CO3), calcium carbonate (CaCO3) [5], and barium carbonate (BaCO3) [6]. In these studies, comparisons with separate experiments using platinum (Pt) sphere markers and literature data using differential thermal analysis (DTA) suggested that at a given pressure, melting could be detected by a steep rise in ionic conduction with increasing temperature. Given uncertainties associated with cross-experiment and cross-laboratory comparisons, it is desirable to rigorously test the criterion for melting detection through simultaneous observations and direct comparisons between conduction, latent heat effect, and sphere motion.
Previous ionic conduction experiments used a symmetric configuration where the tips of electrodes and junction of thermocouple were placed at the opposite ends of the sample chamber, presumably along an isotherm. In reality, symmetric positioning was not easily realized because of uncertainties in initial placement and deformation during compression and heating [5]. Moreover, the external thermocouple does not register the latent heat effect to accurately measure the sample temperature during melting, and therefore the data quality is compromised.
Here we performed concurrent DTA and Pt sphere marker experiments on NaCl and KCl at 1 bar to test the criterion for melting detection in ionic conduction observations. Applying modified configurations with single-side four-wire placements to reduce measurement errors and improve detection sensitivity, we determined the melting curve of KCl at high pressures. These results allowed us to cross-examine various criteria for melting detection and evaluate the applications of KCl as a pressure calibrant for large-volume press and as a material for thermal insulation, pressure transmission, and sample containment in high-pressure research.

2. Method

The starting material was high-purity crystalline KCl (Alfa Aesar 10839, 99.997%) or NaCl (Alfa Aesar 10862, 99.999%). The sample was kept in a vacuum oven at 400 K prior to the experiment, and directly loaded into Pt container or ground into fine powder and then packed into Pt container.

2.1. Experiments at 1 bar

Concurrent ionic conduction, differential thermal analysis (DTA), and Pt sphere marker measurements at the ambient pressure of 1 bar were carried out using a Petit box furnace. The DTA experiments used two type S (Pt-Rh) thermocouples with welded junctions, one near the crucible and the other embedded in the sample (Figure 1). Two Pt electrode wires were inserted into a four-bore alumina sleeve, along with the wires of the embedded thermocouple that measured the temperature of the sample near the tips of the electrodes. The conduction measurements circuit used 0.1 VAC to 1 VAC and 60 Hz excitation voltage and recorded current up to 900 μA using a FLUKE 289 multimeter [6]. A Mastech variac was used to adjust the excitation voltage. For the marker experiments, several Pt spheres with 100–300 μm diameters were placed on top of the sample. The furnace was heated at a rate of 0.2 to 1 K/s in most experiments, using an internal type K thermocouple, and cooled by shutting off the power. The temperatures of the thermocouples were monitored using a multi-channel DataQ device.

2.2. Multi-Anvil Experiments

Ionic conduction experiments were conducted at pressures up to 9 GPa using the 1000-ton Walker-type multi-anvil apparatus at the University of Michigan. Tungsten carbide cubic anvils with truncation edge length (TEL) of 8 mm (Fansteel) and 5 mm (Toshiba-Tungaloy F-grade) were used to generate high pressures. The 8-mm assembly used 646 Ceramacast octahedra with fins [7] and a single-side radial placement of a type C (W-Re) thermocouple and type C negative electrode wires in a four-bore alumina (Al2O3) tubing. The thermocouple junction and electrode tips were in contact with the sample and at the equator of a cylindrical-shaped rhenium (Re) heater where the temperature is the highest along the axis (Figure 2a). The 5-mm assembly was based on the COMPRES design and used a single-side axial configuration, where a type C (W-Re) thermocouple and a pair of Pt electrode wires were placed in a four-bore alumina tubing, also at the heater equator (Figure 2b). The axial assemblies were dried in the vacuum oven at 400 K for at least 24 h before loading into the multi-anvil apparatus.
The relationship between the sample pressure and oil load of the hydraulic press was calibrated through fixed point phase transitions and NaCl melting curve. With radial placement experiments (Figure 2a), we converted press loads to sample pressures using the NaCl-melting-based pressure calibration for 8-mm 646 octahedra [7]. The sample pressures in the axial placement experiments were calculated using the calibration for 5-mm COMPRES assembly [8], which was reproduced in this laboratory. The uncertainty in pressure measurement is estimated to be ±7%. This includes the precision of pressure calibration of ±5% estimated based on duplicate experiments, and systematic errors of ±5% arising from the effect of temperature on pressure calibration and pressure drift during heating and cooling [4]. The uncertainty in temperature measurement is estimated to be ±50 K, by considering the precision in the thermocouple calibration and the effects of pressure on the electromotive force (emf) of the thermocouples [9].
In a typical multi-anvil experiment, the sample was compressed to the first target press load, heated at the rate of ~1 K/s to cross the melting point by 50 to 200 K, then cooled to a few hundred degrees below the melting point to complete one heating and cooling cycle. The temperature was controlled using the embedded thermocouple. Multiple cycles were performed to check reproducibility and to improve the precision of melting detection at a reduced heating rate of 6 K/m, before further compression to the next target press load. After the final cycle, the sample was quenched to room temperature by shutting off the heating power, and then decompressed to room pressure. Temperature and multiple heating and cooling cycles may affect the pressure calibration, as discussed later in this paper.
The conduction measurement circuit was identical to that of the 1 bar experiments. External electromagnetic interference, including heating current and the pressure control motor, was less than a few μA and negligible compared with the ionic current through molten KCl.
Experimental products were recovered by grinding and polishing in oil or directly on SiC papers. An optical microscope was used to check the sample geometry and see if the Pt spheres remained separate or met at the bottom of the capsule.

3. Results

3.1. KCl at 1 bar

At 1 bar, our differential thermal analysis (DTA) measurements of KCl yielded a melting point of 1042 ± 2 K, where a latent heat ledge was observed upon heating and cooling (Table 1, Figure 3a). The width of the latent heat ledge varied with the heating or cooling rate and sample size. The Pt sphere experiments on KCl bracketed the melting point at 1 bar to 1042 ± 2 K. These results agree well with the reported value of 1043 K [3].
The latent heat ledge coincided with a similar ledge in the current-temperature curve (Figure 3a). Along a representative heating path, the ionic current remained below 3 μA at temperatures up to ~1000 K, climbed up slightly upon further heating to ~1038 K, and then rose steeply to more than 50 μA at constant sample temperature of ~1038 K. The rates at which the reference temperature or current increased with the sample temperature, calculated as the first derivatives of the recorded curves dTreference/dTsample and dI/dTsample, are nearly flat at temperatures up to ~1038 K. They increased steeply within 5 K and spiked at 1042 ± 2 K upon melting. Further heating brought these derivatives back to the baseline values. Another steep rise of the current occurred at ~1060 K. The origin of this rise is unclear and may be a result of melt spreading out along the wires. This rise can be distinguished from the melting signal because it was not accompanied by a steep rise in the temperature, as shown in the derivative plots. The maximum current varied with the composition of the electrode, whether it was copper or platinum, their size and geometry including immersion length and separation between the two electrodes, and it aged with time in repeated cycles.

3.2. NaCl at 1 bar

The DTA experiments on NaCl at 1 bar produced slightly tilted latent heat ledge (Figure 3b). Accordingly, the peak in dTreference/dTsample spread over 10 K, likely because the heating rate was too low to produce the expected ledge. The melting temperature was assigned to 1070 ± 2 K, where the relative rate of increase in the reference temperature with respect to that of the sample temperature peaked. This peak was accompanied by a peak in the relative rate of increase in ionic current with respect to that of the sample temperature at 1071 ± 2 K. The current was below 50 μA at temperatures below 1033 K and rose steeply to >400 μA at 1073 K, as a result of melting. With further heating the ionic current increased at a much lower rate. These results agree well with the reported value of 1074 K within mutual uncertainties.
In both the KCl and NaCl experiments, the melting points measured by the DTA method were confirmed by the sinking of Pt spheres. Large clear crystals were recovered at ambient temperature in the containers. Furthermore, samples appeared on the crucible wall and along the thermocouple or electrode wires. We infer that melt climbed up the wall and wires under capillary force and that large crystals grew from melt upon cooling. We observed variations of the peak current with time and between experiments, and attribute some of the variations to the spreading of melt. The recovered samples were confirmed to be single phases according to inspections by optical microscopes.

3.3. KCl at High Pressures

From the high-pressure experiments with radial wire placement, we obtained the melting points of KCl at 3.2 to 5.5 GPa (Table 2). The melting temperature was also located at the steepest point of the current-temperature curve (Figure 4a). During heating, the press load drifted up because of thermal pressure. The reported sample pressures were calculated from the press loads where the steepest current rises took place.
The high-pressure experiments yielded melting points of KCl at 3 to 8 GPa and a lower bound for the melting point at 9 GPa (Table 2). In repeated heating cycles, the steepest current rise occurred within 5–20 K, despite some sporadic excursions in the current-temperature curves (Figure 4b).

4. Discussion

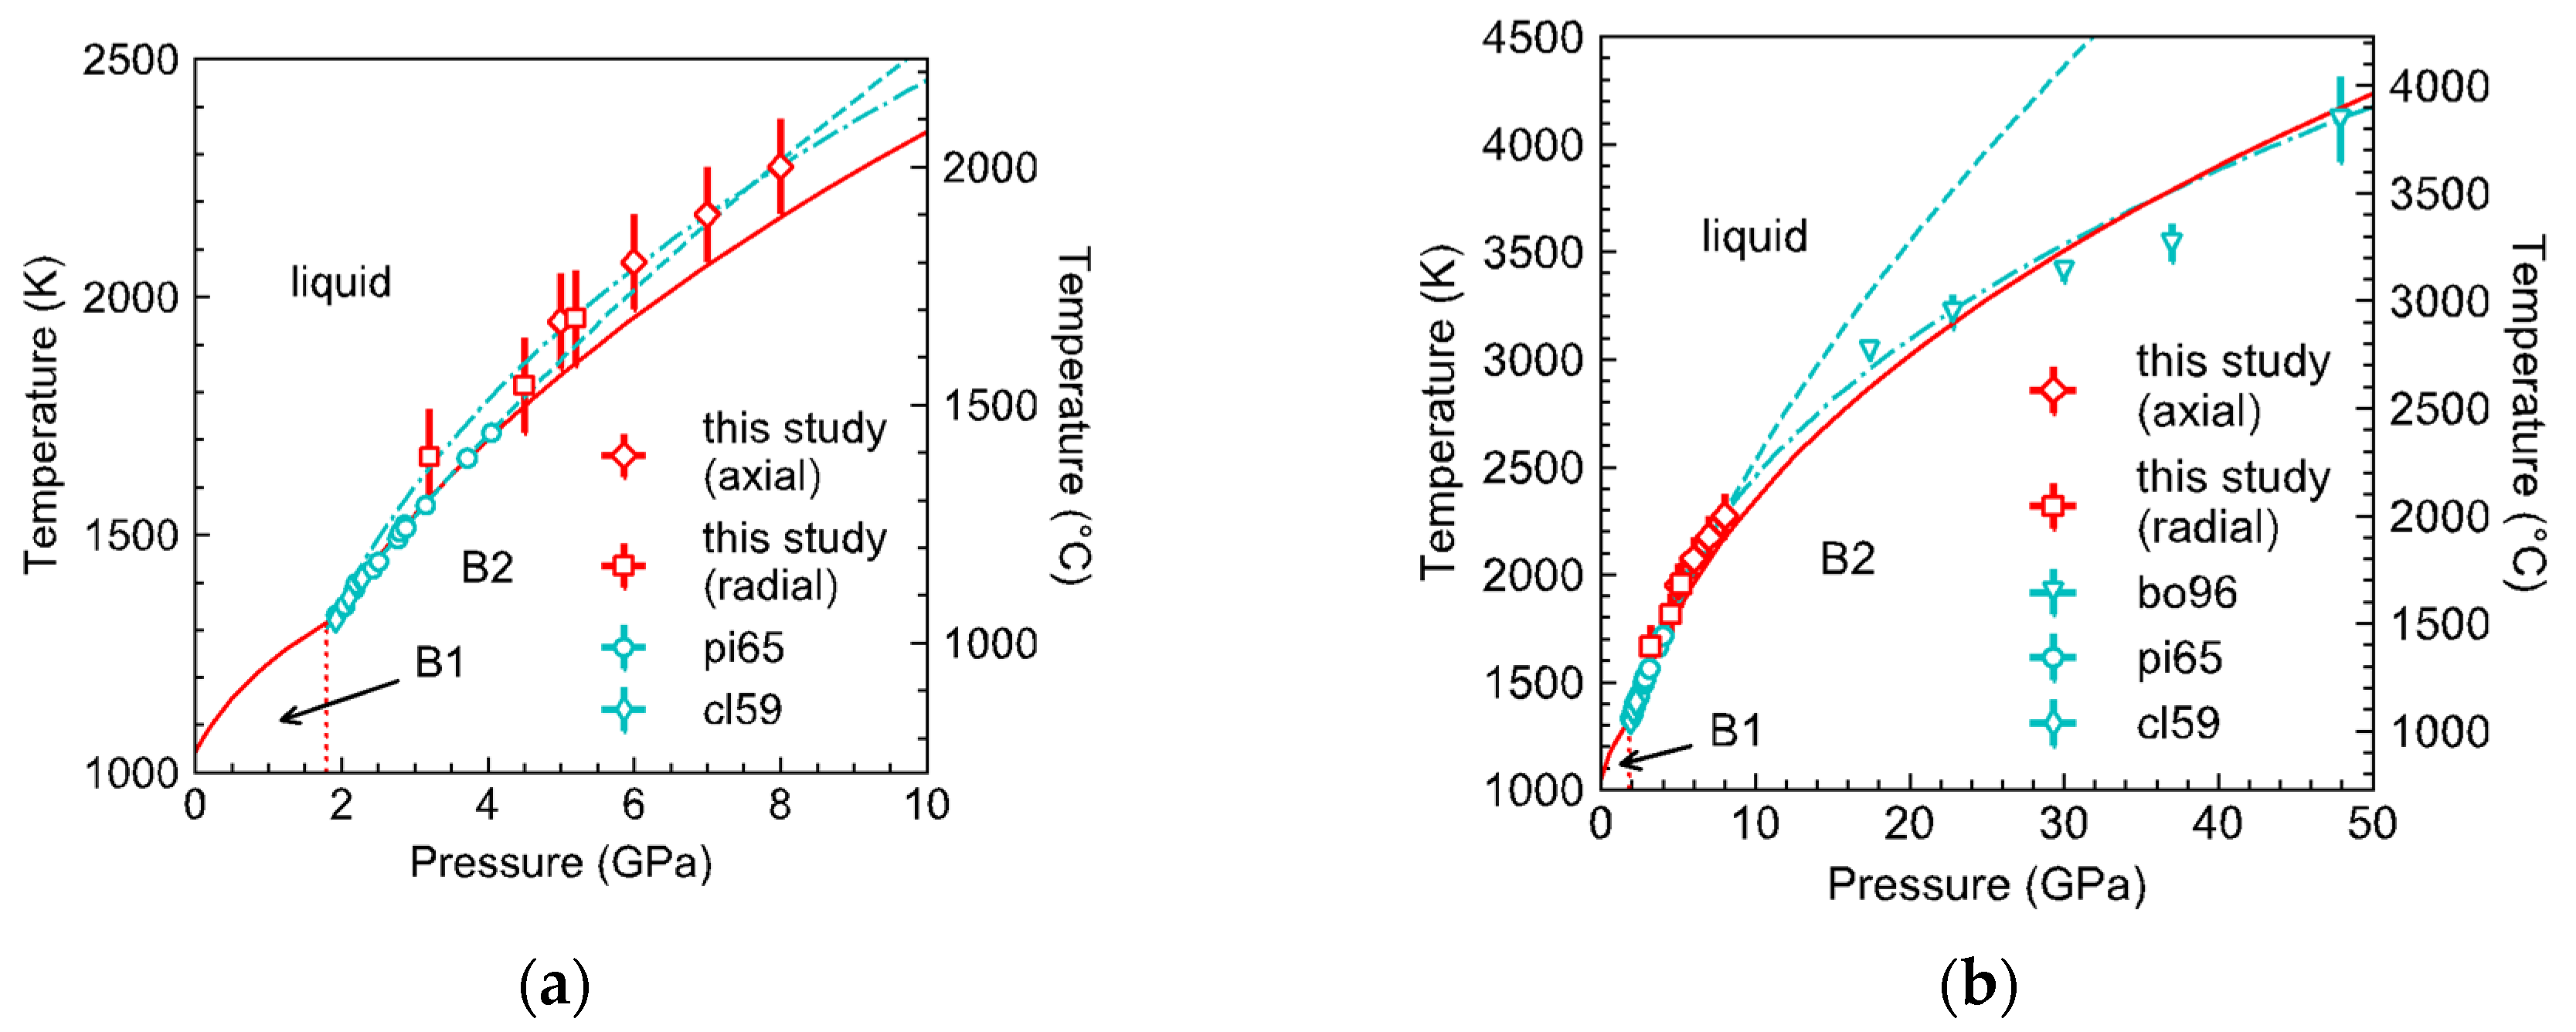
4.1. Melting Curve of KCl

The melting temperatures of KCl measured in this study are in general agreement with the literature data (Figure 5). Where the pressure ranges overlap, the results of our radial-TC experiments agree with the existing data from piston-cylinder experiments [3,10], within uncertainties. Between 5 and 8 GPa, the results of our ionic conduction experiments are higher by 20–90 K, but marginally agree with the Simon–Glatzel melting curve [11] fitted through all the literature data on KCl in the simple cubic B2 structure between 1.8 and 50 GPa, which can be described by T m = 1323 ( P 1.87 2.2 ( 1 ) + 1 ) 1 2.7 ( 1 ) , where T is in K, P is in GPa, and the numbers in parentheses are uncertainties in the last digits.
Excluding the literature data at pressures above 20 GPa from diamond anvil cell (DAC) experiments [2], the fit becomes T m = 1323 ( P 1.87 3.5 ( 5 ) + 1 ) 1 1.8 ( 2 ) . This fit to the data from large volume apparatus alone diverge from the all-data fit at pressures above 10 GPa and differ by as much as 500 K at 25 GPa. The divergence confirms the notion that the Simon’s equation is empirical and cannot be used for extrapolating melting curves beyond the experimental pressure range, although it is widely used for interpolation because the formulation is simpler than other melting laws and requires no knowledge of the equation-of-state of the solid phase. Indeed, a previous study on NaCl found that the Simon’s law equation fit to data between 1 bar and 6.5 GPa overpredicts the melting temperature at 20 GPa by nearly 100 K [4]. On the other hand, more recent DAC data on the melting curve of water questioned the accuracy of data from piston-cylinder experiments [12]. Furthermore, the melting temperatures of iron determined in earlier DAC experiments were found to be overestimated by hundreds of degrees [13]. Therefore, independent measurements at pressures below 10 GPa and new data at pressures above 10 GPa are needed to validate the melting curve of KCl fitted to all the existing data.

4.2. Melting Detection from Ionic Conduction

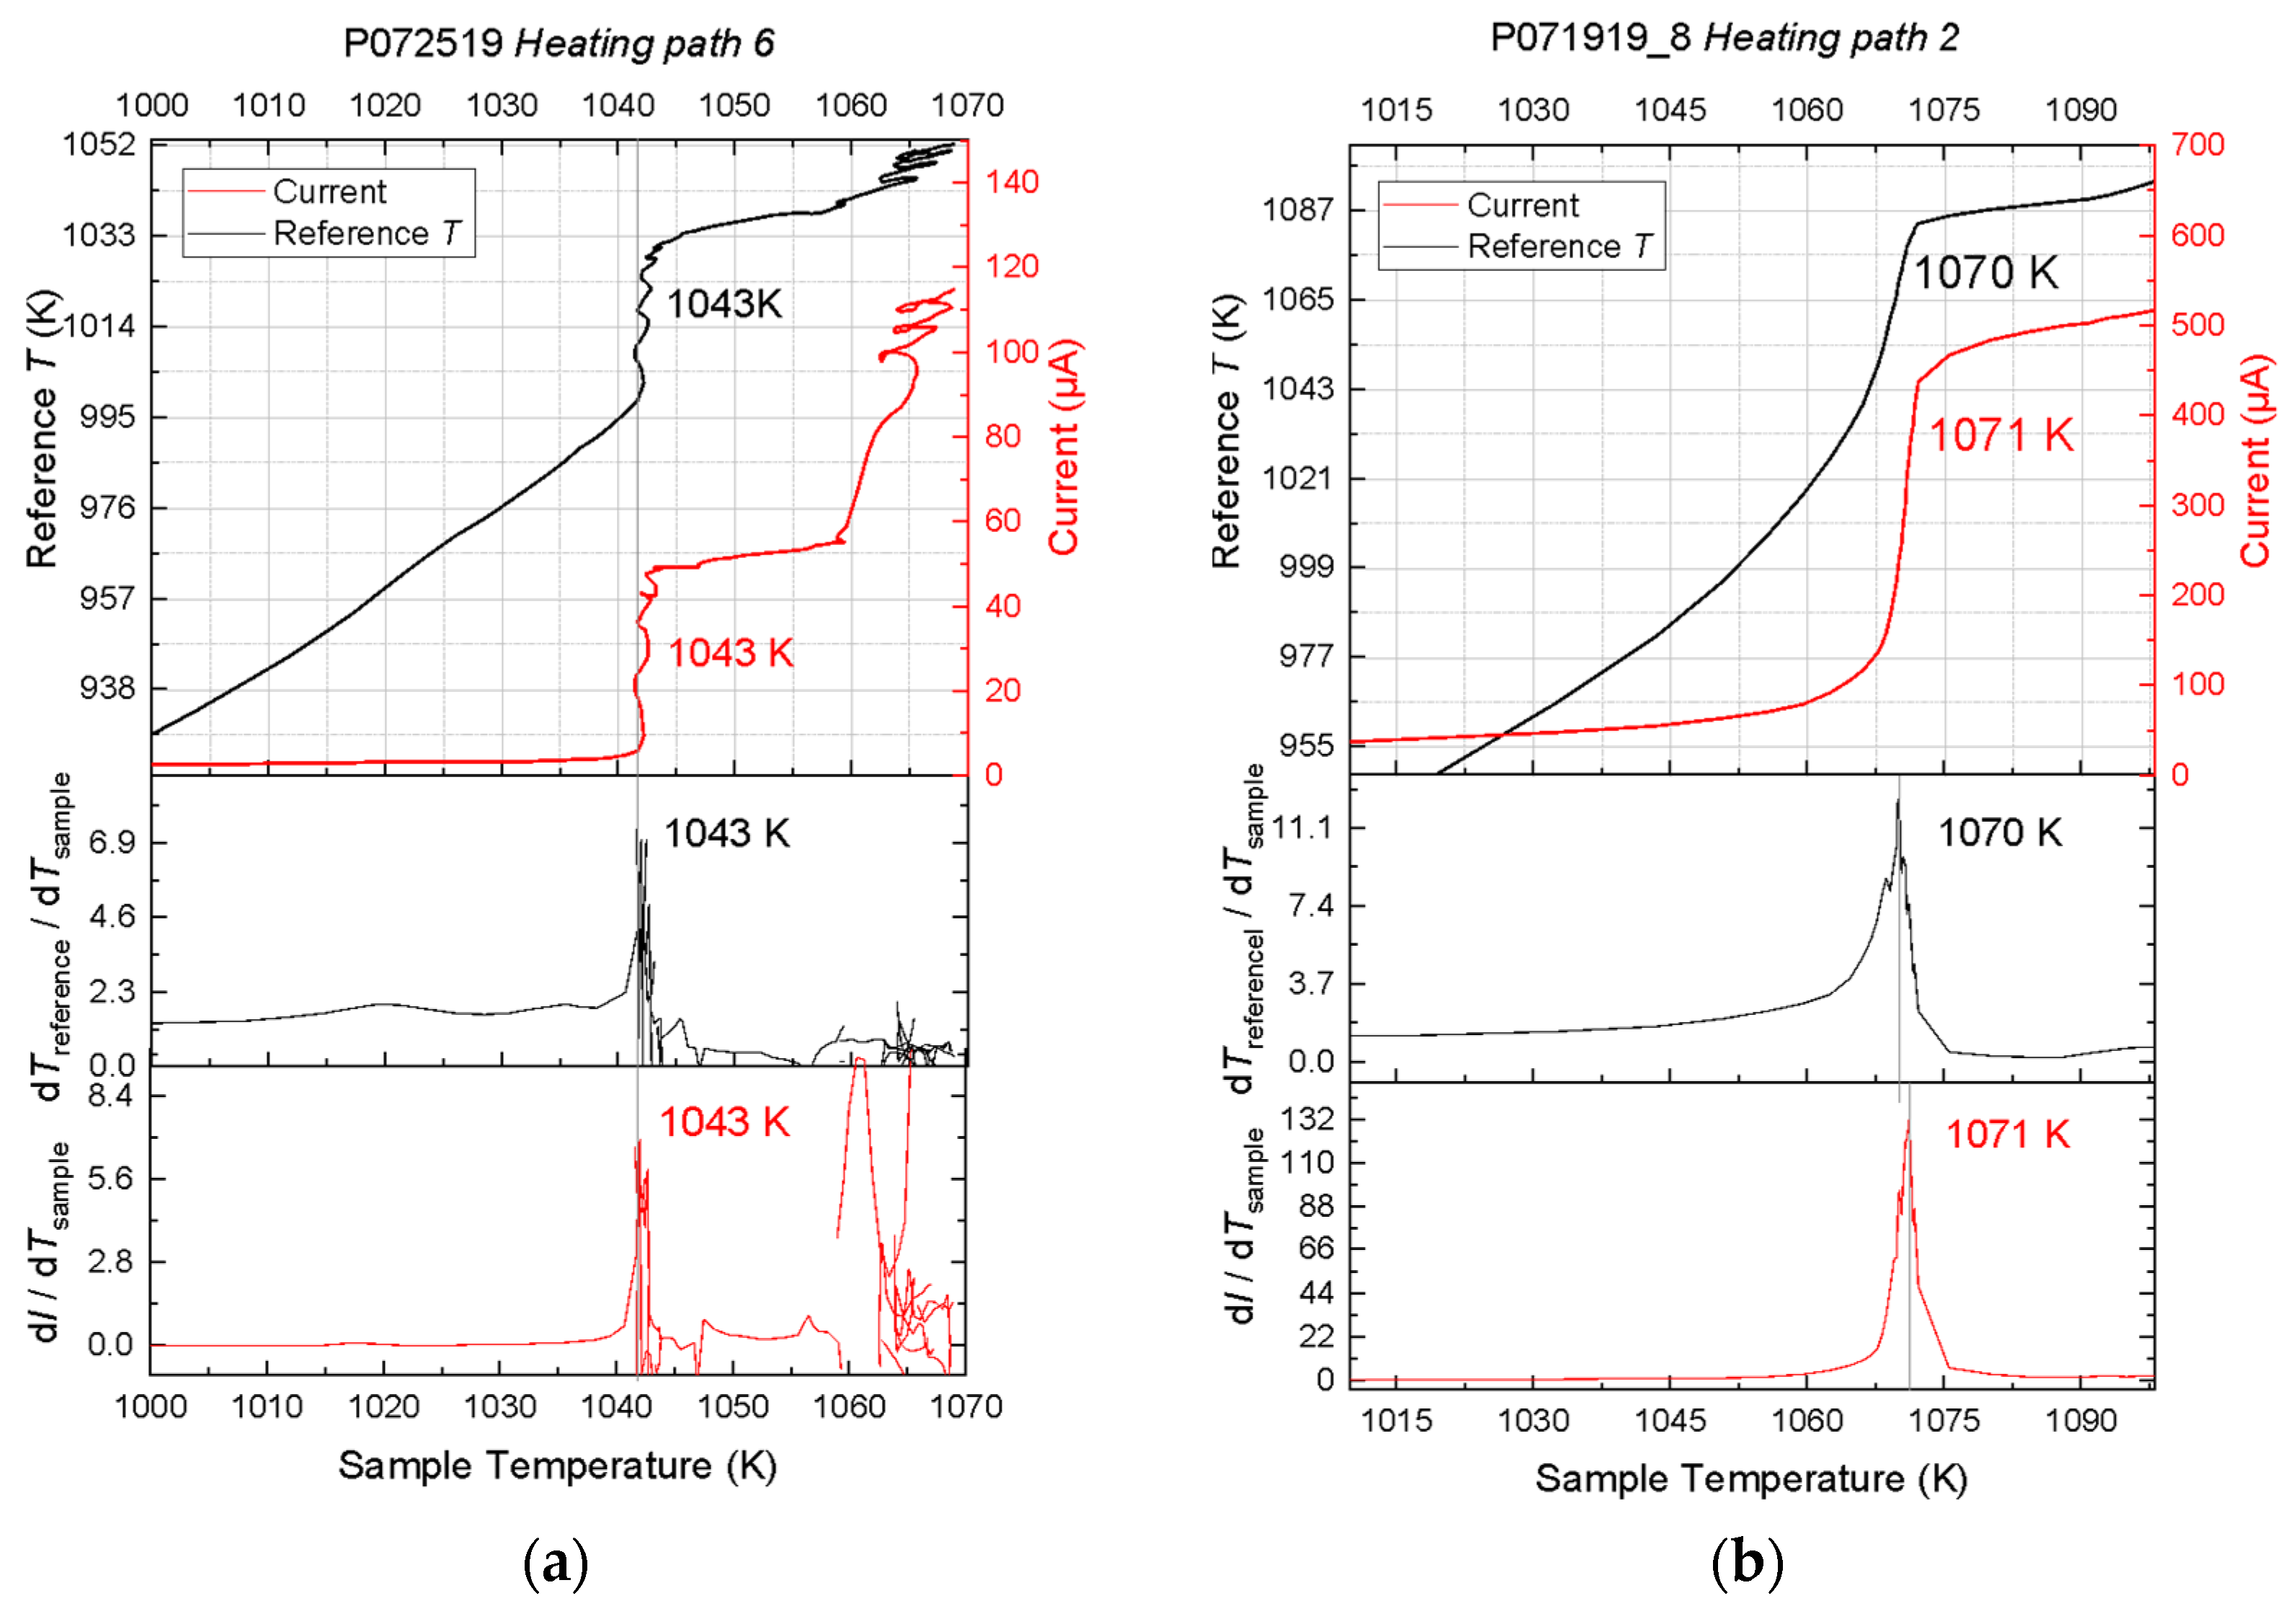
The concurrent experiments at 1 bar demonstrate that ionic conduction measurements can be used to determine the melting temperature of ionic compounds. Where high-quality data were acquired at 1 bar, we observed simultaneous occurrences of latent heat ledge and peak rate of current rise with temperature, thus firmly establishing the criterion of melting detection from ionic conduction observations. The validity of this criterion is further supported by confirmation from the sinking of Pt sphere, movement of melt, and growth of large crystals from melt upon cooling.
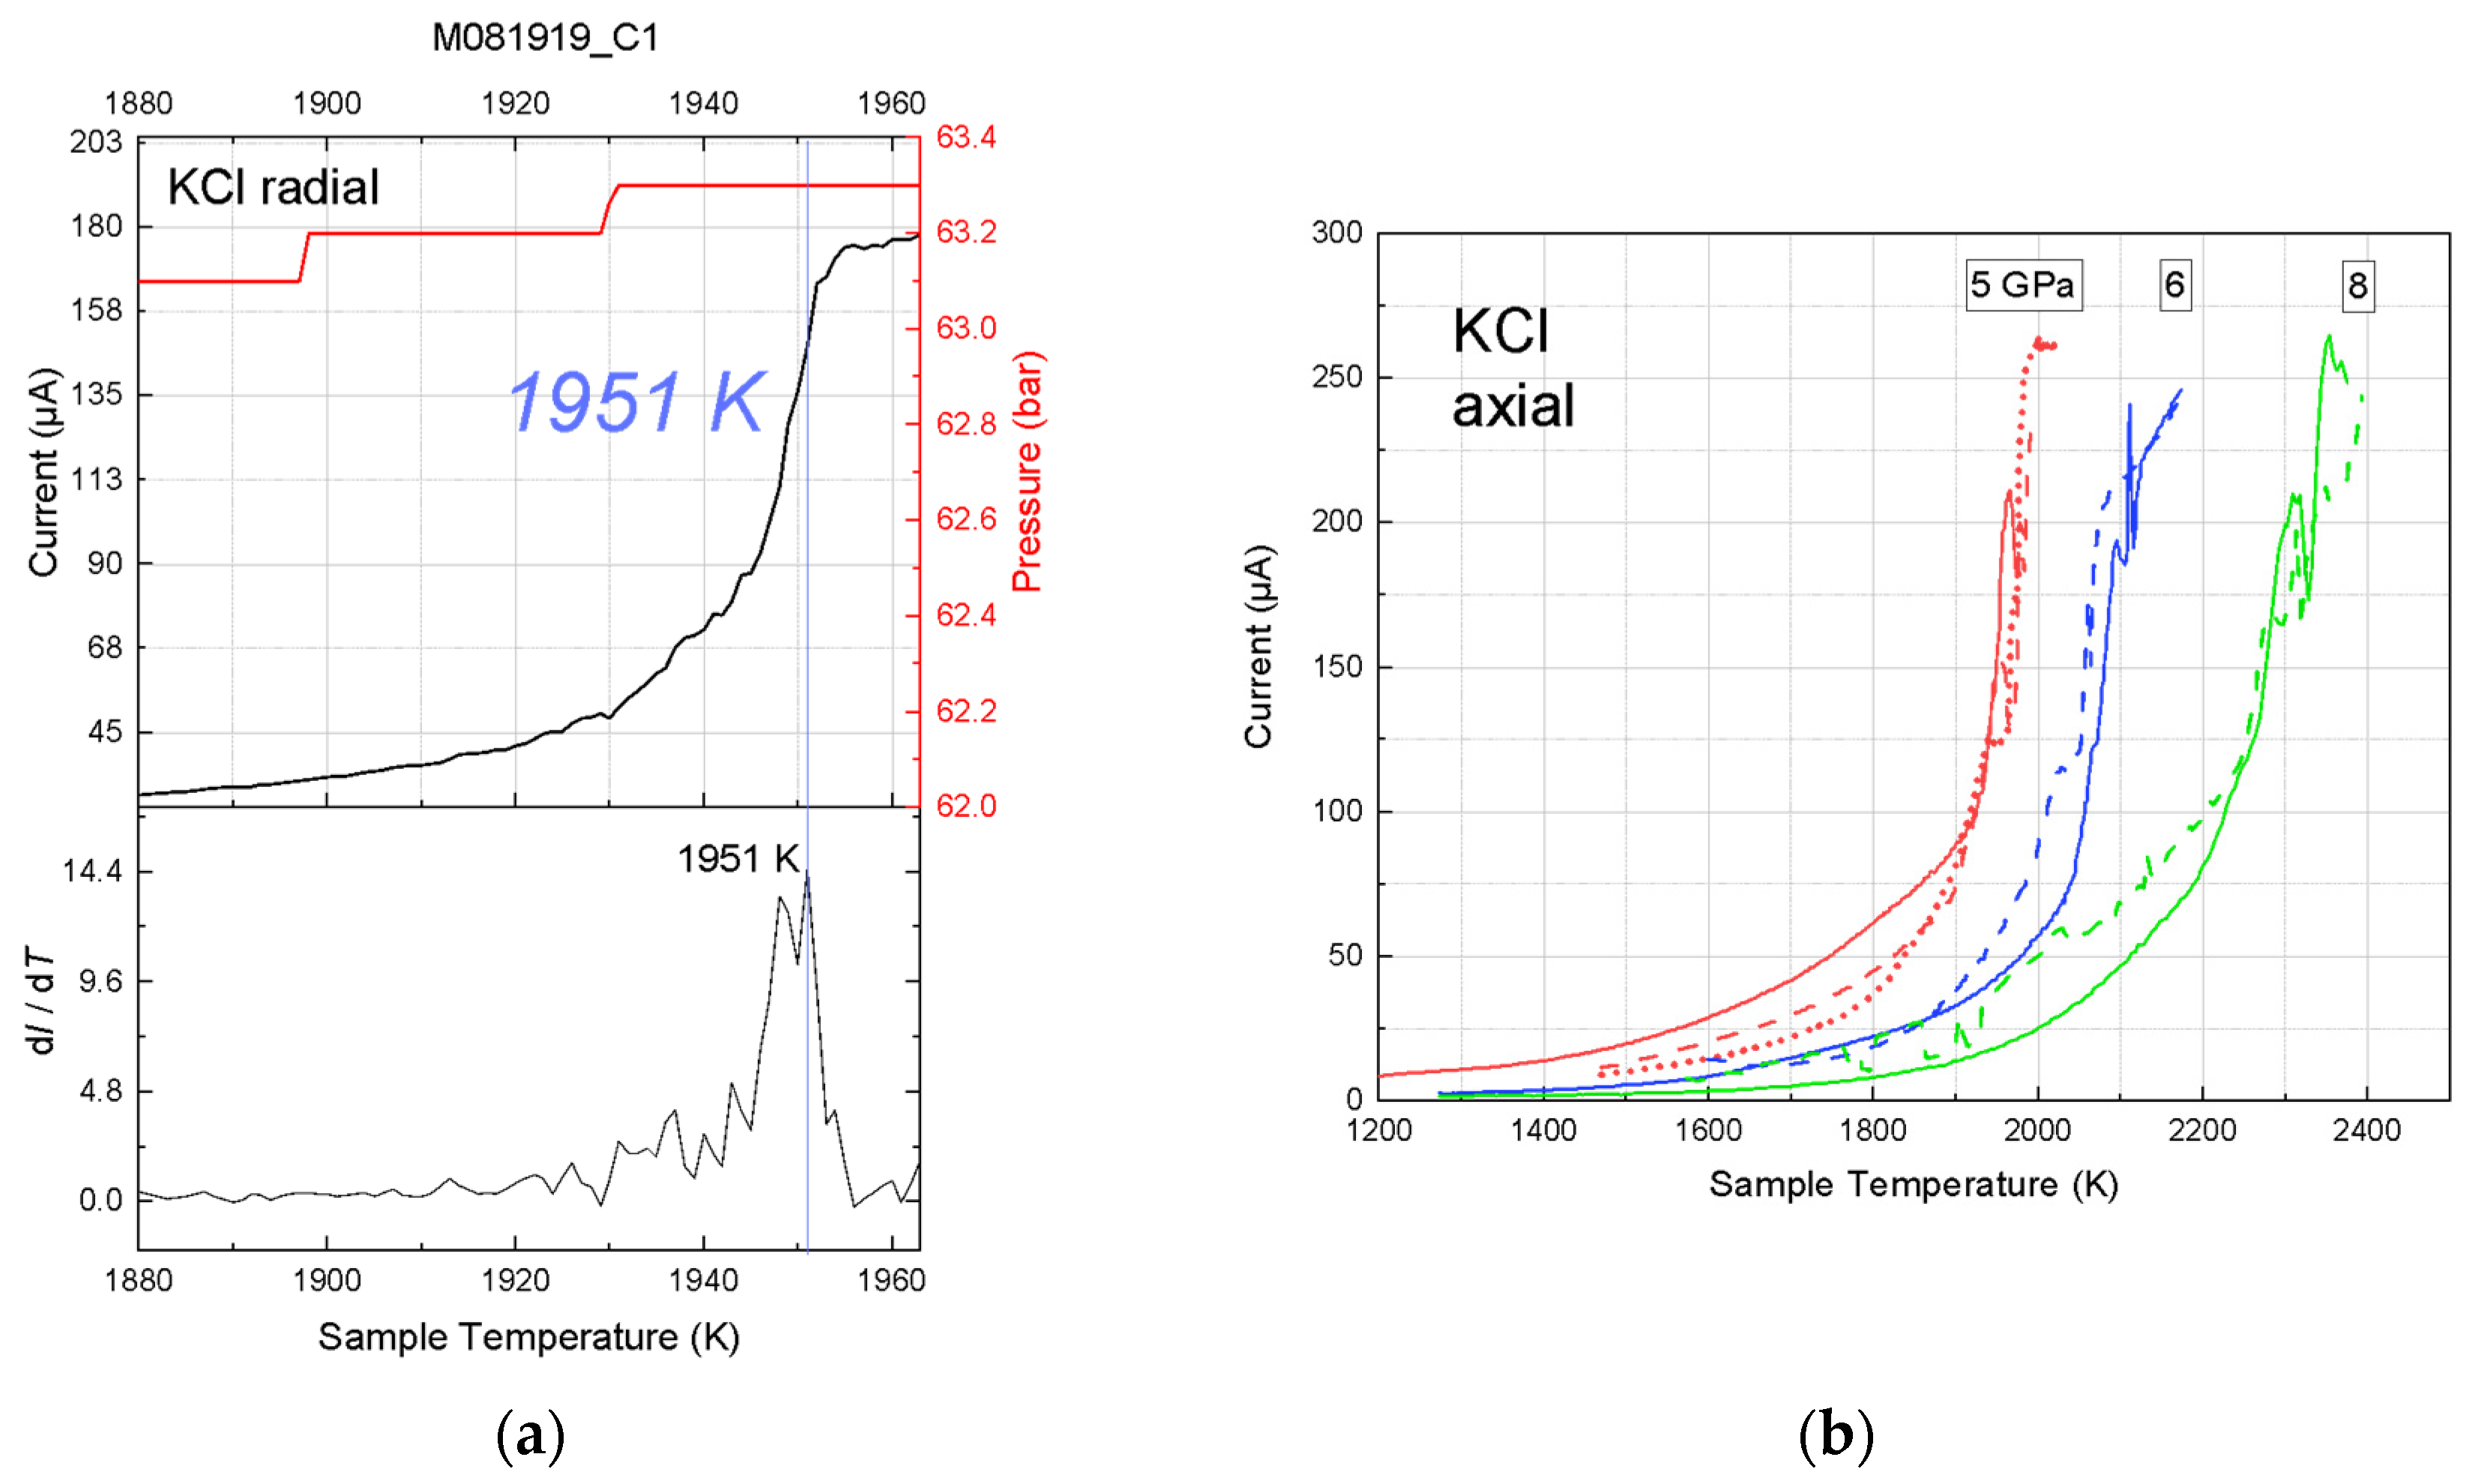
The recorded current-temperature curves are not always of high quality, even at the ambient pressure. Random errors originated from several sources, including melt motion, cell deformation, and pressure drift with temperature. At 1 bar, the migration of melt along the wires or container wall altered the contact location and area of the electrodes, thus producing noise in the current reading. In the high-pressure experiments, components of the high-pressure assembly had diverse ranges of thermoelastic properties and porosities, and therefore responded to compression and heating differently. The resulting stress and deformation produced noise in the current and temperature signals. Furthermore, the current-temperature curve could have been broadened by pressure drift at high temperature. In some of our axial placement experiments, the current-temperature curves were not smooth and the rate of current rise with temperature fluctuated. As a result, the peak in the derivative plot was not as sharp and prominent as expected. Nevertheless, these data gave reasonable constraints on the melting temperature, which increased as a function of pressure, as expected.
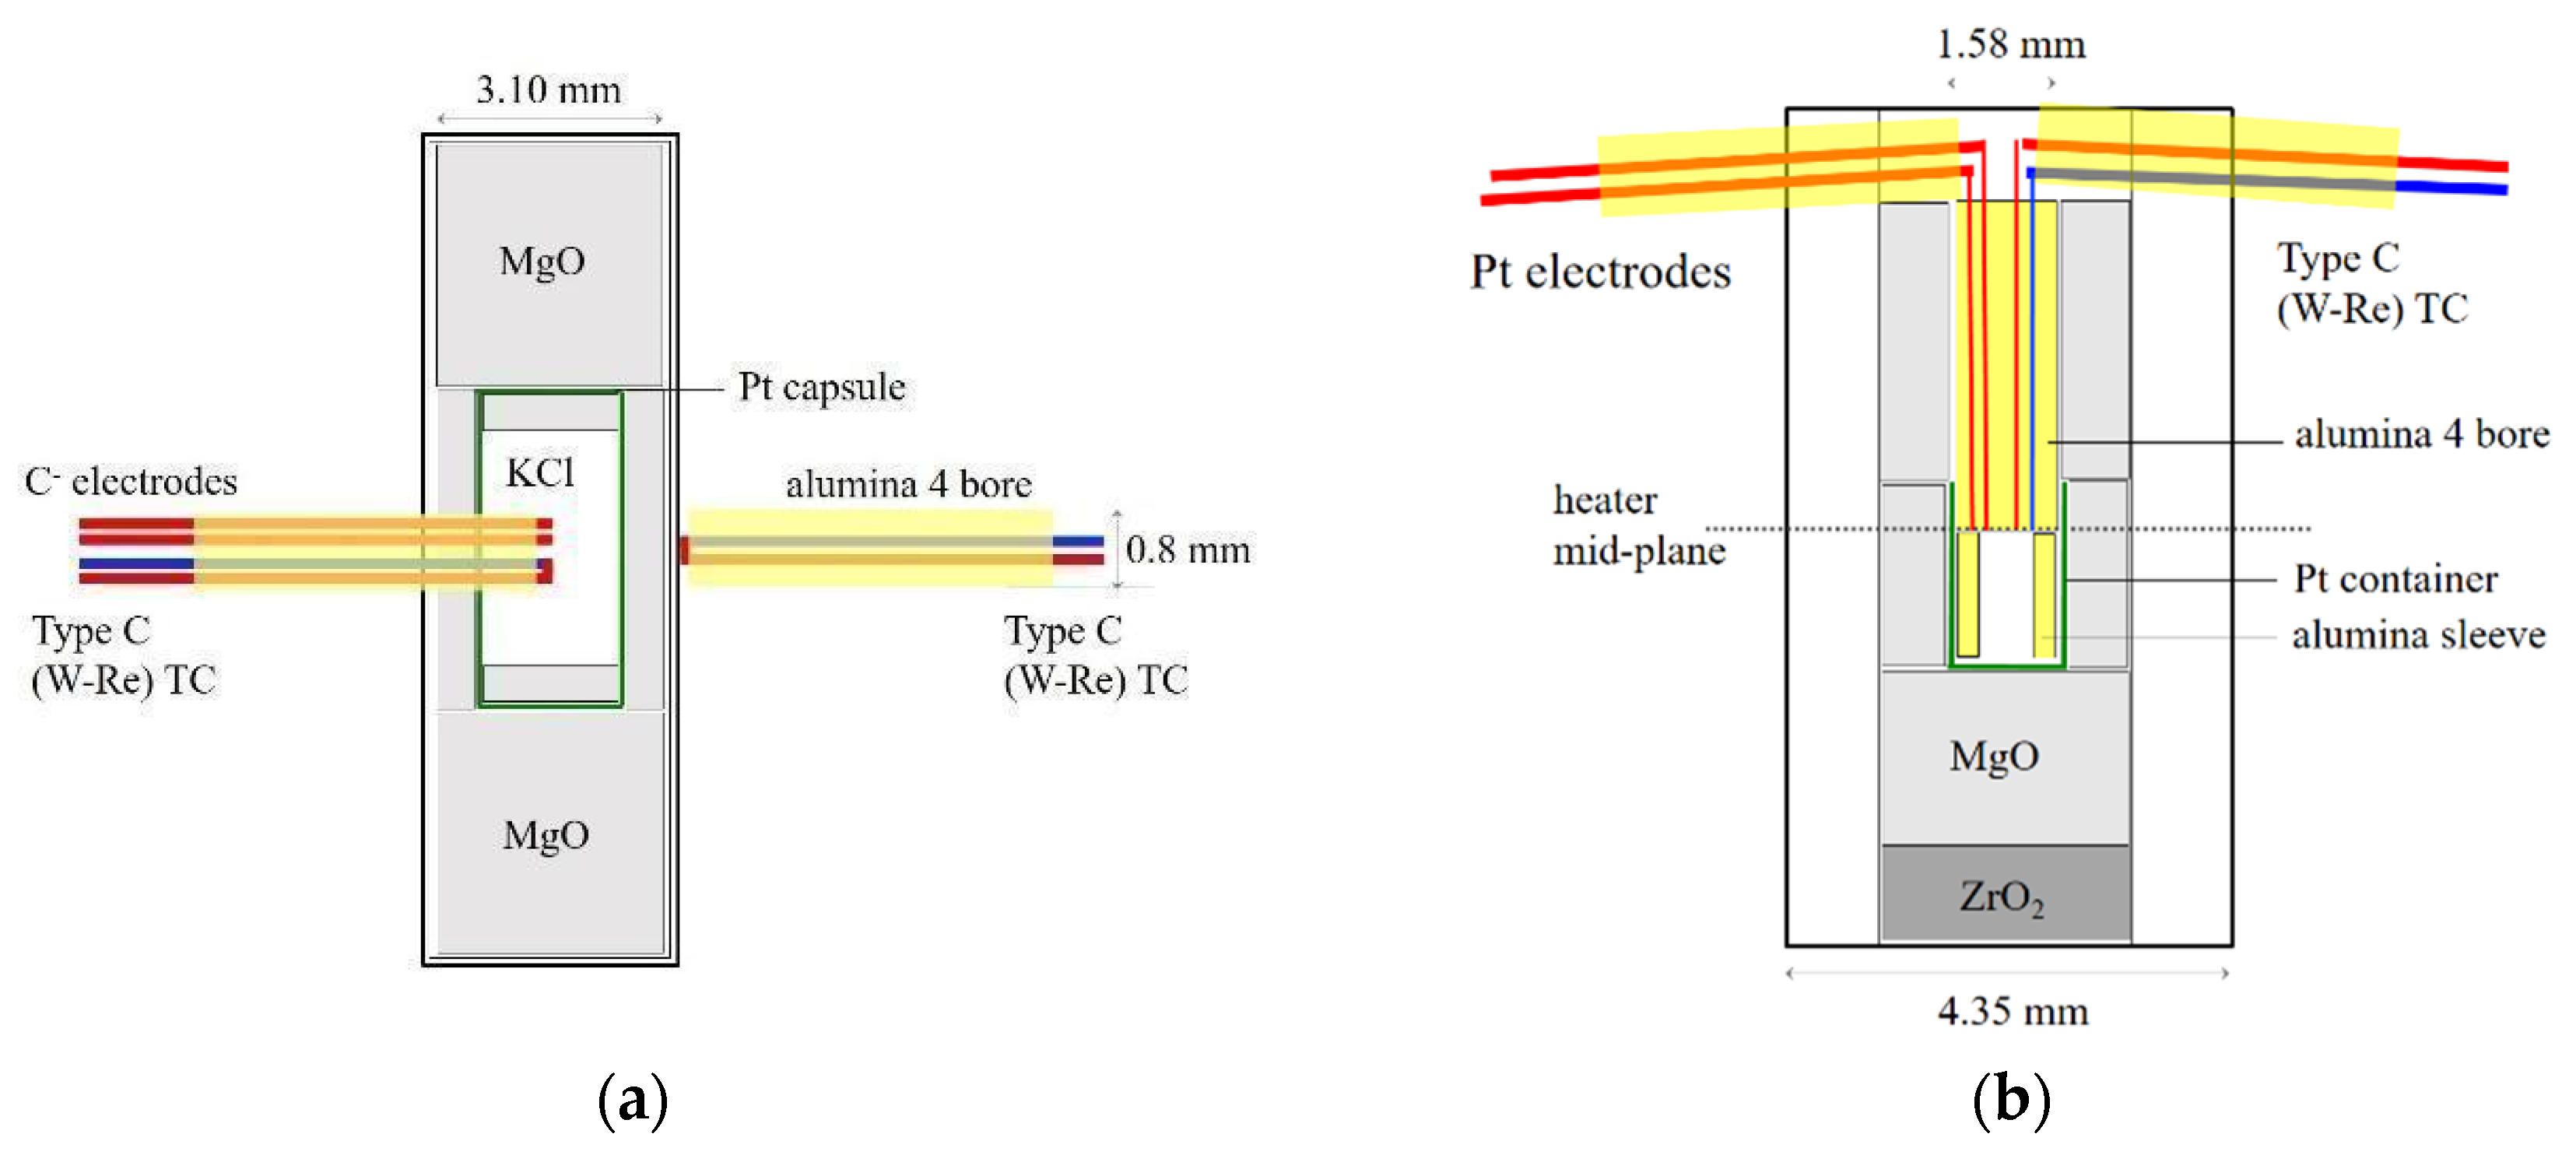
Compared with the symmetric configuration used in previous conduction experiments (e.g., Dong et al., 2019 [6]), the single-side placement of thermocouple and electrodes reduce uncertainties in temperature measurements associated with temperature gradient. Furthermore, the placement of the thermocouple junction and electrode tips at the heater waist allows for detection of the first melt in the sample chamber. By limiting the amount of melt, this configuration minimizes heater deformation associated with melt movement, which may be significant before pore space is not fully closed. Heater deformation leads to perturbation of the temperature distribution and may cause shorting. With the thermocouple junction placed directly in the sample, the single-side placement has the additional advantage of accounting for the latent heat effect on the sample temperature. However, chemical contamination of the thermocouple could produce false signals. In particular, the W-Re based type C wires are known to be vulnerable to oxidation and they react with carbonate melts [5]. The type S wires are more chemical inert, but they are less refractory and do not work at temperatures beyond ~2300 K.
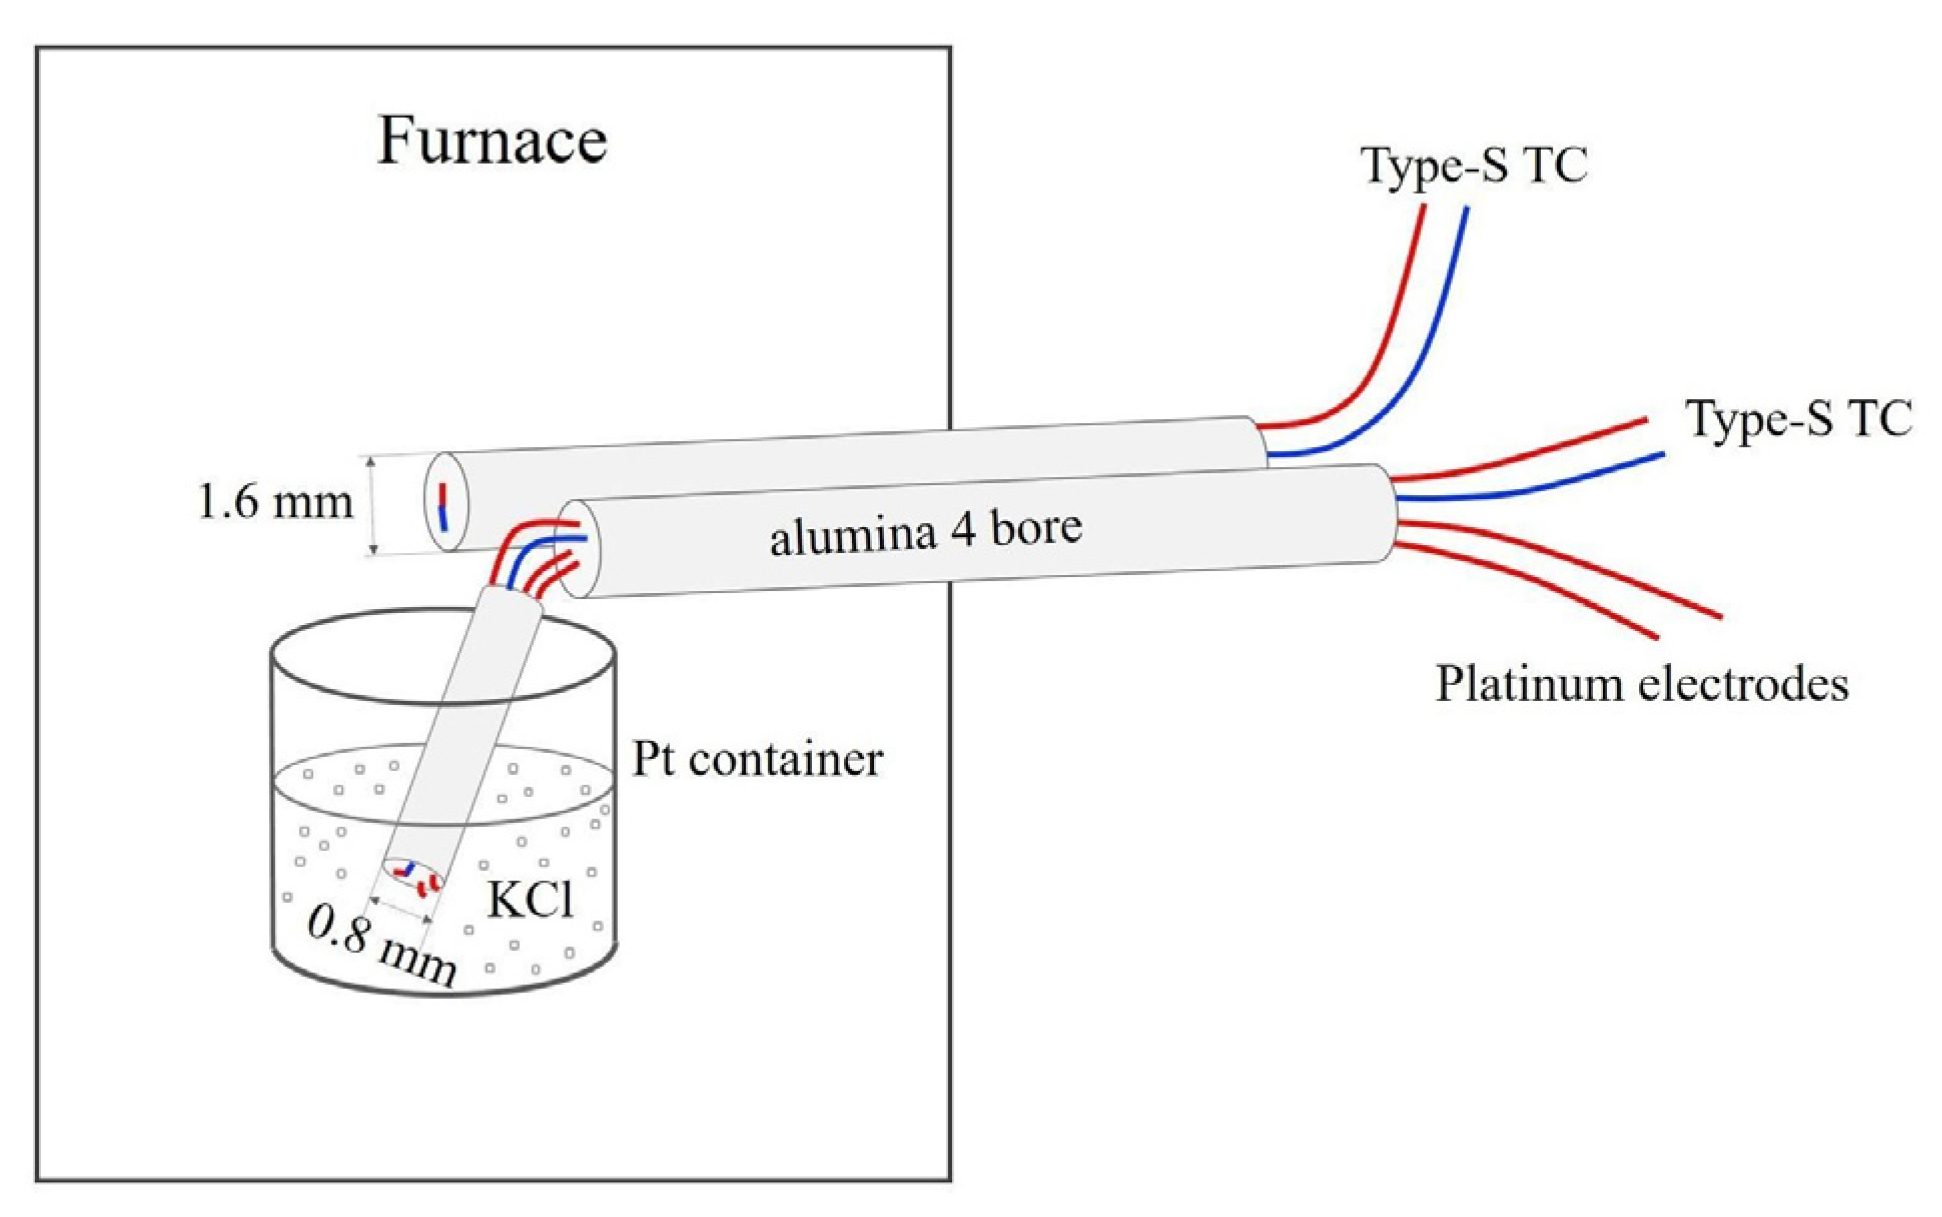
The axial and radial placement of thermocouple and electrodes each has its advantages and disadvantages. Installing the thermocouple requires similar levels of skills in the axial and radial placements, but the axial placement involves cutting two deep grooves in the octahedron and filling extra space with cement after installing the thermocouple, whereas the radial placement only involves drilling one bore through a fin of the octahedron. The radial placement ensures that the thermocouple junction and electrode tips are located at the hottest part of the heater to detect the first melt. Perforation in the heater causes larger temperature gradient and hot spots because each wire from the hot zone to the exterior acts as a heat sink that perturbs the thermal field. Moreover, melt may leak out from the perforation at the heater equator. However, the four-bore holder in the radial placement has a diameter of 0.80 mm so that the thermocouple junction and the electrode tips are less than 0.2 mm apart. This configuration allows reliable melting detection even in the presence of relatively large temperature gradients. Such a small holder can only fit 5 mil wires. The thinner wires lose less heat but are more fragile and break easily at a few GPa. In this study, we placed the second thermocouple just outside the heater in an attempt to observe the latent heat associated with melting in the radial experiments. These two wires can be left out in the radial placement experiment.
A successful conduction experiment requires the survival of the thermocouple and electrode wires and separation of the electrodes. In the KCl experiments, we used the W-Re-based type C wires, which are much stronger than the type S wires and therefore less likely to break or short, but they are more chemically reactive and cannot be used for carbonates such as CaCO3 [5]. The Pt-Rh-based type S thermocouples are soft and prone to failure due to breaking or shorting. In the axial configuration, space is available to accommodate wires with 8 mil or even 10 mil diameters. If correctly placed, these wires are sufficiently thick to survive compression to 20 GPa, but the thicker electrodes short more easily. Shorting may occur upon compression, when the Pt container and malleable wires deform under stress. Chance of shorting increases at high temperature, when the wires soften and flow more readily. The movement of melt may also lead to shorting.
The ionic conduction method has a number of advantages over the differential thermal analysis (DTA) method. At 1 bar, the latent heat ledge may be missing if the sample is heated up too fast or too slow, but the steep rise in ionic current is not affected by the heating rate. The latent heat effect was not observed in the high-pressure experiments, possibly because the sample mass was too small, and the signal was overwhelmed by the thermal response of the surrounding materials in the high-pressure assembly. Thermopile amplification used for differential scanning calorimetry studies at high pressures [14,15] may allow us to observe the latent heat ledge associated with melting. Alternatively, we can apply the ionic conduction method to detect melting.
Compared with the ionic conduction method, applying the Pt sphere maker method at high pressures is labor-intensive. Theoretically the melting point at a given pressure can be bracketed by two experiments, but in reality, many more experiments are needed to locate the melting temperature, even if all are successful. Duplicate experiments may produce contradictory results because of uncertainties in sample placement in a temperature gradient. With limited width and length of the sample, Pt spheres could easily get stuck to the container wall or trapped in the thin layer of melt, and therefore produce no results.
Admittedly, ion conduction measurement at high pressure is challenging because it requires well controlled sample geometry. All the parts need to be aligned and closely fitted to ensure success. Our current success rate is about one third for users with average skills. However, this type of experiment is highly efficient when successful. Our study showed that melting produces a steep rise in ionic current with temperature, but we cannot exclude the possibility of an abrupt current rise resulting from other changes such as decomposition or chemical reaction. For these reasons, it is important to examine the experiment product for chemical changes, and to validate the melting points from conduction experiments by sphere marker experiments at selected pressures.

4.3. Application of KCl in High Pressure Research

The proposed melting curve of KCl informs its potential use as a pressure calibrant for large-volume press or material for pressure transmission, thermal insulation, and sample containment in high pressure research.
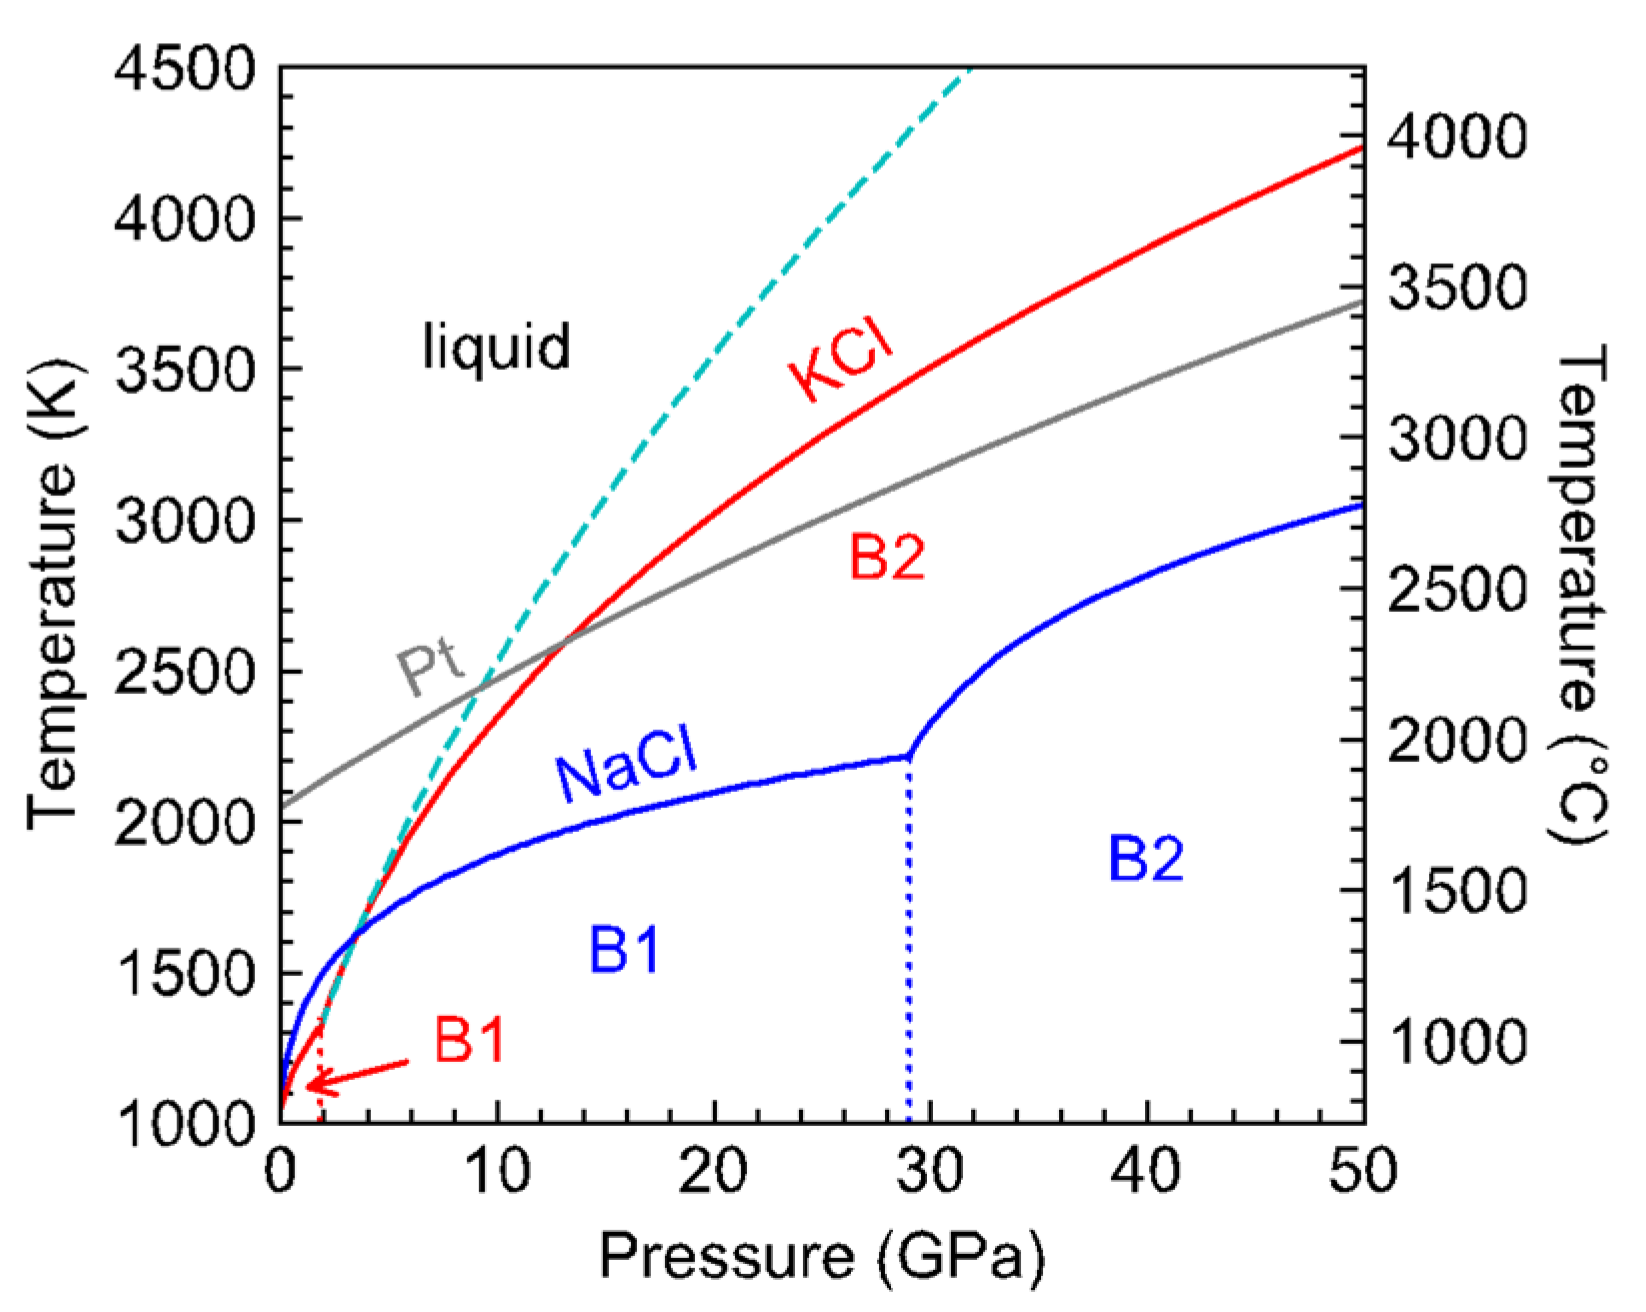
The melting curve of NaCl has been used to calibrate the relationship between press load and sample pressure in piston-cylinder and large-volume press. Such calibration revealed notable deviation from pressure calibration established at 1473 K in experiments using the 646-pressure medium [7]. At 7 GPa and ~2000 K, the thermal pressure reached as much as 2 GPa, which can be explained by the low thermal conduction of zirconia-based 646 ceramics. While NaCl works well as a pressure calibrant at pressures up to ~7 GPa, it loses resolution at higher pressures, where its melting curve becomes relatively flat (Figure 6). Between 1 bar and ~9 GPa, the melting point of KCl increases with pressure at an average rate of ~150 K/GPa. With such a large melting slope, KCl may be used as a high-resolution pressure calibrant at moderate pressures and high temperatures. Note that the reference melting curve of KCl carries an uncertainty of ±100 K and the measured melting temperature bears a comparable uncertainty of ±100 K with the current design of ionic conduction experiment including the uncertainties in temperature measurements, the peak width of dI/dT, and reproducibility among multiple heating cycles (Table 2). As a result, the uncertainty in pressure calibration is at least ±0.7 GPa, which can be improved when the KCl melting curve is more tightly constrained and a better design of ionic conduction experiment enables more accurate and precise melting detection.
Previous studies showed that pressure calibration of multi-anvil experiments is affected by temperature and heating cycle. Leinenweber et al. (2012) [8] found that the COMPRES 10/5 assembly experienced a pressure maximum during heating. At 15 to 20 GPa, the sample pressure varied by as much as 1.5 GPa between room temperature and 1900 K. More significantly, at 20–30 GPa, the COMPRES 8/3 assembly lost 5 to 10 GPa during heating between room temperature and 2300–2600 K [8]. On the other hand, the sample pressure increased by 2 GPa between 1500 and 2300 K at a press load of 1400 ton, after a temperature cycle at 680 ton [16]. Such large pressure variations with temperature and heating cycles suggest that some of the discrepancies in the measured melting temperatures between multiple heating cycles may originate from pressure change at a fixed press load, in addition to other sources such as melt movement and heater deformation. The reproducibility of the measured melting temperatures between repeated cycles and the agreement between our results and literature data on the melting curve of KCl suggests that in this study the deviations of sample pressures from the pressure calibrations are within the estimated uncertainties.
We propose that the ionic conduction method may be used to quantify the effects of temperature and heating cycle on pressure calibration. Although in its current state this method still bears relatively large uncertainties and may have limited resolutions at high pressures, it offers a potential solution when synchrotron radiation is not available or opening an X-ray window in the cell is not desirable.
The divergence between the melting curves of NaCl and KCl is interesting (Figure 6). At 1 bar, they are both in the B1 face-centered cubic structure. As expected from the systematic relationship between the melting temperature and ionic radii [20], KCl melts at a lower temperature than NaCl and transforms into the simple cubic B2 structure at a lower pressure than NaCl. The B1–B2 transition is associated with a volume reduction, which may have led to steepening of the melting slope, as observed in the melting curve of SiO2 upon the transition from high-quartz to coesite and from coesite to stishovite [21].
While NaCl remains in the B1 structure with small increase of melting temperature with pressure, the melting curve of KCl crosses that of NaCl near 3 GPa. Between 3 and 9 GPa, the melting point of KCl continues to rise steeply to cross that of Pt near 9 GPa (Figure 6). The highly refractory nature of KCl at moderate pressures may provide value for high-pressure research. In diamond-anvil cell experiments NaCl and KCl are widely used as pressure medium because they are transparent and have low shear moduli. They also serve as thermal insulating layer for laser-heating experiments. If the sample of interest is a melt, then a refractory medium or insulator may be preferred for stability.
Finding a suitable container is also important for high temperature experiments on materials synthesis phase equilibria and chemical reactions. For sample containment, KCl possesses a unique combination of characteristics: It is water-soluble, relatively soft, and electrically insulating in the solid state, and highly refractory at moderate pressure, therefore it is a promising option along with commonly used container materials such as graphite, MgO, BN, and various metals.

5. Conclusions

Through concurrent differential thermal analysis, platinum sphere marker, and ionic conduction measurements at 1 bar, we showed that melting of KCl or NaCl produces a prominent peak in the increase of ionic current with temperature; therefore, the first derivative of the current-temperature relation can be used to locate the melting point.
Applying this criterion for melting detection to ionic conduction measurements at high pressures, we determined the melting points of KCl at selected pressures between 3.5 and 8 GPa, which partially fill the gap between 4 GPa and 20 GPa in the literature data. Our results suggest that the melting temperature at 9 GPa exceeds that of Pt, and is at least 2400 ± 100 K. The Simon–Glatzel fit to the large volume data diverges from that through all the data including those from the DAC experiments. Considering the empirical nature of the Simon–Glatzel melting equation and large uncertainties in the early DAC results, further constraints are needed at pressures above 10 GPa to provide tighter constraints on the KCl melting curve.
Given the large dependence of melting temperature on pressure between 1 bar and 10 GPa, KCl may be used to calibrate large volume press at high temperatures in this pressure range. The highly refractory nature of KCl at 5 to 50 GPa makes it valuable candidate material for sample containment, pressure transmission, and thermal insulation at high temperatures and moderate pressures.

Author Contributions

Conceptualization, J.L.; methodology, D.Z., J.D., J.L; data analysis, D.Z., J.D., J.L.; investigation, D.Z., J.D., Y.S., F.Z., J.L.; writing—original draft preparation, J.L.; writing—review and editing, D.Z., J.D., Y.S., F.Z., J.L.; visualization, D.Z., J.D., J.L.; supervision, J.L.; All authors have read and agreed to the published version of the manuscript.

Funding

D.Z. acknowledges financial support from USTC’s URP summer project. J.D. acknowledges support through a James Mills Peirce Fellowship from the Graduate School of Arts and Sciences at Harvard University. J.L. acknowledges support of USA National Science Foundation grant EAR 1763189.

Acknowledgments

We thank Robert Liebermann for encouraging and supporting our contribution to this special issue that honors Orson Anderson for his pioneering role in establishing mineral physics. We thank Dave Walker and two anonymous reviewers for providing valuable comments and suggestions, Skye Kaplan, Chengwei Zhang, and Ethan Gutierrez for their assistance with experiments and data archiving.

Conflicts of Interest

The authors declare no conflict of interest.

References

  1. Dewaele, A.; Belonoshko, A.B.; Garbarino, G.; Occelli, F.; Bouvier, P.; Hanfland, M.; Mezouar, M. High-pressure–high-temperature equation of state of KCl and KBr. Phys. Rev. B 2012, 85, 214105. [Google Scholar] [CrossRef]
  2. Boehler, R.; Ross, M.; Boercker, D.B. High-pressure melting curves of alkali halides. Phys. Rev. B 1996, 53, 556. [Google Scholar] [CrossRef] [PubMed]
  3. Pistorius, C.W.F.T. Melting curves of the potassium halides at high pressures. J. Phys. Chem. Solids 1965, 26, 1543–1548. [Google Scholar] [CrossRef]
  4. Li, Z.; Li, J. Melting curve of NaCl to 20 GPa from electrical measurements of capacitive current. Am. Mineral. 2015, 100, 1892–1898. [Google Scholar] [CrossRef]
  5. Li, Z.; Li, J.; Lange, R.; Liu, J.; Militzer, B. Determination of calcium carbonate and sodium carbonate melting curves up to Earth’s transition zone pressures with implications for the deep carbon cycle. Earth Planet. Sci. Lett. 2017, 457, 395–402. [Google Scholar] [CrossRef] [Green Version]
  6. Dong, J.; Li, J.; Zhu, F.; FaRawi, R. Melting curve minimum of barium carbonate BaCO3 near 5 GPa. Am. Mineral. 2019, 104, 671–678. [Google Scholar] [CrossRef]
  7. Walker, D.; Li, J. Castable solid pressure media for multi-anvil devices. Matter Radiat. Extrem. 2020, 5, 018402. [Google Scholar] [CrossRef] [Green Version]
  8. Leinenweber, K.D.; Tyburczy, J.A.; Sharp, T.G.; Soignard, E.; Diedrich, T.; Petuskey, W.B.; Mosenfelder, J.L. Cell assemblies for reproducible multi-anvil experiments (the COMPRES assemblies). Am. Mineral. 2012, 97, 353–368. [Google Scholar] [CrossRef]
  9. Li, J.; Hadidiacos, C.; Mao, H.K.; Fei, Y.; Hemley, R.J. Behavior of thermocouples under high pressure in a multi-anvil apparatus. High Press. Res. 2003, 23, 389–401. [Google Scholar] [CrossRef]
  10. Clark, S.P., Jr. Effect of pressure on the melting points of eight alkali halides. J. Chem. Phys. 1959, 31, 1526–1531. [Google Scholar] [CrossRef]
  11. Simon, F.; Glatzel, G. Bemerkungen zur schmelzdruckkurve. Z. Für Anorg. Und Allg. Chem. 1929, 178, 309–316. [Google Scholar] [CrossRef]
  12. Datchi, F.; Loubeyre, P.; LeToullec, R. Extended and accurate determination of the melting curves of argon, helium, ice (H2O), and hydrogen (H2). Phys. Rev. B 2000, 61, 6535. [Google Scholar] [CrossRef]
  13. Anzellini, S.; Dewaele, A.; Mezouar, M.; Loubeyre, P.; Morard, G. Melting of iron at Earth’s inner core boundary based on fast X-ray diffraction. Science 2013, 340, 464–466. [Google Scholar] [CrossRef] [PubMed]
  14. Rapp, R.P.; Navrotsky, A. Differential scanning calorimetry in a piston-cylinder apparatus: Design and calibration. Pure Appl. Geophys. 1993, 141, 615–629. [Google Scholar] [CrossRef]
  15. Secco, R.A. High Pressure Science and Technology; Schmidt, S.C., Shaner, J.W., Samara, G.A., Ross, M., Eds.; AIP: New York, NY, USA, 1994; Volume 2, p. 1593. [Google Scholar]
  16. Fei, Y.; Van Orman, J.; Li, J.; van Westrenen, W.; Sanloup, C.; Minarik, W.; Hirose, K.; Komabayashi, T.; Walter, M.J.; Funakoshi, K.I. Experimentally determined postspinel transformation boundary in Mg2SiO4 using MgO as an internal pressure standard and its geophysical implications. J. Geophys. Res. Solid Earth 2004, 109. [Google Scholar] [CrossRef] [Green Version]
  17. Boehler, R.; Ross, M.; Boercker, D.B. Melting of LiF and NaCl to 1 Mbar: Systematics of ionic solids at extreme conditions. Phys. Rev. Lett. 1997, 78, 4589. [Google Scholar] [CrossRef]
  18. An, Q.; Zheng, L.; Fu, R.; Ni, S.; Luo, S.N. Solid–liquid transitions of sodium chloride at high pressures. J. Chem. Phys. 2006, 125, 154510. [Google Scholar] [CrossRef] [PubMed]
  19. Errandonea, D. High-pressure melting curves of the transition metals Cu, Ni, Pd, and Pt. Phys. Rev. B 2013, 87, 054108. [Google Scholar] [CrossRef]
  20. Prewitt, C.T.; Downs, R.T. High-pressure crystal chemistry. Rev. Mineral. 1998, 37, 284–318. [Google Scholar]
  21. Ghiorso, M. An equation of state for silicate melts. I. Formulation of a general model. Am. J. Sci. 2004, 304, 637–678. [Google Scholar] [CrossRef]
Figure 1. Configuration of concurrent differential thermal analysis (DTA) and ionic conduction experiments at 1 bar. The container was either a 10 mL Pt crucible or a cylindrical Pt container with 1.6 mm diameter and 3–5 mm height. The diameters of the type S thermocouples and Pt electrodes were 8 mil (0.20 mm) or 5 mil (0.13 mm).
Minerals 10 00250 g001
Figure 2. Configurations of multi-anvil conduction experiments with (a) radial placement and (b) axial placement of thermocouple and electrode wires.
Minerals 10 00250 g002
Figure 3. Representative results of experiments on potassium chloride (KCl) (a) and sodium chloride (NaCl) (b) at 1 bar. In each figure, the three panels show the reference temperature (black) and the ionic current (red) and their rates of change as a function of sample temperature. The KCl data were recorded along the sixth heating path of experiment P072519 on KCl and yielded a melting point of 1042 ± 2 K. The NaCl data were recorded along the second heating path of experiment P071919 and yielded a melting point of 1070 ± 2 K. Note that the latent heat ledges appear as cliffs in these figures.
Minerals 10 00250 g003
Figure 4. Representative ionic conduction results of multi-anvil experiments on KCl. (a) Radial placement. The curve was recorded in experiment M081919_8. The press load (red bars) increased during heating. The steps in the press load reflect the resolution of the pressure transducer. Melting was located at the peak rate of current rise at 1951 ± 5 K. (b) Axial placement. All the current curves were recorded in experiment M080817_5. The solid, dashed, and dotted curves represent the first, second, and third heating cycles, respectively.
Minerals 10 00250 g004
Figure 5. Melting curve of KCl up to 10 GPa (a) and up to 50 GPa (b). The red solid curve is a Simons–Glatzel fit to all the data, including the axial placement data (red diamonds) and radial placement data (red squares) from the ionic conduction measurements in this study, and the literature data using piston-cylinder apparatus ([10], green thin-diamonds, [3], green circles) and diamond anvil cells ([2], green triangles). The green dashed curve is a fit to all the data from large volume apparatus, including piston cylinder and multi-anvil press, and the green dot-dashed curve is a fit to all the literature data. The fits are weighted by uncertainties in pressure and temperature, estimated at ±100 K and ±0.5 GPa for our data. The red solid curve and green dashed curve are described by T m = 1323 ( P 1.87 2.2 ( 1 ) + 1 ) 1 2.7 ( 1 ) , and T m = 1323 ( P 1.87 3.5 ( 5 ) + 1 ) 1 1.8 ( 2 )   , respectively, where T is in K, P is in GPa, and the numbers in parentheses are uncertainties in the last digits.
Minerals 10 00250 g005
Figure 6. Phase diagrams of KCl and NaCl up to 50 GPa. The B1–B2 phase boundaries in KCl (red, [3,17]) and NaCl (blue, [18]) are plotted as dotted lines. The melting curve of Pt [19] intersects the Simons–Glatzel fit of KCl to the large volume data (green dashed curve) near 9 GPa.
Minerals 10 00250 g006
Table 1. Summary of 1 bar experiments
KCl Melting Temperature (K)
#DTACurrentΔT
P072519
1104210420
2104210420
310381043−5
410391043−4
5104310430
6104210420
7104310430
NaCl KCl Melting Temperature (K)
P071919_8 1
1107010700
210701071−1
310711072−1
4107210720
510711072−1
P071919_5A
11081107110
P071919_5B
1107510741
2107510750
3107410740
410731075−2
P071919_5C
2107410740
# refers to the sequence number of heating path; Measurements with unclear DTA signals were discarded; 1 8 and 5 refer to wire diameters in 0.001 inch.
Table 2. Summary of multi-anvil experiments on KCl.
Pressure, GPaMelting T, KError, K
M081919_8 13.61669±7
1678±8
1668±8
4.71820±5
1814±13
1815±12
5.51951±13
1951±9
M072619_8 13.21577±5
M080817_5 15.01954±15
1975±13
1976±12
6.02073±18
2110±29
7.02173±50
8.02273±43
2314±48
9.0 2443 2
M080417_5 14.41752±22
Notes: 1 8 and 5 refer to the truncation edge length in mm. The errors are estimated from the width of the peak in dI/dT and do not include additional errors as discussed in the text. 2 A lower bound for the melting point of KCl at 9 GPa is obtained from the melting point of Pt.

