Article

Picosecond Acoustics Technique to Measure the Sound Velocities of Fe-Si Alloys and Si Single-Crystals at High Pressure

Institut de Minéralogie de Physique des Matériaux et de Cosmochimie, Sorbonne Université— CNRS—Muséum National d’Histoire Naturelle, 4 Place Jussieu, F-75005 Paris, France
*
Author to whom correspondence should be addressed.
Current address: Center for High Pressure Science and Technology Advanced Research (HPSTAR), Shanghai 201203, China.
Minerals 2020, 10(3), 214; https://doi.org/10.3390/min10030214
Submission received: 23 January 2020 / Revised: 18 February 2020 / Accepted: 19 February 2020 / Published: 27 February 2020
(This article belongs to the Special Issue Mineral Physics—In Memory of Orson Anderson)

Abstract

:
We describe here a time resolved pump-probe laser technique—picosecond interferometry—which has been combined with diamond anvil cells (DAC). This method enables the measurement of the longitudinal sound velocity up to Mbar pressure for any kind of material (solids, liquids, metals, insulators). We also provide a description of picosecond acoustics data analysis in order to determine the complete set of elastic constants for single crystals. To illustrate such capabilities, results are given on the pressure dependence of the acoustic properties for prototypical cases: polycrystal (hcp-Fe-5 wt% Si up to 115 GPa) and single-crystal (Si up to 10 GPa).

1. Introduction

The study of the effects of pressure and temperature on the acoustic properties of condensed matter is well known to be particularly useful information in the framework of geophysics and physics. Among the most fascinating questions that still need to be addressed, the composition and structure of the planetary core [1], the role of electron-phonon interactions in the emergence of super-conducting phases [2], or the melting curve of alkali liquids [3], could be recalled.
Beyond such fundamental interest, the precise knowledge of the anisotropic distribution of sound velocities in a crystal and their evolution with pressure and temperature can have direct technological applications. The case of silicon is an obvious example for semiconducting technologies, where the knowledge of its complete set of elastic constants under constraints is employed to improve its mechanical stability [4].
Experimentally, access to the acoustic properties of materials submitted to extreme pressure and temperature conditions remains limited, mainly because of the severe constraints imposed on the sample volume by the pressure-generating device. With the notable exception of Brillouin scattering in diamond anvil cells (DACs), which allows measuring the energy of thermal phonons of a transparent sample [5], most studies on the elasticity or visco-elasticity of dense solids and liquids were done by conventional ultrasonics [6], limited to a few tens of GPa [7,8]. The technique of Inelastic X-ray scattering, compatible with the use of DACs, has paved the way for more ambitious studies and has helped to confirm the great relevance of acoustic phonon measurements in physics [9] and geophysics [10]. We emphasize here that this technique is nevertheless very time demanding and particularly suited to the study of the acoustic phonons far from the zone center. It may thus seem expensive (and somewhat less direct) to use such a powerful method to “simply” derive the speed of sound through the help of a dispersion model.
Thereafter, this article will focus on a review of a recent development, the application of picosecond acoustics in diamond anvils cell. Some of its capabilities will here be illustrated by a choice of two examples of experimental results: (i) the measurements of sound velocities of polycrystalline Fe-5 wt% Si and Fe-10 wt% Si at Mbar pressure and (ii) the determination of the complete set of elastic constants on an opaque single-crystalline sample (silicon) up to 10 GPa.

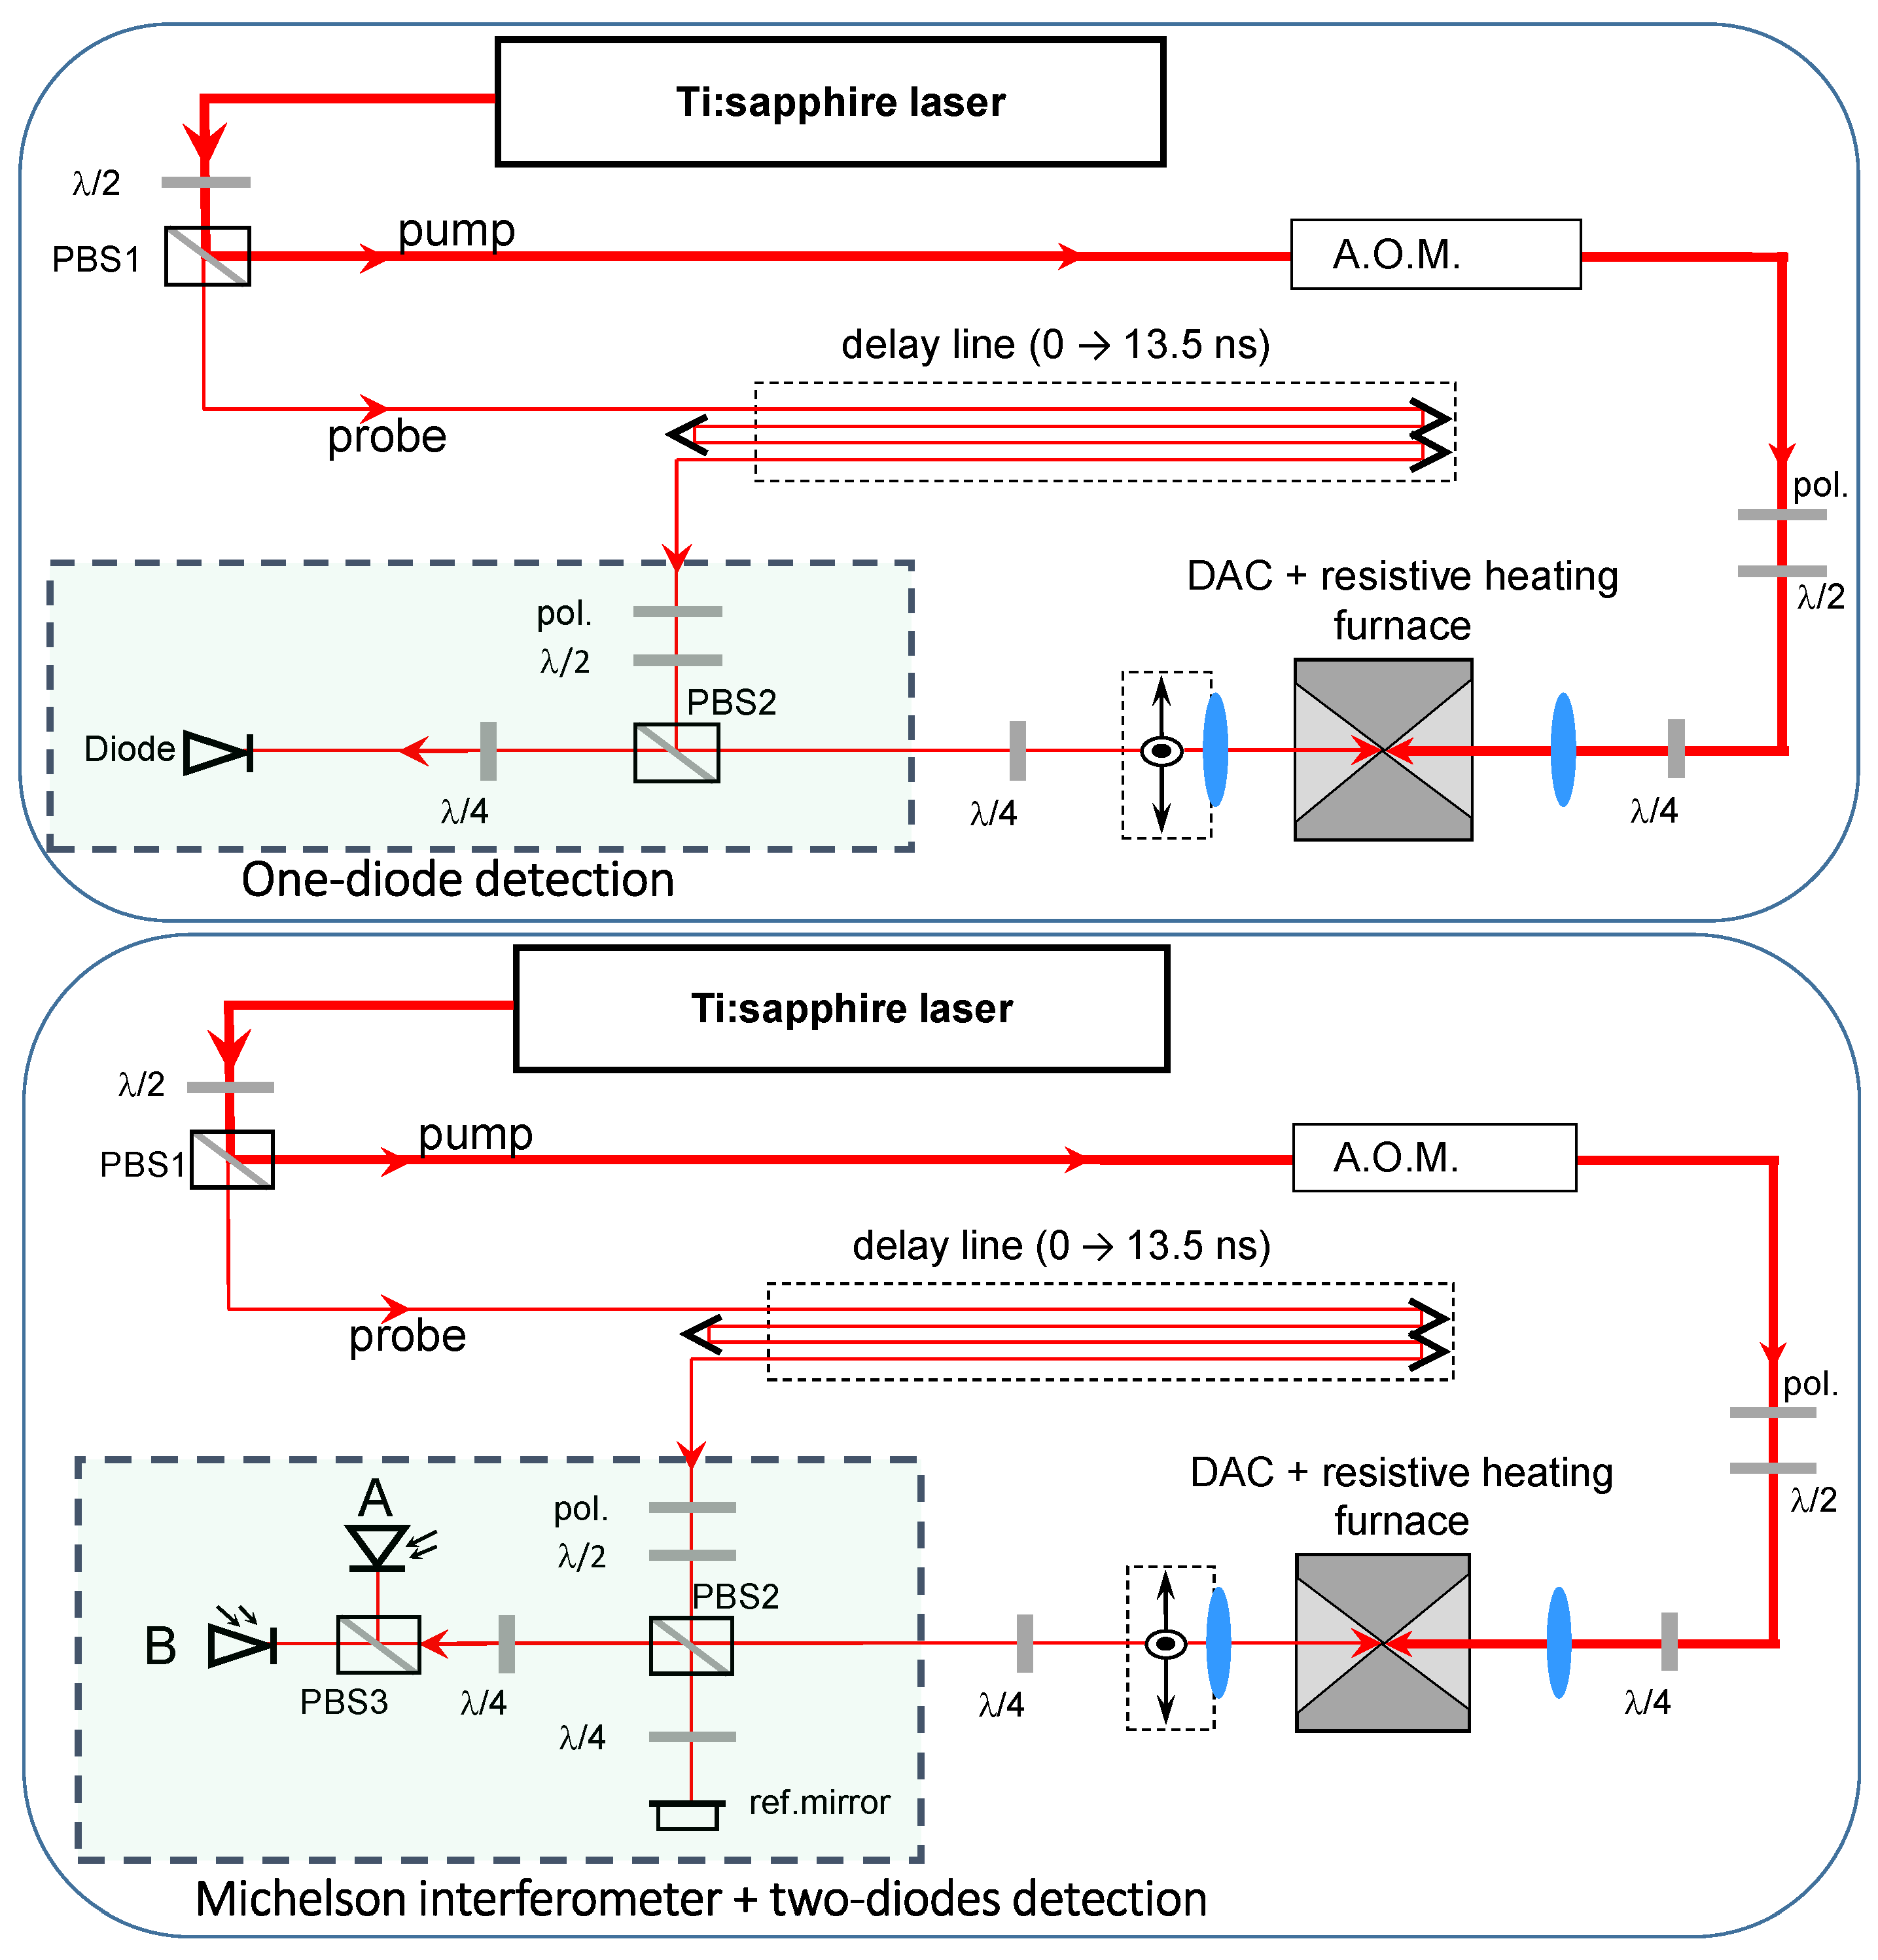
2. Measuring Techniques

Picosecond Acoustics in Diamond Anvil Cells: A Complementary Acoustic Technique for Sound Velocity Measurements at High Pressure and Temperature

The three most well-established types of experiment that allow the determination of the speed of sound in environments subject to extreme conditions are: (i) the ultrasound techniques; (ii) the inelastic neutrons scattering in the large volume press; or using a diamond anvils cell (DAC), (iii) the inelastic scattering of the light by phonons applied either in the visible (Brillouin) or X-ray (IXS) wavelength range. The capabilities, as well as the limitations of each technique are summarized below.
The measurement of sound speed by the ultrasonic technique, where ultrasonic waves are generated through the use of a piezoelectric transducer, may only be carried out for sample dimensions on the order of a few millimeters [6,11]. Therefore, the use of devices allowing large sample volumes (incompatible with the achievement of very high pressures) is required [7,8]. Some attempts have been made to adapt the ultrasonic technique at a very high frequency (on the order of the GHz) to apply the pulse-echo overlap technique in DACs [12], but complications due to interface contact between the sample and the diamond anvils limit the maximum pressure that can be reached, typically less than 15 GPa.
Brillouin scattering could only be applied to transparent materials [5]. In its simpler geometry, mostly used within a DAC, the knowledge of the sample index of refraction is required (including its pressure variation).
As a consequence, if one wished to directly measure the sound velocity of an opaque sample under pressures higher than 20 GPa, IXS has been the only adapted technique [10]. This is an extremely powerful technique as it allows the study of phonon dispersions in condensed matter at momentum transfers and energy transfers characteristic of collective atom motions in a wide range of materials. Disordered systems, opaque crystals, or samples only available in very small quantities could be studied. However, this technique necessitates the use of third-generation synchrotron light sources and long collection times—severely constraining the breadth and scope of such investigations.
In 1986, the first picosecond acoustic experiments were performed, where the authors reported the observation of acoustic oscillations during the measurement of the transitional transmissivity of semiconductor thin films [13]. This idea is schematically illustrated in Figure 1. With this technique, relative changes of the coefficient of electromagnetic reflectivity of the sample are measured as a function of the delay between probe (detection) and pump (generation) laser pulses.
A first ultrashort laser pulse with a duration of approximately 100 fs generates ps acoustic pulses within the sample. The generation process is a result of the photo-elastic coupling between the incident radiation and the material. The energy carried by the incident photons of the pump beam is absorbed by the sample, and electron-phonon coupling causes a local sharp heat pulse (dilatation). This rapid change in volume generates a longitudinal sound wave, the propagation of which is perpendicular to the surface of the sample. A second light pulse, shifted in time with respect to the pump through the use of a delay line, detects the arrival of the acoustic strain field at the surface of the sample. In the framework of a simple photo-elastic model [14,15], the time variation of the sample reflectivity δ r ( t ) of the probe is a function of the photo-elastic coefficient n ˜ / η (where n ˜ is the sample refractive index and η the stress generated by thermal expansion) and the surface displacement u 0 ( t ) along the propagation axis z. It can be expressed as:
δ r ( t ) r 0 = 2 i k 0 n d 0 + η ( z , t ) d z + n ˜ η 2 n ˜ n d 2 n ˜ 2 0 + η ( z , t ) e 2 i k 0 n ˜ z d z
where k 0 is the laser wave vector and n d the refractive index of the material surrounding the sample (pressure transmitting medium or diamond anvil, depending on experimental design).
In other words, after propagation across the sample, both thermal and acoustic effects alter the optical reflectivity sample in two ways: the photo-elastic effect and surface displacement (as the acoustic echo reaches the surface). The first modification contributes to the change in intensity of the reflectivity and its phase shift, whereas the second one only modifies the phase of the reflectivity signal.
Using this novel approach combined with DACs, we showed that such a laboratory setup circumvents all previous limitations [16,17,18]. Technical details related to the setup of such an experiment can be found in [19]. A schematic of the DAC/picosecond acoustics combination setup is given in Figure 2. Sound velocity extraction from the raw experimental data (the time dependence of the surface sample reflectivity) was described in detail in the following references [19,20,21].

3. Measurement of the Sound Velocities of Polycrystalline Fe-Si Alloys at Mbar Pressures

Iron and iron alloys at extreme conditions have garnered significant interest due to their relevance to the Earth’s deep interior. While there are strong constraints on the elastic properties of the Earth’s interior via seismological investigations (e.g., [22]) providing constraints on density, longitudinal wave velocities and shear wave velocities, there is no direct chemical information regarding Earth’s iron-rich core. Consequently, the chemical composition of the Earth’s core is heavily debated, with the presence or absence of different light elements indicating the presence or absence of various geochemical cycles [23,24] or differing formation scenarios of the Earth itself (e.g., [25,26]).
One possible way to constrain the Si content of the inner core is the comparison between seismological data and experimental measurements, or calculations, of ρ , V p , and V s of candidate materials at pertinent P-T conditions. Thanks to the adaptation of picosecond acoustics to DAC previously described, it has been possible to make direct measurements of the compressional sound velocity of Fe-Si alloy with 5 wt% Si (Fe5Si) and 10 wt% Si (Fe10Si) up to more than 120 GPa.
Shown in Figure 3 are selected travel times collected during high pressure runs of Fe10Si before, during, and after the bcc-hcp transition. It is observed that well within the stability field of bcc or hcp Fe-Si alloys, the first acoustic echo is sharp and unambiguous. However, in the transition region, there is significant distortion of the shape and intensity of the initial rise of the time domain signal. This likely arises because in the transition region, the sample exists as a mechanical mixture of two elastically distinct phases.
It is seen that in each case, the bcc-hcp transformation results in some anomaly in the pressure evolution of the normalized travel time (Figure 4), which is somewhat different from alloy to alloy, due to complex changes in the texture, stress, thickness, and elasticity of the sample. Error bars in Figure 4 were estimated as the pressure difference between the last time domain measurement exhibiting a well-defined acoustic echo observed before the transition region in the case of the onset of the bcc-hcp transition, or the first time-domain measurement after the transition region, at the end of the bcc-hcp transition.
The pressure dependence of the sample thickness was taken into account using P-V EoS determined by X-ray diffraction, either after [28] for the bcc and hcp phases of Fe10Si or after [27,29] for Fe5Si. We relate the pressure evolution of the longitudinal sound velocity to the pressure evolution of thickness and acoustic travel time using the following equation:
e ( t 0 ) = v L Δ t = v L t 0 + p T l a s e r τ
where e ( t 0 ) is the sample thickness, p an integer that takes into account the delay due to the successive generation of echoes due to the the laser repetition rate ( T l a s e r = 12.554 ns), τ the time at which the pump-probe coincidence occurs, and t 0 the emergence time of the acoustic wave at the surface of the sample.
In Equation (2), the thickness of the sample is assumed to vary purely with the hydrostatic variation of the unit cell volume of the sample. In general, stress exerted by the diamond anvils onto the sample chamber of a DAC leads to sample compression where the stress along the compression axis is equal to or greater than the stress perpendicular to the compression axis. The variation of these stress components and their influence upon elasticity measurements depends on many aspects of the experimental design, sample elasticity, and the choice of pressure-transmitting medium (e.g., [30]). While a hydrostatic stress (where the magnitude of the stress on the sample is equal in all directions) on a given sample can be achieved through the use of a liquid pressure-transmitting medium surrounding the sample, all conventional pressure-transmitting media crystallize into solids by about 12 GPa at ambient temperature [31,32,33], which leads to the development of differential stress across the sample and the possibility for sample deformation under compression at high pressures. The degree to which such effects take place is bounded by the elastic properties of the sample itself, and the elastic properties of the pressure transmitting medium. On the basis of the determined sound velocities and literature constraints on the shear strength of Ne [34], the pressure gradients that may develop in Ne or Ar are not sufficiently large to induce significant elastic or plastic deformation of the sample in the case of Fe or Fe-alloys relative to experimental uncertainties. Estimations of the Young’s moduli of Fe, Fe5Si, and Fe10Si at the highest pressure data points used from these experiments are E = 890 GPa at 152 GPa, E = 810 GPa at 114 GPa, and E = 340 GPa at 36 GPa for these alloys, respectively [27,28,35]. Given that the shear strength of Ar is estimated to be about 3–6 GPa at 150 GPa [36,37] and the shear strength of Ne is less than 1–2 GPa over the pressure ranges investigated in [27,28], deviations from the assumption of purely volumetric variation in thickness are not significant in these systems relative to experimental uncertainties and scatter. However, future studies are needed to test this assumption for materials that undergo reconstructive phase transitions at very high pressures, as the rapid loss of shear or compressive strength in a sample under conditions where compression becomes strongly deviatoric may lead to plastic effects that would be important to constrain for more precise velocity determination at multi-Mbar pressures.
Irrespective of such considerations, for Fe-5Si, we observed that the acoustic travel time of a sample varied by nearly 50% from ambient pressure to 1 Mbar, while changes in sample volume led to variations in sample thickness of about 10% over the same pressure range [28]. Consequently, the primary contribution to the variation of the sample acoustic travel time over this pressure range was due to the change in sound velocity, rather than the change in thickness. As a result, under strongly deviatoric conditions where the presented assumptions in thickness are violated, the main systematic errors would more likely arise due to variations in sound velocity from the development of sample texture. For the Fe-Si system, textures remained nearly constant over the studied pressure range as observed by XRD [27,28] and have been proposed as the primary explanation for the strong disagreement between ab initio molecular dynamics calculations (e.g., [38]), IXS [29,39,40], and NRIXS [41] investigations of the elastic properties of the Fe-Si system at high pressures. Indeed, due to the limitations on sample volume imposed by NRIXS and IXS, maintaining a good sample texture is challenging at Mbar pressures.
The sound velocities of Fe, Fe5Si, and Fe10Si are reported in Figure 5. We observed that following the transition region, a sharp rise in sound velocity was observed, with nonlinear variations up to about 30 GPa (Fe5Si) or 80 GPa (Fe10Si), across the bcc-hcp transition region.
A critical discussion of these results can be found in [27,28].
Through the combination of a P-V-T equation of state and longitudinal sound velocities, it is possible to derive other thermodynamic quantities to place further constraints on core composition and properties. Adiabatic and isothermal bulk moduli can be related by the equation:
K S = K T ( 1 + α γ t h T )
where K S is the adiabatic bulk modulus, K T is the isothermal bulk modulus, α is the coefficient of thermal expansion of the material, and γ t h is the thermodynamic Grüneisen parameter. It follows that knowing V p ( ρ ) and K S ( ρ ) allows for the determination of shear velocities ( V s ) through the equation:
K S ρ = V P 2 4 3 V S 2
For Fe-Si alloys at ambient temperature, adiabatic bulk moduli are only marginally different from isothermal bulk moduli under pressure (about 2% higher at 20 GPa and about 1% higher at 1.2 Mbar [28]). It follows that using either isothermal or adiabatic bulk moduli to derive V s at ambient temperature results in similar extrapolations to core densities, albeit with isothermal moduli, resulting in a slight overestimation of V s .

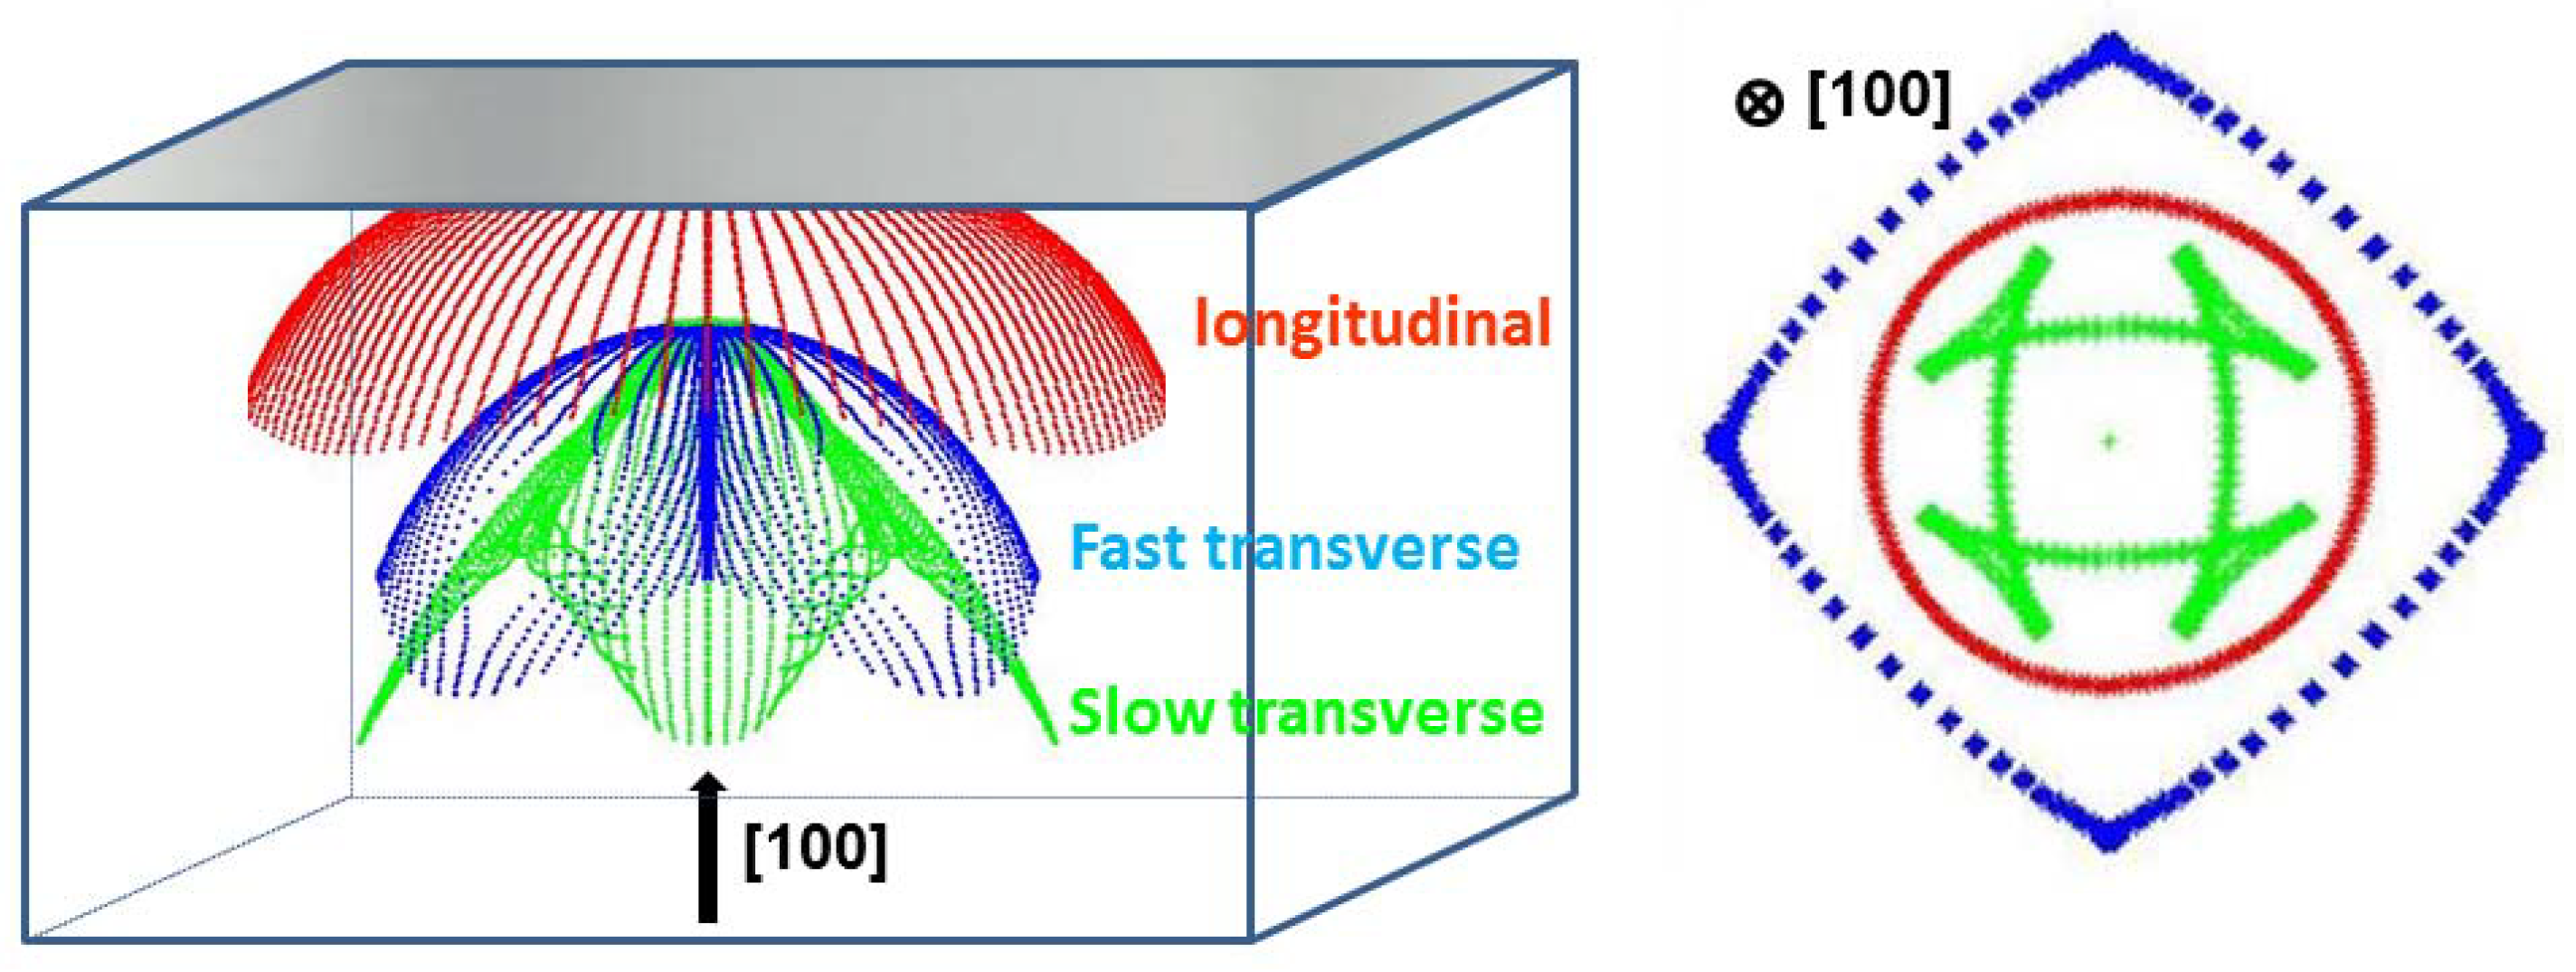
4. Propagation of the Acoustic Energy in a Silicon Single Crystal at High Pressure

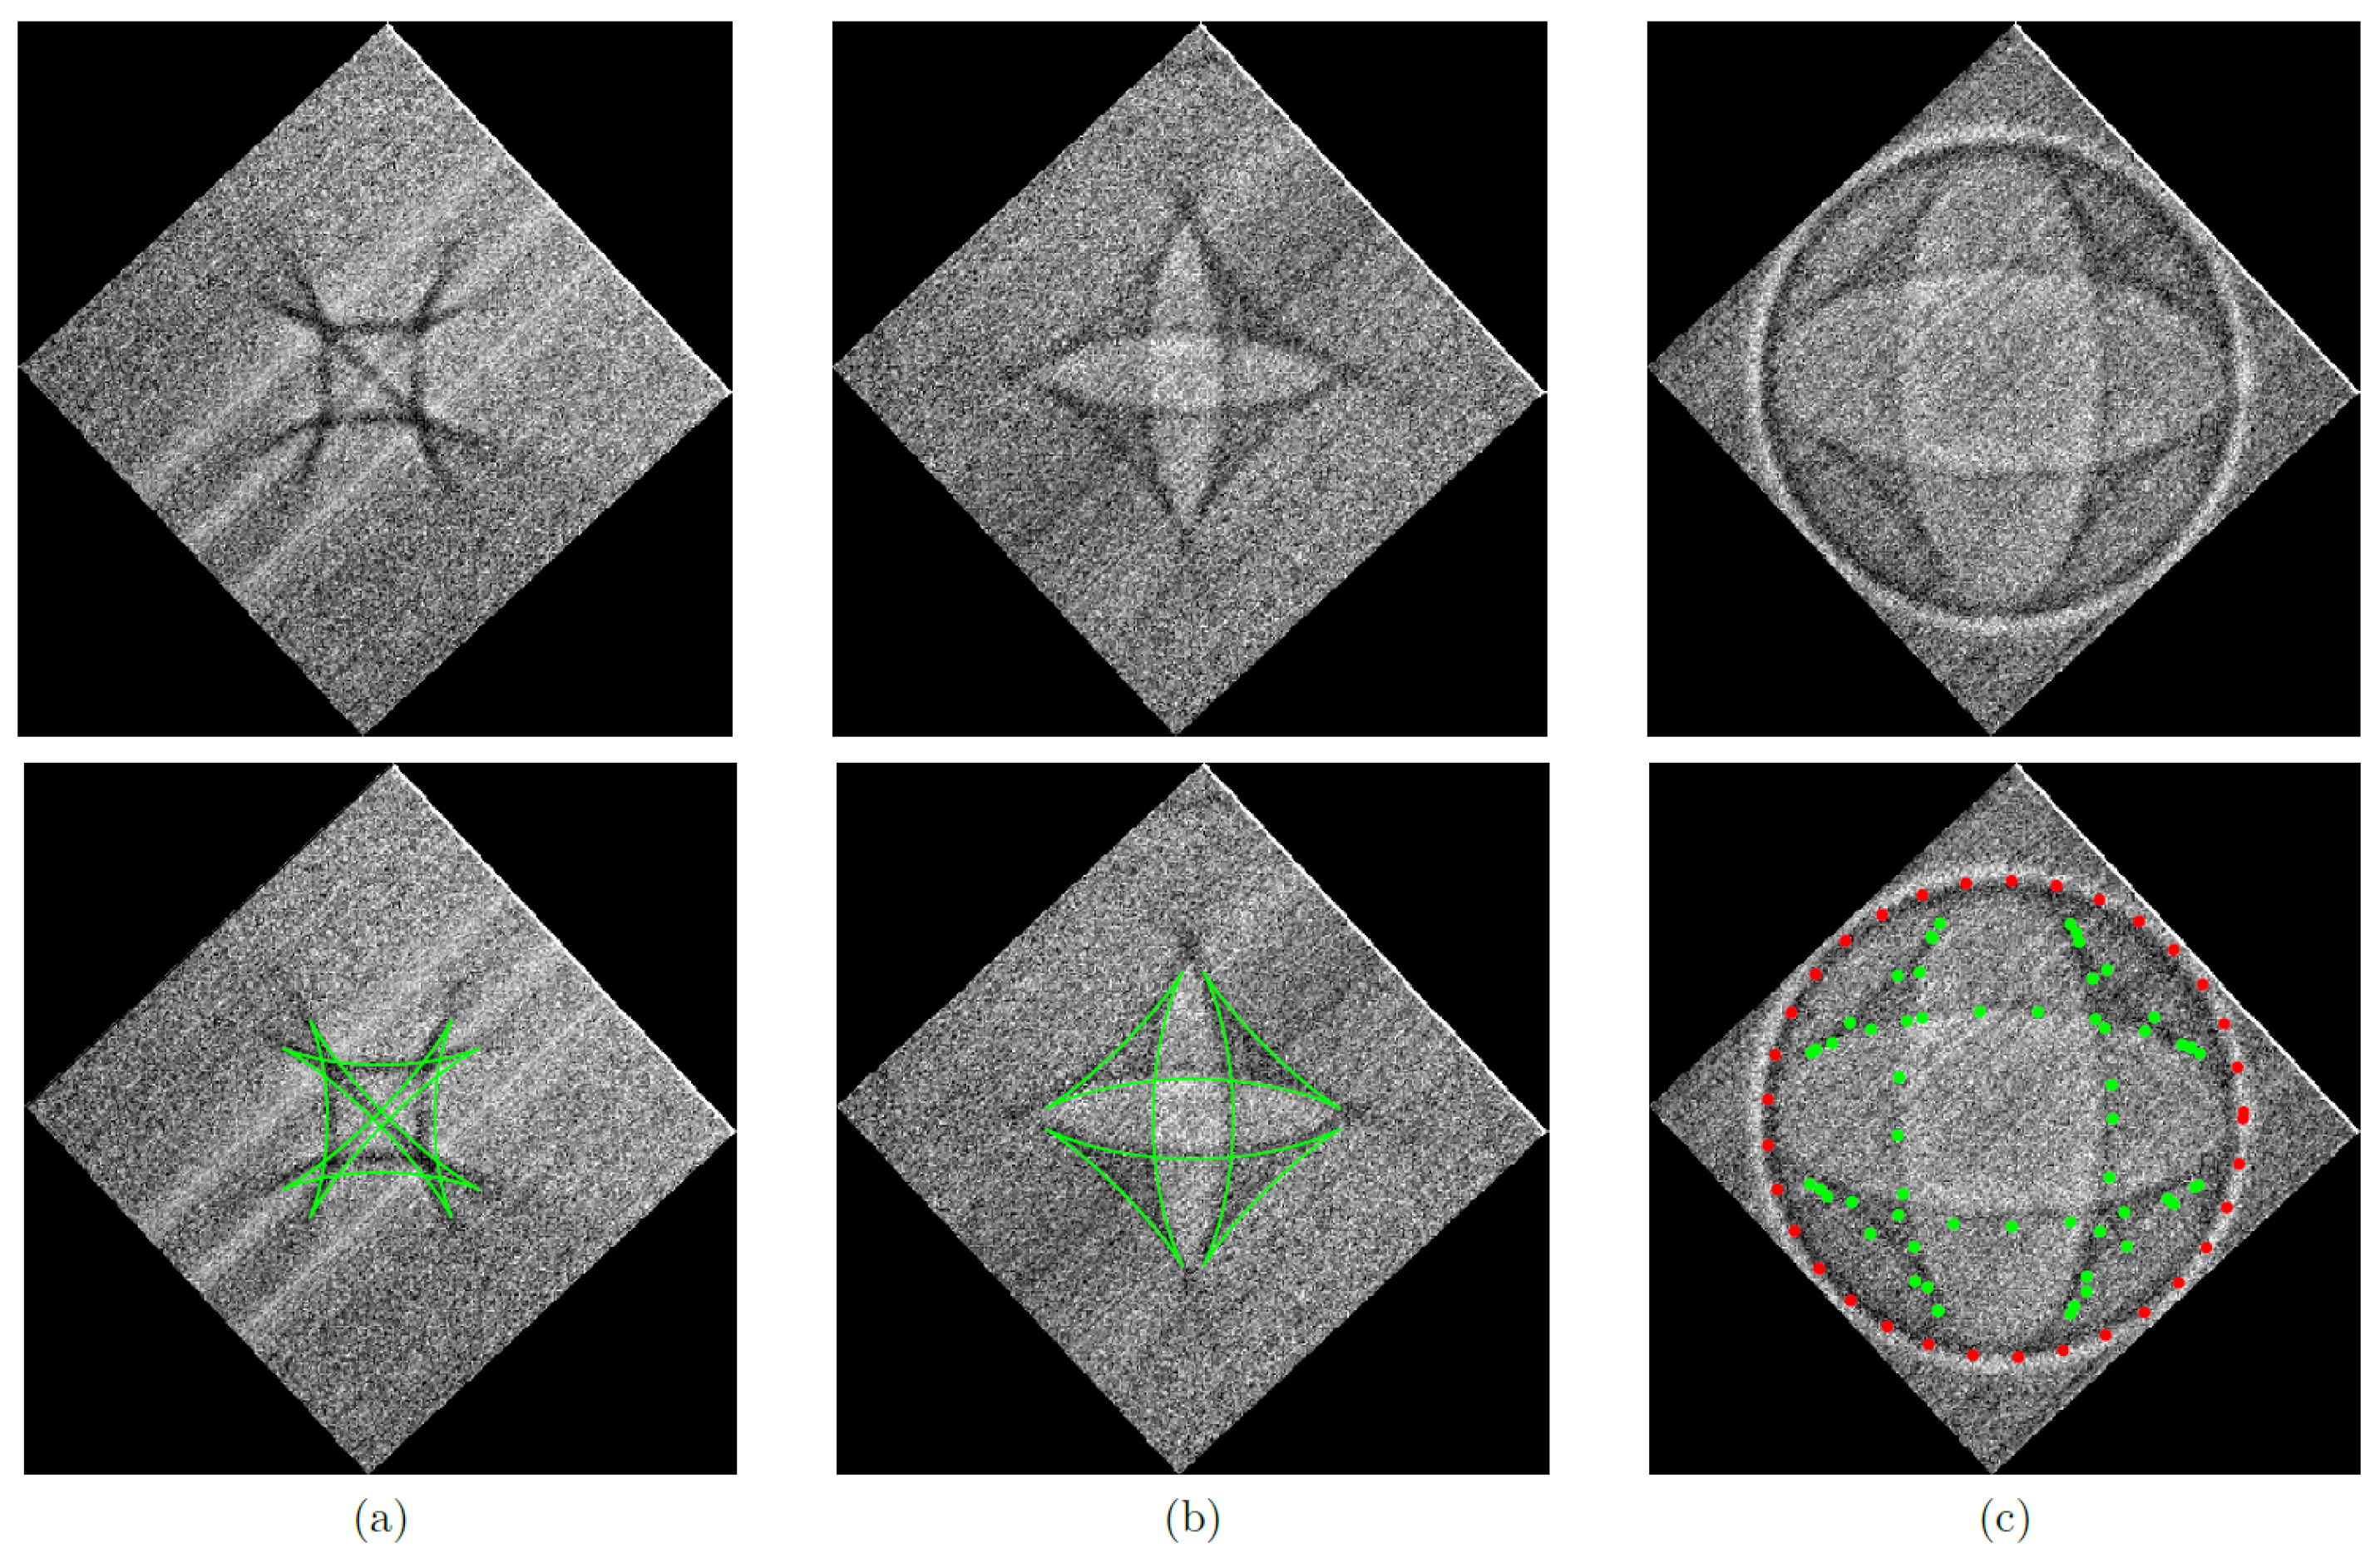
4.1. “Phonon Focusing” at High Pressure: Experimental Principles and Data Analysis

In the preceding studies on Fe-Si alloys, the travel time determination was typically similar to what was usually done at MHz frequencies using the pulse-echo ultrasonic technique.
Because of the acoustic far field diffraction limit, the pump beam mainly generated a longitudinal acoustic strain field such that no shear wave could be detected by the probe. In order to circumvent this “shearless” limitation, we demonstrated in a previous study [42] that lateral compressive stresses (producing internal diffraction) could be produced through a minimization of the source area with respect to the characteristic acoustic wavelength. Similarly to the well-known phonon focusing technique [43], we developed a wavefront “imagery method” that could be used to extract the complete set of elastic constants as a function of pressure. The prototypical case of silicon single crystals was studied and described in the following, demonstrating the high accuracy of such method.
We here used a thin platelet single-crystal of silicon oriented along [100] (dimensions were about 70 × 70 μ m 2 ). As transducers, thin films (50 nm) of aluminum were sputtered on both sides of the single-crystal platelet. From data at ambient conditions [6] and the picosecond measurement of the travel time, we determined the thickness of the sample to be 42.2(1) μ m. This sample was loaded within a DAC, using neon as the pressure transmitting medium and a ruby chip in order to determine the pressure.
For each pressure point, we then used the picosecond setup to image the acoustical surface energy of the sample, as described in [16,42]. The main issue here was the data analysis, as the determination of the elastic constants of a single-crystal through the measurement of its surface energy was a typical inverse problem. Apart from very few cases that could be analytically solved [44], a numerical procedure needed to be developed in order to extract with a high accuracy the complete set of elastic constants from the raw data. Such a procedure was particularly crucial within the context of high pressure data analysis.
In this work, we considered a large number N of experimental velocities v exp m in well-chosen directions. Indeed, by working on pre-aligned samples or with known orientations, experimental velocities could be measured in the plane (100) giving access to C 11 and C 44 , and (110) ( θ = 45 ) for C 12 (for a cubic symmetry). For each direction, the corresponding experimental velocity was the solution of the Christoffel equation.
Theoretical velocities v e th were calculated for several pump-probe delays (identical to the experimental delays) and in several directions for a given elastic tensor C i j k l . Taking into account the laser characteristics (to determine the pump-probe delay), the density ρ and the thickness of the sample e and its initial input values C i j k l 0 were approximated from the expected elastic constants. To estimate the agreement between the experimental and theoretical velocities, the χ 2 test was chosen, assuming that the experimental velocities followed a normal distribution, centered around theoretical velocities:
χ 2 = m = 1 N [ v th e ( n i , C i j k l , ρ ) v exp m ] 2 σ m 2 .
where the parameter σ m corresponds to the estimated uncertainty associated with the m th experimental velocity measurement. The procedure to optimize the elastic constants (schematized by a diagram giving in Figure 6) then consisted of minimizing the difference between the experimental and theoretical velocities by a least squares method.
The optimization procedure converged towards optimized elastic constants according to the initialization values C i j k l 0 given to the algorithm, but the latter succeeded in most cases (except in values much too higher/inferior compared to those expected) to find the expected values. The accuracy on the calculation of elastic constants by the inverse problem depended on the number of experimental velocities considered: the more there were, the more precise the calculation was.

4.2. Ambient Conditions Elastic Constants

Past work [45,46] at ambient conditions showed that pulling part of the diffraction effects, it was possible through a reduction of the pump laser spot to generate and detect transverse waves by picosecond acoustics. Following such a technique, the Christoffel equation was here solved for a set of wave vectors k lying within 45 degrees (cubic symmetry) around the [100] crystallographic direction of our silicon single crystal ( ρ = 2.331 g·cm 3 ). For the three acoustical polarizations, we calculated from ray theory [47] the set of elastic constants that produced the observed slowness curves and the wave front curves within a surface section in the plane (100) (see Figure 7).
The simulated process of the wave surfaces, where the elastic constants were the fitting parameters, well reproduced the experimental pattern and gave rise to an elastic tensor in very good agreement with previously published data [6,48]. We here emphasize that, for a given thermodynamical condition (ambient or high pressures), successive patterns at different pump-probe delays could be used to renew the fitting process in order to determine the complete set of elastic constants with an exceptional accuracy (see Figure 8).

4.3. High Pressure Dependence of the Complete Set of Elastic Constants

Using the procedure described previously and illustrated in Figure 6, we simulated for each high pressure point the 3D phonon imaging patterns for the three acoustic polarizations. Sound velocities and elastic constants of a Si cubic single crystal were then deduced from high pressure picosecond measurements in DAC. The high accuracy of such technique allowed fitting the C 11 ), C 44 , and C 12 high pressure data point with a second-order polynomial regression (data in GPa):
  • C 11 (P) = 165.7 + 4.73P − 0.09P 2 ;
  • C 12 (P) = 63.60 + 5.78P − 0.12P 2 ;
  • C 44 (P) = 80 GPa (constant)
Finally, using the experimental values of C I J (p), the highly accurate and free-hypothesis equation of state B(p) was determined.
A second-order polynomial curve well reproduced the experimental pressure dependence of the bulk modulus with: B(P) = 97.60 + 5.74P − 0.16P 2 , in excellent agreement with a fourth-order regression of the elastic energy with respect to the strain giving: B’ = dB/dP = 5.08 − 0.24P.

5. Conclusions

In conclusion, we showed that the adaptation of picosecond acoustics for measurements in diamond anvil cell opens a wide landscape of new experimental research opportunities. Complementary to the ongoing efforts focused on the use of large facilities, this new high pressure technique allows for determination of the sound velocity as a function of density over a pressure and temperature range one order of magnitude higher than what was previously attainable in both poly- and single-crystalline materials, including metallic samples.
In a first example, we showed that the compressional and shear properties of Fe-Si alloys were incompatible with seismic observations of Earth’s inner core [28]. By combining measurements of the P-V-T EoS and compressional sound velocities of Fe5Si, it was shown that Fe-Si alloys whose velocities were expected to get close to seismological observations were too dense at relevant temperatures, and thus, significant quantities of other elements were needed to describe the elastic properties of Earth’s inner core.
A second example showed that this technique is an adequate tool to extract at high pressure the complete set of elastic constants of single-crystalline silicon with an outstanding accuracy. This study demonstrated that picosecond acoustics in DAC enabled nonlinear acoustics, anisotropy, the equation of state, as well as structural stability measurement on single crystals, whatever the sample.
Finally, and from a more general point of view, we here emphasize that combined with laser heating, this technique would also open a way of determining the sound velocity under the thermodynamical conditions of the Earth’s core (around three million atmospheres and 6000 K). Due to the shorter time scale of the experiments, the temperature stability of the laser was less technically challenging, and there was a lower chance for chemical reaction between the Fe-bearing sample and diamonds. Such measurements will be crucial to new and exciting advances in our comprehension of the properties of the Earth’s deep interior.

Author Contributions

Software M.M. and Y.G.; investigation F.D., E.E., M.G., D.A., S.A., S.B., P.P.; data curation, F.D., E.E., M.G., S.A., T.D.; writing—original draft preparation, F.D.; writing—review and editing F.D. and E.E.; supervision F.D.; project administration, D.A.; funding acquisition, D.A. All authors have read and agreed to the published version of the manuscript.

Funding

This project received funding from the European Research Council (ERC) under the European Union’s Horizon 2020 research and innovation program (Grant Agreement No. 724690).

Conflicts of Interest

The authors declare no conflict of interest.

References

  1. Anderson, O.; Isaak, D. Another look at the core density deficit of Earth’s outer core. Phys. Earth Planet. Int. 2002, 131, 19–27. [Google Scholar] [CrossRef]
  2. Kong, Y.; Dolgov, O.; Jepsen, O.; Andersen, O. Electron-phonon interaction in the normal and superconducting states of MgB2. Phys. Rev. B 2001, 64. [Google Scholar] [CrossRef] [Green Version]
  3. Gregoryanz, E.; Degtyareva, O.; Somayazulu, M.; Hemley, R.J.; Mao, H.K. Melting of Dense Sodium. Phys. Rev. Lett. 2005, 94, 185502. [Google Scholar] [CrossRef] [PubMed]
  4. Tang, Z.; Zhao, H.; Li, G.; Aluru, N.R. Finite-temperature quasicontinuum method for multiscale analysis of silicon nanostructures. Phys. Rev. B 2006, 74, 064110. [Google Scholar] [CrossRef] [Green Version]
  5. Decremps, F.; Datchi, F.; Polian, A. Hypersonic velocity measurement using Brillouin scattering technique. Application to water under high pressure and temperature. Ultrasonics 2006, 44, E1495–E1498. [Google Scholar] [CrossRef]
  6. McSkimin, H.; Andreacht, P. Elastic moduli of silicon vs hydrostatic pressure at 25 degrees C and −195.8 degrees C. J. Appl. Phys. 1964, 35, 2161. [Google Scholar] [CrossRef]
  7. Li, B.; Gwanmesia, G.D.; Liebermann, R.C. Sound velocities of olivine and beta polymorphs of Mg2SiO4 at Earth’s transition zone pressures. Geophys. Res. Lett. 1996, 23, 2259–2262. [Google Scholar] [CrossRef]
  8. Gauthier, M.; Lheureux, D.; Decremps, F.; Fischer, M.; Itié, J.P.; Syfosse, G.; Polian, A. High-pressure ultrasonic setup using the Paris–Edinburgh press: Elastic properties of single crystalline germanium up to 6 GPa. Rev. Sci. Instrum. 2003, 74, 3712–3716. [Google Scholar] [CrossRef]
  9. Krisch, M.; Loubeyre, P.; Ruocco, G.; Sette, F.; Cunsolo, A.; D’Astuto, M.; LeToullec, R.; Lorenzen, M.; Mermet, A.; Monaco, G.; et al. Pressure evolution of the high-frequency sound velocity in liquid water. Phys. Rev. Lett. 2002, 89. [Google Scholar] [CrossRef] [Green Version]
  10. Antonangeli, D.; Occelli, F.; Requardt, H.; Badro, J.; Fiquet, G.; Krisch, M. Elastic anisotropy in textured hcp-iron to 112 GPa from sound wave propagation measurements. Earth Planet. Sci. Lett. 2004, 225, 243–251. [Google Scholar] [CrossRef]
  11. Decremps, F.; Fischer, M.; Polian, A.; Sieskind, M. Elasticity of BaFCl single crystal under hydrostatic pressure. Eur. Phys. J. B 1998, 5, 7–13. [Google Scholar] [CrossRef]
  12. Jacobsen, S.D.; Reichmann, H.J.; Spetzler, H. Advances in High-Pressure Technology for Geophysical Applications; Chen, J., Wang, Y., Duffy, T.S., Shen, G., Dobrzhinetskaya, L., Eds.; Cambridge University Press: Cambridge, UK, 2005; p. 25. [Google Scholar]
  13. Maris, H. Picosecond ultrasonics. Sci. Am. 1998, 278, 86–89. [Google Scholar] [CrossRef]
  14. Matsuda, O.; Larciprete, M.C.; Li Voti, R.; Wright, O.B. Fundamentals of picosecond laser ultrasonics. Ultrasonics 2015, 56, 3–20. [Google Scholar] [CrossRef] [PubMed]
  15. Wright, O.B.; Perrin, B.; Matsuda, O.; Gusev, V.E. Optical excitation and detection of picosecond acoustic pulses in liquid mercury. Phys. Rev. B 2008, 78, 024303. [Google Scholar] [CrossRef]
  16. Decremps, F.; Belliard, L.; Gauthier, M.; Perrin, B. Equation of state, stability, anisotropy and nonlinear elasticity of diamond-cubic (ZB) silicon by phonon imaging at high pressure. Phys. Rev. B 2010, 82. [Google Scholar] [CrossRef] [Green Version]
  17. Decremps, F.; Belliard, L.; Couzinet, B.; Vincent, S.; Munsch, P.; Le Marchand, G.; Perrin, B. Liquid mercury sound velocity measurements under high pressure and high temperature by picosecond acoustics in a diamond anvils cell. Rev. Sci. Instrum. 2009, 80. [Google Scholar] [CrossRef] [PubMed] [Green Version]
  18. Decremps, F.; Belliard, L.; Perrin, B.; Gauthier, M. Sound velocity and absorption measurements under high pressure using picosecond ultrasonics in a diamond anvil cell: Application to the stability study of AlPdMn. Phys. Rev. Lett. 2008, 100. [Google Scholar] [CrossRef] [Green Version]
  19. Decremps, F.; Gauthier, M.; Ayrinhac, S.; Bove, L.; Belliard, L.; Perrin, B.; Morand, M.; Le Marchand, G.; Bergame, F.; Philippe, J. Picosecond acoustics method for measuring the thermodynamical properties of solids and liquids at high pressure and high temperature. Ultrasonics 2015, 56, 129–140. [Google Scholar] [CrossRef]
  20. Ayrinhac, S.; Gauthier, M.; Le Marchand, G.; Morand, M.; Bergame, F.; Decremps, F. Thermodynamic properties of liquid gallium from picosecond acoustic velocity measurements. J. Phys. Condens. Matter 2015, 27, 275103. [Google Scholar] [CrossRef]
  21. Ayrinhac, S.; Gauthier, M.; Bove, L.E.; Morand, M.; Le Marchand, G.; Bergame, F.; Philippe, J.; Decremps, F. Equation of state of liquid mercury to 520 K and 7 GPa from acoustic velocity measurements. J. Chem. Phys. 2014, 140, 244201. [Google Scholar] [CrossRef] [Green Version]
  22. Dziewonski, A.M.; Anderson, D.L. Preliminary reference Earth model. Phys. Earth Planet. Int. 1981, 25, 297–356. [Google Scholar] [CrossRef]
  23. Mao, H.K.; Hu, Q.; Yang, L.; Liu, J.; Kim, D.Y.; Meng, Y.; Zhang, L.; Prakapenka, V.B.; Yang, W.; Mao, W.L. When water meets iron at Earth’s core–mantle boundary. Natl. Sci. Rev. 2017, 4, 870–878. [Google Scholar] [CrossRef]
  24. Dasgupta, R.; Hirschmann, M.M. The deep carbon cycle and melting in Earth’s interior. Earth Planet. Sci. Lett. 2010, 298, 1–13. [Google Scholar] [CrossRef]
  25. Siebert, J.; Badro, J.; Antonangeli, D.; Ryerson, F.J. Terrestrial Accretion Under Oxidizing Conditions. Science 2013, 339, 1194–1197. [Google Scholar] [CrossRef] [PubMed] [Green Version]
  26. Fischer, R.A.; Nakajima, Y.; Campbell, A.J.; Frost, D.J.; Harries, D.; Langenhorst, F.; Miyajima, N.; Pollok, K.; Rubie, D.C. High pressure metal-silicate partitioning of Ni, Co, V, Cr, Si, and O. Geochim. Cosmochim. Acta 2015, 167, 177–194. [Google Scholar] [CrossRef] [Green Version]
  27. Edmund, E.; Antonangeli, D.; Decremps, F.; Morard, G.; Ayrinhac, S.; Gauthier, M.; Boulard, E.; Mezouar, M.; Hanfland, M.; Guignot, N. Structure and elasticity of cubic Fe-Si alloys at high pressures. Phys. Rev. B 2019, 100, 134105. [Google Scholar] [CrossRef]
  28. Edmund, E.; Antonangeli, D.; Decremps, F.; Miozzi, F.; Morard, G.; Boulard, E.; Clark, A.N.; Ayrinhac, S.; Gauthier, M.; Morand, M.; et al. Velocity-Density Systematics of Fe-5wt%Si: Constraints on Si Content in the Earth’s Inner Core. J. Geophys. Res. Solid Earth 2019, 124, 3436–3447. [Google Scholar] [CrossRef]
  29. Antonangeli, D.; Morard, G.; Paolasini, L.; Garbarino, G.; Murphy, C.A.; Edmund, E.; Decremps, F.; Fiquet, G.; Bosak, A.; Mezouar, M.; et al. Sound velocities and density measurements of solid hcp-Fe and hcp-Fe-Si (9 wt.%) alloy at high pressure: Constraints on the Si abundance in the Earth’s inner core. Earth Planet. Sci. Lett. 2018, 482, 446–453. [Google Scholar] [CrossRef]
  30. Takemura, K. Evaluation of the hydrostaticity of a helium-pressure medium with powder X-ray diffraction techniques. J. Appl. Phys. 2001, 89, 662. [Google Scholar] [CrossRef]
  31. Finger, L.W.; Hazen, R.M.; Zou, G.; Mao, H.K.; Bell, P.M. Structure and compression of crystalline argon and neon at high pressure and room temperature. Appl. Phys. Lett. 1981, 39, 892. [Google Scholar] [CrossRef]
  32. Loubeyre, P.; Besson, J.M.; Pinceaux, J.P.; Hansen, J.P. High-Pressure Melting Curve of 4He. Phys. Rev. Lett. 1982, 49, 1172. [Google Scholar] [CrossRef]
  33. Klotz, S.; Chervin, J.C.; Munsch, P.; Marchand, G.L. Hydrostatic limits of 11 pressure transmitting media. J. Phys. D Appl. Phys. 2009, 42, 075413. [Google Scholar] [CrossRef]
  34. Dorfman, S.M.; Prakapenka, V.B.; Meng, Y.; Duffy, T.S. Intercomparison of pressure standards (Au, Pt, Mo, MgO, NaCl and Ne) to 2.5 Mbar. J. Geophys. Res. Solid Earth 2012, 117, B08210. [Google Scholar] [CrossRef]
  35. Decremps, F.; Antonangeli, D.; Gauthier, M.; Ayrinhac, S.; Morand, M.; Le Marchand, G.; Bergame, F.; Philippe, J. Sound velocity of iron up to 152 GPa by picosecond acoustics in diamond anvil cell. Geophys. Res. Lett. 2014, 41, 1459–1464. [Google Scholar] [CrossRef]
  36. Mao, H.K.; Badro, J.; Shu, J.; Hemley, R.J.; Singh, A.K. Strength, anisotropy, and preferred orientation of solid argon at high pressures. J. Phys. Condens. Matter 2006, 18, 963. [Google Scholar] [CrossRef]
  37. Marquardt, H.; Speziale, S.; Gleason, A.; Sinogeikin, S.; Kantor, I.; Prakapenka, V.B. Brillouin scattering and X-ray diffraction of solid argon to 65 GPa and 700 K: Shear strength of Argon at HP/HT. J. Appl. Phys. 2013, 114, 093517. [Google Scholar] [CrossRef] [Green Version]
  38. Martorell, B.; Wood, I.G.; Brodholt, J.; Vocadlo, L. The elastic properties of hcp-Fe1-xSix at Earth’s inner-core conditions. Earth Planet. Sci. Lett. 2016, 451, 89–96. [Google Scholar] [CrossRef] [Green Version]
  39. Mao, Z.; Lin, J.F.; Liu, J.; Alatas, A.; Gao, L.; Zhao, J.; Mao, H.K. Sound velocities of Fe and Fe-Si alloy in the Earth’s core. Proc. Natl. Acad. Sci. USA 2012, 109, 10239–10244. [Google Scholar] [CrossRef] [Green Version]
  40. Sakairi, T.; Sakamaki, T.; Ohtani, E.; Fukui, H.; Kamada, S.; Tsutsui, S.; Uchiyama, H.; Baron, A.Q. Sound velocity measurements of hcp Fe-Si alloy at high pressure and high temperature by inelastic X-ray scattering. Am. Mineral. 2018, 103, 85. [Google Scholar] [CrossRef]
  41. Lin, J.F.; Struzhkin, V.V.; Sturhahn, W.; Huang, E.; Zhao, J.; Hu, M.Y.; Alp, E.E.; Mao, H.k.; Boctor, N.; Hemley, R.J. Sound velocities of iron-nickel and iron-silicon alloys at high pressures. Geophys. Res. Lett. 2003, 30, 2112. [Google Scholar] [CrossRef] [Green Version]
  42. Decremps, F.; Belliard, L.; Perrin, B. Structure and elasticity of single-crystals by phonon imaging at high pressure. Acta Crystallogr. A Found. Adv. 2011, 67, C111–C112. [Google Scholar] [CrossRef] [Green Version]
  43. Hurley, D.; Wolfe, J. Phonon Focusing in Cubic-Crystals. Phys. Rev. B 1985, 32, 2568–2587. [Google Scholar] [CrossRef] [PubMed]
  44. Buchwald, V.; Davis, A. Surface waves in anisotropic elastic media. Nature 1961, 191, 899. [Google Scholar] [CrossRef]
  45. Audoin, B.; Bescond, C.; Deschamps, M. Measurement of stiffness coefficients of anisotropic materials from pointlike generation and detection of acoustic waves. J. Appl. Phys. 1996, 80, 3760–3771. [Google Scholar] [CrossRef]
  46. Rossignol, C.; Rampnoux, J.M.; Perton, M.; Audoin, B.; Dilhaire, S. Generation and Detection of Shear Acoustic Waves in Metal Submicrometric Films with Ultrashort Laser Pulses. Phys. Rev. Lett. 2005, 94, 166106. [Google Scholar] [CrossRef] [PubMed]
  47. Auld, B.A. Acoustic Fields and Waves in Solids; Malabar, F.L., Ed.; R.E. Krieger Publishing Company: Malabar, FL, USA, 1990; Volume I. [Google Scholar]
  48. McSkimin, H.; Andreacht, P. Measurement of 3-order moduli of silicon and germmanium. J. Appl. Phys. 1964, 35, 3312. [Google Scholar] [CrossRef]
Figure 1. Femtosecond laser light pulse used here as a kind of ultimate “hammer” to generate an ultrashort (ps) acoustic strain. (Top) The pump is focused on one surface of the sample (focused spot of about 3 μ m) through a diamond window and absorbed on a length scale of ξ ( 10 nm). As soon as the pump laser pulse reaches the surface, it creates a sudden and small temperature increase Δ T (less than 10 K). (Bottom) The change of temperature relaxes by launching an acoustic strain field (with frequency typically on the order of GHz in a metallic liquid) propagating at the sound velocity v l (the laser probe is here focused on the opposing face of the sample with respect to the pump beam).
Minerals 10 00214 g001
Figure 2. (Top) Schematic [19] of the diamond anvil cell (DAC)/picosecond acoustics setup (transmission geometry) within the reflectometry configuration (one diode detection). (Bottom) Interferometric setup (both the real and imagery part of the reflectivity are measured using a Michelson interferometer). PBS: polarizing beam-splitter, λ /4: quarter wave plate, λ /2: half-wave plate, pol.: linear polarizer, A.O.M.: acousto-optic modulator. A and B: diodes.
Minerals 10 00214 g002
Figure 3. bcc-hcp transition observed by PA time domain measurements for Fe10Si. The signal shows a sharp, well-defined initial acoustic echo above and below the transition region observed by XRD [27].
Minerals 10 00214 g003
Figure 4. Normalized travel time t / t 0 vs P for different runs on Fe5Si (up) and Fe10Si (down). The bcc-hcp transition results in a significant reduction in the scatter of the measured travel times for Fe5Si. We also note that sample tilt within the sample chamber has a negligible effect on measured travel times due to the instrumental configuration used. Run numbers indicate the number of each experimental run for a given alloy, and Samples 1 and 2 for Fe10Si indicate two separate samples co-compressed in one experimental run.
Minerals 10 00214 g004
Figure 5. Vp vs. P for Fe (left triangles, labeled Fe [35]), Fe5Si (squares), and Fe10Si (up-triangles) compressed quasi-hydrostatically. While at the transition for Fe, there is a sharp increase in Vp, this does not occur in Fe5Si and Fe10Si, possibly due to a change in the bcc-hcp transition mechanism with Si addition [27]. Errors in Vp were about 2% up to 60 GPa, and up to 3% at higher pressures.
Minerals 10 00214 g005
Figure 6. Calculation procedure for the determination of the complete set of elastic constants C i j k l using experimental measurements of 3D phonon imaging patterns of single crystals.
Minerals 10 00214 g006
Figure 7. Group velocity surfaces at ambient conditions along the [100] symmetry axis of ZB-cubic silicon. The pump probe delay time here is 3.5 ns. Red, blue, and green dashed lines correspond respectively to the longitudinal, fast, and slow transversal group velocities. Right: surface wave sections along the (100) plane of a cubic zincblende structure)
Minerals 10 00214 g007
Figure 8. Top panel: Experimental phonon imaging pattern (100 × 100 μ m 2 ) in the (100) plane of silicon at three different delay times: (a) 8.3 ns, (b) 9.6 ns, and (c) 10.7 ns. Lower panel: Comparison between simulation and experimental phonon imaging patterns using C 11 = 165.7 GPa, C 12 = 63.9 GPa, and C 44 = 79.5 GPa.
Minerals 10 00214 g008

