Article

Effect of Mineral Composition on Transverse Relaxation Time Distributions and MR Imaging of Tight Rocks from Offshore Ireland

1
Department of Physics and Technology, University of Bergen, 5007 Bergen, Norway
2
iCRAG, School of Earth Sciences, University College Dublin, A94T286 Dublin, Ireland
3
Department of Chemistry, University of Bergen, 5007 Bergen, Norway
*
Author to whom correspondence should be addressed.
Minerals 2020, 10(3), 232; https://doi.org/10.3390/min10030232
Submission received: 24 January 2020 / Revised: 19 February 2020 / Accepted: 1 March 2020 / Published: 3 March 2020
(This article belongs to the Special Issue Mineralogy of Shale Gas and Other Low Permeability Reservoirs)

Abstract

:
In this paper, we investigate the effect of magnetic field strength on the transverse relaxation time constant (T2) in six distinct core plugs from four different rock types (three sandstones, one basalt, one volcanic tuff and one siltstone), retrieved from offshore Ireland. The CPMG pulse-sequence was used at two different magnetic field strengths: high-field at 4.70 T and low-field at 0.28 T. Axial images of the core plugs were also acquired with the RAREst sequence at high magnetic field strength. Thin-sections of the core plugs were prepared for optical imaging and SEM analysis, and provided qualitative information on the porosity and quantification of the elemental composition of the rock material. The content of iron varied from 4 wt. % to close to zero in the rock samples. Nevertheless, the effective T2 distributions obtained at low-field were used to successfully predict the porosity of the core plugs. Severe signal attenuations from internal magnetic gradients resulted in an underestimation of the porosity at high-field. No definitive trend was identified on the evolution of discrete relaxation time components between magnetic field strengths. The low-field measurements demonstrate that NMR is a powerful quantitative tool for petrophysical rock analysis as compared to thin-section analysis. The results of this study are of interest to the research community who characterizes natural gas hydrates in tight heterogeneous core plugs, and who typically relies on MR imaging to distinguish between solid hydrates and fluid phases. It further exemplifies the importance of selecting appropriate magnetic field strengths when employing NMR/MRI for porosity calculation in tight rock.

1. Introduction

Common techniques for inspection of sedimentary structures in reservoir rocks are often limited to one or two dimensions, such as coring, photography, lacquer profiles or soil monolith. Most of these methods are destructive, and, as a result, the three-dimensional context of grains is lost. Therefore, two imaging techniques have been developed and increasingly used to image 3D pore structures of sediment cores during the last two decades: X-ray computed tomography (XCT) and magnetic resonance imaging (MRI). High-resolution XCT and micro-CT are frequently used for the investigation of internal structures of sediment cores [1], as well as 4D monitoring of fluid flow within sediment pores [2]. However, limitations of this technique include the operator dependency for the 3D image analysis from the reconstructed data, the discretization effects, and possible imaging artifacts [3]. MRI provides an alternative method for nondestructive imaging of the rock, and quantitative analysis of the pore space is achieved through nuclear magnetic resonance (NMR) measurements. MRI is a well-known technique in medical diagnosis but has also been applied to study food, animals, fossils, mummies and pottery, as well as to the mapping of structures in material science. In addition to these applications, MRI is increasingly used during laboratory rock-core-plug analysis, to visualize the distribution of fluid phases during dynamic processes [4,5,6,7]. It can also provide three-dimensional mapping of particle sorting and configuration of grains and fractures in natural sediments [1,8,9]. NMR is commonly used for logging of the borehole after the drilling of new wells. In the laboratory, NMR is typically used on rock core plugs to give quantitative information on porosity, permeability, pore size distribution and wettability [10,11,12,13,14,15].
The applicability of a given NMR magnet to be used for either MRI or NMR measurements is governed by the magnetic field strength of the associated magnet. The magnets are classified as low-field when B0 < 1 T, intermediate-field when 1 T < B0 < 3 T and high-field when B0 > 3 T [16]. MRI may be conducted at any field strength, but it is usually performed at intermediate-field. Increasing the field strength leads to better signal-to-noise ratio as more of the hydrogen protons are affected by the static magnetic field. High spatial resolution is therefore achieved on small sample sizes, using short measurement times. However, increasing the field strength has the major disadvantage of enhancing internal magnetic gradients in the rock. Internal magnetic gradients arise from the fact that the pore fluid saturating the rock (usually water) has a magnetic susceptibility that differs significantly from the solid grains constituting the matrix of the rock. This leads to internal gradients, g, with intensities scaling with the field strength, B0:
g   ~   ( Δ χ B 0 ) n ,
where Δχ is the difference in magnetic susceptibility, and n is a scaling exponent. n was measured to be close to unity in large pores in quartz sand, whereas it increased to 1.3 for smaller pores [17], approaching the theoretical limit of 1.5 [18]. The internal gradients affect the precession frequency of the hydrogen protons and each proton will have a time-dependent frequency as it diffuses through the magnetic gradients. This results in an enhanced dephasing of the phase coherence inflicted by a 90° excitation pulse and thus a shorter effective transverse relaxation time constant, T2,eff. The dephasing would be reversed in a spin-echo measurement (CPMG) if the protons were stationary during the echo train, but diffusion through the gradients hinders reestablishment of the phase coherence. The conversion from T2 distribution to pore size distribution through the following equation may therefore not be appropriate:
1 T 2 = 1 T 2 , b u l k + ρ 2 S V ,
where T2,bulk is the relaxation time of bulk liquid, ρ2 is the surface relaxivity associated with T2, and S/V is the surface-to-volume ratio of the pore space. This relation relies on fast diffusion and independent pores, as well as no internal gradients. Otherwise, it is difficult to distinguish surface relaxation from diffusive decay, depending on which length scales are dominating. In the short time regime (large pores), the measured T2,eff has an echo time dependence, while the T2,eff is independent of echo time for the motional averaging and localization regimes [19]. Diffusion was found to be the dominating relaxation mechanism in a water-saturated Bentheim sandstone, as the average T2,eff decreased for increasing field strength [19].
The successful application of Equation (2) to find the pore size distribution requires knowledge of the surface relaxivity of the pore, ρ2. This quantity is not necessarily constant for the entire grain surface and depends heavily on inclusions of paramagnetic impurities, particularly the iron content in natural rock. The microscopic interaction between the proton spin of hydrogen in a fluid molecule and the electron spin of a paramagnetic ion affects the surface relaxation significantly. The relaxivity was measured to increase linearly with the concentration of paramagnetic ions [20], which implies that T2,eff decreases compared to the same pore space without paramagnetic impurities. These short T2,eff components may not be acquired during the echo train if the echo time is insufficiently low.
The objective of this paper is to compare the distributions of T2,eff acquired with the CPMG sequence on different rock types. Two different magnetic field strengths of B0 = 4.7 T and B0 = 0.28 T were used to investigate the effect of internal magnetic gradients. Six core plugs were retrieved from boreholes drilled in three different locations in offshore Ireland and were analyzed with respect to mineral composition, by scanning electron microscopy (SEM). The amount of paramagnetic elements were quantified in each core plug and were used to interpret the resulting T2,eff distributions. Porosity estimates from T2,eff distributions were compared to porosity values obtained by mass balance calculations, and the discussion focuses on limitations of MRI when imaging the internal porous structure of tight sediment core plug samples.

2. Materials and Methods

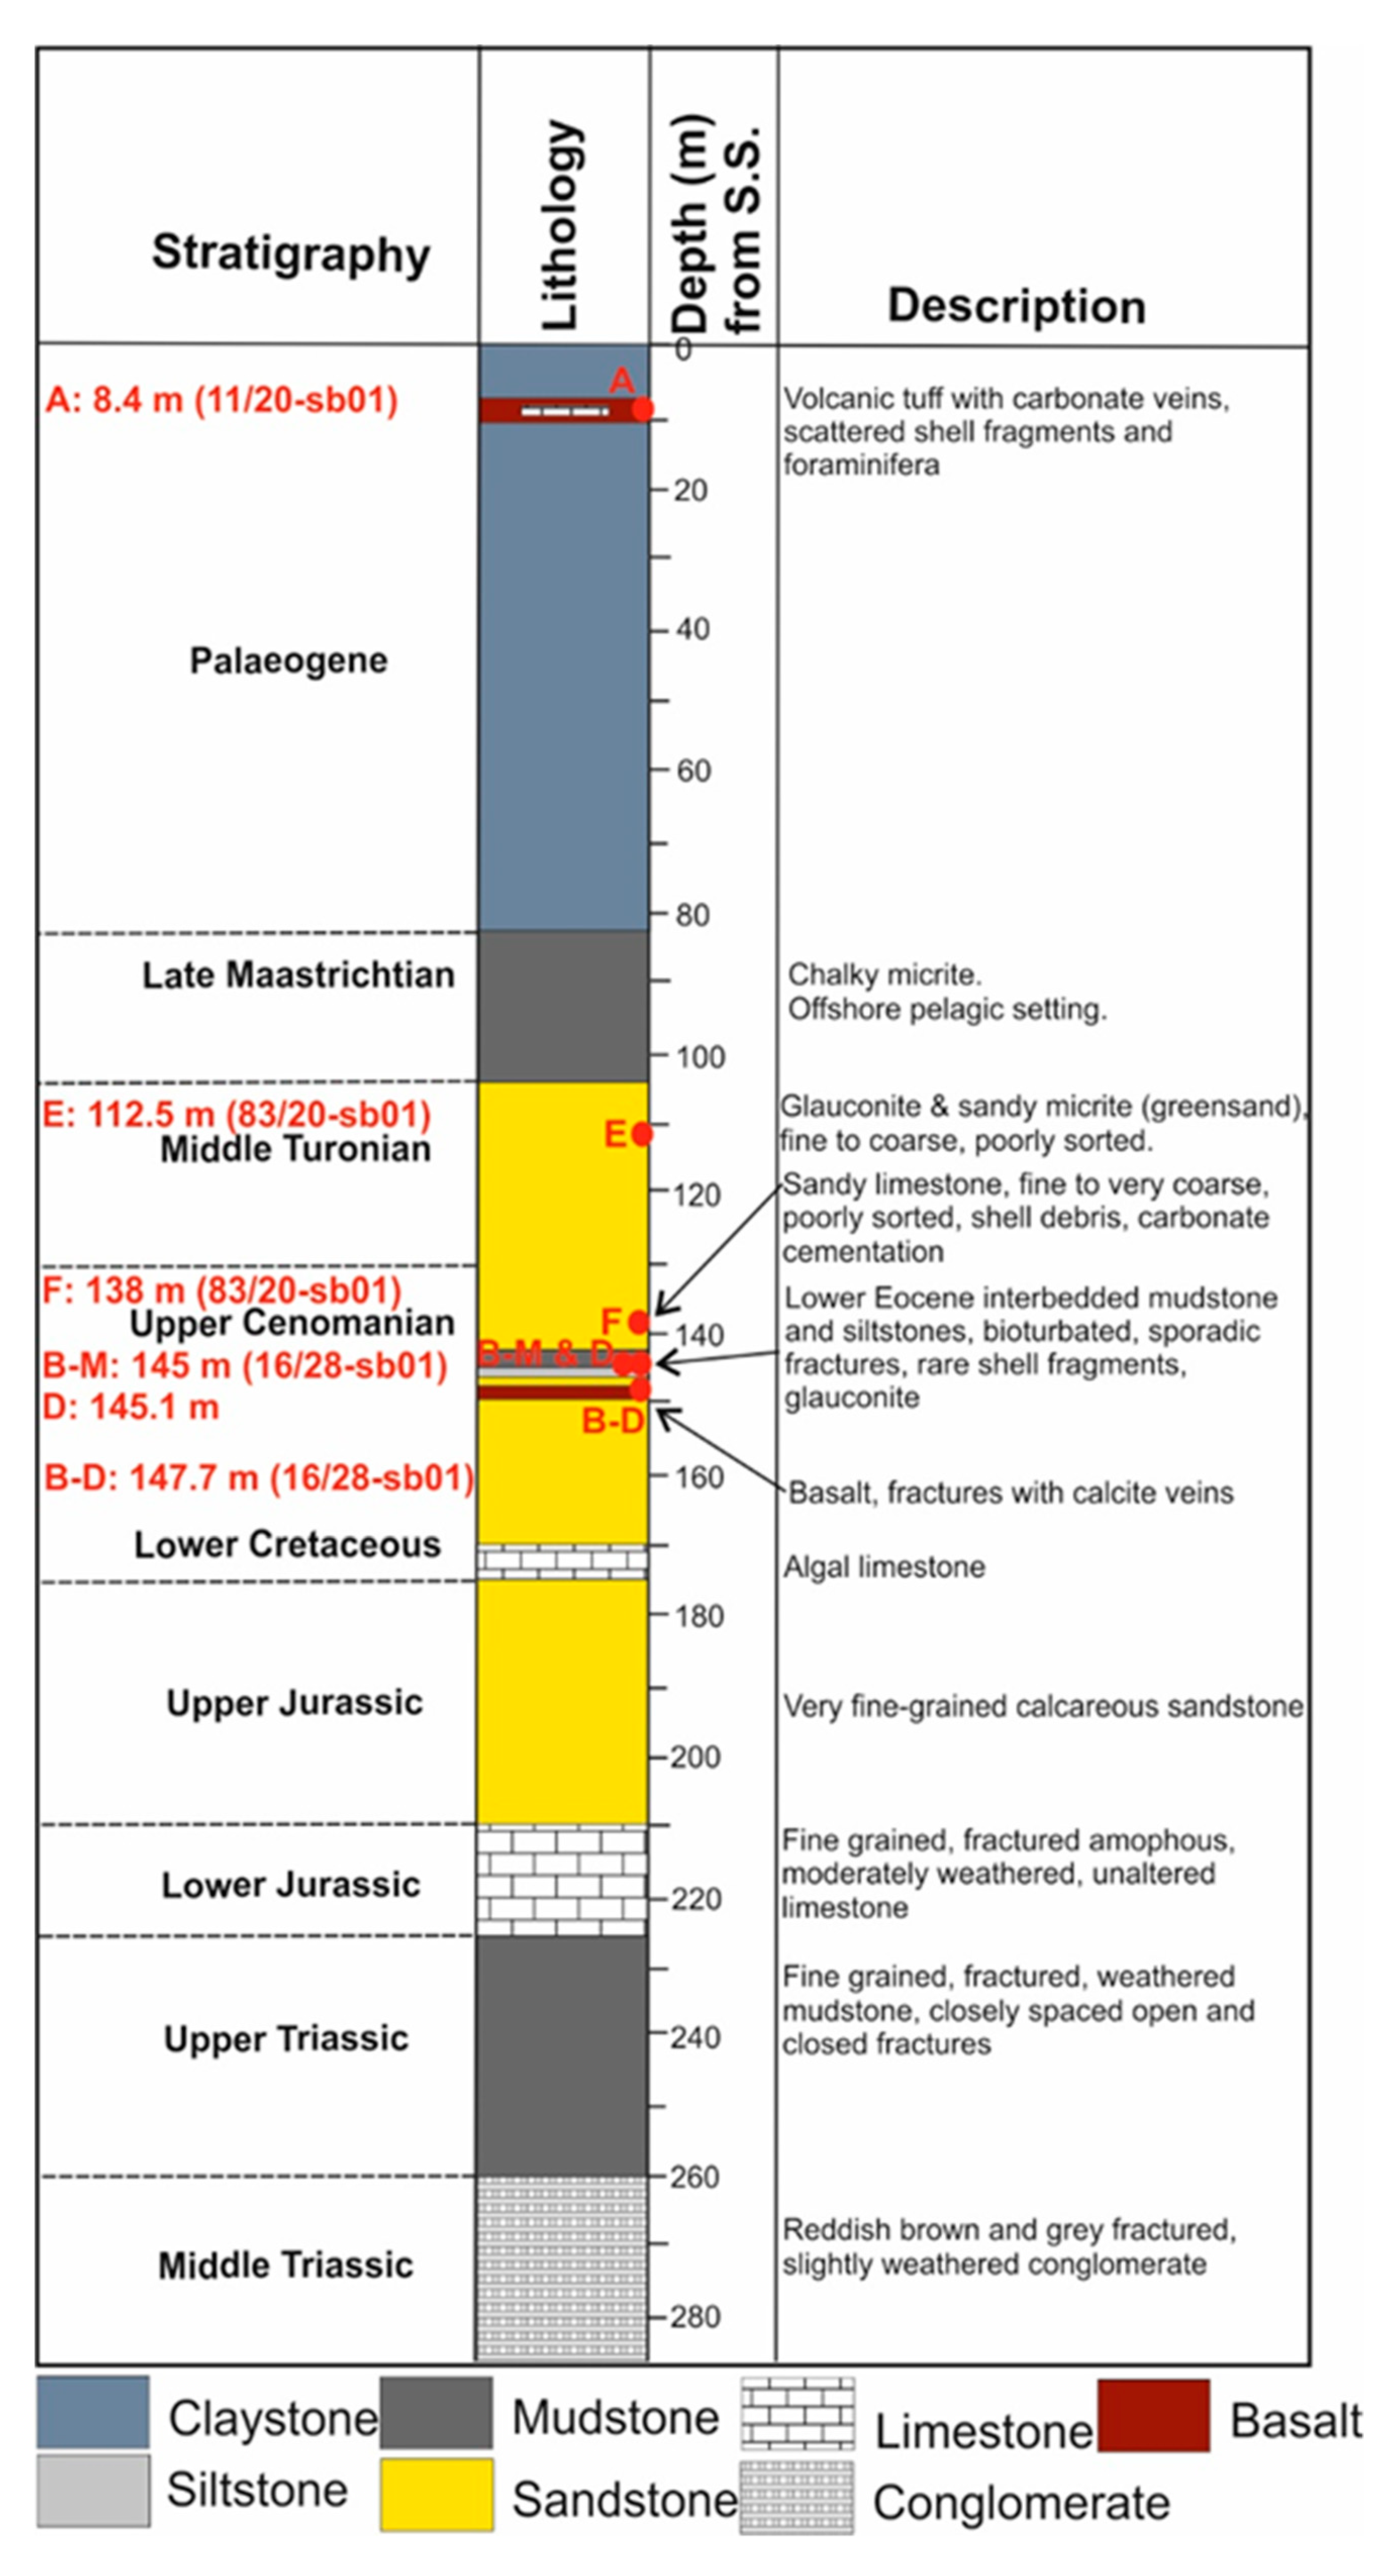
2.1. Lithological Overview

Five boreholes from four sites were drilled as part of the Rockall Studies Group (established by the Petroleum Affairs Division of Ireland), by the MV Bucentaur during the summer of 1999, as part of a wider research effort focusing on the evolution of the Rockall Basin offshore Ireland. Boreholes from three of these sites were chosen for this study, to give a range of mineralogical composition: (i) along the western slope of the Porcupine High, in close proximity to the Brona Basin (83/20-sb01), (ii) on the northern flank of Porcupine High, above the Macdara Basin (16/28-sb01) and (iii) on the Erris High (11/20-sb-01) (Figure 1). A lithological description of these boreholes was done in detail elsewhere [21] and is briefly summarized in Table 1 and Figure 2.

2.2. Core Plug Characterization

Standard (35 µm thick) polished thin-sections were cut from each core plug. A blue synthetic dye was injected to image the intergranular porosity. The thin-sections were scanned, using a Kyocera scanner, to observe the textures in the cores. The modal composition of the thin-sections was determined by using a Nikon Eclipse LV100POL light microscope. Chemical mapping of the thin-sections was done by using a Hitachi TM3030Plus Tabletop Scanning Electron Microscope fitted with an Oxford EDS detector housed at the School of Earth Sciences, University College Dublin, Dublin, Ireland. Elemental maps were acquired over thin-section surfaces (200 µm × 200 µm grid). EDS mapping of each sample took 2–3 h, using a pixel dwell time of 800 ms, resolution of 1024 and process time of 4 s. Composite color maps and histogram plots were produced by merging elemental concentration maps, using Aztec One (version 3.2) software.

2.3. Core Plug Preparation

Every core plug was dried at 70 °C for 24 h, to remove potential moisture from the grains. The diameter and length of the cylindrical core plugs were measured before the pore space was purged under vacuum. Brine containing 3.5 wt. % NaCl was used to saturate the core plugs by submerging the core plugs in brine for several days. The given amount of salt was used to mimic seawater and to prevent clay swelling in the pore space. The weight difference between water-filled cores and dried cores were used, together with the density of the water, to calculate the volume of water in each core. The porosity (frac.) was defined as follows:
Φ = V w V b ,
where Vw (mL) is the volume of water, and Vb (mL) is the bulk (total) volume of the core plug.

2.4. NMR/MRI Characterization

The high-field measurements were made with a superconductive magnet (Bruker BioSpec 47/40 USR) that has a magnetic field strength of 4.70 T (200 MHz). The spin-echo pulse-sequence CPMG [22,23] was used to generate T2,eff decay curves for each core. A total of 1024 echoes with echo spacing TE = 0.50 ms and 32 averages were detected in each scan. Inverse Laplace Transform was used to convert the decay curves to T2,eff distributions with Matlab software (provided by courtesy of Paul Callaghan), based on the Schlumberger algorithm [24]. Additionally, the cores were imaged by the 2D RAREst sequence (Rapid Acquisition with Relaxation Enhancement with short echo time). The echo time was set as low as the MR equipment allowed (TE = 4.9 ms), while keeping a voxel resolution of 1 mm x 1 mm × 5 mm in each axial slice. Each core plug was divided into 14 slices, with a slice gap of 6 mm between each slice. The repetition time was 3500 ms, and one average was used per scan, with a rare factor of two. A Maran DRX spectrometer with magnetic field strength of 0.28 T (12 MHz) was used for the low-field measurements of each core plug. The CPMG sequence was run with 10,240 echoes, with echo spacing TE = 0.20 ms and 128 averages in each scan.
The areas under the T2,eff distributions were calculated for both field strengths in each core plug and compared to the area under the T2,eff distribution of a known volume of bulk water (3.5 wt. % NaCl). The bulk water was measured at both low-field and high-field, with the same CPMG sequence as the core plugs. The volume of water in each core plug was then calculated by taking the ratio of the area under the T2,eff distribution in the core plug and the area under the T2,eff distribution of the bulk water. The porosity of each core plug was estimated by dividing the volume of water by the bulk volume, and the T2,eff porosity was compared to the known porosity calculated from weight measurements.

3. Results and Discussion

3.1. Mineralogical Composition

The six core plug samples acquired from three different boreholes were composed of a variety of sediment/rock types, ranging from siltstones/mudstones, sandstones, volcanic tuff and basalt, pertaining to various geological timescales (Figure 2). Hence, petrography and mineralogical analysis of thin-sections prepared from these six core samples provided further detailed information on their mineralogical composition and internal texture, which could possibly affect NMR measurements (Figure 3 and Figure 4).

3.1.1. Core Plug A—Volcanic Tuff

Core A was predominantly composed of Paleogene yellowish-red-to-brown tuffaceous sediments, with scattered dark-gray basalt and volcanic glass lithics. The lithic grains were commonly altered to Palagonite due to the interaction of water with basalt and glass. Different types of bioclastic grains, i.e., foraminifera and broken shell fragments, were also present. Semiquantitative EDS analysis showed that the core had high concentrations of ferromagnetic elements (iron) and paramagnetic elements (magnesium and aluminum) due to abundant basalt lithics. Bioclastic material showed some dissolution- and fracture-related porosity, which seemed to be the dominant porosity type in this core sample. The average grain size of the core sample was 368 μm.

3.1.2. Core Plug B-M—Lithic-Rich Sandstone

Core B-M was composed of Eocene-aged, coarse-grained, lithic-rich quartz sandstone. The lithic grains were predominantly of bioclastic origin, with high concentrations of calcium. The core had very small proportions of other paramagnetic elements and contained nearly no iron. The sandstones were interbedded with greenish-gray, massive, commonly bioturbated mudstones and siltstones, containing sporadic fractures. Thin-sections exhibited excellent intergranular porosity, with an average pore diameter >50 µm and average grain size of 735 μm.

3.1.3. Core Plug B-D—Basalt

Core B-D was composed of upper Cretaceous plagioclase basalt. The plagioclase phenocrysts (laths) were scattered within a highly altered fine-grained matrix. Plagioclase laths showed partial flow alignment, representing differential (shear) flow probably close to the time of solidification. The scattered brown and red patches were due to oxidation of its mafic (iron-rich) minerals into hematite, which was reflected by moderate iron and magnesium contents. The core sample had the highest amount of aluminum of all the core plugs. There was no visible porosity in the core, and the average grain size was 264 μm.

3.1.4. Core Plug D—Siltstone

Core D was composed of the Lower Eocene greenish-gray siltstones. The siltstones were commonly massive and bioturbated, with scattered lithic fragments. The two main types of lithic fragments present were bioclastic fragments and mm-size mud-chips, with rare occurrences of mica flakes. However, the concentration of bioclastic material was considerably higher than mud-chips or phyllosilicate flakes. The core had low concentrations of ferro- and paramagnetic elements. Petrographic analysis showed that the porosity was dominantly intergranular, with an average pore diameter >40 µm and average grain size of 227 μm.

3.1.5. Core Plug E—Upper Cretaceous Sandstone

Core E consisted of fine- to medium-grained, moderately to poorly sorted Upper Cretaceous quartz sandstone. The sandstone contained abundant dispersed, dark greenish-gray glauconite grains. A small proportion of lithic grains, i.e., tiny mica flakes, and mud-chips were also present. Opaque materials, likely to be iron oxides, were present in smaller proportions. Lithic grains and glauconite justified moderate to high concentrations of iron and paramagnetic elements within the sample. The sandstone was carbonate-cemented with rare matrix porosity and secondary grain dissolution porosity. The average grain size of the core sample was 464 μm.

3.1.6. Core Plug F—Mid-Cretaceous Sandstone

Core F consisted of coarse-grained, poorly sorted, mid-Cretaceous quartz sandstone. Lithic grains present within the sandstone included mudclasts and bioclastic debris. It also contained dark scattered glauconite grains. The sandstone was carbonate-cemented with small proportions of opaque grains and had no visible porosity. The average grain size of the core sample was 567 μm.

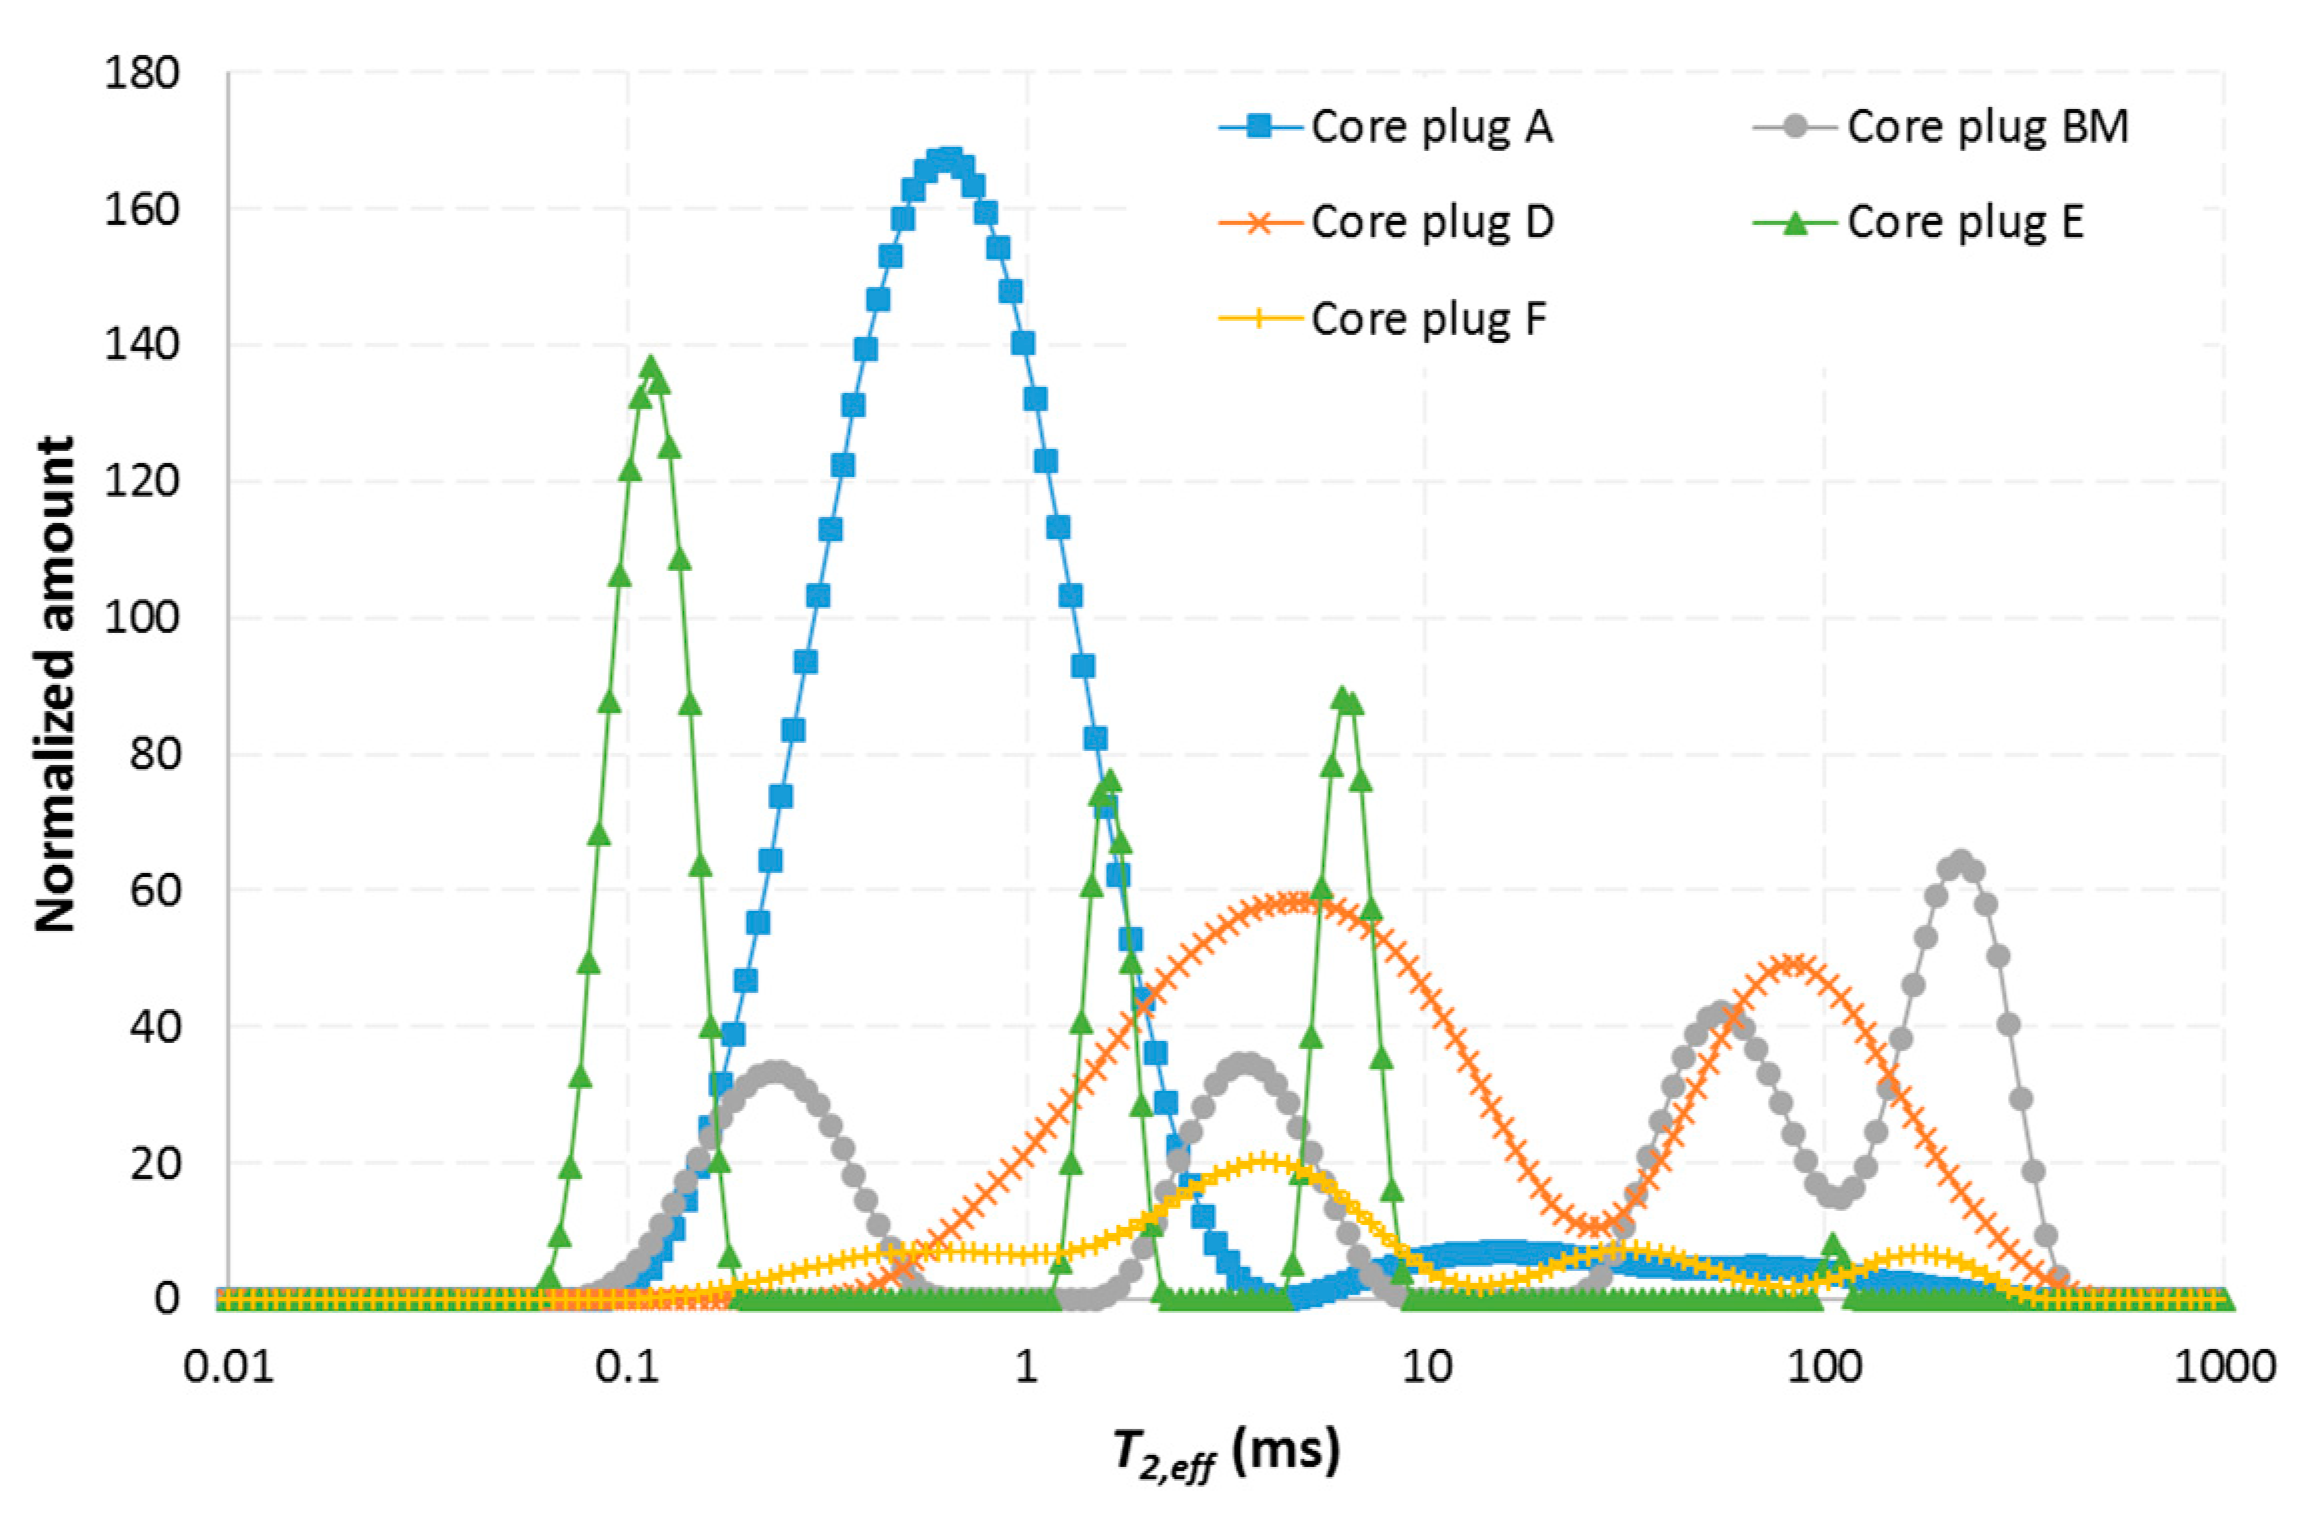
3.2. NMR/MRI Characterization

The T2,eff distribution was different for each core plug at both low magnetic field strength (Figure 5) and high magnetic field strength (Figure 6). Each distribution was polymodal with several discrete relaxation time intervals of different intensity. If the effect of internal gradients is neglected, this implies that every core plug had polymodal pore size distributions in accordance with Equation (2). However, the core plugs contained paramagnetic metal ions (Figure 4), which affect the measured transverse relaxation time significantly. The particular shape of the T2,eff distribution is likely a reflection of separate regions of local magnetic field gradients existing within each core plug, as is suggested by Mitchell et al. [19].
The effect of internal magnetic field gradients on the signal attenuation of the first echo in the CPMG decay was investigated by comparing the area under the T2,eff distribution to the porosity of the core plug. The area under the T2,eff distribution of each core plug was compared to the area under the T2,eff distribution of a known volume of bulk water (3.5 wt. % NaCl). The ratio of the areas was adjusted for the bulk volume of the core plug and used to estimate the porosity of the core plug (Table 2). The porosity calculated by the low-field distributions matched the porosity calculated by weight measurements, indicating that the effect of internal gradients was insignificant on the signal decay for B0 = 0.28 T and TE = 0.20 ms. Mitchell [25] successfully obtained the porosity of four sandstone and four limestone core plugs, at a slightly higher field strength of 0.3 T. However, the porosity was best matched in the limestone core plugs, where the effect of internal gradients was negligible. Here, the porosity match was weakest in core plug E, where the porosity calculation from low-field NMR overestimated the porosity with ~30%. This was despite the fact that the iron content in core plug E was lower than in core plug A (Figure 4). The observed mismatch in porosity estimation likely originates from the very low T2,eff time interval that was recorded in this core plug (shown in next section). The porosity would likely be matched better in core plug E if a lower echo time was used. On the contrary, the porosity could not be determined at all by the high-field measurements conducted at B0 = 4.70 T and TE = 0.50 ms. The increased internal gradients produced by the higher static magnetic field, combined with the slightly longer echo time, led to severe signal attenuation and corresponding underestimation of the porosity. The degree of porosity underestimation varied amongst the samples and was most pronounced in sample A, which contained the highest amount of iron. It was not possible to obtain T2,eff distribution curves on core plug BD with either of the magnetic field strengths. The combination of low porosity (Φ = 0.09), small pores and a high amount of iron within the matrix of the core plug (BD is an igneous/volcanic rock usually composed of iron- and magnesium-rich lava) resulted in a low signal, which was inseparable from the background noise.
Signal attenuation stemming from enhanced dephasing of the transverse phase coherence was clearly demonstrated by the RAREst images that was obtained at high-field strength (Figure 7). The core plug that gave the best image was sample D, followed by sample BM. This is consistent with the amount of iron that was present in each of these samples (Figure 4). Iron ions are paramagnetic and form several ferromagnetic phases which have very high magnetic susceptibility. The samples containing the most iron (sample A, BD, E and F) could not be visualized with the applied echo time of 4.9 ms, as the entire signal attenuated before the echo was recorded. The bright spots in the images of core plug BM and F were a result of vugs originating from dissolution- and fracture-related porosity. More advanced MRI sequences with shorter echo times should be used to image tight rocks with paramagnetic impurities, such as UTE (ultrashort echo time) and ZTE (zero echo time) imaging [26,27].

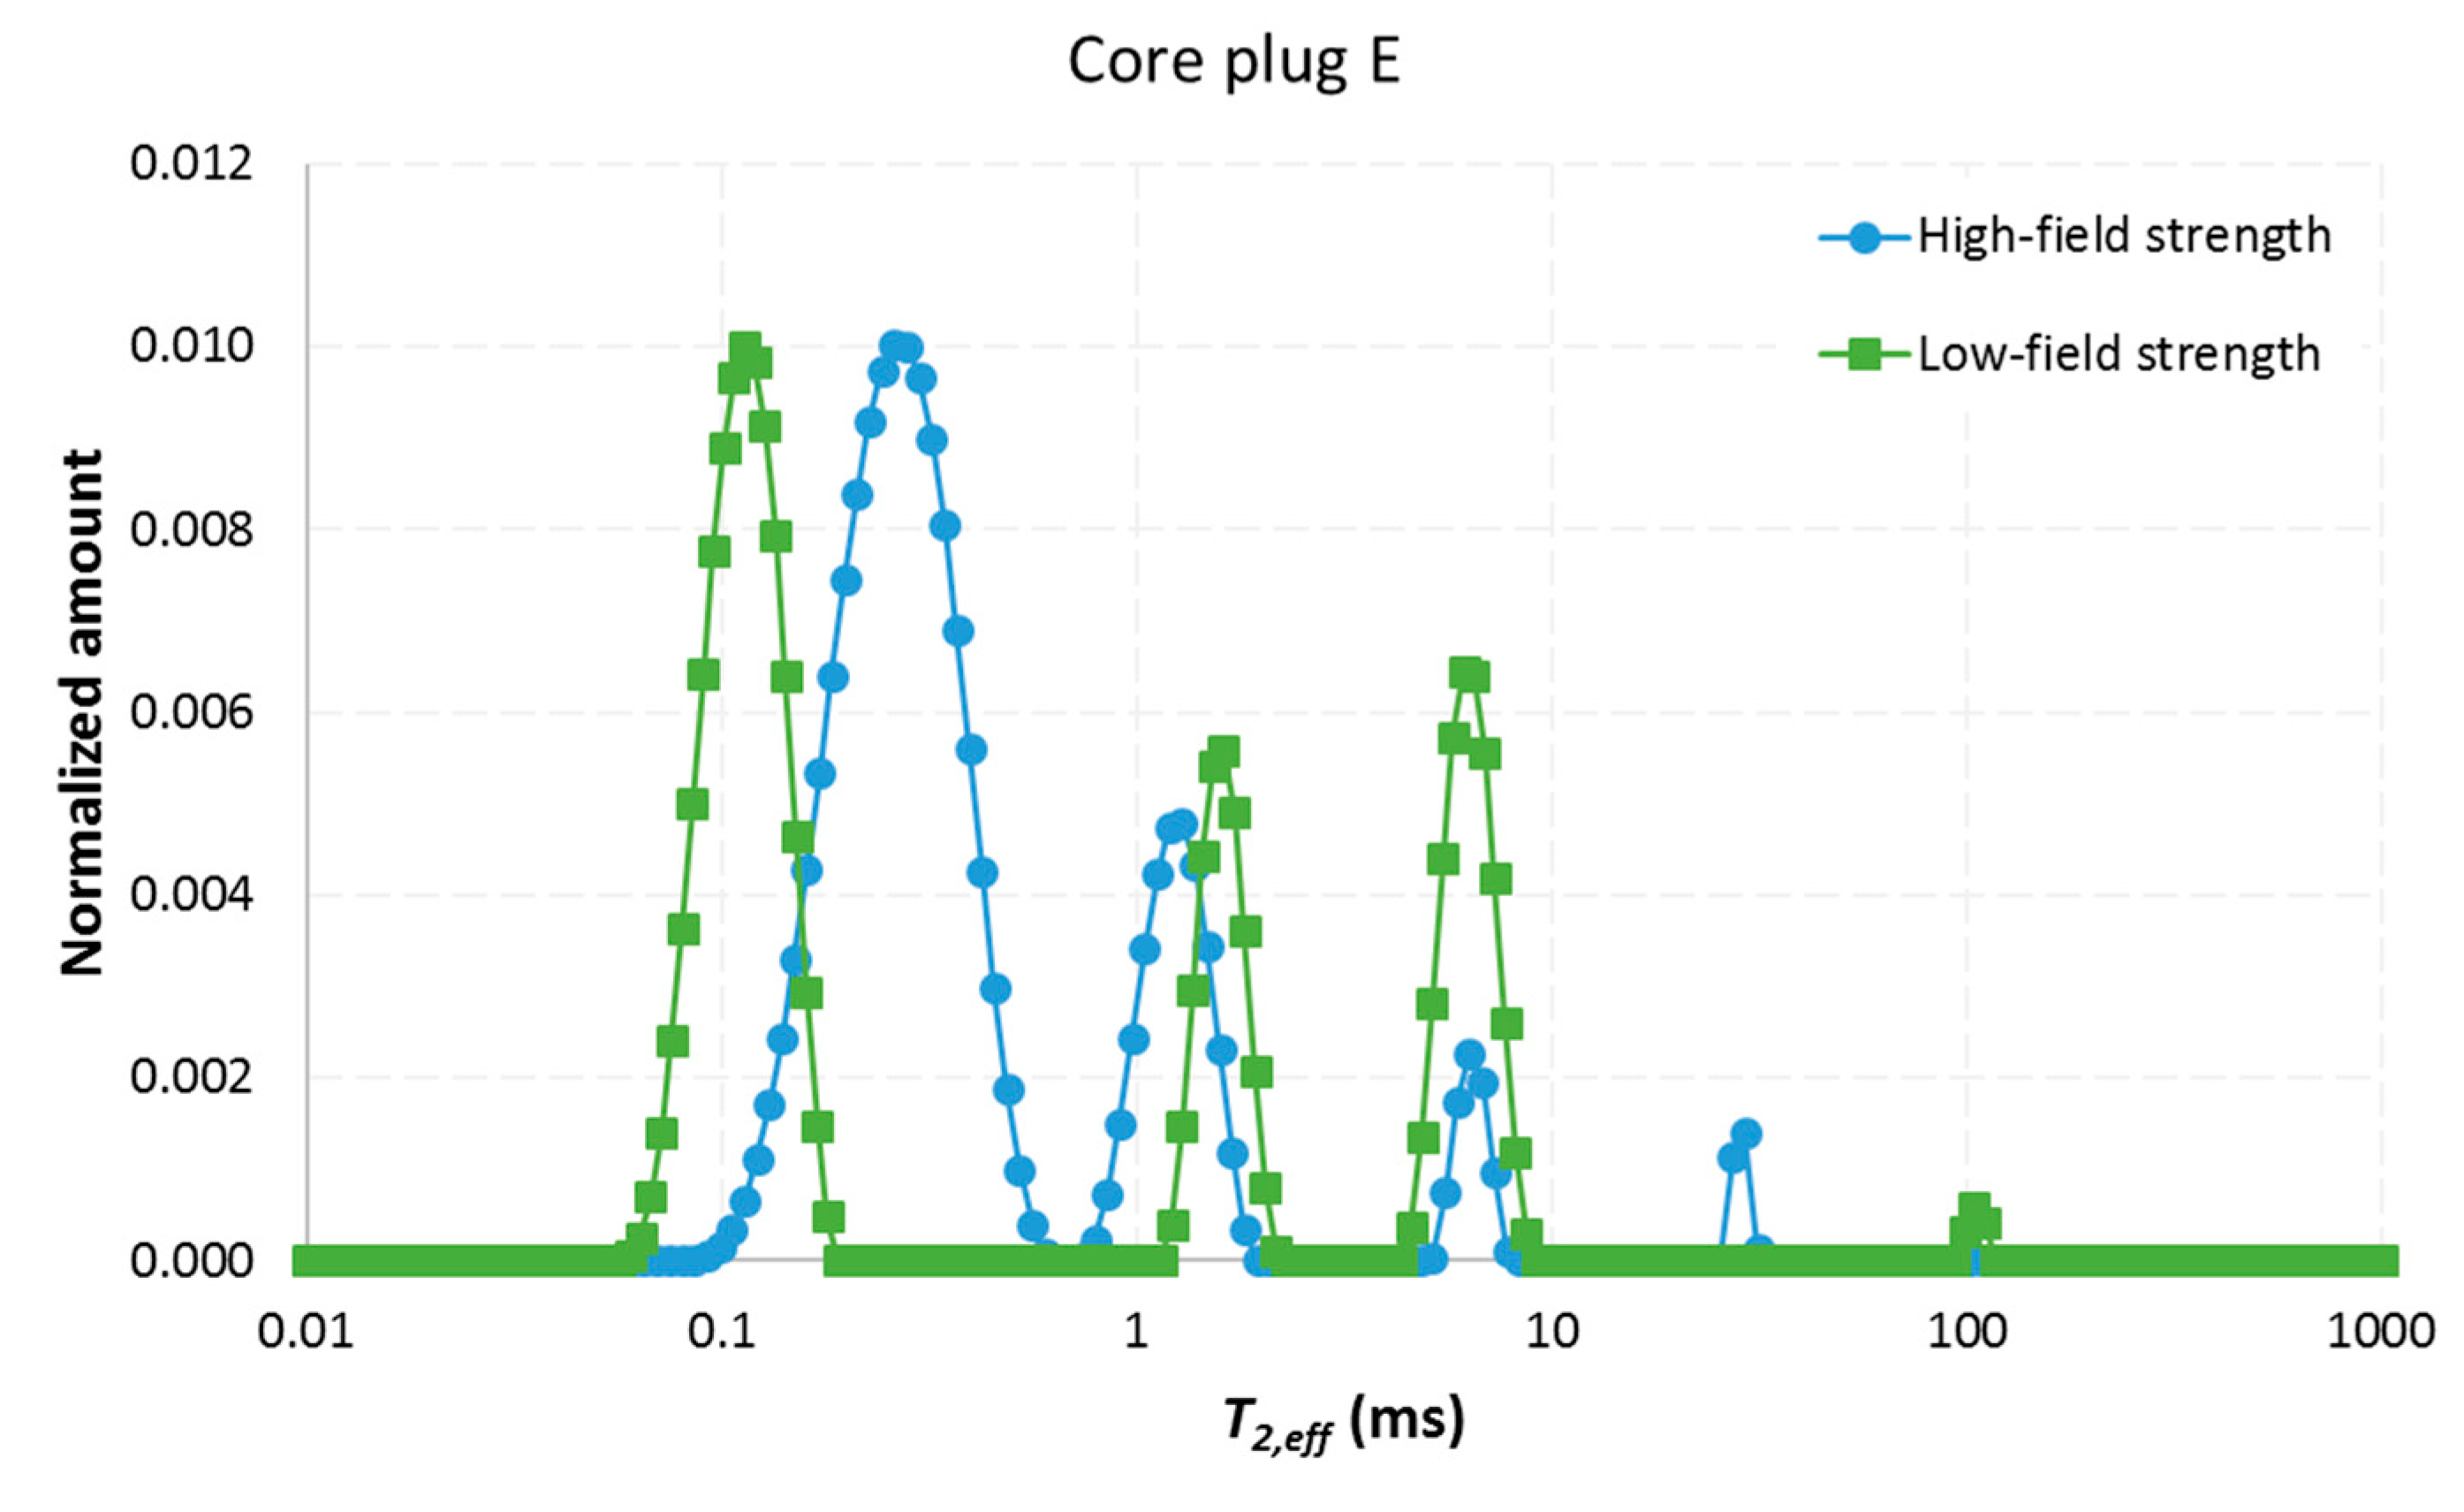
3.3. Effect of Magnetic Field Strength

The T2,eff distributions obtained at high magnetic field strength were unsuitable for quantification of the porosity of the core plugs. This section, therefore, compares the shape of the T2,eff distributions obtained at different field strengths, with no emphasis on the area under the distribution curves (Figure 8, Figure 9, Figure 10, Figure 11 and Figure 12).

3.3.1. Core Plug A

Core plug A contained the highest amount of iron, approximately 4 wt. %, and similar amounts of aluminum and magnesium. The content of calcium in the core plug was low. The average grain size was 368 μm, and the SEM analysis indicated that the porosity was very low. However, the porosity was calculated, by both weight measurements and low-field T2,eff distribution, to be as high as 0.34 (frac.). This underlines the advantage of NMR characterization and the limitation of thin-section analysis. The thin-section prepared for analysis may not be representative of the entire core plug, or the pores may be too small to capture. The size of the pores was small in this core plug, as demonstrated by the low average T2,eff of less than 1 ms (Figure 8). Some signal from the tight rock was obtained at high-field, but approximately half of the signal, corresponding to the shortest relaxation times, was lost due to internal gradients. A small part of the signal corresponded to longer relaxation times of 10–100 ms, which probably reflected minor dissolution- and fracture-related porosity. The high-field distribution had several discrete T2,eff time intervals at longer relaxation times, in contrast to the low-field distribution.

3.3.2. Core Plug BM

Core plug BM contained large amounts of calcium but nearly no iron. Thin-section analysis showed good intergranular porosity, and the porosity of the core plug was measured to be 0.14 (frac.). The observed macropores in the thin-section were reflected by the T2,eff components between 1–10 ms and ~100 ms (Figure 9). The T2,eff intervals corresponding to these pores were identified at both high- and low-field. The low-field acquisition captured some signal from relaxation times below 1 ms, which was too fast to be detected by the high-field measurement. These signals likely represented micropores, similar to the main porosity in core plug A that was not observed in the thin-section.

3.3.3. Core Plug D

Core plug D was the cleanest rock material with respect to iron and other diamagnetic impurities. The content of calcium was only around 4 wt. %. The porosity was 0.22 (frac.) and was mainly intergranular. The relatively large pores and low content of impurities resulted in less discrepancy between signal intensities recorded at low- and high-field (Figure 10). Two main T2,eff intervals were observed at a relaxation time of slightly less than 10 ms and around 100 ms. The high-field distribution had one extra discrete T2,eff time interval compared to the low-field distribution.

3.3.4. Core Plug E

Core plug E contained approximately 3 wt. % iron and abundant amounts of calcium because of carbonate cementation. The porosity was considered low based on the thin-section analysis, but was measured to be 0.13 (frac.) in the core plug. The porosity was the same as for core plug BM, where the intergranular porosity was highly visible in the thin-section. The size of some of the pores in core plug E was small, as highlighted by the T2,eff distribution (Figure 11), and these low T2,eff values (~0.1 ms) were likely the reason why the porosity estimation was poor in this core plug (Table 2). The match between the high- and low-field measurements were surprisingly good in this core plug, taking into account the significant inclusions of iron in the rock. The same number of discrete T2,eff time intervals was observed at both field strengths.

3.3.5. Core Plug F

Core plug F had no visible porosity due to carbonate cementation and poorly sorted grains. The porosity was only 0.06 (frac.) and was the lowest of the core plugs in this study. The iron content was around 3 wt. %. Still, signal intensities were measured at both high- and low-field (Figure 12). The relaxation time distribution was wide and ranged between 0.1 and above 100 ms. The signal intensity likely originated from dissolution- and fracture-related porosity in the carbonate cement. The low-field T2,eff distribution contained additional discrete time intervals than the high-field distribution.
There was no clear trend in the T2,eff distribution curves when changing the magnetic field strength, except from that the area under the distribution curves decreased at high magnetic field strength. The number of discrete T2,eff time intervals increased in two of the core plugs, decreased in two of the core plugs and remained unchanged in one core plug. There was no leftward shift in the T2,eff values at high magnetic field strength. This demonstrates that it is difficult to project the outcome of changing the magnetic field strength, and that the observed increase and leftward shift in discrete T2,eff time intervals with increasing magnetic field strength in Bentheim sandstone [19] is not valid in other core materials.

4. Conclusions

In this paper, we measured the T2,eff distribution in six different rock core plugs obtained from different geological settings offshore west of Ireland. The CPMG sequence was used at two different magnetic field strengths: An echo time of 0.20 ms was used at a field strength of 0.28 T, and an echo time of 0.50 ms was used at a field strength of 4.70 T. The transverse relaxation time distributions were compared and discussed with the known elemental composition of the rocks obtained by SEM–EDS analysis. The following conclusions are drawn:
(1) The low-field CPMG measurements gave reliable T2,eff distributions that matched the porosity of the rocks as calculated by weight measurements. The magnetic field strength (0.28 T) and echo time (0.20 ms) were sufficiently low, to depress the effect of internal magnetic gradients in heterogeneous rocks with an iron content of up to 4 wt. %.
(2) The T2,eff distributions obtained with CPMG at high-field were not representative of the porosity of the core plugs. The internal magnetic gradients reduced the recorded signal intensity severely at a magnetic field strength and echo time of 4.70 T and 0.50 ms, respectively. MR imaging of tight rocks at high-field must rely on more sophisticated scan sequences than RAREst, like ZTE (zero echo time) imaging, where the echo time can approach zero.
(3) The iron content was not alone in controlling the quality of the obtained transverse relaxation time distributions. The combination of iron content on the mineral surface, porosity and pore size distribution affected the recorded NMR signal.
(4) There was no clear trend on the number of discrete T2,eff time intervals for the different magnetic field strengths. In some core plugs, the number of time intervals decreased with field strength, and in some core plugs, the change was reversed.
(5) Microscopy and SEM analysis of thin-sections of the core plugs were not always adequate to characterize the porosity of the core plugs, especially due to the heterogeneity of the rock samples. NMR measurements at low magnetic field strength demonstrated its supreme ability in quantifying the porosity of tight heterogeneous rock.

Author Contributions

Conceptualization, S.A., S.R., J.G.S. and G.E.; methodology, S.A., S.R., A.H., J.G.S. and G.E.; software, S.A., S.R., A.H., J.G.S. and G.E.; formal analysis, S.A., S.R., A.H., J.G.S. and G.E..; investigation, S.A., S.R., J.G.S. and G.E.; writing—original draft preparation, S.A.; writing—review and editing, S.A., S.R., J.G.S. and G.E.; visualization, S.A., S.R. and A.H.; supervision, J.G.S. and G.E. All authors have read and agreed to the published version of the manuscript.

Funding

Parts of this research was funded by the Irish Research Council for the Government of Ireland Postdoctoral Fellowship (Project No.: GOIPD/2018/17), and Science Foundation of Ireland (Grant No. 13/RC/2092).

Acknowledgments

We gratefully acknowledge Equinor for access to MRI facilities in Bergen, Norway, and financial support by the Academia-agreement between Equinor and the University of Bergen. SR is grateful to the Royal Irish Academy for providing the Charlemont Grant, which supported his travel to the University of Bergen. We finally thank the Petroleum Affairs Division of Ireland for providing us with the sediment cores from offshore Ireland which were used in this study.

Conflicts of Interest

The authors declare no conflict of interest. The funders had no role in the design of the study; in the collection, analyses, or interpretation of data; in the writing of the manuscript, or in the decision to publish the results.

References

  1. Fheed, A.; Krzyzak, A.; Swierczewska, A. Exploring a carbonate reef reservoir—Nuclear magnetic resonance and computed microtomography confronted with narrow channel and fracture porosity. J. Appl. Geophys. 2018, 151, 343–358. [Google Scholar] [CrossRef]
  2. Berg, S.; Armstrong, R.; Ott, H.; Georgiadis, A.; Klapp, S.A.; Schwing, A.; Neiteler, R.; Brussee, N.; Makurat, A.; Leu, L.; et al. Multiphase Flow in Porous Rock Imaged Under Dynamic Flow Conditions with Fast X-Ray Computed Microtomography. Petrophysics 2014, 55, 304–312. [Google Scholar]
  3. Cnudde, V.; Boone, M. High-resolution X-ray computed tomography in geosciences: A review of the current technology and applications. Earth-Sci. Rev. 2013, 123, 1–17. [Google Scholar] [CrossRef] [Green Version]
  4. Mansfield, P.; Issa, B. Fluid Transport in Porous Rocks. I. EPI Studies and a Stochastic Model of Flow. J. Magn. Reson. Ser. A 1996, 122, 137–148. [Google Scholar] [CrossRef]
  5. Oswald, S.E.; Spiegel, M.A.; Kinzelbach, W. Three-dimensional saltwater–freshwater fingering in porous media: Contrast agent MRI as basis for numerical simulations. Magn. Reson. Imaging 2007, 25, 537–540. [Google Scholar] [CrossRef]
  6. Baldwin, B.A.; Stevens, J.; Howard, J.J.; Graue, A.; Kvamme, B.; Aspenes, E.; Ersland, G.; Husebø, J.; Zornes, D.R. Using magnetic resonance imaging to monitor CH4 hydrate formation and spontaneous conversion of CH4 hydrate to CO2 hydrate in porous media. Magn. Reson. Imaging 2009, 27, 720–726. [Google Scholar] [CrossRef]
  7. Li, M.; Romero-Zerón, L.; Marica, F.; Balcom, B.J. Polymer Flooding Enhanced Oil Recovery Evaluated with Magnetic Resonance Imaging and Relaxation Time Measurements. Energy Fuels 2017, 31, 4904–4914. [Google Scholar] [CrossRef]
  8. Kleinhans, M.G.; Jeukens, C.R.L.P.N.; Bakker, C.J.G.; Frings, R.M. Magnetic Resonance Imaging of coarse sediment. Sediment. Geol. 2008, 208, 69–78. [Google Scholar] [CrossRef]
  9. Gingras, M.K.; Macmillan, B.; Balcom, B.J.; Saunders, T.; Pemberton, S.G. Using Magnetic Resonance Imaging and Petrographic Techniques to Understand the Textural Attributes and Porosity Distribution in Macaronichnus-Burrowed Sandstone. J. Sediment. Res. 2002, 72, 552–558. [Google Scholar] [CrossRef]
  10. Al-Muthana, A.S.; Hursan, G.G.; Mark Ma, S.; Valori, A.; Nicot, B.; Singer, P.M. Wettability as a function of pore size by Nmr. In Proceedings of the International Symposium of the Society of Core Analysts, Aberdeen, UK, 27–30 August 2012. [Google Scholar]
  11. Arnold, J.; Clauser, C.; Pechnig, R.; Anferova, C.; Anferov, V.; Blümich, B. Porosity and permeability from mobile NMR core-scanning. Petrophysics 2006, 47. [Google Scholar]
  12. Lewis, R.T.; Seland, J.G. A multi-dimensional experiment for characterization of pore structure heterogeneity using NMR. J. Magn. Reson. 2016, 263, 19–32. [Google Scholar] [CrossRef] [PubMed]
  13. Lewis, R.T.; Seland, J.G. Characterization of pore geometry using correlations between magnetic field and internal gradient. Microporous Mesoporous Mater. 2018, 269, 31–34. [Google Scholar] [CrossRef]
  14. Lyu, C.; Ning, Z.; Wang, Q.; Chen, M. Application of NMR T2 to Pore Size Distribution and Movable Fluid Distribution in Tight Sandstones. Energy Fuels 2018, 32, 1395–1405. [Google Scholar] [CrossRef]
  15. Yan, J.; He, X.; Zhang, S.; Feng, C.; Wang, J.; Hu, Q.; Cai, J.; Wang, M. Sensitive parameters of NMR T2 spectrum and their application to pore structure characterization and evaluation in logging profile: A case study from Chang 7 in the Yanchang Formation, Heshui area, Ordos Basin, NW China. Mar. Pet. Geol. 2020, 111, 230–239. [Google Scholar] [CrossRef]
  16. Mitchell, J.; Chandrasekera, T.C.; Holland, D.J.; Gladden, L.F.; Fordham, E.J. Magnetic resonance imaging in laboratory petrophysical core analysis. Phys. Rep. 2013, 526, 165–225. [Google Scholar] [CrossRef]
  17. Washburn, K.E.; Eccles, C.D.; Callaghan, P.T. The dependence on magnetic field strength of correlated internal gradient relaxation time distributions in heterogeneous materials. J. Magn. Reson. 2008, 194, 33–40. [Google Scholar] [CrossRef]
  18. Hürlimann, M.D. Effective Gradients in Porous Media Due to Susceptibility Differences. J. Magn. Reson. 1998, 131, 232–240. [Google Scholar] [CrossRef]
  19. Mitchell, J.; Chandrasekera, T.C.; Johns, M.L.; Gladden, L.F.; Fordham, E.J. Nuclear magnetic resonance relaxation and diffusion in the presence of internal gradients: The effect of magnetic field strength. Phys. Rev. E 2010, 81, 026101. [Google Scholar] [CrossRef]
  20. Foley, I.; Farooqui, S.A.; Kleinberg, R.L. Effect of Paramagnetic Ions on NMR Relaxation of Fluids at Solid Surfaces. J. Magn. Reson. Ser. A 1996, 123, 95–104. [Google Scholar] [CrossRef]
  21. Haughton, P.; Praeg, D.; Shannon, P.; Harrington, G.; Higgs, K.; Amy, L.; Tyrrell, S.; Morrissey, T. First results from shallow stratigraphic boreholes on the eastern flank of the Rockall Basin, offshore western Ireland. Geol. Soc. Lond. Pet. Geol. Conf. Ser. 2005, 6, 1077–1094. [Google Scholar] [CrossRef]
  22. Carr, H.Y.; Purcell, E.M. Effects of Diffusion on Free Precession in Nuclear Magnetic Resonance Experiments. Phys. Rev. 1954, 94, 630–638. [Google Scholar] [CrossRef]
  23. Meiboom, S.; Gill, D. Modified Spin-Echo Method for Measuring Nuclear Relaxation Times. Rev. Sci. Instrum. 1958, 29, 688–691. [Google Scholar] [CrossRef] [Green Version]
  24. Song, Y.Q.; Venkataramanan, L.; Hürlimann, M.D.; Flaum, M.; Frulla, P.; Straley, C. T1–T2 Correlation Spectra Obtained Using a Fast Two-Dimensional Laplace Inversion. J. Magn. Reson. 2002, 154, 261–268. [Google Scholar] [CrossRef] [PubMed]
  25. Mitchell, J. Magnetic resonance core analysis AT 0.3 T. In Proceedings of the International Symposium of the Society of Core Analysts, Avignon, France, 8–11 September 2014. [Google Scholar]
  26. Mastrogiacomo, S.; Dou, W.; Jansen, J.A.; Walboomers, X.F. Magnetic Resonance Imaging of Hard Tissues and Hard Tissue Engineered Bio-substitutes. Mol. Imaging Biol. 2019, 21, 1003–1019. [Google Scholar] [CrossRef] [PubMed] [Green Version]
  27. Weglarz, W.P.; Krzyzak, A.; Machowski, G.; Stefaniuk, M. ZTE MRI in high magnetic field as a time effective 3D imaging technique for monitoring water ingress in porous rocks at sub-millimetre resolution. Magn. Reson. Imaging 2018, 47, 54–59. [Google Scholar] [CrossRef] [PubMed]
Figure 1. Overview map showing the three boreholes used in this study. Source: INFOMAR, Geological Survey of Ireland.
Minerals 10 00232 g001
Figure 2. Lithology log from three different boreholes where the six core plugs utilized in this study were retrieved from.
Minerals 10 00232 g002
Figure 3. Thin-section scans, petrographic optical microscope and SEM images for all studied core plugs.
Minerals 10 00232 g003
Figure 4. Semiquantitative elemental composition of studied core plugs obtained by SEM–EDS analysis. The amounts of oxygen, carbon, silicon, sulfur, phosphorus and chlorine are not shown.
Minerals 10 00232 g004
Figure 5. Transverse relaxation distribution for each core plug obtained by the CPMG sequence at low-field strength, B0 = 0.28 T. Each distribution is normalized with respect to the bulk volume of the respective core plug.
Minerals 10 00232 g005
Figure 6. Transverse relaxation distribution for each core plug obtained by the CPMG sequence at high-field strength, B0 = 4.70 T. Each distribution is normalized with respect to the bulk volume of the respective core plug.
Minerals 10 00232 g006
Figure 7. MR images of each core plug obtained by the RAREst sequence at high-field strength, B0 = 4.70 T. Three axial slices are chosen to represent the length of each core.
Minerals 10 00232 g007
Figure 8. Transverse relaxation distribution for core plug A obtained by the CPMG sequence at high-field strength, B0 = 4.70 T, and low-field strength, B0 = 0.28 T. The low-field distribution is normalized with respect to the bulk water distribution, and the sum of the data points is a measure of the porosity of the core plug. The high-field distribution is scaled to the amplitude of the low-field distribution.
Minerals 10 00232 g008
Figure 9. Transverse relaxation distribution for core plug BM obtained by the CPMG sequence at high-field strength, B0 = 4.70 T, and low-field strength, B0 = 0.28 T. The low-field distribution is normalized with respect to the bulk water distribution, and the sum of the data points is a measure of the porosity of the core plug. The high-field distribution is scaled to the amplitude of the low-field distribution.
Minerals 10 00232 g009
Figure 10. Transverse relaxation distribution for core plug D obtained by the CPMG sequence at high-field strength, B0 = 4.70 T, and low-field strength, B0 = 0.28 T. The low-field distribution is normalized with respect to the bulk water distribution, and the sum of the data points is a measure of the porosity of the core plug. The high-field distribution is scaled to the amplitude of the low-field distribution.
Minerals 10 00232 g010
Figure 11. Transverse relaxation distribution for core plug E obtained by the CPMG sequence at high-field strength, B0 = 4.70 T, and low-field strength, B0 = 0.28 T. The low-field distribution is normalized with respect to the bulk water distribution, and the sum of the data points is a measure of the porosity of the core plug. The high-field distribution is scaled to the amplitude of the low-field distribution.
Minerals 10 00232 g011
Figure 12. Transverse relaxation distribution for core plug F obtained by the CPMG sequence at high-field strength, B0 = 4.70 T, and low-field strength, B0 = 0.28 T. The low-field distribution is normalized with respect to the bulk water distribution, and the sum of the data points is a measure of the porosity of the core plug. The high-field distribution is scaled to the amplitude of the low-field distribution.
Minerals 10 00232 g012
Table 1. Description of lithology where the six core plugs utilized in this study were retrieved from. The exact mineralogical composition of each core plug is found in the results section.
Sample IDBorehole NameDepth of SampleAge and Description
ABucentaur 11/20-sb018.4 m (bsf)Paleogene: yellowish-red to brown tuff, lithic and crystal fragments, scattered dark-gray basalt clasts, vesicular with zeolites, glass commonly altered to Palagonite. Foraminifera and bivalve shell fragments are scattered throughout the interval.
B-MBucentaur 16/28-sb01145 m (bsf)L. Eocene: interbedded mudstone and siltstone: greenish gray, firm to hard, commonly massive, bioturbated, sporadic fractures, rare shell fragments, glauconite.
B-DBucentaur 16/28-sb01147.7 m (bsf)U. Cretaceous: basalt: black, fractures with calcite veins, highly altered. Top is microphyric with flow-banded plagioclase laths, remainder is fine-grained.
DBucentaur 16/28-sb01145.1 m (bsf)L. Eocene: mostly siltstone (interbedded mudstone and siltstone): greenish gray, firm to hard, commonly massive, bioturbated, sporadic fractures, rare shell fragments, glauconite.
EBucentaur 83/20-sb01112.5 m (bsf)U. Cretaceous: sandstone: dark greenish gray, fine to coarse, poorly sorted, soft to hard, glauconite, carbonate cemented, locally shelly.
FBucentaur 83/20-sb01138 m (bsf)M. Cretaceous: sandstone: yellowish brown, fine to very coarse, poorly sorted, brown glauconite, frosted quartz, shell debris, carbonate cement, thin limestone.
Table 2. Porosity of each core plug estimated by weight calculations and transverse relaxation distributions at low magnetic field strength.
Core PlugLengthDiameterΦ (frac.)
(cm)(cm)Weight CalculationLow-Field Strength
±0.01B0 = 0.28 T
A2.972.660.340.33
BD3.272.680.09-
BM2.232.630.140.16
D3.302.660.220.23
E3.192.660.130.17
F3.262.640.060.06

