Article

Thermal Analysis, Compressibility, and Decomposition of Synthetic Bastnäsite-(La) to Lanthanum Oxyfluoride

by
Richard L. Rowland II
1,*,
Barbara Lavina
2,†,
Kathleen E. Vander Kaaden
3,
Lisa R. Danielson
4 and
Pamela C. Burnley
5,*
1
Static High Pressure Team, Explosive Science and Shock Physics (M-9), Los Alamos National Laboratory, Los Alamos, NM 87544, USA
2
High Pressure Science and Engineering Center, University of Nevada Las Vegas, Las Vegas, NV 89154, USA
3
Astromaterials Research and Exploration Science Division (ARES), Jacobs, NASA Johnson Space Center, Mail Code XI3, Houston, TX 77058, USA
4
Space and Remote Sensing (ISR-2), Los Alamos National Laboratory, Los Alamos, NM 87544, USA
5
High Pressure Science and Engineering Center and Geoscience Department, University of Nevada Las Vegas, Las Vegas, NV 89154, USA
*
Authors to whom correspondence should be addressed.
Current address: X-ray Science Division, Argonne National Laboratory, Argonne, IL 60439, USA.
Minerals 2020, 10(3), 212; https://doi.org/10.3390/min10030212
Submission received: 30 December 2019 / Revised: 20 February 2020 / Accepted: 21 February 2020 / Published: 27 February 2020
(This article belongs to the Special Issue Mineral Physics—In Memory of Orson Anderson)

Abstract

:
Understanding basic material properties of rare earth element (REE) bearing minerals such as their phase stability and equations of state can assist in understanding how economically viable deposits might form. Bastnäsite is the most commonly mined REE bearing mineral. We synthesized the lanthanum-fluoride end member, bastnäsite-(La) (LaCO3F), and investigated its thermal behavior and decomposition products from 298 K to 1173 K under ambient pressure conditions through thermogravimetric analysis, differential scanning calorimetry, evolved gas analysis, and high temperature powder X-ray diffraction. We also investigated the compressibility of bastnäsite-(La) via single crystal X-ray diffraction in diamond anvil cells at an ambient temperature up to 11.3 GPa and from 4.9 GPa to 7.7 GPa up to 673 K. At ambient pressure, bastnäsite-(La) was stable up to 598 K in air, where it decomposed into CO2 and tetragonal γ-LaOF. Above 948 K, cubic α-LaOF is stable. High temperature X-ray diffraction data were used to fit the Fei thermal equation of state and the thermal expansion coefficient α298 for all three materials. Bastnäsite-(La) was fit from 298 K to 723 K with V0 = 439.82 Å3, α298 = 4.32 × 10⁻⁵ K−1, a0 = −1.68 × 10⁻⁵ K−1, a1 = 8.34 × 10⁻⁸ K−1, and a2 = 3.126 K−1. Tetragonal γ-LaOF was fit from 723 K to 948 K with V0 = 96.51 Å3, α298 = 2.95×10⁻⁴ K−1, a0 = −2.41×10⁻⁵ K−1, a1 = 2.42×10⁻⁷ K−1, and a2 = 41.147 K−1. Cubic α-LaOF was fit from 973 K to 1123 K with V0 = 190.71 Å3, α298 = −1.12×10⁻⁵ K−1, a0 = 2.36×10⁻⁴ K−1, a1 = −1.73 × 10⁻⁷ K−1, and a2 = −17.362 K−1. An ambient temperature third order Birch–Murnaghan equation of state was fit with V0 = 439.82 Å3, K0 = 105 GPa, and K’ = 5.58.

1. Introduction

Rare earth elements (REE), the elements with atomic number 57 to 71, are the first on the periodic table to begin populating F-block orbitals. Due to this fact, they exhibit unique electronic properties and thus are sought after for various technological applications for which other metals are not suitable. They are considered rare, not because of their relative abundance in the Earth’s crust, but because they are generally only found as trace impurities instead of primary cations in minerals [1,2]. Relative crustal abundances of REEs are higher than noble metals such as gold or platinum, and some REEs are more common than base metals like lead [2,3]. The limited number of minerals that form with high REE content are rarely found in high enough concentrations to make economically viable deposits [2]. Currently, China controls > 90% of the world’s supply of REEs [1], presenting the potential for a supply problem. Understanding basic material properties of REE bearing minerals such as how they respond to changes in pressure and temperature can assist in understanding how economically viable deposits form.
Having the general formula of (Ce,La,Nd,Y)CO3(F,OH), bastnäsite is the most common mineral mined for REEs [4]. It occurs mainly in carbonatites and is usually found in association with calcite, dolomite, and barite [5,6,7], but also occurs in other geologic settings important for REE-bearing minerals [8]. Bastnäsite-(La) is the lanthanum fluoride end member (LaCO3F) [2,4,9,10,11,12,13,14]. This work explores the ambient pressure thermal behavior of bastnäsite-(La) and the oxyfluorides it decomposes to using thermogravimetric analysis, differential scanning calorimetry, evolved gas analysis, and high temperature X-ray powder diffraction. We also explore the behavior of bastnäsite-(La) at high pressure via single crystal X-ray diffraction in a diamond anvil cell.

Structure and Decomposition of Bastnäsite-(La) to Lanthanum Oxyfluoride

Bastnäsite-(La) (LaCO3F) exhibits hexagonal symmetry in the P-62c space group. Each unit cell contains six formula units of alternating layers of carbonate anions and layers of lanthanum cations and fluorine anions (Figure 1). The lanthanum-fluoride layers are parallel to the a- axis while the carbonate anion groups between them are locally parallel to the c- axis [4,9,10]. With the application of sufficient energy in the form of heat, bastnäsite-(La) decomposes via the decarbonation reaction LaCO3F + (heat) = LaOF + CO2 [7,15]. At ambient conditions, γ-LaOF exhibits tetragonal symmetry in the P4/nmm space group with two formula units per unit cell [16,17,18,19,20]. At high temperature, α-LaOF is stable with cubic symmetry in the Fm-3m space group with four formula units per unit cell [21,22,23,24,25]. β-LaOF is reported as stable at ambient pressure and temperature exhibiting rhombohedral symmetry in the R-3m space group with six formula units per unit cell [16,20,24]. This structure was not encountered during this investigation.

2. Materials and Methods

2.1. Synthesis

Bastnäsite-(La) was synthesized via precipitation from an aqueous solution at room pressure and temperature using the method described by Janka and Schleid [15]. Aqueous solutions of each reagent were made by mixing powdered lanthanum nitrate (La(NO3)3·6H2O, Sigma Aldrich 203548-100G, >99% purity), sodium bicarbonate (NaHCO3, Sigma Aldrich S6014-25G, >99% purity), and sodium fluoride (NaF, Sigma Aldrich 201154-5G, >99% purity) with deionized water in separate beakers. The solutions were combined in a larger beaker. Bastnäsite-(La) precipitated from the mixture of solutions immediately, with sodium nitrate (NaNO3) remaining in the solution. The fluid was decanted, and the bastnäsite-(La) precipitate was washed in deionized water and centrifuged to remove residual sodium nitrate. The powder was then dried in a Fischer Scientific model 289A Isotemp Vacuum oven under vacuum at 488 K for at least 12 h.
Phase identification was completed by powder X-ray diffraction in a PANalytical X’Pert PRO and photoaccoustic infrared spectroscopy on a Digilab FTS-7000 Fourier transfer infrared (FTIR) spectrometer. Rietveld structure refinement using X’pert Highscore Plus software was used to determine that the bastnäsite-(La) starting material contained < 10% LaF3 impurity. No OH peaks were detected by FTIR between 3600 cm−1 and 3400 cm−1.
The powder X-ray diffraction peaks from the synthesized bastnäsite-(La) are wide due to the small particle size, so the material was next annealed in a Griggs modified piston cylinder apparatus [27] using NaCl as the pressure transmitting medium. Samples were placed in a platinum jacket, surrounded by graphite, and sealed in a copper capsule, then subjected to pressures between 0.25 GPa and 1.0 GPa and temperatures from 973 K to 1123 K [28]. See Figure 2 for a comparison of diffraction patterns before and after annealing.

2.2. Themogravimetric Analysis and Differential Scanning Calorimetry

Thermogravimetric analysis (TGA), differential scanning calorimetry (DSC), and evolved gas analysis (EGA, Pfeiffer Vacuum Thermostar. Aßlar, Germany.) were used to determine the temperature at which bastnäsite-(La) begins to decompose and to determine the temperatures of phase transformations in the decomposition products. Powdered samples of at least 5 mg were heated in an alumina ceramic crucible in a Netzsch STA449 F1 Jupiter DSC/TGA apparatus under dry N2 at 1 atm pressure at a programmed rate of 5°/min from 313 K to 1223 K. Nitrogen was used as a carrier gas because it was unreactive with the sample during heating. A second empty alumina crucible was used as the reference. It is noted that the Netzsch Jupiter DSC/TGA apparatus contains a heat-flux style calorimeter, thus exothermic reactions produce a measured increase in heat flow. A Pfeiffer Vacuum Thermostar Quadrupole mass spectrometer was used to record select masses between 1–100 AMU throughout the temperature ramp.

2.3. High Temperature Powder X-ray Diffraction

High temperature powder X-ray diffraction was used to determine unit cell volume as a function of temperature and to determine which phases were present at different temperatures. Measurements were made in air on a PANalytical X’Pert Pro MPD Diffractometer fitted with an Anton Paar XRK 900 thermal reactor stage and an X’celerator (2.02° 2θ) detector. A cobalt X-ray source (Co Kα1 λ = 1.78901 Å) was used in angle dispersive mode from 4.0980 to 79.9814° 2θ with a step size of 0.0170° at 50.1650 s per step. Diffraction patterns were collected at 298 K, and in 50 degree increments from 323 K to 473 K, and in 25 degree increments from 473 K to 1173 K. A final pattern was collected at 298 K after the sample was allowed to cool. Data analysis was completed using QualX 2.0 [29], UnitCellWin64 [30] and EosFit7GUI [31].

2.4. Single Crystal X-ray Diffraction

In situ single crystal synchrotron X-ray diffraction was performed at Sector 16 HPCAT of the Advanced Photon Source at Argonne National Laboratory. The pressure cells used were four-post diamond anvil cells (DAC) with 700 μm diameter culets and laser-cut rhenium gaskets with a 380 μm diameter laser-cut gasket hole sample chamber [32,33]. Single crystals of the annealed bastnäsite-(La) ~20 μm in diameter were placed in the sample chamber. Ruby spheres along with gold or copper powder were included in the sample chamber as pressure standards. The diamond cells were gas loaded [34] with helium, neon, or argon as the pressure transmitting media. Angle dispersive X-ray diffraction images were captured on a 2048 × 2048 pixel MAR CCD detector with a monochromatic beam of 30 keV energy X-rays (λ = 0.3738 nm) while rotating the DAC ±30 degrees around the vertical axis; allowing for between 50 and 300 bastnäsite-(La) reflections to be measured. The ruby luminescence pressure scale [35] was used to estimate pressure during data collection and the equations of state for gold [36] and copper [37] were used for final pressure determination. Heated DAC experiments were conducted in a vacuum chamber with kapton and mylar windows. The DAC was equipped with resistive heating wires wound around the gasket between the anvils and around the exterior of the DAC housing to generate and maintain sample chamber temperatures up to 673 K. Thermocouples were placed in contact with the diamonds to measure the sample temperature. For the heated experiments, argon was used as the pressure transmitting media, and copper (Cu) as the pressure standard. Data analysis was completed using the software packages Fit2D [38], MDI Jade (Materials Data Inc), GSE_ADA/RSV [39], and EosFit7GUI [31].

3. Results

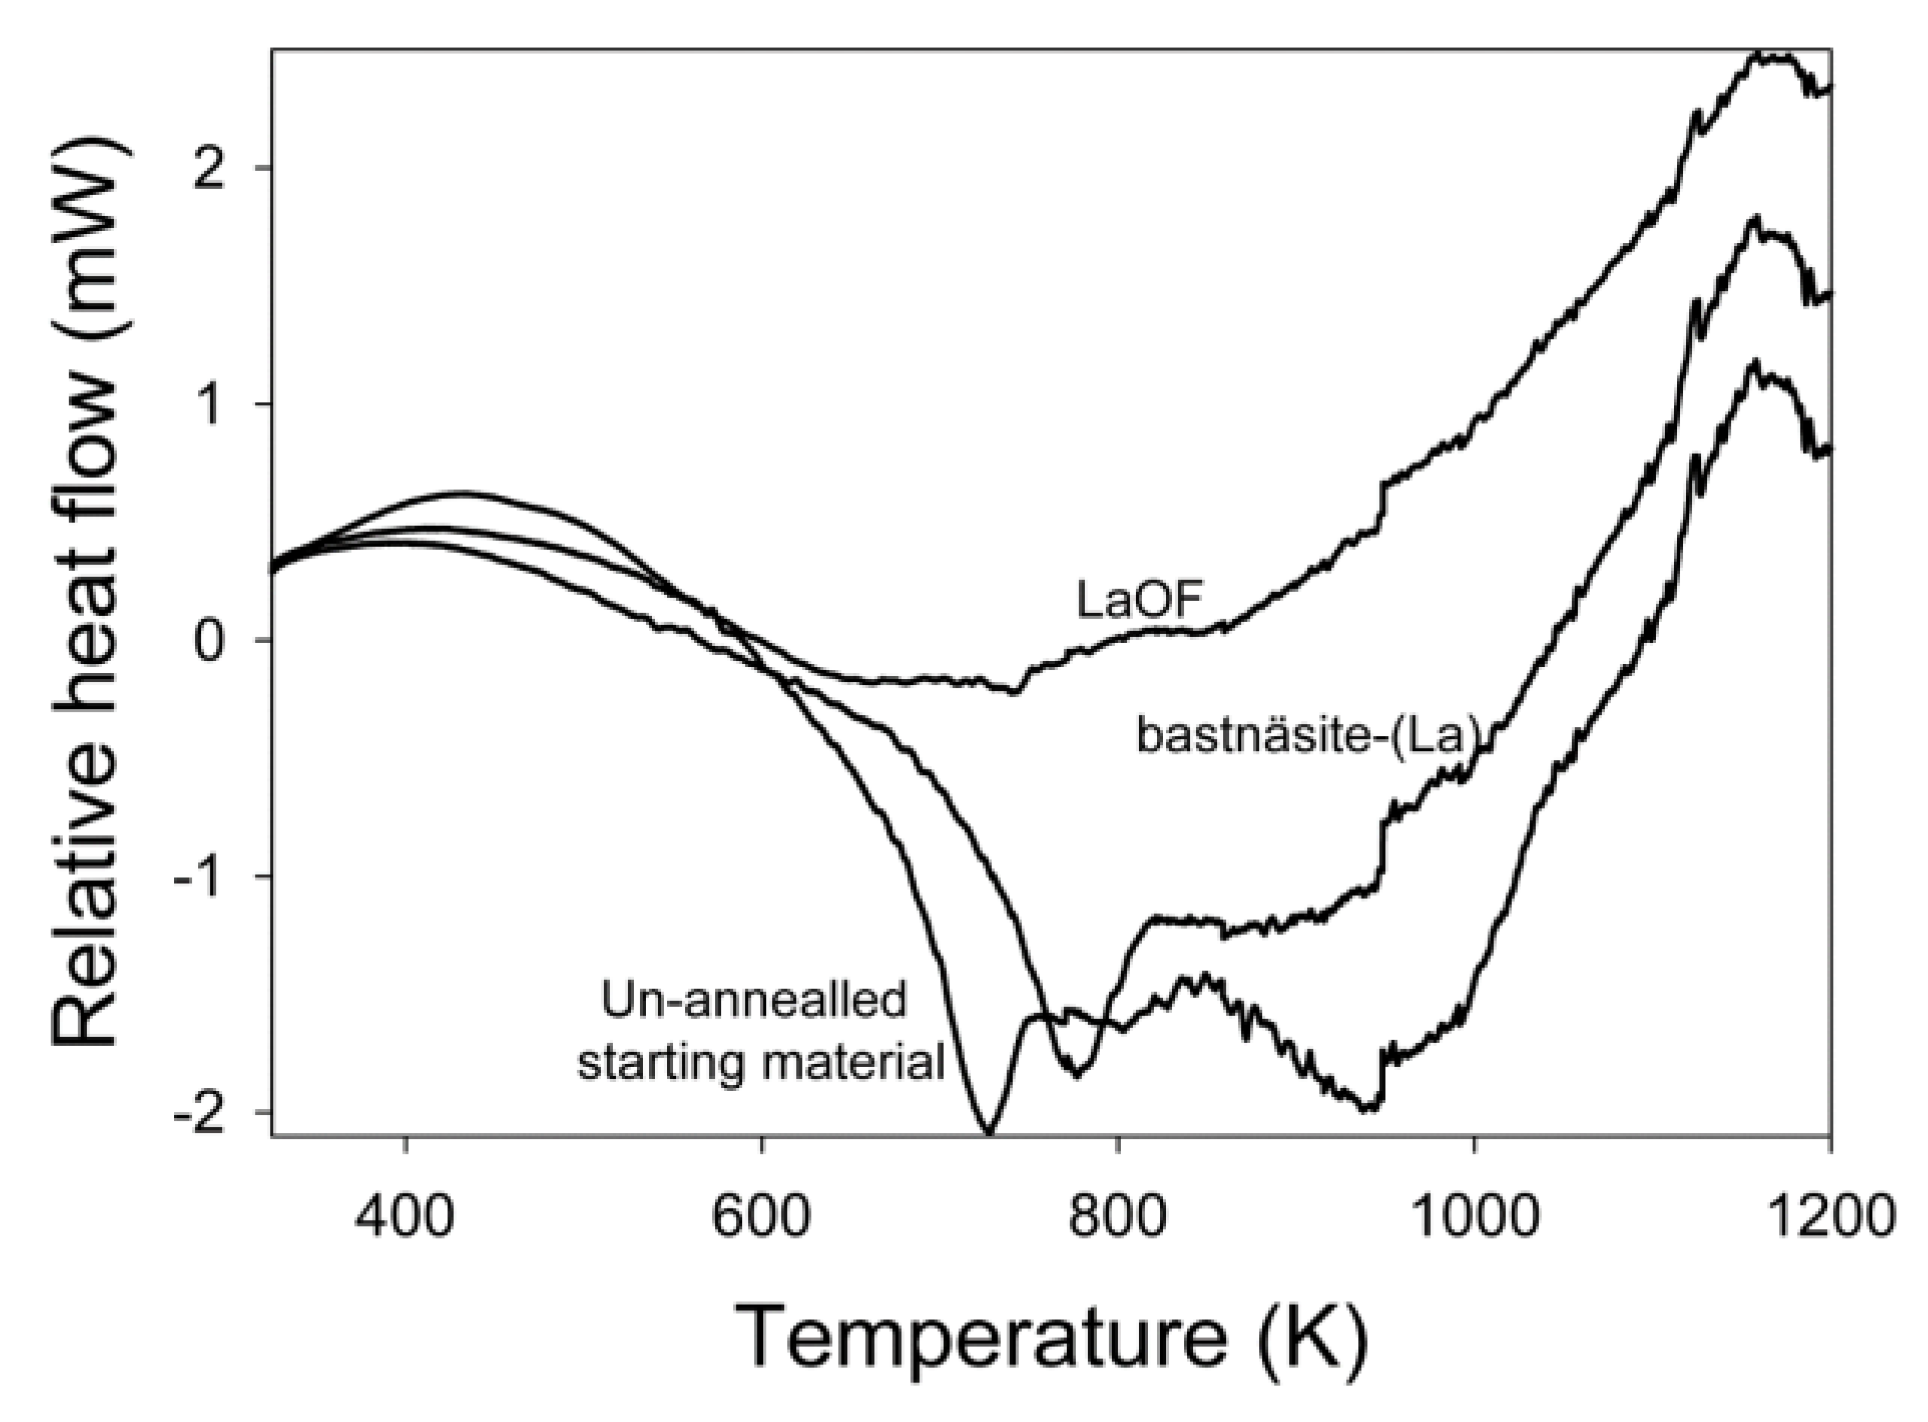
3.1. Thermogravimetric Analysis and Differential Scanning Calorimetry

Thermogravimetric analysis and mass spectrometry CO2 detection curves for annealed and unannealed bastnäsite-(La) and LaOF are displayed in Figure 3. Samples containing bastnäsite-(La) lost 1.0% to 1.3% between 313 K and 598 K due to adsorbed water. From 598 K to 778 K, 13.0% to 17.4% was lost due to the decomposition of bastnäsite-(La) to γ-LaOF and CO2. Since the LaOF sample was generated by the decomposition of bastnäsite-(La), the minor deflection of its mass loss curve at the bastnäsite-(La) decomposition point is likely caused by minor amounts of remaining bastnäsite-(La). Otherwise, the curve for LaOF does not show a significant change in slope, indicating that the LaOF itself did decompose.
The differential scanning calorimetry curves for annealed and unannealed bastnäsite-(La) (Figure 4) exhibit endotherms between 598 K and 778 K, and the mass spectrometer’s CO2 detection peaked at 730 K. All samples exhibited exotherms at 948 K and endotherms at 1123 K, indicative of phase transitions.

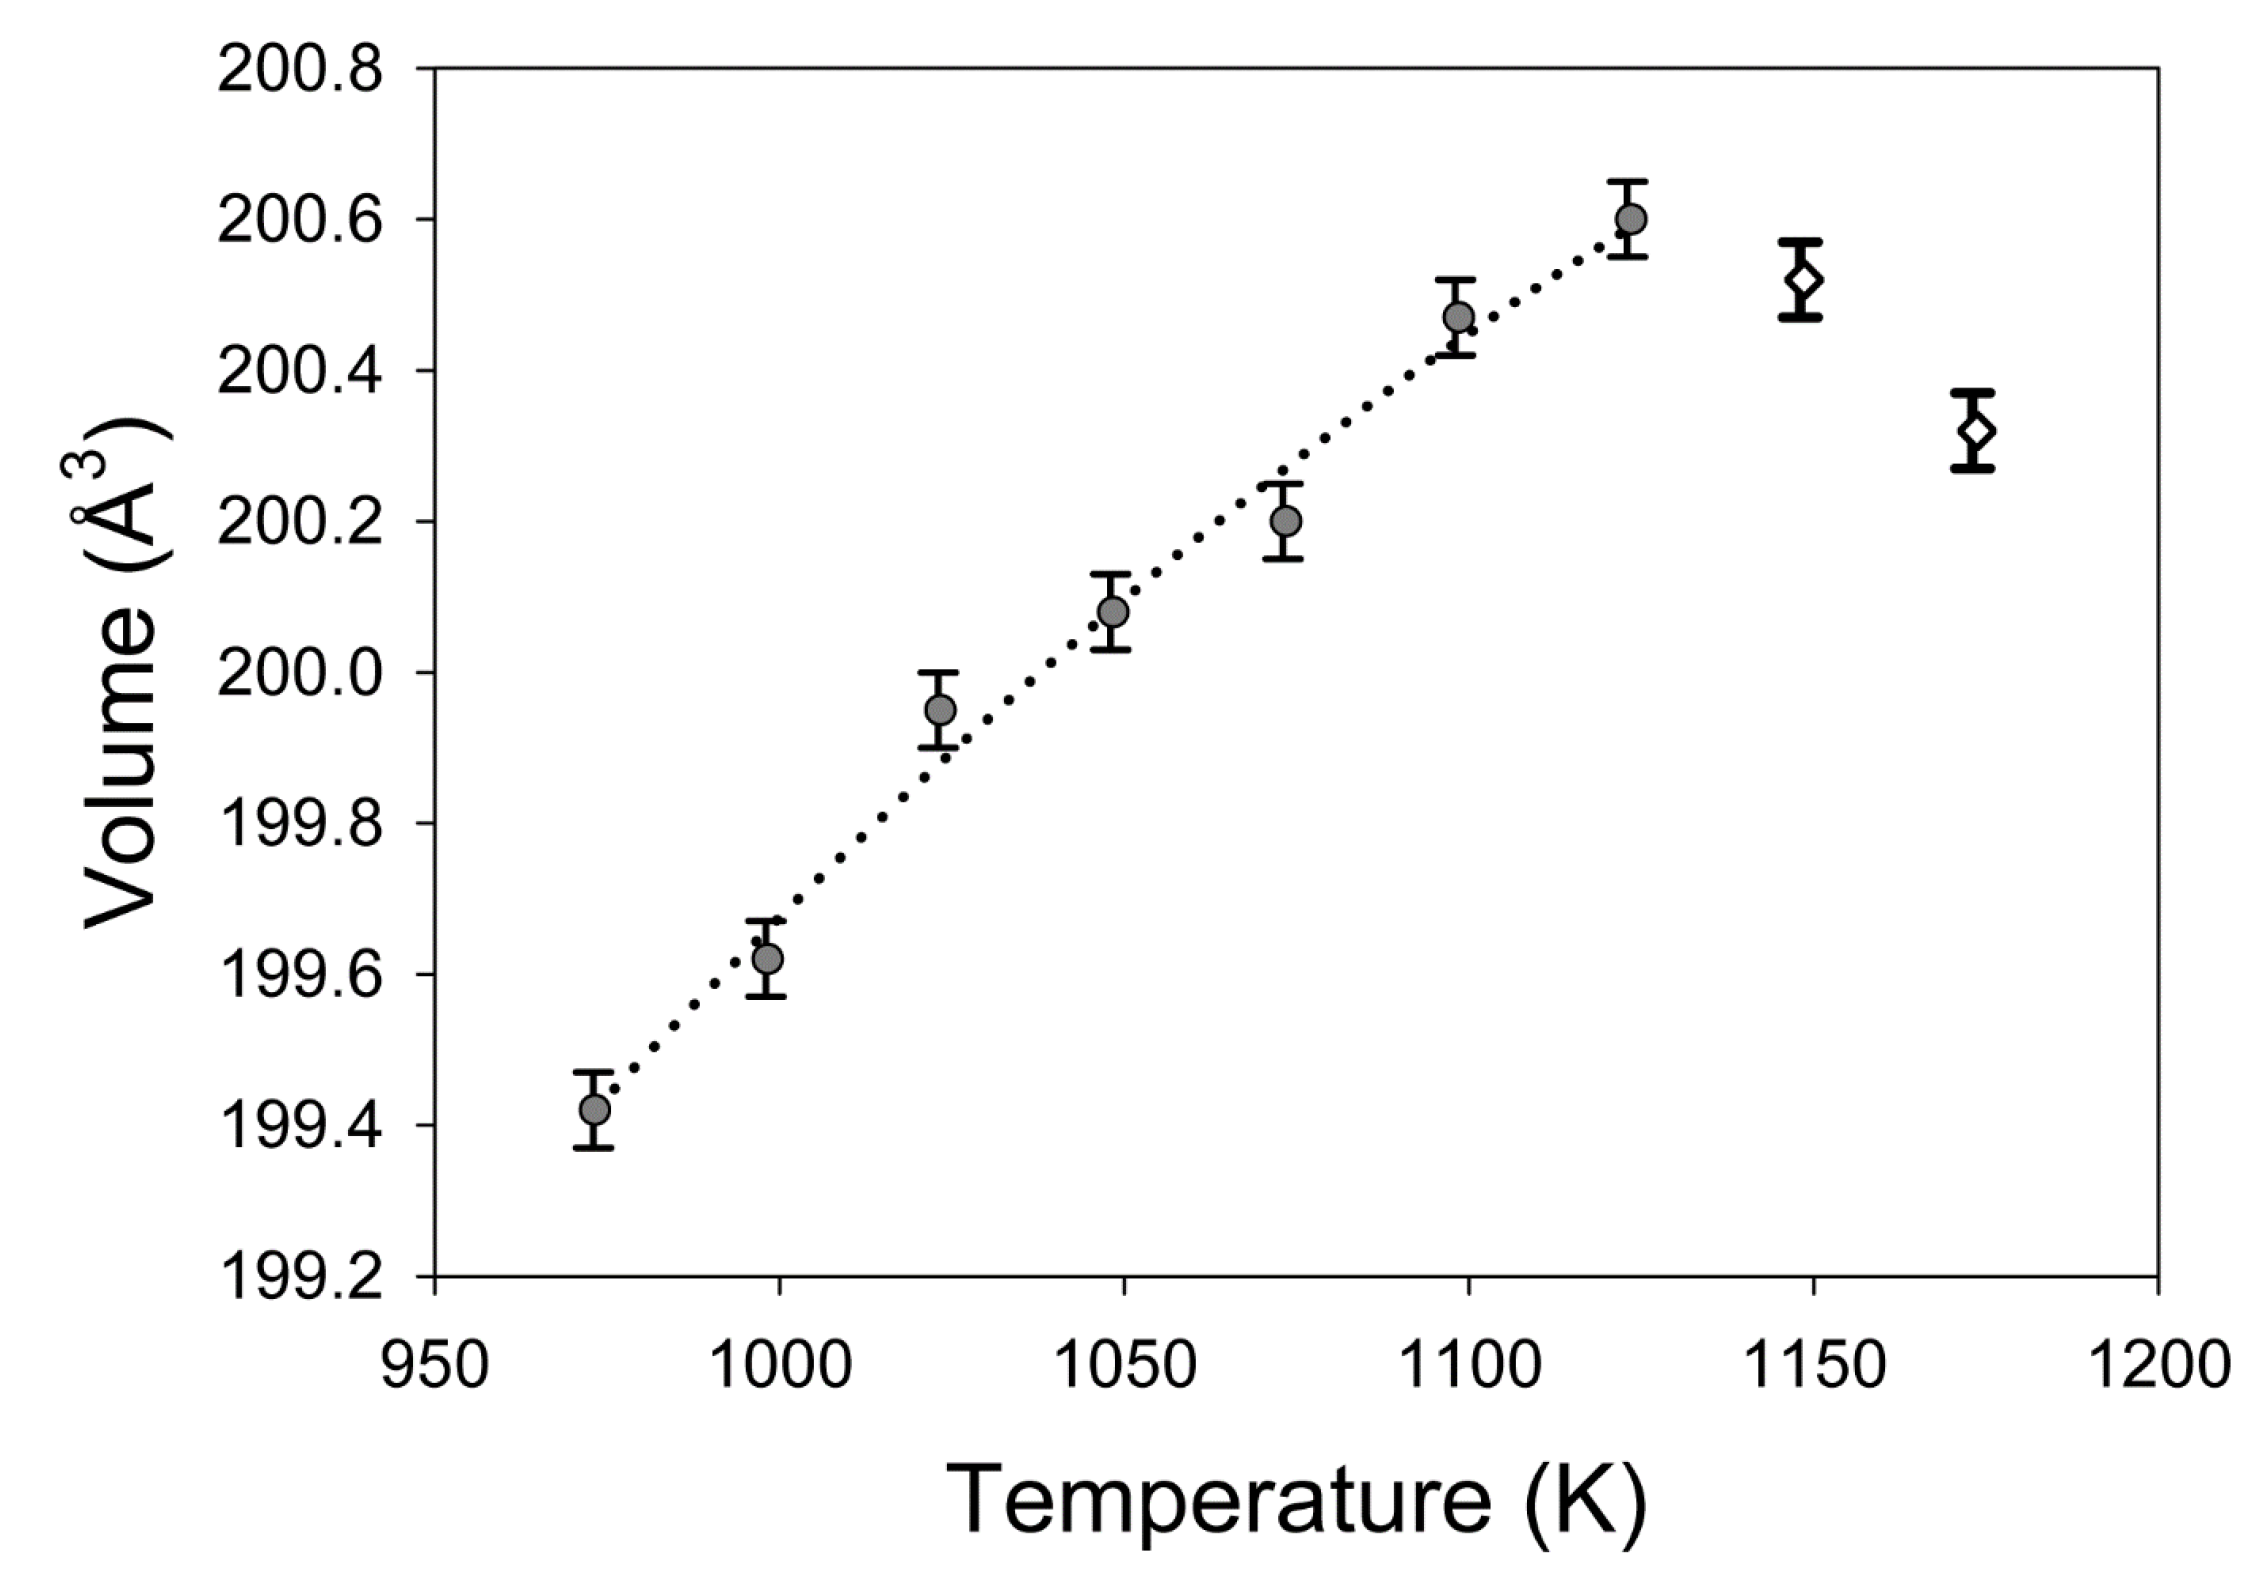
3.2. High Temperature Powder X-ray Diffraction

Figure 5 displays a selection of the high temperature powder XRD patterns encompassing the bastnäsite-(La) decomposition reaction. Bastnäsite-(La) is the dominant species in the X-ray diffraction patterns from 298 K to 723 K. Diffraction peaks for γ-LaOF begin to show up in the patterns above 598 K. By 773 K, bastnäsite-(La) is no longer present in the patterns, and γ-LaOF is the only phase present. Above 948 K, only α-LaOF is present. γ-LaOF was the only species present in the pattern collected at 298 K after the sample was allowed to cool following the collection of the final high temperature pattern. β-LaOF was not evident in any of the patterns. See Table 1, Table 2 and Table 3 for the measured lattice parameters and volumes of all three materials. Figure 6, Figure 7 and Figure 8 display measured unit cell volumes as a function of temperature for all three materials.

3.3. Single Crystal X-ray Diffraction

At ambient temperature, 16 X-ray diffraction patterns of bastnäsite-(La) were collected from ambient pressure to 11.3 GPa. Over this pressure range, the a- crystallographic axis contracts from 7.187 Å to 6.974 Å, and the c- crystallographic axis contracts from 9.830 Å to 9.593 Å, with a corresponding unit cell volume contraction from 439.82 Å3 to 404.06 Å3. Table 4 lists the measured lattice parameters, calculated unit cell volumes, and crystallographic axis ratios for each pressure point. The unit cell volume data were fit to a third order Birch–Murnaghan equation of state [31,41] with Vo = 439.82 Å3, Ko = 105 GPa, and K’ = 5.58. Figure 9 illustrates the unit cell volume measurements superimposed over the calculated equation of state.
Over the temperature range of 347 K to 673 K, nine X-ray diffraction patterns were collected between 4.9 GPa and 7.7 GPa. Over this range of conditions, the a- crystallographic axis varies between 7.057 Å and 7.086 Å, and the c- crystallographic axis varies between 9.730 Å and 9.685 Å, with corresponding variation in unit cell volumes between 423.11 Å3 and 418.32 Å3. Table 5 lists the measured lattice parameters, calculated unit cell volumes, and crystallographic axis ratios for each pressure and temperature point.

4. Discussion

From TGA/DSC and high temperature powder XRD data, it is apparent that at ambient pressure, the decarbonation temperature of bastnäsite-(La) is about 598 K. Above this temperature, the decomposition reaction of bastnäsite-(La) into γ-LaOF and CO2 begins. Since our experiments were conducted without controlled pCO2, this decarbonation point is not the equilibrium decomposition temperature; which at one bar pCO2 is likely higher. The application of pressure significantly increases the stability of bastnäsite-(La), as was observed in our recrystallization experiments at 1073 K and 0.22 GPa (after five hours) and at 1123 K and 0.71 GPa after 21 h [28]. However, as these experiments were not reversed, a phase diagram for bastnäsite-(La) cannot yet be established. At 948 K, tetragonal γ-LaOF undergoes a first order structural phase transition reaction to cubic α-LaOF. The decomposition temperature for bastnäsite-(La) found in this study agrees with previous values reported by Janka and Schlied [15] who used similar methods, but did not report behavior for temperatures above 823 K. While the sample material cooled back down to 298 K, it transformed to γ-LaOF, the stable structure of lanthanum oxyfluoride at ambient conditions.
Table 6 lists the fitted thermal expansion coefficients for bastnäsite-(La), γ-LaOF, and α-LaOF over the temperature ranges measured in the high temperature powder X-ray diffraction experiments. Over the temperature ranges measured, all three species exhibit a trend of positive thermal expansion (Figure 6, Figure 7 and Figure 8), except between 1123 K and 1173 K, where the α-LaOF unit cell contracts. There is an endotherm in the DSC curve at 1123 K that could indicate a phase transition, but the X-ray diffraction patterns at these temperatures do not indicate a structural change, and the mass spectrometer did not detect any compounds outgassing at these temperatures; further studies are necessary to determine what this endotherm and coincident thermal contraction represent.
Thermal analysis has not been performed on any other fluorocarbonate minerals, so a direct comparison of the properties of bastnäsite-(La) measured in this investigation to other materials with similar structure is not possible. Others have investigated the thermal expansion of more common carbonates including aragonite (CaCO3), strontianite (SrCO3), cerrusite (PbCO3), witherite (BaCO3) [42], calcite (CaCO3), and magnesite (MgCO3) [43]. A comparison of the thermal equations of state for bastnäsite-(La) and these materials is given in Figure 10. Compared with these more common carbonates, bastnäsite-(La) experiences more thermal expansion for a given increase in temperature than the trigonal R-3c carbonates (calcite and magnesite), and less thermal expansion for a given increase in temperature than the orthorhombic Pmcn carbonates (aragonite, cerrusite, strontianite, and witherite). Additionally, as shown in Table 6, bastnäsite-(La)’s a- and c- crystallographic axes expand at different rates; all of the other carbonates listed above also exhibit some degree of anisotropic thermal expansion. Overall, this indicates that bastnäsite-(La)’s thermal expansion behavior is similar to that of other carbonate minerals.
There are no previous studies of tetragonal REE-bearing oxyfluorides, but Achary et al. [24] synthesized the rhombohedral oxyfluorides of five REEs (La, Nd, Sm, Eu, and Gd), and used high temperature powder XRD to investigate their thermal expansion and phase transformation to cubic structures at high temperature. Their calculation and fitting of thermal expansion coefficients used the data for both rhombohedral and cubic phases, so the resulting thermal equations of state are not suitable to compare directly to that for α-LaOF derived in this study. However, using their data for just the cubic phases, we were able to fit thermal expansion coefficients using EOSFit7GUI [31]. Table 7 lists the fitted coefficients, and Figure 11 illustrates the thermal equations of state compared to that of α-LaOF measured in this study. The thermal expansion behavior we measured for α-LaOF is essentially the same as what we derived from Achary et al.’s data [24].
The anisotropy of bastnäsite-(La) is enhanced under compression; the a- crystallographic axis contracts more than the c- crystallographic axis. The changing ratio of a/c is given in Table 4. Similarly, the a- crystallographic axis is also more expansive during heating (Table 1). As illustrated in Figure 1, the planar carbonate ions are arranged in the structure such that they lie on planes containing the c- crystallographic axis. Others [44,45,46] have observed rigid body behavior of CO32− anions in other carbonates at high pressure. Thus, we suggest that most of the expansion and contraction of the structure is accommodated by the La-O and La-F bonds.
There are no compressibility data fit to equations of state or any bulk moduli measured from other methods (e.g., ultrasonic methods) in the literature for bastnäsite or any other fluorocarbonate minerals, so a direct comparison of the properties of bastnäsite-(La) measured in this investigation to materials with similar structure is not possible. However, our results are consistent with recent work on natural materials that shows that the bastnäsite structure is stable up to 25 GPa at room temperature [47]. Anderson and Nafe [48] found that when comparing many compounds’ bulk moduli versus their specific ionic volumes, multiple trends emerged. Figure 12 displays their data, with additional data for carbonate minerals from Knittle [49], Merlini [50], and Xu [51]. Anderson and Nafe [48] identified a sulfide-selenide-telluride trend, an oxide trend, a fluorite trend, and an alkali-halide trend. Rhodochrosite, dolomite, ankerite, calcite, strontianite, and witherite form a separate carbonate trend (yellow line in Figure 12), but the hydroxycarbonates azurite and malachite do not lie on this trend. The values measured for bastnäsite-(La) in this study plot in a location consistent with the carbonate trend, the fluorite trend, as well as the oxide trend. Work on other fluorocarbonates needs to be completed in order to determine which of these trends bastnäsites follow, or if fluorocarbonates have a separate trend. If the speculation above that bastnäsite-(La)’s compressional anisotropy is related to rigid body behavior and orientation of the carbonate ions is correct, it is then likely that bastnäsites would follow the carbonate trend.
While some of our measurements were taken at elevated temperature and pressure (Table 5), there is not enough data to properly fit a high temperature and pressure equation of state. However, these data can be used to evaluate whether our isothermal and thermal equations of state can be combined to predict bastnäsite-(La)’s unit cell volume at high temperature and pressure. Thus, for each pressure temperature point measured in our heated DAC experiments, we calculated the value for Vo (at P = 0) using our values for the thermal equation of state [40], and then used our Birch–Murnaghan equation of state [41] to calculate the pressure required to produce the observed unit cell volume. The pressures calculated in this way agree well with those measured from the copper pressure standard. Table 8 lists the measured temperatures, unit cell volumes, and pressures, and the calculated pressures. Since the temperatures and volumes from the elevated temperature DAC experiments were not used in the fitting of Fei’s thermal equation of state or in the fitting of the Birch–Murnaghan equation of state, these data show that the combination of both equations is a reasonable approximation for modeling changes in volume due to both pressure and temperature simultaneously.

5. Conclusions

Compressibility, thermal expansion and phase stability are fundamental thermodynamic properties of materials, and as such are significant in understanding how they interact with the geologic settings in which the minerals naturally occur. Bastnäsite-La and the lanthanum oxyfluoride polymorphs addressed above are important REE-bearing compounds, and thus studying them is useful for understanding how REE bearing compounds form and participate in chemical reactions with other compounds. Additionally, since bastnäsite is found in carbonatites, it is an important mineral to investigate in order to understand carbonated magmas and the formation of carbonatite-related ore deposits. Gaining insight into the thermodynamic behavior of bastnäsite and other fluorocarbonates could potentially lead to better methods of locating and processing REE ore in the future.

Author Contributions

Conceptualization, R.L.R.II, P.C.B. and B.L.; methodology, R.L.R.II, B.L., K.E.V.K.; formal analysis, R.L.R.II and B.L.; investigation, R.L.R.II; resources, P.C.B. and L.R.D.; data curation, P.C.B.; writing—original draft preparation, R.L.R.II; writing—review and editing, P.C.B., L.R.D., and K.E.V.K.; supervision, P.C.B.; project administration, P.C.B.; funding acquisition, P.C.B. All authors have read and agreed to the published version of the manuscript.

Funding

This research was sponsored in part by the National Nuclear Security Administration under the Stewardship Science Academic Alliances program through the DOE Cooperative Agreement #DE-NA0001982 as well as by National Science Foundation grant EAR-1220548.

Acknowledgments

The high-pressure work was conducted at HPCAT (Sector 16), Advanced Photon Source (APS), Argonne National Laboratory. HPCAT operations are supported by DOE-NNSA’s Office of Experimental Sciences.The Advanced Photon Source, a U.S. Department of Energy (DOE) Office of Science User Facility operated for the DOE Office of Science by Argonne National Laboratory under Contract No. DE-AC02-06CH11357. Use of the COMPRES-GSECARS gas loading system was supported by COMPRES under NSF Cooperative Agreement EAR 11-57758 and by GSECARS through NSF grand EAR-1128799 and DOE grand DE-FG02-94ER1466. We thank Sergey Tkachev for his assistance with the gas loadings. This research also used resources and equipment at the National Aeronautics and Space Administration Lyndon B. Johnson Space Center’s Astromaterials Research and Exploration Science division. We thank Brad Sutter of Jacobs JETS at NASA Johnson Space Center for assistance with the high temperature powder XRD data collection and Joanna V. Hogancamp of Geocontrols Systems and Jacobs JETS at NASA Johnson Space Center for assistance with TGA, DSC, and EGA data collection. The authors also wish to thank several anonymous reviewers for helpful suggestions.

Conflicts of Interest

The authors declare no conflict of interest. The funders had no role in the design of the study; in the collection, analyses, or interpretation of data; in the writing of the manuscript, or in the decision to publish the results.

References

  1. Chen, Z. Global rare earth resources and scenarios of future rare earth industry. J. Rare Earths 2011, 29, 1–6. [Google Scholar] [CrossRef]
  2. Long, K.R.; Van Gosen, B.S.; Foley, N.K.; Cordier, D. The Principal Rare Earth Elements Deposits of the United States: A Summary of Domestic Deposits and a Global Perspective. US Geol. Surv. Sci. Investig. 2010, 2010, 96. [Google Scholar]
  3. Workman, R.K.; Hart, S.R. Major and trace element composition of the depleted MORB mantle (DMM). Earth Planet. Sci. Lett. 2005, 231, 53–72. [Google Scholar] [CrossRef]
  4. Ni, Y.; Hughes, J.M.; Mariano, A.N. The atomic arrangement of bastnäsite-(Ce), Ce(CO3)F, and structural elements of synchysite-(Ce), röntgenite-( Ce), and parisite-(Ce). Am. Mineral. 1993, 78, 415–418. [Google Scholar]
  5. Olson, J.C.; Shawe, D.R.; Pray, L.C.; Sharp, W.N.; Hewett, D.F. Rare-Earth Mineral Deposits of the Mountain Pass District San Bernardino County California. Geol. Surv. Prof. Pap. 1954, 261, 4–15. [Google Scholar]
  6. Williams-Jones, A.E.; Wood, S.A. A preliminary petrogenetic grid for REE fluorocarbonates and associated minerals. Geochim. Cosmochim. Acta 1992, 56, 725–738. [Google Scholar] [CrossRef]
  7. Hsu, L.C. Synthesis and Stability of Bastnaesites in a Part of the System (Ce,La)-F-H-C-O. Mineral. Petrol. 1992, 47, 87–101. [Google Scholar] [CrossRef]
  8. Schmandt, D.S.; Cook, N.J.; Ciobanu, C.L.; Ehrig, K.; Wade, B.P.; Gilbert, S.; Kamenetsky, V.S. Rare earth element fluorocarbonate minerals from the olympic dam Cu-U-Au-Ag deposit, South Australia. Minerals 2017, 7, 202. [Google Scholar] [CrossRef] [Green Version]
  9. Oftedal, I. Zur Kristallstruktur von Bastnäsit, (Ce,La)FCO3. Zeitschrift fur Krist. Krist. Krist. Krist. 1931, 78, 462. [Google Scholar]
  10. Donnay, G.; Donnay, J.D.H. The Crystallography of Bastnaesite, Parisite, Roentgenite, and Synchisite. Am. Mineral. 1953, 38, 932–963. [Google Scholar]
  11. Castor, S.B. Rare Earth Deposits of North America. Resour. Geol. 2008, 58, 337–347. [Google Scholar] [CrossRef]
  12. Castor, S.B. The Mountain Pass Rare-Earth Carbonatite and Associated Ultrapotassic Rocks, California. Can. Mineral. 2008, 46, 779–806. [Google Scholar] [CrossRef]
  13. Shivaramaiah, R.; Anderko, A.; Riman, R.E.; Navrotsky, A. Thermodynamics of bastnaesite: A major rare earth ore mineral. Am. Mineral. 2016, 101, 1129–1134. [Google Scholar] [CrossRef]
  14. Gysi, A.P.; Williams-Jones, A.E. The thermodynamic properties of bastnäsite-(Ce) and parisite-(Ce). Chem. Geol. 2015, 392, 87–101. [Google Scholar] [CrossRef]
  15. Janka, O.; Schleid, T. Facile Synthesis of Bastnaesite-Type LaF[CO3] and Its Thermal Decomposition to LaOF for Bulk and Eu3+-Doped Samples. Eur. J. Inorg. Chem. 2009, 2009, 357–362. [Google Scholar] [CrossRef]
  16. Woo, D.C.; Lee, M.-H.; Jung, W.-S. Synthesis and characterization of rhombohedral- and tetragonal-lanthanum oxyfluoride powders. Ceram. Int. 2013, 39, 1533–1538. [Google Scholar] [CrossRef]
  17. Jacob, K.T.; Saji, V.S.; Waseda, Y. Lanthanum Oxyfluoride: Structure, Stability, and Ionic Conductivity. Int. J. Appl. Ceram. Technol. 2006, 3, 312–321. [Google Scholar] [CrossRef]
  18. Fergus, J.W.; Chen, H.-P. Structure and Conductivity of Tetragonal and Rhombohedral Lanthanum Oxyfluoride Compounds. J. Electrochem. Soc. 2000, 147, 4696–4704. [Google Scholar] [CrossRef]
  19. Shinn, D.B.; Eick, H.A. Phase Analyses of Lanthanide Oxide Fluorides. Inorg. Chem. 1969, 8, 232–235. [Google Scholar] [CrossRef]
  20. Zachariasen, W.H. Crystal Chemical Studies of the 5f-series of Elements. XIV. Oxyfluorides, XOF. Acta Crystallogr. 1951, 4, 231–236. [Google Scholar] [CrossRef]
  21. Pistorius, C.W.F.T. Effect of Pressure on the Rhombohedral/Cubic Transitions of Some Lanthanide Oxide Fluorides. J. Less-Common Met. 1973, 31, 119–124. [Google Scholar] [CrossRef]
  22. Klemm, V.W.; Klein, H.-A. Lanthanoxyfluorid [Lanthanum Oxyfluoride]. Zeitschrift fur Anorg. und Allg. Chemie 1941, 248, 167–171, in Germany. [Google Scholar]
  23. Mathews, M.D.; Tyagi, A.K.; Moorthy, P.N. Study of phase transition in REOF system by dilatometry (RE = La, Nd, Sm, Gd, Eu and Y). Thermochim. Acta 1997, 298, 165–167. [Google Scholar] [CrossRef]
  24. Achary, S.N.; Ambekar, B.R.; Mathews, M.D.; Tyagi, A.K.; Moorthy, P.N. Study of phase transition and volume thermal expansion in a rare-earth (RE) oxyfluoride system by high-temperature XRD (RE = La, Nd, Sm, Eu and Gd). Thermochim. Acta 1998, 320, 239–243. [Google Scholar] [CrossRef]
  25. Holtstam, D.; Grins, J.; Nysten, P. Håleniusite- (La) from the Bastnäs Deposit, Västmandland, Sweden: A new REE Oxyfluoride Mineral Species. Can. Mineral. 2004, 42, 1097–1103. [Google Scholar] [CrossRef]
  26. Momma, K.; Izumi, F. VESTA 3 for three-dimensional visualization of crystal, volumetric and morphology data. J. Appl. Crystallogr. 2011, 44, 1272–1276. [Google Scholar] [CrossRef]
  27. Tullis, T.E.; Tullis, J. Experimental Rock Deformation Techniques. Geophys. Monogr. 1986, 36, 297–324. [Google Scholar]
  28. Rowland, R.L., II. Phase Equilibria, Compressibility, and Thermal Analysis of Bastnaesite-(La); University of Nevada: Las Vegas, NV, USA, 2017. [Google Scholar]
  29. Altomare, A.; Corriero, N.; Cuocci, C.; Falcicchio, A.; Moliterni, A.; Rizzi, R. QUALX2.0: A qualitative phase analysis software using the freely available database POW_COD. J. Appl. Crystallogr. 2015, 48, 598–603. [Google Scholar] [CrossRef]
  30. Holland, T.J.B.; Redfern, S.A.T. Unit cell refinement from powder diffraction data: the use of regression diagnostics. Mineral. Mag. 1997, 61, 65–77. [Google Scholar] [CrossRef]
  31. Angel, R.J.; Gonzalez-Platas, J.; Alvaro, M. EosFit7c and a Fortran module (library) for equation of state calculations. Zeitschrift fur Krist. 2014, 229, 405–419. [Google Scholar] [CrossRef]
  32. Kantor, I.; Prakapenka, V.; Kantor, A.; Dera, P.; Kurnosov, A.; Sinogeikin, S.; Dubrovinskaia, N.; Dubrovinsky, L. BX90: A new diamond anvil cell design for X-ray diffraction and optical measurements. Rev. Sci. Instrum. 2012, 83. [Google Scholar] [CrossRef] [PubMed]
  33. Hrubiak, R.; Sinogeikin, S.; Rod, E.; Shen, G. The laser micro-machining system for diamond anvil cell experiments and general precision machining applications at the High Pressure Collaborative Access Team. Rev. Sci. Instrum. 2015, 86. [Google Scholar] [CrossRef] [PubMed]
  34. Rivers, M.; Prakapenka, V.B.; Kubo, A.; Pullins, C.; Holl, C.M.; Jacobsen, S.D. The COMPRES/GSECARS gas-loading system for diamond anvil cells at the Advanced Photon Source. High Press. Res. 2008, 28, 273–292. [Google Scholar] [CrossRef]
  35. Mao, H.K.; Xu, J.; Bell, P.M. Calibration of the Ruby Pressure Gauge to 800 kbar Under Quasi-Hydrostatic Conditions. J. Geophys. Res. 1986, 91, 4673. [Google Scholar] [CrossRef]
  36. Hirose, K.; Sata, N.; Komabayashi, T.; Ohishi, Y. Simultaneous volume measurements of Au and MgO to 140 GPa and thermal equation of state of Au based on the MgO pressure scale. Phys. Earth Planet. Inter. 2008, 167, 149–154. [Google Scholar] [CrossRef]
  37. Wang, Y.; Zhang, J.; Xu, H.; Lin, Z.; Daemen, L.L.; Zhao, Y.; Wang, L. Thermal equation of state of copper studied by high P-T synchrotron X-ray diffraction. Appl. Phys. Lett. 2009, 94, 4. [Google Scholar] [CrossRef]
  38. Hammersley, A.P. FIT2D: A multi-purpose data reduction, analysis and visualization program. J. Appl. Crystallogr. 2016, 49, 646–652. [Google Scholar] [CrossRef]
  39. Dera, P.; Zhuravlev, K.; Prakapenka, V.; Rivers, M.L.; Finkelstein, G.J.; Grubor-Urosevic, O.; Tschauner, O.; Clark, S.M.; Downs, R.T. High pressure single-crystal micro X-ray diffraction analysis with GSE_ADA/RSV software. High Press. Res. 2013, 33, 466–484. [Google Scholar] [CrossRef]
  40. Fei, Y. Thermal Expansion. In Mineral Physics and Crystallography: A Handbook of Physical Constants; Ahrens, T.J., Ed.; American Geophysical Union: Washington, DC, USA, 1995; pp. 29–44. ISBN 0-87590-852-7. [Google Scholar]
  41. Birch, F. Finite Elastic Strain of Cubic Crystals. Phys. Rev. 1947, 71, 809–824. [Google Scholar] [CrossRef]
  42. Ye, Y.; Smyth, J.R.; Boni, P. Crystal structure and thermal expansion of aragonite-group carbonates by single-crystal X-ray diffraction. Am. Mineral. 2012, 97, 707–712. [Google Scholar] [CrossRef]
  43. Markgraf, S.A.; Reeder, R.J. High-temperature structure refinements of calcite and magnesite. Am. Mineral. 1985, 70, 590–600. [Google Scholar]
  44. Ross, N.L.; Reeder, R.J. High-pressure structural study of dolomite and ankerite. Am. Mineral. 1992, 77, 412–421. [Google Scholar]
  45. Ross, N.L. The equation of state and high-pressure behavior of magnesite. Am. Mineral. 1997, 82, 682–688. [Google Scholar] [CrossRef] [Green Version]
  46. Zhang, J.; Reeder, R.J. Comparative compressibilities of calcite-structure carbonates: Deviations from empirical relations. Am. Mineral. 1999, 84, 861–870. [Google Scholar] [CrossRef]
  47. Vennari, C.E.; Williams, Q. High-pressure Raman and Nd3+ luminescence spectroscopy of bastnäsite-(REE)CO3F. Am. Mineral. 2019, 104, 1389–1401. [Google Scholar] [CrossRef]
  48. Anderson, O.L.; Nafe, J.E. The Bulk Modulus-Volume Relationship for Oxide Compounds and Related Geophysical Problems. J. Geophys. Res. 1965, 70, 3951–3963. [Google Scholar] [CrossRef]
  49. Knittle, E. Static Compression Measurements of Equation of State. In Mineral physics and Crystallography: A Handbook of Physical Constants; Ahrens, T.A., Ed.; American Geophysical Union: Washington, DC, USA, 1995; pp. 98–142. [Google Scholar]
  50. Merlini, M.; Perchiazzi, N.; Hanfland, M.; Bossak, A. Phase transition at high pressure in Cu2CO3(OH)2 related to the reduction of the Jahn–Teller effect. Acta Crystallogr. Sect. B Struct. Sci. 2012, B68, 266–274. [Google Scholar] [CrossRef]
  51. Xu, J.; Kuang, Y.; Zhang, B.; Liu, Y.; Fan, D.; Zhou, W.; Xie, H. High-pressure study of azurite Cu3(CO3)2(OH)2 by synchrotron radiation X-ray diffraction and Raman spectroscopy. Phys. Chem. Miner. 2015, 42, 805–816. [Google Scholar] [CrossRef]
Figure 1. Structure of bastnäsite-(La) generated in the software VESTA [26], (a) as viewed down the c- axis, (b) as viewed down the a*- axis [4]. In both images, the trigonal planar polyhedral for the CO32− ions are highlighted.
Minerals 10 00212 g001
Figure 2. Powder XRD patterns of synthesized bastnäsite-(La) starting material. Top pattern is after washing and drying, bottom pattern is after annealing in the Griggs modified piston cylinder apparatus.
Minerals 10 00212 g002
Figure 3. Thermogravimetric analysis (TGA) curves for annealed bastnäsite-(La), unannealed starting material, and LaOF from 325 K to 1223 K. CO2 detection from the Pfeiffer Vacuum Thermostar Quadrupole mass spectrometer in light gray. Mass loss curves for the starting material and annealed bastnäsite-(La) begin to steepen at 600 K, at the same time CO2 detection begins. The mass loss curve for LaOF does not show a significant change in slope, indicating that the decomposition reaction did not occur in that sample.
Minerals 10 00212 g003
Figure 4. Differential scanning calorimetry (DSC) curves for annealed bastnäsite-(La), unannealed starting material, and LaOF from 325 K to 1223 K. Endotherms can be seen on both the annealed bastnäsite-(La), and unannealed starting material curves from the range near 598 K to 773 K, indicating the decomposition reaction. The LaOF curve does not exhibit this, since it did not decompose. Exotherms at 948 K and endotherms at 1123 K are evident on all three curves, indicating phase transformations.
Minerals 10 00212 g004
Figure 5. High temperature powder X-ray diffraction patterns from 598 K to 723 K. Bottom pattern is 598 K, and the patterns go up in 25° temperature increments. Bottom-most pattern exhibits only bastnäsite-(La). Top-most pattern exhibits only γ-LaOF. The middle six patterns exhibit both species as the decomposition reaction progresses from bastnäsite-(La) to γ-LaOF.
Minerals 10 00212 g005
Figure 6. Measured unit cell volumes for bastnäsite-(La), as a function of temperature from 298 K to 723 K. The dotted black line is the fit for the Fei thermal equation of state [40].
Minerals 10 00212 g006
Figure 7. Measured unit cell volumes for tetragonal γ-LaOF as a function of temperature from 723 K to 948 K. The dotted black line is the fit for the Fei thermal equation of state [40].
Minerals 10 00212 g007
Figure 8. Measured unit cell volumes for cubic α-LaOF as a function of temperature from 973 K to 1123 K. Gray-filled circles represent data used to fit the thermal equation of state in this temperature range. White diamonds represent temperature points 1148 K and 1173 K, which are above the temperature that coincides with a contraction in unit cell volume and an exotherm on the DSC curve. The dotted black line is the fit for the Fei thermal equation of state [40].
Minerals 10 00212 g008
Figure 9. Pressure-volume data measured for bastnäsite-(La) fit to the 3rd order Birch–Murnaghan equation of state [41]. V0 = 439.82 Å3, K0 = 105 GPa, K’ = 5.58. Gray circles are measured volumes from Table 4, and dotted line represents equation of state fit to data.
Minerals 10 00212 g009
Figure 10. Comparisons of ambient pressure thermal equations of state for different carbonate minerals. Gray circles represent bastnäsite-(La) data from this study, and the dotted black line represent the fitted Fei equation of state [40] for bastnäsite-(La). Thermal equations of state are shown for calcite (CaCO3), magnesite (MgCO3) [43], witherite (BaCO3), cerrusite (PbCO3), strontianite (SrCO3), and aragonite (CaCO3) [42].
Minerals 10 00212 g010
Figure 11. Comparisons of ambient pressure thermal equations of state for cubic REE-OF compounds from this study and using data from Achary et al. [24] (solid symbols). Gray circles are data for cubic α-LaOF from this study.
Minerals 10 00212 g011
Figure 12. Bulk modulus versus specific volume for simple oxides, alkali halides, fluorites, sulfides, selenides, tellurides, and carbonates. Small circles include data from [48] and [49]. Large purple star is the value for bastnäsite-(La) measured in this study (2M/Pρ = 12.60 cm3/mol, Ko = 105 GPa), large orange diamonds are carbonates from [49], and green triangles are malachite and azurite from [50,51]. Dark gray line is the oxide trend, black line is the sulfide, selenide, and telluride trend, light gray line is the fluorite trend, medium gray line is the alkali-halide trend, and orange line is proposed carbonate trend.
Minerals 10 00212 g012
Table 1. Measured lattice parameters and volume for bastnäsite-(La) from 298 to 723 K.
Temperature (K)a (Å)Uncertaintyc (Å)UncertaintyV (Å3)Uncertaintya/c ratio
2987.18670.000859.83280.00083439.820.1850.7309
3237.18970.000859.83470.00083440.260.1850.7311
3737.19540.000859.83940.00083441.180.1850.7313
4237.19920.000859.84380.00083441.840.1850.7313
4737.20440.000859.84860.00083442.690.1860.7315
4987.20740.000859.85040.00083443.140.1860.7317
5237.20960.000859.85390.00083443.570.1860.7316
5487.21250.000859.85640.00083444.040.1860.7318
5737.21590.000859.85720.00083444.500.1860.7320
5987.21720.000859.85980.00083444.760.1860.7320
6237.22050.000869.86260.00083445.300.1860.7321
6487.22380.000869.86690.00083445.910.1870.7321
6737.22660.000869.86690.00083446.250.1870.7324
6987.22960.000869.87300.00083446.900.1870.7323
7237.23390.000869.87310.00083447.430.1870.7327
Table 2. Measured lattice parameters and volumes for γ-LaOF at 298 K, and from 723 K to 948 K.
Temperature (K)a (Å)Uncertaintyc (Å)UncertaintyV (Å3)Uncertainty
2984.07980.000415.7980.002096.510.118
7234.12420.000455.8550.003099.590.130
7484.11920.000415.8730.002099.650.119
7734.11920.000415.8730.002099.650.119
7984.12130.000425.8620.002099.570.119
8234.12300.000425.8620.002099.640.119
8484.12460.000425.8670.002099.800.119
8734.12760.000425.8640.002099.910.119
8984.12930.000425.8600.002099.920.119
9234.12860.000505.8660.002299.990.122
9484.13110.000425.8590.0020100.000.119
Table 3. Measured lattice parameters and volumes for α-LaOF from 973 K to 1173 K.
Temperature (K)a (Å)UncertaintyV (Å3)Uncertainty
2985.756 *0.003 *190.71 *
9735.84240.00049199.420.138
9985.84430.00049199.620.138
10235.84760.00050199.950.138
10485.84890.00050200.080.138
10735.85000.00050200.200.138
10985.85260.00050200.470.138
11235.85380.00050200.600.138
11485.85310.00050200.520.138
11735.85110.00050200.320.138
* values for ambient temperature (298 K) from [22], because this structure was not recoverable to room temperature by quenching in the XRK-900 reactor stage.
Table 4. Bastnäsite-(La) measured lattice parameters, unit cell volumes, a/c crystallographic axis ratios, pressure transmitting media, and pressure standards from 0 GPa to 11.3 GPa at ambient temperature.
Pressure (GPa)a (Å)Uncertaintyc (Å)UncertaintyV (Å3)Uncertaintya/c RatioPressure MediaPressure Standard
0.007.1870.0029.8330.040439.820.0440.7309n/an/a
0.537.1690.0039.8110.003436.680.0090.7307NeAu
1.357.1480.0039.8060.003433.910.0080.7289NeAu
1.397.1590.0019.7630.003433.320.0060.7333HeCu
1.537.1580.0019.7800.003433.960.0060.7319HeCu
1.697.1500.0029.7870.004433.300.0080.7306HeCu
2.117.1440.0049.7660.006431.640.0130.7315NeAu
2.157.1450.0019.7690.003431.880.0050.7314HeCu
2.827.1290.0019.7510.003429.180.0050.7311HeCu
2.907.1170.0029.7610.002428.150.0060.7291NeAu
3.697.1110.0019.7340.002426.230.0040.7305HeCu
3.877.0950.0039.7380.003424.530.0090.7286NeAu
6.477.0510.0039.6940.003417.380.0090.7274NeAu
8.347.0140.0039.6630.003411.650.0090.7259NeAu
10.606.9730.0039.6320.003405.590.0090.7239NeAu
11.316.9740.0049.5930.003404.060.0110.7270NeAu
Table 5. Bastnäsite-(La) measured lattice parameters, unit cell volumes, and a/c crystallographic axis ratios from 4.9 GPa to 7.7 GPa pressure and from 347 K to 673 K temperature.
Pressure (GPa)Temp (K)a (Å)Uncertaintyc (Å)UncertaintyV (Å3)Uncertaintya/c Ratio
4.93477.0860.0019.7300.002423.110.0050.7283
5.13247.0840.0029.7210.002422.470.0060.7287
5.83737.0760.0029.6960.002420.440.0060.7298
6.54237.0700.0029.6990.003419.850.0070.7289
6.74737.0600.0029.6910.002418.320.0060.7285
6.75237.0630.0029.6970.003418.930.0070.7284
7.05737.0570.0029.7130.003418.910.0070.7266
7.36237.0650.0019.6940.002419.010.0050.7288
7.76737.0640.0029.6850.002418.530.0060.7294
Table 6. Calculated thermal expansion coefficients for bastnäsite-(La), γ-LaOF, and α-LaOF.
MaterialDimensionTemp. Range (K)α298
× 10−5
a0
× 10−5
a1
× 10−7
a2
bastnäsite-(La)a(a0 = 7.1867 Å)298–7231.73−1.080.3731.502
c(c0 = 9.8328 Å)298–7230.9510.2470.1160.319
V(V0 = 439.82 Å3)298–7234.32−1.680.8343.126
γ-LaOFa(a0 = 4.0798 Å)723–94813.5−17.91.9022.879
c(c0 = 5.798 Å)723–9480.1790.1785−0.2298.154
V(V0 = 96.51 Å3)723–94829.5−24.12.4241.147
α-LaOFa(a0 = 5.756 Å)973–1123−0.8448.46−0.625−6.606
V(V0 = 190.71 Å3)973–1123−1.1223.6−1.73−17.362
Note: Reference temperature for all fits is 298 K.
Table 7. Calculated thermal expansion coefficients for cubic REE-oxyfluorides.
MaterialTemp. Range (K)Vo3)α298
× 10−5
ao
× 10−5
a1
× 10−7
a2
α-LaOF †973–1123190.71−1.1223.6−1.73−17.362
α-LaOF *823–1077196.10.8550.00170.2860.0001
NdOF *823–1075183.80.2680.00070.08950.0001
SmOF *811–1075176.21.41.40.000280
EuOF *815–1077168.24.494.490.000520.0001
GdOF *913–1067172.60.4610.00440.15300
Note: Reference temperature for all fits is 298 K; † this study; * data from Achary, et. al [24].
Table 8. List of heated DAC experiments comparing measured pressure using the Cu standard versus calculated pressures using the Fei thermal EOS [40] parameters. Difference is calculated by subtracting the measured pressure from the calculated pressure. Error is calculated by dividing the difference by the measured pressure.
Temp (K)V (Å3)Measured P (GPa)Calculated P (GPa)DifferenceError
347423.114.905.030.130.03
324422.475.095.110.020.00
373420.445.786.020.240.04
423419.856.466.460.000.00
473418.326.747.230.490.07
523418.936.717.280.570.08
573418.916.977.570.600.09
623419.017.337.840.510.07
673418.537.698.330.640.08

