X-ray Laue Microdiffraction and Raman Spectroscopic Investigation of Natural Silicon and Moissanite

 ,
,  and
and
Abstract

1. Introduction
2. Materials and Methods
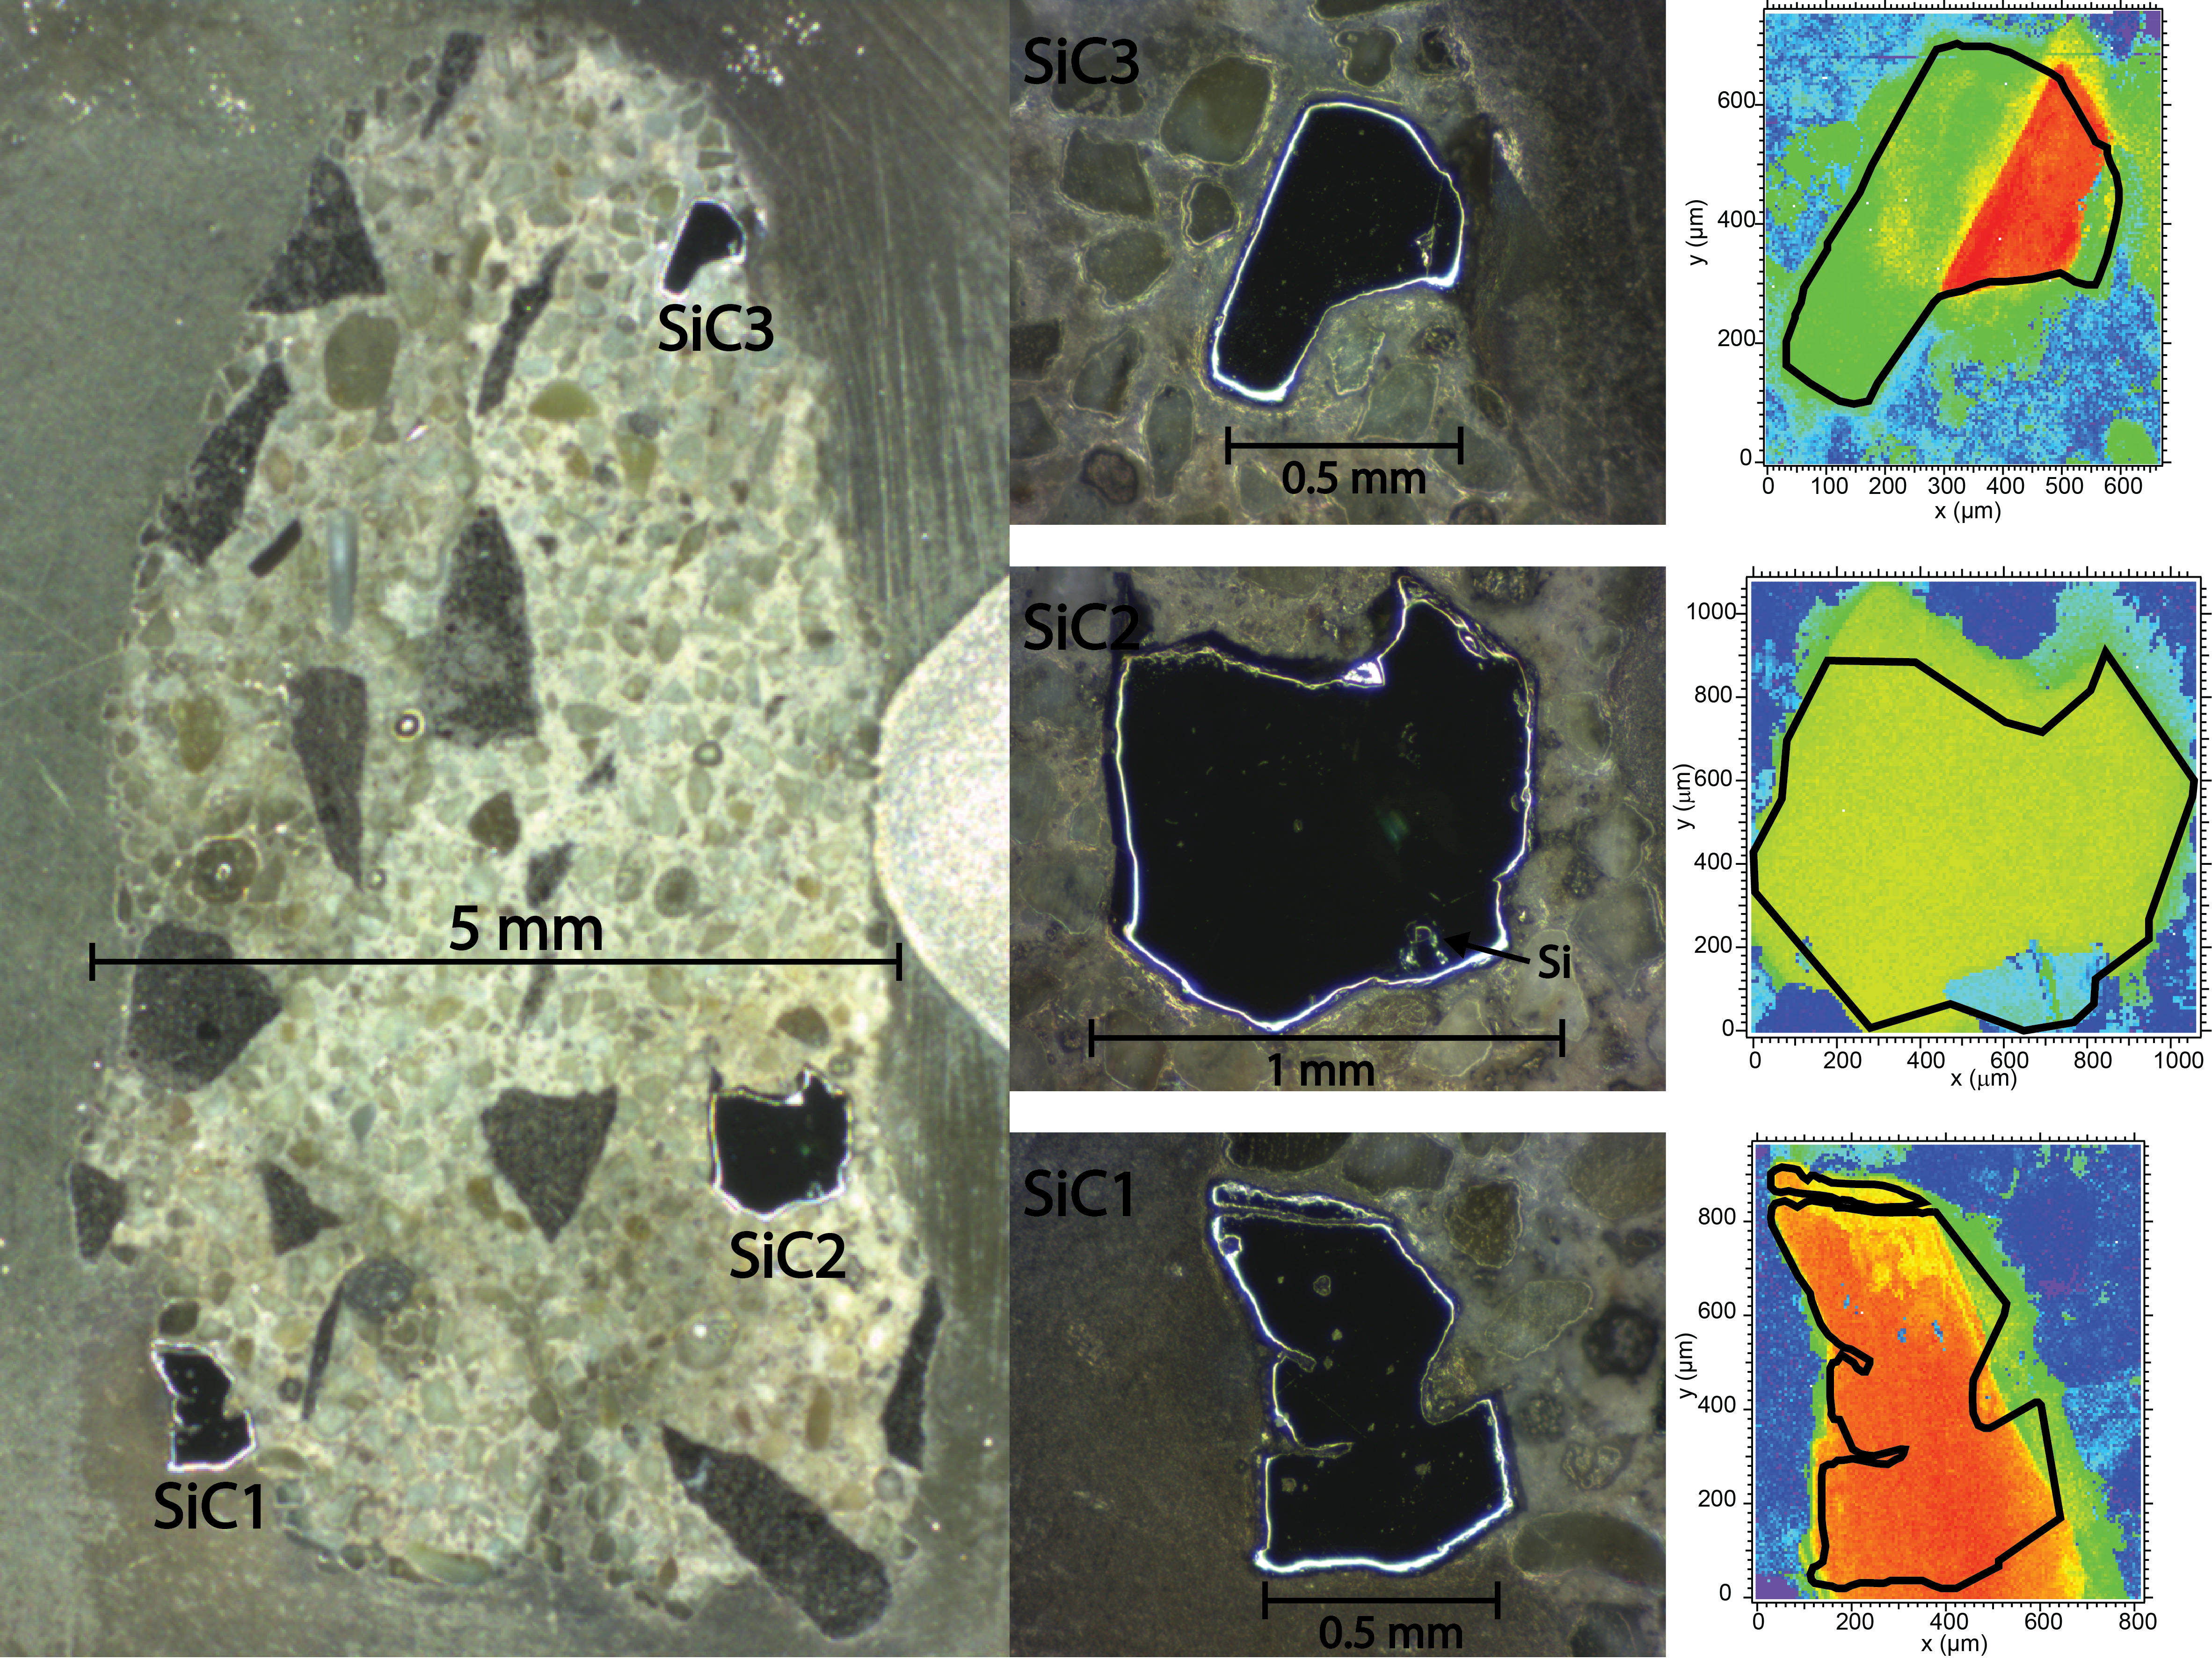
2.1. Sample Description
2.2. Data Collection
3. Results
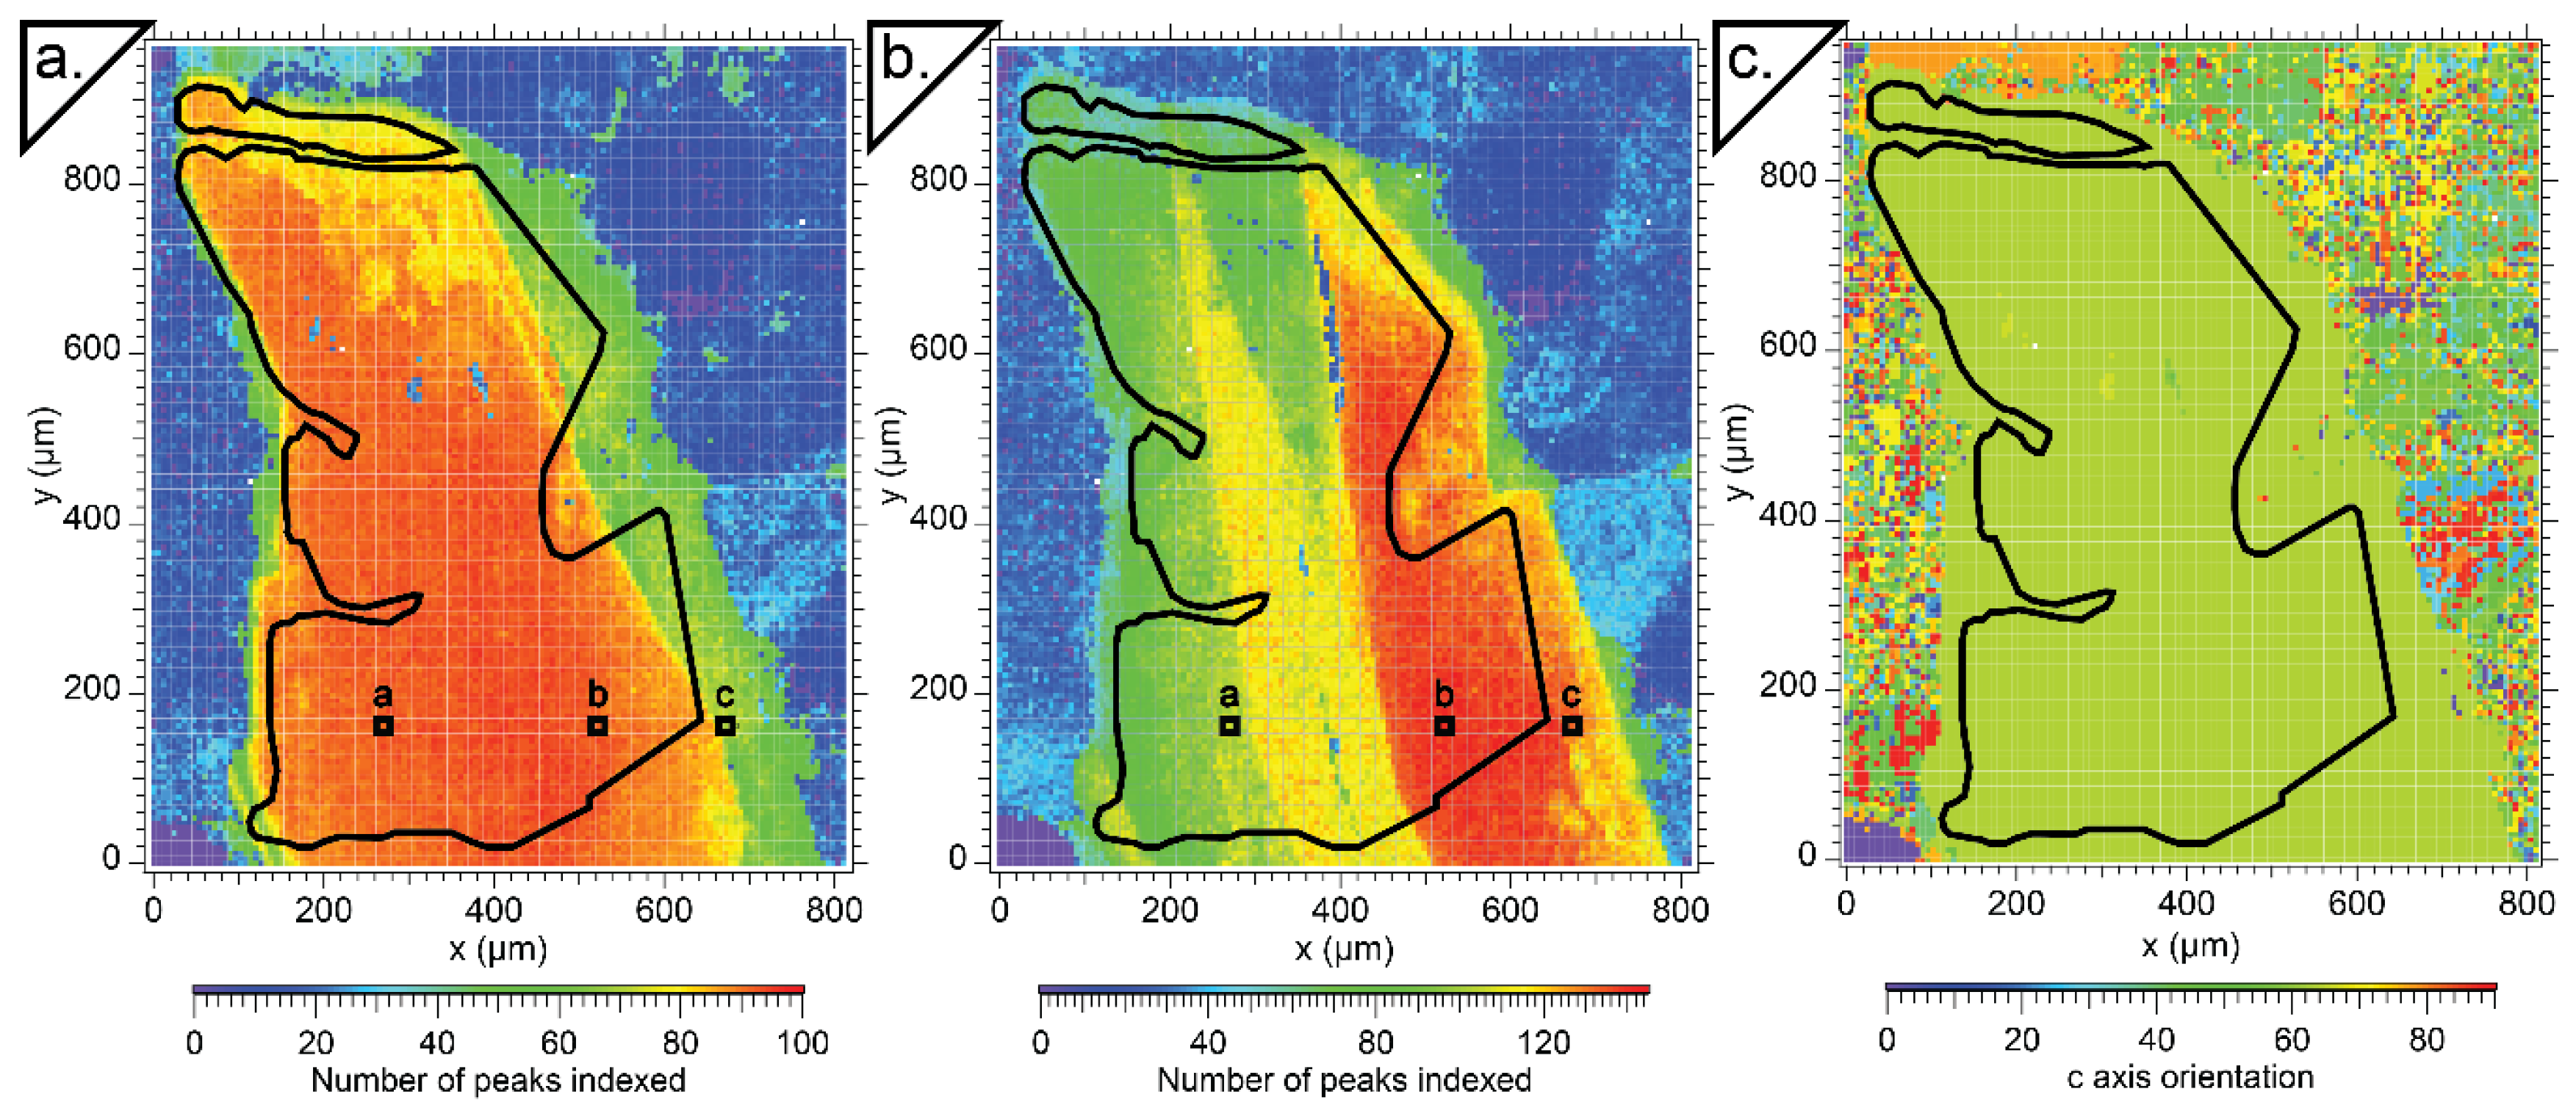
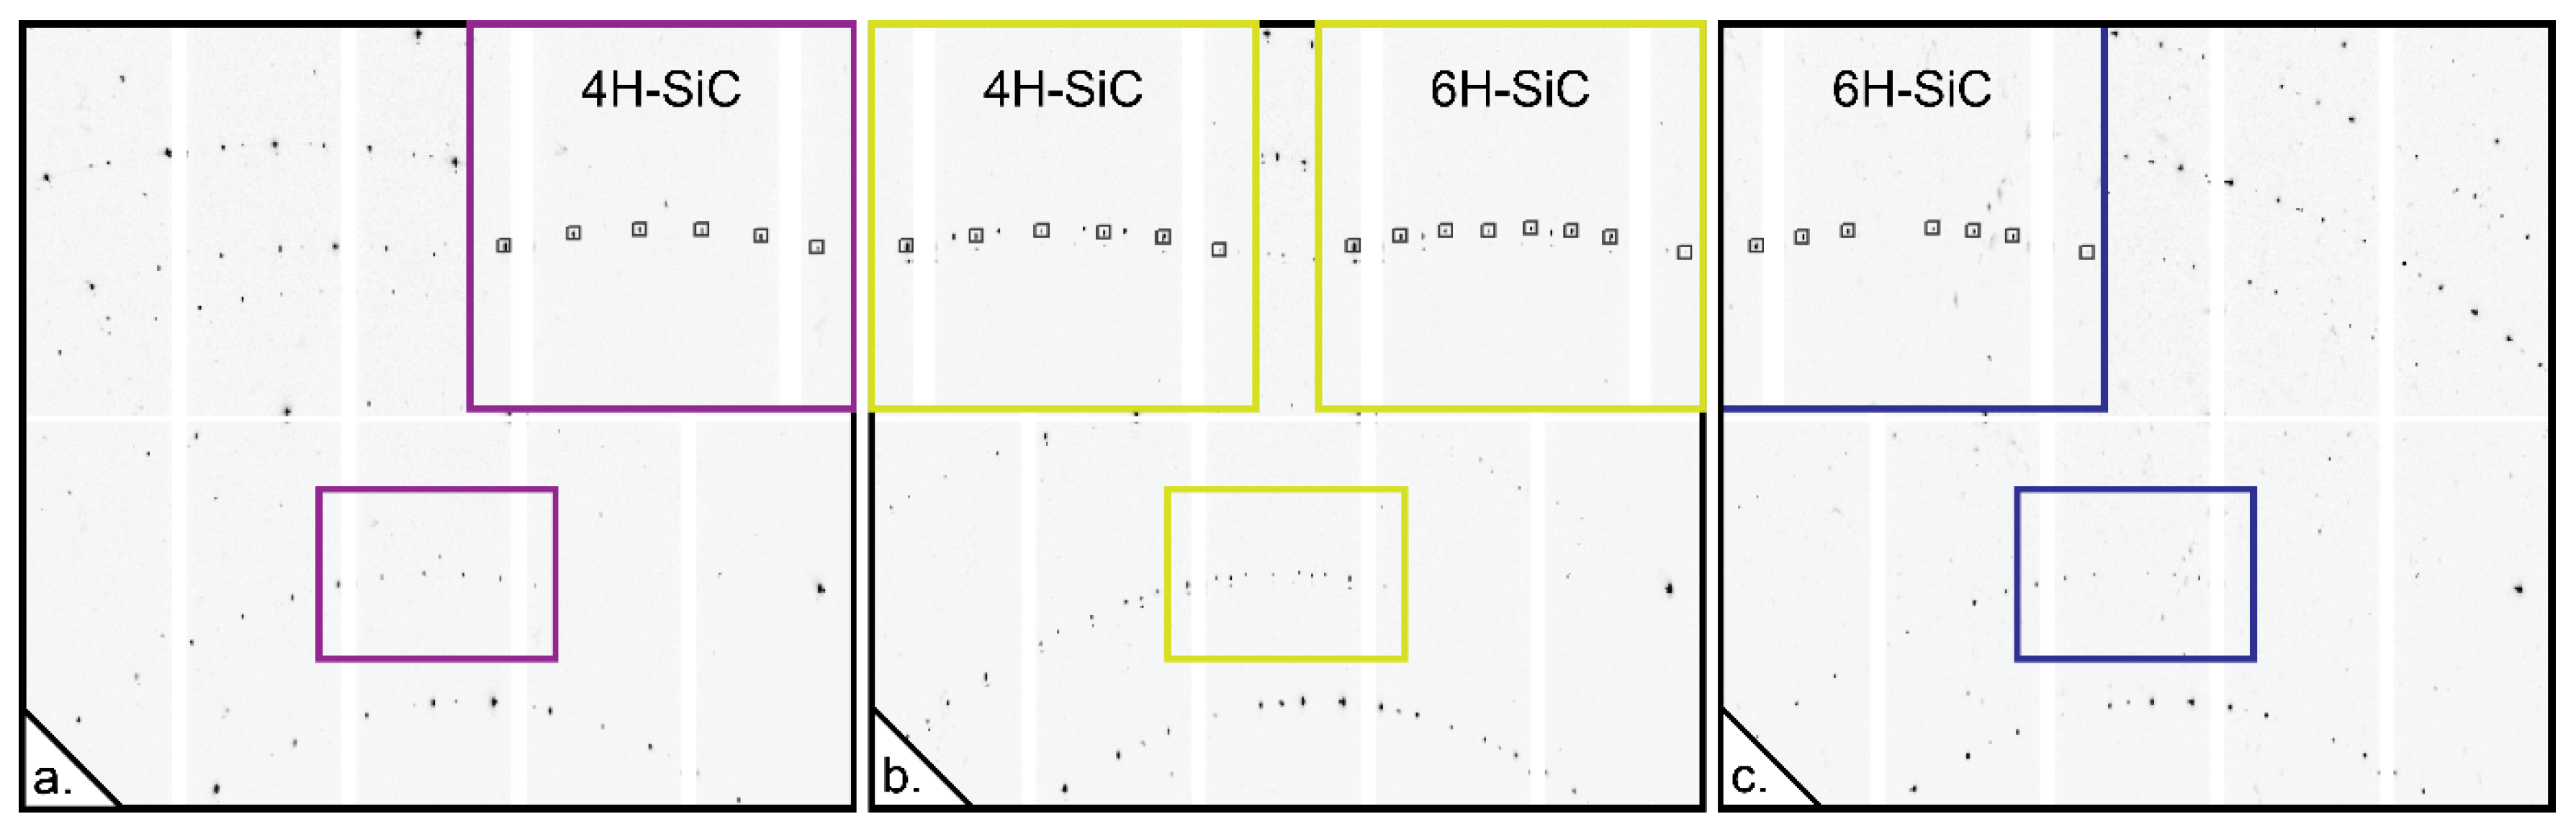
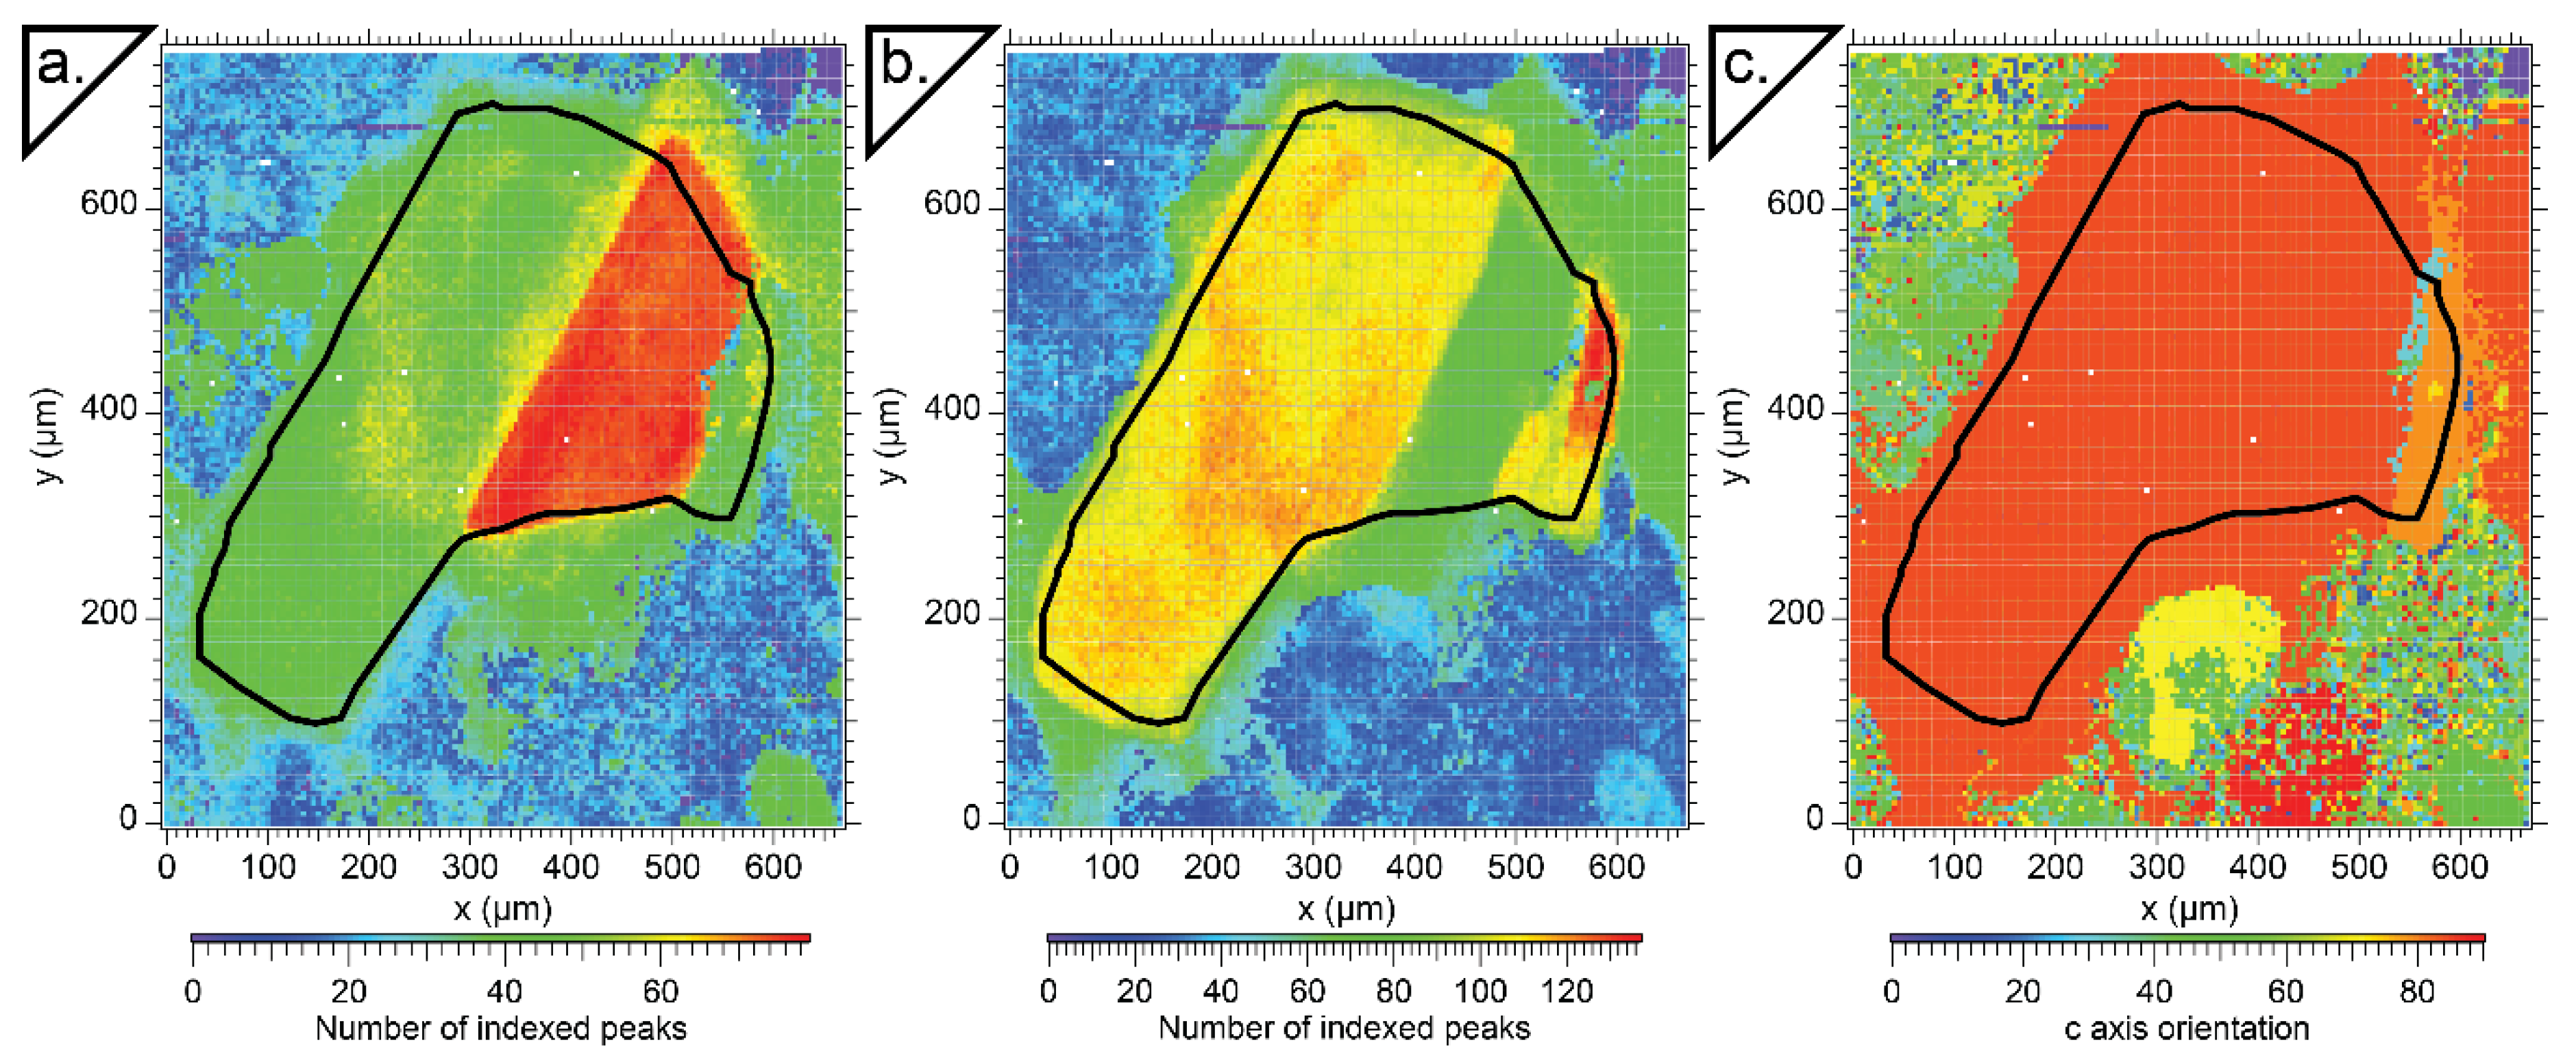
3.1. SiC1
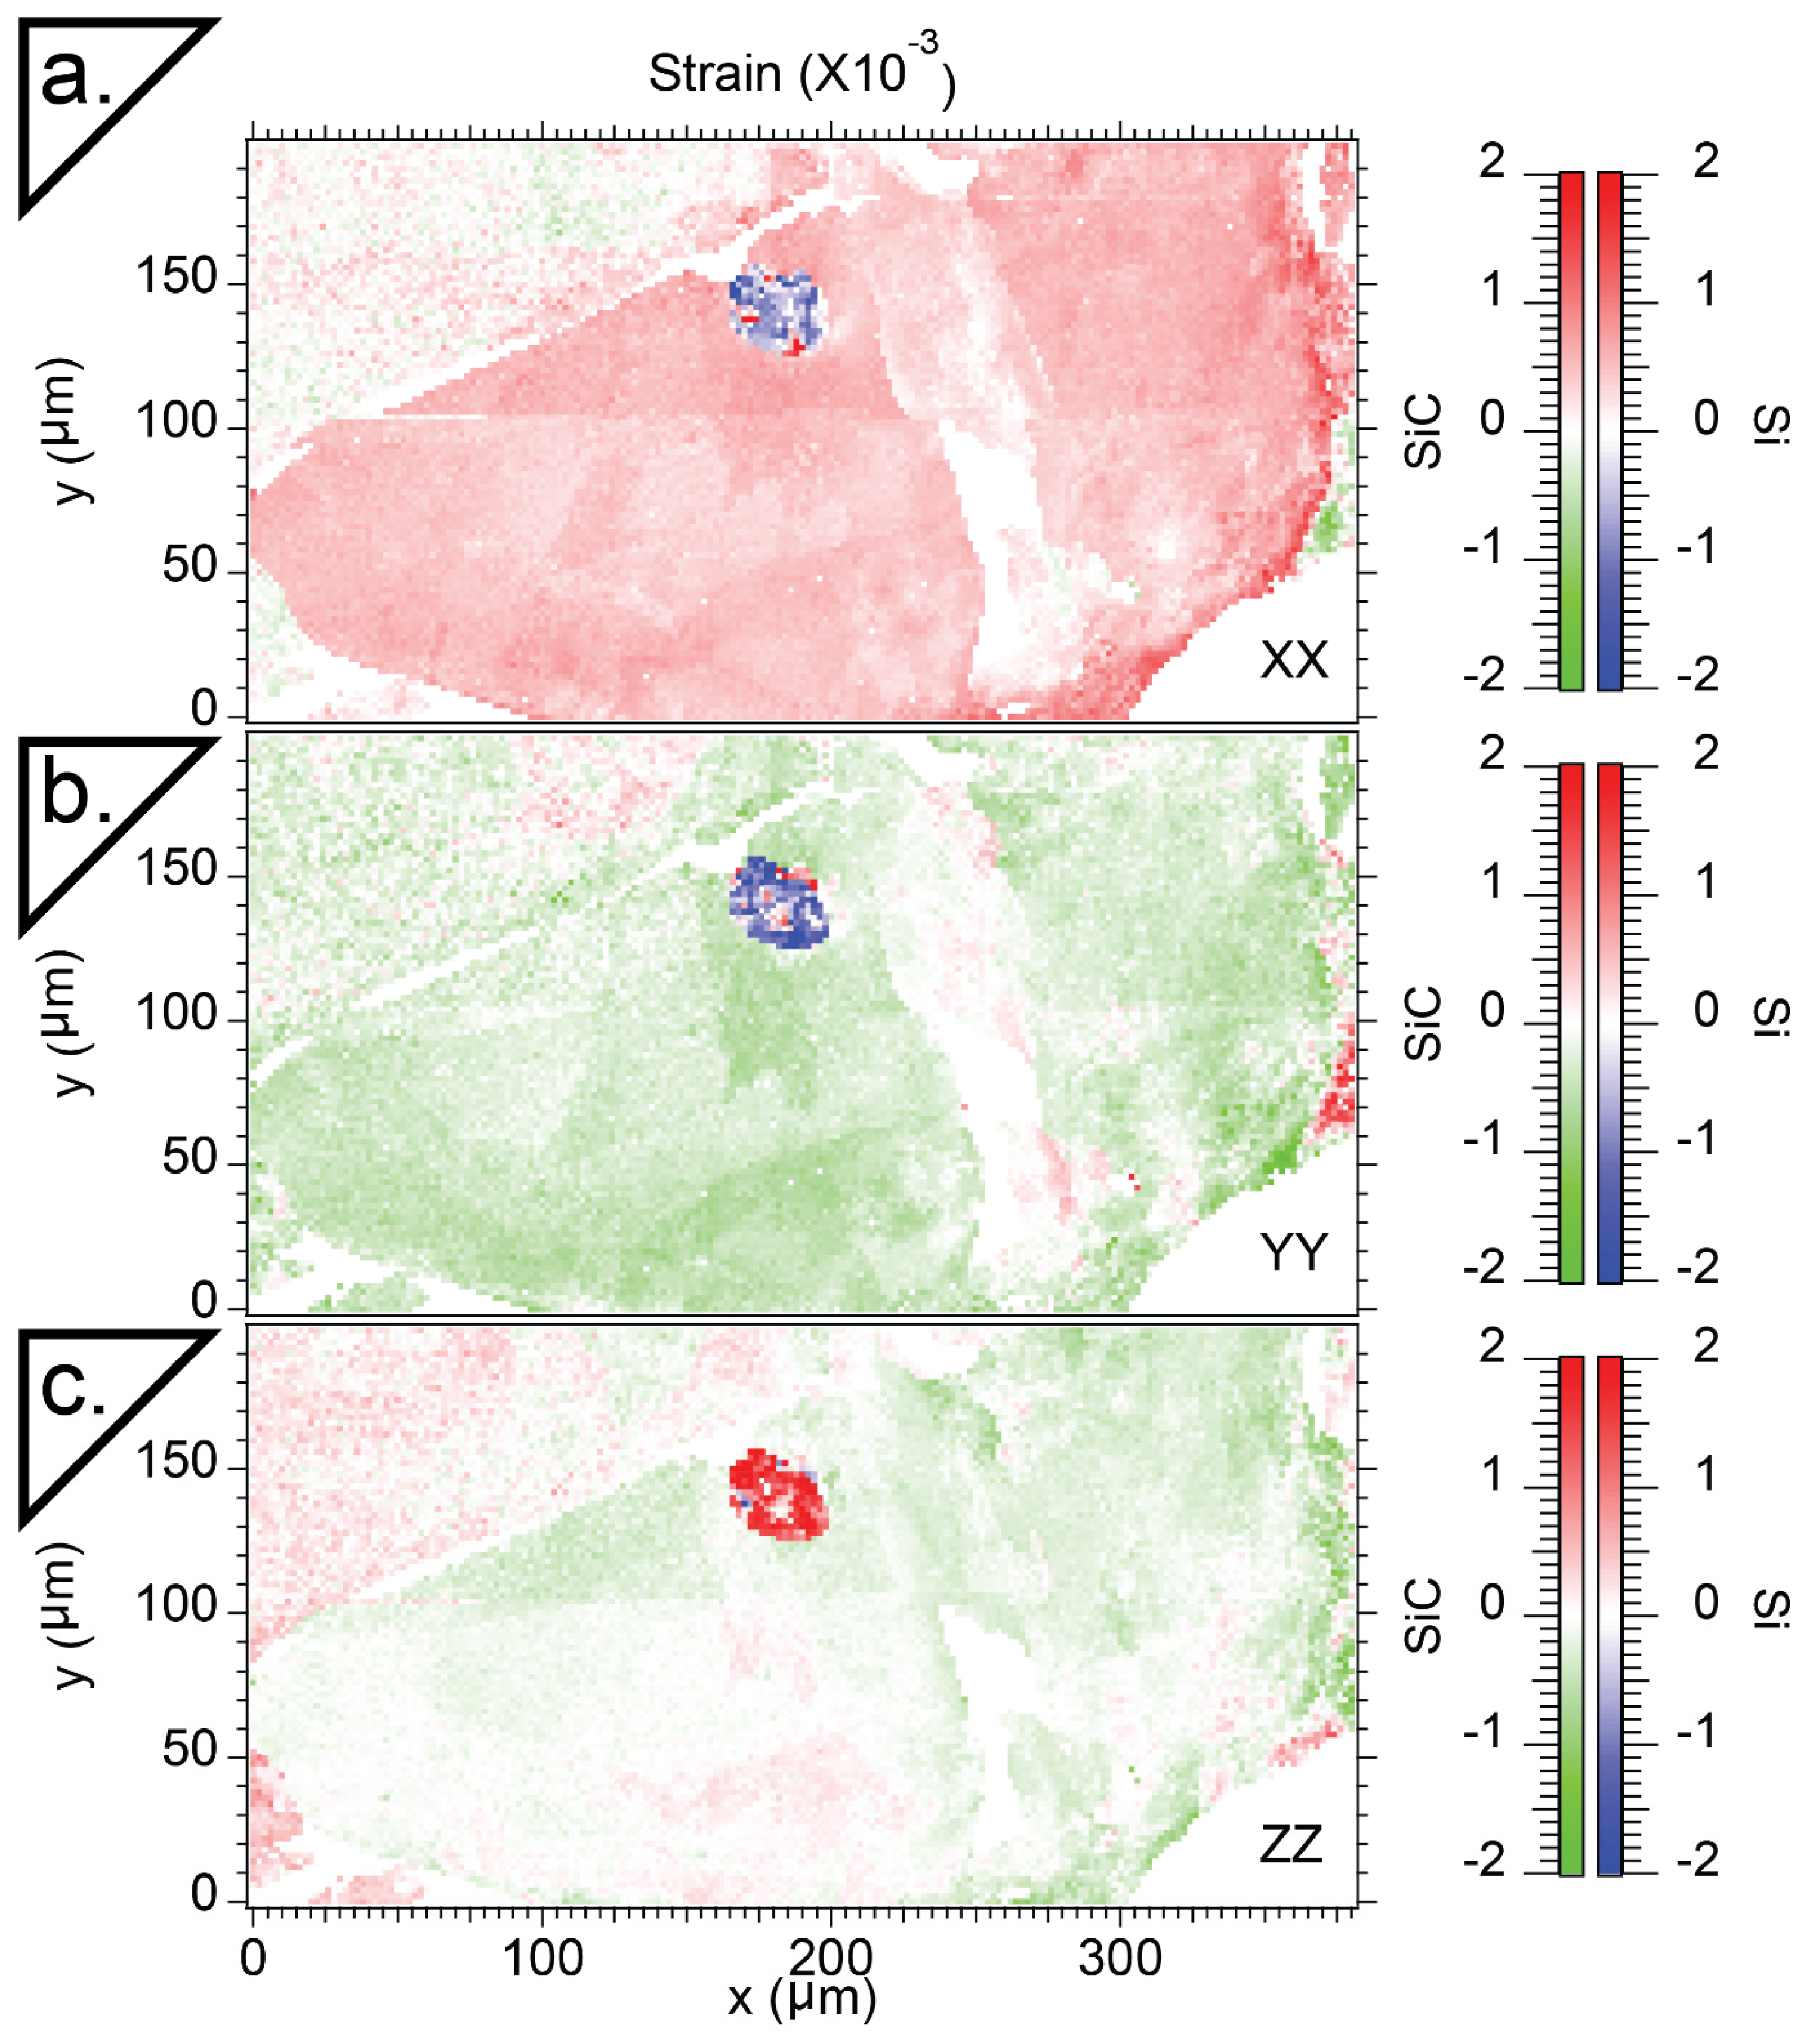
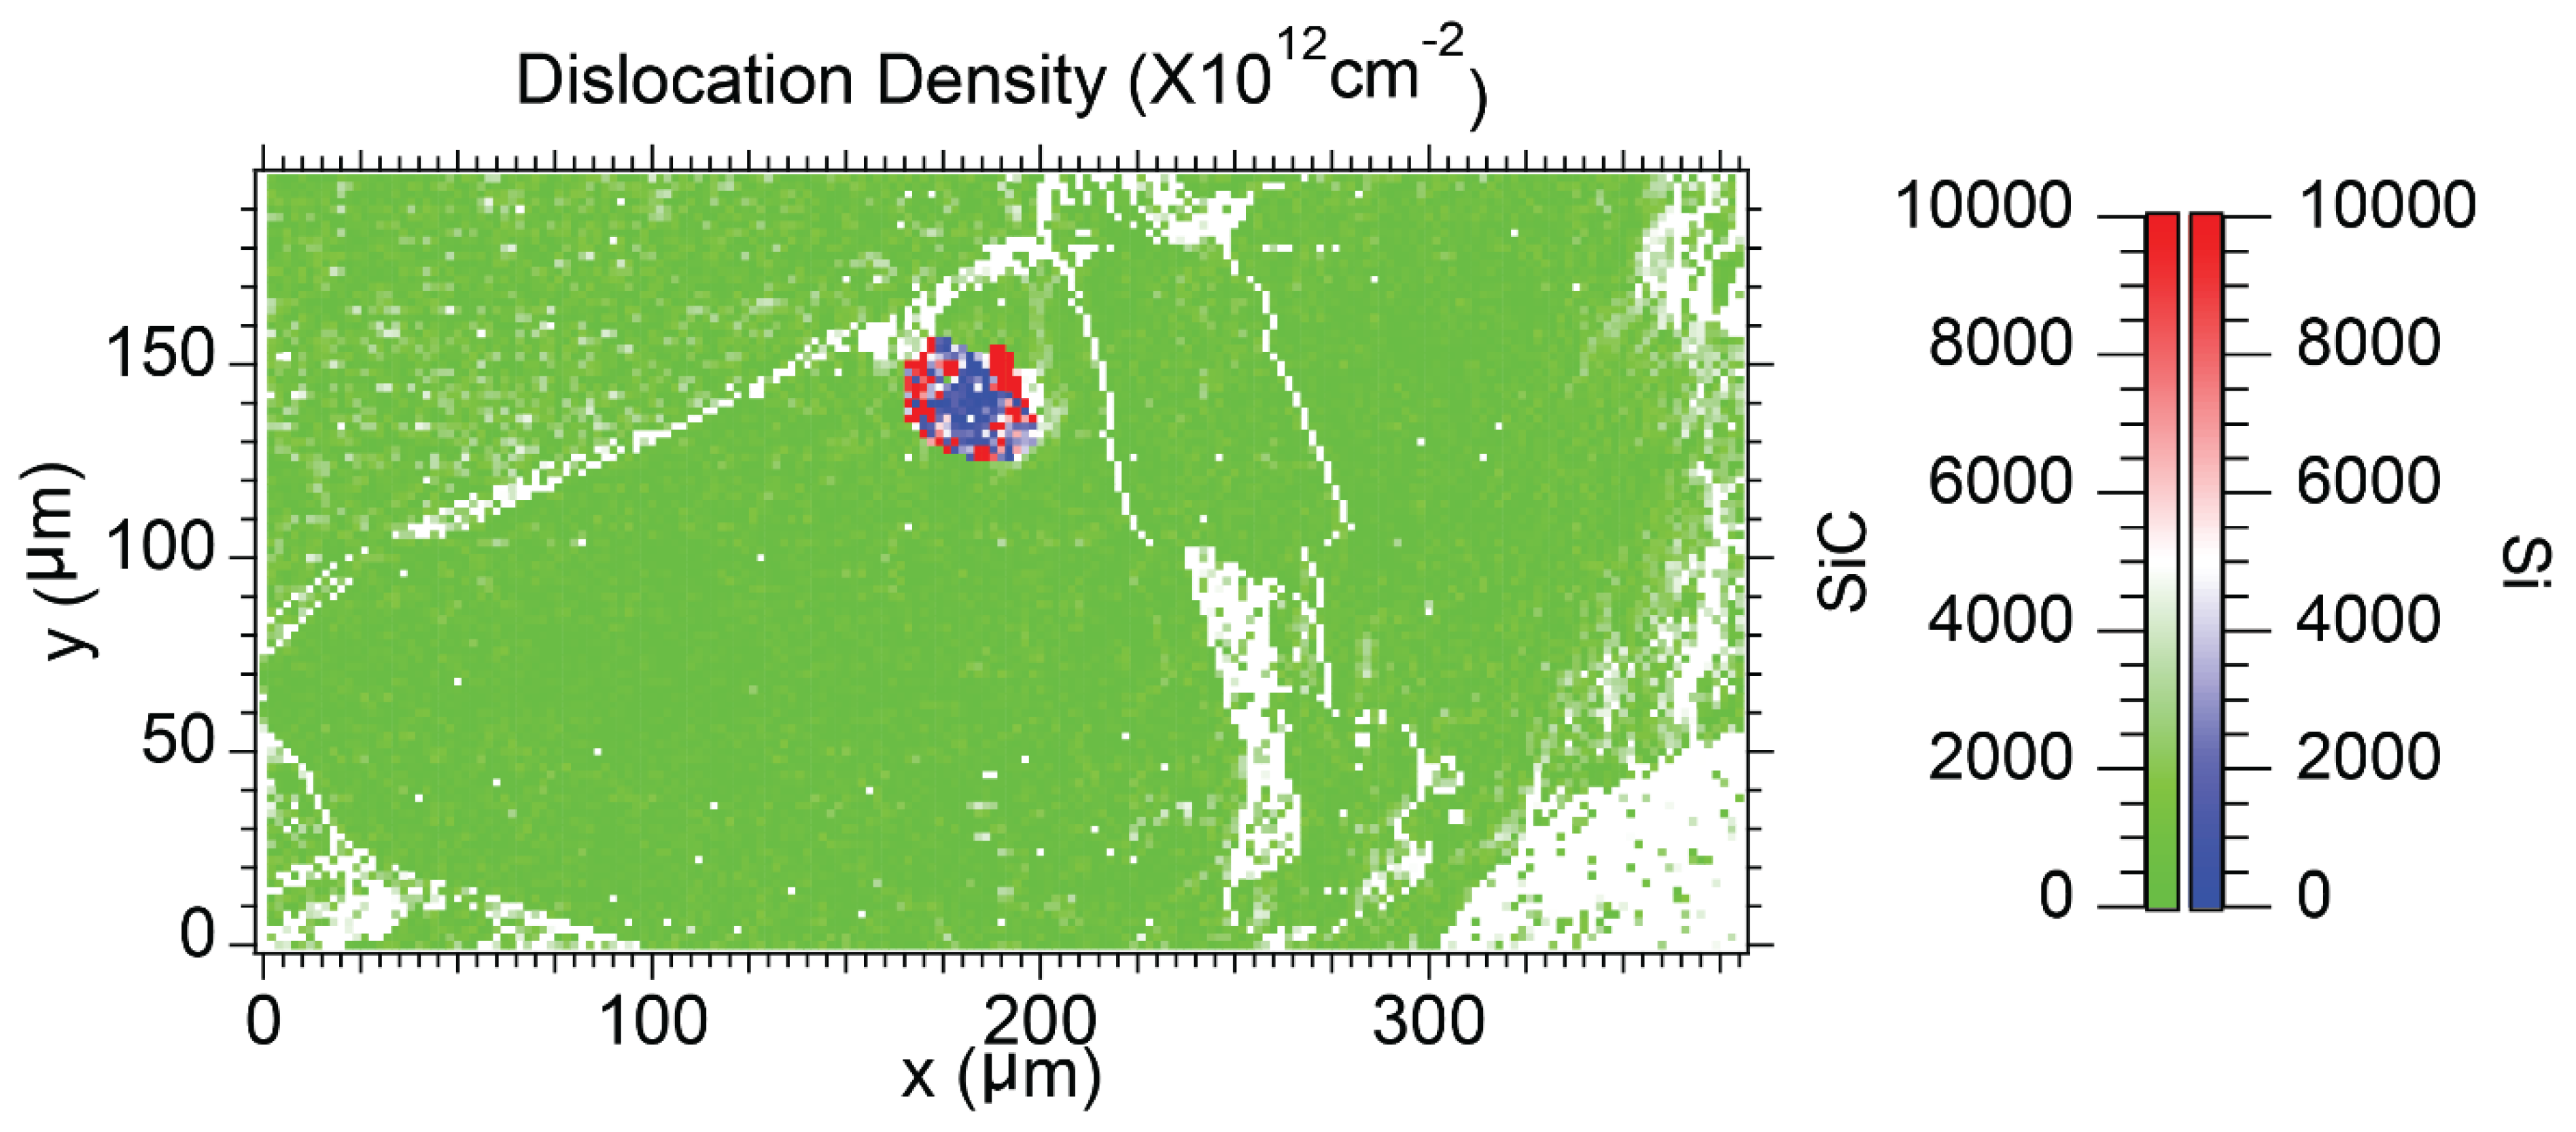
3.2. SiC2
3.3. SiC3
4. Discussion
4.1. SiC Formation—Geological Context
4.2. Stress/Strain Relationships and Crystal Grain Formation
4.3. SiC/Si Relationship
5. Conclusions
Supplementary Materials
Author Contributions
Funding
Conflicts of Interest
References
- Cheung, R. Silicon Carbide Microelectromechanical Systems for Harsh Environments; Imperial College Press: London, UK, 2006; ISBN 978-1-86094-624-0. [Google Scholar]
- Ramsdell, L.S. Studies on silicon carbide. Am. Mineral. 1947, 32, 64–82. [Google Scholar]
- Jepps, N.W.; Page, T.F. Polytypic transformations in silicon carbide. Prog. Cryst. Growth Charact. 1983, 7, 259–307. [Google Scholar] [CrossRef]
- Powell, J.A.; Will, H.A. Low-temperature solid-state phase transformations in 2H silicon carbide. J. Appl. Phys. 1972, 43, 1400–1408. [Google Scholar] [CrossRef]
- Jagodzinski, H. Polytypism in SiC crystals. Acta Cryst. 1954, 7, 300. [Google Scholar] [CrossRef]
- Haase, V.; Kirschstein, G.; List, H.; Ruprecht, S.; Sangster, R.; Schröder, F.; Töpper, W.; Vanecek, H.; Heit, W.; Schlichting, J.; et al. Si Silicon: System Si-C. SiC: Natural Occurrence. Preparation and Manufacturing Chemistry. Special Forms. Manufacture. Electrochemical Properties. Chemical Reactions. Applications. Ternary and Higher Systems with Si and C; Gmelin Handbook of Inorganic Chemistry; Springer-Verlag Berlin Heidelberg: Berlin, Germany, 1985; Volume B3, ISBN 978-3-662-06994-3. [Google Scholar]
- Burdick, C.L.; Owen, E.A. The structure of carborundum determined by X-rays. J. Am. Chem. Soc. 1918, 40, 1749–1759. [Google Scholar] [CrossRef]
- Thibault, N.W. Morphological and structural crystallography and optical properties of silicon carbide (SiC). Am. Mineral. 1944, 29, 327–362. [Google Scholar]
- Moissan, H. Nouvelles recherches sur la météorité de Cañon Diablo. Comptes rendus 1904, 139, 773–786. [Google Scholar]
- Milton, C.; Vitaliano, D.B. Moissanite SiC, a geological aberration. In Proceedings of the 98th Annual Meeting of the Geological Society of America, Orlando, FL, USA, 14 October 1985; p. 665. [Google Scholar]
- Abderrazak, H.; Hmida, E.S.B.H. Silicon Carbide: Synthesis and Properties. In Properties and Applications of Silicon Carbide; InTech: Rijeka, Croatia, 2011; p. 361. [Google Scholar]
- Lyakhovich, V.V. Origin of accessory moissanite. Int. Geol. Rev. 1980, 22, 961–970. [Google Scholar] [CrossRef]
- Marshintsev, V.K. Nature of silicon carbide in kimberlite rocks of Yakutiya. Mineral. Zhurnal 1990, 12, 17–26. [Google Scholar]
- Leung, I.; Guo, W.; Friedman, I.; Gleason, J. Natural occurrence of silicon carbide in a diamondiferous kimberlite from Fuxian. Nature 1990, 346, 352. [Google Scholar] [CrossRef]
- Qi, X.; Yang, J.; Xu, Z.; Bai, W.; Zhang, Z.; Fang, Q. Discovery of moissanite in retrogressive eclogite from the Pre-pilot Hole of the Chinese Continental Scientific Drilling Project (CCSD-PP2) and its geological implication. Acta Petrol. Sin. 2007, 23, 3207–3214. [Google Scholar]
- Lee, J.-S.; Yu, S.-C.; Tung, S.-F.; Bai, W.-J.; Yang, J.-S.; Fang, Q.-S.; Zhang, Z. The crystal structure of natural 33R moissanite from Tibet. Z. für Krist.–Cryst. Mater. 2009, 221, 213–217. [Google Scholar] [CrossRef]
- Kaminsky, F. Mineralogy of the lower mantle: A review of ‘super-deep’ mineral inclusions in diamond. Earth-Sci. Rev. 2012, 110, 127–147. [Google Scholar] [CrossRef]
- Shiryaev, A.A.; Griffin, W.L.; Stoyanov, E. Moissanite (SiC) from kimberlites: Polytypes, trace elements, inclusions and speculations on origin. Lithos 2011, 122, 152–164. [Google Scholar] [CrossRef]
- Ballhaus, C.; Wirth, R.; Fonseca, R.O.C.; Blanchard, H.; Pröll, W.; Bragagni, A.; Nagel, T.; Schreiber, A.; Dittrich, S.; Thome, V.; et al. Ultra-high pressure and ultra-reduced minerals in ophiolites may form by lightning strikes. Geochem. Perspect. Lett. 2017, 5, 42–46. [Google Scholar] [CrossRef]
- Ballhaus, C.; Blanchard, H.; Fonseca, R.O.C.; Bragagni, A. Reply 2 to Comment on “Ultra-high pressure and ultra-reduced minerals in ophiolites may form by lightning strikes”. Geochem. Perspect. Lett. 2018, 8, 8–10. [Google Scholar] [CrossRef]
- Mathez, E.A.; Fogel, R.A.; Hutcheon, I.D.; Marshintsev, V.K. Carbon isotopic composition and origin of SiC from kimberlites of Yakutia, Russia. Geochim. Cosmochim. Ac. 1995, 59, 781–791. [Google Scholar] [CrossRef]
- Golubkova, A.; Schmidt, M.W.; Connolly, J.A.D. Ultra-reducing conditions in average mantle peridotites and in podiform chromitites: a thermodynamic model for moissanite (SiC) formation. Contrib. Mineral. Petrol. 2016, 171, 41. [Google Scholar] [CrossRef]
- Ohrenschall, R.D.; Milton, C. The occurrence of moissanite (silicon carbide) in sediments. J. Sediment. Res. 1931, 1, 96–99. [Google Scholar]
- Kaminskiy, F.V.; Bukin, V.J.; Potapov, S.V.; Arkus, N.G.; Ivanova, V.G. Discoveries of silicon carbide under natural conditions and their genetic importance. Int. Geol. Rev. 1969, 11, 561–569. [Google Scholar] [CrossRef]
- Ross, J. Kimberlites and Related Rocks; John Wiley & Sons: Hoboken, NJ, USA, 1989; ISBN 978-0-86793-384-0. [Google Scholar]
- Leung, I.S. Silicon carbide cluster entrapped in a diamond from Fuxian, China. Am. Mineral. 1990, 75, 1110–1119. [Google Scholar]
- Wilding, M.C.; Harte, B.; Harris, J.W. Evidence for a deep origin of São Luis diamonds. In CPRM Special Publication 2/91, Proceedings of the Extended Abstracts 5th International Kimberlite Conference; CPRM: Brasília, Brazil, 1991; pp. 456–458. [Google Scholar]
- Svisero, D.P. Distribution and origin of diamonds in Brazil: An overview. J. Geodyn. 1995, 20, 493–514. [Google Scholar] [CrossRef]
- Di Pierro, S.; Gnos, E.; Grobety, B.H.; Armbruster, T.; Bernasconi, S.M.; Ulmer, P. Letters. Rock-forming moissanite (natural α-silicon carbide). Am. Mineral. 2003, 88, 1817–1821. [Google Scholar] [CrossRef]
- Zhang, Z. Native gold and native copper grains enclosed by olivine phenocrysts in a picrite lava of the Emeishan large igneous province, SW China. Am. Mineral. 2006, 91, 1178–1183. [Google Scholar] [CrossRef]
- Klein-BenDavid, O.; Wirth, R.; Navon, O. Micrometer-scale cavities in fibrous and cloudy diamonds—A glance into diamond dissolution events. Earth Planet Sc. Lett. 2007, 264, 89–103. [Google Scholar] [CrossRef]
- Xu, S.; Wu, W.; Xiao, W.; Yang, J.; Chen, J.; Ji, S.; Liu, Y. Moissanite in serpentinite from the Dabie Mountains in China. Mineral. Mag. 2008, 72, 899–908. [Google Scholar] [CrossRef]
- Trumbull, R.B.; Yang, J.-S.; Robinson, P.T.; Di Pierro, S.; Vennemann, T.; Wiedenbeck, M. The carbon isotope composition of natural SiC (moissanite) from the Earth’s mantle: New discoveries from ophiolites. Lithos 2009, 113, 612–620. [Google Scholar] [CrossRef]
- Yusupov, R.G.; Stanley, C.J.; Welch, M.D.; Spratt, J.; Cressey, G.; Rumsey, M.S.; Seltmann, R.; Igamberdiev, E. Mavlyanovite, Mn5Si3: A new mineral species from a lamproite diatreme, Chatkal Ridge, Uzbekistan. Mineral. Mag. 2009, 73, 43–50. [Google Scholar] [CrossRef]
- Fritsch, E.; Toledo, V.; Matlins, A. Record-size natural moissanite crystals discovered in Israel. Gems Gemol. 2014, 50, 160–161. [Google Scholar]
- Liang, F.; Xu, Z.; Zhao, J. In-situ moissanite in dunite: deep mantle origin of mantle peridotite in Luobusa ophiolite, Tibet. Acta Geol. Sin. Engl. Ed. 2014, 88, 517–529. [Google Scholar] [CrossRef]
- Liu, Y.; He, D.; Gao, C.; Foley, S.; Gao, S.; Hu, Z.; Zong, K.; Chen, H. First direct evidence of sedimentary carbonate recycling in subduction-related xenoliths. Sci. Rep. 2015, 5, 11547. [Google Scholar] [CrossRef] [PubMed]
- Xu, X.; Yang, J.; Robinson, P.T.; Xiong, F.; Ba, D.; Guo, G. Origin of ultrahigh pressure and highly reduced minerals in podiform chromitites and associated mantle peridotites of the Luobusa ophiolite, Tibet. Gondwana Res. 2015, 27, 686–700. [Google Scholar] [CrossRef]
- Yang, J.; Meng, F.; Xu, X.; Robinson, P.T.; Dilek, Y.; Makeyev, A.B.; Wirth, R.; Wiedenbeck, M.; Cliff, J. Diamonds, native elements and metal alloys from chromitites of the Ray-Iz ophiolite of the Polar Urals. Gondwana Res. 2015, 27, 459–485. [Google Scholar] [CrossRef]
- Di Pierro, S.; Gnos, E. Ca-Al-silicate inclusions in natural moissanite (SiC). Am. Mineral. 2016, 101, 71–81. [Google Scholar] [CrossRef]
- Dobrzhinetskaya, L.; Mukhin, P.; Wang, Q.; Wirth, R.; O’Bannon, E.; Zhao, W.; Eppelbaum, L.; Sokhonchuk, T. Moissanite (SiC) with metal-silicide and silicon inclusions from tuff of Israel: Raman spectroscopy and electron microscope studies. Lithos 2018, 310–311, 355–368. [Google Scholar] [CrossRef]
- Machev, P.; O’Bannon, E.F.; Bozhilov, K.N.; Wang, Q.; Dobrzhinetskaya, L. Not all moissanites are created equal: New constraints on moissanite from metamorphic rocks of Bulgaria. Earth Planet. Sci. Lett. 2018, 498, 387–396. [Google Scholar] [CrossRef]
- Nazzareni, S.; Nestola, F.; Zanon, V.; Bindi, L.; Scricciolo, E.; Petrelli, M.; Zanatta, M.; Mariotto, G.; Giuli, G. Discovery of moissanite in a peralkaline syenite from the Azores Islands. Lithos 2019, 324–325, 68–73. [Google Scholar] [CrossRef]
- Baer, G.; Aharon, L.; Heimann, A.; Shaliv, G.; Agnon, A. The Nahal Tavor vent: Interplay of Miocene tectonics, dikes, and volcanism in the Lower Galilee, Israel. Isr. J. Earth Sci. 2006, 55, 1–16. [Google Scholar] [CrossRef]
- Kunz, M.; Tamura, N.; Chen, K.; MacDowell, A.A.; Celestre, R.S.; Church, M.M.; Fakra, S.; Domning, E.E.; Glossinger, J.M.; Kirschman, J.L.; et al. A dedicated superbend X-ray microdiffraction beamline for materials, geo-, and environmental sciences at the advanced light source. Rev. Sci. Instrum. 2009, 80, 035108. [Google Scholar] [CrossRef]
- Stan, C.V.; Tamura, N. Synchrotron X-ray Microdiffraction and Fluorescence Imaging of Mineral and Rock Samples. JoVE 2018, in press. [Google Scholar] [CrossRef]
- Tamura, N.; MacDowell, A.A.; Spolenak, R.; Valek, B.C.; Bravman, J.C.; Brown, W.L.; Celestre, R.S.; Padmore, H.A.; Batterman, B.W.; Patel, J.R. Scanning X-ray microdiffraction with submicrometer white beam for strain/stress and orientation mapping in thin films. J. Synchrotron Radiat. 2003, 10, 137–143. [Google Scholar] [CrossRef]
- Merlen, A.; Sangar, A.; Torchio, P.; Kallepalli, L.N.D.; Grojo, D.; Utéza, O.; Delaporte, P. Multi-wavelength enhancement of silicon Raman scattering by nanoscale laser surface ablation. Appl. Surf. Sci. 2013, 284, 545–548. [Google Scholar] [CrossRef]
- Russell, J.P. Raman scattering in silicon. Appl. Phys. Lett. 1965, 6, 223–224. [Google Scholar] [CrossRef]
- Parker, J.H.; Feldman, D.W.; Ashkin, M. Raman Scattering by Silicon and Germanium. Phys. Rev. 1967, 155, 712–714. [Google Scholar] [CrossRef]
- Uchinokura, K.; Sekine, T.; Matsuura, E. Raman scattering by silicon. Solid State Commun. 1972, 11, 47–49. [Google Scholar] [CrossRef]
- Weinstein, B.A.; Piermarini, G.J. Raman scattering and phonon dispersion in Si and GaP at very high pressure. Phys. Rev. B 1975, 12, 1172–1186. [Google Scholar] [CrossRef]
- Poborchii, V.; Tada, T.; Kanayama, T. Study of stress in a shallow-trench-isolated Si structure using polarized confocal near-UV Raman microscopy of its cross section. Appl. Phys. Lett. 2007, 91, 241902. [Google Scholar] [CrossRef]
- Zhang, C.; Duan, Z. A model for C–O–H fluid in the Earth’s mantle. Geochim. et Cosmochim. Acta 2009, 73, 2089–2102. [Google Scholar] [CrossRef]
- Li, Z.; Bradt, R.C. Thermal Expansion of the Hexagonal (6H) Polytype of Silicon Carbide. J. Am. Ceram. Soc. 1986, 69, 863–866. [Google Scholar] [CrossRef]
- Watanabe, H.; Yamada, N.; Okaji, M. Linear Thermal Expansion Coefficient of Silicon from 293 to 1000 K. Int. J. Thermophys. 2004, 25, 221–236. [Google Scholar] [CrossRef]
- Arsenault, R.J.; Shi, N. Dislocation generation due to differences between the coefficients of thermal expansion. Mater. Sci. Eng. 1986, 81, 175–187. [Google Scholar] [CrossRef]
- Vogelsang, M.; Arsenault, R.J.; Fisher, R.M. An in situ HVEM study of dislocation generation at Al/SiC interfaces in metal matrix composites. MTA 1986, 17, 379–389. [Google Scholar] [CrossRef]
- Anastassakis, E.; Pinczuk, A.; Burstein, E.; Pollak, F.H.; Cardona, M. Effect of static uniaxial stress on the Raman spectrum of silicon. Solid State Commun. 1970, 8, 133–138. [Google Scholar] [CrossRef]
- Hart, T.R.; Aggarwal, R.L.; Lax, B. Temperature Dependence of Raman Scattering in Silicon. Phys. Rev. B 1970, 1, 638–642. [Google Scholar] [CrossRef]
- Cerdeira, F.; Buchenauer, C.J.; Pollak, F.H.; Cardona, M. Stress-Induced Shifts of First-Order Raman Frequencies of Diamond- and Zinc-Blende-Type Semiconductors. Phys. Rev. B 1972, 5, 580–593. [Google Scholar] [CrossRef]
- Campbell, I.H.; Fauchet, P.M. The effects of microcrystal size and shape on the one phonon Raman spectra of crystalline semiconductors. Solid State Commun. 1986, 58, 739–741. [Google Scholar] [CrossRef]
- Kouteva-Arguirova, S.; Arguirov, T.; Wolfframm, D.; Reif, J. Influence of local heating on micro-Raman spectroscopy of silicon. J. Appl. Phys. 2003, 94, 4946–4949. [Google Scholar] [CrossRef]
- Georgi, C.; Hecker, M.; Zschech, E. Effects of laser-induced heating on Raman stress measurements of silicon and silicon-germanium structures. J. Appl. Phys. 2007, 101, 123104. [Google Scholar] [CrossRef]
- Yang, Y.; Munck, K.D.; Teixeira, R.C.; Swinnen, B.; Verlinden, B.; Wolf, I.D. Process induced sub-surface damage in mechanically ground silicon wafers. Semicond. Sci. Technol. 2008, 23, 075038. [Google Scholar] [CrossRef]
- Zhang, Y.; Wang, D.; Gao, W.; Kang, R. Residual stress analysis on silicon wafer surface layers induced by ultra-precision grinding. Rare Met. 2011, 30, 278–281. [Google Scholar] [CrossRef]
- Xu, Z.; He, Z.; Song, Y.; Fu, X.; Rommel, M.; Luo, X.; Hartmaier, A.; Zhang, J.; Fang, F. Topic Review: Application of Raman Spectroscopy Characterization in Micro/Nano-Machining. Micromachines 2018, 9, 361. [Google Scholar] [CrossRef] [PubMed]
- Robinson, P.T.; Bai, W.-J.; Malpas, J.; Yang, J.-S.; Zhou, M.-F.; Fang, Q.-S.; Hu, X.-F.; Cameron, S.; Staudigel, H. Ultra-high pressure minerals in the Luobusa Ophiolite, Tibet, and their tectonic implications. Geol. Soc. Lond. Spec. Publ. 2004, 226, 247–271. [Google Scholar] [CrossRef]
- Zarudi, I.; Zhang, L. Subsurface damage in single-crystal silicon due to grinding and polishing. J. Mater Sci. Lett. 1996, 15, 586–587. [Google Scholar] [CrossRef]
- Amelinckx, S.; Strumane, G.; Webb, W.W. Dislocations in Silicon Carbide. J. Appl. Phys. 1960, 31, 1359–1370. [Google Scholar] [CrossRef]
- Dobrzhinetskaya, L.F.; Green, H.W.; Bozhilov, K.N.; Mitchell, T.E.; Dickerson, R.M. Crystallization environment of Kazakhstan microdiamond: evidence from nanometric inclusions and mineral associations. J. Metamorph. Geol. 2003, 21, 425–437. [Google Scholar] [CrossRef]
- Kvasnytsya, V.M.; Wirth, R. Nanoinclusions in microdiamonds from Neogenic sands of the Ukraine (Samotkan’ placer): A TEM study. Lithos 2009, 113, 454–464. [Google Scholar] [CrossRef]


| Grain | Map Dimensions (μm2) | Pixel Dimension (μm) |
|---|---|---|
| SiC1 | 798 × 972 | 6 |
| SiC2 | 1064 × 1080 | 8 |
| SiC2 a | 382 × 202 | 2 |
| SiC3 | 665 × 755 | 5 |
© 2020 by the authors. Licensee MDPI, Basel, Switzerland. This article is an open access article distributed under the terms and conditions of the Creative Commons Attribution (CC BY) license (http://creativecommons.org/licenses/by/4.0/).
Share and Cite
Stan, C.V.; O’Bannon, E.F., III; Mukhin, P.; Tamura, N.; Dobrzhinetskaya, L. X-ray Laue Microdiffraction and Raman Spectroscopic Investigation of Natural Silicon and Moissanite. Minerals 2020, 10, 204. https://doi.org/10.3390/min10030204
Stan CV, O’Bannon EF III, Mukhin P, Tamura N, Dobrzhinetskaya L. X-ray Laue Microdiffraction and Raman Spectroscopic Investigation of Natural Silicon and Moissanite. Minerals. 2020; 10(3):204. https://doi.org/10.3390/min10030204
Chicago/Turabian StyleStan, Camelia Veronica, Earl Francis O’Bannon, III, Pavel Mukhin, Nobumichi Tamura, and Larissa Dobrzhinetskaya. 2020. "X-ray Laue Microdiffraction and Raman Spectroscopic Investigation of Natural Silicon and Moissanite" Minerals 10, no. 3: 204. https://doi.org/10.3390/min10030204
APA StyleStan, C. V., O’Bannon, E. F., III, Mukhin, P., Tamura, N., & Dobrzhinetskaya, L. (2020). X-ray Laue Microdiffraction and Raman Spectroscopic Investigation of Natural Silicon and Moissanite. Minerals, 10(3), 204. https://doi.org/10.3390/min10030204