Diagenetic Pore Fluid Evolution and Dolomitization of the Silurian and Devonian Carbonates, Huron Domain of Southwestern Ontario: Petrographic, Geochemical and Fluid Inclusion Evidence


Abstract
1. Introduction
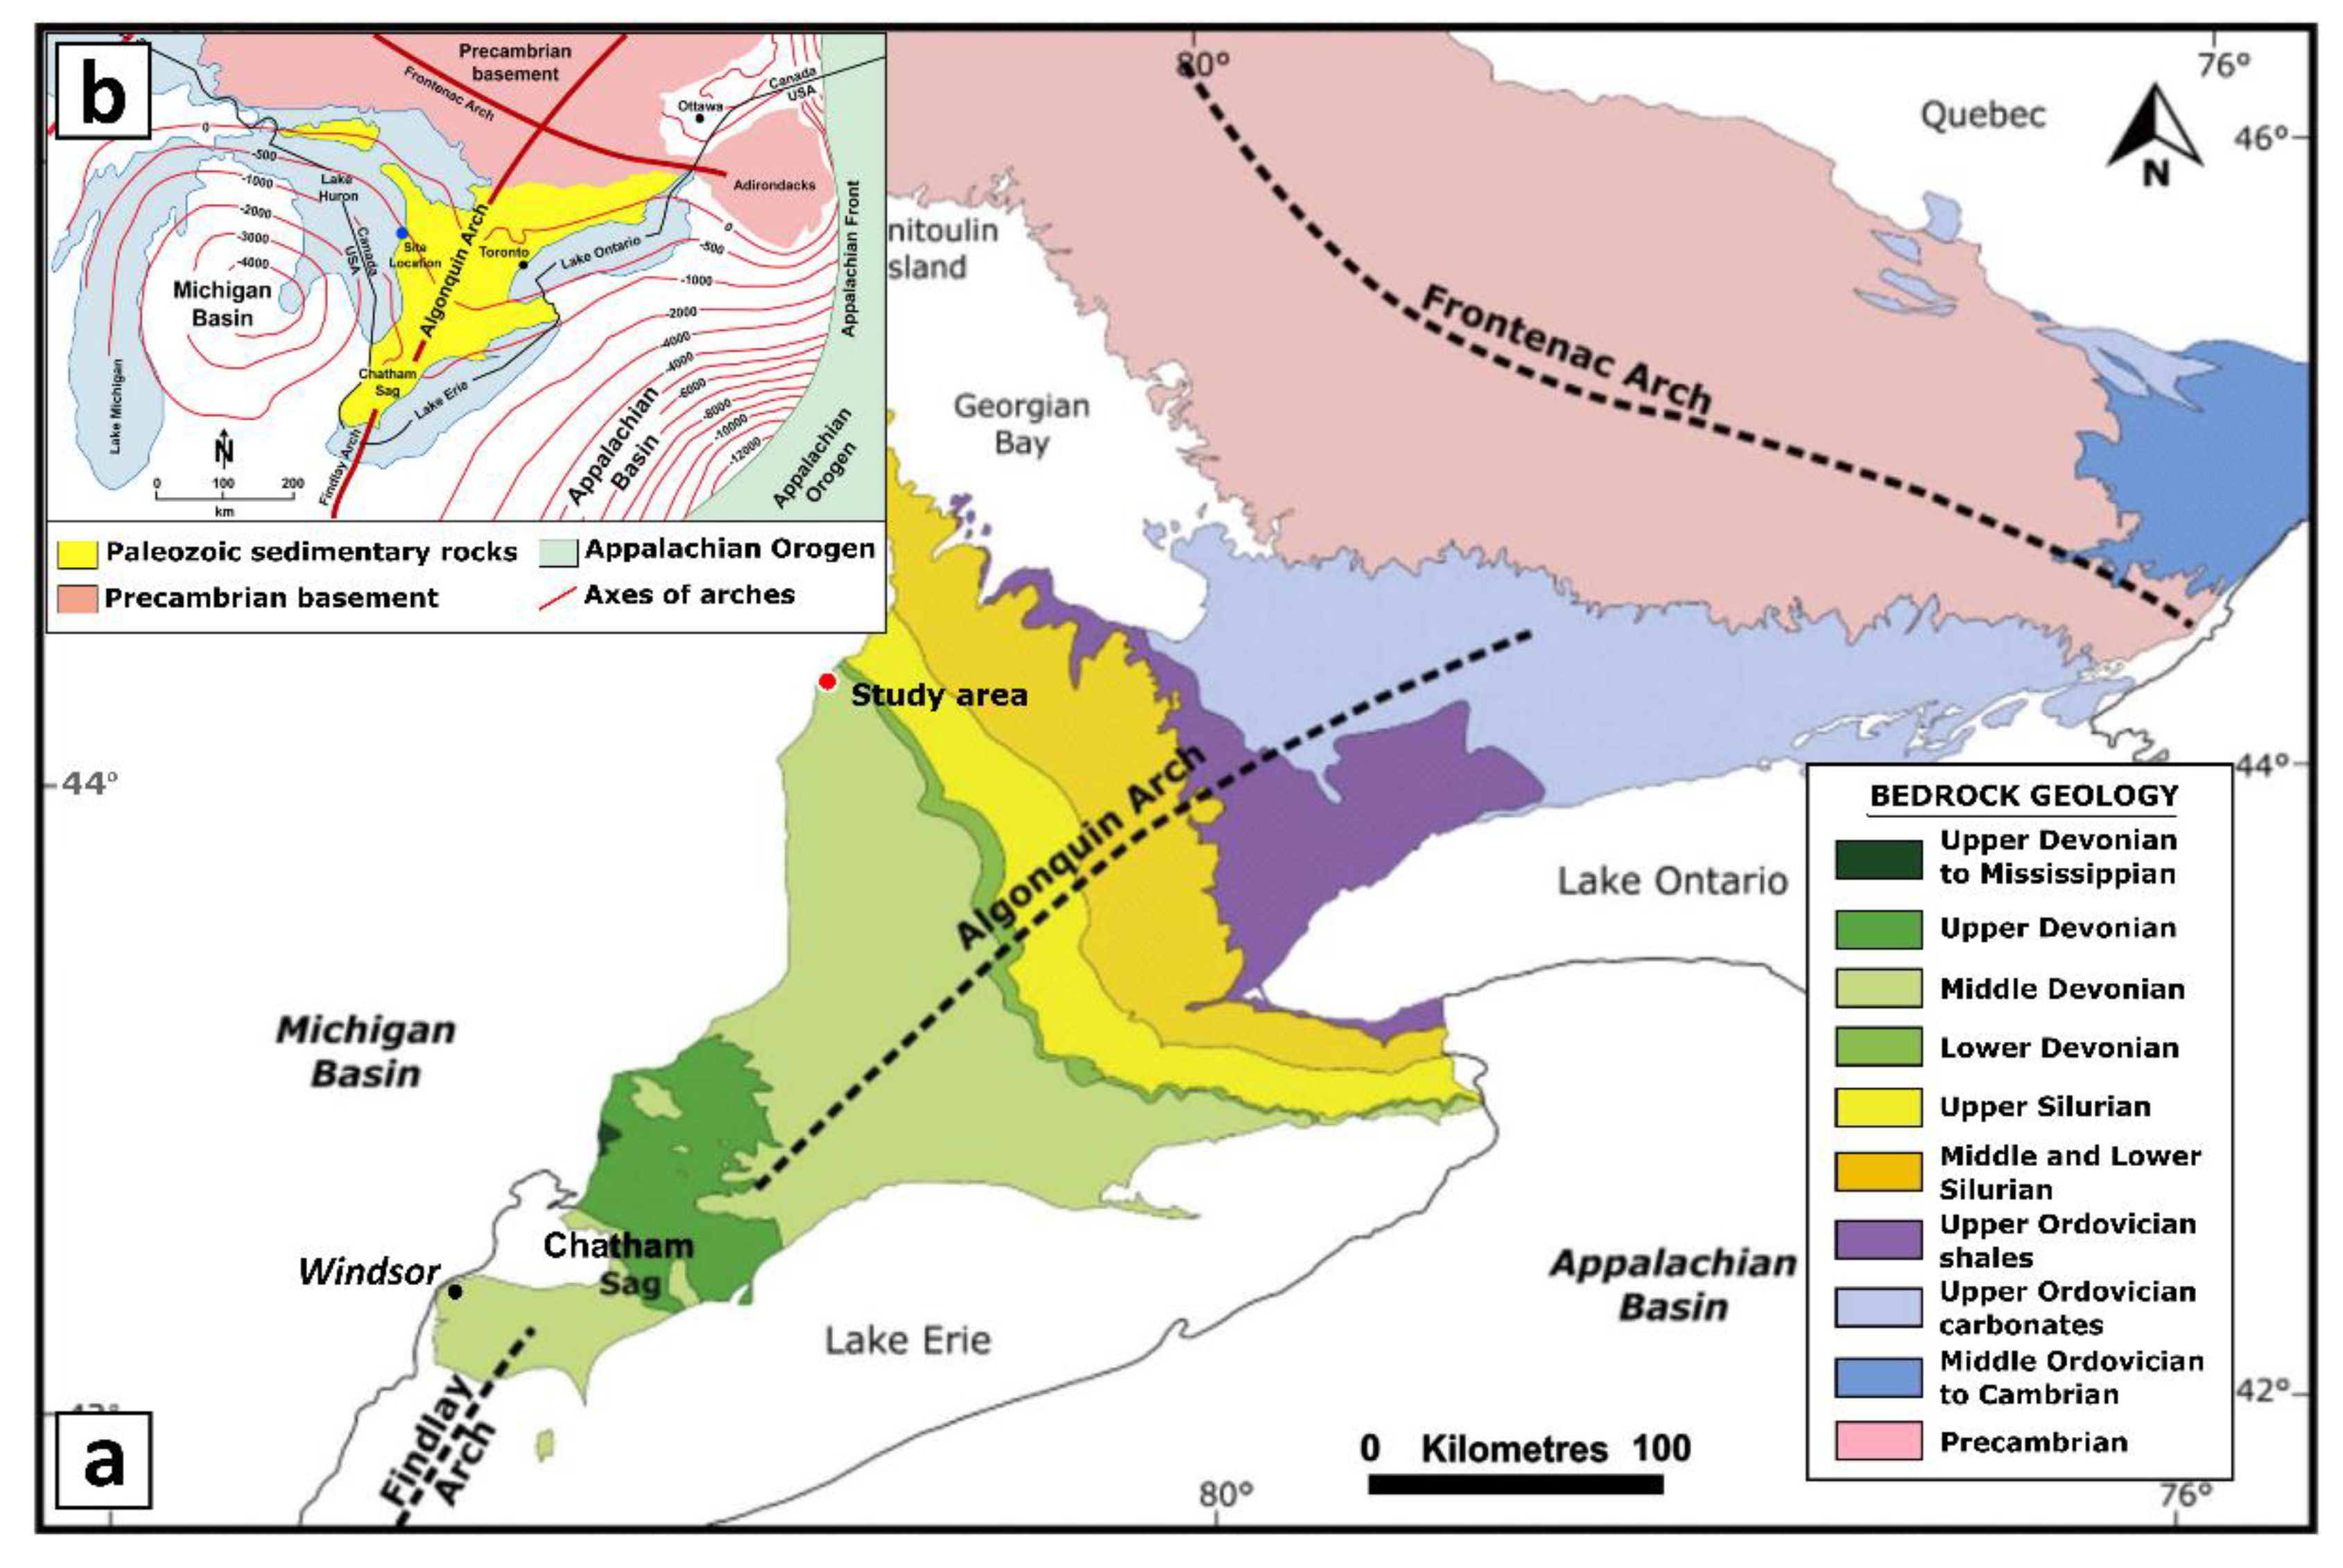
2. Geologic and Tectonic Setting
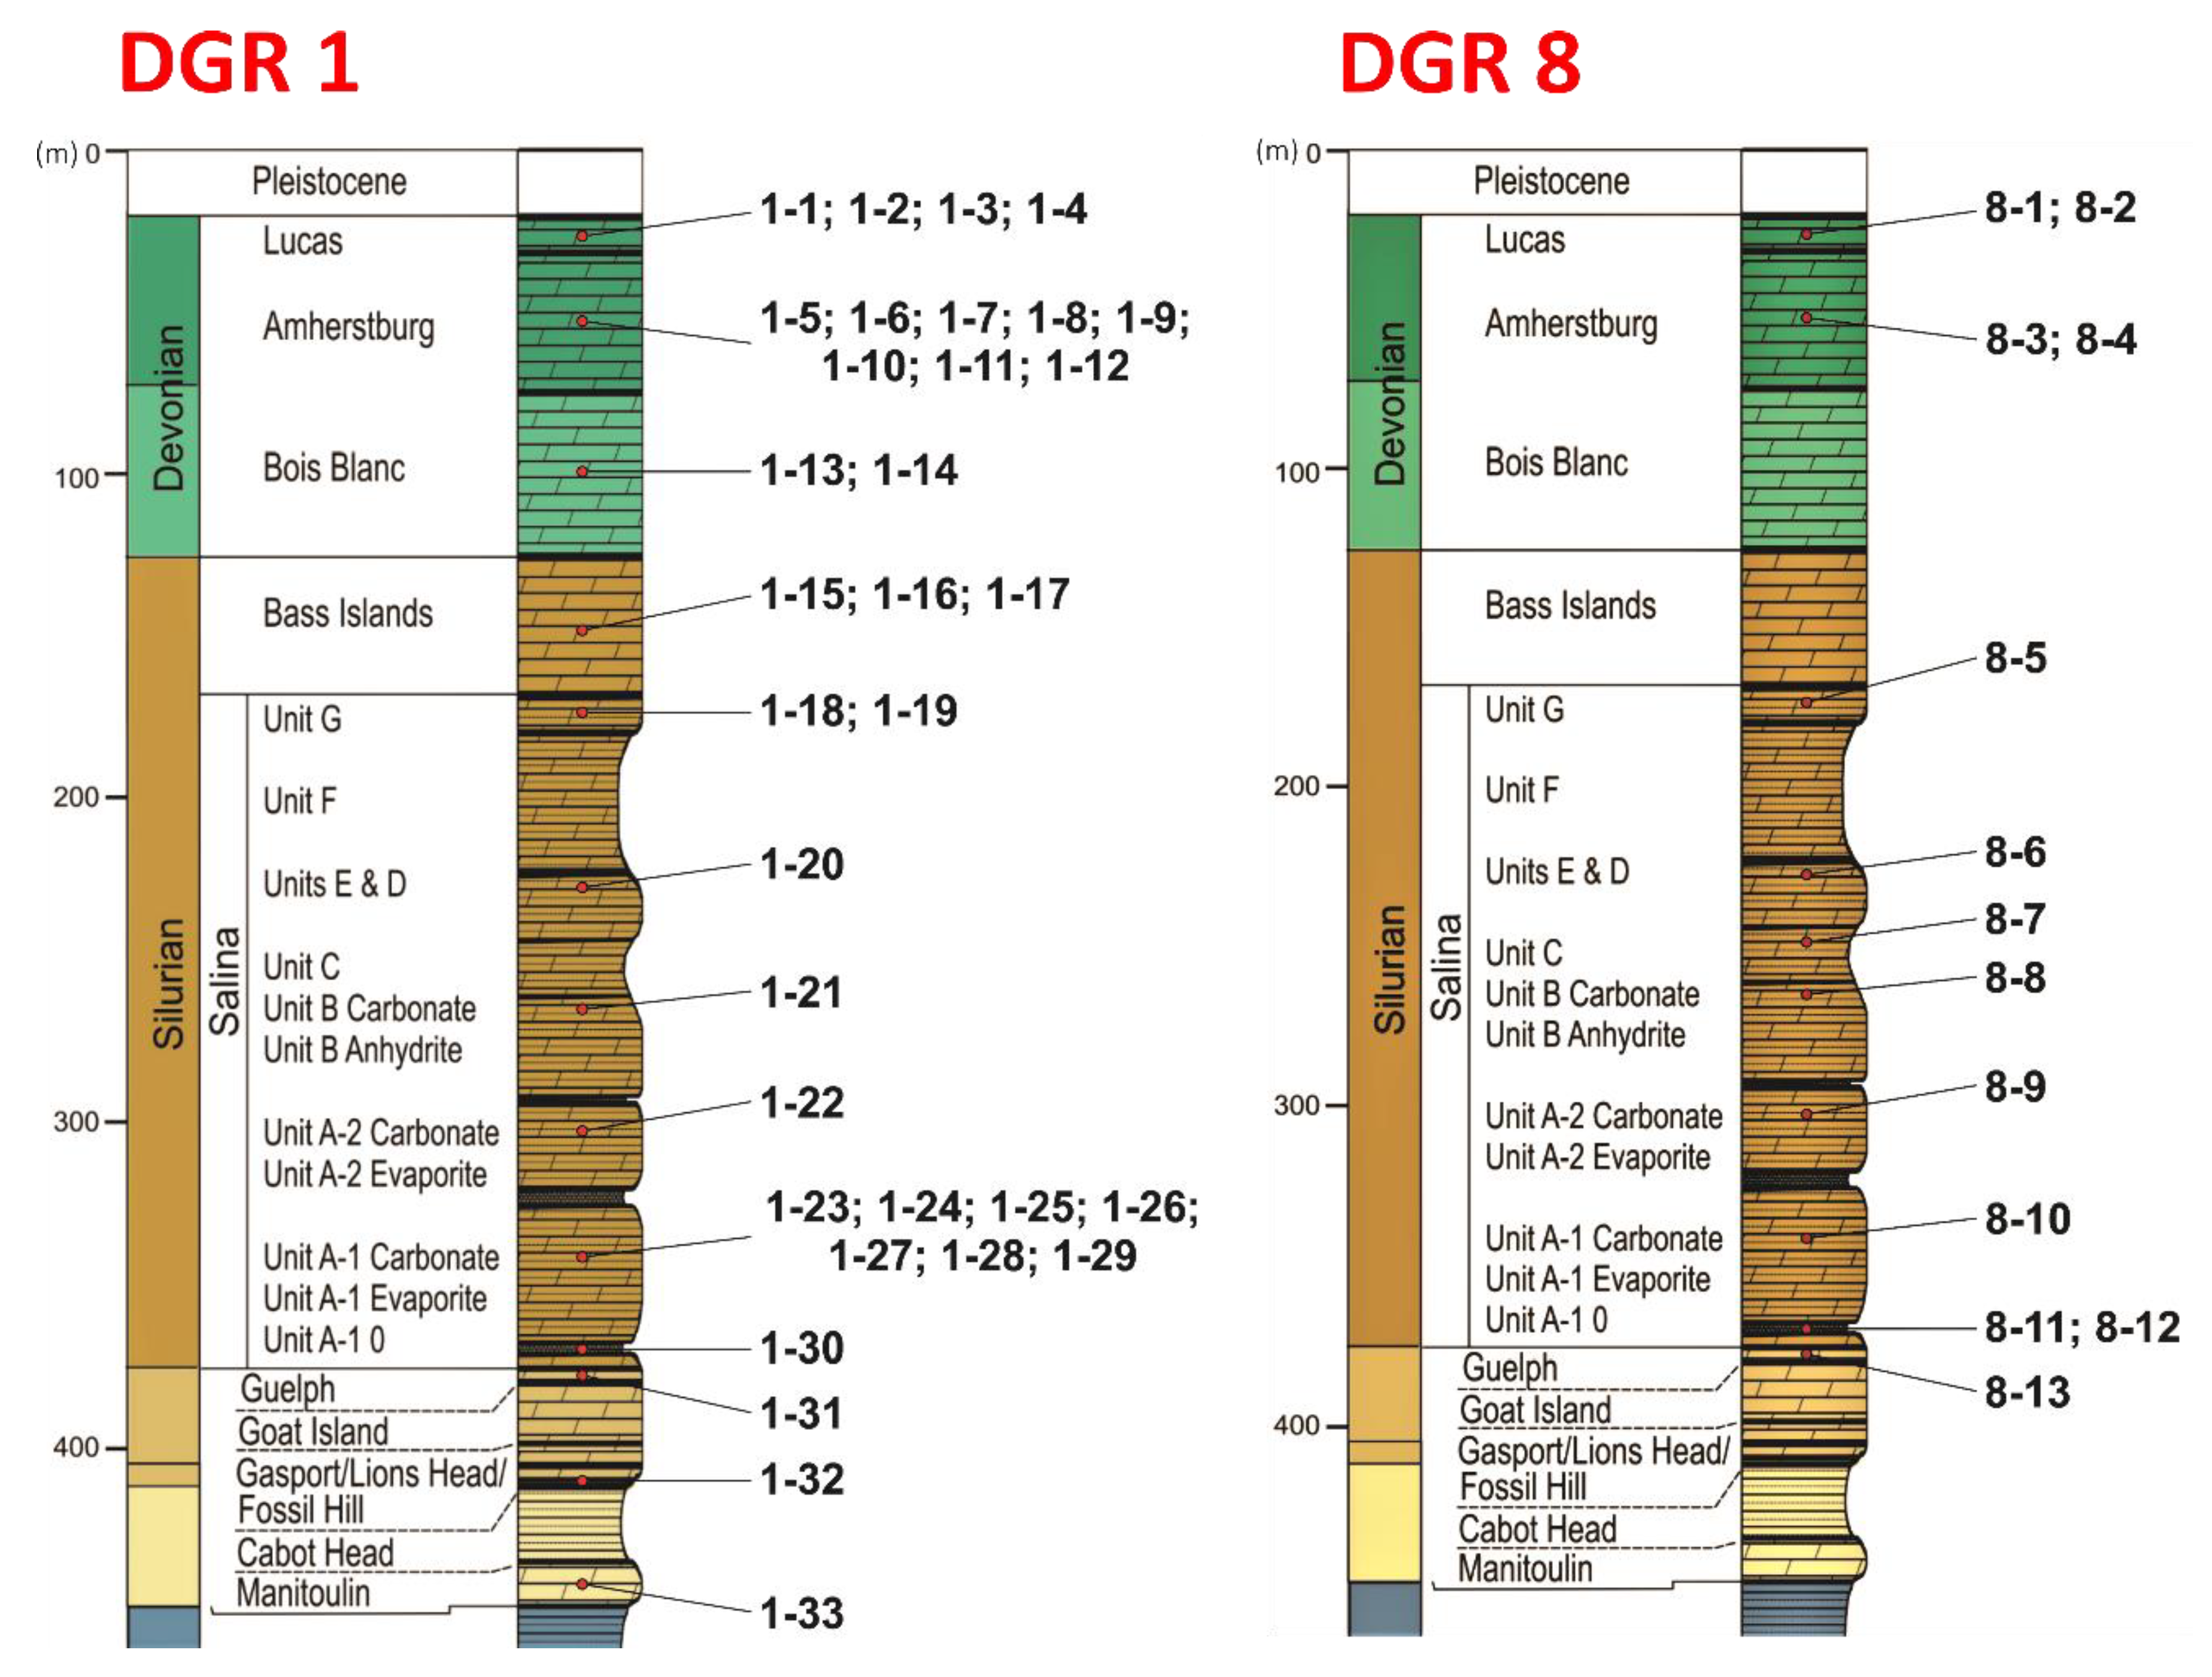
3. Materials and Methods
4. Results
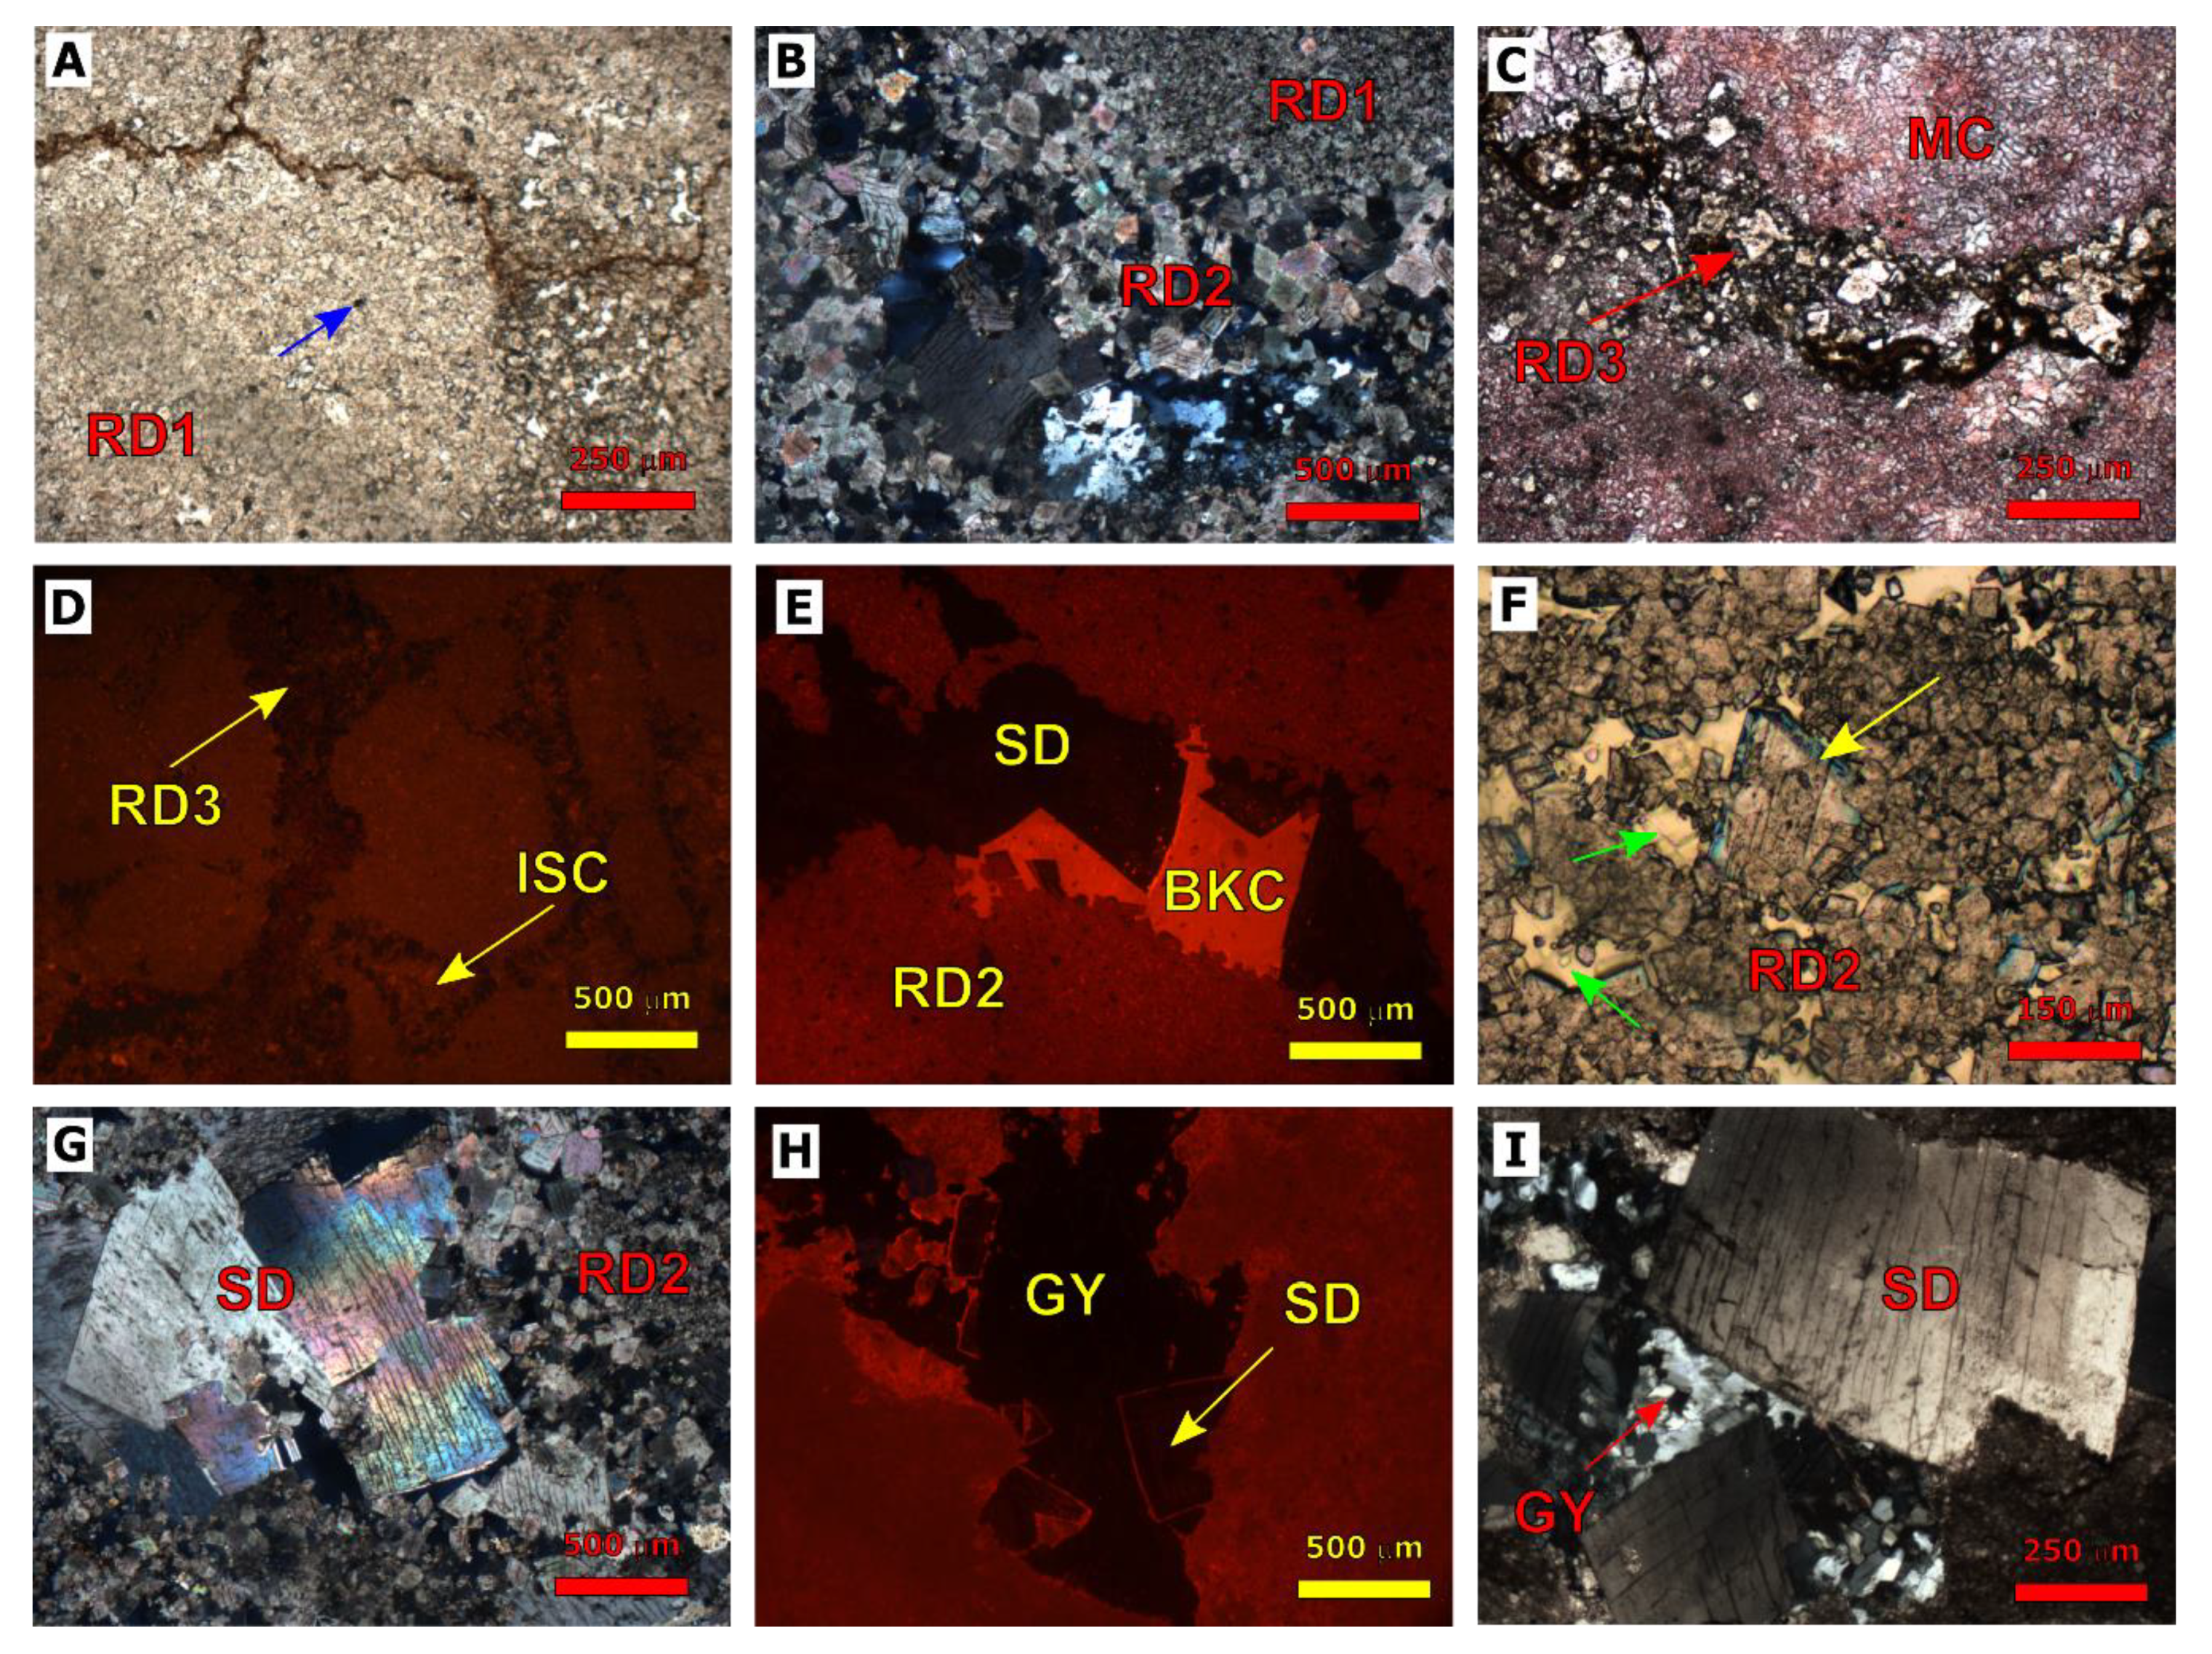
4.1. Petrography of Silurian Formations
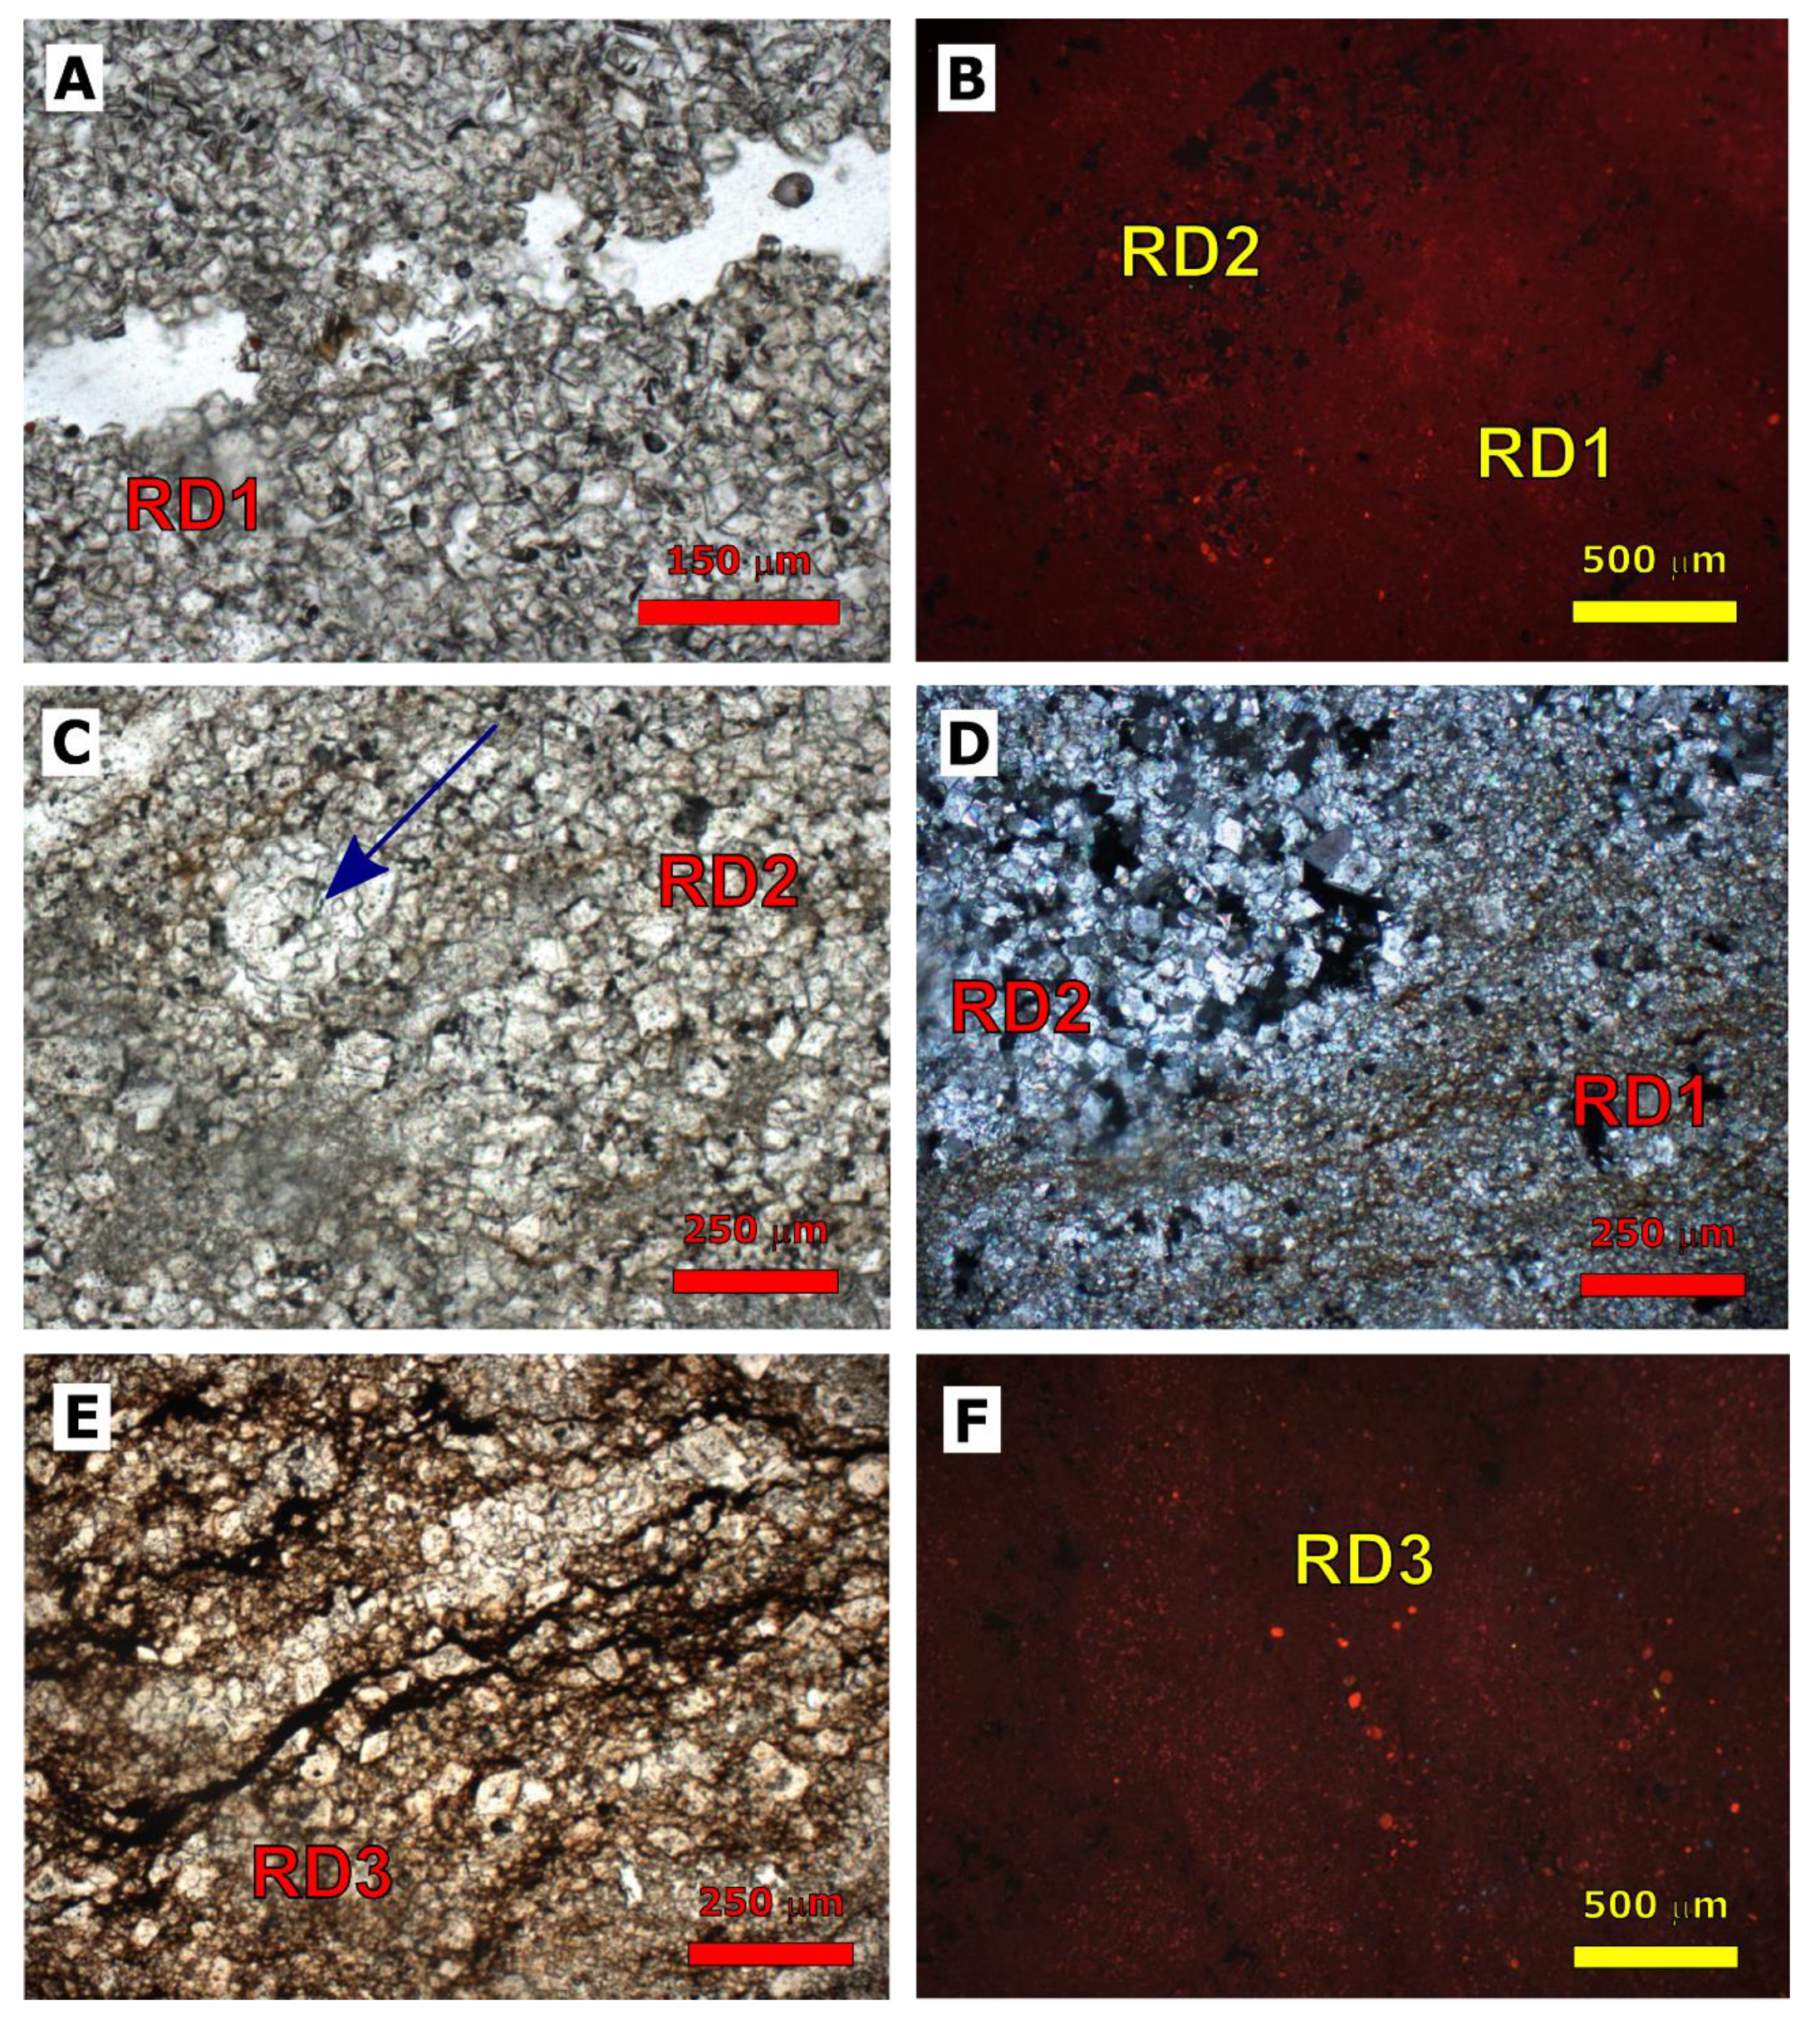
4.1.1. Dolomitization
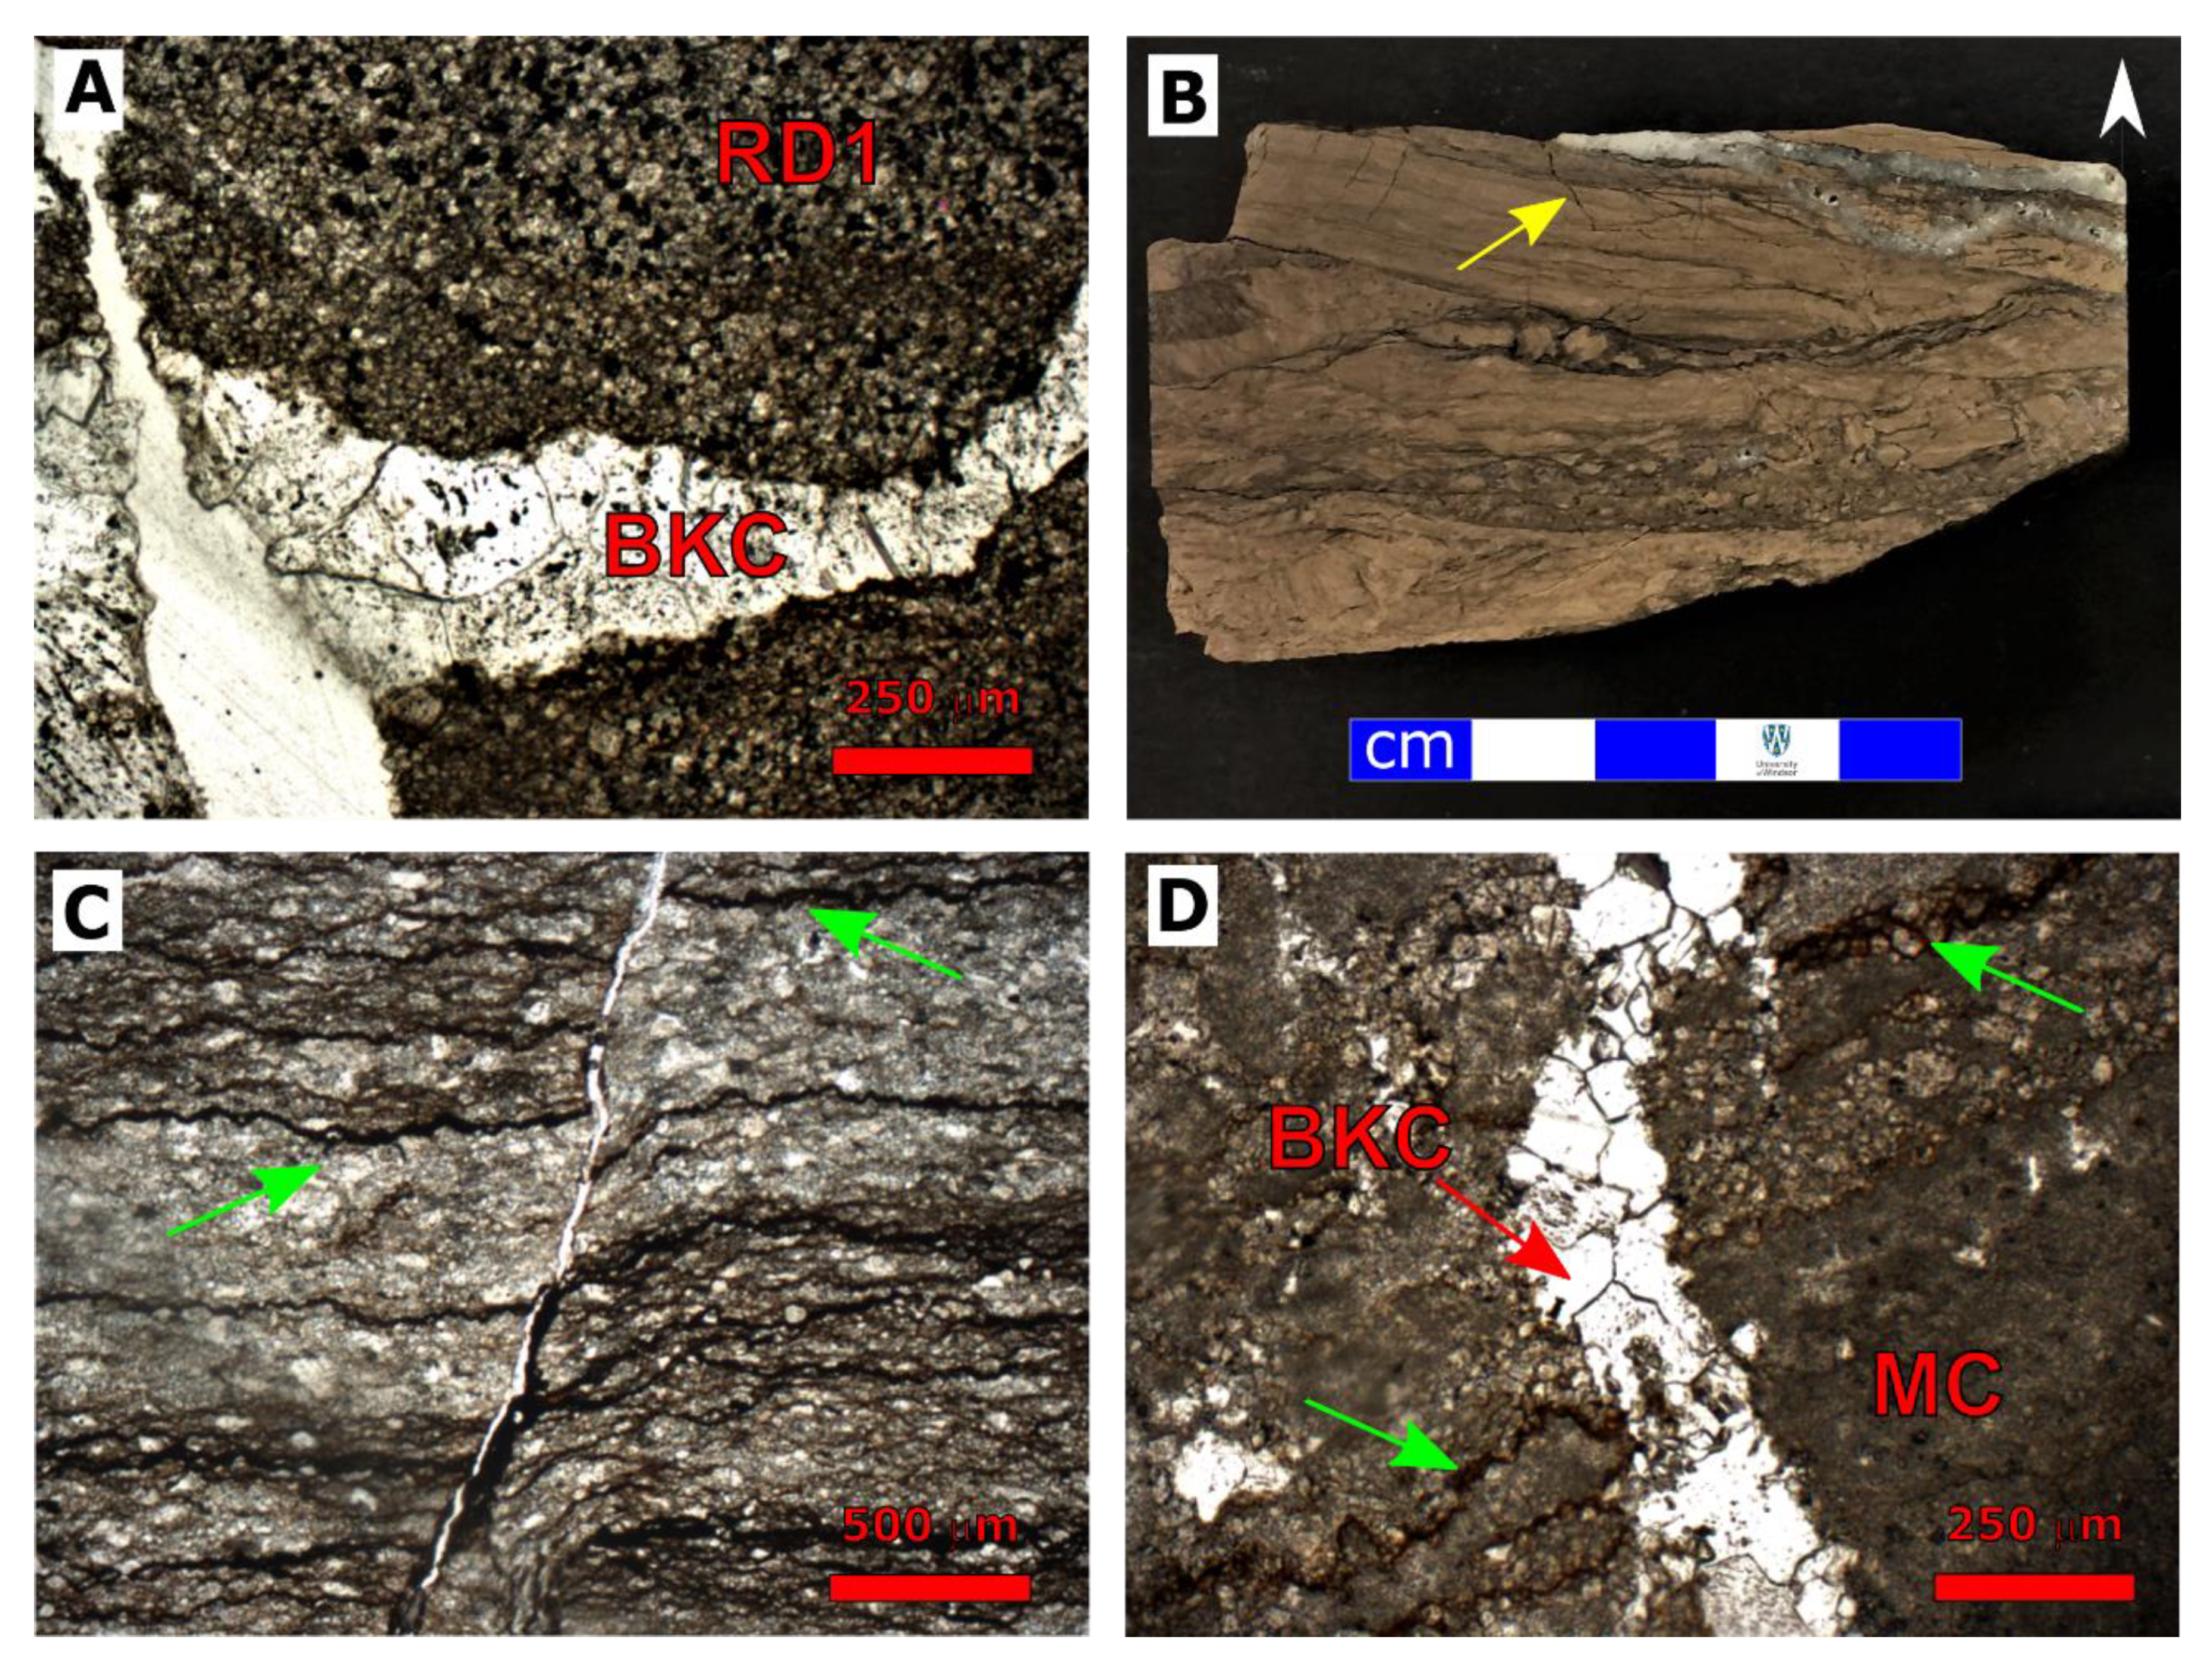
4.1.2. Fracturing
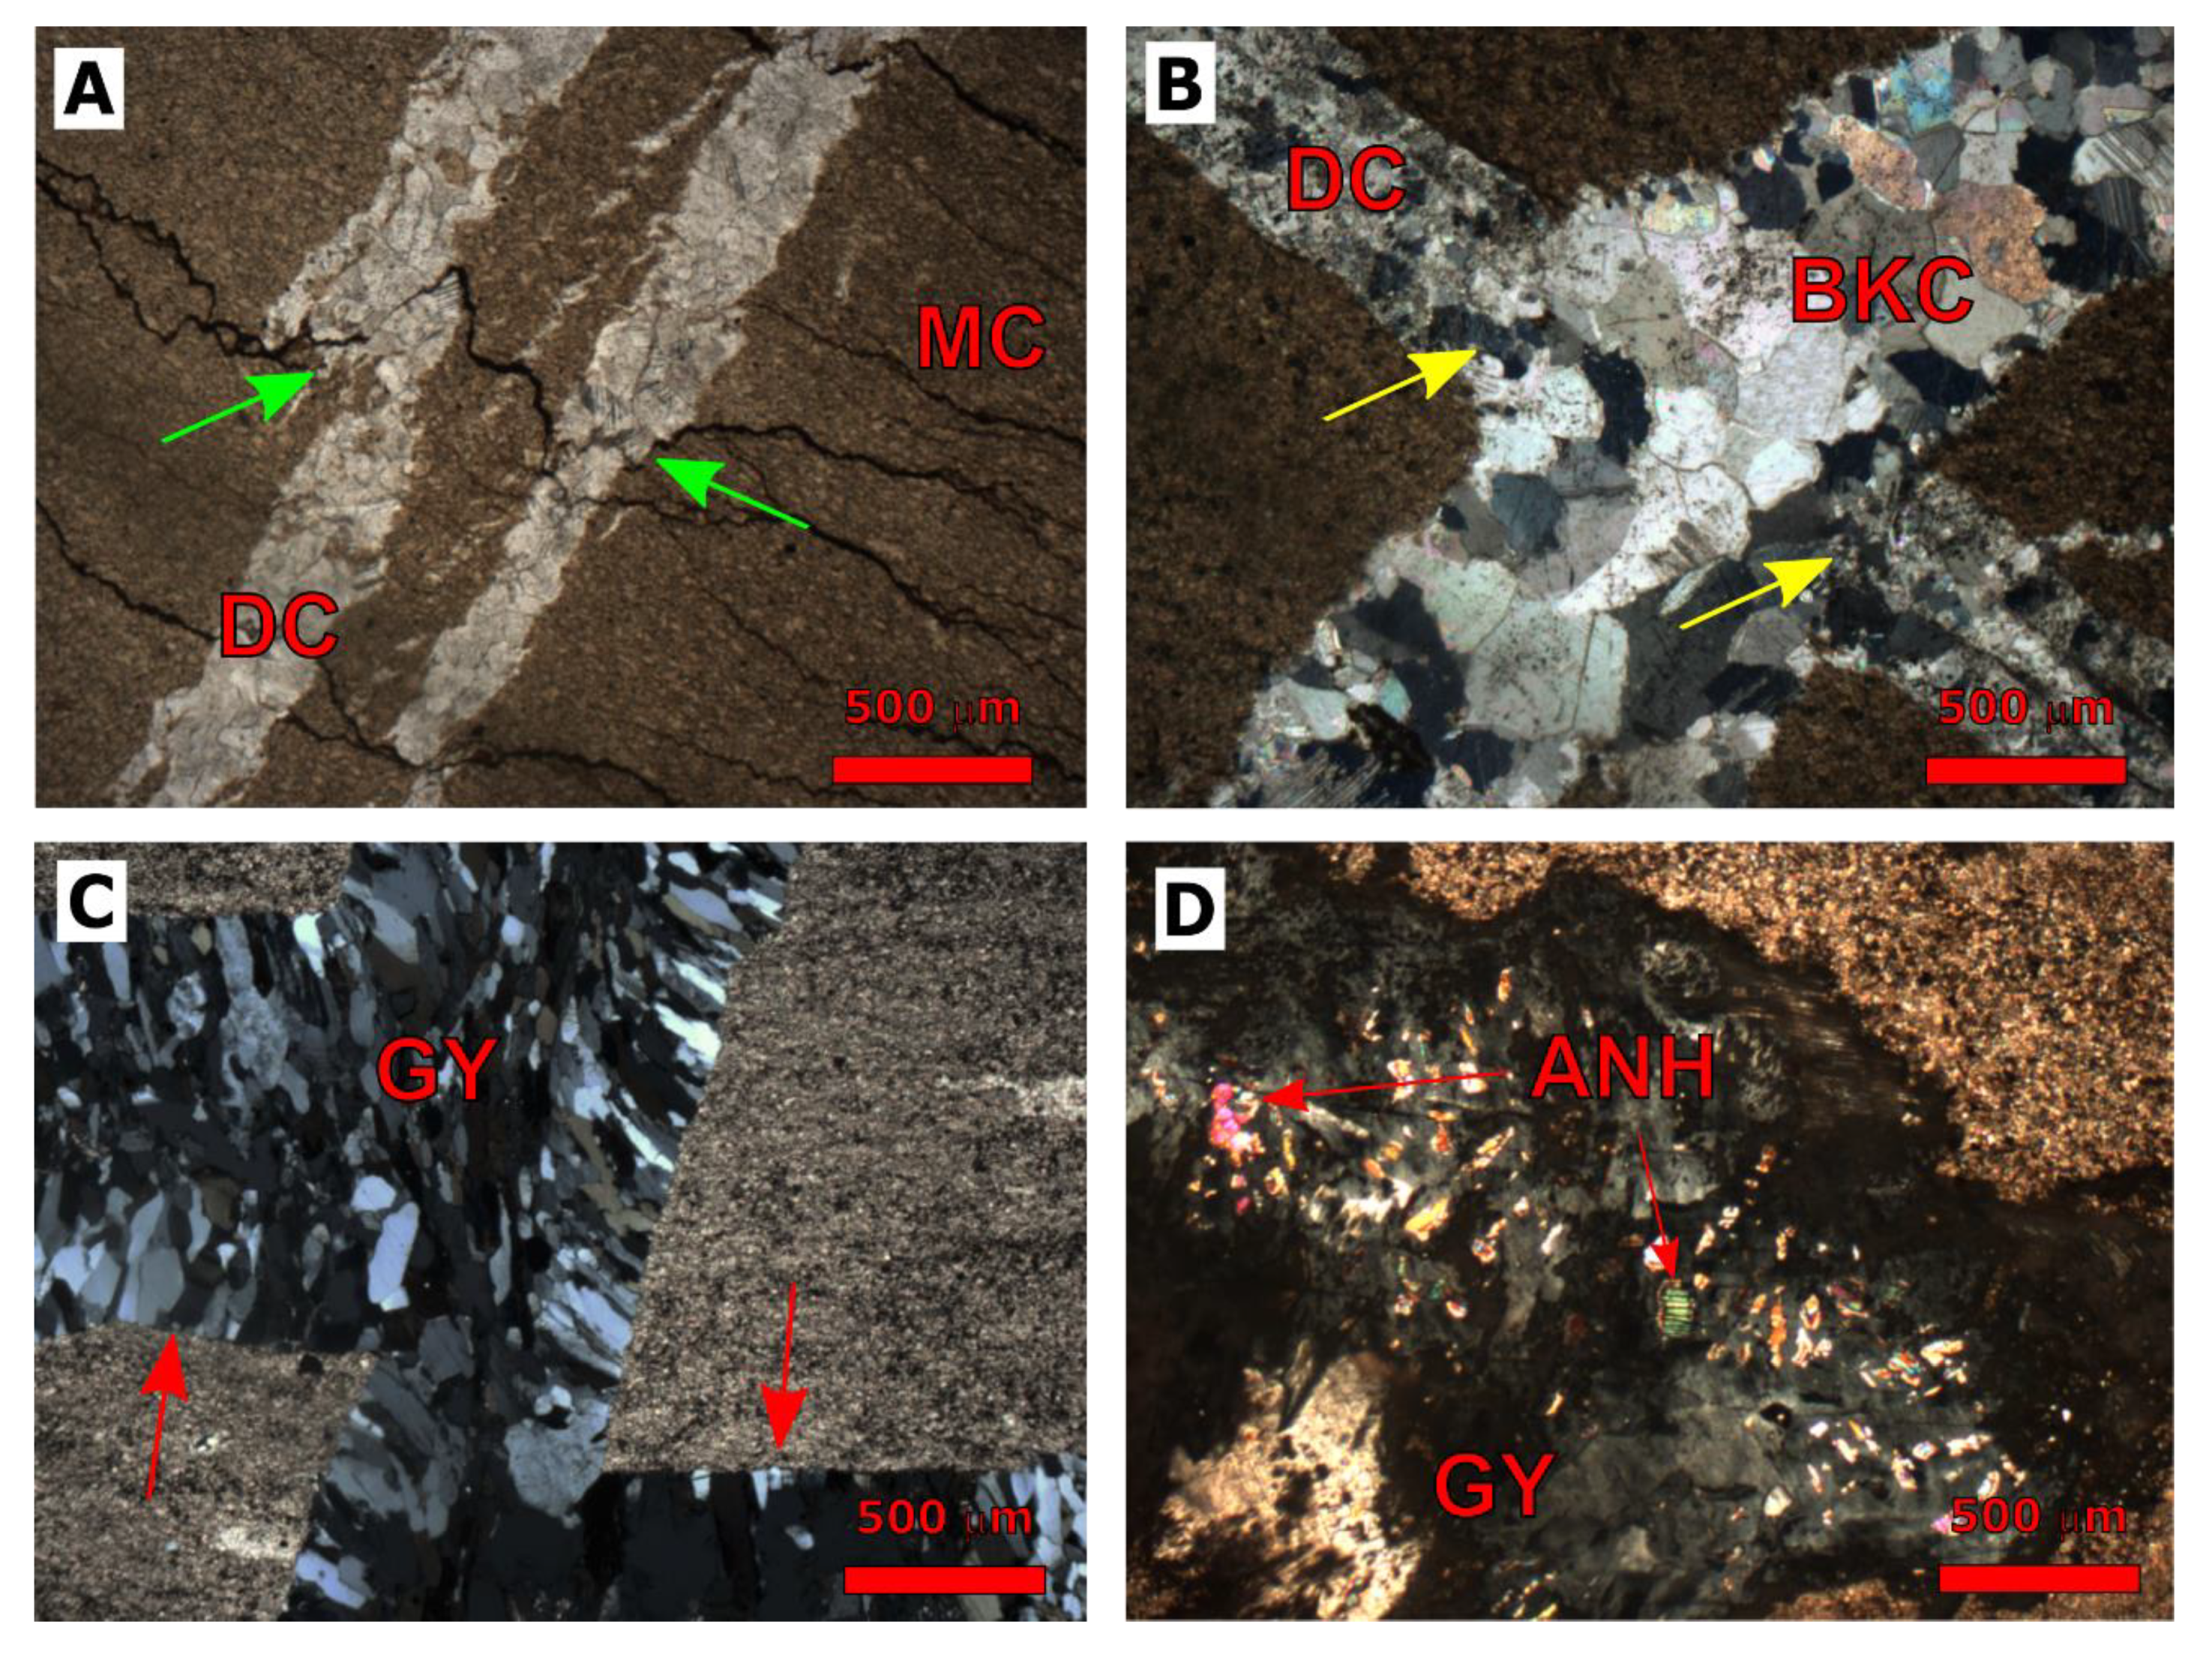
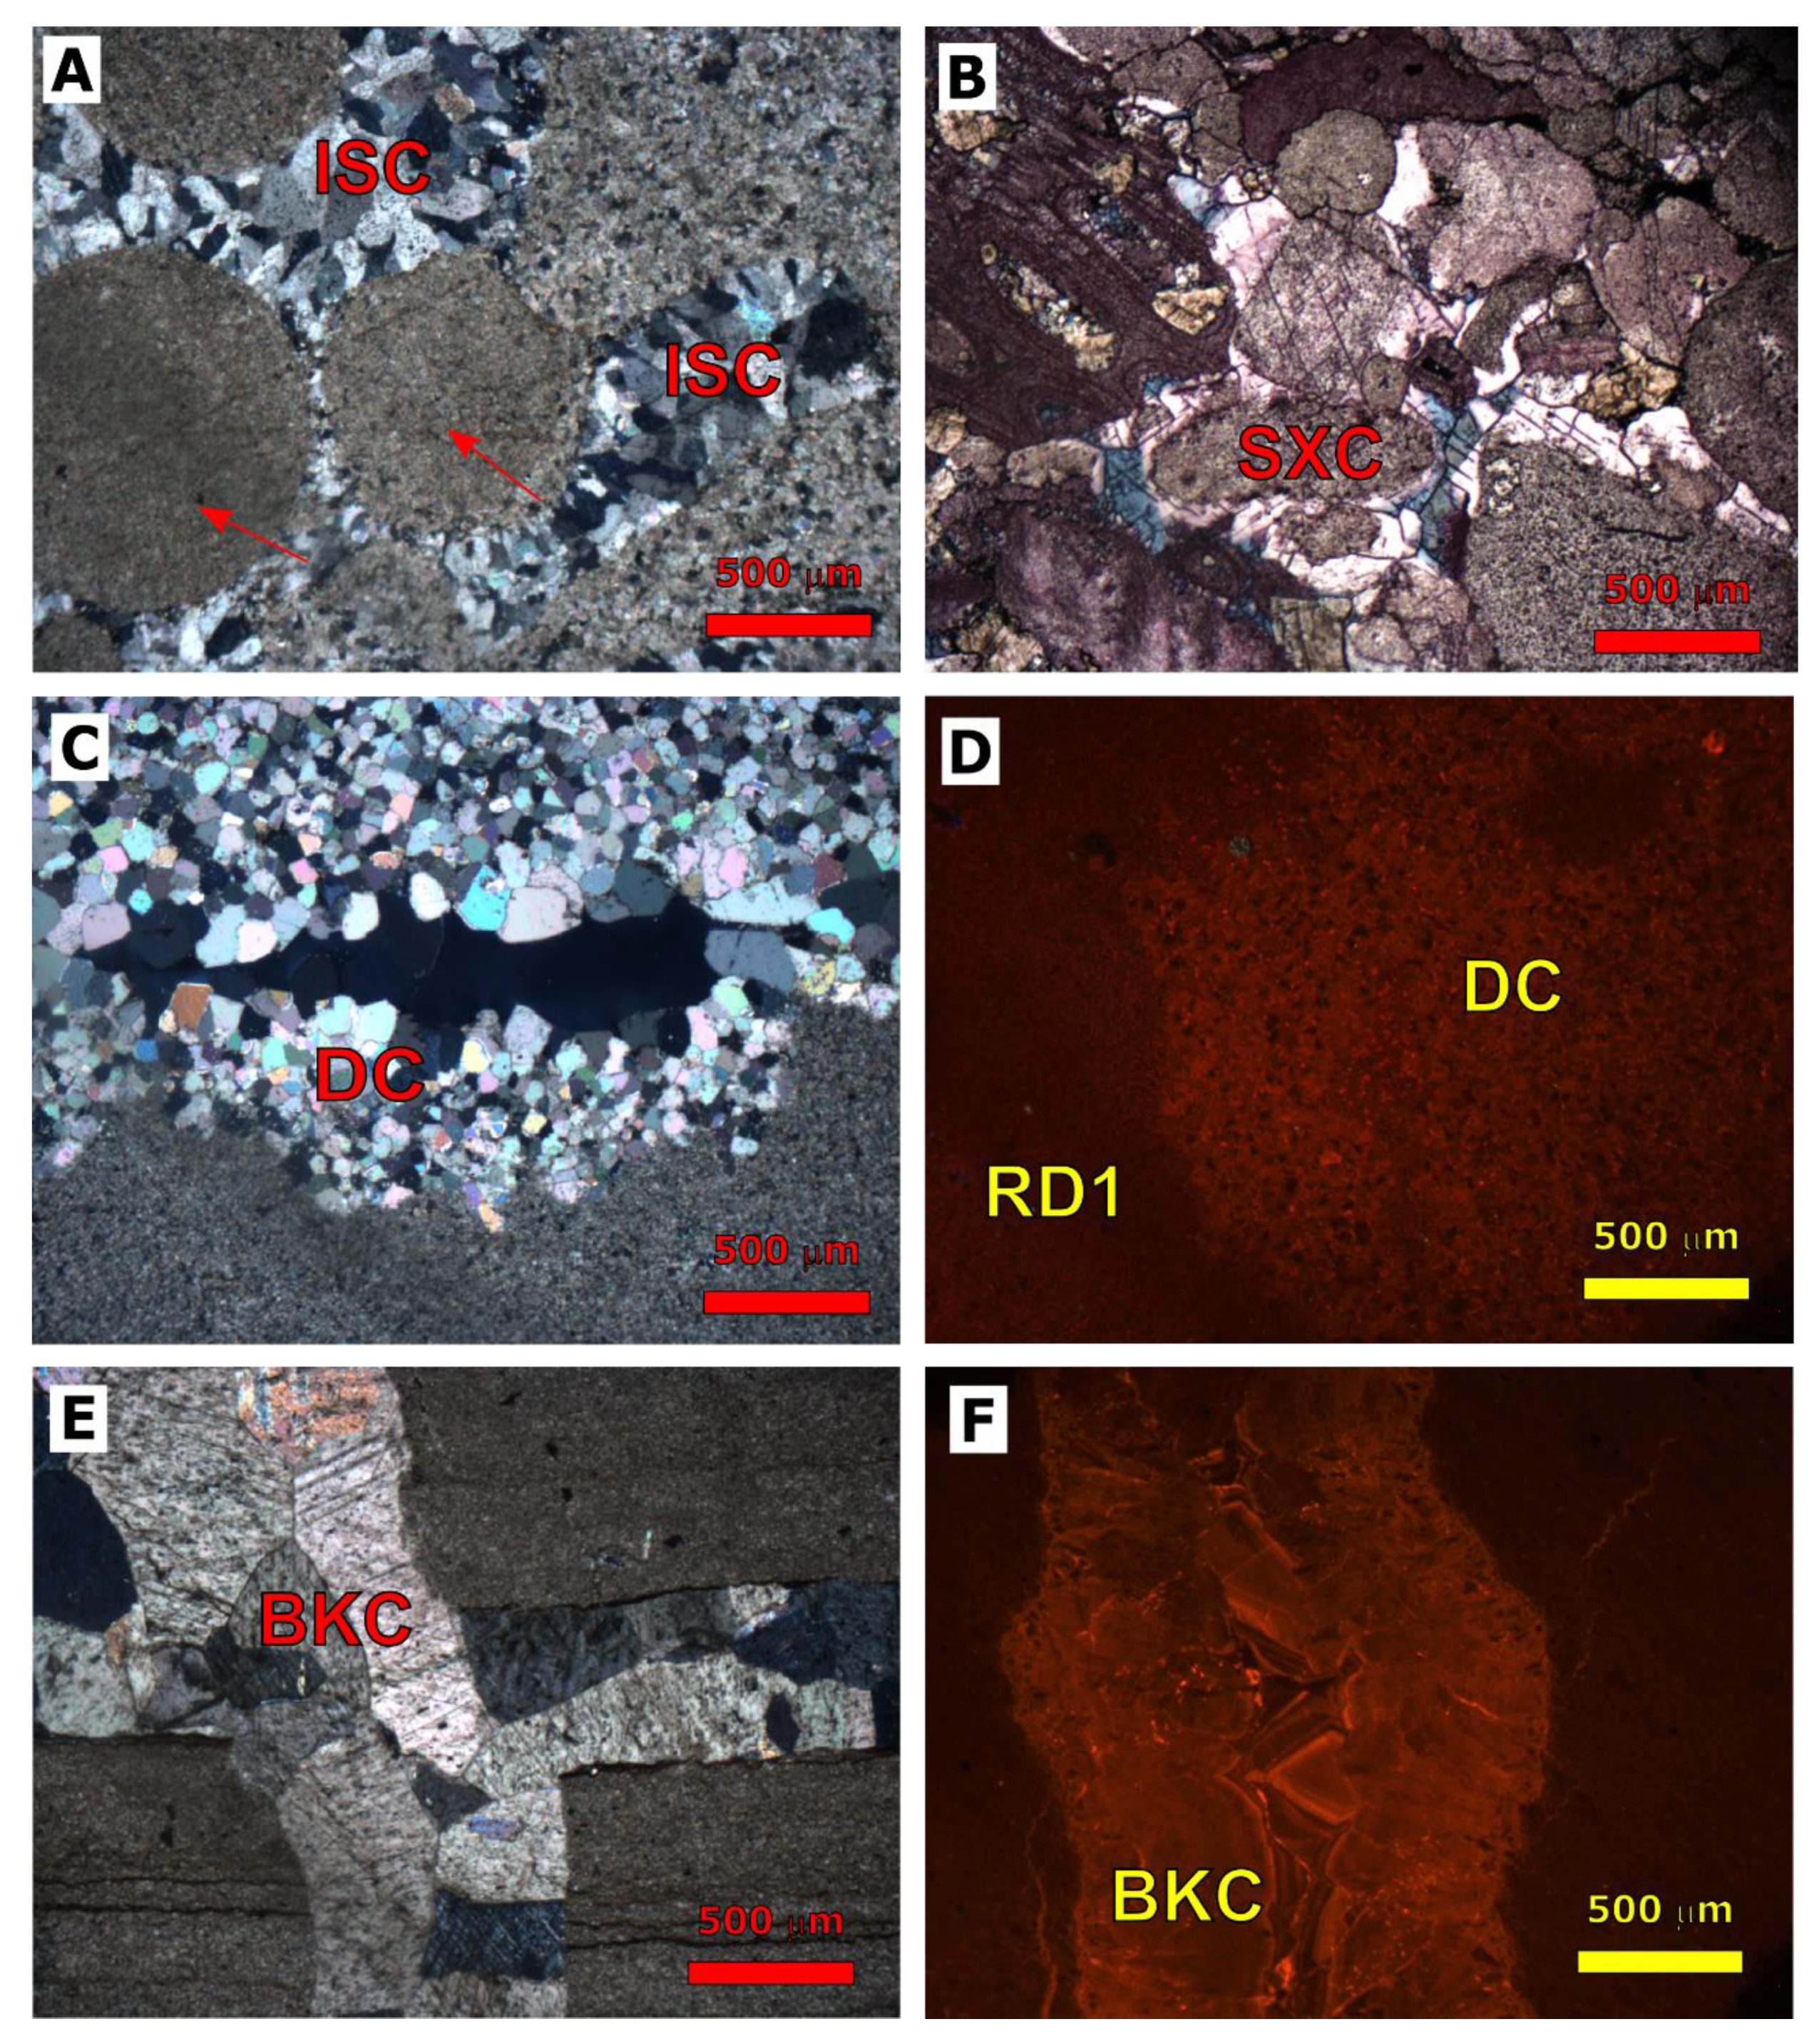
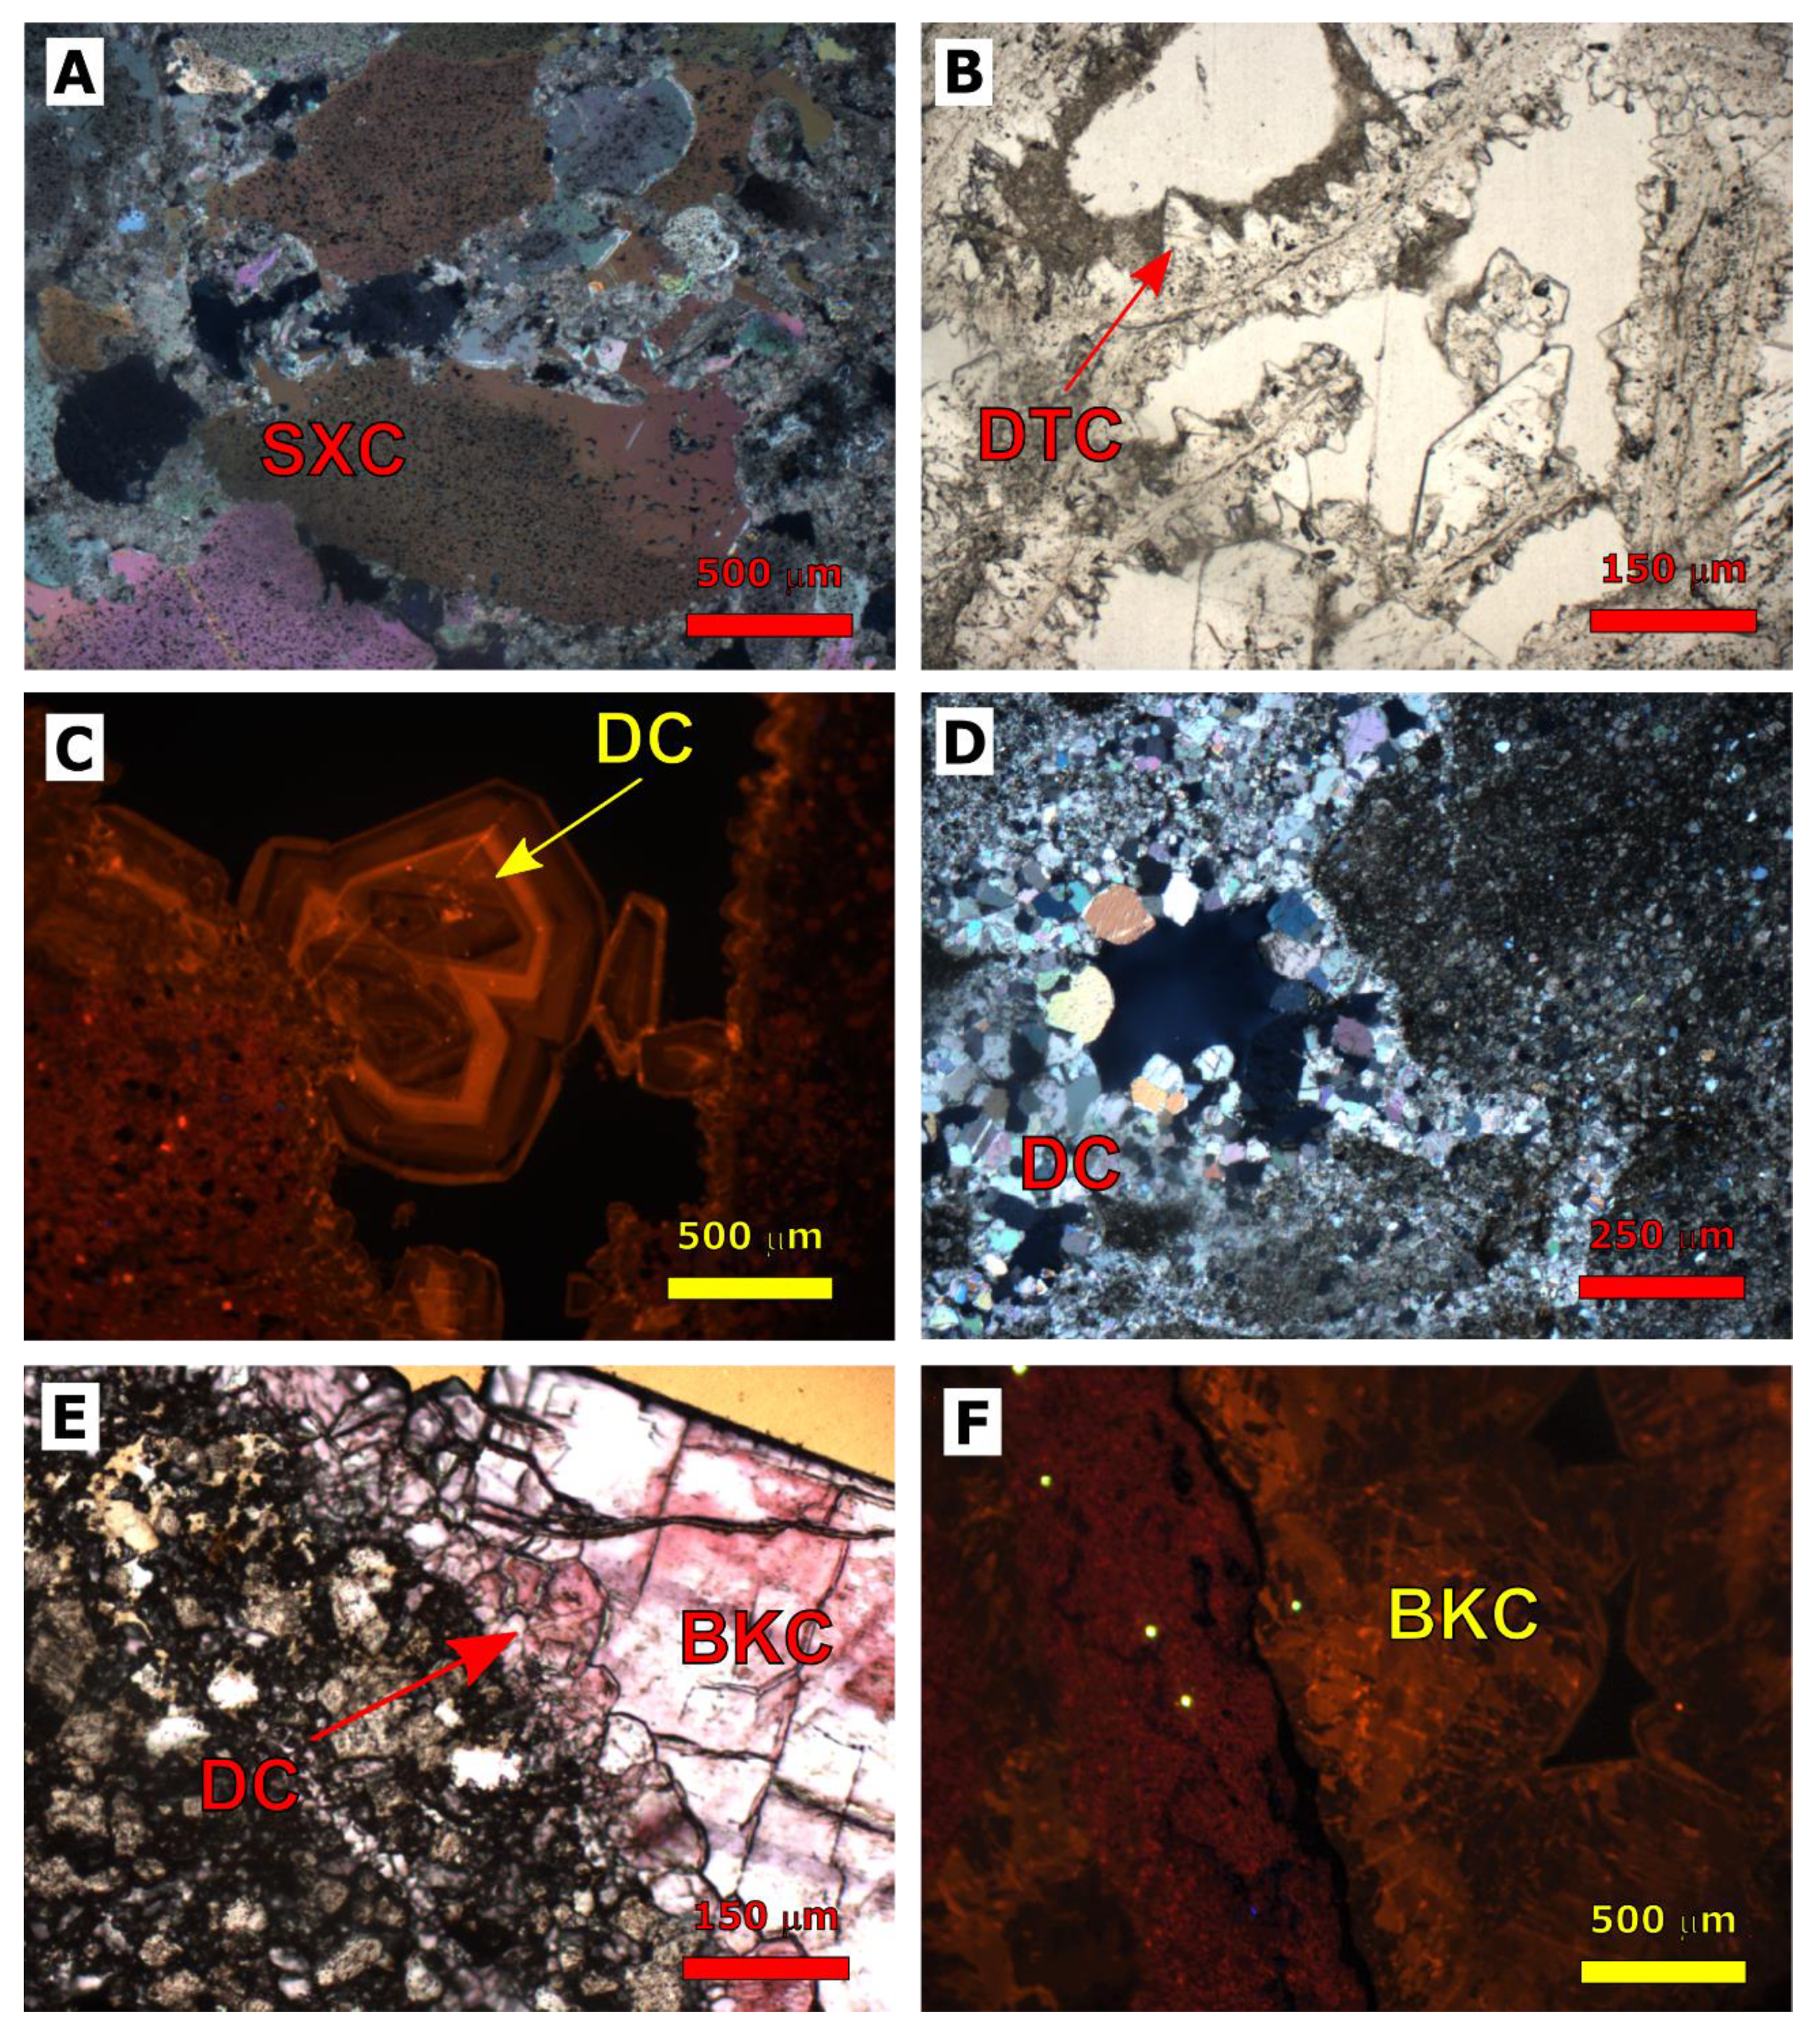
4.1.3. Calcite Cementation
4.1.4. Evaporite Cementation
4.2. Petrography of Devonian Formations
4.2.1. Dolomitization
4.2.2. Fracturing
4.2.3. Calcite Cementation
4.3. Geochemistry of Silurian and Devonian Formations
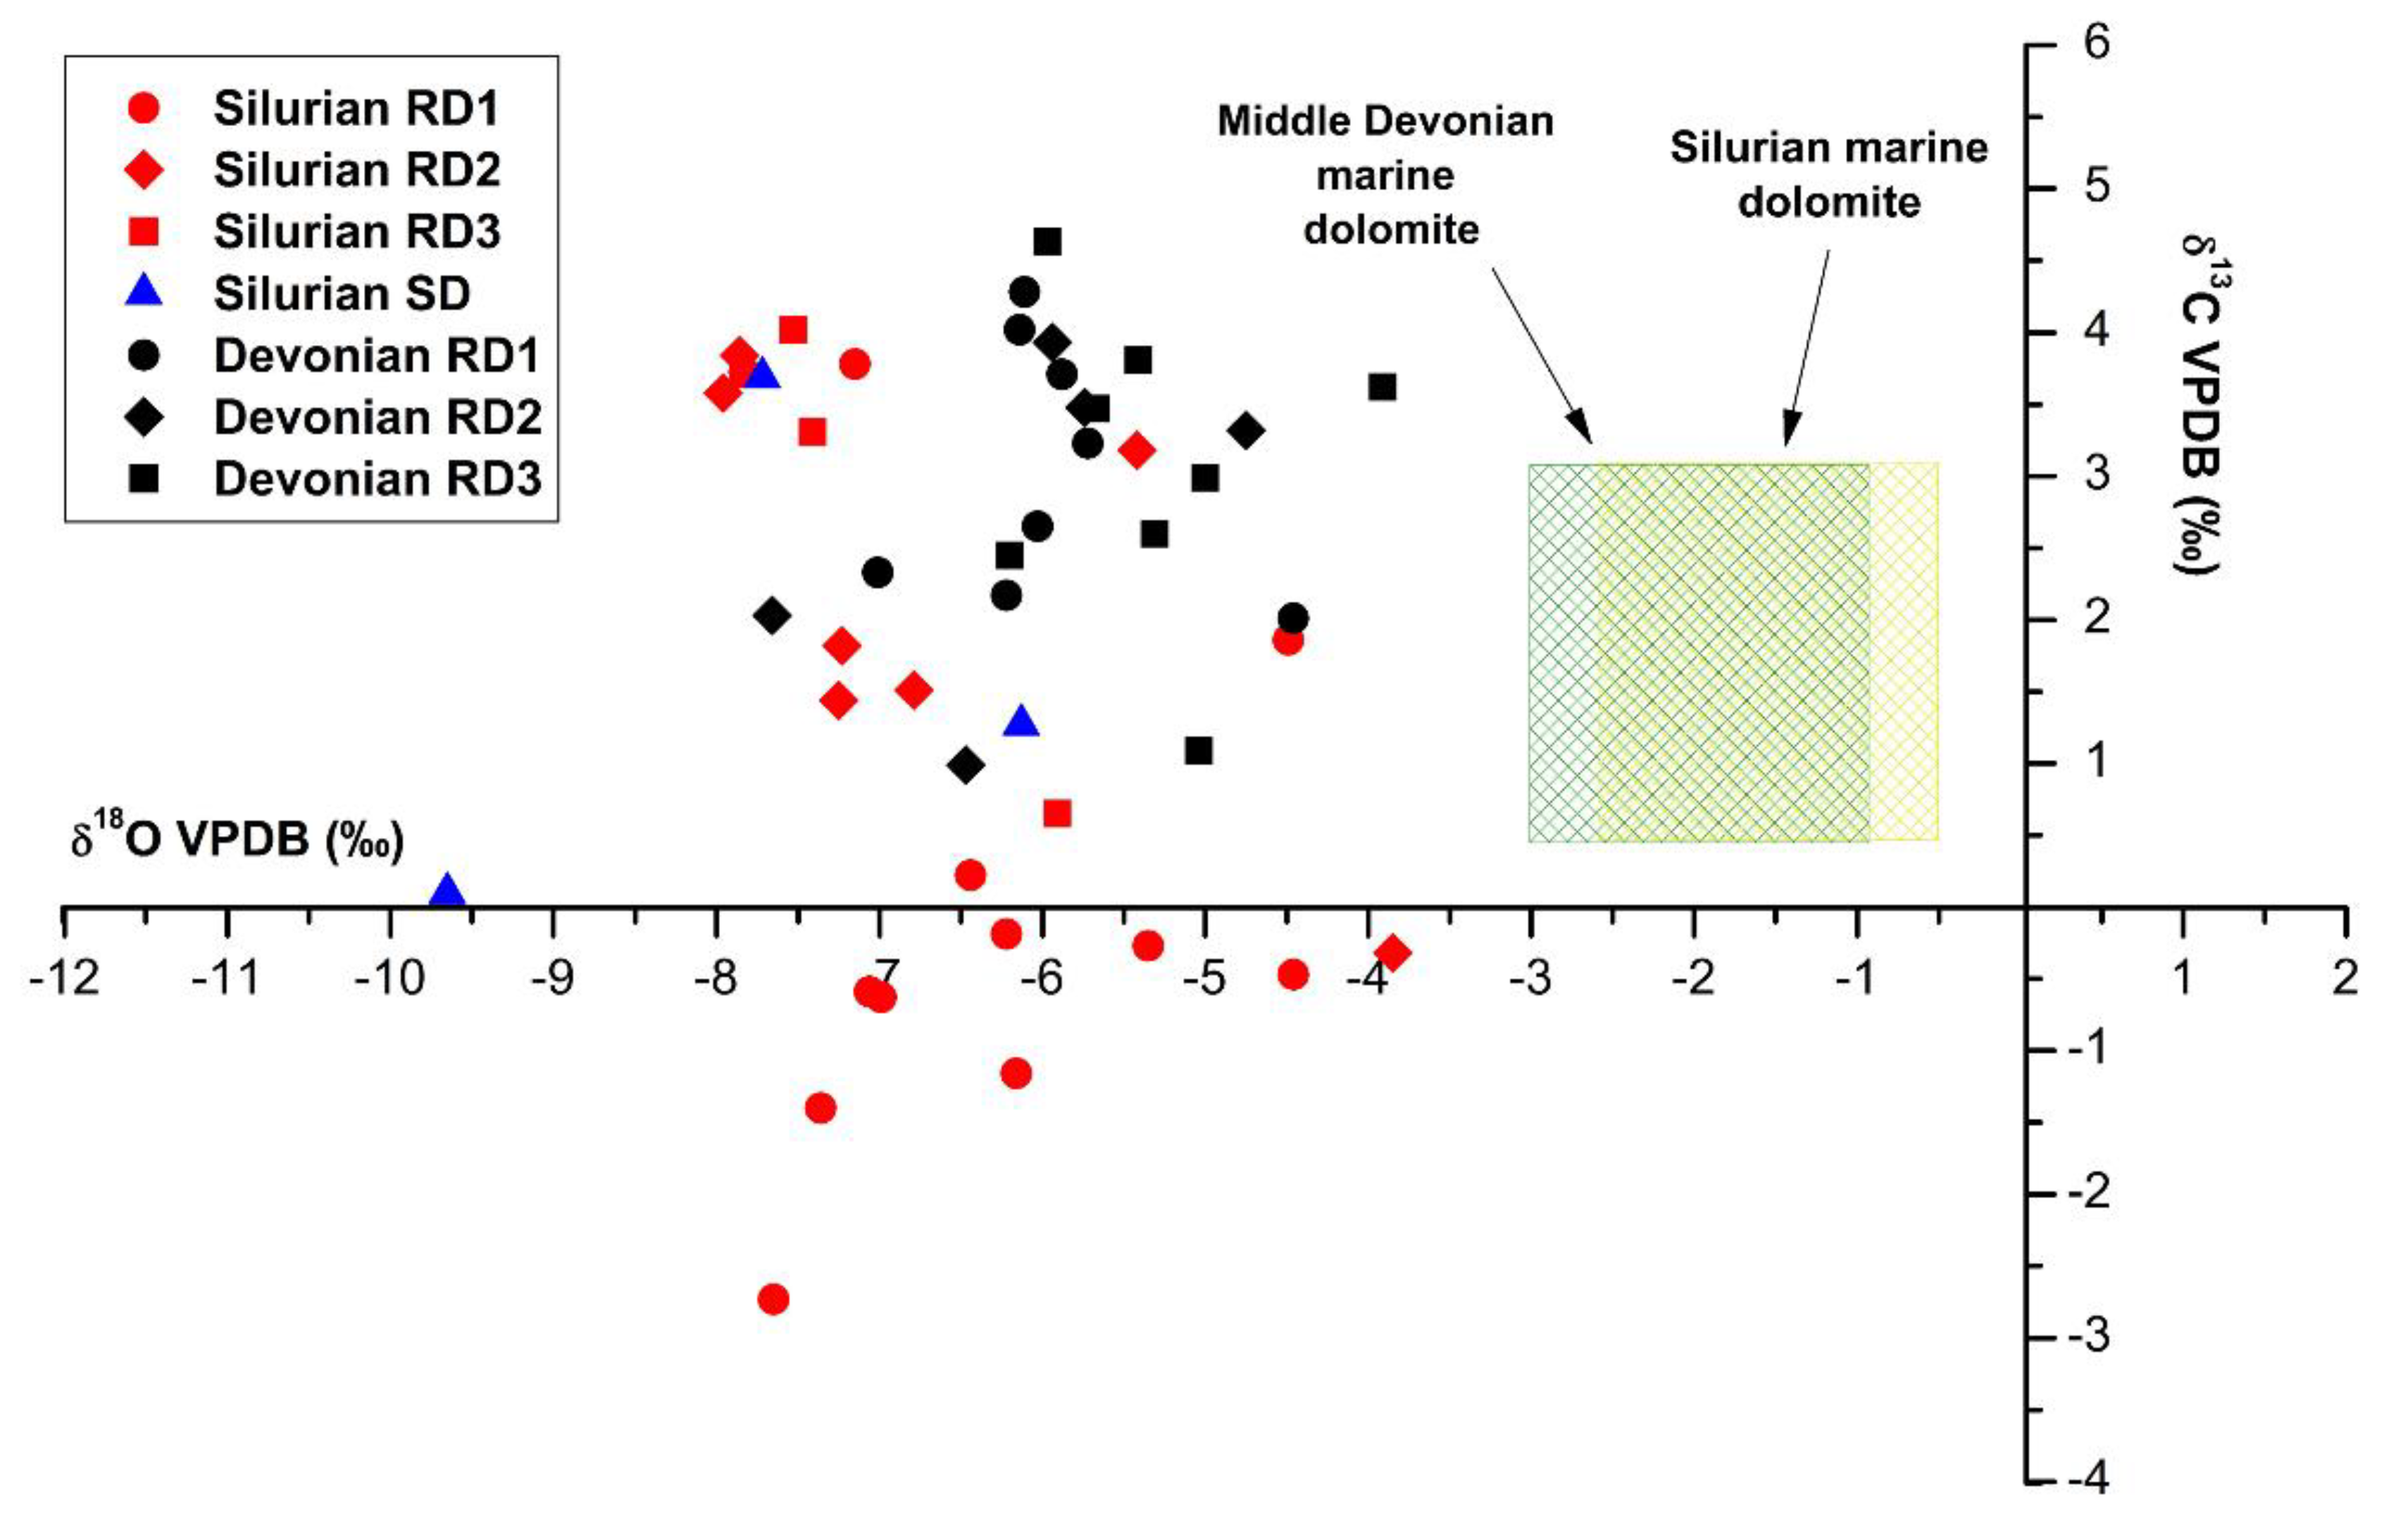
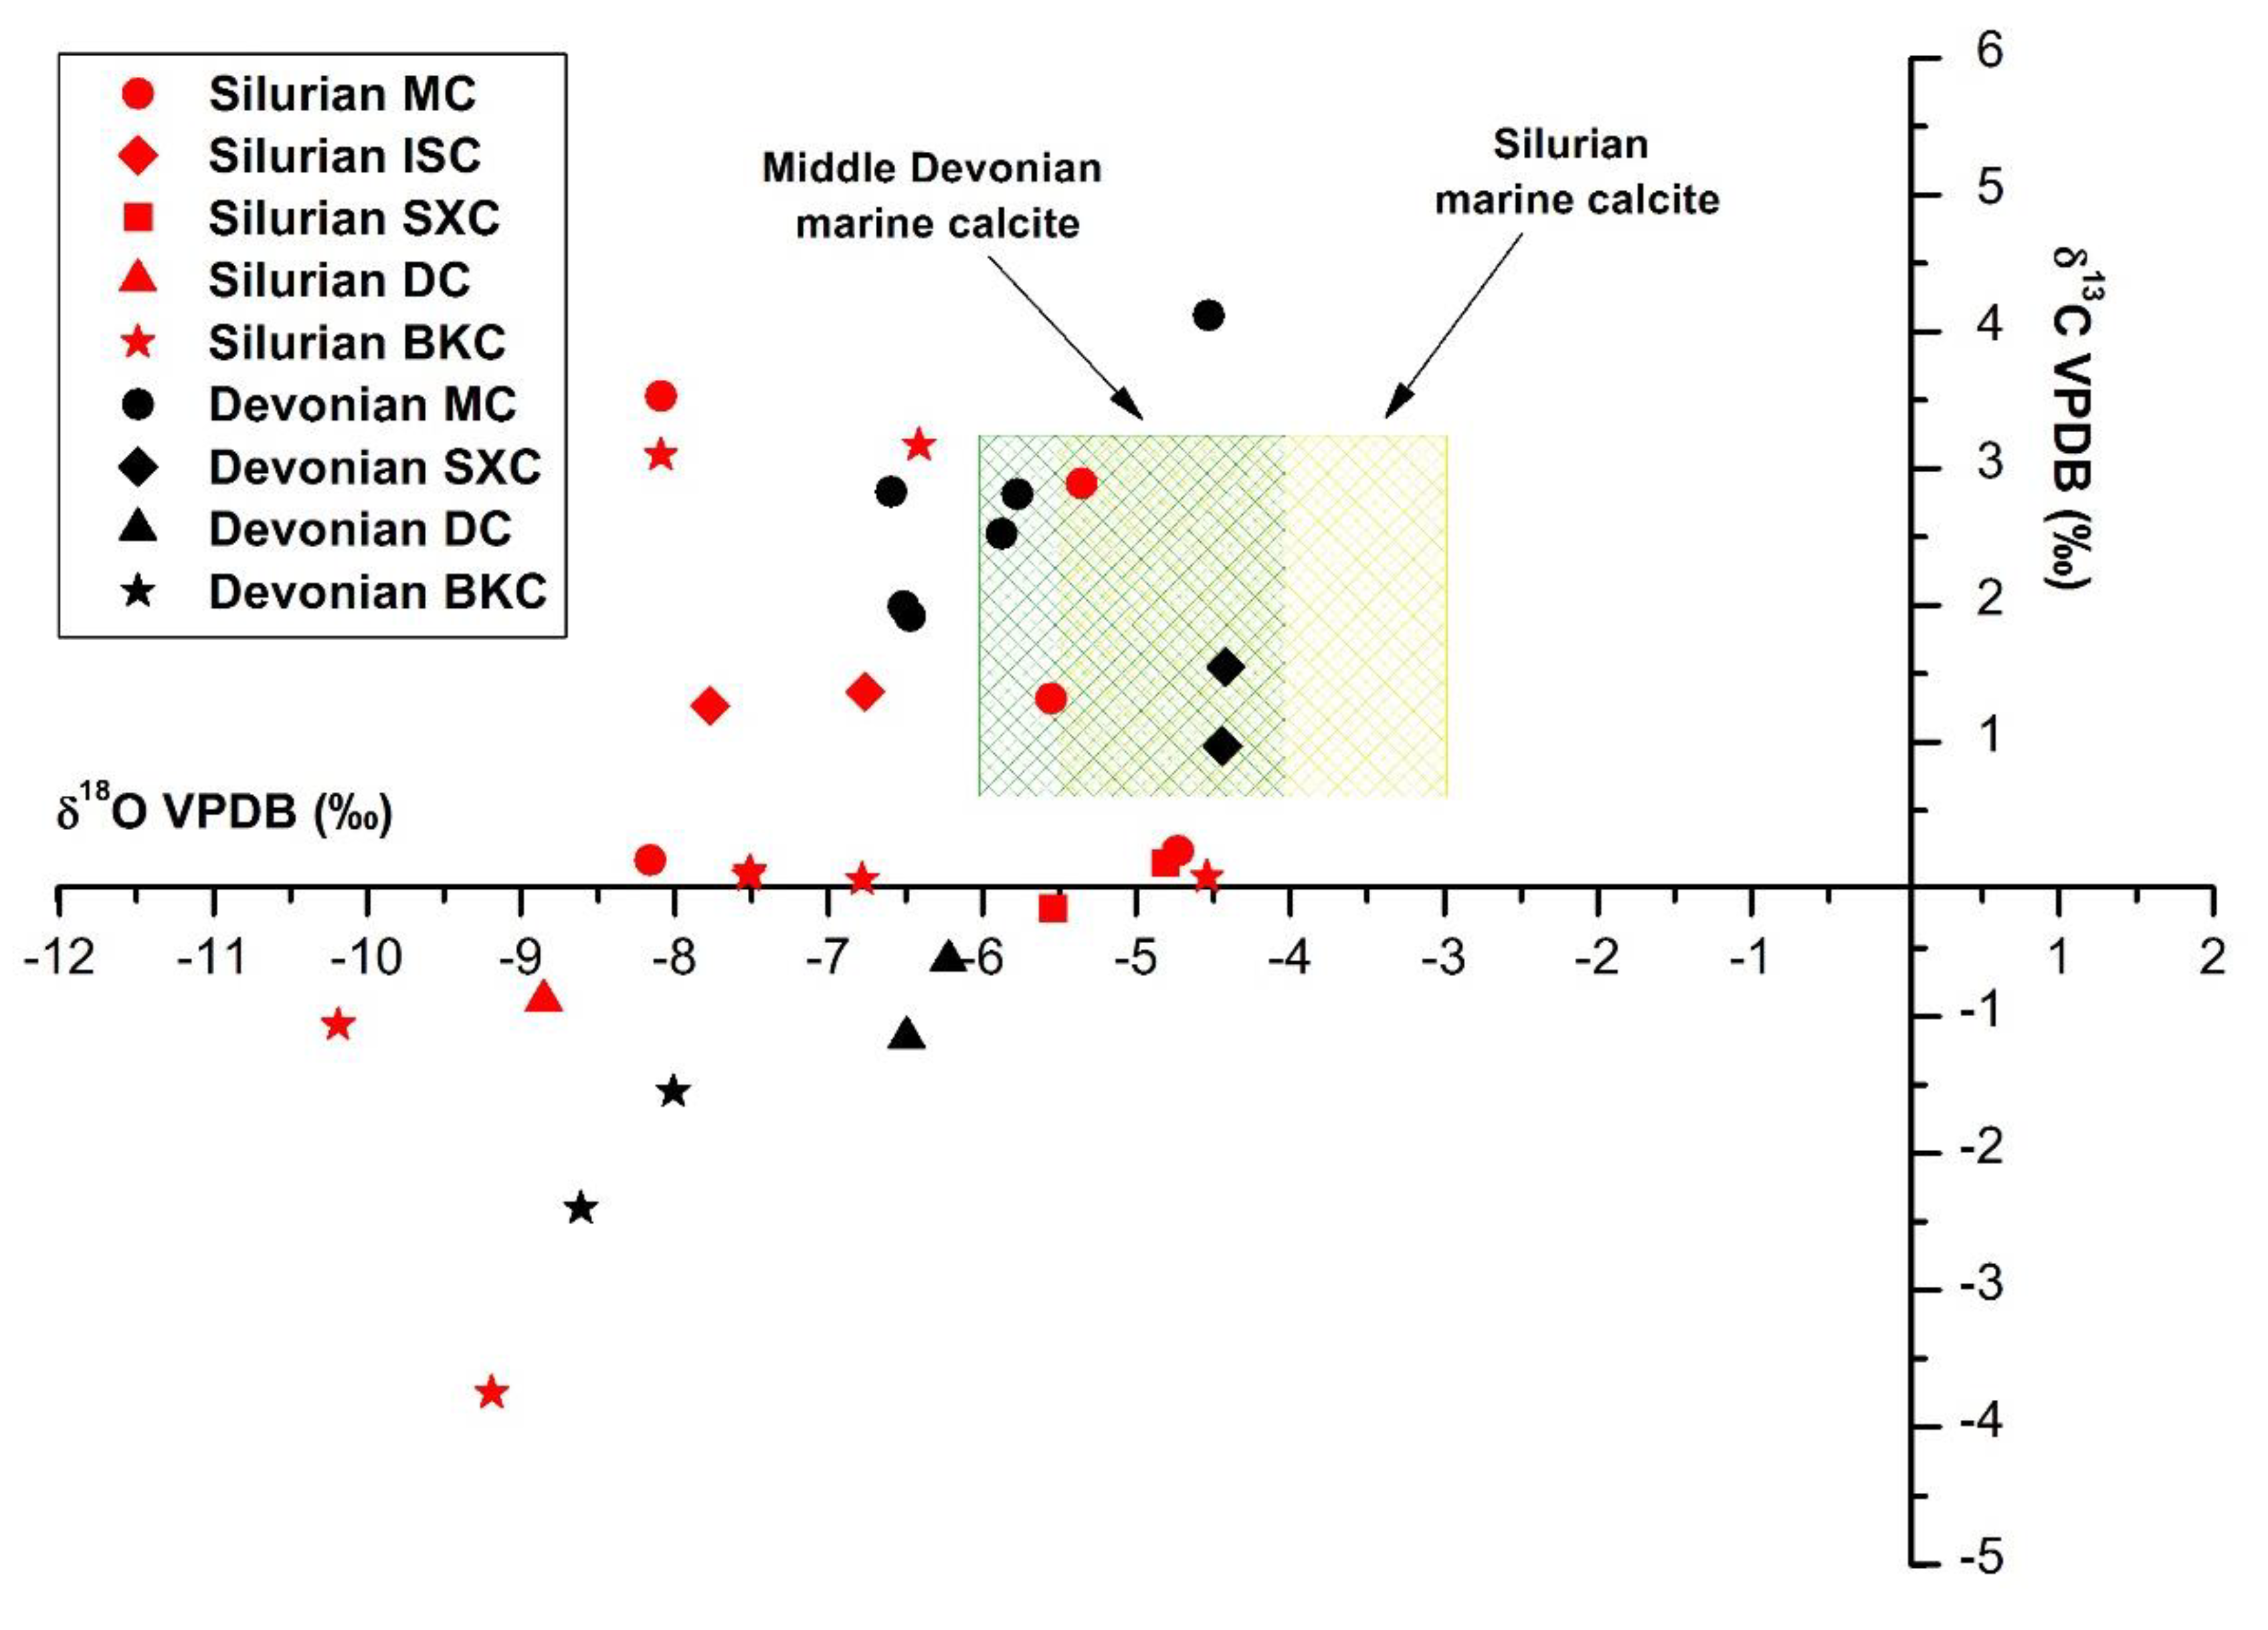
4.3.1. Oxygen and Carbon Stable Isotopes
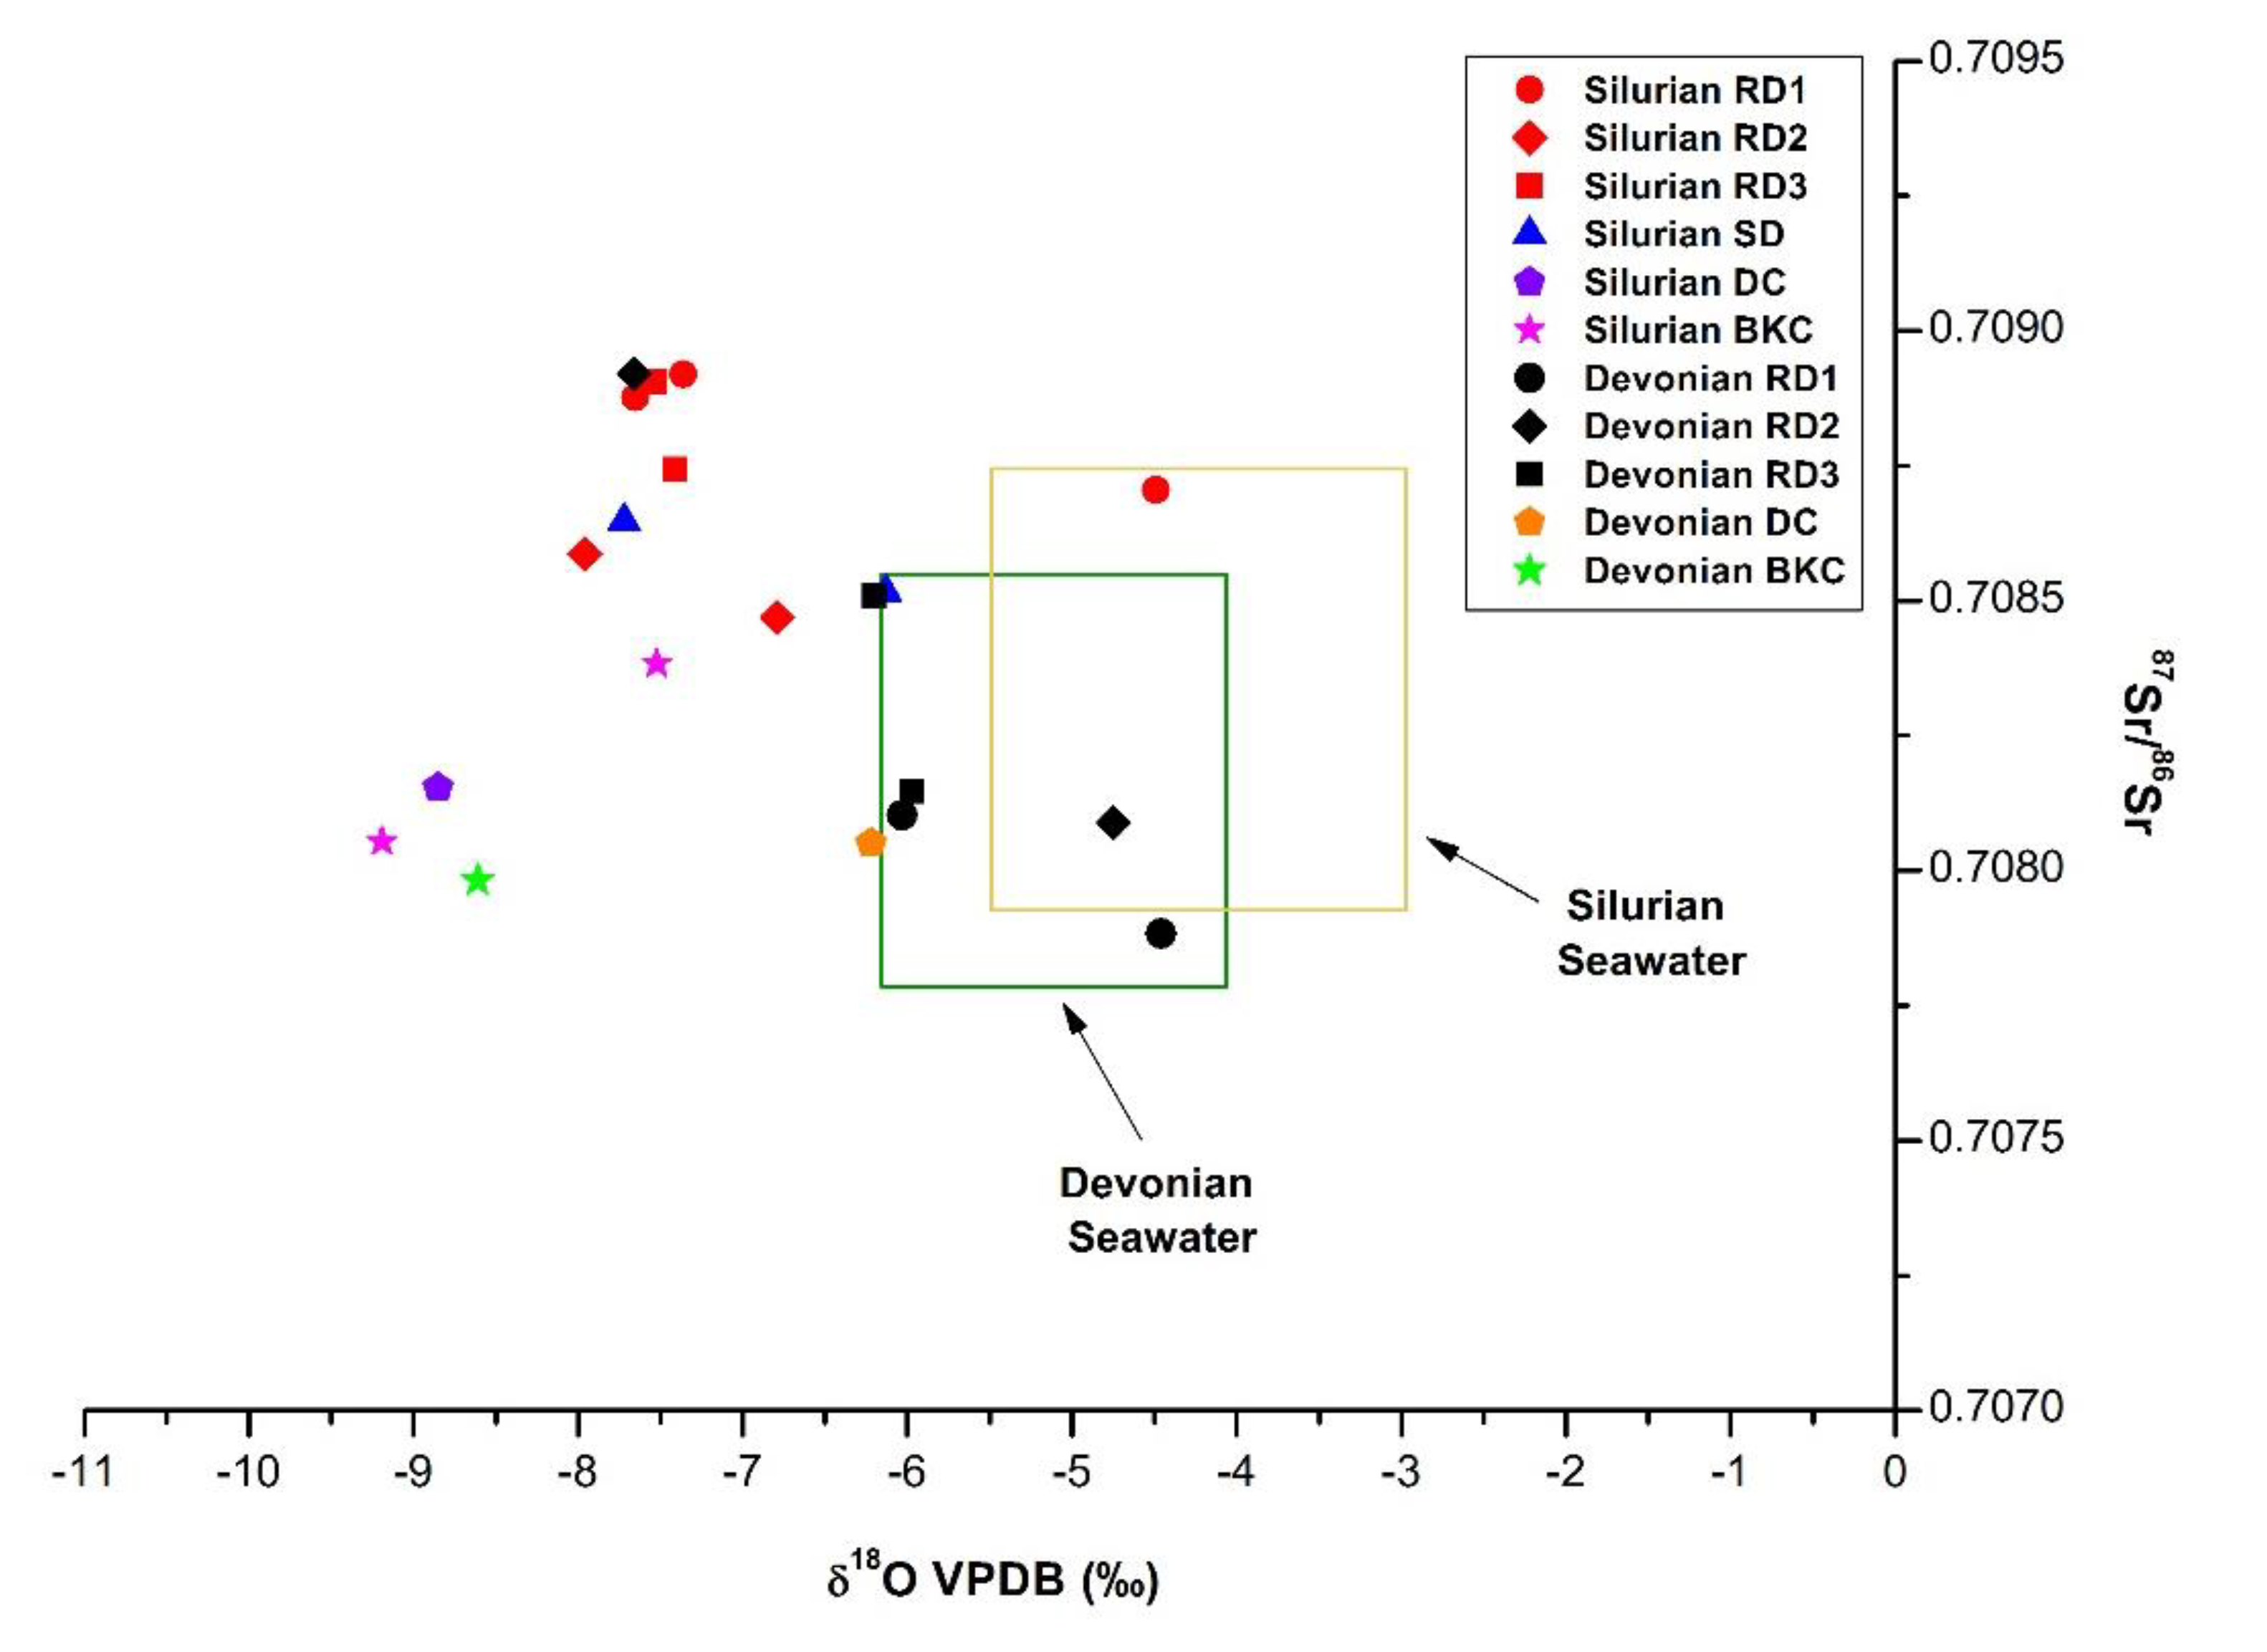
4.3.2. Strontium Isotopes
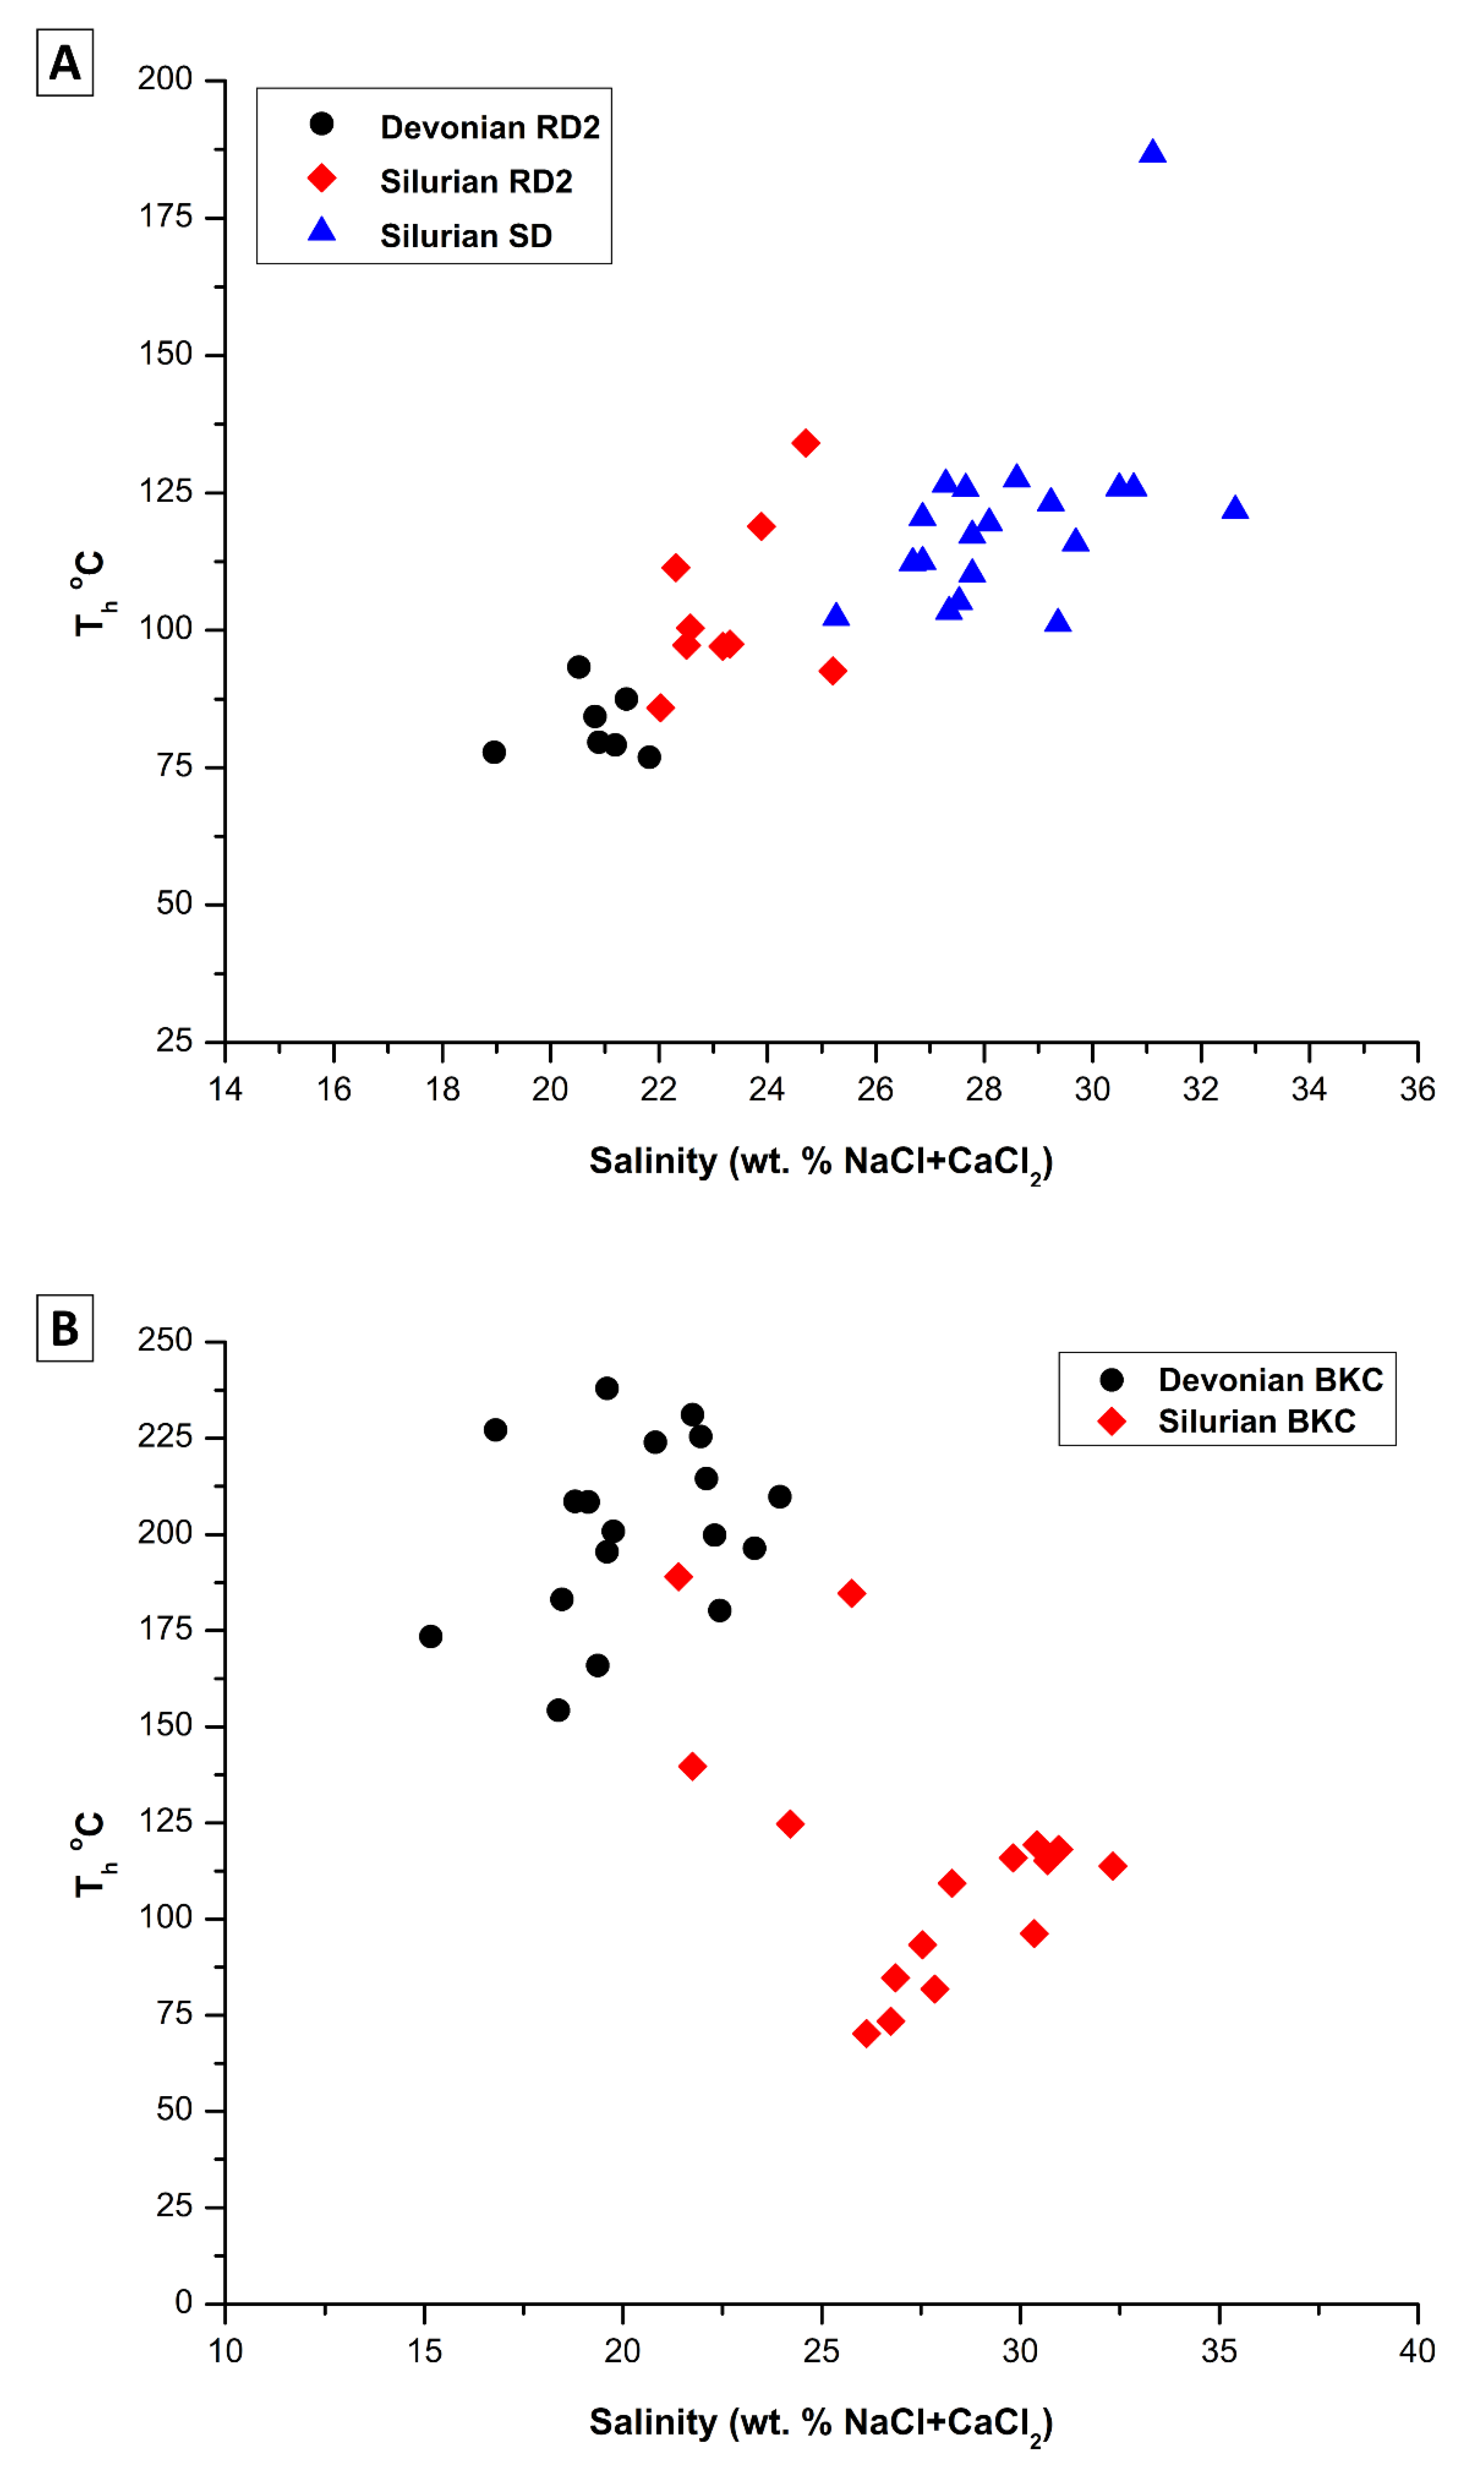
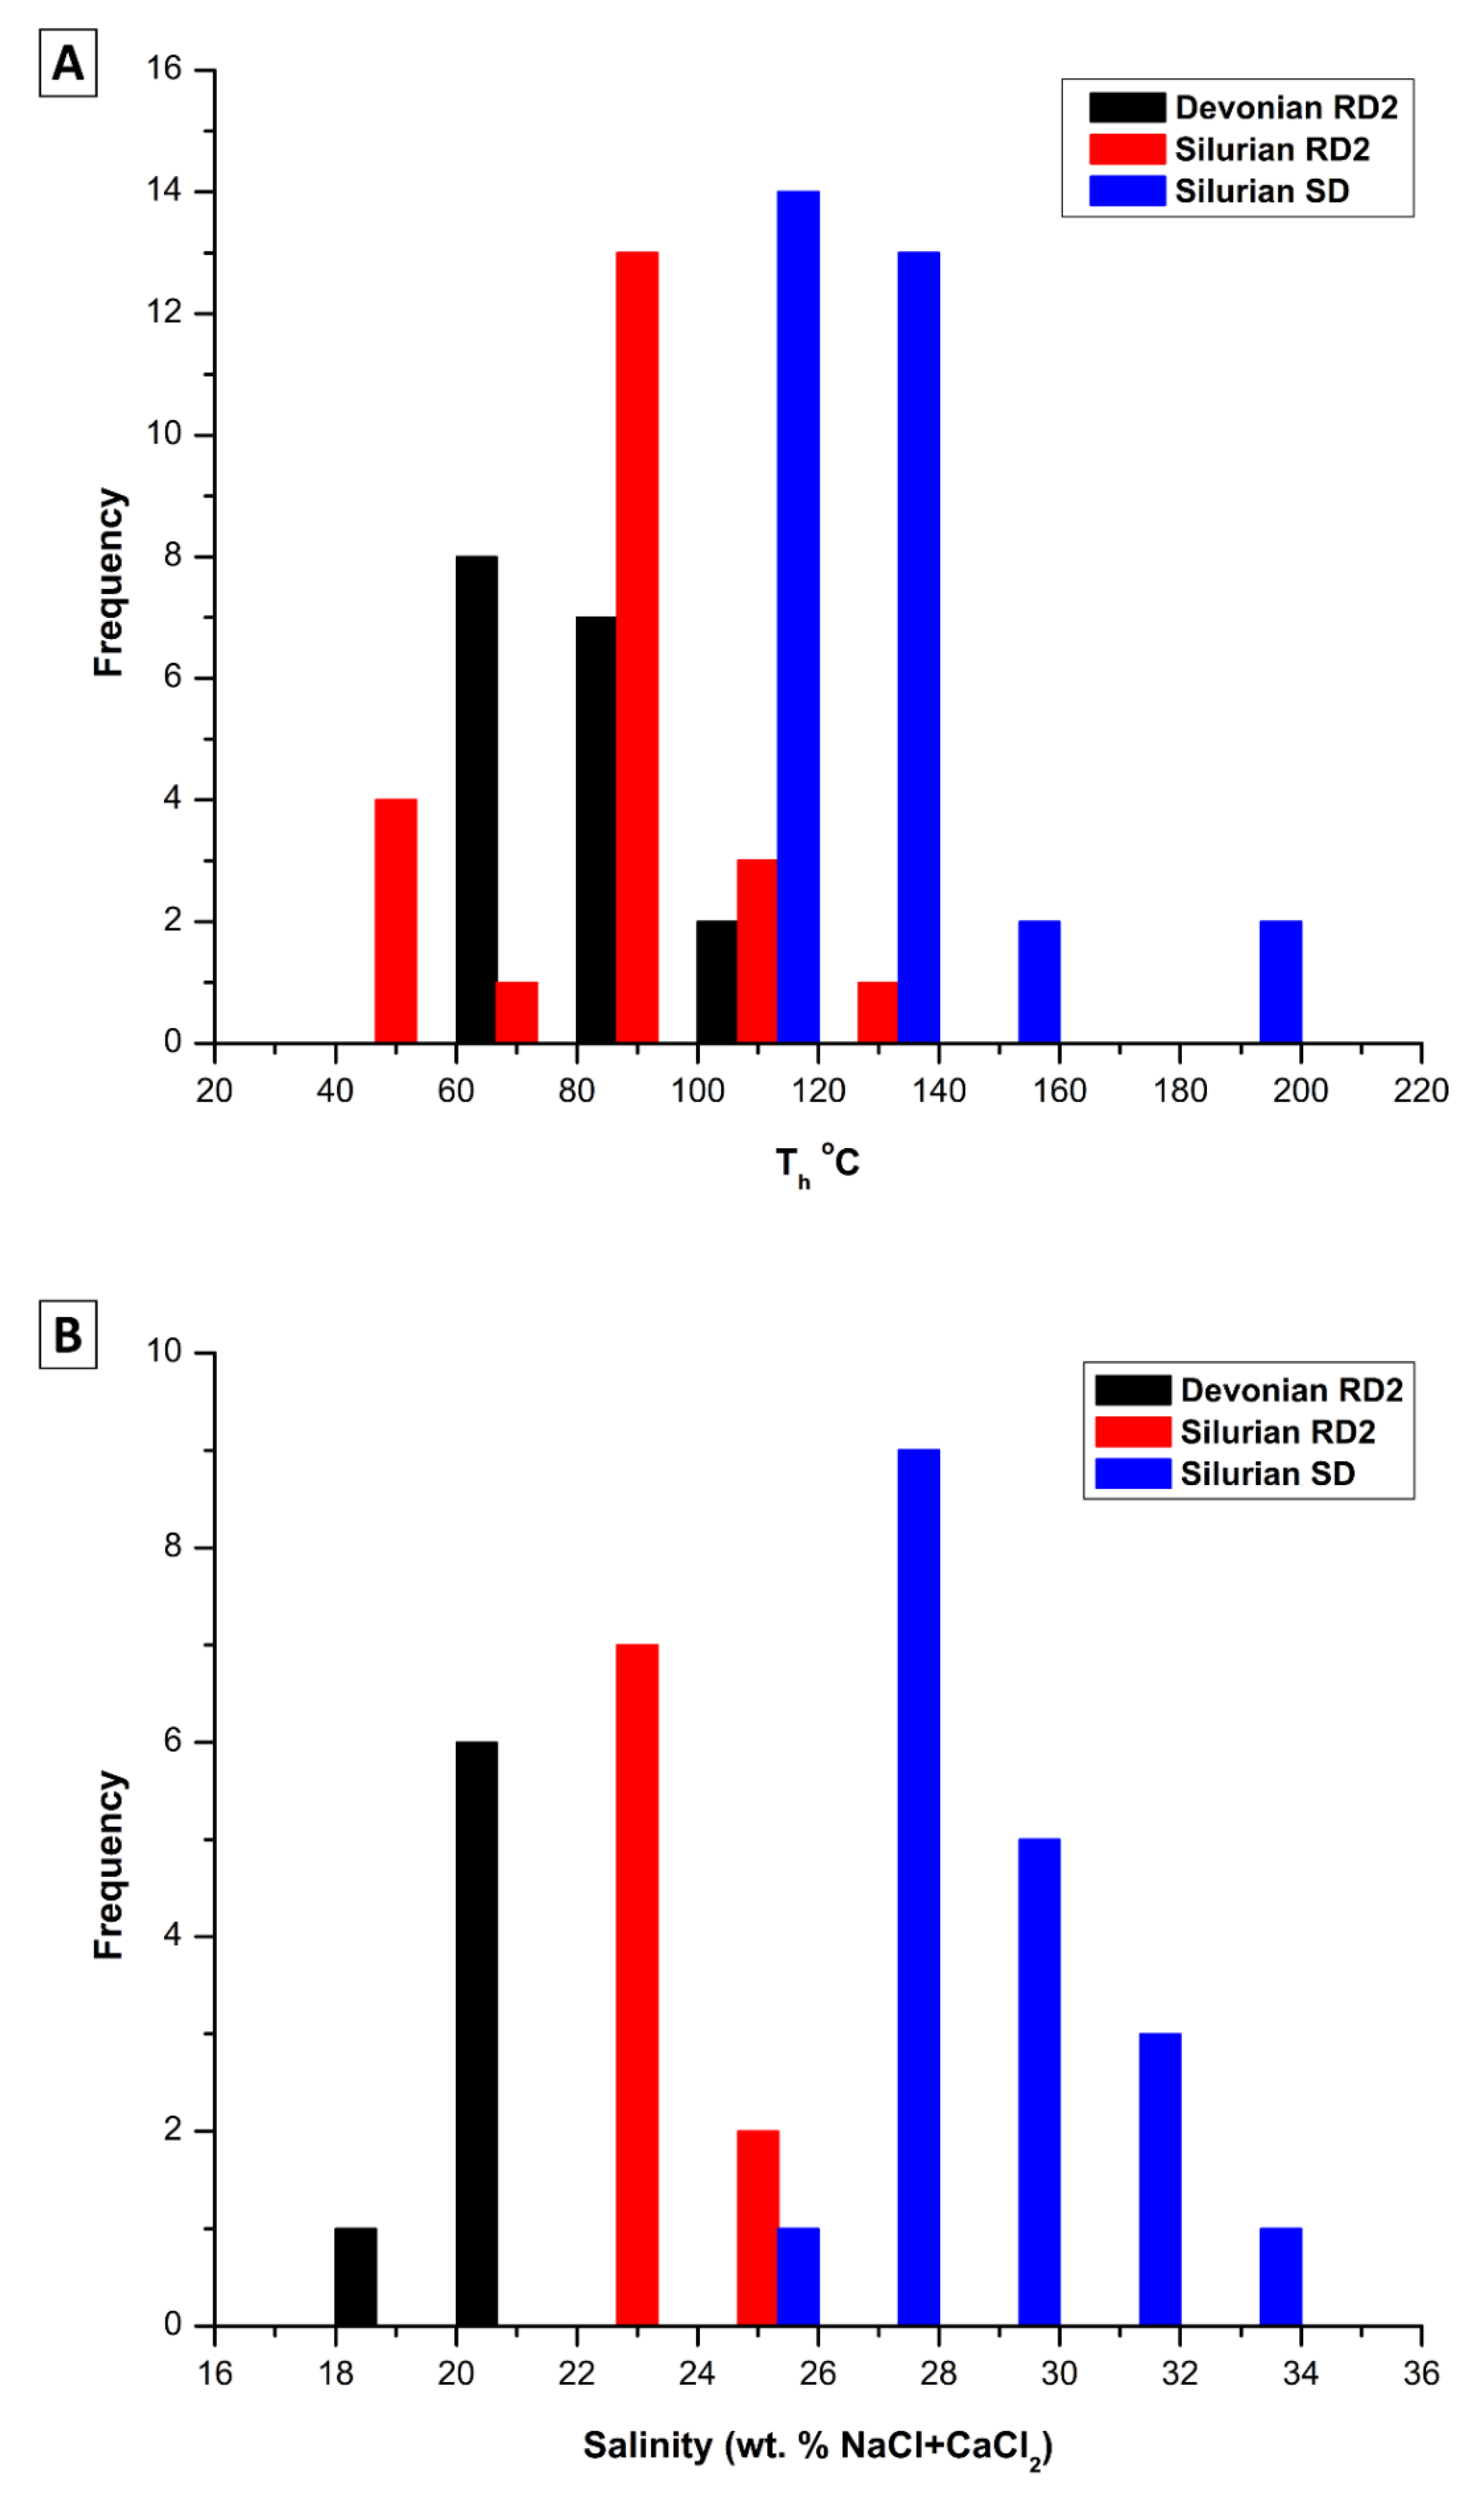
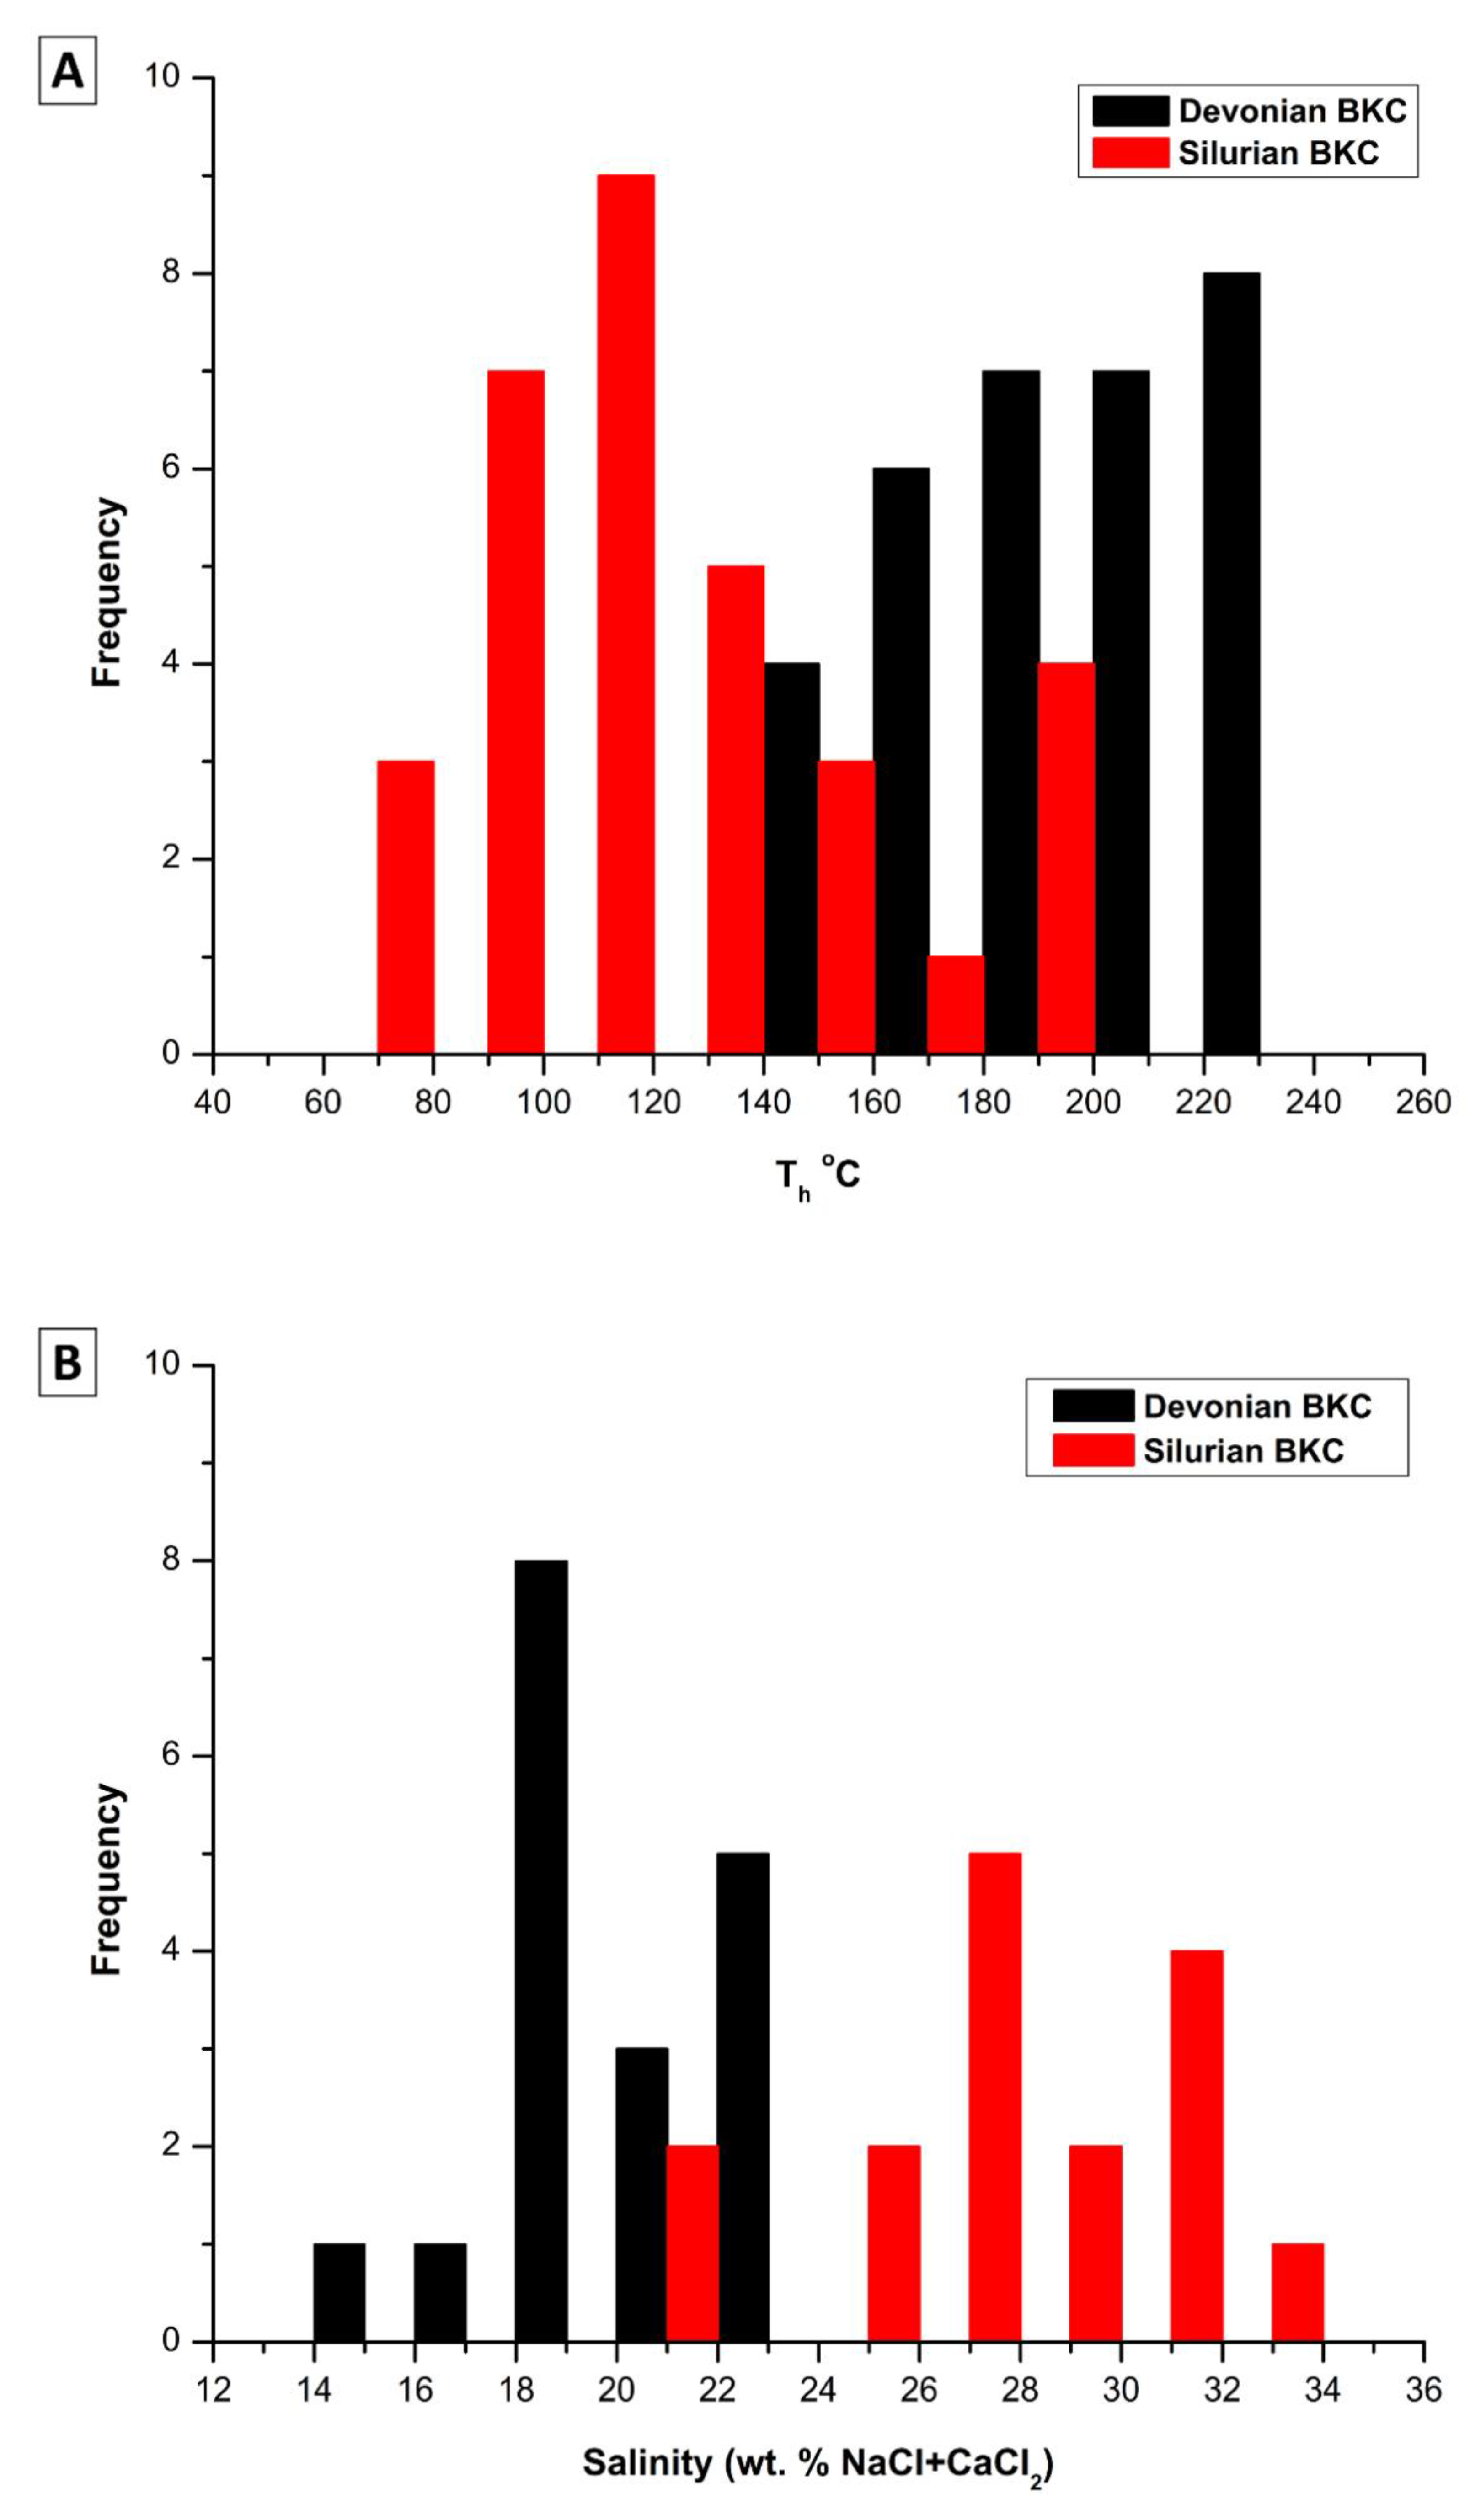
4.3.3. Fluid Inclusions Microthermometry
4.3.4. Major, Minor and Trace Elements Analysis
Major Elements and Dolomite Stoichiometry
Minor and Trace Elements: Iron, Manganese and Strontium
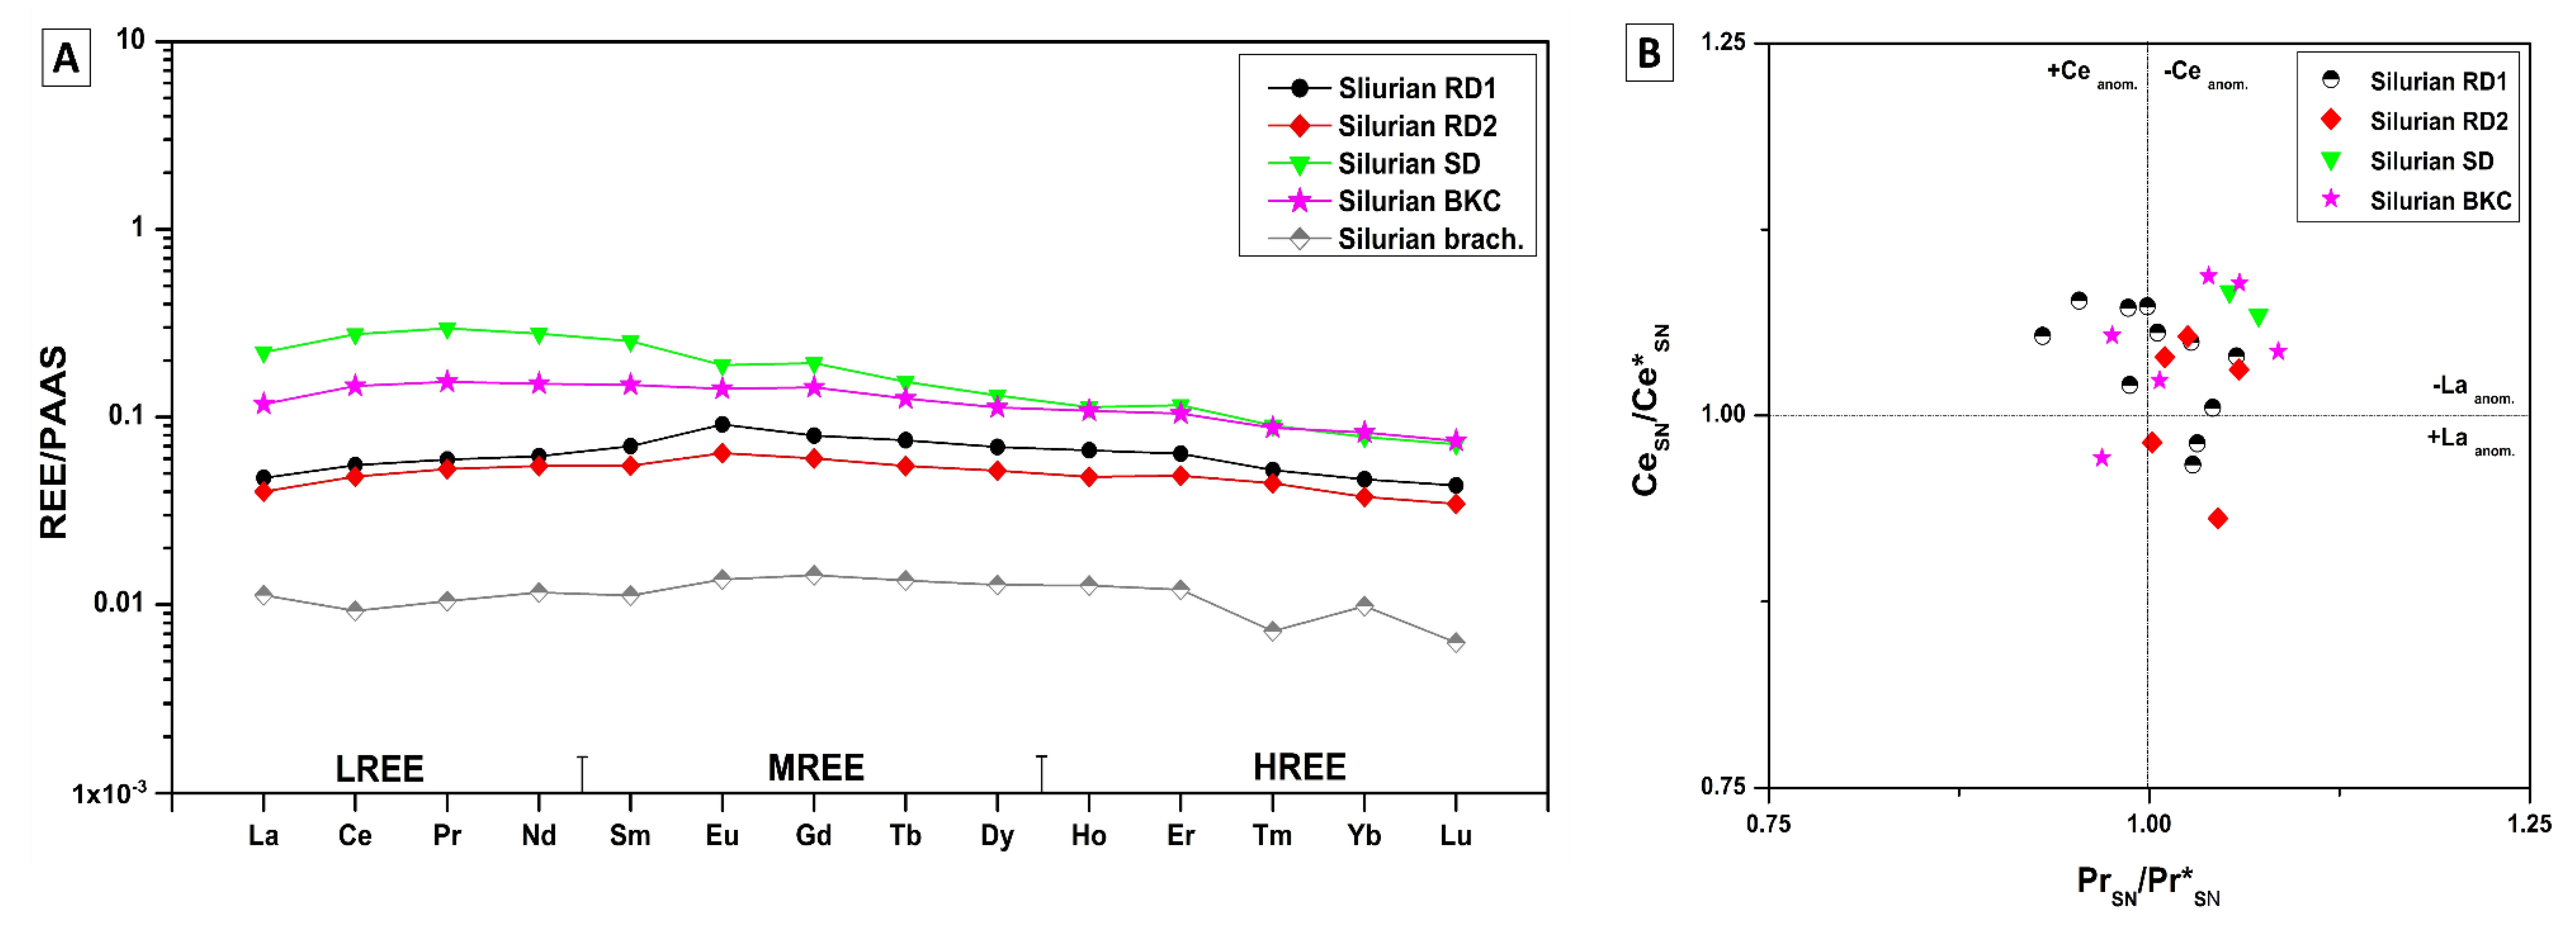
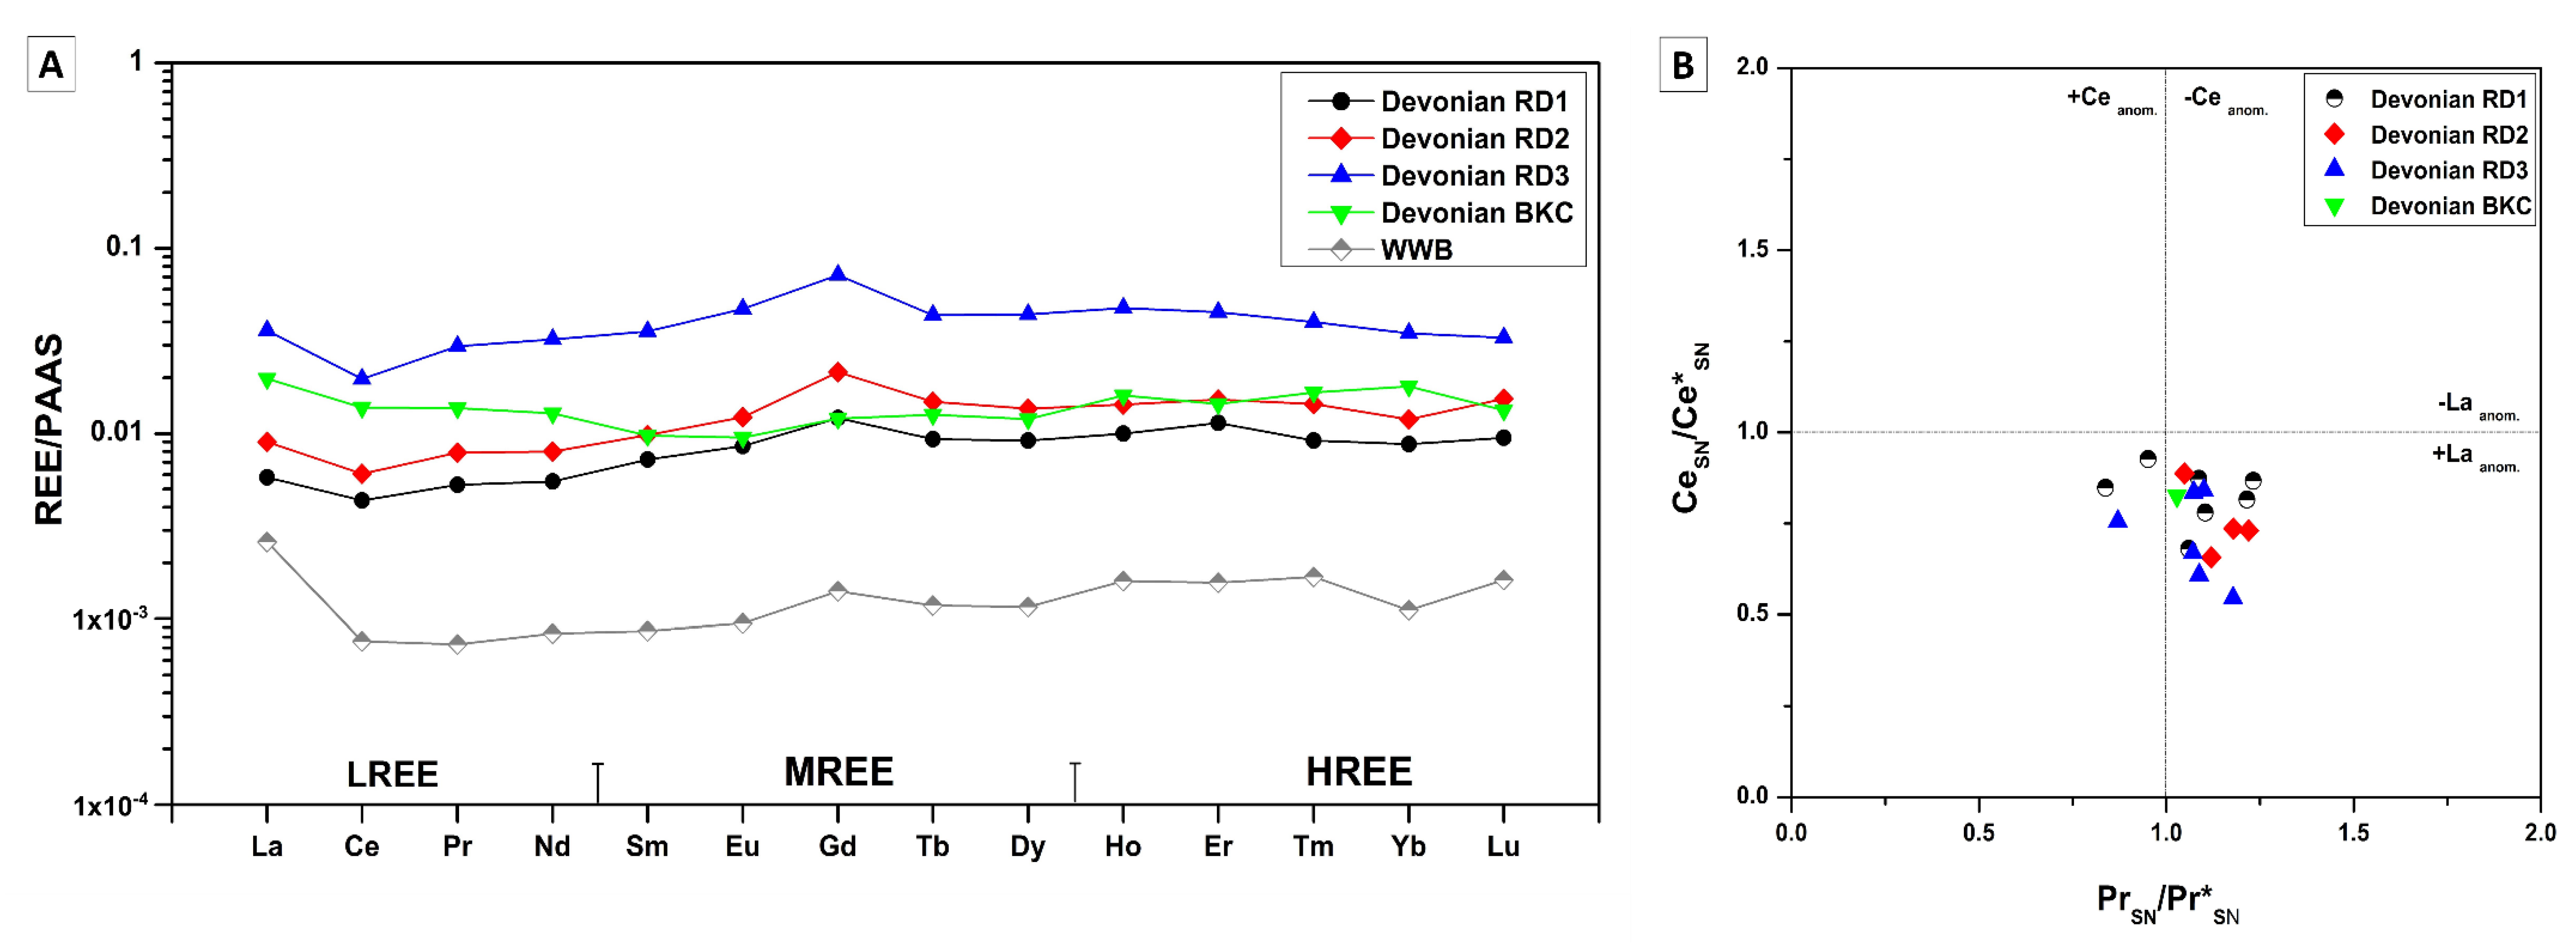
4.3.5. Rare Earth Elements (REE)
5. Discussion and Interpretations
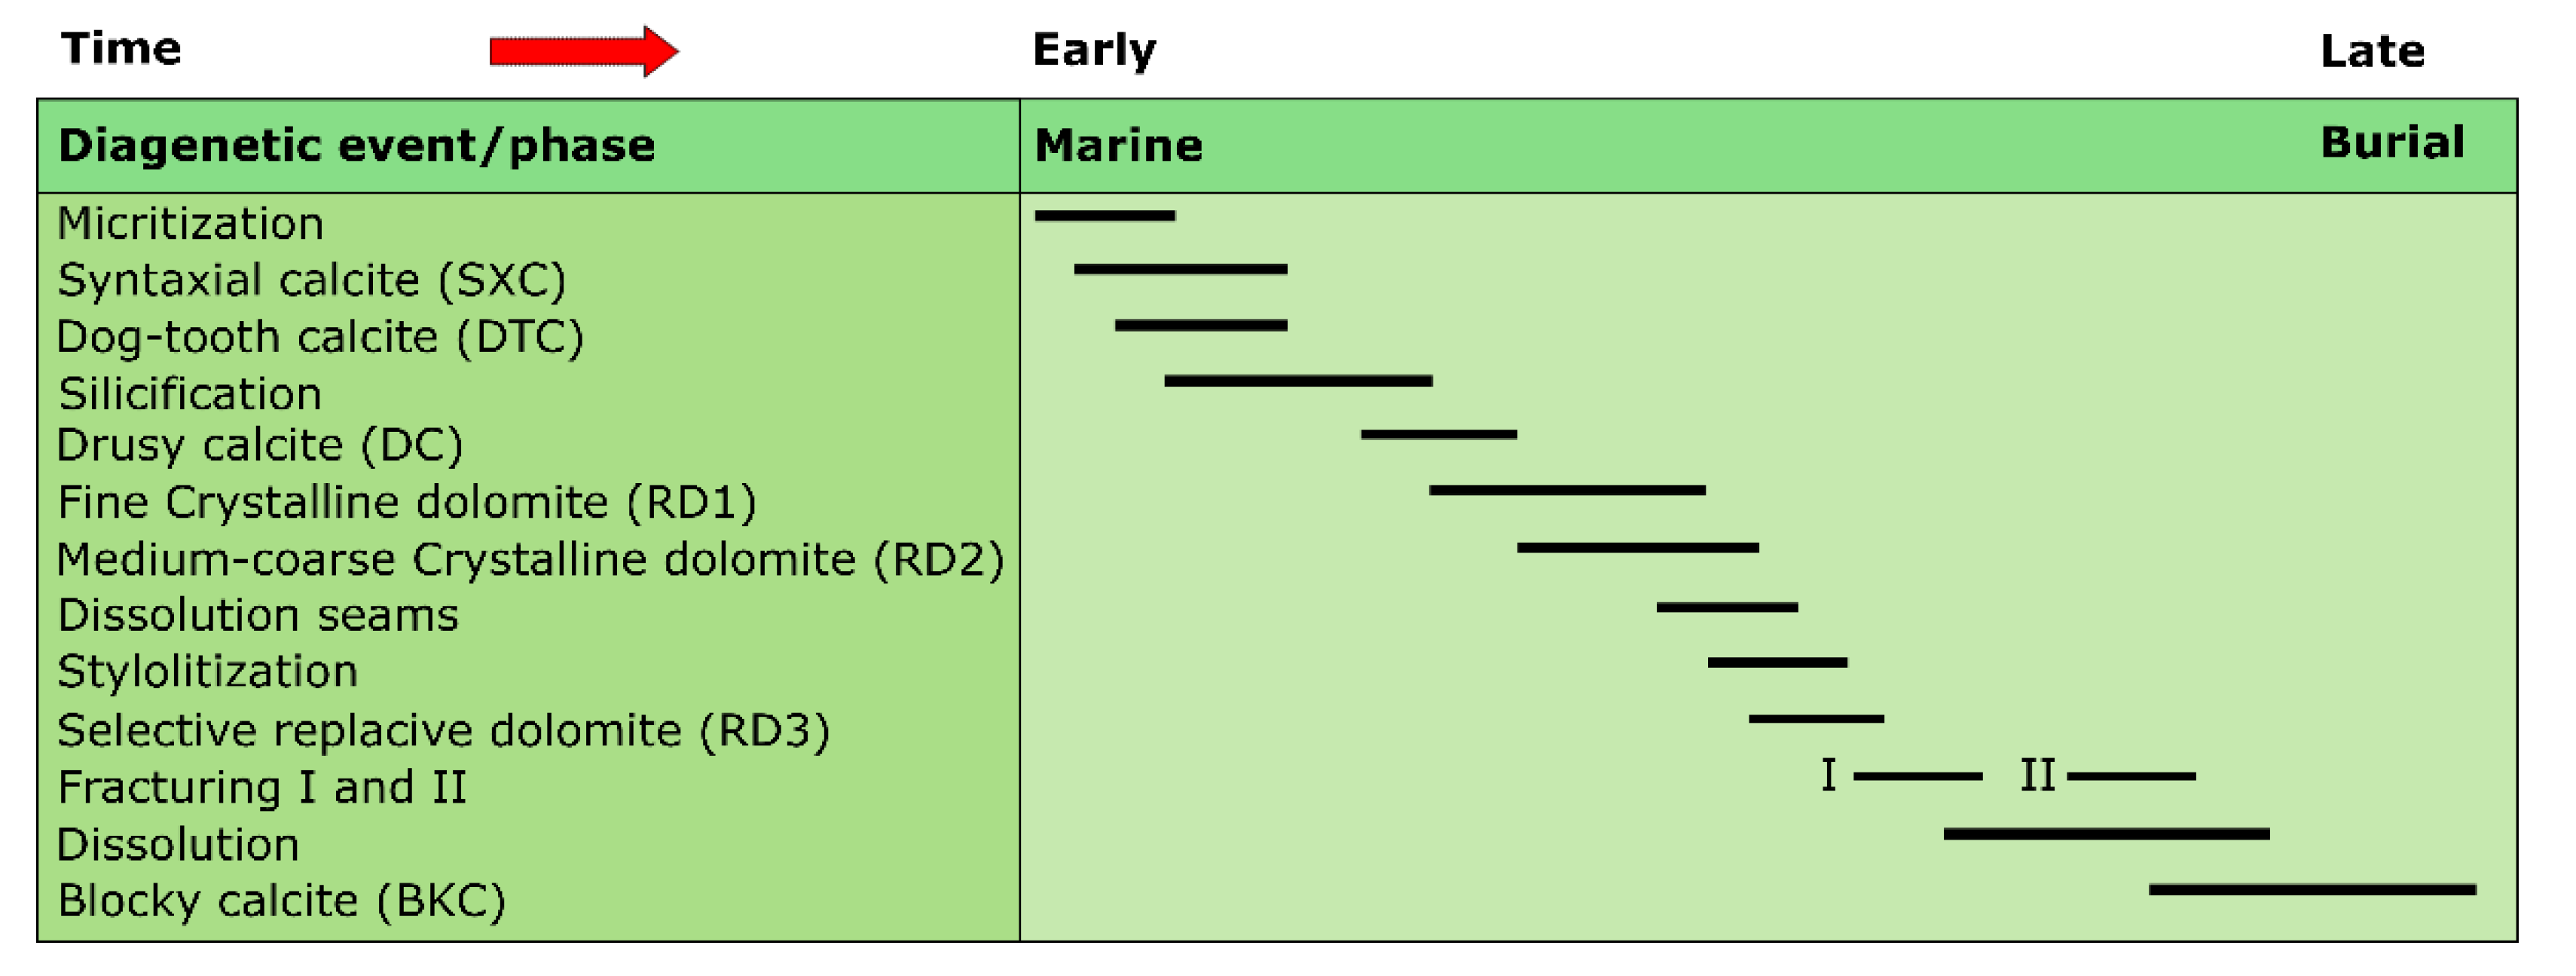
5.1. Constraints from Petrography
5.1.1. Silurian
Dolomitization
Calcite Cementation
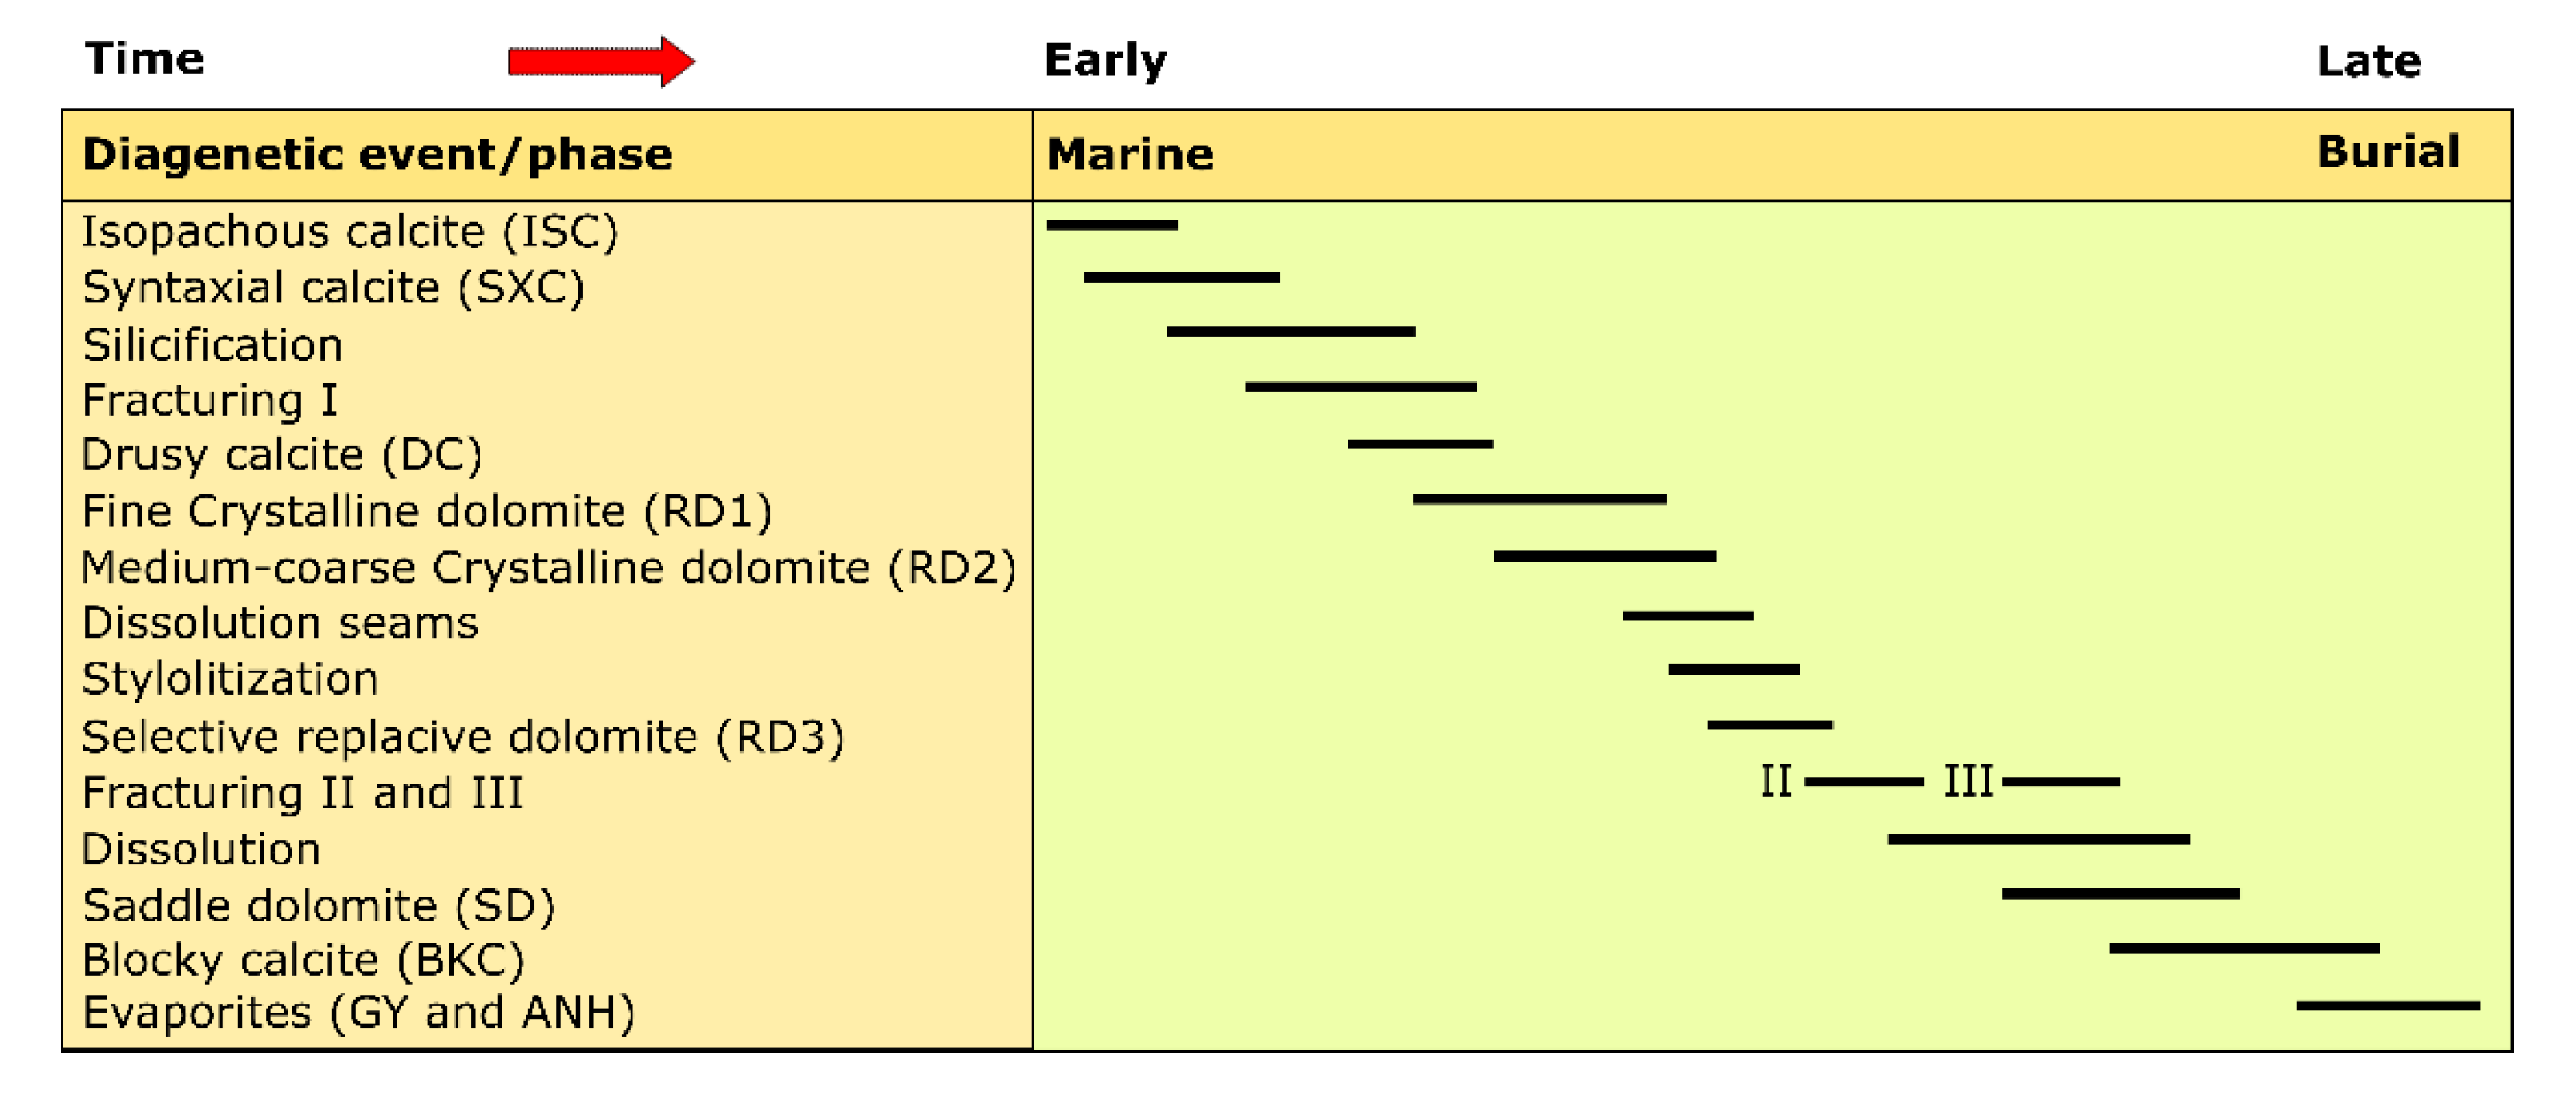
5.1.2. Devonian
Dolomitization
Calcite Cementation
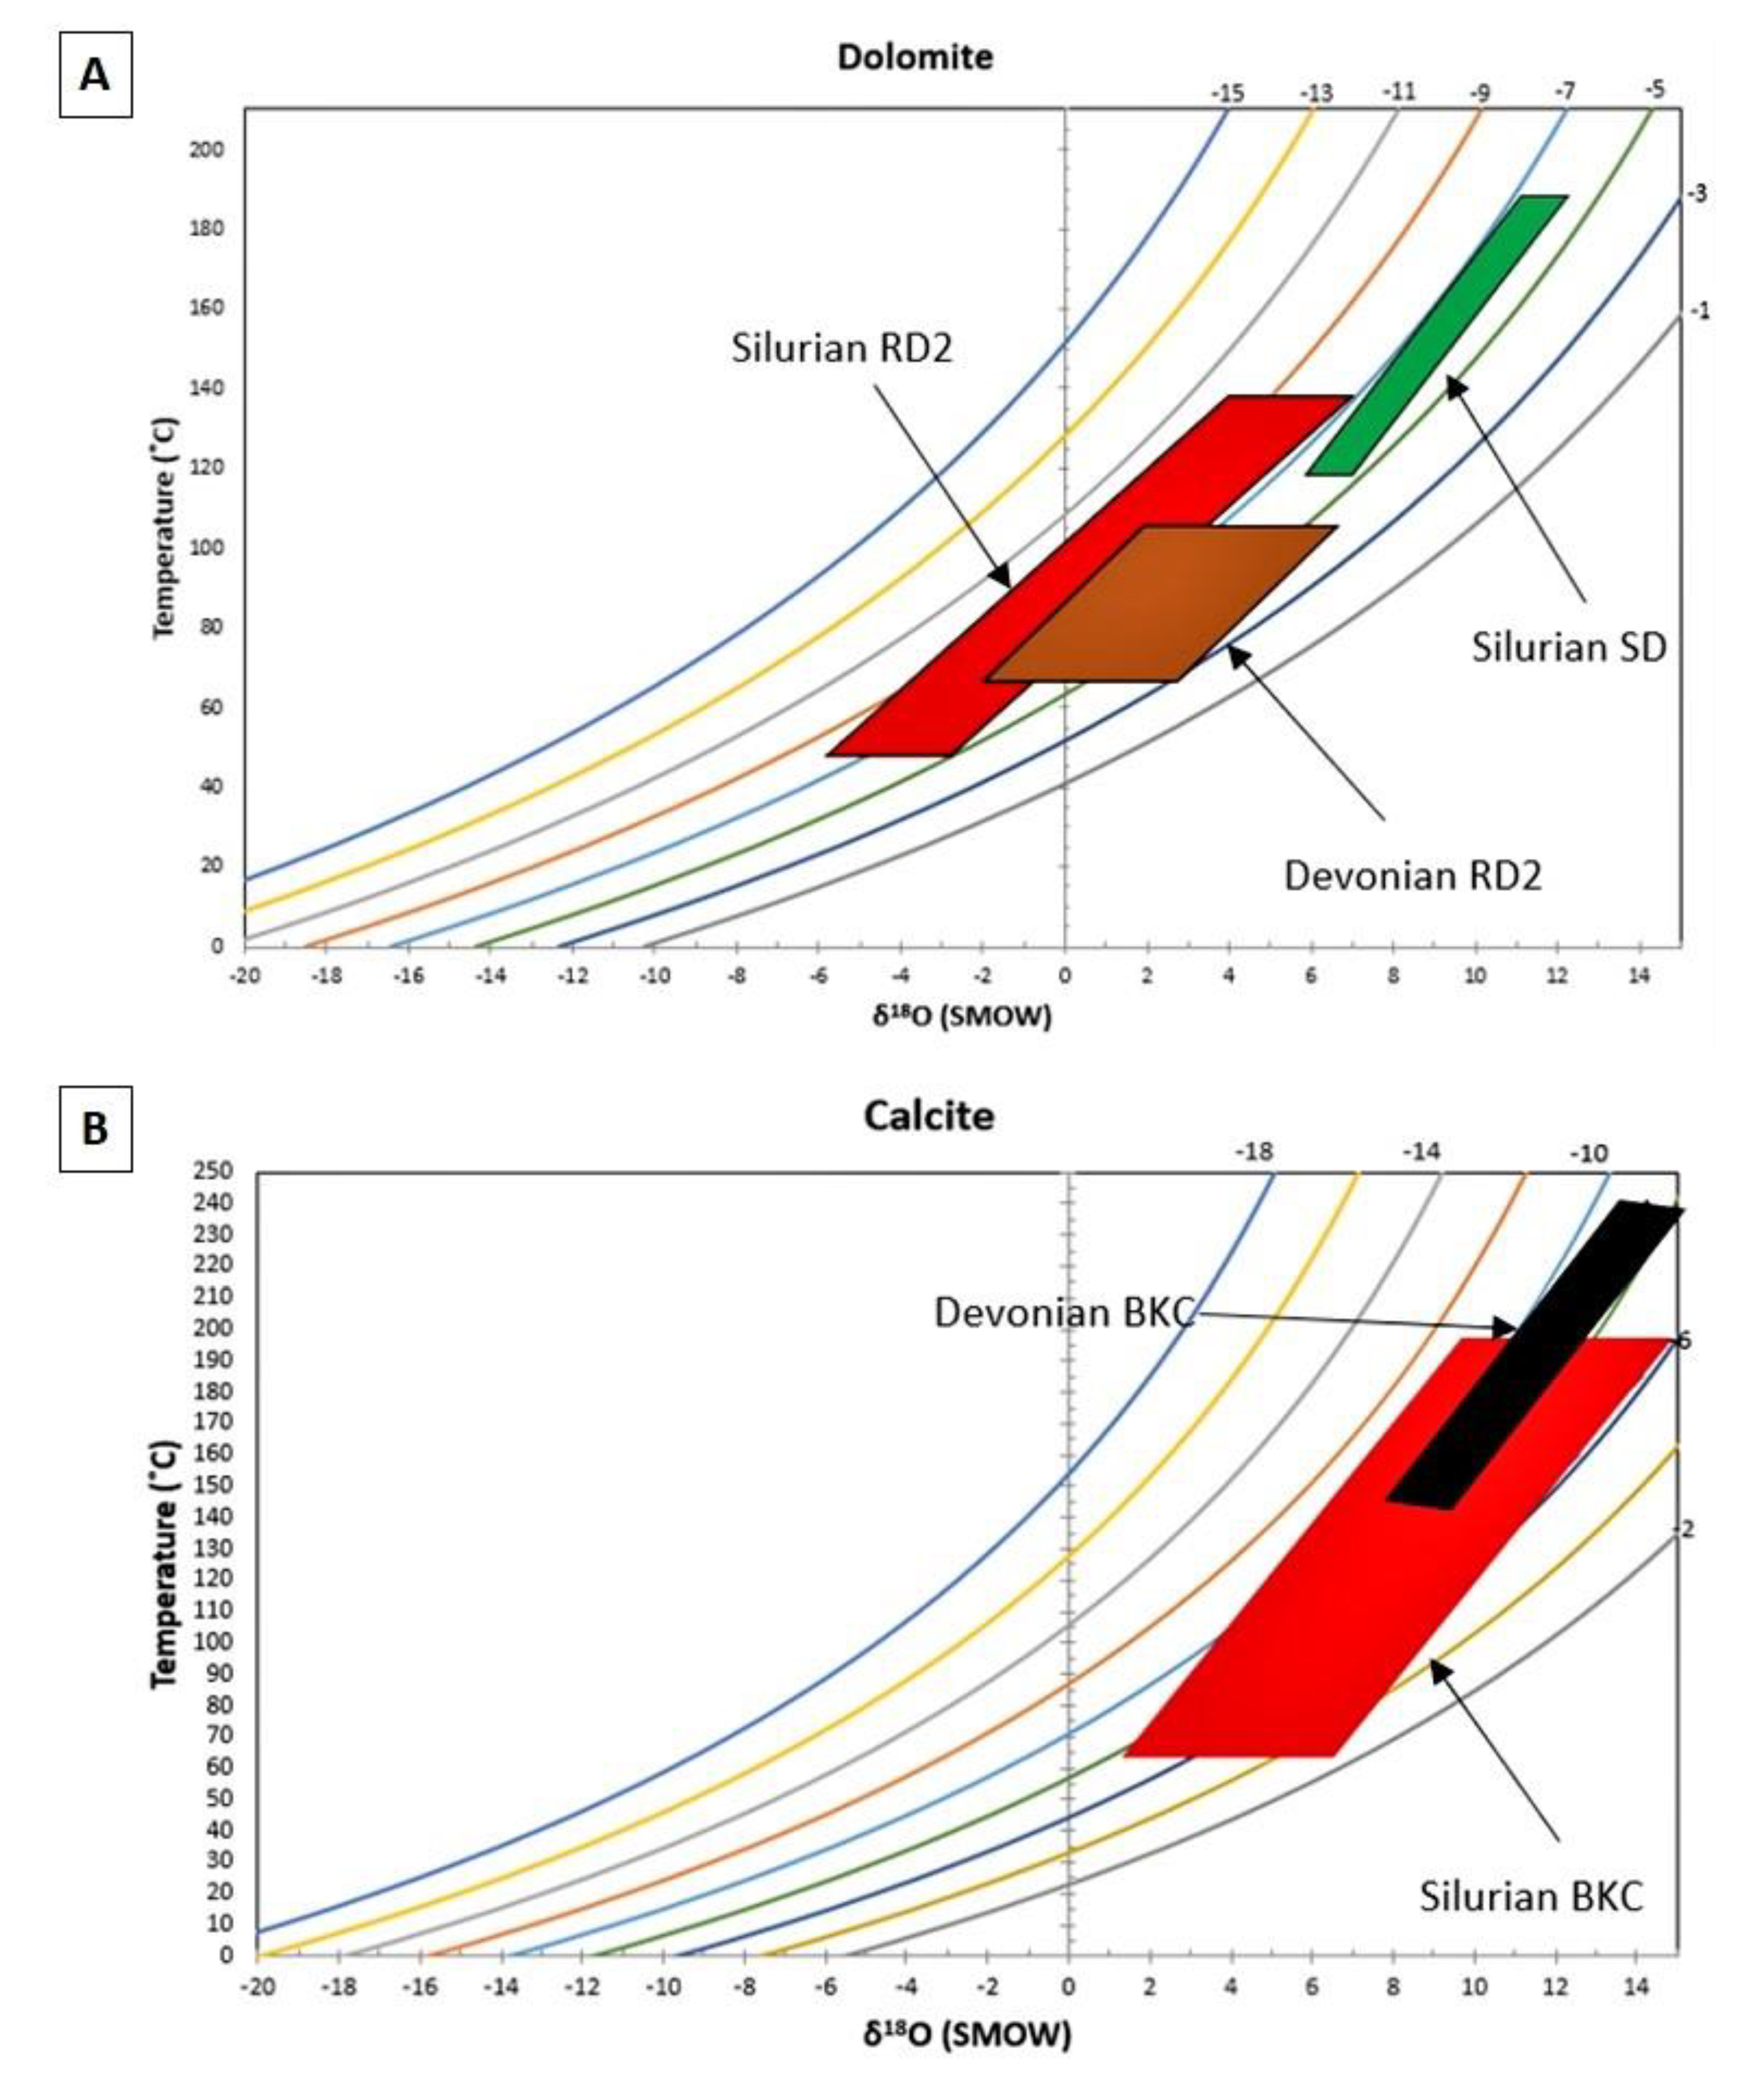
5.2. Constraints from Stable O, C and Radiogenic Sr Isotopes
5.2.1. Silurian
5.2.2. Devonian
5.3. Constraints from Fluid Inclusions
5.4. Constraints from Geochemistry
5.4.1. Stoichiometry
5.4.2. Trace Elements: Iron, Manganese and Strontium
5.4.3. Rare Earth Elements (REE)
Silurian
Devonian
5.5. Evolution of Diagenetic Fluids
6. Conclusions
- Silurian and Devonian formations are characterized by the presence of three types of replacive dolomite matrix RD1 (formed in shallow burial conditions), RD2 and RD3 (formed in intermediate burial conditions). In addition to these types, a coarse crystalline ferroan saddle dolomite cement (formed in intermediate burial conditions) filling fractures and vugs is observed only in the Silurian rocks. Early- and late-stage calcite cement have been distinguished in both groups of formations including isopachous, syntaxial overgrowth, dogtooth, drusy and blocky calcite.
- Isotopic data show an overlap between δ13C and δ18O values in Silurian and Devonian dolomites. In both Devonian and Silurian, many samples δ13C values fall in the range of values estimated for the marine dolomite of equivalent age. The negative shift in δ18O values, however, show evidence of dolomite recrystallization during burial and increasing temperature. Several other lines of evidence for recrystallization have been observed such as increasing crystal size, zonation, etched surfaces between cores and rims of crystals, and an increase in radiogenic strontium ratios.
- Silurian and Devonian Sr isotopic ratios show the seawater composition of their respective age as the primary source of diagenetic fluids with minor rock-water interactions. However, Silurian samples show a more radiogenic signature that documents more intense interactions of water with feldspar-bearing rocks
- REE shale-normalized patterns suggest that in both age groups the diagenetic fluids were originally of coeval seawater composition subsequently modified via water-rock interaction. The different evolution of the diagenetic fluids is more prominent in REESN patterns from Silurian samples and it is possibly related to brines, which were modified by the dissolution of Silurian evaporites from the Salina series.
- Homogenization temperatures characterizing fluid inclusions hosted in RD2 from the Devonian samples, and RD2 and saddle dolomite in the Silurian successions exceed the temperature estimated for maximum burial. Hence, it may suggest the involvement of hydrothermal fluids during their formation.
- The potential source of heat could be related to the reactivation of the buried mid-continental rift (MCR), whereas the preferential path for the migration of diagenetic fluids from the central part of the Michigan Basin towards the margins via faults and fractures can be attributed to the Cambrian sandstones unconformably overlying the Precambrian basement that could have behaved as regional aquifers.
- Geochemical and fluid inclusion investigations denote two distinct fluid systems related to the diagenetic and tectonic history of Michigan Basin.
Author Contributions
Funding
Acknowledgments
Conflicts of Interest
References
- Cercone, K.R.; Lohmann, K.C. Late burial diagenesis of Niagaran (Middle Silurian) pinnacle reefs in Michigan Basin. Am. Assoc. Geol. Bull. 1987, 71, 156–166. [Google Scholar]
- Hamilton, G.D. Styles of reservoir development in middle Devonian carbonates of southwestern Ontario. In Diagenetic History of Ordovician and Devonian Oil and Gas Reservoirs in Southwestern Ontario; Open File Report 5822; Coniglio, M., Frape, S.K., Eds.; Ontario Geological Survey: Sudbury, ON, Canada, 1991. [Google Scholar]
- Hamilton, D.G.; Coniglio, M. Reservoir development in the middle Devonian of southwestern Ontario. In Proceedings of the Ontario Petroleum Institute Thirty-First Annual Conference, Niagara Falls, ON, Canada, 28–30 October 1992; Technical Paper No. 9. Volume 32, p. 20. [Google Scholar]
- Coniglio, M.; Sherlock, R.; Williams-Jones, A.E.; Middleton, K.; Frape, S.K. Burial and hydrothermal diagenesis of Ordovician carbonates from the Michigan Basin, Ontario, Canada. Int. Assoc. Sedimentol. 1994, 21, 231–254. [Google Scholar]
- Haeri-Ardakani, O.; Al-Aasm, I.S.; Coniglio, M. Fracture mineralization and fluid flow evolution: An example from Ordovician-Devonian carbonates, southwestern Ontario, Canada. Geofluids 2013, 13, 1–20. [Google Scholar] [CrossRef]
- Cercone, K.R. Evaporative sea-level drawdown in the Silurian Michigan Basin. Geology 1988, 16, 109–130. [Google Scholar] [CrossRef]
- Zheng, Q. Carbonate Diagenesis and Porosity Evolution in the Guelph Formation, Southwestern Ontario. Ph.D. Thesis, University of Waterloo, Waterloo, ON, Canada, 1999. [Google Scholar]
- Coniglio, M.; Zheng, Q.; Carter, T.R. Dolomitization and recrystallization of middle Silurian reefs and platformal carbonates of the Guelph formation, Michigan basin, Southwestern Ontario. Bull. Can. Pet. Geol. 2003, 51, 177–199. [Google Scholar] [CrossRef]
- Coniglio, M.; William-Jones, A.E. Diagenesis of Ordovician carbonates from the northeast Michigan Basin, Manitoulin island area, Ontario: Evidence from petrography, stable isotopes and fluid inclusions. Sedimentology 1992, 39, 813–836. [Google Scholar] [CrossRef]
- Sanford, B.V.; Thompson, F.J.; McFall, G.H. Plate tectonics—A possible controlling mechanism in the development of hydrocarbon traps in southwestern Ontario. Bull. Can. Pet. Geol. 1985, 33, 52–71. [Google Scholar]
- Carter, T.R.; Trevail, R.A.; Easton, R.M. Basement controls on some hydrocarbon traps in southern Ontario, Canada. In Basement and Basins of Eastern North America; Van der Pluijm, B.A., Catacosinos, P.A., Eds.; Geological Society of America: Boulder, CO, USA, 1996; Volume 308, pp. 95–107. [Google Scholar]
- Boyce, J.J.; Morris, W.A. Basement-controlled faulting of Paleozoic strata in southern Ontario, Canada: New evidence from geophysical lineament mapping. Tectonophysics 2002, 353, 151–171. [Google Scholar] [CrossRef]
- Luczaj, J.A. Evidence against the Dorag (mixing-zone) model for dolomitization along the Wisconsin arch-A case for hydrothermal diagenesis. Am. Assoc. Pet. Geol. Bull. 2006, 90, 1719–1738. [Google Scholar] [CrossRef]
- Carter, T.R.; Easton, R.M. Extension of Grenville basement beneath southwestern Ontario: lithology and tectonic subdivisions. In Subsurface Geology of Southwestern Ontario: A Core Workshop; Ontario Petroleum Institute: London, ON, Canada, 1990. [Google Scholar]
- Armstrong, D.K.; Carter, T.R. An updated guide to the subsurface Paleozoic stratigraphy of Southern Ontario. Ont. Geol. Surv. 2006, 6191, 214. [Google Scholar]
- Ontario Geological Survey. Bedrock geology of Ontario, southern sheet, Map 2544, scale 1:1 000 000; Ontario Geological Survey: Sudbury, ON, Canada, 1991. [Google Scholar]
- Ontario Power Generation’s (OPG). Deep Geologic Repository for Low and Intermediate Level Waste: Preliminary Safety Report; OPG: Thunder Bay, ON, Canada, 2011; Program Document n 00216-SR-01320-00001. [Google Scholar]
- Johnson, M.D.; Armstrong, D.K.; Sanford, V.V.; Telford, P.G.; Rutka, M.A. Paleozoic and Mesozoic geology of Ontario, in geology of Ontario. Ont. Geol. Surv. 1992, 4, 907–1008. [Google Scholar]
- De Klein, G.V.; Hsui, A.T. Origin of cratonic basins. Geology 1987, 15, 1094–1098. [Google Scholar] [CrossRef]
- Sleep, N.H. Thermal effects of the formation of Atlantic continental margins by continental break up. Geophys. J. R. Astron. Soc. 1971, 24, 325–350. [Google Scholar] [CrossRef]
- Sleep, N.H.; Snell, N.S. Thermal contraction and flexure of mid-continent and Atlantic marginal basins. Geophys. J. R. Astron. Soc. 1976, 45, 125–154. [Google Scholar] [CrossRef]
- Nunn, J.A.; Sleep, N.H.; Moore, W.E. Thermal subsidence and generation of hydrocarbon in Michigan Basin. AAPG Bull. 1984, 68, 296–315. [Google Scholar]
- Howell, P.D.; van der Pluijm, B.A. Early history of the Michigan basin: Subsidence and Appalachian tectonics. Geology 1990, 18, 1195–1198. [Google Scholar] [CrossRef]
- Howell, P.D.; van der Pluijm, B.A. Structural sequences and styles of subsidence in the Michigan basin. Geol. Soc. Am. Bull. 1999, 111, 974–991. [Google Scholar] [CrossRef]
- AECOM. Regional Geology—Southern Ontario; Report for the Nuclear Waste Management Organization NWMO DGR-TR-2011-15 R000; AECOM Canada Ltd.: Calgary, AB, Canada; Itasca Consulting Canada Inc.: Sudbury, ON, Canada, 2011. [Google Scholar]
- Coakley, B.J.; Nadon, C.; Wang, H.F. Spatial variations in tectonic subsidence during Tippecanoe I in the Michigan Basin. Basin Res. 1994, 6, 131–140. [Google Scholar] [CrossRef]
- Coakley, B.; Gurnis, M. Far-field tilting of Laurentia during the Ordovician and constraints on the evolution of a slab under an ancient continent. J. Geophys. Res. Solid Earth 1995, 100, 6313–6327. [Google Scholar] [CrossRef]
- Beaumont, C.; Quinlan, G.; Hamilton, J. Orogeny and stratigraphy: Numerical models of the Paleozoic in the eastern interior of North America. Tectonics 1988, 7, 389–416. [Google Scholar] [CrossRef]
- Bethke, C.M.; Marshak, S. Brine migrations across North America—The plate tectonics of groundwater. Annu. Rev. Earth Planet. Sci. 1990, 18, 287–315. [Google Scholar] [CrossRef]
- Wang, H.F.; Crowley, K.D.; Nadon, G.C. Thermal history of the Michigan basin from apatite fission-track analysis and vitrinite reflectance. In Basin Compartments and Seals; Ortoleva, P.J., Ed.; AAPG Memoir 61; American Association of Petroleum Geologists: Tusla, OK, USA, 1994. [Google Scholar]
- Van der Voo, R. Paleozoic paleogeography of North America, Gondwana, and intervening displaced terranes: Comparison of paleomagnetism with paleoclimatology and biogeographical patterns. Geol. Soc. Am. Bull. 1988, 100, 311–324. [Google Scholar] [CrossRef]
- Sonnenfeld, P.; Al-Aasm, I.S. The Salina evaporites in the Michigan basin. In Early Sedimentary Evolution of the Michigan Basin; Catacosinos, P.A., Daniels, P.A., Jr., Eds.; Geological Society of America: Boulder, CO, USA, 1991; Volume 256, pp. 139–153. [Google Scholar]
- Birchard, M.C.; Rutka, M.A.; Brunton, F.R. Lithofacies and geochemistry of the Lucas Formation in the subsurface of Southwestern Ontario: A high purity limestone and Potential high purity dolostone resource. Ont. Geol. Surv. 2004, 6137, 57. [Google Scholar]
- Armstrong, D.K.; Goodman, W.R. Stratigraphy and Depositional Environments of Niagaran Carbonates, Bruce Peninsula, Ontario; Field Trip No. 4 Guidebook; American Association of Petroleum Geologists, Eastern Section Meeting; Ontario Petroleum Institute: London, ON, Canada, 1990. [Google Scholar]
- Dickson, J.A. Carbonate identification and genesis as revealed by staining. J. Sediment. Res. 1966, 36, 491–505. [Google Scholar]
- Evamy, B.D. The application of a chemical staining technique to a study of dolomitization. J. Int. Assoc. Sedimentol. 1963, 2, 164–170. [Google Scholar] [CrossRef]
- Al-Aasm, I.S.; Taylor, B.E.; South, B. Stable isotope analysis of multiple carbonate samples using selective acid extraction. Chem. Geol. 1990, 80, 119–125. [Google Scholar] [CrossRef]
- Hall, D.L.; Sterner, S.M.; Bodnar, R.J. Freezing point depression of NaCl-KCl-H2O solutions. Econ. Geol. 1988, 83, 197–202. [Google Scholar] [CrossRef]
- Bodnar, R.J. Revised equation and table for freezing point depressions of H2O-salt solutions. Econ. Geol. 1992, 83, 197–202. [Google Scholar]
- Roedder, E. Fluid inclusions. Mineral. Soc. Am. Rev. Mineral. Sediment. Petrol. 1984, 57, 967–975. [Google Scholar]
- Lawler, J.P.; Crawford, M.L. Stretching of fluid inclusions resulting from a low temperature microthermometric technique. Econ. Geol. 1983, 78, 527–529. [Google Scholar] [CrossRef]
- Pourmand, A.; Dauphas, N.; Ireland, T.J. A novel extraction chromatography and MC-ICP-MS technique for rapid analysis of REE, Sc and Y: Revising CI-chondrite and Post-Archean Australian Shale (PAAS) abundances. Chem. Geol. 2012, 291, 38–54. [Google Scholar] [CrossRef]
- Bau, M.; Dulski, P. Distribution of yttrium and rare-earth elements in the Penge and Kuruman iron-formations, Transvaal Supergroup, South Africa. Precambr. Res. 1996, 79, 37–55. [Google Scholar] [CrossRef]
- Kucera, J.; Cempirek, J.; Dolnicek, Z.; Muchez, P.; Prochaska, W. Rare earth elements and yttrium geochemistry of dolomite from post-Variscan vein-type mineralization of the Nizky Jesenik and Upper Silesian Basins, Czech Republic. J. Geochem. Explor. 2009, 103, 69–79. [Google Scholar] [CrossRef]
- Felitsyn, S.; Morad, S. REE patterns in latest Neoproterozoic–early Cambrian phosphate concretions and associated organic matter. Geochem. Geol. 2002, 187, 257–265. [Google Scholar] [CrossRef]
- Tortola, M. Petrographic and Geochemical Attributes of Silurian and Devonian Dolomitized Formations in the Huron Domain, Michigan Basin. Electronic Theses and Dissertation. 2019. Available online: https://scholar.uwindsor.ca/etd/7740 (accessed on 13 September 2019).
- Sibley, D.F.; Gregg, J.M. Classification of dolomite rock textures. J. Sediment. Res. 1987, 57, 967–975. [Google Scholar]
- Middleton, K.; Coniglio, M.; Sherlock, R.; Frape, S.K. Dolomitization of Middle Ordovician carbonate reservoirs, southwestern Ontario. Bull. Can. Pet. Geol. 1993, 41, 150–163. [Google Scholar]
- Hurley, N.F.; Lohmann, K.C. Diagenesis of Devonian reefal carbonates in the Oscar Range, Canning Basin, Western Australia. J. Sediment. Res. 1989, 59, 127–146. [Google Scholar]
- Land, L.S. The origin of massive dolomite. J. Geol. Educ. 1985, 33, 112–125. [Google Scholar] [CrossRef]
- Veizer, J.; Ala, D.; Azmy, K.; Bruckschen, P.; Buhl, D.; Bruhn, F.; Carden, G.A.F.; Diener, A.; Ebneth, S.; Godderis, Y.; et al. 87Sr/86Sr and δ13C and δ18O evolution of Phanerozoic seawater. Chem. Geol. 1999, 161, 59–88. [Google Scholar] [CrossRef]
- Qing, H.; Barnes, C.R.; Buhul, D.; Veizer, J. The strontium isotopic composition of Ordovician and Silurian brachiopods and conodont: Relationships to geological events and implications for coeval seawater. Geochim. Cosmochim. Acta 1998, 62, 1721–1733. [Google Scholar] [CrossRef]
- Boggs, S. Petrology of Sedimentary Rocks; Macmillan Publishing Company: New York, NY, USA, 1992; p. 707. [Google Scholar]
- Azmy, K.; Brand, U.; Sylvester, P.; Gleeson, S.A.; Logan, A.; Bitner, M.A. Biogenic and abiogenic low-Mg calcite (bLMC and aLMC): Evaluation of seawater-REE composition, water masses and carbonate diagenesis. Chem. Geol. 2011, 280, 180–190. [Google Scholar] [CrossRef]
- Gao, G.; Land, L.S. Early ordovician cool creel dolomite, middle Arbuckle group, silick Hills, SW Oklahoma, USA: Origin and modification. J. Sediment. Res. 1991, 61, 161–173. [Google Scholar]
- Haeri-Ardakani, O.; Al-Aasm, I.S.; Coniglio, M. Petrologic and geochemical attributes of fracture-related dolomitization in Ordovician carbonates and their spatial distribution in southwestern Ontario, Canada. Mar. Pet. Geol. 2013, 3, 409–422. [Google Scholar] [CrossRef]
- Gregg, J.M.; Sibley, D.F. Epigenetic dolomitization and the origin of xenotopic dolomite texture. J. Sediment. Res. 1984, 54, 908–931. [Google Scholar]
- Gregg, J.M.; Shelton, K.L. Dolomitization and dolomite Neomorphism in the back-reef facies of the Bonneterre and Davis formations (Cambrian), southwestern Missouri. J. Sediment. Res. 1990, 60, 549–562. [Google Scholar]
- Hiatt, E.E.; Pufahl, P.K. Cathodoluminescence petrography of carbonate rocks: Application to understanding diagenesis, reservoir quality, and pore system evolution. In Cathodoluminescence and Its Application to Geoscience; Short Course Series; Coulson, I.M., Ed.; Mineralogical Association of Canada: Québec, QC, Canada, 2014; Volume 45, pp. 75–96. [Google Scholar]
- Dawans, J.M.; Swart, P.K. Textural and geochemical alteration in the late Cenozoic Bahamian dolomites. Sedimentology 1988, 35, 385–403. [Google Scholar] [CrossRef]
- Land, L.S. Dolomitization of the Hope Gate Formation (north Jamaica) by seawater: Reassessment of mixing-zone dolomite. In Stable Isotope Geochemistry: A Tribute to Samuel; Geochem. Society: San Antonio, TX, USA, 1991. [Google Scholar]
- Kupecz, J.A.; Land, L.S. Progressive recrystallization and stabilization of early-stage dolomite: Lower Ordovician Ellenburger Group, west Texas. In Dolomites. A Volume in Honor of Dolomieu; Purser, B., Tucker, M., Zenger, D., Eds.; International Association of Sedimentologists: Gent, Belgium, 1994; Volume 21, pp. 155–166. [Google Scholar]
- Sibley, D.F.; Gregg, G.M.; Brown, R.G.; Laudon, P.R. Dolomite crystal size distribution. In Carbonate Microfabrics, Frontiers in Sedimentology; Rezak, R., Lavoie, D.L., Eds.; Springer: New York, NY, USA, 1993; pp. 195–204. [Google Scholar]
- Machel, H.G. Concepts and models of dolomitization: A critical reappraisal. In The Geometry and Petrogenesis of Dolomite Hydrocarbon Reservoirs; Braithwaite, C.J.R., Rizzi, G., Drake, G., Eds.; Geological Society Special Publication: London, UK, 2004; Volume 245, pp. 7–63. [Google Scholar]
- Montanez, I.P.; Read, J.F. Fluid-rock interaction history during stabilization of early dolomites, Upper Knox Group (Lower Ordovician), U.S. Appalachian. J. Sediment. Res. 1992, 62, 753–778. [Google Scholar]
- Machel, H.G. Recrystallization versus neomorphism, and the concept of “significant recrystallization” in dolomite research. Sediment. Geol. 1997, 113, 161–168. [Google Scholar] [CrossRef]
- American Geological Institute (AGI). Glossary of Geology; AGI: Alexandria, VA, USA, 1987; p. 788. [Google Scholar]
- Mazzullo, S.J. Geochemical and neomorphic alteration of dolomite: A review. Carbonate Evaporites 1992, 7, 21–37. [Google Scholar] [CrossRef]
- Al-Aasm, I.S. Chemical and isotopic constraints for recrystallization of sedimentary dolomites from the Western Canada Sedimentary basin. Aquat. Geochem. 2000, 6, 229–250. [Google Scholar] [CrossRef]
- Al-Aasm, I.S.; Packard, J.J. Stabilization of early-formed dolomite: A tale of divergence from two Mississippian dolomites. Sediment. Geol. 2000, 131, 97–108. [Google Scholar] [CrossRef]
- Adam, J.; Al-Aasm, I.S. Petrologic and geochemical attributes of calcite cementation, dolomitization and dolomite recrystallization: An example from the Mississippian Pekisko Formation, west-central Alberta. Bull. Can. Pet. Geol. 2017, 65, 235–261. [Google Scholar] [CrossRef]
- Al-Aasm, I.S.; Lu, F. Multistage dolomitization of the Mississippian turner valley formation, quirk Creek field, alberta: Chemical and petrologic evidence. Can. Soc. Pet. Geol. 1994, 17, 657–675. [Google Scholar]
- Qing, H.; Mountjoy, E.W. Rare element geochemistry of dolomite in the Middle Devonian Presqu’ile barrier, Western Canada Sedimentary Basin: Implication fluid-rock ratios during dolomitization. Sedimentology 1994, 41, 787–804. [Google Scholar] [CrossRef]
- Walker, K.R.; Jernigan, D.G.; Weber, L.J. Petrographic criteria for the recognition of marine, syntaxial overgrowths, and their distribution in geologic time. Carbonates Evaporites 1990, 5, 141–161. [Google Scholar] [CrossRef]
- Choquette, P.W.; James, N.P. Diagenesis in limestones. The deep burial environment. Geosci. Can. 1987, 14, 3–35. [Google Scholar]
- Flügel, E. Microfacies of Carbonate Rocks, Analysis, Interpretation and Application; Springer: Berlin, Germany, 2010; p. 976. [Google Scholar]
- Al-Aasm, I.S.; Crowe, R. Fluid compartmentalization and dolomitization in the Cambrian and Ordovician successions of the Huron Domain, Michigan Basin. Mar. Pet. Geol. 2018, 92, 160–178. [Google Scholar] [CrossRef]
- Reinhold, C. Dog-tooth cements; indicators of different diagenetic environments. Zbl. Geol. Paläont. 1999, 10, 1221–1235. [Google Scholar]
- Land, L.S. The isotopic and trace element geochemistry of dolomite: The state of the art. In Concepts and Models of Dolomitization; Zenger, D.H., Dunham, J.B., Ethington, R.L., Eds.; SEPM Special Publication: Broken Arrow, UK, USA, 1980; Volume 28, pp. 87–110. [Google Scholar]
- Allan, J.R.; Wiggins, W.D. Dolomite Reservoirs: Geochemical Techniques for Evaluating Origin and Distribution; Continuing Education Course Note Series #36; American Association of Petroleum Geologists: Tulsa, OK, USA, 1993. [Google Scholar]
- Al-Aasm, I.S. Origin and characterization of hydrothermal dolomite in the Western Canada Sedimentary Basin: Jour. Geochem. Explor. 2003, 78–79, 9–15. [Google Scholar] [CrossRef]
- Land, L.S. The application of stable isotopes to studies of the origin of dolomite and to problems of diagenesis of clastic sediments. In Stable Isotopes in Sedimentary Geology; Society of Economic Paleontologists and Mineralogists: New York, NY, USA, 1983; p. 129. [Google Scholar]
- Azmy, K.; Veizer, J.; Bassett, M.G.; Copper, P. Oxygen and carbon isotopic composition of Silurian brachiopods: Implications for coeval seawater and glaciations. Geol. Soc. Am. Bull. 1998, 110, 1499–1512. [Google Scholar] [CrossRef]
- Baldermann, A.; Deditius, A.P.; Dietzel, M.; Fichtner, V.; Fischer, C.; Hippler, D.A.; Leis, A.; Baldermann, C.; Mavromatis, V.; Stickler, C.P.; et al. The role of bacterial sulfate reduction during dolomite precipitation: Implications from Upper Jurassic platform carbonates. Chem. Geol. 2015, 412, 1–14. [Google Scholar] [CrossRef]
- Warren, J. Dolomite: Occurrence, evolution and economically important associations. Earth Sci. Rev. 2000, 1–3, 1–81. [Google Scholar] [CrossRef]
- Dorobek, S.L.; Smith, T.M.; Whitsit, P.M. Microfabrics and geochemistry of meteorically altered dolomite in Devonian and Mississippian carbonates, Montana and Idaho. In Carbonate Microfabrics; Rezak, R., Lavoie, D.L., Eds.; Springer: Berlin, Germany, 1993; Volume 16, pp. 205–224. [Google Scholar]
- Durocher, S.; Al-Aasm, I.S. Dolomitization and neomorphism of Mississippian (Visean) upper Debolt Formation, Blueberry Field, NE British Columbia, Canada: Geologic, petrologic and chemical evidence. Am. Assoc. Pet. Geol. Bull. 1997, 81, 954–977. [Google Scholar]
- Geldern, R.A.; Joachimski, M.M.; Day, J.; Jansen, U.; Alvarez, F.; Yolkin, E.A.; Ma, X.P. Carbon, oxygen and strontium isotope records of Devonian brachiopod shell calcite. Palaeogeogr. Palaeoclimatol. Palaeoecol. 2006, 240, 47–67. [Google Scholar] [CrossRef]
- Worthington, S.R.H. Karst Assessment; NWMO DGR-TR-2011-22; Canadian Nuclear Safety Commission: Toronto, ON, Canada, 2011.
- Barnes, D.A.; Parris, T.M.; Grammer, G.M. Hydrothermal Dolomitization of Fluid Reservoirs in the Michigan Basin, USA; Search and Discovery Article #50087; AAPG/Datapages, Inc.: San Antonio, TX, USA, 2008. [Google Scholar]
- Legall, F.D.; Barnes, C.R.; Macqueen, R.W. Thermal maturation, burial history and hotspot development, Paleozoic strata of southern Ontario-Quebec, from conodont and acritach color alteration index. Bull. Can. Pet. Geol. 1981, 29, 492–539. [Google Scholar]
- Sibley, D.F. Unstable to stable transformations during dolomitization. J. Geol. 1990, 98, 967–975. [Google Scholar] [CrossRef]
- Gregg, J.M.; Howard, S.A.; Mazzullo, S.J. Early diagenetic recrystallization of Holocene (<3000 years old) peritidal dolomites, Ambergris Cay, Belize. Sedimentology 1992, 39, 143–160. [Google Scholar] [CrossRef]
- White, T.; Al-Aasm, I.S. Hydrothermal dolomitization of the Mississippian Upper Debolt Formation, Sikanni gas field, northeastern British Columbia, Canada. Bull. Can. Pet. Geol. 1997, 45, 297–316. [Google Scholar]
- Malone, M.J.; Baker, P.A.; Burns, S.J. Recrystallization of dolomite: An experimental study from 50–200 °C. Geochim. Cosmochim. Acta 1996, 60, 2189–2207. [Google Scholar] [CrossRef]
- Swart, P.K. The geochemistry of carbonate diagenesis: The past, present and future. Int. Assoc. Sedimentol. 2015, 62, 1233–1304. [Google Scholar] [CrossRef]
- Veizer, J. Chemical diagenesis of carbonates: Theory and application of trace element technique. In Stable Isotopes in Sedimentary Petrology; Arthur, M.A., Anderson, T.F., Kaplan, I.R., Veizer, J., Land, L.S., Eds.; Society of Economic Paleontologists and Mineralogists: New York, NY, USA, 1983; Volume 10, pp. 3–100. [Google Scholar]
- Gao, G. Geochemical and isotopic constraints on the diagenetic history of a massive, late Cambrian (Royer) dolomite, Lower Arbukle Group, Silick Hills, SW Oklahoma, USA. Geochim. Cosmochim. Acta 1990, 54, 1979–1989. [Google Scholar] [CrossRef]
- Frank, J.R. Dolomitization in the Taum Sauk Limestone (Upper Cambrian), southeast Missouri. J. Sediment. Res. 1981, 51, 7–18. [Google Scholar]
- Lorens, R.B.; Mn, S.C. Distribution coefficients in calcite as a function of calcite precipitation rate. Geochim. Cosmochim. Acta 1981, 45, 553–561. [Google Scholar] [CrossRef]
- Machel, H.G.; Anderson, J.H. Pervasive subsurface dolomitization of the Nisku Formation in central Alberta. J. Sediment. Res. 1989, 59, 891–911. [Google Scholar]
- Banner, J.L. Application of the trace element and isotope geochemistry of strontium to studies of carbonate diagenesis. Sedimentology 1995, 42, 805–824. [Google Scholar] [CrossRef]
- Dunham, J.B.; Olson, E.R. Shallow subsurface dolomitizaion of subtidally deposited carbonate sediments in the Hanson Creek Formation (Ordovician-Silurian) of Central Nevada. In Concepts and Models of Dolomitization; Zenger, D.H., Dunham, J.B., Ethington, R.L., Eds.; Society of Economic Paleontologists and Mineralogists: New York, NY, USA, 1980; Volume 28, pp. 139–161. [Google Scholar]
- Webb, G.E.; Nothdurft, L.D.; Kamber, B.S.; Kloprogge, J.T.; Zhao, J.X. Rare earth element geochemistry of scleractinian coral skeleton during meteoric diagenesis: A before and-after sequence through neomorphism of aragonite to calcite. Sedimentology 2009, 56, 1433–1463. [Google Scholar] [CrossRef]
- Allwood, A.C.; Kamber, B.S.; Walter, M.R.; Burch, I.W.; Kanik, I. Trace elements record depositional history of an Early Archean stromatolitic carbonate platform. Chem. Geol. 2010, 270, 148–163. [Google Scholar] [CrossRef]
- Banner, J.L.; Hanson, G.N.; Meyers, W.J. Rare earth element and Nd isotopic variations in regionally extensive dolomites from the Burlington-keokuk formation (Mississippian): Implications for REE mobility during carbonate diagenesis. J. Sediment. Res. 1988, 58, 415–432. [Google Scholar]
- Frimmel, H.E. Trace element distribution in Neoproterozoic carbonates as palaeoenvironmental indicator. Chem. Geol. 2009, 258, 338–353. [Google Scholar] [CrossRef]
- Zhao, Y.; Zheng, Y.F.; Chen, F. Trace element and strontium isotope constraints on sedimentary environment of Ediacaran carbonates in southern Anhui, South China. Chem. Geol. 2009, 265, 345–362. [Google Scholar] [CrossRef]
- Chaudhuri, S.; Clauer, N. (Eds.) Isotopic Signatures and Sedimentary Records; Lecture Notes in Earth Sciences; Springer: Berlin, Germany, 1992; Volume 43, pp. 497–529. [Google Scholar]
- Murray, R.W.; Buchholtz ten Brink, M.R.; Gerlach, D.C.; Russ, P.G., III; Jones, D.L. Interoceanic variation in the rare earth, major, and trace element depositional chemistry of chert: Perspectives gained from the DSDP and ODP record. Geochim. Cosmochim. Acta 1992, 56, 1897–1913. [Google Scholar] [CrossRef]
- Madhavaraju, J.; Ramasamy, S. Rare earth elements in limestones of Kallankurichchi formation of Ariyalur Group, Tiruchirapalli Cretaceous, Tamil Nadu. J. Geol. Soc. India 1999, 54, 291–301. [Google Scholar]
- De Baar, H.J.W. On cerium anomalies in the Sargasso Sea. Geochim. Cosmochim. Acta 1991, 55, 2981–2983. [Google Scholar] [CrossRef]
- Nothdurft, L.D.; Webb, G.E.; Kamber, B.S. Rare earth element geochemistry of Late Devonian reefal carbonates, Canning Basin, Western Australia: Confirmation of a seawater REE proxy in ancient limestones. Geochim. Cosmochim. Acta 2004, 68, 263–283. [Google Scholar] [CrossRef]
- Tostevin, R.; Shields, G.A.; Tarbuck, G.M.; He, T.; Clarkson, M.O.; Wood, R.A. Effective use of cerium anomalies as a redox proxy in carbonate-dominated marine settings. Chem. Geol. 2016, 438, 146–162. [Google Scholar] [CrossRef]
- Vugrinovich, R. Shale compaction in the Michigan Basin: Estimates of former depth of burial and implications for paleogeothermal gradients. Bull. Can. Pet. Geol. 1988, 36, 1–8. [Google Scholar]
- Cercone, K.R.; Pollack, H.N. Thermal maturity of the Michigan Basin. In Early Sedimentary Evolution of the Michigan Basin; Catacosinos, P., Daniels, P., Eds.; Geological Society of America: Boulder, CO, USA, 1991; Special Paper 256; pp. 1–11. [Google Scholar]
- Friedman, I.; O’Neil, J.R. Compilation of stable isotope fractionation factors of geochemical interest. In Data of Geochemistry, 6th ed.; Chapter, K.K., Ed.; U.S. Government Printing Office: Washington, DC, USA, 1977. [Google Scholar]
- Graven, G. Continental-scale groundwater flow and geological processes. Annu. Rev. Earth Planet. Sci. 1995, 23, 89–118. [Google Scholar] [CrossRef]
- Bjorlykke, K. Fluid-flow processes and diagenesis in sedimentary basins. In Geofluids: Origin, Migration and Evolution of Fluids in Sedimentary Basins; Parnell, J., Ed.; Geological Society: London, UK, 1994; Volume 87, pp. 127–140. [Google Scholar]
- Girard, J.P.; Barnes, D.A. Illitization and paleothermal regimes in the middle Ordovician St. Peter sandstone, central Michigan Basin: K–Ar, oxygen isotope, and fluid inclusion data. Am. Assoc. Pet. Geol. Bull. 1995, 79, 49–69. [Google Scholar]
- Ma, L.; Castro, M.C.; Hall, C.M. Atmospheric noble gas signatures in deep Michigan Basin brines as indicators of a past thermal event. Earth Planet. Sci. Lett. 2009, 277, 137–147. [Google Scholar] [CrossRef]
- Sutcliffe, C.N.; Thibodeau, A.M.; Davis, D.W.; Al-Aasm, I.S.; Parmenter, A.; Zajacz, Z.; Jensen, M. Hydrochronology of a proposed deep geological repository for Low and Intermediate nuclear waste in southern Ontario from U-Pb dating of secondary minerals: Response to Alleghanian events. Can. J. Earth Sci. 2019. [Google Scholar] [CrossRef]


| Cored Sample | Sample Code | Formation | Age | Depth (m) |
|---|---|---|---|---|
| DGR1-CR1 | 1-1 | Lucas | Devonian | 23.5 |
| DGR1-CR2-(1) | 1-2 | Lucas | Devonian | 26.25 |
| DGR1-CR2-(2) | 1-3 | Lucas | Devonian | 26.95 |
| DGR1-CR2-(3) | 1-4 | Lucas | Devonian | 27.75 |
| DGR1-CR3-(1) | 1-5 | Amherstburg | Devonian | 31.35 |
| DGR1-CR3-(2) | 1-6 | Amherstburg | Devonian | 31.85 |
| DGR1-CR5 | 1-7 | Amherstburg | Devonian | 35.95 |
| DGR1-CR8 | 1-8 | Amherstburg | Devonian | 42.58 |
| DGR1-CR9 | 1-9 | Amherstburg | Devonian | 46.4 |
| DGR1-CR10-(1) | 1-10 | Amherstburg | Devonian | 48.65 |
| DGR1-CR10-(2) | 1-11 | Amherstburg | Devonian | 49.7 |
| DGR1-CR11 | 1-12 | Amherstburg | Devonian | 51 |
| DGR1-CR30-(1) | 1-13 | Bois Blanc | Devonian | 104.05 |
| DGR1-CR30-(2) | 1-14 | Bois Blanc | Devonian | 105.08 |
| DGR1-CR41 | 1-15 | Bass Island | Silurian | 128.93 |
| DGR1-CR44 | 1-16 | Bass Island | Silurian | 133.03 |
| DGR1-CR49 | 1-17 | Bass Island | Silurian | 142.28 |
| DGR1-CR65 | 1-18 | Salina—G-Unit | Silurian | 176.13 |
| DGR1-CR66 | 1-19 | Salina—G-Unit | Silurian | 178 |
| DGR1-CR84 | 1-20 | Salina—E-Unit | Silurian | 229.32 |
| DGR1-CR104 | 1-21 | Salina—B-Unit (Carbonate) | Silurian | 289.85 |
| DGR1-CR105 | 1-22 | Salina—A2-Unit (Carbonate) | Silurian | 294.14 |
| DGR1-CR116-(1) | 1-23 | Salina—A1-Unit (Carbonate) | Silurian | 326.92 |
| DGR1-CR116-(2) | 1-24 | Salina—A1-Unit (Carbonate) | Silurian | 328.17 |
| DGR1-CR117 | 1-25 | Salina—A1-Unit (Carbonate) | Silurian | 329.97 |
| DGR1-CR118 | 1-26 | Salina—A1-Unit (Carbonate) | Silurian | 333.48 |
| DGR1-CR119 | 1-27 | Salina—A1-Unit (Carbonate) | Silurian | 337.32 |
| DGR1-CR121 | 1-28 | Salina—A1-Unit (Carbonate) | Silurian | 342.27 |
| DGR1-CR122 | 1-29 | Salina—A1-Unit (Carbonate) | Silurian | 344.42 |
| DGR1-CR130 | 1-30 | Salina—A0-Unit | Silurian | 371.27 |
| DGR1-CR133 | 1-31 | Guelph | Silurian | 378.1 |
| DGR1-CR143 | 1-32 | Fossil Hill | Silurian | 410.1 |
| DGR1-CR154 | 1-33 | Manitoulin | Silurian | 440.92 |
| DGR8-CR10 | 8-1 | Lucas | Devonian | 22.71 |
| DGR8-CR17 | 8-2 | Lucas | Devonian | 43.46 |
| DGR8-CR18 | 8-3 | Amherstburg | Devonian | 48.61 |
| DGR8-CR22 | 8-4 | Amherstburg | Devonian | 59.06 |
| DGR8-CR64 | 8-5 | Salina—G-Unit | Silurian | 182.06 |
| DGR8-CR90 | 8-6 | Salina—E-Unit | Silurian | 238.91 |
| DGR8-CR100 | 8-7 | Salina—C-Unit | Silurian | 265.46 |
| DGR8-CR110 | 8-8 | Salina—B-Unit (Carbonate) | Silurian | 295.91 |
| DGR8-CR116 | 8-9 | Salina—A2-Unit (Carbonate) | Silurian | 313.31 |
| DGR8-CR122 | 8-10 | Salina—A1-Unit (Carbonate) | Silurian | 332.26 |
| DGR8-CR137 | 8-11 | Salina—A0-Unit | Silurian | 377.21 |
| DGR8-CR137 | 8-12 | Salina—A0-Unit | Silurian | 378.75 |
| DGR8-CR139 | 8-13 | Guelph | Silurian | 382.4 |
| Age | Mineral | Description | Texture | Size | Luminescence | Ferroan/Non-Ferroan |
|---|---|---|---|---|---|---|
| Silurian | RD1 | Pervasive replacive micro to fine crystalline dolomite matrix | Non-planar to planar-s | <50 μm | Dully red/bright | Non-ferroan |
| Silurian | RD2 | Pervasive replacive medium crystalline dolomite matrix | Planar-e/planar-s | >50 μm up to 150 μm | Dully red/non-luminescent | Non-ferroan |
| Silurian | RD3 | Selective replacive medium crystalline dolomite matrix (commonly associated with dissolution seams) | Planar-e | >50 μm up to 150 μm | Dull/red | Non-ferroan |
| Silurian | SD | Coarse crystalline saddle dolomite cement filling fractures and vugs | Curved crystal faces and cleavage planes and undulose extinction | >500 μm | Dull/non-luminescent | Ferroan |
| Silurian | ISC | Isopachous calcite cement characterized by cement rims growing around coated grains | bladed | 50–100 μm | Dully red | Non-ferroan |
| Silurian | SXC | Syntaxial calcite overgrowth cement usually around echinoderm fragments | - | 100 μm to >500 μm | Bright red | Ferroan |
| Silurian | DC | Void-filling and pore-lining cement in intergranular and intraskeletal pores, molds and fractures | Equant to elongate, anhedral to subhedral | 75–250 μm Size increase towards the center | Dull red | Ferroan |
| Silurian | BKC | Blocky calcite cement consisting of coarse-grained crystals without a preferred orientation mainly filling fractures and voids | - | 200 μm to >500 μm | Red/bright orange zoned | Non-ferroan/ferroan |
| Devonian | RD1 | Pervasive replacive micro to fine crystalline dolomite matrix | Non-planar to planar-s | <50 μm | Dull/red | Non-ferroan |
| Devonian | RD2 | Pervasive replacive medium crystalline dolomite matrix | Planar-e/ planar-s | >50 μm up to 100 μm | Dull/non-luminescent | Non-ferroan |
| Devonian | RD3 | Selective replacive medium crystalline dolomite matrix (commonly associated with dissolution seams) | Planar-e | >50 μm up to 100 μm | Red/bright | Non-ferroan |
| Devonian | SXC | Syntaxial calcite overgrowth cement usually around echinoderm fragments | - | 100 μm to >500 μm | Non-luminescent | Non-ferroan |
| Devonian | DTC | Dogtooth calcite cement characterized by sharply pointed acute crystals growing normal to the substrate (mainly skeletal grains) | Elongate scalenohedral or rhombohedral | 50 μm | Red/bright mostly zoned | Non-ferroan |
| Devonian | DC | Void-filling and pore-lining cement in intergranular and intraskeletal pores, molds and fractures | Equant to elongate, anhedral to subhedral | 75–250 μm Size increase towards the center | Dull red to bright, zoned in most cases | Non-ferroan |
| Devonian | BKC | Blocky calcite cement consisting of coarse-grained crystals without a preferred orientation mainly filling fractures and voids | - | 200 μm to >500 μm | Red/bright zoned | Non-ferroan |
| Sample ID | Age | Phase | δ13CVPDB (‰) | δ18OVPDB (‰) | 87Sr/86Sr |
|---|---|---|---|---|---|
| 1-15a | Silurian | RD1 | −0.47 | −4.46 | |
| 1-16a | Silurian | RD1 | −0.27 | −5.35 | |
| 1-17a | Silurian | RD1 | 1.86 | −4.49 | 0.708705 |
| 1-18a | Silurian | RD1 | −2.73 | −7.65 | 0.708877 |
| 1-20a | Silurian | RD1 | −0.59 | −7.06 | |
| 1-21a | Silurian | RD1 | 0.22 | −6.44 | |
| 1-31a | Silurian | RD1 | 3.78 | −7.15 | |
| 8-6a | Silurian | RD1 | −1.4 | −7.36 | 0.708919 |
| 8-5a | Silurian | RD1 | −0.63 | −6.99 | |
| 8-8a | Silurian | RD1 | −1.16 | −6.16 | |
| 8-9a | Silurian | RD1 | −0.19 | −6.22 | |
| 8-13a | Silurian | RD1 | 3.72 | −7.83 | |
| 1-16b | Silurian | RD2 | −0.32 | −3.85 | |
| 1-24a | Silurian | RD2 | 1.51 | −6.79 | 0.708469 |
| 1-23b | Silurian | RD2 | 1.44 | −7.25 | |
| 1-31b | Silurian | RD2 | 3.58 | −7.96 | 0.708587 |
| 8-11a | Silurian | RD2 | 3.18 | −5.42 | |
| 8-10b | Silurian | RD2 | 1.82 | −7.23 | |
| 8-13b | Silurian | RD2 | 3.84 | −7.86 | |
| 1-30a | Silurian | RD3 | 4.02 | −7.53 | 0.708905 |
| 1-33b | Silurian | RD3 | 0.65 | −5.91 | |
| 8-12 | Silurian | RD3 | 3.31 | −7.41 | 0.708743 |
| 1-31c | Silurian | SD | 3.69 | −7.72 | 0.708648 |
| 8-13c | Silurian | SD | 0.10 | −9.65 | |
| 1-28a | Silurian | SD | 1.27 | −6.13 | 0.708516 |
| 1-24b | Silurian | MC | 1.32 | −5.55 | |
| 1-27b | Silurian | MC | 0.14 | −8.16 | |
| 1-30b | Silurian | MC | 3.53 | −8.09 | |
| 1-33c | Silurian | MC | 0.21 | −4.73 | |
| 8-11b | Silurian | MC | 2.89 | −5.35 | |
| 1-23a | Silurian | ISC | 1.37 | −6.76 | |
| 8-10a | Silurian | ISC | 1.27 | −7.77 | |
| 1-32 | Silurian | SXC | 0.12 | −4.81 | |
| 1-33a | Silurian | SXC | −0.21 | −5.54 | |
| 1-17b | Silurian | DC | −0.88 | −8.85 | 0.708154 |
| 1-25 | Silurian | BKC | 0.02 | −4.54 | |
| 1-26a | Silurian | BKC | 0.00 | −6.78 | |
| 1-27a | Silurian | BKC | 0.03 | −7.52 | 0.708383 |
| 1-28b | Silurian | BKC | 0.06 | −7.51 | |
| 1-31d | Silurian | BKC | 3.17 | −6.41 | |
| 8-5b | Silurian | BKC | −3.75 | −9.19 | 0.708054 |
| 8-9c | Silurian | BKC | −1.06 | −10.19 | |
| 8-13d | Silurian | BKC | 3.10 | −8.09 | |
| 8-9d | Silurian | GY | - | - | 0.708486 |
| 1-29a | Silurian | GY | - | - | 0.708434 |
| 1-1a | Devonian | RD1 | 2.65 | −6.03 | 0.708103 |
| 1-1b | Devonian | RD1 | 2.17 | −6.22 | |
| 1-3-1a | Devonian | RD1 | 3.23 | −5.72 | |
| 1-5a | Devonian | RD1 | 4.02 | −6.14 | |
| 1-5b | Devonian | RD1 | 4.28 | −6.11 | |
| 1-7a | Devonian | RD1 | 3.71 | −5.88 | |
| 8-1a | Devonian | RD1 | 2.01 | −4.46 | 0.707884 |
| 8-4a | Devonian | RD1 | 2.33 | −7.01 | |
| 1-3-2b | Devonian | RD2 | 3.32 | −4.75 | 0.708089 |
| 1-4a | Devonian | RD2 | 3.93 | −5.94 | |
| 1-7b | Devonian | RD2 | 3.48 | −5.74 | |
| 1-14a | Devonian | RD2 | 0.99 | −6.47 | |
| 8-4b | Devonian | RD2 | 2.03 | −7.66 | 0.708920 |
| 1-2a | Devonian | RD3 | 3.47 | −5.67 | |
| 1-3-2c | Devonian | RD3 | 3.62 | −3.91 | |
| 1-6a | Devonian | RD3 | 4.63 | −5.97 | 0.708146 |
| 1-10a | Devonian | RD3 | 2.60 | −5.31 | |
| 1-13b | Devonian | RD3 | 1.09 | −5.04 | |
| 8-2a | Devonian | RD3 | 3.81 | −5.41 | |
| 8-3a | Devonian | RD3 | 2.99 | −5.00 | |
| 8-4c | Devonian | RD3 | 2.45 | −6.20 | 0.708509 |
| 1-2b | Devonian | MC | 2.52 | −5.87 | |
| 1-4b | Devonian | MC | 2.81 | −5.77 | |
| 1-6b | Devonian | MC | 4.12 | −4.53 | |
| 1-8b | Devonian | MC | 1.92 | −6.47 | |
| 8-2b | Devonian | MC | 2.83 | −6.59 | |
| 8-3b | Devonian | MC | 1.99 | −6.51 | |
| 1-11a | Devonian | SXC | 0.97 | −4.44 | |
| 1-12a | Devonian | SXC | 1.55 | −4.42 | |
| 1-13a | Devonian | DC | −0.59 | −6.22 | 0.708051 |
| 1-14b | Devonian | DC | −1.15 | −6.49 | |
| 1-2c | Devonian | BKC | −1.55 | −8.01 | |
| 8-1b | Devonian | BKC | −2.40 | −8.61 | 0.707982 |
| Sample | Age | Host Mineral | Occurrence | Size (µm) | Th (°C) | Tmice (°C) | Salinity |
|---|---|---|---|---|---|---|---|
| 1-31-1 | Silurian | RD2 | Cluster | 2 | 54.2 | ||
| 1-31-2 | Silurian | RD2 | Cluster | 3 | 55.1 | ||
| 1-31-3 | Silurian | RD2 | Cluster | 1 | 57.5 | ||
| 1-31-4 | Silurian | RD2 | Cluster | 7 | 100.4 | −20.3 | 22.58 |
| 1-31-5 | Silurian | RD2 | Cluster | 1 | 49.7 | ||
| 1-31-6 | Silurian | RD2 | Cluster | 6 | 118.9 | −22.3 | 23.89 |
| 1-31-7 | Silurian | RD2 | Cluster | 5 | 92.6 | −24.4 | 25.21 |
| 1-31-8 | Silurian | RD2 | Cluster | 5 | 97.5 | −21.4 | 23.31 |
| 1-31-9 | Silurian | RD2 | Cluster | 4 | 88.9 | ||
| 1-31-10 | Silurian | RD2 | Isolated | 5 | 85.9 | −19.5 | 22.03 |
| 1-31-11 | Silurian | RD2 | Isolated | 2 | 71.4 | ||
| 1-31-12 | Silurian | RD2 | Isolated | 10 | 134.1 | −23.6 | 24.71 |
| 1-31-13 | Silurian | RD2 | Crystal growth | 2 | 91.5 | ||
| 1-31-14 | Silurian | RD2 | Crystal growth | 1 | 92.8 | ||
| 1-31-15 | Silurian | RD2 | Crystal growth | 1 | 93.6 | ||
| 1-31-16 | Silurian | RD2 | Crystal growth | 1 | 84.7 | ||
| 1-31-17 | Silurian | RD2 | Crystal growth | 1 | 89.6 | ||
| 1-31-18 | Silurian | RD2 | Crystal growth | 4 | 97.1 | −21.2 | 23.18 |
| 1-31-19 | Silurian | RD2 | Crystal growth | 2 | 96.4 | ||
| 1-31-20 | Silurian | RD2 | Crystal growth | 1 | 99.8 | ||
| 1-31-21 | Silurian | RD2 | Crystal growth | 6 | 97.3 | −20.2 | 22.51 |
| 8-13-31 | Silurian | RD2 | Crystal growth | 3 | 111.4 | −19.9 | 22.31 |
| 1-31-22 | Silurian | BKC | Isolated | 6 | 159.9 | ||
| 1-31-23 | Silurian | BKC | Isolated | 5 | 184.7 | −25.3 | 25.76 |
| 8-13-1 | Silurian | BKC | Short trail | 7 | 119.3 | −32.7 | 30.42 |
| 8-13-2 | Silurian | BKC | Short trail | 8 | 118.1 | −33.5 | 30.97 |
| 8-13-3 | Silurian | BKC | Short trail | 6 | 109.3 | −29.4 | 28.28 |
| 8-13-4 | Silurian | BKC | Cluster | 4 | 106.4 | ||
| 8-13-5 | Silurian | BKC | Cluster | 4 | 145.4 | ||
| 8-13-6 | Silurian | BKC | Cluster | 2 | 79.4 | ||
| 8-13-7 | Silurian | BKC | Cluster | 2 | 95.7 | ||
| 8-13-8 | Silurian | BKC | Cluster | 3 | 130.1 | ||
| 8-13-9 | Silurian | BKC | Cluster | 2 | 149.7 | ||
| 8-13-10 | Silurian | BKC | Cluster | 2 | 172.3 | ||
| 8-13-11 | Silurian | BKC | Isolated | 10 | 115.9 | −31.8 | 29.82 |
| 8-13-12 | Silurian | BKC | Crystal growth | 13 | 81.8 | −28.7 | 27.85 |
| 8-13-13 | Silurian | BKC | Crystal growth | 18 | 96.2 | −32.6 | 30.35 |
| 8-13-14 | Silurian | BKC | Crystal growth | 15 | 93.3 | −28.2 | 27.54 |
| 8-13-15 | Silurian | BKC | Crystal growth | 6 | 89.4 | ||
| 8-13-16 | Silurian | BKC | Crystal growth | 5 | 81.6 | ||
| 8-13-17 | Silurian | BKC | Isolated | 8 | 73.4 | −26.9 | 26.74 |
| 8-13-18 | Silurian | BKC | Isolated | 6 | 84.7 | −27.1 | 26.86 |
| 8-13-19 | Silurian | BKC | Isolated | 2 | 104.7 | ||
| 8-13-20 | Silurian | BKC | Isolated | 3 | 103.5 | ||
| 8-13-21 | Silurian | BKC | Isolated | 2 | 122.6 | ||
| 8-13-22 | Silurian | BKC | Crystal growth | 10 | 113.8 | −35.4 | 32.33 |
| 1-28-6 | Silurian | BKC | Isolated | 12 | 115.2 | −33.1 | 30.69 |
| 1-28-7 | Silurian | BKC | Cluster | 3 | 123.3 | ||
| 1-28-8 | Silurian | BKC | Cluster | 4 | 189 | −18.6 | 21.40 |
| 1-28-9 | Silurian | BKC | Cluster | 4 | 139.7 | −19.1 | 21.75 |
| 1-28-10 | Silurian | BKC | Isolated | 6 | 182.8 | ||
| 1-28-11 | Silurian | BKC | Isolated | 6 | 194.3 | ||
| 1-28-12 | Silurian | BKC | Isolated | 4 | 124.7 | −22.8 | 24.21 |
| 1-28-13 | Silurian | BKC | Isolated | 10 | 70.2 | −25.9 | 26.13 |
| 8-13-19 | Silurian | SD | Crystal growth | 5 | 122.6 | ||
| 8-13-20 | Silurian | SD | Crystal growth | 5 | 123.4 | ||
| 8-13-21 | Silurian | SD | Crystal growth | 3 | 142.7 | ||
| 8-13-22 | Silurian | SD | Crystal growth | 4 | 193.4 | ||
| 8-13-23 | Silurian | SD | Scattered | 5 | 121.8 | −35.8 | 32.63 |
| 8-13-24 | Silurian | SD | Scattered | 6 | 125.9 | −33.2 | 30.76 |
| 8-13-25 | Silurian | SD | Scattered | 2 | 117.16 | ||
| 8-13-26 | Silurian | SD | Scattered | 3 | 145.1 | ||
| 8-13-27 | Silurian | SD | Scattered | 2 | 115.5 | ||
| 8-13-28 | Silurian | SD | Scattered | 2 | 118.1 | ||
| 8-13-29 | Silurian | SD | Scattered | 4 | 119.5 | −29.1 | 28.09 |
| 8-13-30 | Silurian | SD | Isolated | 10 | 102.3 | −24.5 | 25.27 |
| 8-13-31 | Silurian | SD | Isolated | 15 | 110.2 | −28.6 | 27.78 |
| 8-13-32 | Silurian | SD | Crystal growth | 6 | 112.5 | −27.1 | 26.86 |
| 8-13-33 | Silurian | SD | Crystal growth | 7 | 123.2 | −30.9 | 29.23 |
| 8-13-34 | Silurian | SD | Crystal growth | 11 | 105.2 | −28.2 | 27.54 |
| 8-13-35 | Silurian | SD | Crystal growth | 5 | 115.9 | −31.6 | 29.69 |
| 8-13-36 | Silurian | SD | Crystal growth | 4 | 108.9 | ||
| 8-13-37 | Silurian | SD | Crystal growth | 10 | 117.3 | −28.6 | 27.78 |
| 8-13-38 | Silurian | SD | Crystal growth | 9 | 103.4 | −27.9 | 27.35 |
| 8-13-39 | Silurian | SD | Crystal growth | 6 | 101.2 | −31.1 | 29.36 |
| 8-13-40 | Silurian | SD | Crystal growth | 13 | 127.5 | −29.9 | 28.60 |
| 8-13-41 | Silurian | SD | Crystal growth | 3 | 125.9 | −32.8 | 30.49 |
| 8-13-42 | Silurian | SD | Crystal growth | 4 | 132.7 | ||
| 1-28-1 | Silurian | SD | Crystal growth | 6 | 112.3 | −26.8 | 26.68 |
| 1-28-2 | Silurian | SD | Crystal growth | 8 | 120.5 | −27.1 | 26.86 |
| 1-28-3 | Silurian | SD | Crystal growth | 5 | 126.6 | −27.8 | 27.29 |
| 1-28-4 | Silurian | SD | Crystal growth | 3 | 130.3 | ||
| 1-28-5 | Silurian | SD | Crystal growth | 3 | 136.4 | ||
| 1-28-6 | Silurian | SD | Crystal growth | 5 | 125.8 | −28.4 | 27.66 |
| 1-28-7 | Silurian | SD | Crystal growth | 7 | 186.6 | −33.7 | 31.11 |
| 8-4-1. | Devonian | RD2 | Crystal growth | 3 | 101.1 | ||
| 8-4-2. | Devonian | RD2 | Isolated | 5 | 87.5 | −18.6 | 21.40 |
| 8-4-2. | Devonian | RD2 | Cluster | 2 | 85.3 | ||
| 8-4-2. | Devonian | RD2 | Cluster | 4 | 79.6 | −17.9 | 20.89 |
| 8-4-2. | Devonian | RD2 | Cluster | 1 | 88.1 | ||
| 8-4-2. | Devonian | RD2 | Cluster | 6 | 77.8 | −15.4 | 18.96 |
| 8-4-2. | Devonian | RD2 | Cluster | 4 | 84.3 | −17.8 | 20.82 |
| 8-4-2. | Devonian | RD2 | Cluster | 2 | 75.4 | ||
| 1-3-2-1 | Devonian | RD2 | Isolated | 5 | 76.9 | −19.2 | 21.82 |
| 1-3-2-2 | Devonian | RD2 | Isolated | 3 | 85.2 | ||
| 1-3-2-3 | Devonian | RD2 | Cluster | 4 | 93.3 | −17.4 | 20.52 |
| 1-3-2-4 | Devonian | RD2 | Isolated | 6 | 79.1 | −18.3 | 21.19 |
| 1-3-2-5 | Devonian | RD2 | Isolated | 1 | 71.4 | ||
| 1-3-2-6 | Devonian | RD2 | Isolated | 2 | 102.3 | ||
| 1-3-2-7 | Devonian | RD2 | Isolated | 1 | 76.3 | ||
| 1-3-2-8 | Devonian | RD2 | Isolated | 1 | 69.9 | ||
| 1-3-2-9 | Devonian | RD2 | Isolated | 2 | 81.1 | ||
| 8-1-1. | Devonian | BKC | Isolated | 8 | 173.5 | −11.2 | 15.17 |
| 8-1-2. | Devonian | BKC | Cluster | 10 | 205.1 | ||
| 8-1-3. | Devonian | BKC | Cluster | 2 | 166.9 | ||
| 8-1-4. | Devonian | BKC | Crystal growth | 8 | 175 | ||
| 8-1-5. | Devonian | BKC | Crystal growth | 8 | 208.4 | −15.6 | 19.13 |
| 8-1-6. | Devonian | BKC | Trail | 2 | 154.1 | ||
| 8-1-7. | Devonian | BKC | Trail | 2 | 157.9 | ||
| 8-1-8. | Devonian | BKC | Trail | 2 | 163.2 | ||
| 8-1-9. | Devonian | BKC | Scattered | 8 | 183.1 | −14.8 | 18.47 |
| 8-1-10. | Devonian | BKC | Scattered | 8 | 208.6 | −15.2 | 18.80 |
| 8-1-11. | Devonian | BKC | Scattered | 4 | 221.2 | ||
| 8-1-12. | Devonian | BKC | Scattered | 3 | 182.4 | ||
| 8-1-13. | Devonian | BKC | Cluster | 6 | 199.8 | −19.9 | 22.31 |
| 8-1-14. | Devonian | BKC | Scattered | 3 | 168.3 | ||
| 8-1-15. | Devonian | BKC | Cluster | 5 | 237.8 | ||
| 8-1-16. | Devonian | BKC | Cluster | 7 | 180.2 | −20.1 | 22.44 |
| 8-1-17. | Devonian | BKC | Cluster | 8 | 225.4 | −19.4 | 21.96 |
| 8-1-18. | Devonian | BKC | Cluster | 5 | 225.8 | ||
| 8-1-19. | Devonian | BKC | Isolated | 7 | 196.4 | −21.4 | 23.31 |
| 8-1-20. | Devonian | BKC | Trail | 5 | 207.1 | ||
| 8-1-21. | Devonian | BKC | Isolated | 8 | 165.9 | −15.9 | 19.37 |
| 8-1-22. | Devonian | BKC | Trail | 8 | 237.9 | −16.2 | 19.60 |
| 8-1-23. | Devonian | BKC | Isolated | 8 | 231.1 | −19.1 | 21.75 |
| 8-1-24. | Devonian | BKC | Isolated | 7 | 209.8 | −22.4 | 23.95 |
| 8-1-25. | Devonian | BKC | Scattered | 8 | 227.1 | −12.9 | 16.80 |
| 8-1-26. | Devonian | BKC | Scattered | 4 | 146.2 | ||
| 8-1-27. | Devonian | BKC | Scattered | 4 | 188.6 | ||
| 8-1-28. | Devonian | BKC | Isolated | 6 | 200.8 | −16.4 | 19.76 |
| 8-1-29. | Devonian | BKC | Isolated | 6 | 195.5 | −16.2 | 19.60 |
| 8-1-30. | Devonian | BKC | Isolated | 7 | 223.9 | −17.8 | 20.82 |
| 8-1-31. | Devonian | BKC | Isolated | 4 | 154.3 | −14.7 | 18.38 |
| 8-1-32. | Devonian | BKC | Isolated | 9 | 214.5 | −19.6 | 22.10 |
| Sample | Age | Type | MgCO3 | CaCO3 | Mn | Fe | Sr |
|---|---|---|---|---|---|---|---|
| (mole %) | (mole %) | (ppm) | (ppm) | (ppm) | |||
| 1-15a | Silurian | RD1 | 43.0 | 57.0 | 42.5 | 678.9 | 89.3 |
| 1-16a | Silurian | RD1 | 41.6 | 58.4 | 62.1 | 599.1 | 90.1 |
| 1-17a | Silurian | RD1 | 42.0 | 58.0 | 34.2 | 606.3 | 70.2 |
| 1-18 | Silurian | RD1 | 46.8 | 53.2 | 197.6 | 3458.5 | 71.9 |
| 1-20 | Silurian | RD1 | 40.6 | 59.4 | 130.2 | 2564.8 | 72.4 |
| 1-21 | Silurian | RD1 | 48.7 | 51.3 | 67.9 | 339.3 | 71.9 |
| 1-31a | Silurian | RD1 | 49.8 | 50.2 | 446.7 | 2984.0 | 97.7 |
| 8-5a | Silurian | RD1 | 51.7 | 48.3 | 208.9 | 3515.8 | 94.8 |
| 8-6 | Silurian | RD1 | 41.2 | 58.8 | 157.3 | 3276.2 | 81.2 |
| 8-8 | Silurian | RD1 | 45.6 | 54.4 | 100.1 | 617.7 | 107.9 |
| 8-13a | Silurian | RD1 | 41.8 | 58.2 | 552.2 | 4020.5 | 80.2 |
| 1-16b | Silurian | RD2 | 43.9 | 56.1 | 66.3 | 809.7 | 81.2 |
| 1-24 | Silurian | RD2 | 37.9 | 62.1 | 103.7 | 6261.1 | 166.3 |
| 1-31b | Silurian | RD2 | 42.6 | 57.4 | 702.5 | 5183.0 | 70.7 |
| 8-13b | Silurian | RD2 | 43.5 | 56.5 | 748.4 | 5929.5 | 71.9 |
| 1-28a | Silurian | SD | 33.0 | 67.0 | 214.6 | 20,374.0 | 81.8 |
| 8-13c | Silurian | SD | 36.5 | 63.5 | 1436.5 | 18,005.3 | 111.2 |
| 1-1a | Devonian | RD1 | 48.2 | 51.8 | 30.1 | 81.3 | 46.8 |
| 1-3-1a | Devonian | RD1 | 39.5 | 60.5 | 29.1 | 80.6 | 58.4 |
| 1-5a | Devonian | RD1 | 39.3 | 60.7 | 46.1 | 171.2 | 81.9 |
| 1-5b | Devonian | RD1 | 43.4 | 56.6 | 40.7 | 148.4 | 66.3 |
| 1-7a | Devonian | RD1 | 43.7 | 56.3 | 35.7 | 112.2 | 72.6 |
| 8-1a | Devonian | RD1 | 39.2 | 60.8 | 25.8 | 90.0 | 62.0 |
| 8-4a | Devonian | RD1 | 42.7 | 57.3 | 54.2 | 690.5 | 67.3 |
| 1-3-2a | Devonian | RD2 | 40.4 | 59.6 | 32.9 | 83.0 | 60.3 |
| 1-4a | Devonian | RD2 | 40.7 | 59.3 | 39.8 | 89.6 | 93.9 |
| 1-7b | Devonian | RD2 | 41.6 | 58.4 | 37.4 | 117.4 | 71.7 |
| 8-4b | Devonian | RD2 | 38.4 | 61.6 | 59.9 | 756.1 | 79.4 |
| 1-3-2b | Devonian | RD3 | 47.2 | 52.8 | 40.8 | 360.9 | 65.7 |
| 1-6a | Devonian | RD3 | 40.0 | 60.0 | 42.5 | 173.0 | 89.1 |
| 8-4c | Devonian | RD3 | 52.1 | 47.9 | 59.0 | 724.8 | 78.9 |
| Sample | Age | Type | La | Ce | Pr | Nd | Sm | Eu | Gd | Tb | Dy | Ho | Er | Tm | Yb | Lu | ΣREE |
|---|---|---|---|---|---|---|---|---|---|---|---|---|---|---|---|---|---|
| (ppm) | (ppm) | (ppm) | (ppm) | (ppm) | (ppm) | (ppm) | (ppm) | (ppm) | (ppm) | (ppm) | (ppm) | (ppm) | (ppm) | (ppm) | |||
| 1-15a | Silurian | RD1 | 1.51 | 3.42 | 0.44 | 1.65 | 0.36 | 0.09 | 0.31 | 0.05 | 0.26 | 0.05 | 0.16 | 0.02 | 0.12 | 0.02 | 8.46 |
| 1-16a | Silurian | RD1 | 3.80 | 9.17 | 1.16 | 4.22 | 0.84 | 0.16 | 0.76 | 0.11 | 0.62 | 0.11 | 0.33 | 0.04 | 0.26 | 0.04 | 21.62 |
| 1-17a | Silurian | RD1 | 0.78 | 1.42 | 0.15 | 0.52 | 0.10 | 0.02 | 0.10 | 0.01 | 0.06 | 0.01 | 0.04 | 0.00 | 0.03 | 0.00 | 3.25 |
| 1-18 | Silurian | RD1 | 1.76 | 4.02 | 0.51 | 2.07 | 0.43 | 0.08 | 0.41 | 0.05 | 0.28 | 0.05 | 0.12 | 0.01 | 0.07 | 0.01 | 9.88 |
| 1-20 | Silurian | RD1 | 3.97 | 9.62 | 1.16 | 4.58 | 1.05 | 0.25 | 1.06 | 0.15 | 0.80 | 0.15 | 0.41 | 0.05 | 0.27 | 0.04 | 23.55 |
| 1-21 | Silurian | RD1 | 0.87 | 1.99 | 0.23 | 0.90 | 0.16 | 0.05 | 0.17 | 0.02 | 0.13 | 0.02 | 0.07 | 0.01 | 0.06 | 0.00 | 4.68 |
| 1-31a | Silurian | RD1 | 2.06 | 4.23 | 0.54 | 2.04 | 0.41 | 0.10 | 0.42 | 0.06 | 0.32 | 0.06 | 0.19 | 0.02 | 0.14 | 0.02 | 10.62 |
| 8-5a | Silurian | RD1 | 2.19 | 5.21 | 0.64 | 2.40 | 0.47 | 0.11 | 0.50 | 0.06 | 0.35 | 0.07 | 0.18 | 0.02 | 0.12 | 0.02 | 12.33 |
| 8-6 | Silurian | RD1 | 2.75 | 6.99 | 0.87 | 3.46 | 0.75 | 0.19 | 0.82 | 0.12 | 0.64 | 0.12 | 0.30 | 0.04 | 0.20 | 0.03 | 17.27 |
| 8-8 | Silurian | RD1 | 1.17 | 2.82 | 0.35 | 1.34 | 0.27 | 0.06 | 0.30 | 0.04 | 0.22 | 0.04 | 0.11 | 0.01 | 0.12 | 0.01 | 6.86 |
| 8-13a | Silurian | RD1 | 2.42 | 4.90 | 0.60 | 2.19 | 0.48 | 0.10 | 0.46 | 0.07 | 0.39 | 0.08 | 0.25 | 0.02 | 0.16 | 0.02 | 12.13 |
| 1-16b | Silurian | RD2 | 3.64 | 9.45 | 1.23 | 4.86 | 0.88 | 0.18 | 0.86 | 0.12 | 0.65 | 0.12 | 0.36 | 0.05 | 0.23 | 0.03 | 22.67 |
| 1-23b | Silurian | RD2 | 0.28 | 0.50 | 0.05 | 0.26 | 0.05 | 0.01 | 0.05 | 0.01 | 0.04 | 0.01 | 0.02 | 0.00 | 0.02 | 0.00 | 1.30 |
| 1-24 | Silurian | RD2 | 0.32 | 0.69 | 0.09 | 0.35 | 0.06 | 0.01 | 0.07 | 0.01 | 0.07 | 0.02 | 0.04 | 0.01 | 0.02 | 0.01 | 1.77 |
| 1-31b | Silurian | RD2 | 2.87 | 6.52 | 0.80 | 2.80 | 0.49 | 0.12 | 0.48 | 0.06 | 0.37 | 0.06 | 0.21 | 0.03 | 0.15 | 0.02 | 14.98 |
| 8-10b | Silurian | RD2 | 0.29 | 0.53 | 0.06 | 0.23 | 0.06 | 0.01 | 0.06 | 0.01 | 0.05 | 0.01 | 0.03 | 0.00 | 0.02 | 0.00 | 1.37 |
| 8-13b | Silurian | RD2 | 3.32 | 7.82 | 0.97 | 3.79 | 0.73 | 0.13 | 0.67 | 0.08 | 0.48 | 0.09 | 0.24 | 0.04 | 0.23 | 0.03 | 18.61 |
| 1-28a | Silurian | SD | 0.36 | 0.77 | 0.09 | 0.39 | 0.07 | 0.02 | 0.04 | 0.01 | 0.05 | 0.01 | 0.02 | 0.00 | 0.02 | 0.00 | 1.85 |
| 1-31c | Silurian | SD | 5.75 | 16.24 | 2.14 | 8.07 | 1.39 | 0.23 | 1.06 | 0.13 | 0.68 | 0.11 | 0.33 | 0.04 | 0.21 | 0.03 | 36.41 |
| 8-13c | Silurian | SD | 19.39 | 47.98 | 5.92 | 20.35 | 3.42 | 0.44 | 2.30 | 0.27 | 1.34 | 0.23 | 0.69 | 0.08 | 0.45 | 0.06 | 102.93 |
| 1-23a | Silurian | ISC | 0.40 | 0.71 | 0.08 | 0.33 | 0.05 | 0.01 | 0.06 | 0.01 | 0.05 | 0.01 | 0.05 | 0.00 | 0.02 | 0.00 | 1.80 |
| 8-10a | Silurian | ISC | 0.20 | 0.39 | 0.05 | 0.20 | 0.04 | 0.01 | 0.04 | 0.01 | 0.03 | 0.01 | 0.02 | 0.00 | 0.02 | 0.00 | 1.01 |
| 1-32 | Silurian | SXC | 6.07 | 10.30 | 1.44 | 5.74 | 1.09 | 0.24 | 1.17 | 0.14 | 0.76 | 0.14 | 0.35 | 0.04 | 0.24 | 0.03 | 27.75 |
| 1-33a | Silurian | SXC | 3.86 | 7.09 | 0.94 | 3.92 | 1.08 | 0.26 | 1.42 | 0.20 | 1.39 | 0.29 | 0.93 | 0.12 | 0.80 | 0.10 | 22.42 |
| 1-17b | Silurian | DC | 1.22 | 2.08 | 0.23 | 0.82 | 0.15 | 0.04 | 0.12 | 0.02 | 0.10 | 0.01 | 0.05 | 0.01 | 0.03 | 0.01 | 4.88 |
| 1-26 | Silurian | BKC | 2.99 | 7.48 | 0.95 | 4.01 | 1.08 | 0.24 | 1.19 | 0.19 | 1.15 | 0.22 | 0.60 | 0.08 | 0.48 | 0.06 | 20.73 |
| 1-27 | Silurian | BKC | 2.07 | 5.09 | 0.67 | 2.76 | 0.53 | 0.13 | 0.56 | 0.08 | 0.42 | 0.07 | 0.22 | 0.03 | 0.15 | 0.02 | 12.78 |
| 1-28b | Silurian | BKC | 0.70 | 1.24 | 0.13 | 0.49 | 0.10 | 0.02 | 0.13 | 0.02 | 0.13 | 0.03 | 0.09 | 0.01 | 0.07 | 0.01 | 3.17 |
| 1-31d | Silurian | BKC | 9.35 | 26.81 | 3.53 | 13.19 | 2.43 | 0.34 | 1.75 | 0.21 | 1.03 | 0.19 | 0.53 | 0.06 | 0.40 | 0.05 | 59.87 |
| 8-5b | Silurian | BKC | 1.72 | 4.60 | 0.62 | 2.28 | 0.40 | 0.10 | 0.42 | 0.06 | 0.32 | 0.08 | 0.24 | 0.03 | 0.20 | 0.03 | 11.09 |
| 8-13d | Silurian | BKC | 14.53 | 32.22 | 3.47 | 10.91 | 1.60 | 0.21 | 1.18 | 0.12 | 0.53 | 0.09 | 0.24 | 0.03 | 0.20 | 0.03 | 65.36 |
| 1-1a | Devonian | RD1 | 0.13 | 0.25 | 0.03 | 0.14 | 0.03 | 0.01 | 0.03 | 0.00 | 0.02 | 0.00 | 0.01 | 0.00 | 0.01 | 0.00 | 0.69 |
| 1-3-1a | Devonian | RD1 | 0.23 | 0.42 | 0.06 | 0.18 | 0.05 | 0.01 | 0.04 | 0.01 | 0.04 | 0.01 | 0.02 | 0.00 | 0.03 | 0.00 | 1.10 |
| 1-5a | Devonian | RD1 | 0.13 | 0.18 | 0.02 | 0.09 | 0.02 | 0.00 | BDL | 0.00 | 0.03 | 0.01 | 0.03 | 0.00 | 0.02 | 0.00 | 0.54 |
| 1-5b | Devonian | RD1 | 0.11 | 0.17 | 0.02 | 0.07 | 0.01 | 0.00 | BDL | BDL | 0.02 | 0.00 | 0.02 | 0.00 | 0.02 | 0.00 | 0.44 |
| 1-7a | Devonian | RD1 | 0.14 | 0.20 | 0.02 | 0.11 | 0.03 | 0.01 | BDL | 0.00 | 0.02 | 0.00 | 0.01 | 0.00 | 0.02 | 0.00 | 0.56 |
| 8-1a | Devonian | RD1 | 0.31 | 0.53 | 0.07 | 0.24 | 0.04 | 0.01 | 0.04 | 0.01 | 0.05 | 0.01 | 0.02 | 0.00 | 0.02 | 0.00 | 1.35 |
| 8-4a | Devonian | RD1 | 0.76 | 0.94 | 0.15 | 0.61 | 0.17 | 0.03 | 0.18 | 0.03 | 0.16 | 0.04 | 0.12 | 0.01 | 0.07 | 0.01 | 3.29 |
| 1-3-2a | Devonian | RD2 | 0.25 | 0.45 | 0.06 | 0.23 | 0.04 | 0.01 | 0.04 | 0.01 | 0.05 | 0.01 | 0.03 | 0.00 | 0.02 | 0.01 | 1.22 |
| 1-4a | Devonian | RD2 | 0.33 | 0.40 | 0.05 | 0.15 | 0.03 | 0.01 | BDL | 0.00 | 0.03 | 0.00 | 0.01 | 0.00 | 0.02 | 0.00 | 1.05 |
| 1-7b | Devonian | RD2 | 0.14 | 0.20 | 0.03 | 0.10 | 0.03 | 0.00 | BDL | 0.01 | 0.02 | 0.01 | 0.01 | 0.00 | 0.01 | 0.00 | 0.56 |
| 8-4b | Devonian | RD2 | 0.89 | 1.09 | 0.18 | 0.72 | 0.16 | 0.03 | 0.22 | 0.03 | 0.19 | 0.04 | 0.14 | 0.02 | 0.09 | 0.01 | 3.80 |
| 1-2a | Devonian | RD3 | 0.43 | 0.66 | 0.08 | 0.29 | 0.06 | 0.01 | 0.07 | 0.01 | 0.04 | 0.01 | 0.02 | 0.00 | 0.02 | 0.00 | 1.72 |
| 1-3-2b | Devonian | RD3 | 0.42 | 0.76 | 0.11 | 0.42 | 0.12 | 0.02 | 0.08 | 0.01 | 0.08 | 0.02 | 0.05 | 0.01 | 0.04 | 0.01 | 2.15 |
| 1-6a | Devonian | RD3 | 0.20 | 0.23 | 0.03 | 0.13 | 0.03 | 0.00 | 0.03 | 0.00 | 0.03 | 0.01 | 0.02 | 0.00 | 0.01 | 0.00 | 0.73 |
| 1-10a | Devonian | RD3 | 1.67 | 1.53 | 0.20 | 0.70 | 0.13 | 0.03 | 0.14 | 0.02 | 0.14 | 0.03 | 0.10 | 0.01 | 0.06 | 0.01 | 4.78 |
| 1-13b | Devonian | RD3 | 6.74 | 6.77 | 1.32 | 5.40 | 1.07 | 0.25 | 1.25 | 0.16 | 0.96 | 0.20 | 0.56 | 0.06 | 0.38 | 0.05 | 25.17 |
| 8-4c | Devonian | RD3 | 0.91 | 1.12 | 0.18 | 0.75 | 0.16 | 0.04 | 0.23 | 0.03 | 0.21 | 0.05 | 0.12 | 0.02 | 0.11 | 0.01 | 3.94 |
| 1-10b | Devonian | SXC | 0.82 | 0.74 | 0.11 | 0.38 | 0.04 | 0.01 | 0.06 | 0.01 | 0.07 | 0.02 | 0.06 | 0.01 | 0.04 | 0.00 | 2.38 |
| 1-11a | Devonian | SXC | 1.13 | 1.16 | 0.16 | 0.64 | 0.09 | 0.02 | 0.14 | 0.02 | 0.12 | 0.02 | 0.07 | 0.01 | 0.05 | 0.01 | 3.63 |
| 1-12a | Devonian | SXC | 1.20 | 0.90 | 0.15 | 0.61 | 0.12 | 0.03 | 0.21 | 0.03 | 0.22 | 0.05 | 0.16 | 0.02 | 0.11 | 0.02 | 3.83 |
| 1-13a | Devonian | DC | 5.61 | 5.71 | 1.07 | 4.07 | 0.71 | 0.14 | 0.70 | 0.11 | 0.60 | 0.13 | 0.39 | 0.05 | 0.36 | 0.06 | 19.70 |
| 8-1b | Devonian | BKC | 0.88 | 1.22 | 0.14 | 0.48 | 0.07 | 0.01 | 0.07 | 0.01 | 0.06 | 0.02 | 0.04 | 0.01 | 0.05 | 0.01 | 3.08 |
© 2020 by the authors. Licensee MDPI, Basel, Switzerland. This article is an open access article distributed under the terms and conditions of the Creative Commons Attribution (CC BY) license (http://creativecommons.org/licenses/by/4.0/).
Share and Cite
Tortola, M.; Al-Aasm, I.S.; Crowe, R. Diagenetic Pore Fluid Evolution and Dolomitization of the Silurian and Devonian Carbonates, Huron Domain of Southwestern Ontario: Petrographic, Geochemical and Fluid Inclusion Evidence. Minerals 2020, 10, 140. https://doi.org/10.3390/min10020140
Tortola M, Al-Aasm IS, Crowe R. Diagenetic Pore Fluid Evolution and Dolomitization of the Silurian and Devonian Carbonates, Huron Domain of Southwestern Ontario: Petrographic, Geochemical and Fluid Inclusion Evidence. Minerals. 2020; 10(2):140. https://doi.org/10.3390/min10020140
Chicago/Turabian StyleTortola, Marco, Ihsan S. Al-Aasm, and Richard Crowe. 2020. "Diagenetic Pore Fluid Evolution and Dolomitization of the Silurian and Devonian Carbonates, Huron Domain of Southwestern Ontario: Petrographic, Geochemical and Fluid Inclusion Evidence" Minerals 10, no. 2: 140. https://doi.org/10.3390/min10020140
APA StyleTortola, M., Al-Aasm, I. S., & Crowe, R. (2020). Diagenetic Pore Fluid Evolution and Dolomitization of the Silurian and Devonian Carbonates, Huron Domain of Southwestern Ontario: Petrographic, Geochemical and Fluid Inclusion Evidence. Minerals, 10(2), 140. https://doi.org/10.3390/min10020140