Article

Insights into the CaSO4–H2O System: A Raman-Spectroscopic Study

1
Bundesanstalt für Materialforschung und -prüfung, Richard-Willstätter-Str. 11, 12489 Berlin, Germany
2
School of Analytical Sciences Adlershof (SALSA), Humboldt-Universität zu Berlin, Unter den Linden 6, 10099 Berlin, Germany
3
Bern University of Applied Sciences, Bern University of the Arts, Conservation-Restoration, Fellerstr. 11, 3027 Bern, Switzerland
*
Author to whom correspondence should be addressed.
Minerals 2020, 10(2), 115; https://doi.org/10.3390/min10020115
Submission received: 20 December 2019 / Revised: 17 January 2020 / Accepted: 22 January 2020 / Published: 29 January 2020
(This article belongs to the Special Issue Modern Raman Spectroscopy of Minerals)

Abstract

:
Even though being the subject of natural scientific research for many decades, the system CaSO4–H2O, consisting of the five crystalline phases gypsum, bassanite, and the anhydrites III, II, and I, has left many open questions for research. Raman spectroscopy was used because of its structural sensitivity and in situ measurement capability to obtain further insight by studying phase transitions in both ex situ and in situ experiments. The findings include significant contributions to the completeness and understanding of Raman spectroscopic data of the system. The dehydration path gypsum–bassanite–anhydrite III was shown to have strong parallels to a physical drying process, which depends on many parameters beyond the burning temperature. Raman band width determination was demonstrated to enable the quantitative discrimination of α-bassanite and β-bassanite as well as the postulated three sub-forms of anhydrite II (AII), which are all based on differences in crystallinity. In the latter case, the observed continuous structural variations over increasing burning temperatures were elucidated as a combination of decreasing surface areas and healing of crystal lattice defects. We propose an only two-fold sub-division of AII into reactive “disordered AII” and much less reactive “crystalline AII” with a transition temperature of 650 °C ± 50 K.

1. Introduction

In the course of the 19th century, gypsum increasingly became a subject of natural scientific investigations and the sentence written by Eugene W. Posnjak about 80 years ago is still currently relevant: “It seemed very surprising that, considering the relative simplicity of the system CaSO4–H2O, and its accessibility for study, it could remain over a period of so many years the subject of so much controversy.” [1] (p. 248). To mention only the most significant milestones in research history, Henry Le Chatelier published his doctoral thesis on “Recherches expérimentales sur la constitution des mortiers hydrauliques” (experimental research on the constitution of hydraulic mortars) in 1887, recognising plaster of Paris as calcium sulphate hemihydrate (and not as anhydrite as supposed by Antoine Laurent de Lavoisier in 1765) and its setting as a rehydration process leading to the formation of gypsum again. He observed the partial dehydration of calcium sulphate dihydrate into the hemihydrate bassanite and the subsequent transformation into the anhydrous salt at 128 °C and 163 °C, respectively [2,3]. In 1903, Jacobus Henricus van’t Hoff and his co-workers gave a transition temperature for the gypsum–hemihydrate reaction of 107 °C and proposed the existence of a soluble anhydrite form in the wrong assumption of a direct dehydration of gypsum without the intermediate hemihydrate step at 93 °C [4], which was confirmed and revised, respectively, in independent studies by W. A. Davis [5], Harry B. Weiser et al. [6], and Eugene W. Posnjak [1]. In 1913, Werner Grahmann found (optical) indications for a high-temperature form of anhydrite and reported a transition point at approximately 1194 °C [7]. Evidence for the actual conversion of anhydrite II into anhydrite I is based on an endothermic peak on the heating curve of gypsum at approximately 1180–1230 °C [8,9,10,11,12,13].
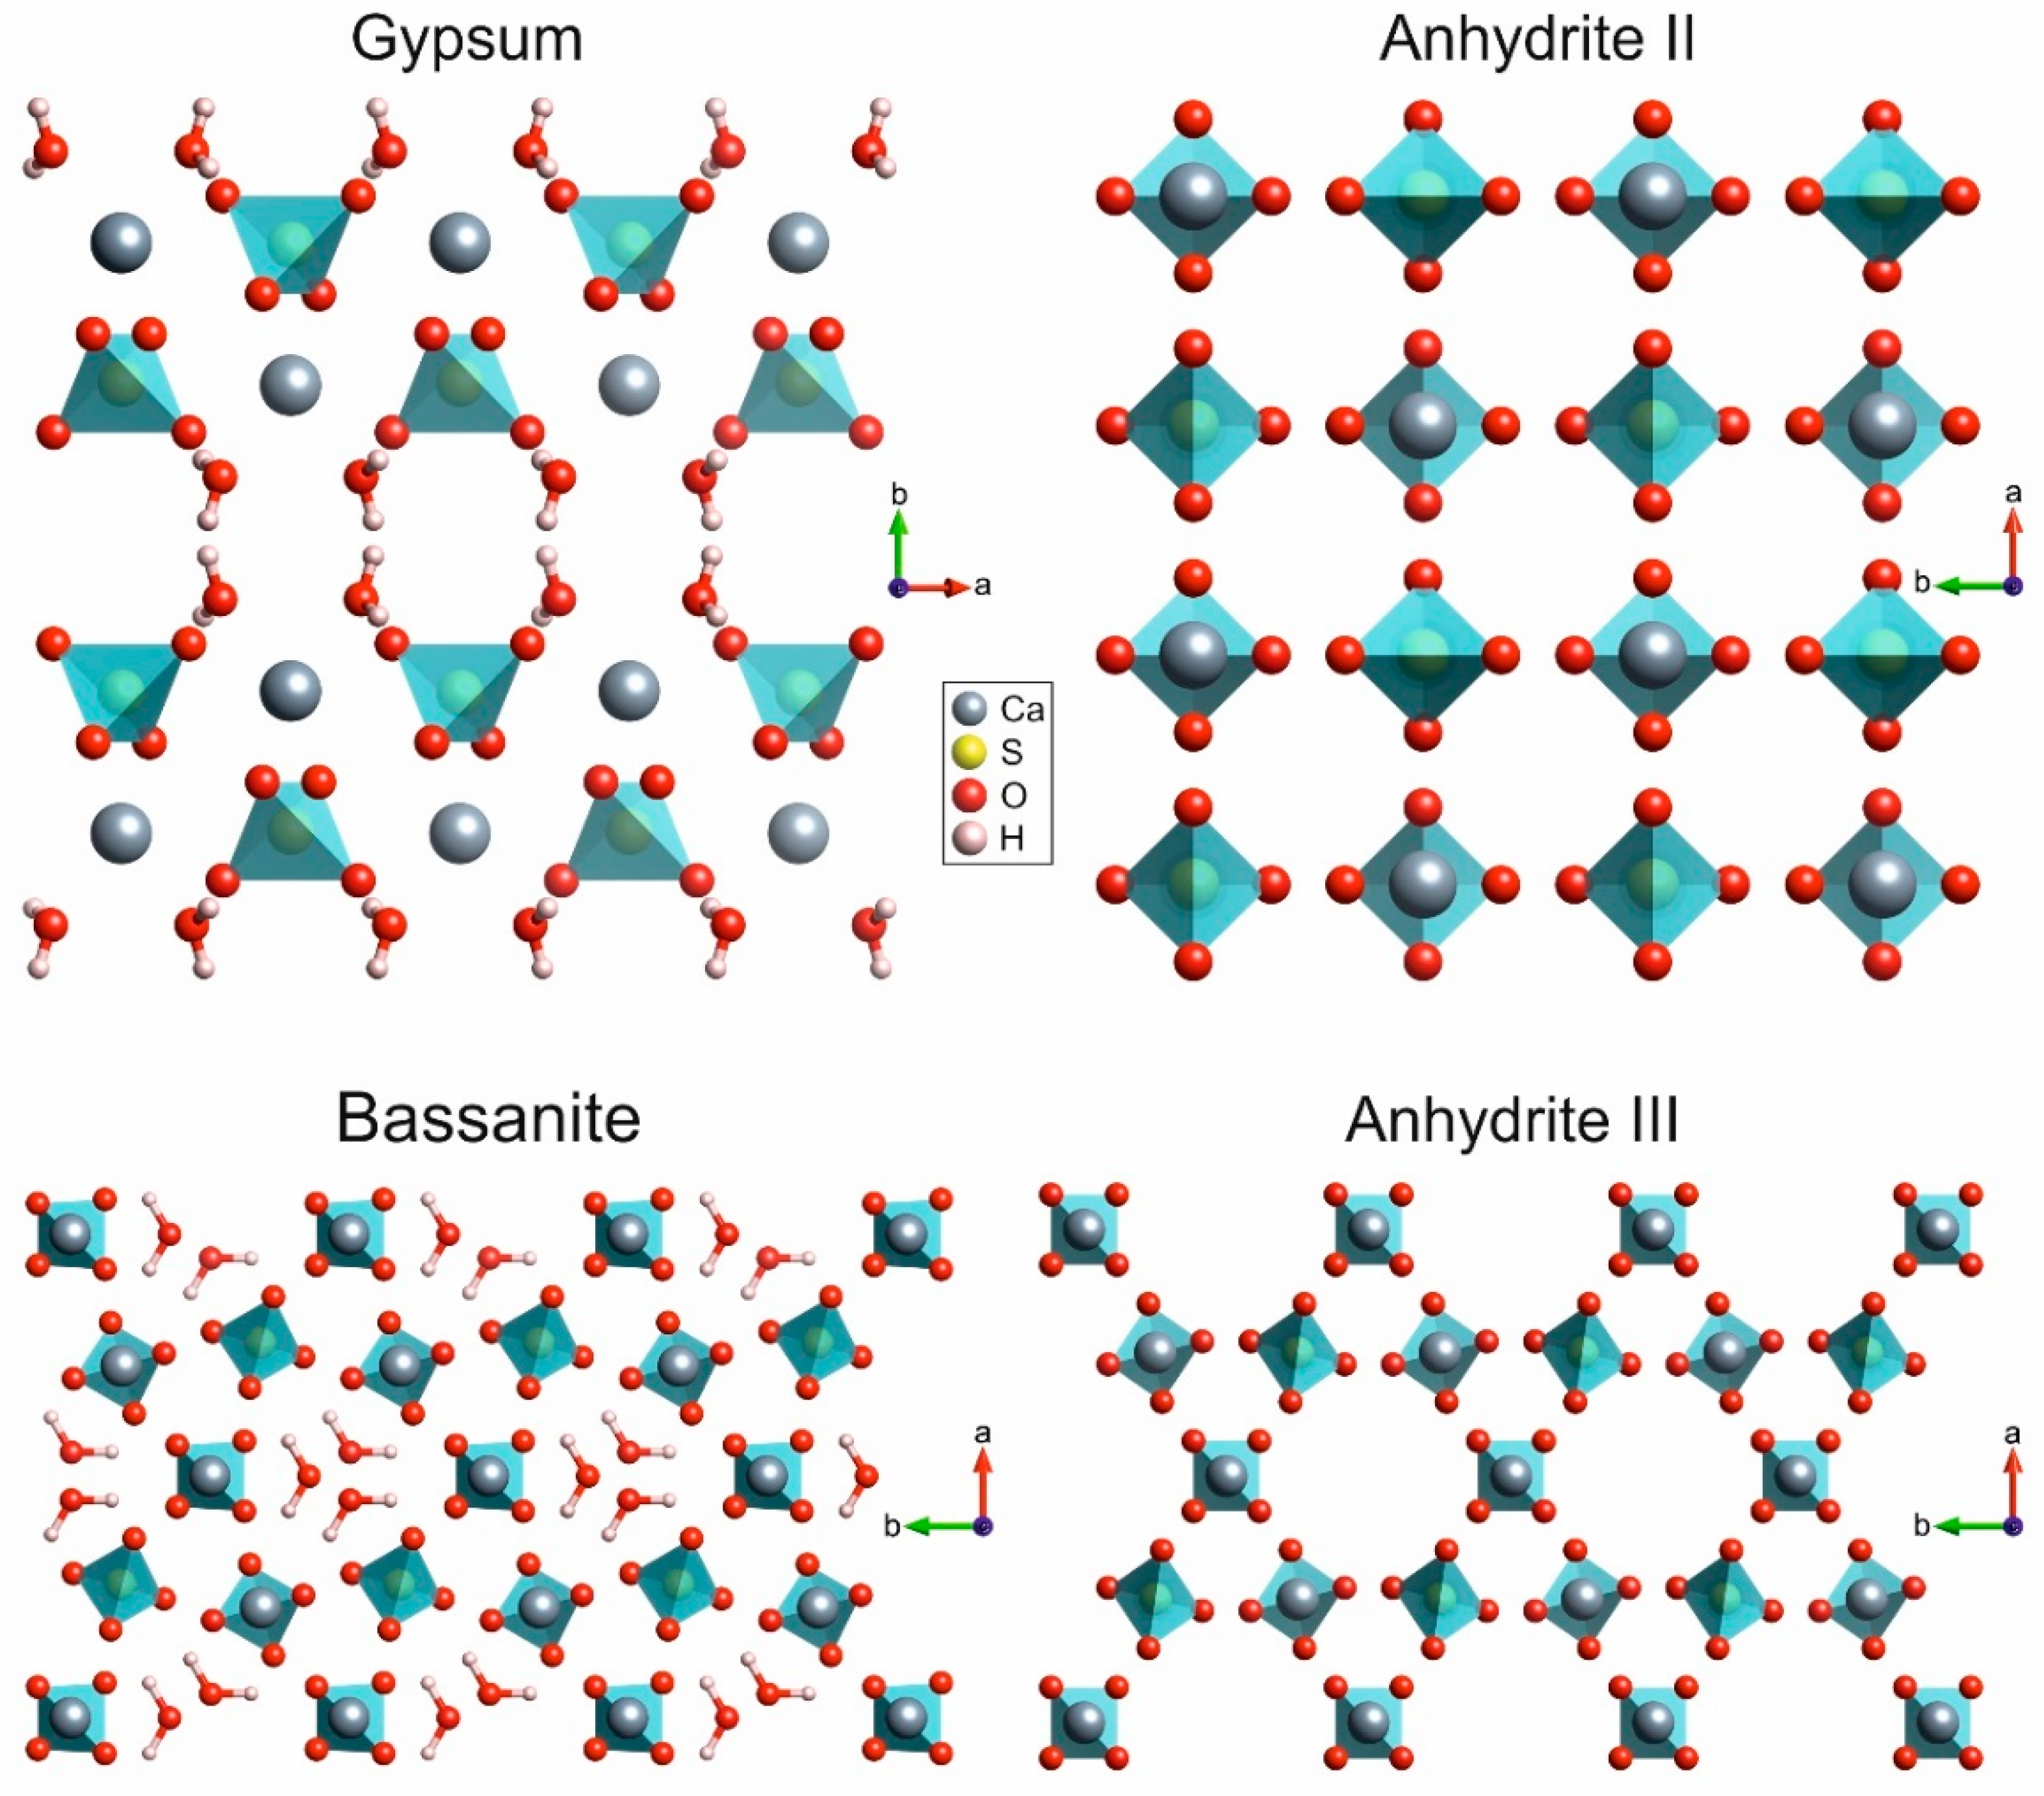
After decades of controversy regarding the number of phases in the CaSO4–H2O system, there is agreement on four phases stable (or metastable, respectively) at room temperature—gypsum CaSO4∙2H2O (dihydrate), bassanite CaSO4·½H2O (hemihydrate), anhydrite III CaSO4 (soluble anhydrite, γ-CaSO4), and anhydrite II CaSO4 (insoluble anhydrite or natural anhydrite, β-CaSO4). Several of those are described with more than one structural model. The excerpt of the crystal structure of gypsum in Figure 1 shows the view along the [001] direction, which reveals chains of alternating calcium and sulphate ions that are building blocks of all phases of the CaSO4–H2O system.
In gypsum, they are arranged as double layers interconnected by the hydrogen bonds of water layers. Gypsum, which forms monoclinic prismatic crystals (space group C2/c) [15], cleaves predominantly along these layers. Conversion of the dihydrate into hemihydrate (bassanite) is accompanied by clear structural changes, which leads to the arrangement of six Ca2+–SO42− chains around approximately 0.4-nm wide channels hosting the crystal water. Figure 1 shows the view onto the (001) plane of bassanite, which crystallises in the monoclinic space group I2 [16]. Only slight rearrangements of the Ca2+–SO42− chains lead to orthorhombic anhydrite III (C222) [17], which is mainly characterised by empty channels due to the loss of crystal water. Lastly, anhydrite II consists of regularly arranged Ca2+–SO42− chains in an orthorhombic (Amma) crystal lattice [18]. Since the high-temperature phase anhydrite I (α-CaSO4) is not stable at room temperature, only X-ray diffraction conducted in heating chambers was able to provide structural insight, which revealed a cubic crystal lattice in analogy to sodium chloride with calcium ions coordinated by 12 oxygen atoms (in gypsum and anhydrite II, the coordination number is 8) [11].
Research proceeds regarding structural differences and properties of the phases constituting the CaSO4–H2O system, which allow their qualitative and quantitative identification, such as the two forms of hemihydrate and the three proposed sub-phases of anhydrite II (AII). The AII sub-phases exhibit different macroscopic characteristics (e.g., morphology, hydration reactivity, etc.) as a function of increasing calcination temperature. Sparingly soluble AII-s is produced at 300–500 °C, insoluble AII-u at 500–700 °C, and estrich gypsum AII-E at 700–1180 °C [19,20]. The first successful analytical approach to AII sub-phases was achieved recently in 2017, which demonstrated that, over the burning temperature range from 500 to 900 °C, the specific surface area of anhydrite II decreases due to an increase of crystallite size, while an overall increase of crystallinity can be traced by quantitatively evaluating the widths of room-temperature Raman bands, which get sharper at increasing burning temperatures [21]. Investigations within an extended temperature range of 400–1100 °C confirmed this trend [22,23].
Whereas predecessor studies of the CaSO4–H2O system employed Raman micro-spectroscopic imaging of high-fired medieval gypsum mortars for determining burning temperatures [21,22,23,24], the present study focuses on the structural sensitivity and in situ measurement capabilities of Raman spectroscopy while spatial resolution only plays a role in surface vs. sub-surface measurements within kinetic investigations and in heterogeneity tests of samples. The whole system of phases stable at room temperature ranging from gypsum to anhydrite II is studied, including their Raman spectra, temperature-dependence of spectroscopic data, phase transformations, and their significant process parameters as well as analytical approaches and structural insights to the α-form and β-form of bassanite and the sub-phases of anhydrite II. Even if the study provides answers to several questions, others still remain open, which underlines the complexity of a seemingly simple and well-known system.

2. Materials and Methods

2.1. Starting Materials

Starting material of most experiments of this study was gypsum powder, i.e., calcium sulphate dihydrate (≥98%, p.a., ACS), purchased from Carl Roth GmbH + Co. KG (Karlsruhe, Germany). Samples of α-bassanite and β-bassanite were provided by Knauf Gips KG (Iphofen, Germany). Gypsum stone fragments originated from Cavalese (Italy). The starting materials of the gypsum calcination experiments of the present study are described in detail in Appendix A.

2.2. Calcination in a Laboratory Furnace (Ex Situ Experiments)

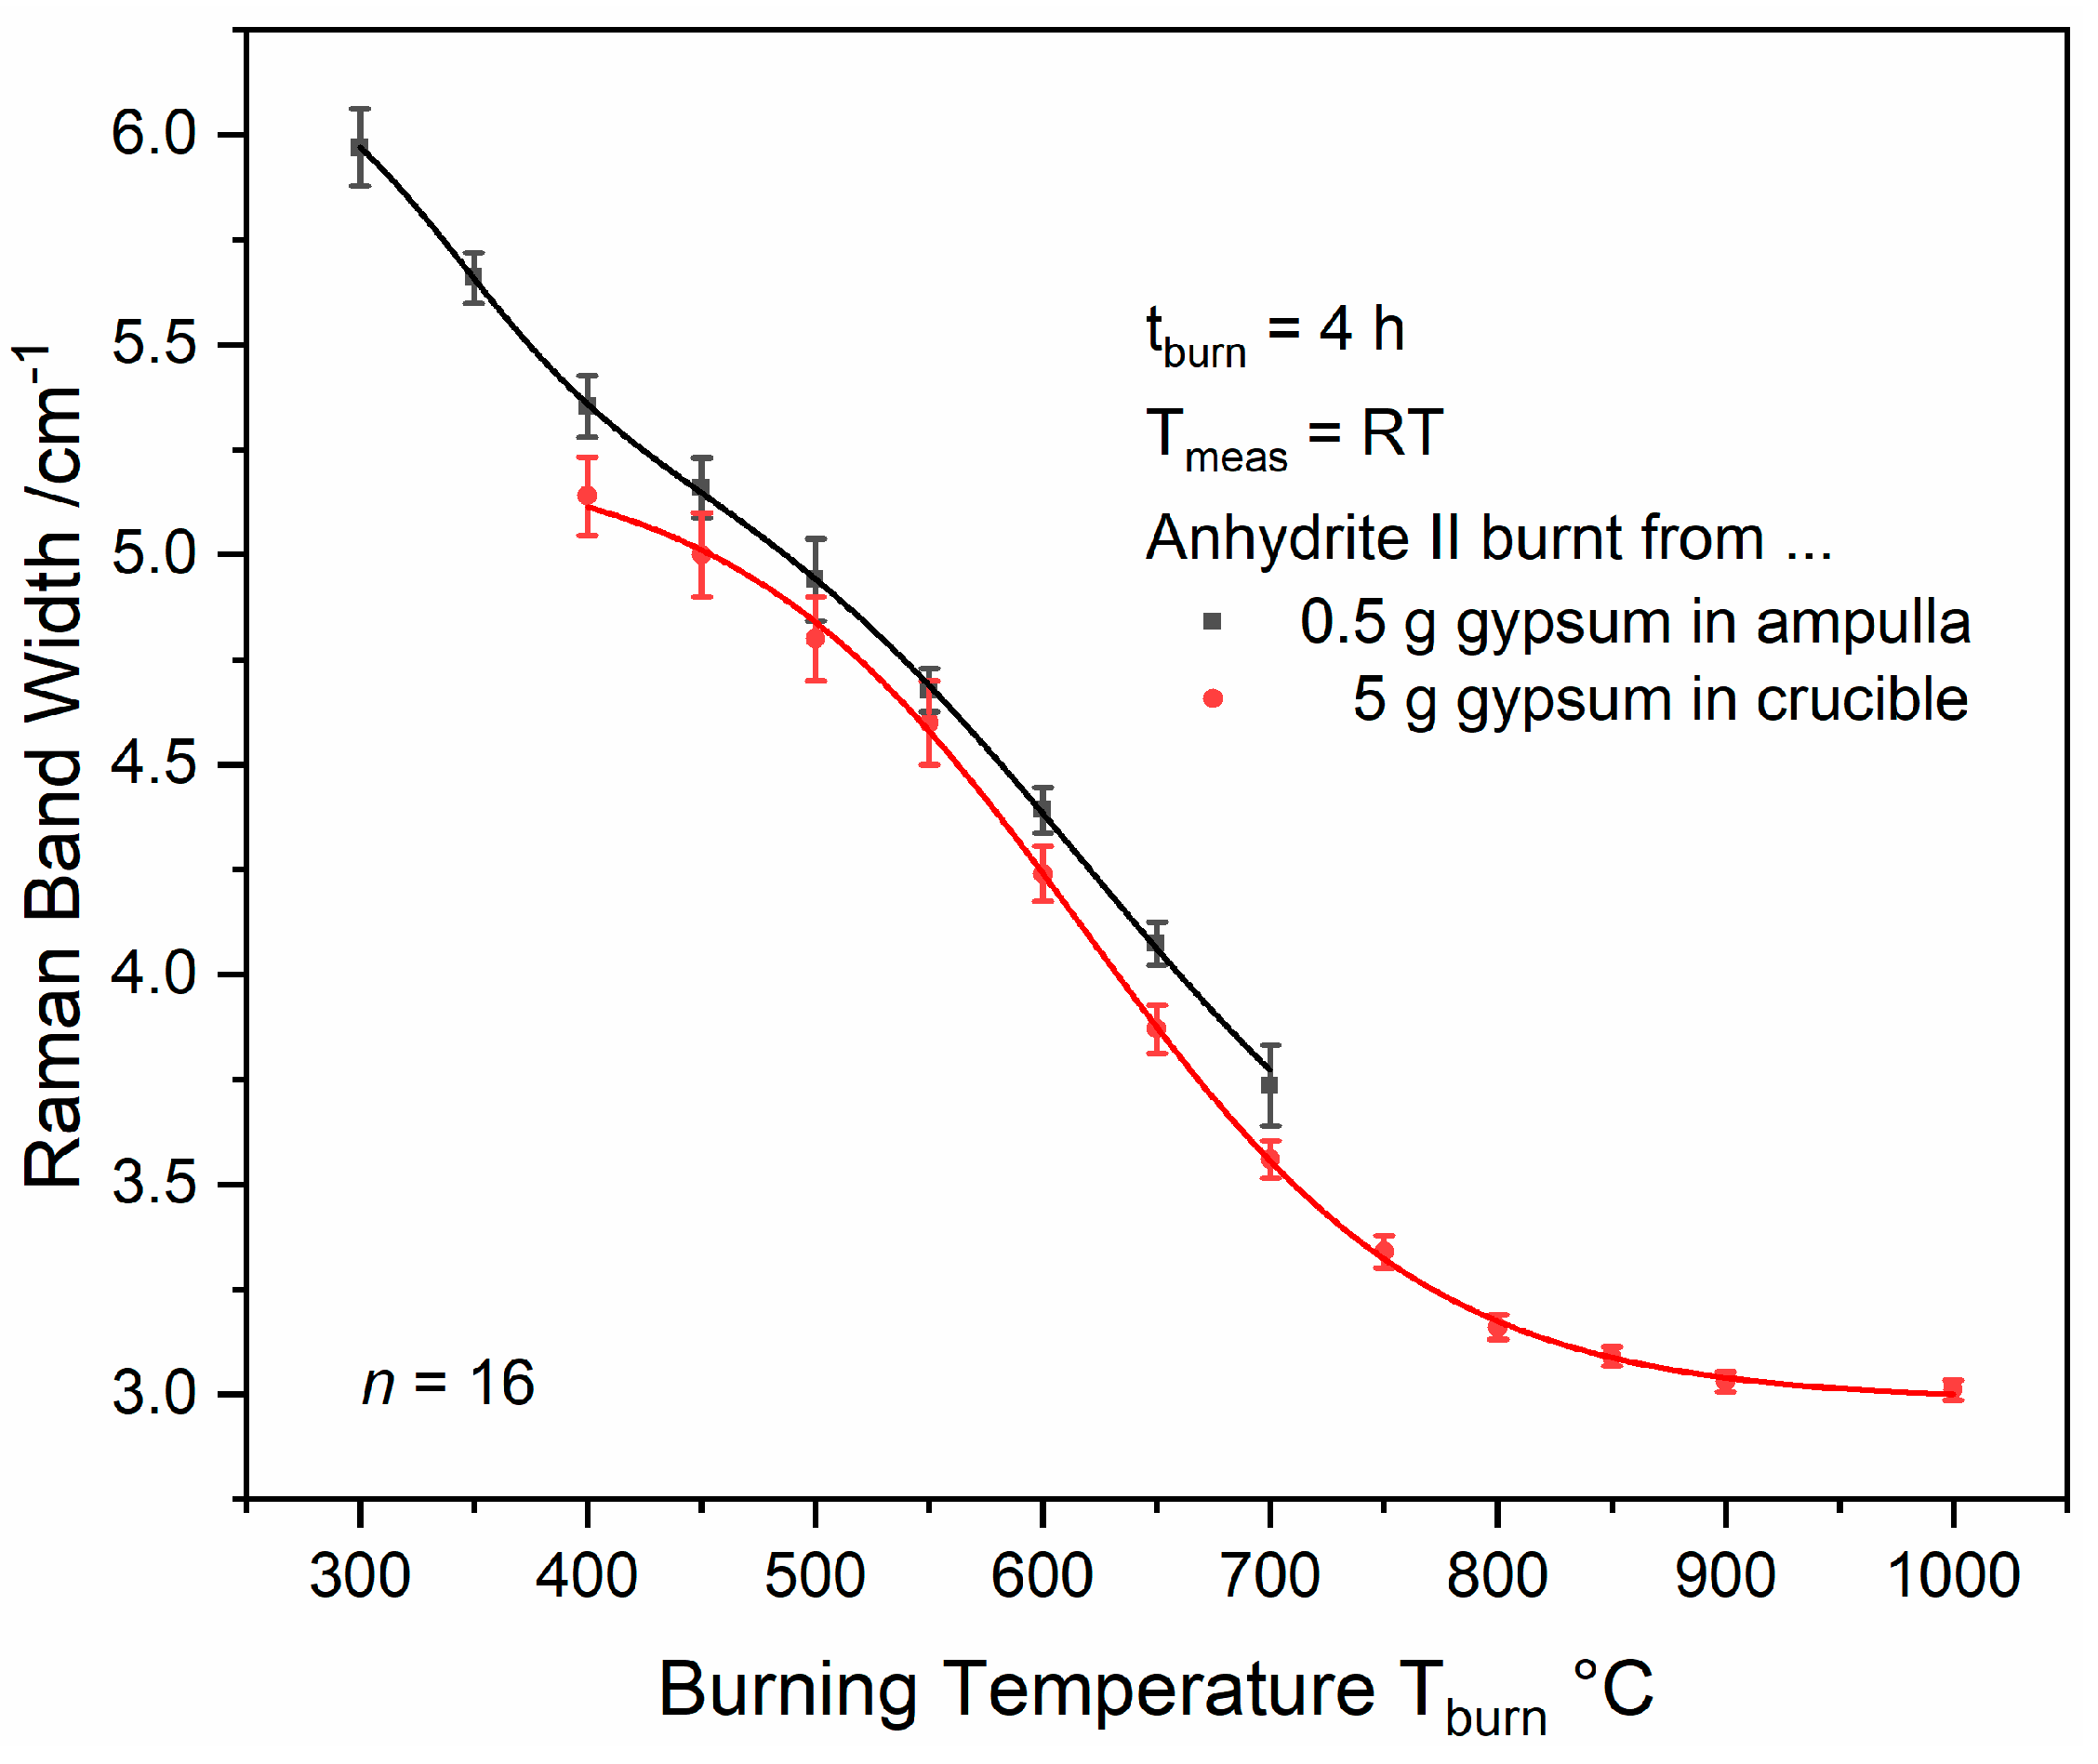
Most ex situ calcination experiments in this study were performed with 0.5 g gypsum powder in a glass ampulla (below referred to as “ampulla method”), which, for practical reasons, was placed into a corundum crucible. The glass ampullae had an outer diameter of 1 cm at the base and of 0.5 cm at the upper opening, and a volume of approximately 2.5 cm3. In order to protect the reaction products from moist ambient air, these ampullae were sealed directly after calcination by melting the glass using a gas torch. The distance of the opening from the calcinated material was high enough and heat conductivity of glass was low enough to avoid interference of the heat with the reaction products. The results shown as red curves in Figure 18 and Figure A2 (in Appendix B) were obtained by burning 5 g gypsum powder each in open, cylindrical corundum crucibles (“crucible method”) with a diameter of 3.5 cm and a height of 5 cm.
Calcination was conducted in an LT 9/13/P320 laboratory furnace from Nabertherm. The starting material was placed in the furnace and heated typically at the highest rate of 30 K min−1. In order to avoid short overheating events, burning temperatures of <500 °C were approached within heating ramps of 2 h even though test experiments have demonstrated no differences in Raman data for the different heating scenarios of placing the sample into the pre-heated furnace (e.g., at 450 °C), heating with the steepest ramp (e.g., 450 °C reached with 30 K min−1 within 14 min) or slow heating within 2 h. We would like to make clear that the burning time tburn mentioned along with the data in this study is defined as the duration of the holding time period of constant temperature and does not include heating or cooling phases. Along with tburn, the calcination temperature (Tburn), which is the setpoint temperature kept constant during tburn, and the measurement temperature (Tmeas) are given for each data set. All Raman spectra of reaction products synthesised in the laboratory furnace were measured at room temperature (i.e., Tmeas = RT). Typically, n = 16 measurements were performed on different spots.

2.3. Calcination Using a Heating Stage (In Situ Experiments)

A TS-1500 heating stage from Linkam with a T96-LinkPad controller was employed for in situ measurements. The device contains a corundum crucible with a height of 7 mm and a diameter of 3 mm, which can be heated with a maximum rate of 200 K min−1 from room temperature up to 1500 °C. A transparent, sub-millimetre-thin sapphire disk was the base plate in the crucible. The device was employed for Raman measurements by focussing the laser beam through the central hole of a corundum disk used as the top cover of the crucible. In all experiments, the highest heating rate was used, and the setpoint temperature Tburn was held constant during the holding time period tburn. Measurements were either performed at room temperature (Tmeas = RT), a selected elevated temperature (e.g., Tmeas = 100 °C), or at the burning temperature (Tmeas = Tburn). Typical laboratory conditions (RT) were 25 °C and 30%–40% relative air humidity.
In a typical in situ experiment, 10 mg gypsum powder was filled into the corundum crucible. After heating to Tburn = 120 °C with the highest possible rate of 200 K min−1, the temperature was held constant for 30 min, and Raman measurements were performed every 30 s. Analogous experiments were performed with 20 mg gypsum powder and 20-mg gypsum stone fragments.
The temperature-dependence of Raman spectra (see Section 3.2) was investigated by heating anhydrite II (burnt from 20 mg gypsum powder within tburn = 15 min) to a certain temperature and, consecutively, acquiring n = 12 spectra with 2 × 10 s acquisition time each after a holding time period of 5 min. This procedure was repeated for all temperature steps shown in Figures 3 and 4. Mean values and standard deviations—shown as error bars—were determined from each set of n = 12 spectra.
Changes of Raman spectra within the stability range of anhydrite II (see Section 3.7) were studied by heating 10 mg gypsum powder to different burning temperatures Tburn for tburn = 5 min and subsequent cooling down to the measurement temperature of Tmeas = 100 °C at which n = 12 measurements were performed at the same sample spot. This procedure was repeated for all Tburn given in Figure 20.

2.4. Reactivity Test

Aliquots of 1 g of anhydrite II samples synthesised in crucibles at different Tburn were exposed to 1 mL water at room temperature for a period of 14 days. According to stoichiometric factors, this corresponds to more than a three-fold excess of water. Samples were neither shaken nor stirred during this period. After the reaction, the products were ground and dried, and Raman micro-spectroscopy was performed on n = 16 different sample spots each.

2.5. Raman Spectroscopy

The Raman-spectroscopic measurements in this study were performed by employing a Labram HR 800 Raman microscope system from Horiba Jobin Yvon coupled with a BX41 microscope from Olympus and controlled by Horiba’s LabSpec 6 software. The system is equipped with a continuous diode-pumped solid-state laser with a wavelength of 532 nm and a power at the sample of 40 mW (in all experiments, the unattenuated power was used). A long-working-distance 50x/N.A. = 0.55 microscope objective was employed for both the excitation of the sample from the top and collection of the back-scattered light (N.A. denotes the numerical aperture). The working distance of around 1 cm enabled focusing into the crucible of the heating stage described above. A spectrometer grating having 1800 grooves per millimetre in conjunction with a liquid-N2 cooled charge-coupled device (CCD) camera (operating temperature of −130 °C) with 1024 pixels along the spectral axis provides a spectral resolution of approximately 0.45 cm−1 per CCD pixel within the range of the most prominent Raman bands of the phases in the CaSO4–H2O system of 1008 cm−1–1028 cm−1. We would like to point out that an instrument configuration enabling such high spectral resolution and adequate reproducibility of peak shapes is a prerequisite for the determination of the small changes in band widths described in this study, as discussed in more detail in Reference [23]. With the centre wavenumber 1100 cm−1, the available spectral range within one acquisition was 860–1330 cm−1. Measurements shown in Figures 4–11 and 13–20 are based on this restricted spectral range. The full spectral range is available by using the “Range” function of the instrument control software by which several individual acquisitions at different angles of the spectrometer grating with respect to the optical axis are combined to yield one single spectrum. This approach was employed for acquiring the data shown in Figures 2, 3, and 12.
The opening of a confocal pinhole in front of the spectrometer entrance slit can be optionally adjusted. It was operated in the fully opened position (diameter of 1000 µm) in most experiments and tuned to 100 µm in depth-resolved experiments (surface vs. sub-surface of gypsum stones). That way, depth resolution is estimated to improve from 40 µm to 10 µm [24]. Typical acquisition time per spectrum was 60 s in ex situ experiments (see Figures 2, 5, 12, 13, and 17–19), usually split into several accumulations (depending on the intensity with the aim of avoiding saturation effects). Time-dependent in situ measurements (see Section 2.3 above) were typically based on measurement times of 2 × 10 s per spectrum (i.e., two accumulations of 10 s acquisition time each), which enabled automated repetitions every 30 s (see Figures 6–11 and 14–16). The same acquisition time applies to the in situ measurements shown in Figures 3, 4, and 20.

2.6. Data Evaluation

Spectroscopic data was plotted and analysed by using the software Origin 2019 (OriginLab). Exact band positions and band widths (expressed as full widths at half maximum or FWHMs, respectively) were determined by fitting Lorentzian peak profiles to the experimental data, according to References [21,22,23,24]. A detailed description of the choice of appropriate fit functions for Raman bands can be found in Reference [23]. The band widths of the ν1 modes of bassanite samples (see Section 3.4, and Figures 12 and 13) were evaluated by Lorentzian peak fitting of the partially overlapped, most prominent bassanite band in each spectrum in the range of 1013 cm−1 to 1030 cm−1, i.e., the fraction of the band not affected by the neighbouring peak, as pointed out for the similarly overlapping bands of gypsum and anhydrite II in Reference [23]. The only partly overlapping anhydrite II and anhydrite III ν1 bands obtained in the range of Tburn = 300–500 °C were analysed by fitting a linear combination of two Lorentzian profiles to the data (see Figures 18 and 20). Partly overlapping ν1 modes of gypsum and anhydrite II obtained in a reactivity test were evaluated by the same method (see Figure 19). For the analysis of the in situ data of gypsum–bassanite–anhydrite III conversions, linear combinations of up to three Lorentzians were employed for fitting (see Figures 6–11).
All FWHMs in this study were corrected with respect to instrument-dependent band broadening by applying the method explained in Reference [23] and using the emission line at 576.96 nm of a mercury argon lamp as a reference.

2.7. Scanning Electron Microscopy

Electron-microscopic imaging was performed using a table-top environmental scanning electron microscope JCM-6000 Neoscope (Jeol) in low-vacuum mode (approximately 100 Pa) by employing backscattered-electron detection without prior coating of the samples.

3. Results and Discussion

3.1. Raman Spectra of the CaSO4–H2O System

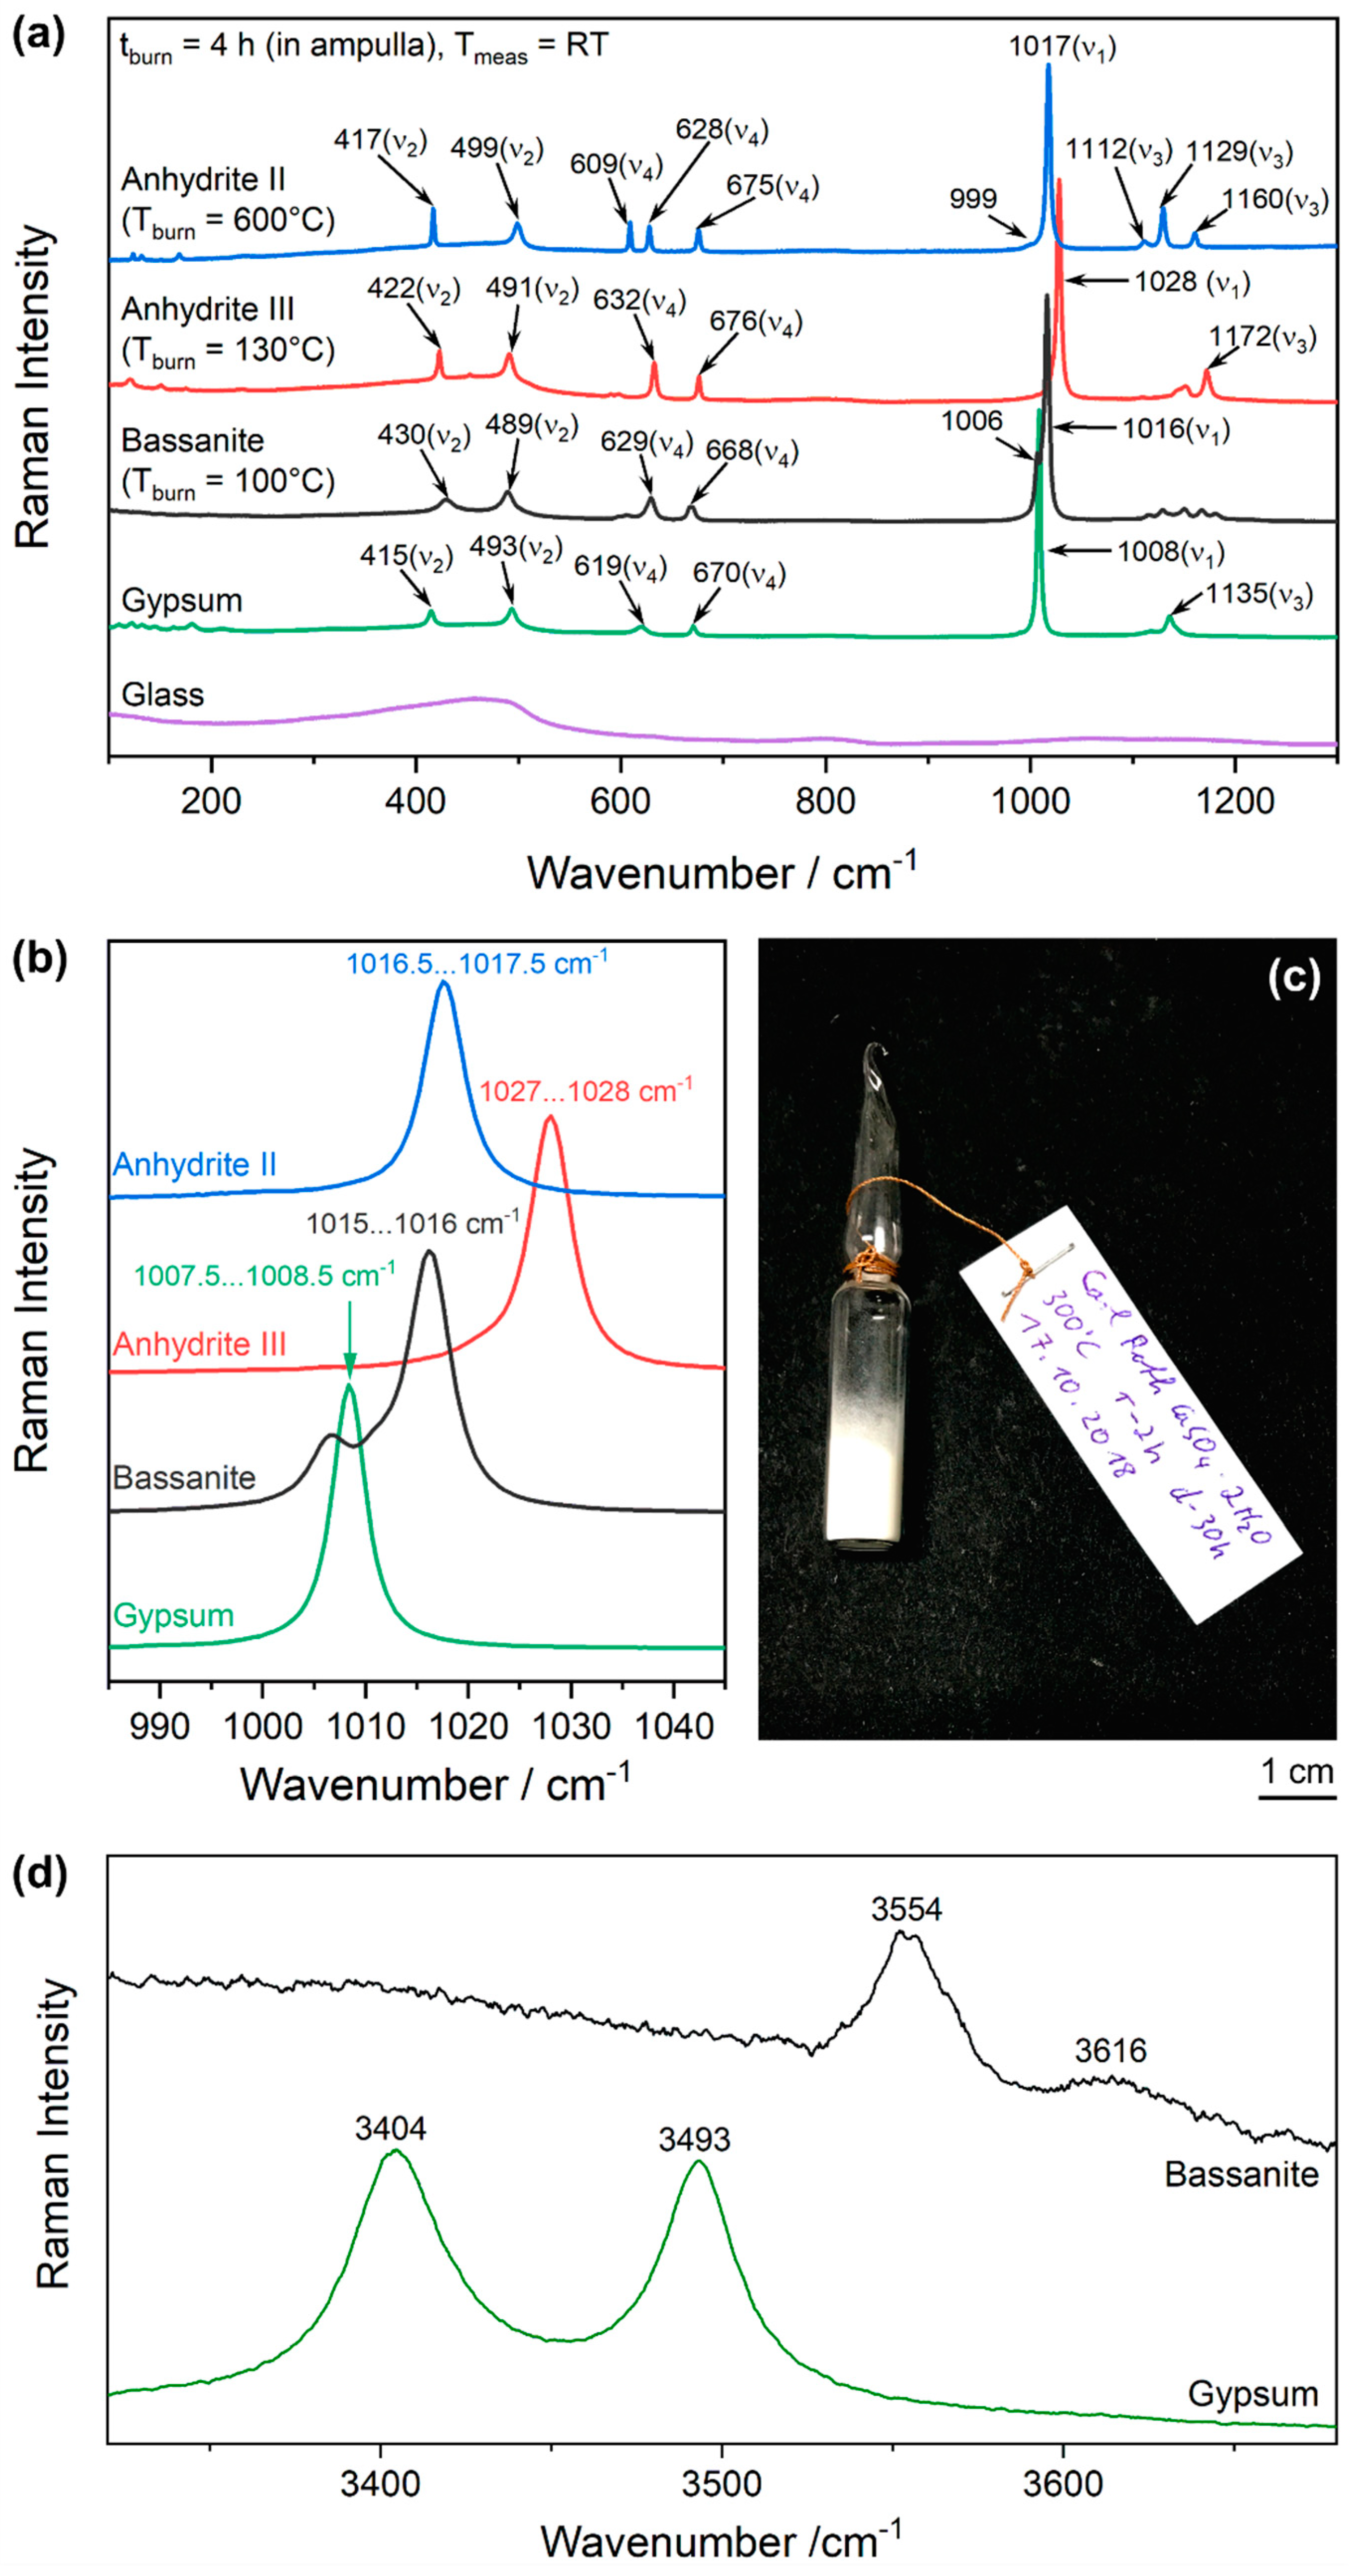
Since anhydrite I is described to be stable only at temperatures above 1180 °C, only the other four main phases of the CaSO4–H2O system are accessible for Raman spectroscopy at room temperature. The spectra of these phases are summarised in Figure 2. They were synthesised from gypsum at the burning temperatures (Tburn) given there. At room temperature, the conversion of anhydrite III into bassanite under the influence of air humidity takes only minutes (see Section 3.4 below), which makes the acquisition of Raman spectra of anhydrite III impossible. This issue was overcome by burning gypsum in open glass ampullae in a laboratory furnace and sealing them by melting the glass before cooling of the reaction products to room temperature (see Figure 2c, and the ampulla method described in Section 2.2). Since Raman measurements were conducted through the glass, we show a glass spectrum for comparison in Figure 2a.
A peak list is given in Table 1. This is not intended to be a complete collection of all (theoretically) possible Raman-active modes, but a guide including the most practically relevant and typically the strongest Raman bands. For example, the primitive unit cell of anhydrite II (CaSO4) contains two formula units, i.e., N = 12 atoms. Thus, such crystal can conduct 3N = 36 vibrations. Three vibrations are acoustic and 3(N − 1) = 33 are optical modes of which 18 are Raman active [25]. We typically observe a maximum of 15 modes in strong Raman spectra, and, depending on the actual sample material and measurement conditions, this number can easily shrink because of the challenging detection of the weak low-wavenumber modes. Detection of weak modes can be hampered by spectrally broad fluorescence emission, which, in some cases, is observed after calcination at certain temperatures [21]. Since such emission is not necessarily observed in the gypsum used as a starting material and often vanishes after calcination at higher temperatures, it is most likely due to crystal lattice defects (colour centres or F centres, respectively) appearing and healing depending on calcination [22,23]. This effect is detailed below in Section 3.7 (see Figure 20c). Furthermore, some (even the strong) modes can be suppressed by crystal-orientation effects [25].
As shown in Table 1, the Raman bands of the phases of the CaSO4–H2O system can be grouped into crystal-lattice phonons, modes assigned to the sulphate ion, and vibrations of crystal water. Crystal-lattice vibrations or phonons moving through the whole crystal, respectively, which are also termed external modes, are motions of Ca2+ against SO42− ions. They appear at <300 cm−1 and are typically weak and easily overwhelmed by fluorescence emission from the sample, which was most challenging in measurements of all bassanite samples included in this study.
The sulphate ion in a solvated state consists of N = 5 atoms arranged in tetrahedral (Td) symmetry. Thus, it has 3N = 15 degrees of freedom of which three are translations of the whole SO42− ion and three are rotations. The remaining 3N − 6 = 9 modes are vibrations. In Td symmetry, they are distributed as follows: one (non-degenerated) symmetric stretch vibration ν1, two degenerated symmetric bending vibrations ν2, three degenerated antisymmetric stretch vibrations ν3, and three degenerated anti-symmetric bending vibrations ν4 (notation according to Reference [26]). Due to degeneration, in aqueous solution, only four Raman bands of sulphate ions can be observed. When integrated into crystal lattices, the tetrahedra are distorted (e.g., to C2h symmetry in gypsum [27] and D2h in anhydrite II [25]), and the crystal field leads to changes of energy levels and (partial) breaking of degeneracies. A more simplistic explanation is that orientations in space of the same vibration cannot be distinguished in case of freely moveable ions in solution but can play a role for ions implemented into a crystal lattice. Therefore, Table 1 shows the four frequencies of free sulphate ions in solution compared to the split-up modes observed in the crystalline compounds. The νn nomenclature is also applied to the latter, internal modes of gypsum, bassanite, anhydrite III, and anhydrite II.
In practice, the ν1 mode, both ν2 bands, and two or three ν3 and ν4 modes, respectively, are typically observed. Some modes can be missing either due to crystal orientation effects or merging of neighbouring bands. The symmetric stretch vibration ν1 of the sulphate ion is the most prominent mode in all spectra and indicative of the phase within the CaSO4–H2O system, as shown in Figure 2b, which also includes typical ranges of observed wavenumbers, considering variations within one cm−1 from sample to sample due to variations of stress and strain.
The Raman spectra of the crystal-water-containing phases gypsum and bassanite are completed by the OH stretch modes of water of which the lower wavenumber is assigned to the symmetric and the higher wavenumber to the antisymmetric stretch vibration (Figure 2d).
In the 1970s, Brian J. Berenblut et al. published comprehensive studies on the Raman spectra of gypsum and anhydrite II, including theoretical predictions and experimental proof (involving different crystal orientations) of all bands of these compounds [25,27]. Later research focused on excerpts of the spectra, mainly around the most prominent bands enabling phase identification [28,29,30,31]. Especially, complete spectra of bassanite and anhydrite III including low-wavenumber lattice phonons have been missing so far [32,33]. Therefore, Table 1 gives the most complete list of wavenumbers of these phases, even though we do not lay any claim to completeness.
An interesting observation is the 1006-cm−1 band overlapping with the most prominent mode of bassanite at 1016 cm−1, which, at first look, seems to be a shifted ν1 band of gypsum. In fact, Prasad [29] observed a typical temperature-induced downshift of the gypsum ν1 mode during heating, but also saw that, after conversion into bassanite and cooling to room temperature, a seeming gypsum band remained at 1006 cm−1, i.e., shifted from the normal room-temperature wavenumber of 1008 cm−1. Based on this observation, the band at 1006 cm−1 was assigned to gypsum in a “disordered form” [28] or a “different structural environment” [29], which seems reasonable. We confirm this experimental observation of a steady downshift in Section 3.3 below. Having the full spectrum of bassanite available, we come to a different hypothesis. If this mode would be due to gypsum, shifted bands would be expected in other parts of the spectrum as well. For example, additional sulphate bending and water stretching modes at the according (or slightly shifted) wavenumbers of gypsum would be expected to appear in the bassanite spectrum, which is not the case. Contrarily, we observe the same number of water and sulphate bending modes as in the other spectra of the CaSO4–H2O system, while a higher number of sulphate stretching bands appears. There is a doubling of the ν1 and an almost doubling of the ν3 modes, as we observe five bands in the range of the latter. In case of a different (e.g., a gypsum-like) type of sulphate ions in the structure, we would expect such doubling for all bands. Our hypothesis is that this is rather due to a splitting of modes because of coupled vibrations than due to sulphate ions in different structural environments.
The CaSO4–H2O system includes the case of two phases with almost the same structure, mainly distinct by the absence (anhydrite III) or presence of crystal water (bassanite). Thus, the differences in their spectra is mostly due to the implementation of water molecules into channels in their structures (see bassanite and anhydrite III in Figure 1). The general downshift of wavenumbers in the conversion of anhydrite III to bassanite can be explained by the strong influence of hydrogen bonding, which leads to weakening of bonds within the sulphate ions, and thus, to lower vibrational frequencies. The observed band splitting is most likely induced by the integration of water molecules into the structure because it is not observed in the spectrum of anhydrite III. According to Figure 1, each water channel is surrounded by six Ca2+–SO42− chains. Stretch vibrations of the sulphate ions interfere with the water molecules, and differences in force constants can be hypothesised for the symmetric and antisymmetric vibrations of two opposite sulphate ions (each of both performing a symmetric ν1 stretch motion), while much less influence on vibrational frequencies is expected in case of the bending vibrational motions. Further experimental and theoretical work is needed to fully understand this peak splitting, but, at this point, we can conclude that the 1006-cm−1 band has to be treated as an intrinsic bassanite mode and not be assigned to gypsum or another type of sulphate. For that reason, Table 1 lists 1016 cm−1 as the most prominent band of bassanite with the shoulder at 1006 cm−1 in parentheses. We show below, in Section 3.3, Section 3.4, and Section 3.5, that the shoulder is present in all spectra of bassanite, independent of the route of its synthesis.
In strong anhydrite II spectra, a shoulder of the ν1 (Ag) band at 999 cm−1–1000 cm−1 can be observed (compare Reference [21]). This might be a weak contribution from the infrared-active Au mode, which is similarly described for gypsum [27]. The same assignment may be hypothesised for the weak bands present at 599 cm−1/606 cm−1 and 590 cm−1/599 cm−1 in spectra of bassanite and anhydrite III, respectively, whose origins remain unclear.

3.2. Temperature Dependence of Raman Spectra

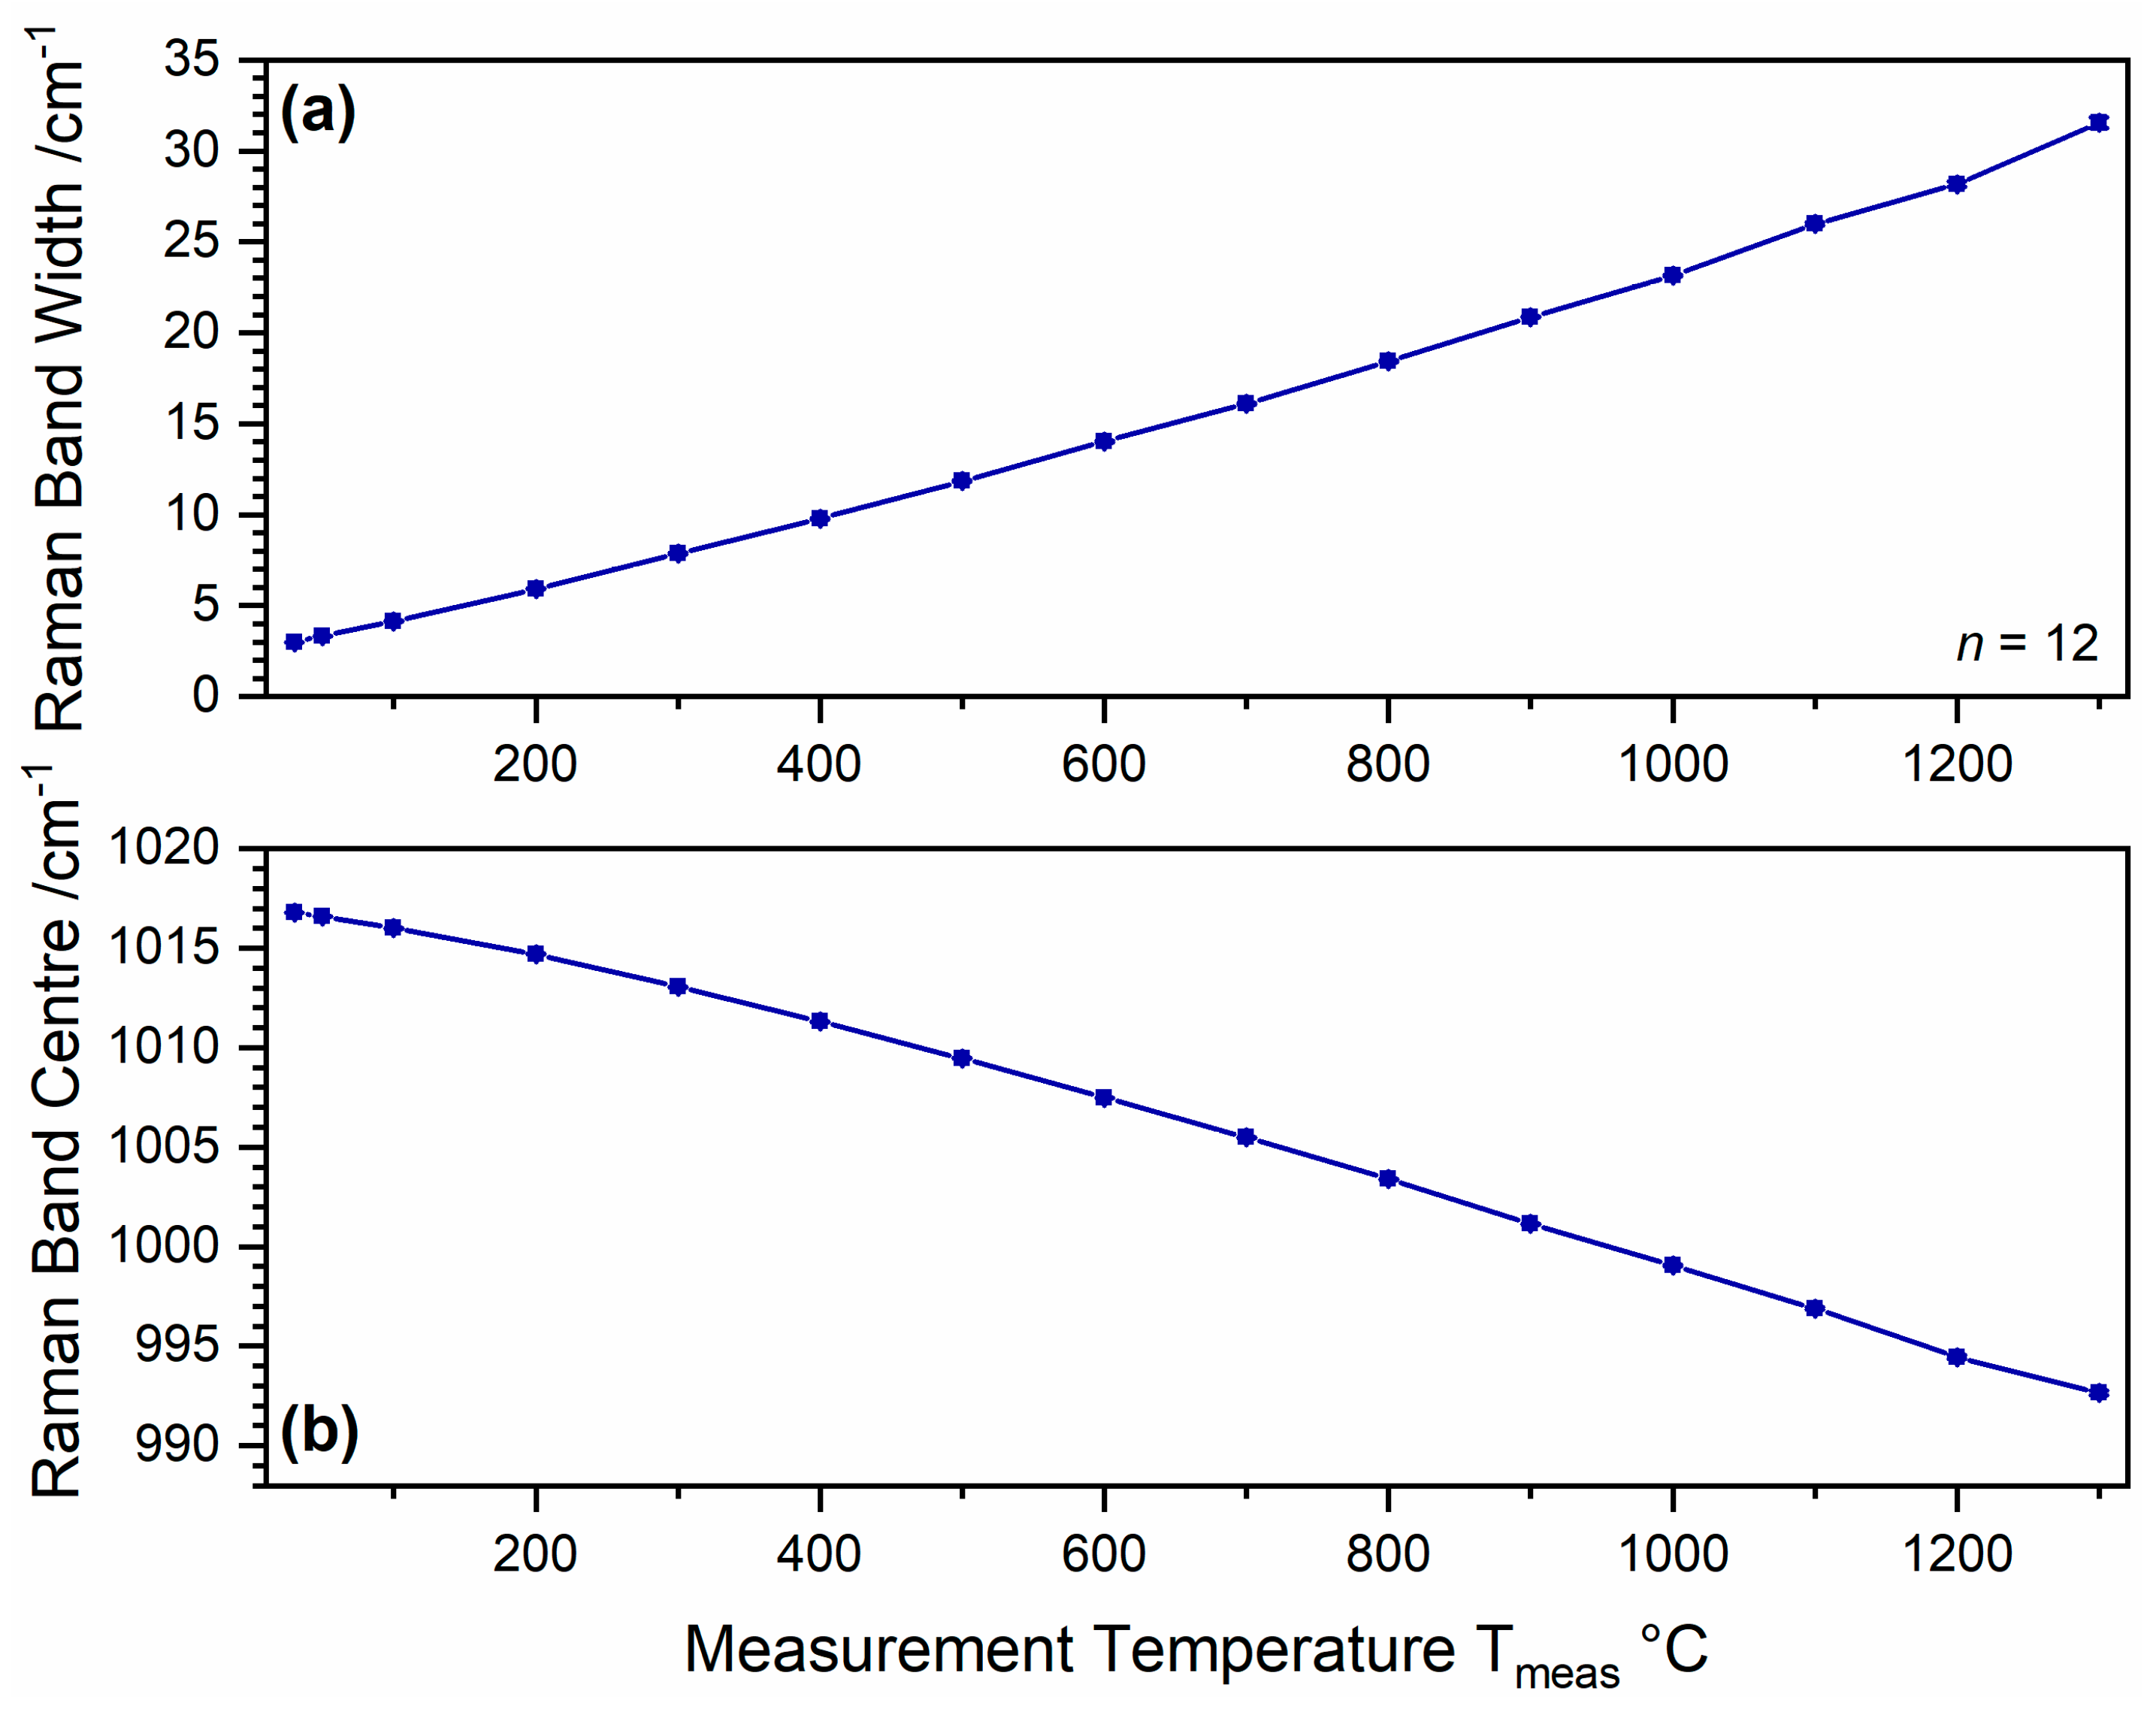
The influence of the measurement temperature on Raman spectra is well known [34,35]. This is shown for the CaSO4–H2O system in Figure 3 by using anhydrite II as an example (see Section 2.3 for experimental details). This phase was chosen because of its wide stability range including room temperature up to approximately 1200 °C. The spectra undergo significant changes, which include the overlap of neighbouring bands due to their shift and broadening. Furthermore, in situ measurements at temperatures exceeding 900 °C are complicated by the raise of a sloped baseline due to interfering heat radiation [35] or, in other words, the acquisition of the continuous spectrum of visible light emitted by the glowing crucible. Therefore, at temperatures above 1200 °C, only shifted and widened versions of the two most intense ν1 and ν2 bands are accessible for investigation. As shown in Figure 4, the most prominent ν1 band undergoes a continuous increase of band width (expressed as full width at half maximum, FWHM), which is accompanied by a downshift of approximately 25 cm−1 in the temperature range of 30 °C to 1300 °C.
These observations make it clear that band positions and band widths from different measurements can only be reasonably compared when acquired at the same measurement temperature. Figure 4 helps us better understand the different values of peak widths and positions that we present below, if determined at different temperatures. For example, due to the instability of anhydrite III at room temperature in ambient air, some spectra were measured at Tmeas = 100 °C. The change of the ν1 band of anhydrite II is a guideline for the order in which such changes are expected to occur in other compounds. The position of this band shifts from 1016.8 cm−1 to 1016 cm−1 for a temperature increase from 30 °C to 100 °C, and it widens from approximately 3.0 cm−1 to 4.1 cm−1 (FWHM).

3.3. Gypsum–Bassanite–Anhydrite III Conversion Reactions

Dehydration of gypsum at elevated temperatures below 200 °C yields bassanite and anhydrite III. Since these phases are difficult to discriminate in XRD [31,36,37,38], some previous studies on the dehydration reaction of gypsum rely on Raman spectroscopy and make use of the clearly different Raman shifts of the ν1 bands, as shown in Figure 2b [28,29,30,31,39,40,41]. Nevertheless, some of the studies yield contradictive results, which range from the formation of gypsum, bassanite, and anhydrite III at increasing burning temperatures [31,39] to the direct formation of anhydrite III out of gypsum, which is followed by conversion into bassanite upon cooling in ambient air with air humidity acting as a reactant [29,30,34]. In the present, more detailed study involving both ex situ and in situ experiments, we investigated further factors such as the burning time and the comminution of the raw material and performed mechanistic investigations to better understand these conversion reactions and to find reasons for such seemingly contradictive observations.
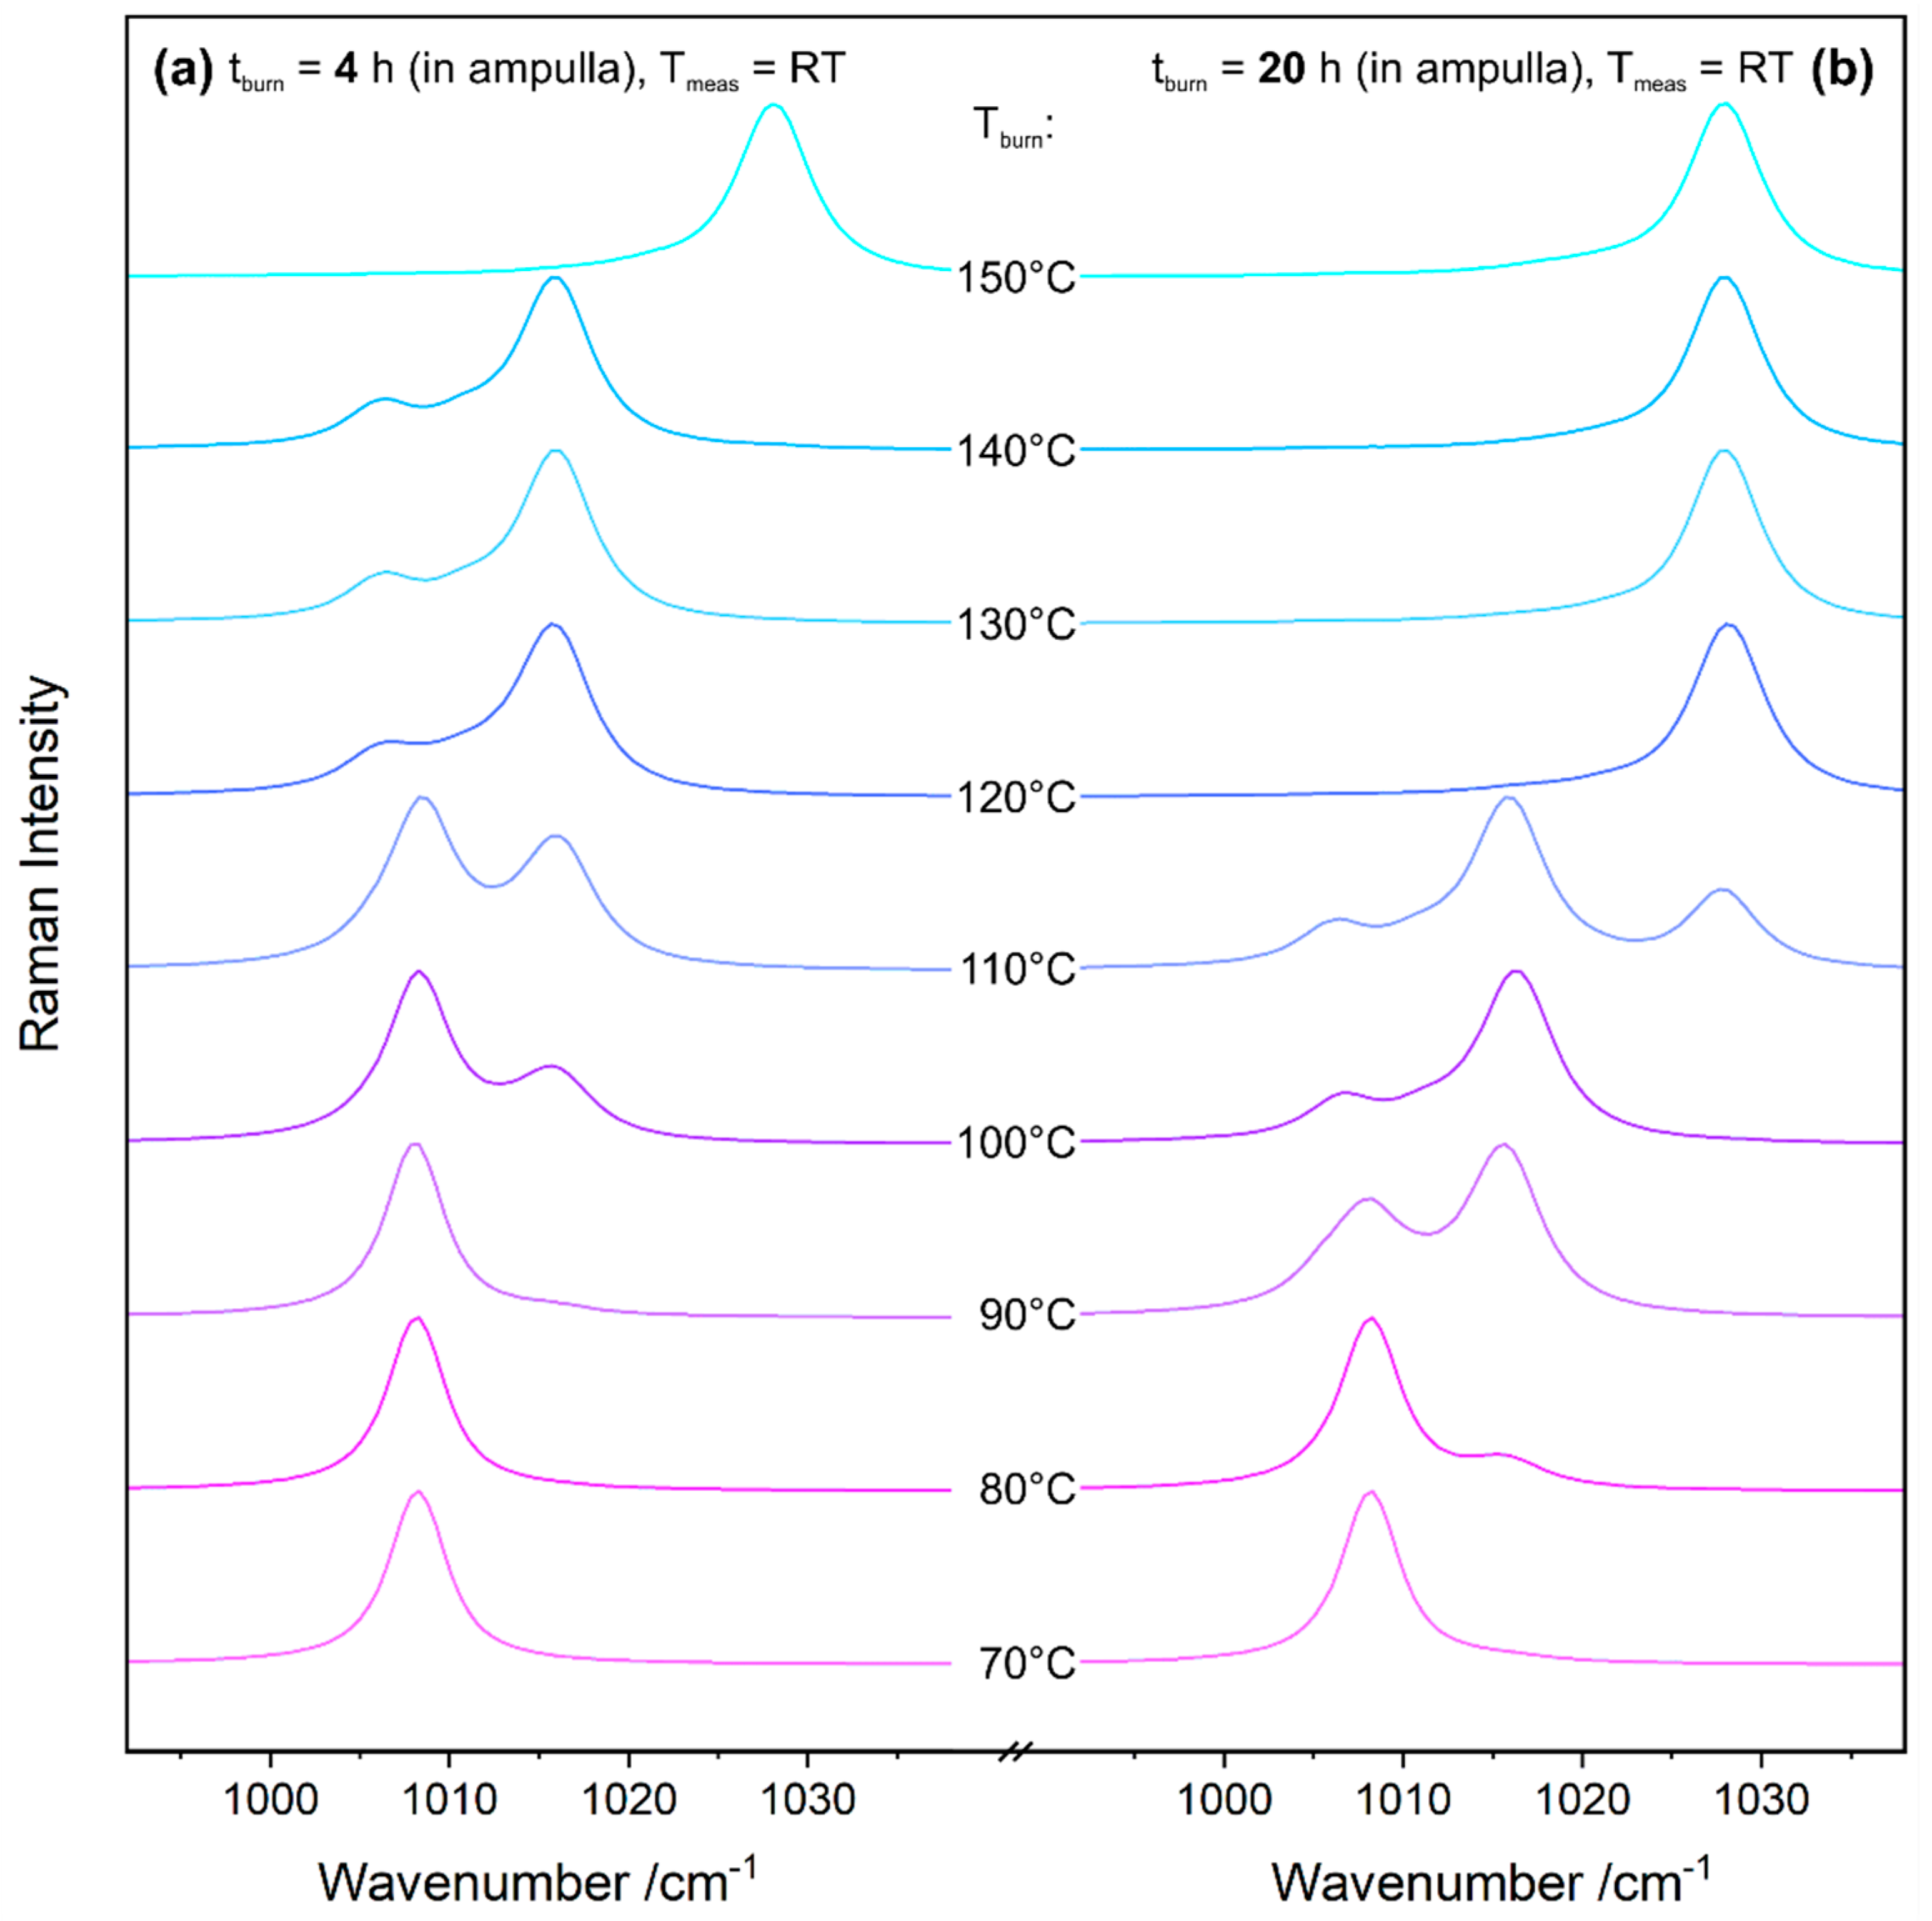
Figure 5 reveals the results of gypsum burning experiments in a laboratory furnace conducted with different holding times tburn of either 4 h or 20 h, according to the ampulla method described in Section 2.2. The spectral range shown in Figure 5 contains the most prominent ν1 modes of gypsum, bassanite, and anhydrite III at approximately 1008 cm−1, 1016 cm−1, and 1028 cm−1, respectively. The data easily enables the monitoring of the conversion of gypsum into bassanite and anhydrite III. For both burning durations, these transitions occur in this order.
Of special interest in Figure 5 are the differences of the results depending on holding time tburn. While a clear bassanite signal is seen from 100 °C upwards (and a weak shoulder from 90 °C) at 4 h burning time, bassanite is already present at 80 °C if gypsum is calcinated for 20 h. The differences are even more distinct regarding the formation of anhydrite III, which starts (due to a seemingly immediate depletion of bassanite) at 150 °C with tburn = 4 h, while already present in a mixture with bassanite at 110 °C with tburn = 20 h. Calcination time has a significant influence on the product composition. Thus, in situ measurements for studying reaction kinetics in detail were performed.
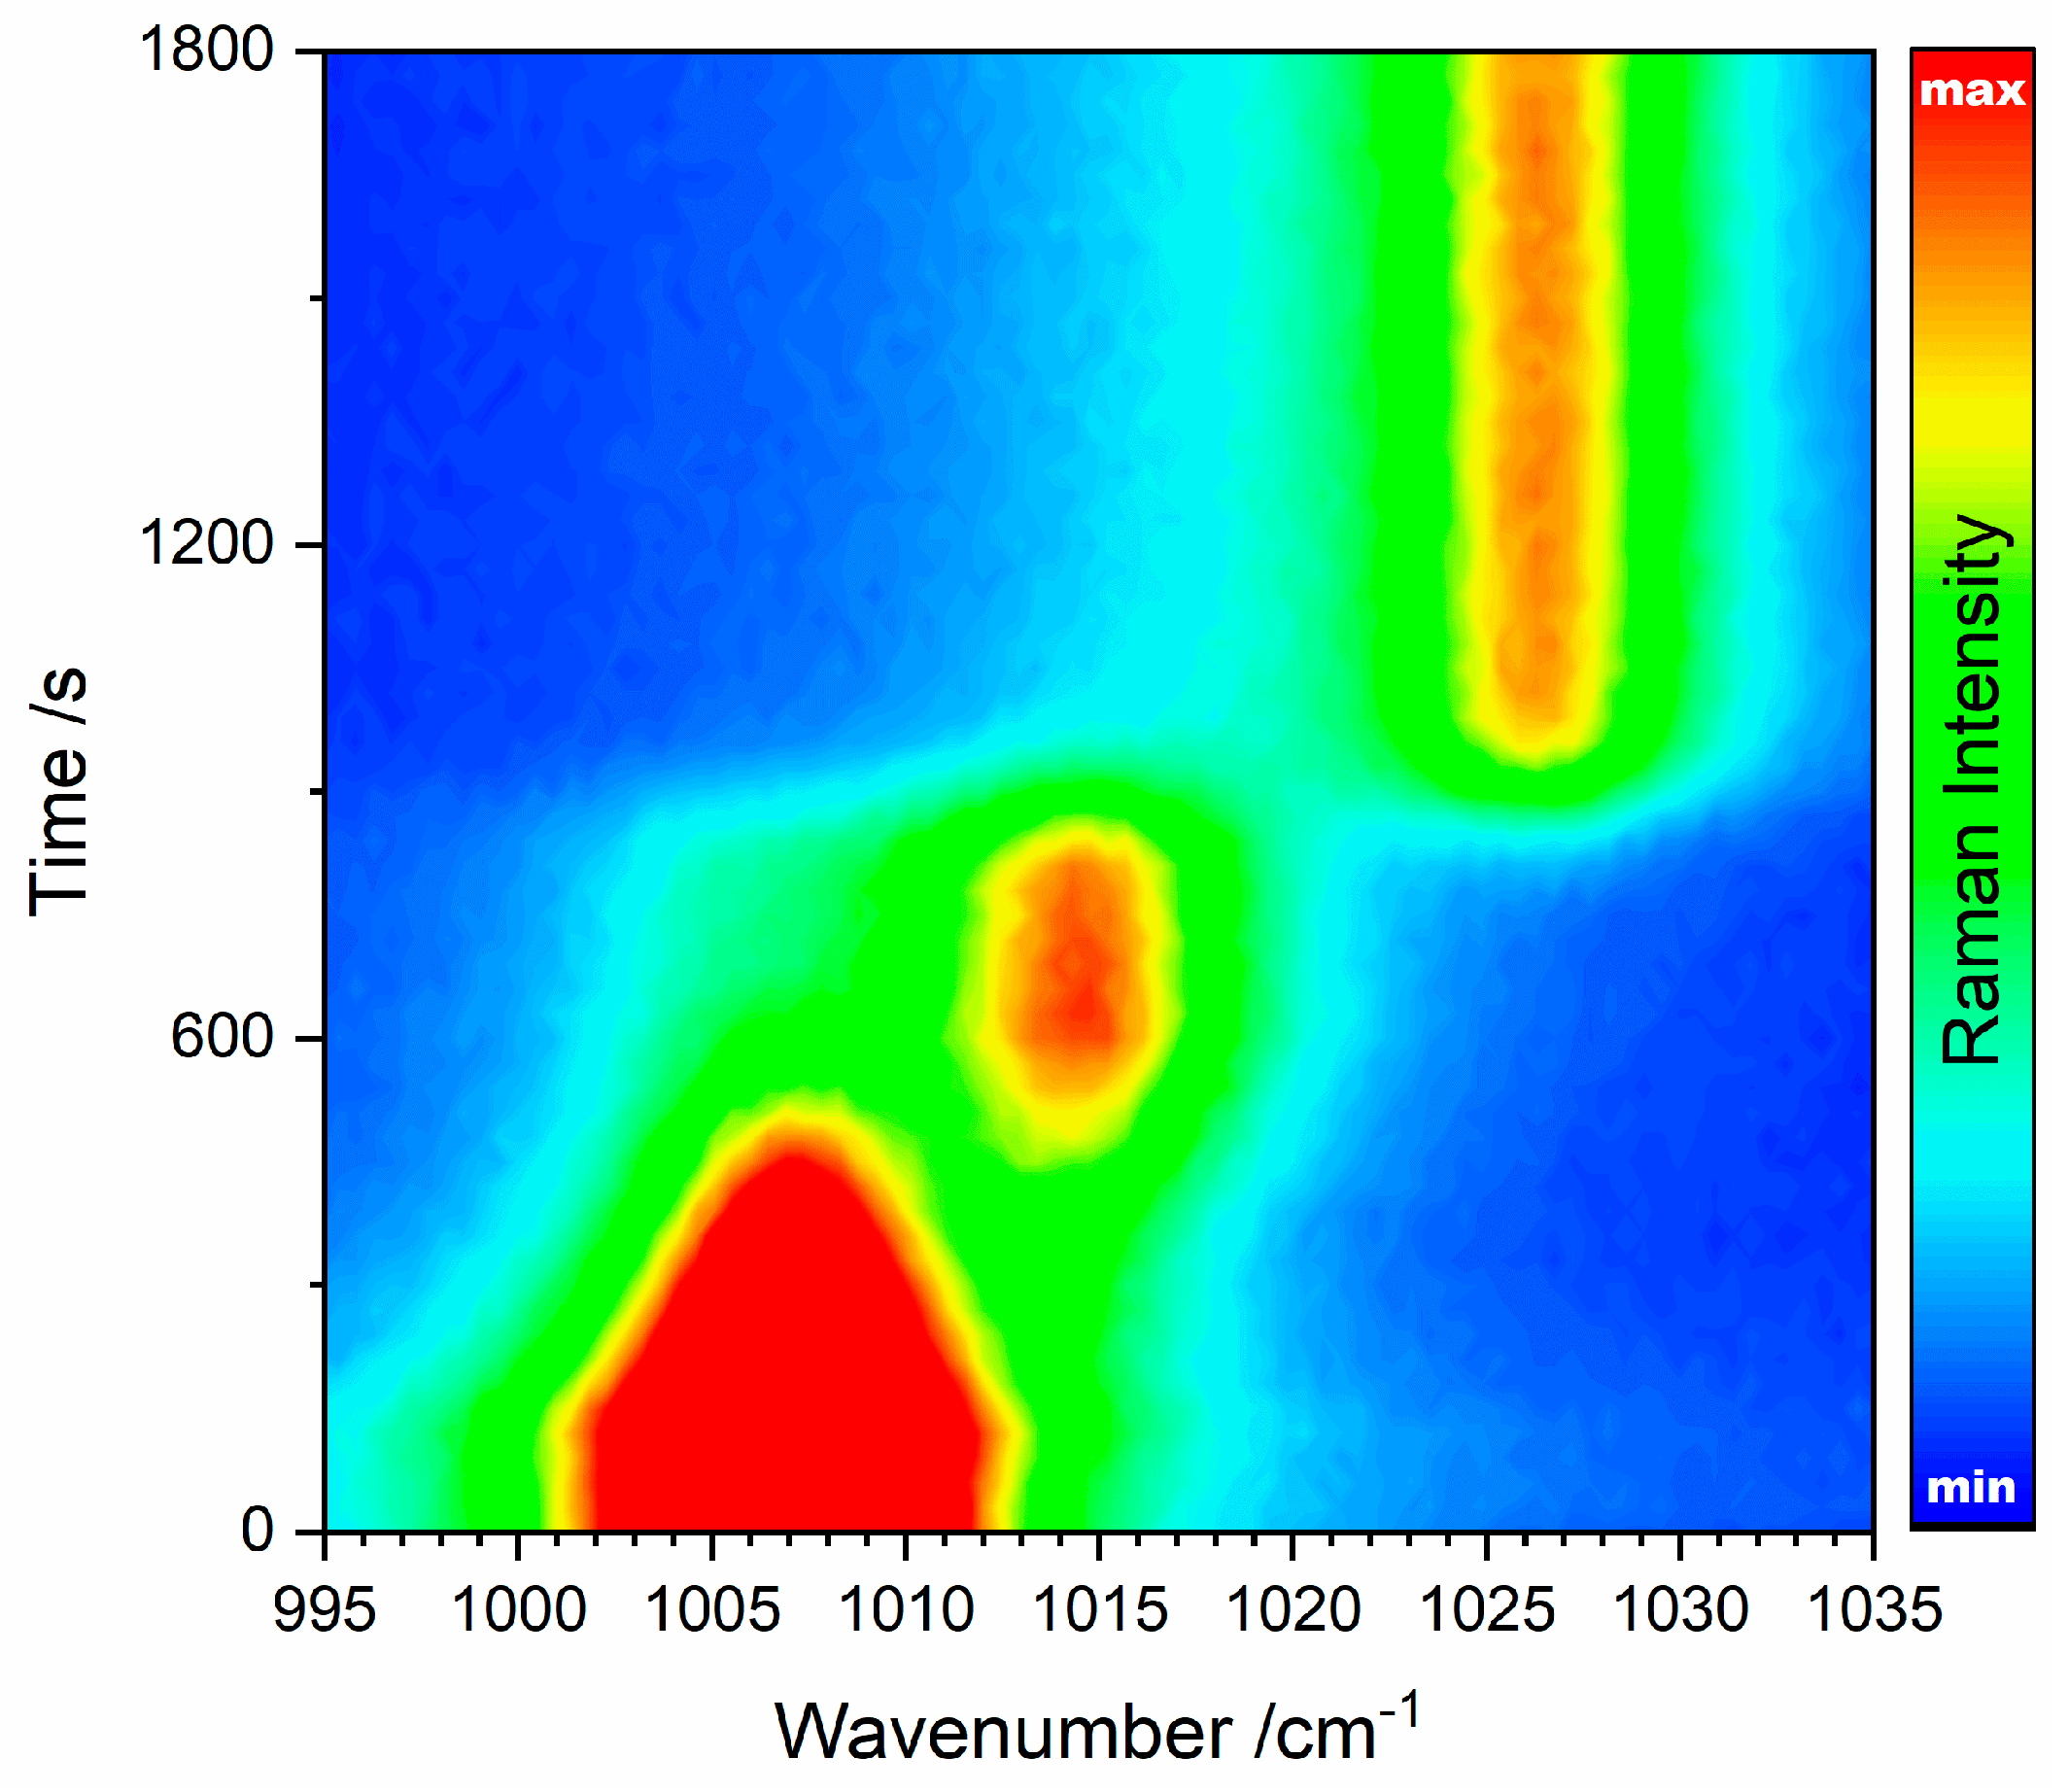
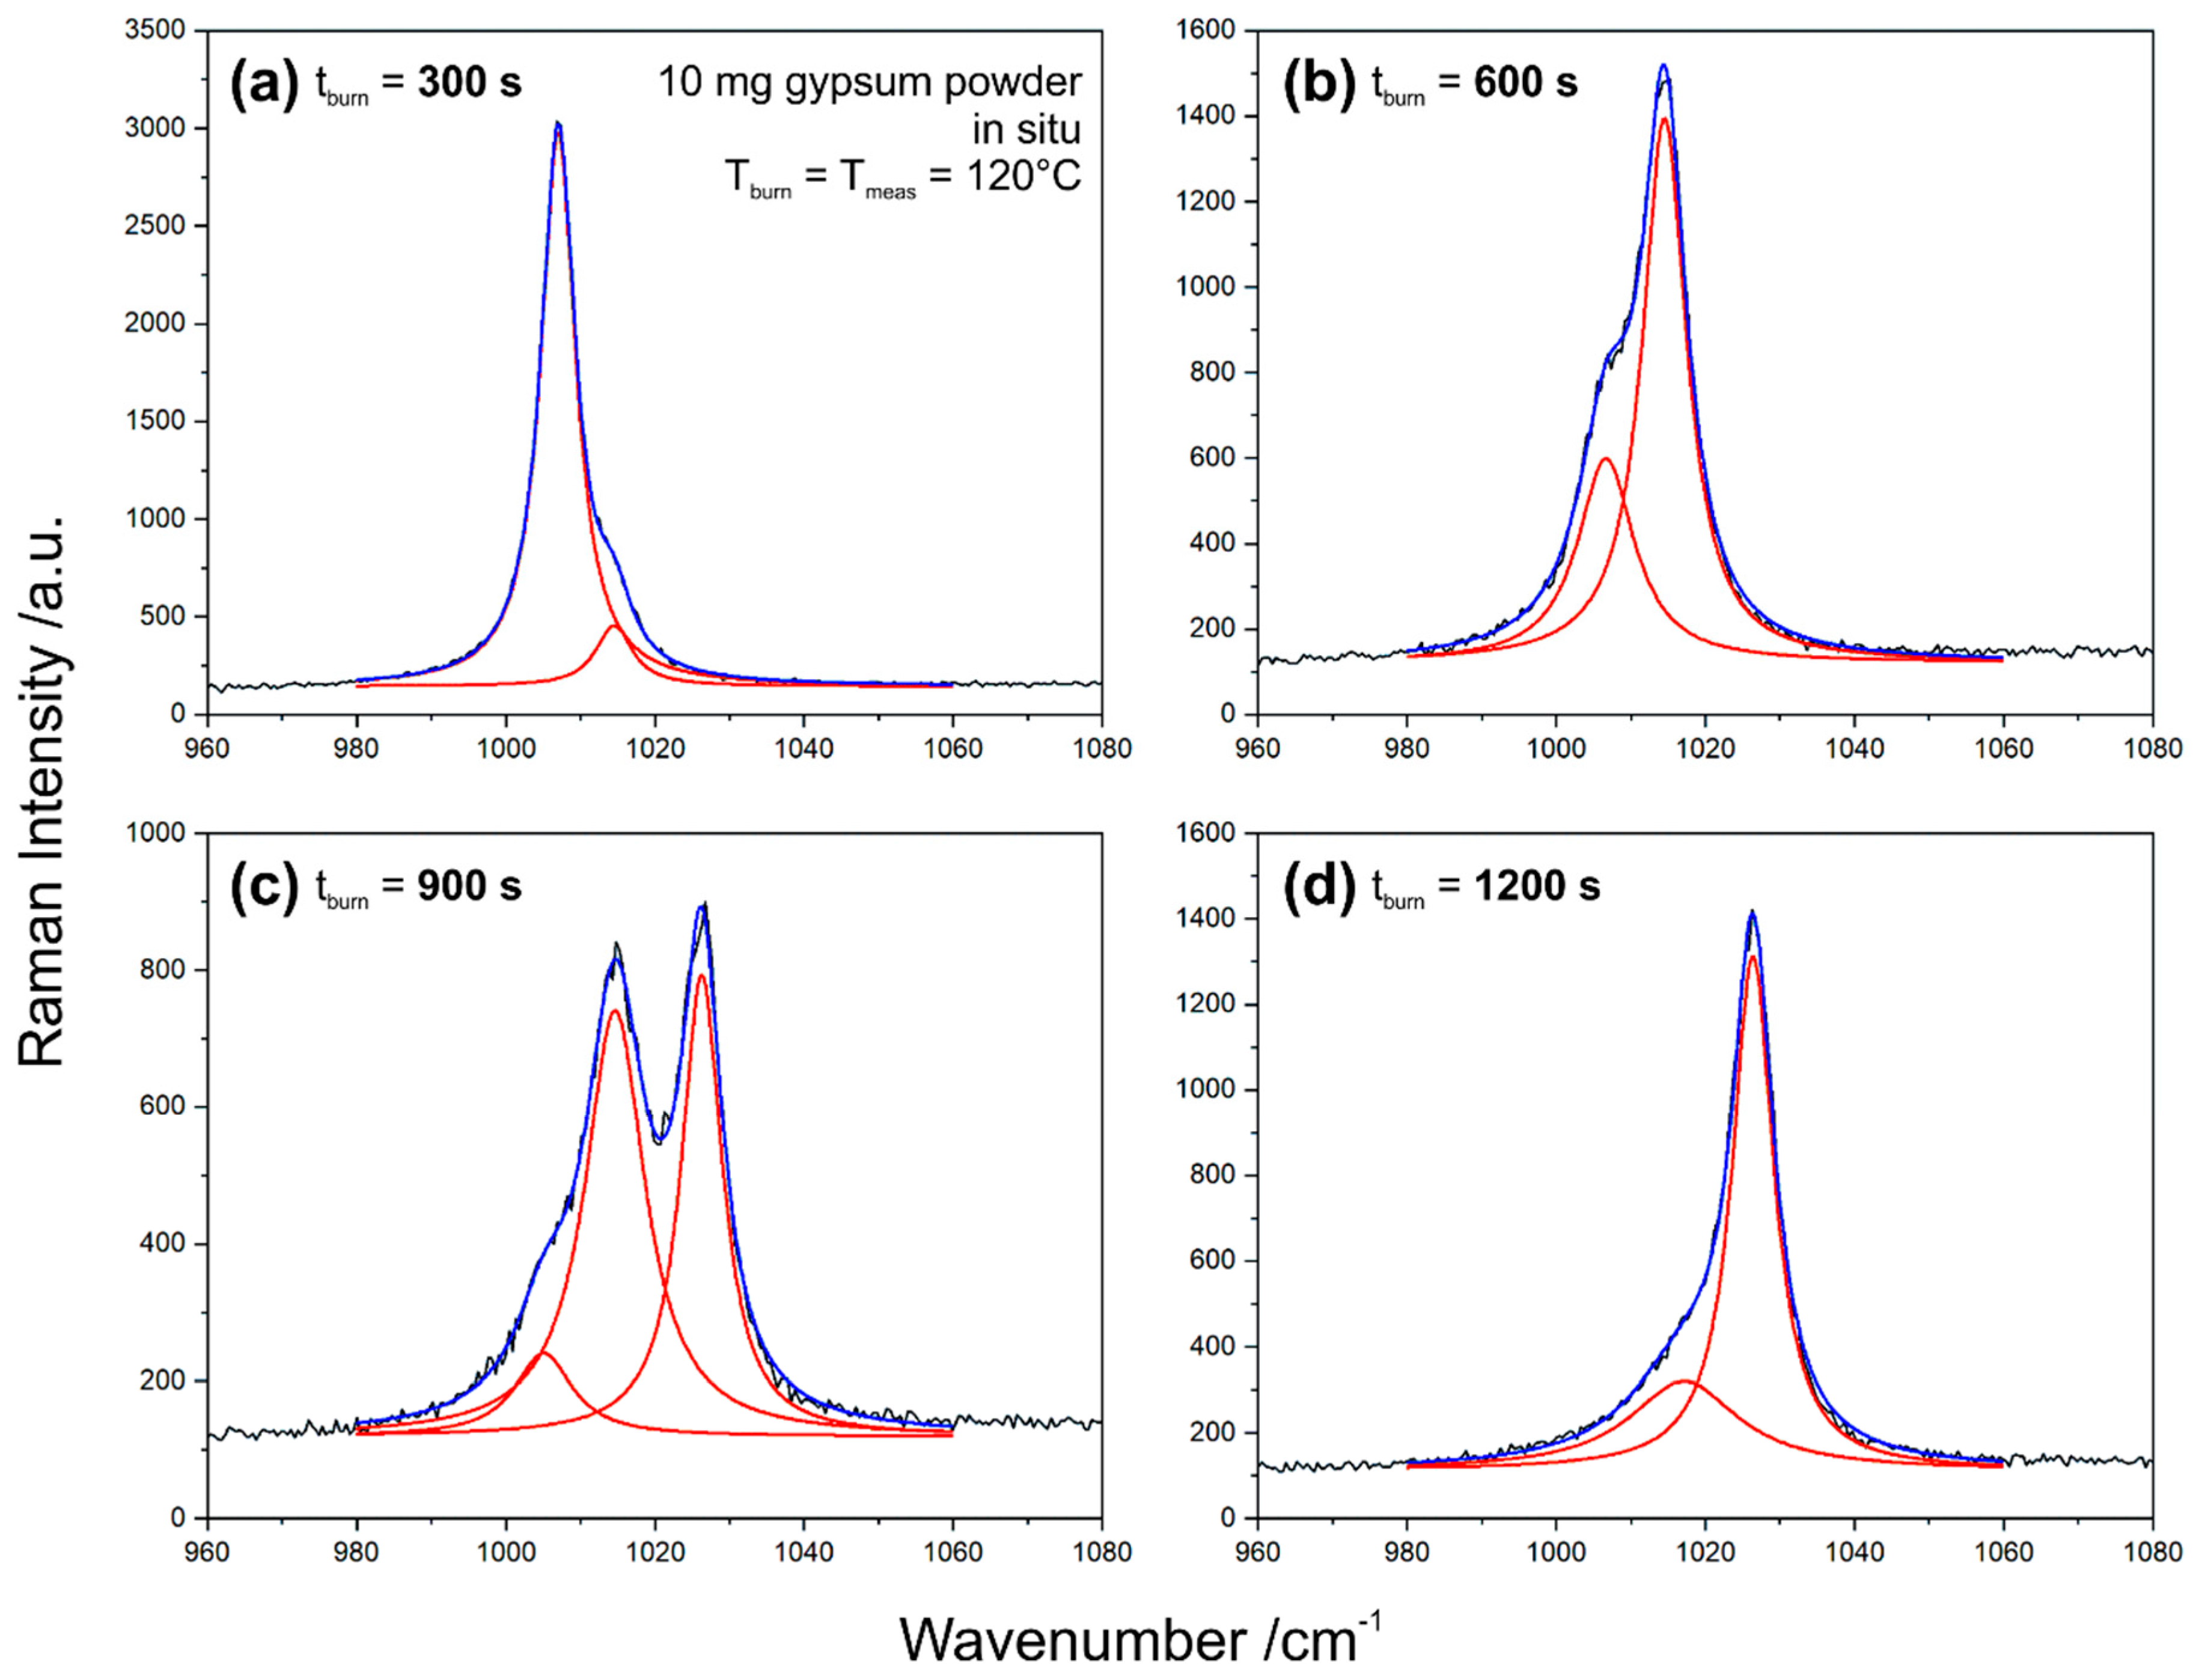
Figure 6 shows all in situ Raman spectra acquired during calcination of 10 mg gypsum powder (see Section 2.3 for experimental details) with the wavenumber axis and time scale as two dimensions and the Raman intensity as third dimension represented by colours. The conversion of gypsum via bassanite into anhydrite III can be qualitatively monitored. Quantitative data can be extracted from the spectra by (multiple) peak fitting. Figure 7 exemplifies the data analysis based on selected spectra from this set. Depending on burning time, the range including the ν1 modes can be described by one, or a linear combination of two or three Lorentzian profiles.
From the fit functions, properties such as the peak areas and positions can be derived. In this case, the focus is on areas with the aim of turning the qualitative data in Figure 6 into semi-quantitative information by enabling insights into reaction kinetics. In order to yield semi-quantitative results, the individual band areas assigned to the three phases were converted into relative Raman intensities, expressed as a percentage, according to the equation below.
Irel(i) = 100% × A(i)/Σi(A(i)),
where Irel(i) is the relative Raman intensity of phase i, A(i) is the peak area assigned to phase i, and Σi(A(i)) is the sum of all peak areas. We would like to point out that this is not an exact quantification in mole percent, as we do not consider the (presumably different) Raman activities of the involved phases. Independent from the amount of a substance, Raman intensities can also change due to the crystal orientation [42] and other effects. In fact, Prasad [29] describes a continuous decrease of the gypsum ν1 band intensity due to structural disorder preceding dehydration. We also observed a weakening of the gypsum peak during the first phase of such experiments with only the gypsum ν1 present in the spectra. Because of the reproducibility of the effect, it can surely not only be explained by the rearrangement of the powder inside the measurement cell (thus, partly moving out of the laser focus) because of air convection. The semi-quantitative data given in Figure 8a starts when two ν1 modes, assigned to gypsum and basanite, can be detected simultaneously and, thus, Equation (1) yields percentages other than the trivial values of 0 or 100%.
During calcination of 10 mg gypsum, 240 s after reaching the Tburn of 120 °C, the bassanite peak becomes strong enough for the described spectra analysis (compare Figure 7a). The amount of gypsum decreases while bassanite is formed, which both reach approximately equal Raman intensities after 510 s. Anhydrite III formation starts at 780 s, and the bassanite concentration decreases. Both peaks reach equal intensities between 900 s and 930 s, which is followed by an asymptotic approach to the chemical equilibrium at these conditions. Note that bassanite is not fully consumed during this reaction. Instead, it reaches its equilibrium concentration at the given temperature. For a rough comparison of reaction rates, we have a look at the (linear) slopes of curves at the intersection points of equal relative Raman intensities. The approximated rate of bassanite formation is 0.22% s−1, while anhydrite III is formed within 0.41% s−1. These numbers are consistent with a look at the graphs: The conversion of gypsum into bassanite is slower than the reaction of bassanite into anhydrite III. An explanation might be that only little structural rearrangement is needed in the second reaction, while the water molecules simply leave bassanite through channels (see Figure 1).
As shown in Figure 2, the most prominent bassanite band has a shoulder toward lower wavenumbers. Note that, due to the elevated measurement temperature of 120 °C, all bands appear downshifted with respect to the room temperature data shown in Figure 2. Thus, the shoulder appears at approximately 1005 cm−1 instead of 1006 cm−1. The downshift of the gypsum ν1 mode during dehydration as a function of temperature and its downshifted position at 1006 cm−1 even after cooling the resulting bassanite to room temperature were previously observed [29]. We see a gradual downshift also at a constant temperature of Tburn = 120 °C during gypsum–bassanite conversion (see blue-green dotted line in Figure 8b), which ends in the position of the bassanite shoulder at 1005 cm−1. According to the interpretation given in Section 3.1, this is the result of two parallel effects: The decrease of gypsum band intensity and simultaneous increase of the strongly overlapping bassanite shoulder leads to a seemingly shifting signal. The relative Raman intensity in the range of the gypsum ν1 mode (1008 cm−1 at room temperature) and the bassanite shoulder (1006 cm−1 at room temperature) is disregarded in the data analysis from the point when the bassanite ν1 becomes stronger than the gypsum ν1 mode. From this point, bassanite and gypsum cannot be unambiguously distinguished due to strongly overlapping bands, and quantifications start again at the beginning of anhydrite III formation. It is unclear whether the upshift of the bassanite peak at low concentrations in the presence of anhydrite III is a real effect (which, due to the instability of anhydrite III, is difficult to study at room temperature) or at least partly related to the mathematical deconvolution of this weak and strongly overlapping band from the anhydrite III band (see Figure 7d).
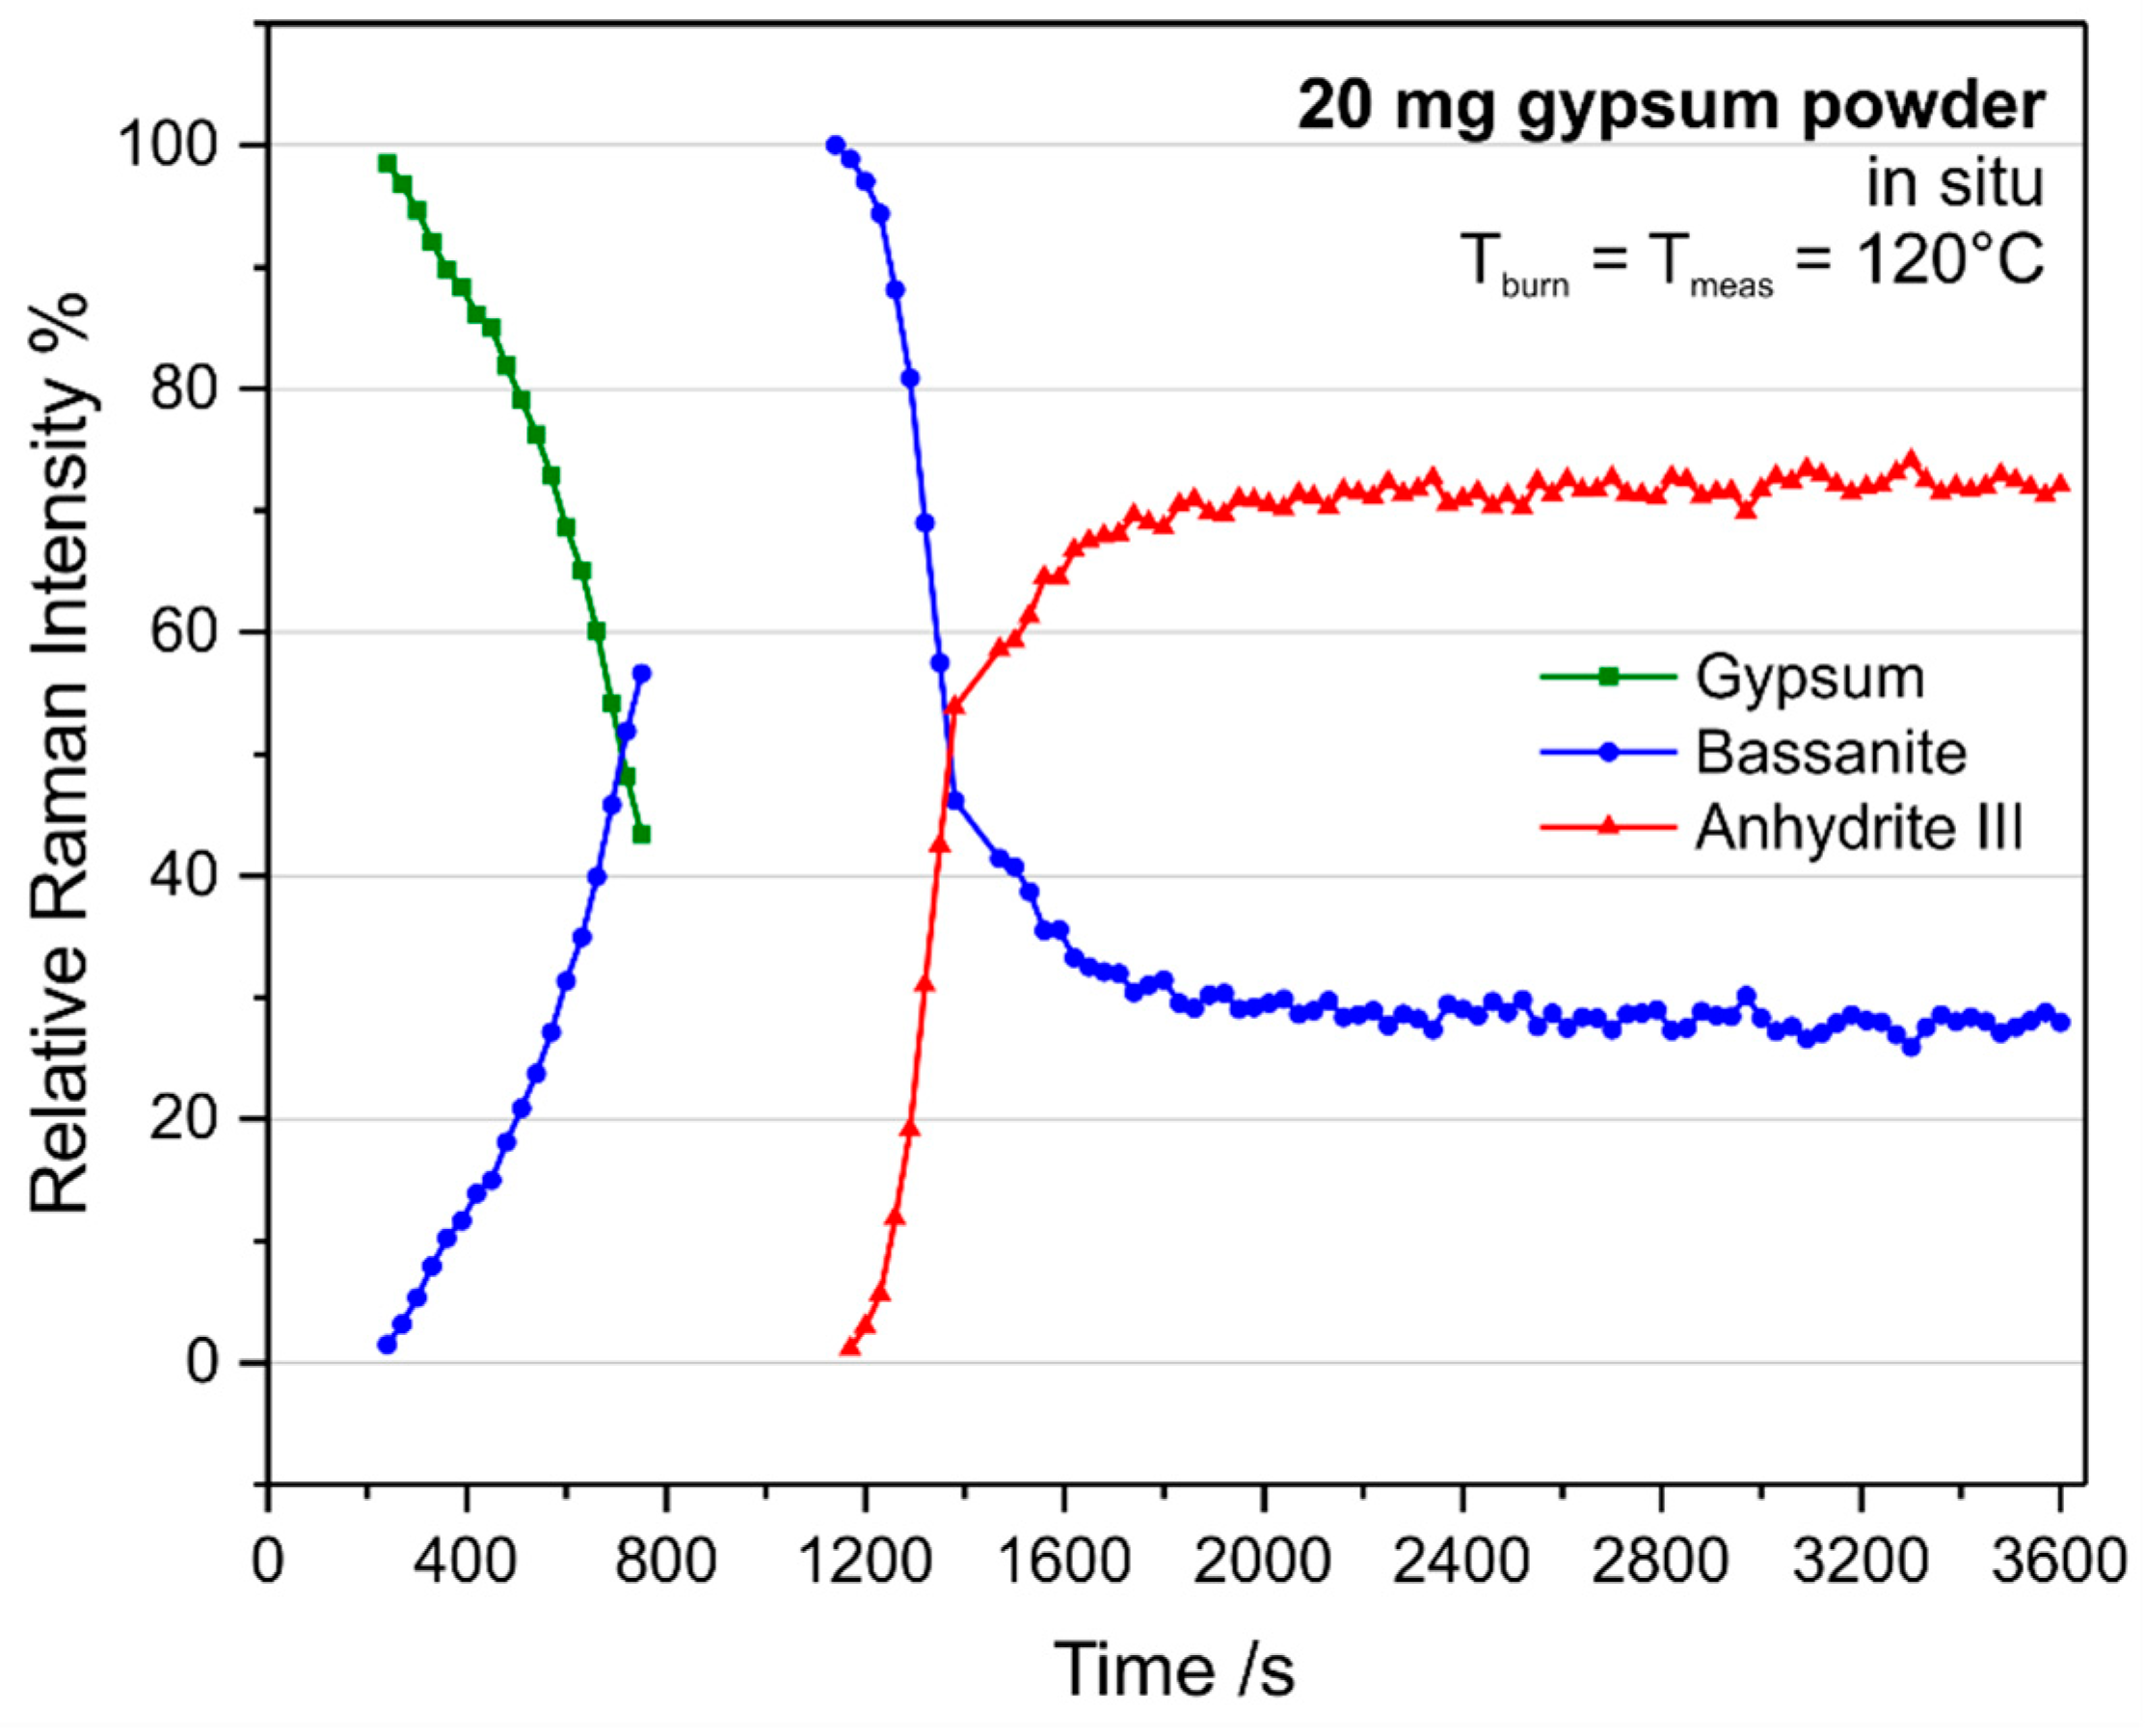
If the experiment is repeated with 20 mg instead of 10 mg gypsum powder as starting material, the measurements result in a different picture (see Figure 9). Note that the time scale in Figure 9 covers 1 h instead of 0.5 h in Figure 8. Similar to the first experiment, bassanite can be detected from 240 s after reaching the setpoint temperature of 120 °C, but it takes until 720 s to achieve the same gypsum and bassanite band intensities, which is a difference of 210 s compared to the 10-mg experiment. In the following transition of bassanite to anhydrite III, equal band intensities are reached at approximately 1380 s (780 s during 10-mg experiment). All times approximately double if twice the amount of starting material is used.
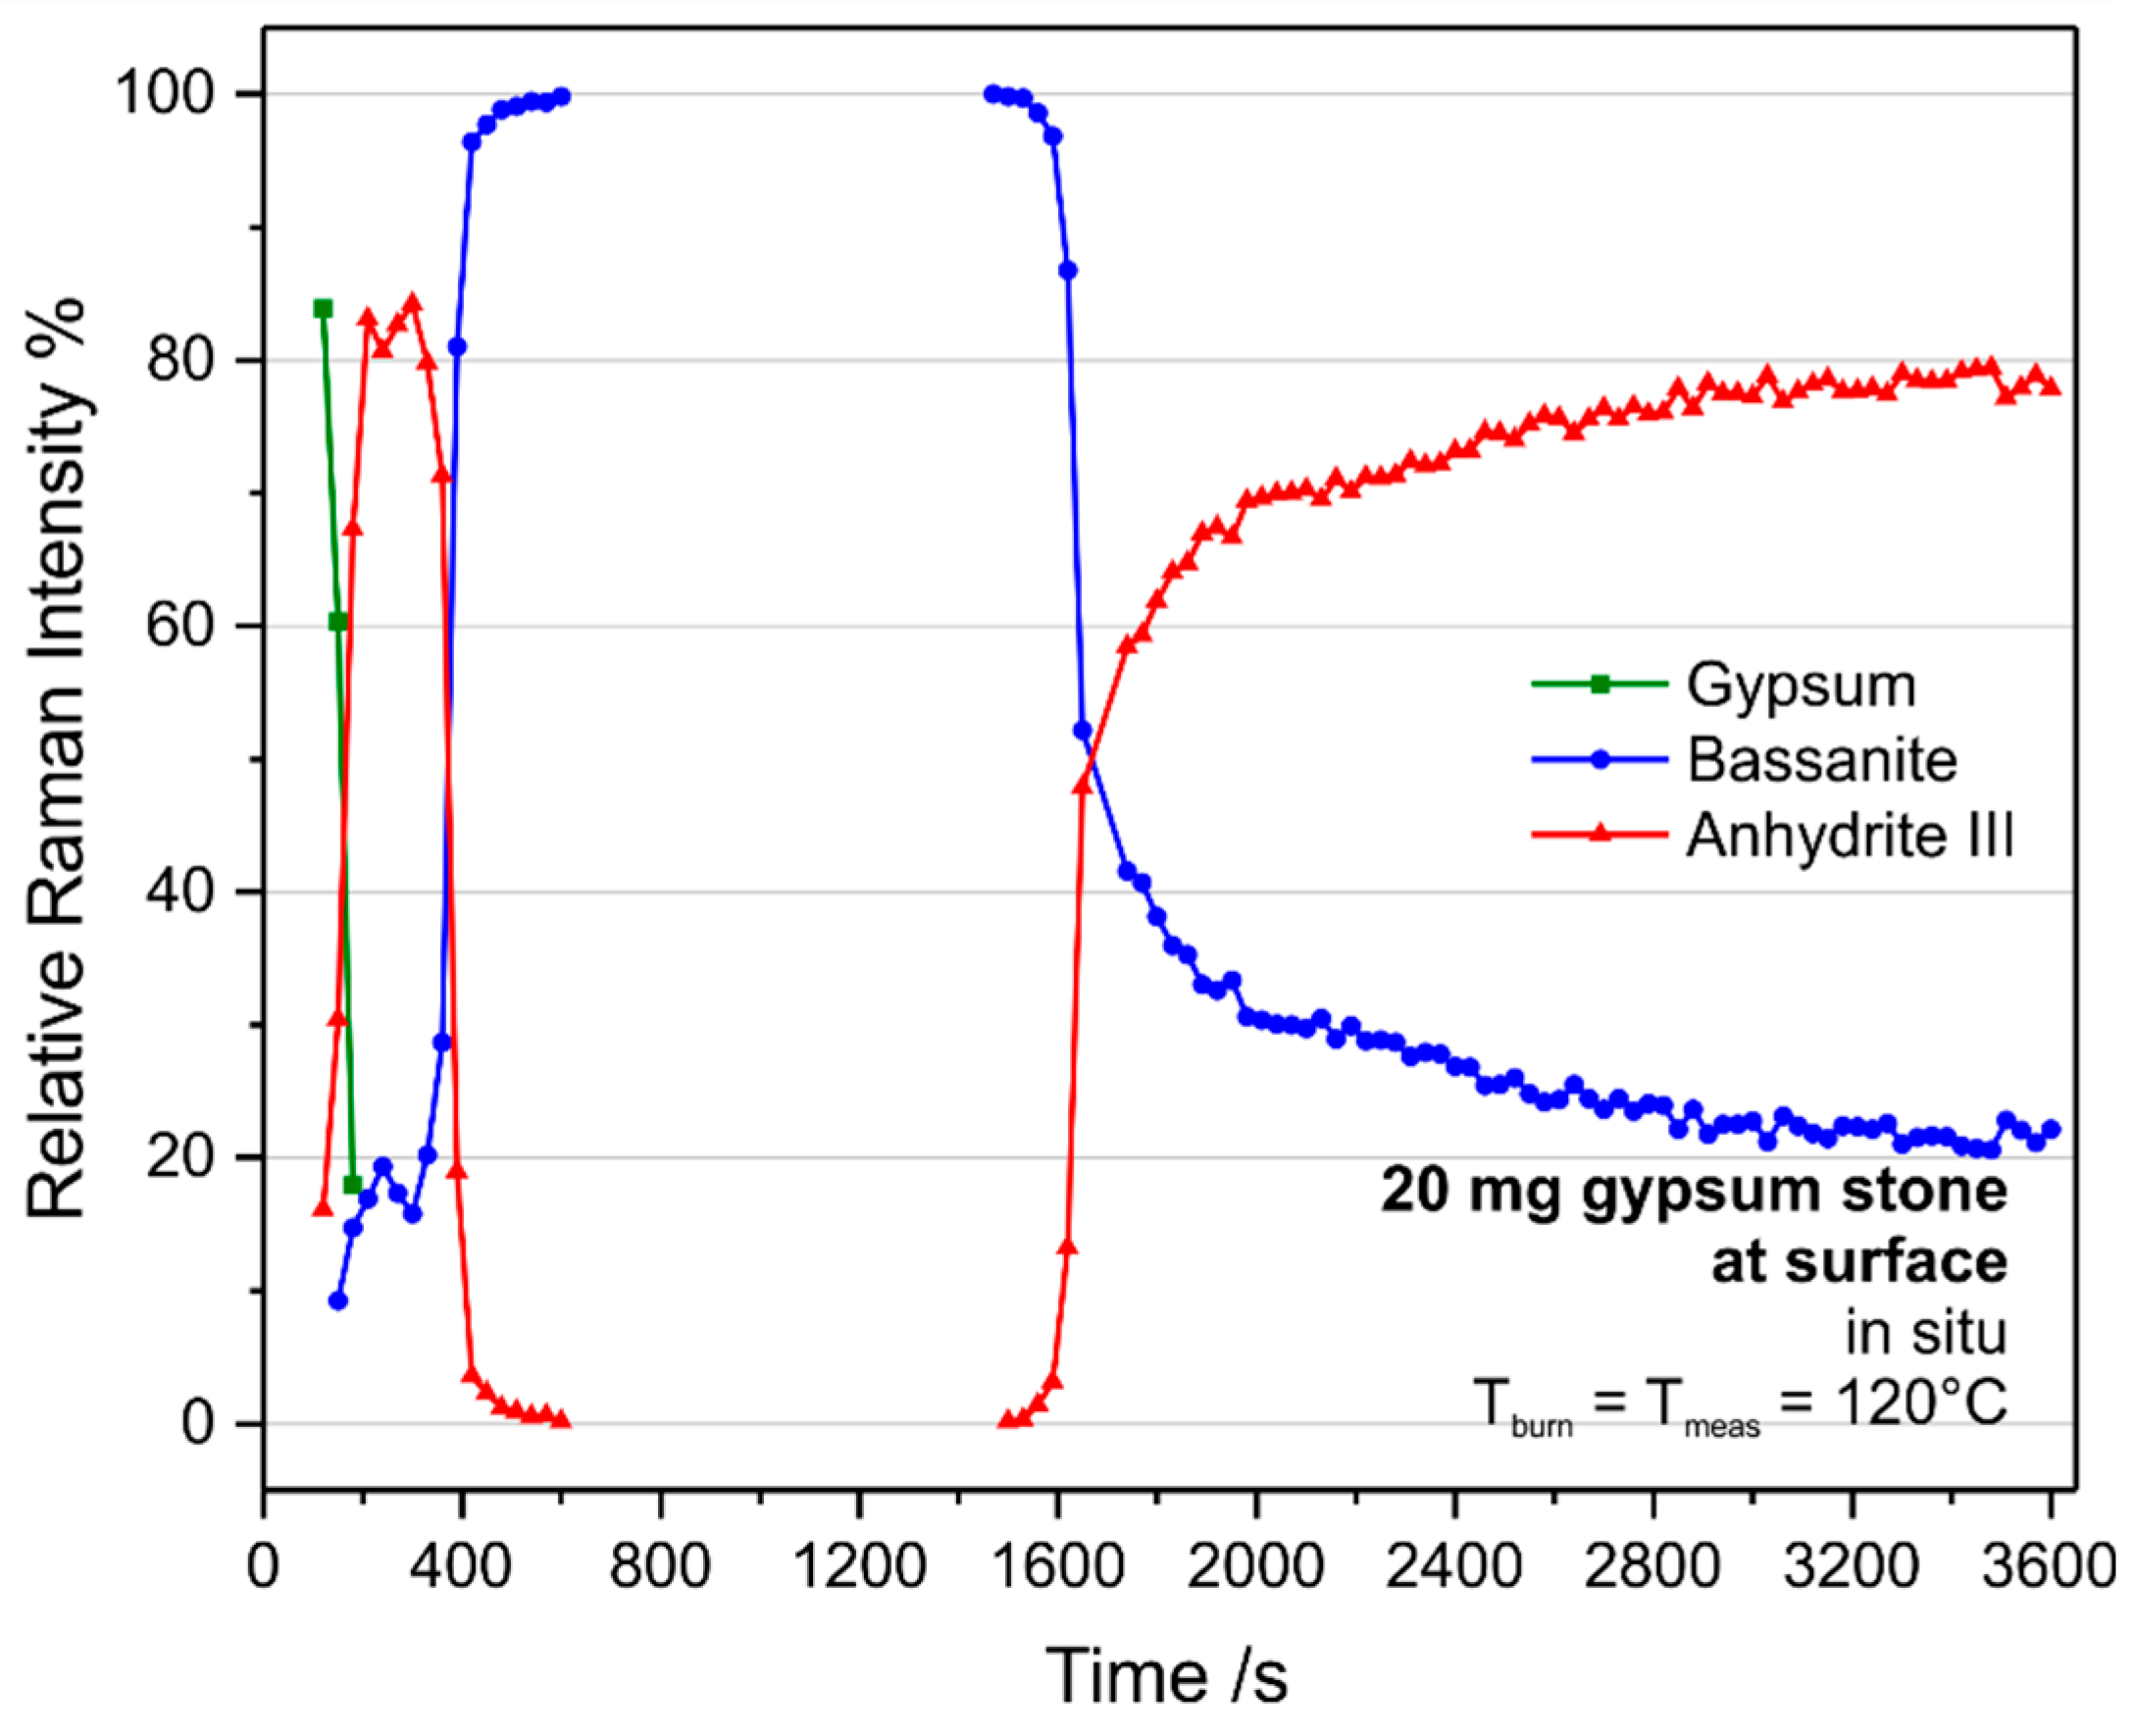
The measurements during calcination of gypsum stones, which had a mass of 20 mg and typically around 10 mm3 volume, revealed very different trends of the reactions as compared to the powder studies (see Figure 10 and Figure 11). Note that the increased noise in the sub-surface measurement shown in Figure 11 is due to the reduced peak heights achieved in the raw data of these measurements. In both cases, anhydrite III is formed prior to the detection of bassanite. The restricted time resolution of the experiment does not allow us to monitor the intermediate formation of bassanite, if present. While bassanite is formed later, anhydrite III is depleted and reappears at a later stage when, very similar to the powder experiments, the bassanite concentration drops. While the initial anhydrite III can be detected from 120 s to 600 s at the surface of the gypsum stone, it appears only between 210 s and 450 s at 100 µm below the surface. Another difference is the point of equal bassanite and anhydrite III Raman intensities during the final anhydrite III formation, which is at approximately 1650 s at the surface and 1500 s 100 µm below the surface.
These observations reveal that, even though these are chemical transformation reactions, there are significant parallels to physical drying of solid materials, which consists of a drying phase of the surface layer with a constant rate corresponding to the evaporation rate of free water, which is followed by a phase of falling rate (or several distinguishable phases of varying rates), which is determined by the mass transport of water from inside the material toward its surface, which is the only part of the material where water can leave the system [43,44]. A rate-determining influence of the water transport also explains the discrepancies between the conversions of 10 mg and 20 mg gypsum powder, and the conversion of anhydrite III to anhydrite II discussed in Section 3.6 below provides further evidence for this assumption. Thus, the local oven atmosphere changes if the transport of water vapour out of the reaction volume is hampered by a more voluminous kiln run. The comminution of the kiln run also plays a role for the same reasons.
Furthermore, local measurements at the surface or sub-surface provide mechanistic insights. Clearly, we have to differentiate between surface and bulk “drying”. At the surface, heat can attack as well as water vapour can leave the gypsum stone very rapidly, which leads to an almost immediate formation of anhydrite III (whether or not via bassanite cannot be proven due to limited time resolution of this experiment). At the same time, the “drying” process also starts within the bulk, but can only take place if water is transported to the surface from where it can leave the reaction volume. Thus, at some point, a water front reaches the surface, which converts anhydrite III back into bassanite, and bassanite is also formed within the bulk. In accordance with these similarities with a drying process, conversion of the initially formed anhydrite III into bassanite happens first within the sub-surface and last at the outer surface. Similarly, the reaction front of bassanite and anhydrite III moves from the inside out after completion of the gypsum–bassanite transformation. In that sense, the final transformation of bassanite into anhydrite III occurs last at the surface while the sub-surface of the 20-mg stone behaves similarly to 20 mg gypsum powder, which is also a consequence of a reaction front moving from the bulk toward the surface.

3.4. Spectroscopic Differentiation of the α and β Forms of Bassanite

Bassanite is known to exist in two forms, termed α and β, which are the results of different routes of synthesis (i.e., wet or dry method) and have differing properties in terms of reactivity with water as well as physical-mechanical qualities of the hydration product [40,45]. Their discriminative microscopic properties (crystal habit and size) most likely arise from variations in their internal structure, which are expected to be spectroscopically measurable. Nevertheless, there are only a few analytical studies on this subject available so far. A study on X-ray diffractometry (XRD) shows the widening of three overlapping signals when comparing the diffractograms of the crystallographic (hkl) = (212) planes of α-bassanite and β-bassanite. Stacking order faults within the same crystal structure are mentioned as a reason for the peak widening, which is quantified based on the stacking order index calculated from the areas of a central and two satellite peaks [46]. In contrast, another XRD study provides indications for differences in the crystal structure between the two forms [47]. Research aiming for an analytical approach capable of quantifying the α-character and β-character of bassanite mixtures went on, and thermoanalysis had to be ruled out as a candidate [40].
Within the present study, a Raman-microspectroscopy-based approach for detailed quantitative analyses of the differences between the α and β forms of bassanite was found, which enables repeated measurements on either the same spot or a range of different sample spots for testing the significance of differences and probing heterogeneity within a sample material. Figure 12 shows typical spectra of two samples of industrial products, which mainly consist of either α-bassanite or β-bassanite, which reveal no clear changes in band positions or relative band intensities. A close look at the ν1 mode of bassanite at 1016 cm−1 and the overlapping shoulder at 1006 cm−1 discussed above yields a stronger overlap between these modes in case of the β form. This is in close agreement with the previous observations made regarding the broadening of XRD signals [46]. Peak broadening in Raman spectroscopy during retention of an approximately Lorentzian peak shape can be explained by a decrease of crystallinity and a higher number of crystal lattice defects [48,49,50,51]. The same explanation applies to gradual changes of Raman band widths found recently within the stability range of anhydrite II [21,22,23], which are described in more detail in Section 3.7 below. Standard deviations and mean values from repeated measurements enable judgment of the significance of the differences in band FWHMs (as graphically depicted by arrows in the inset of Figure 12).
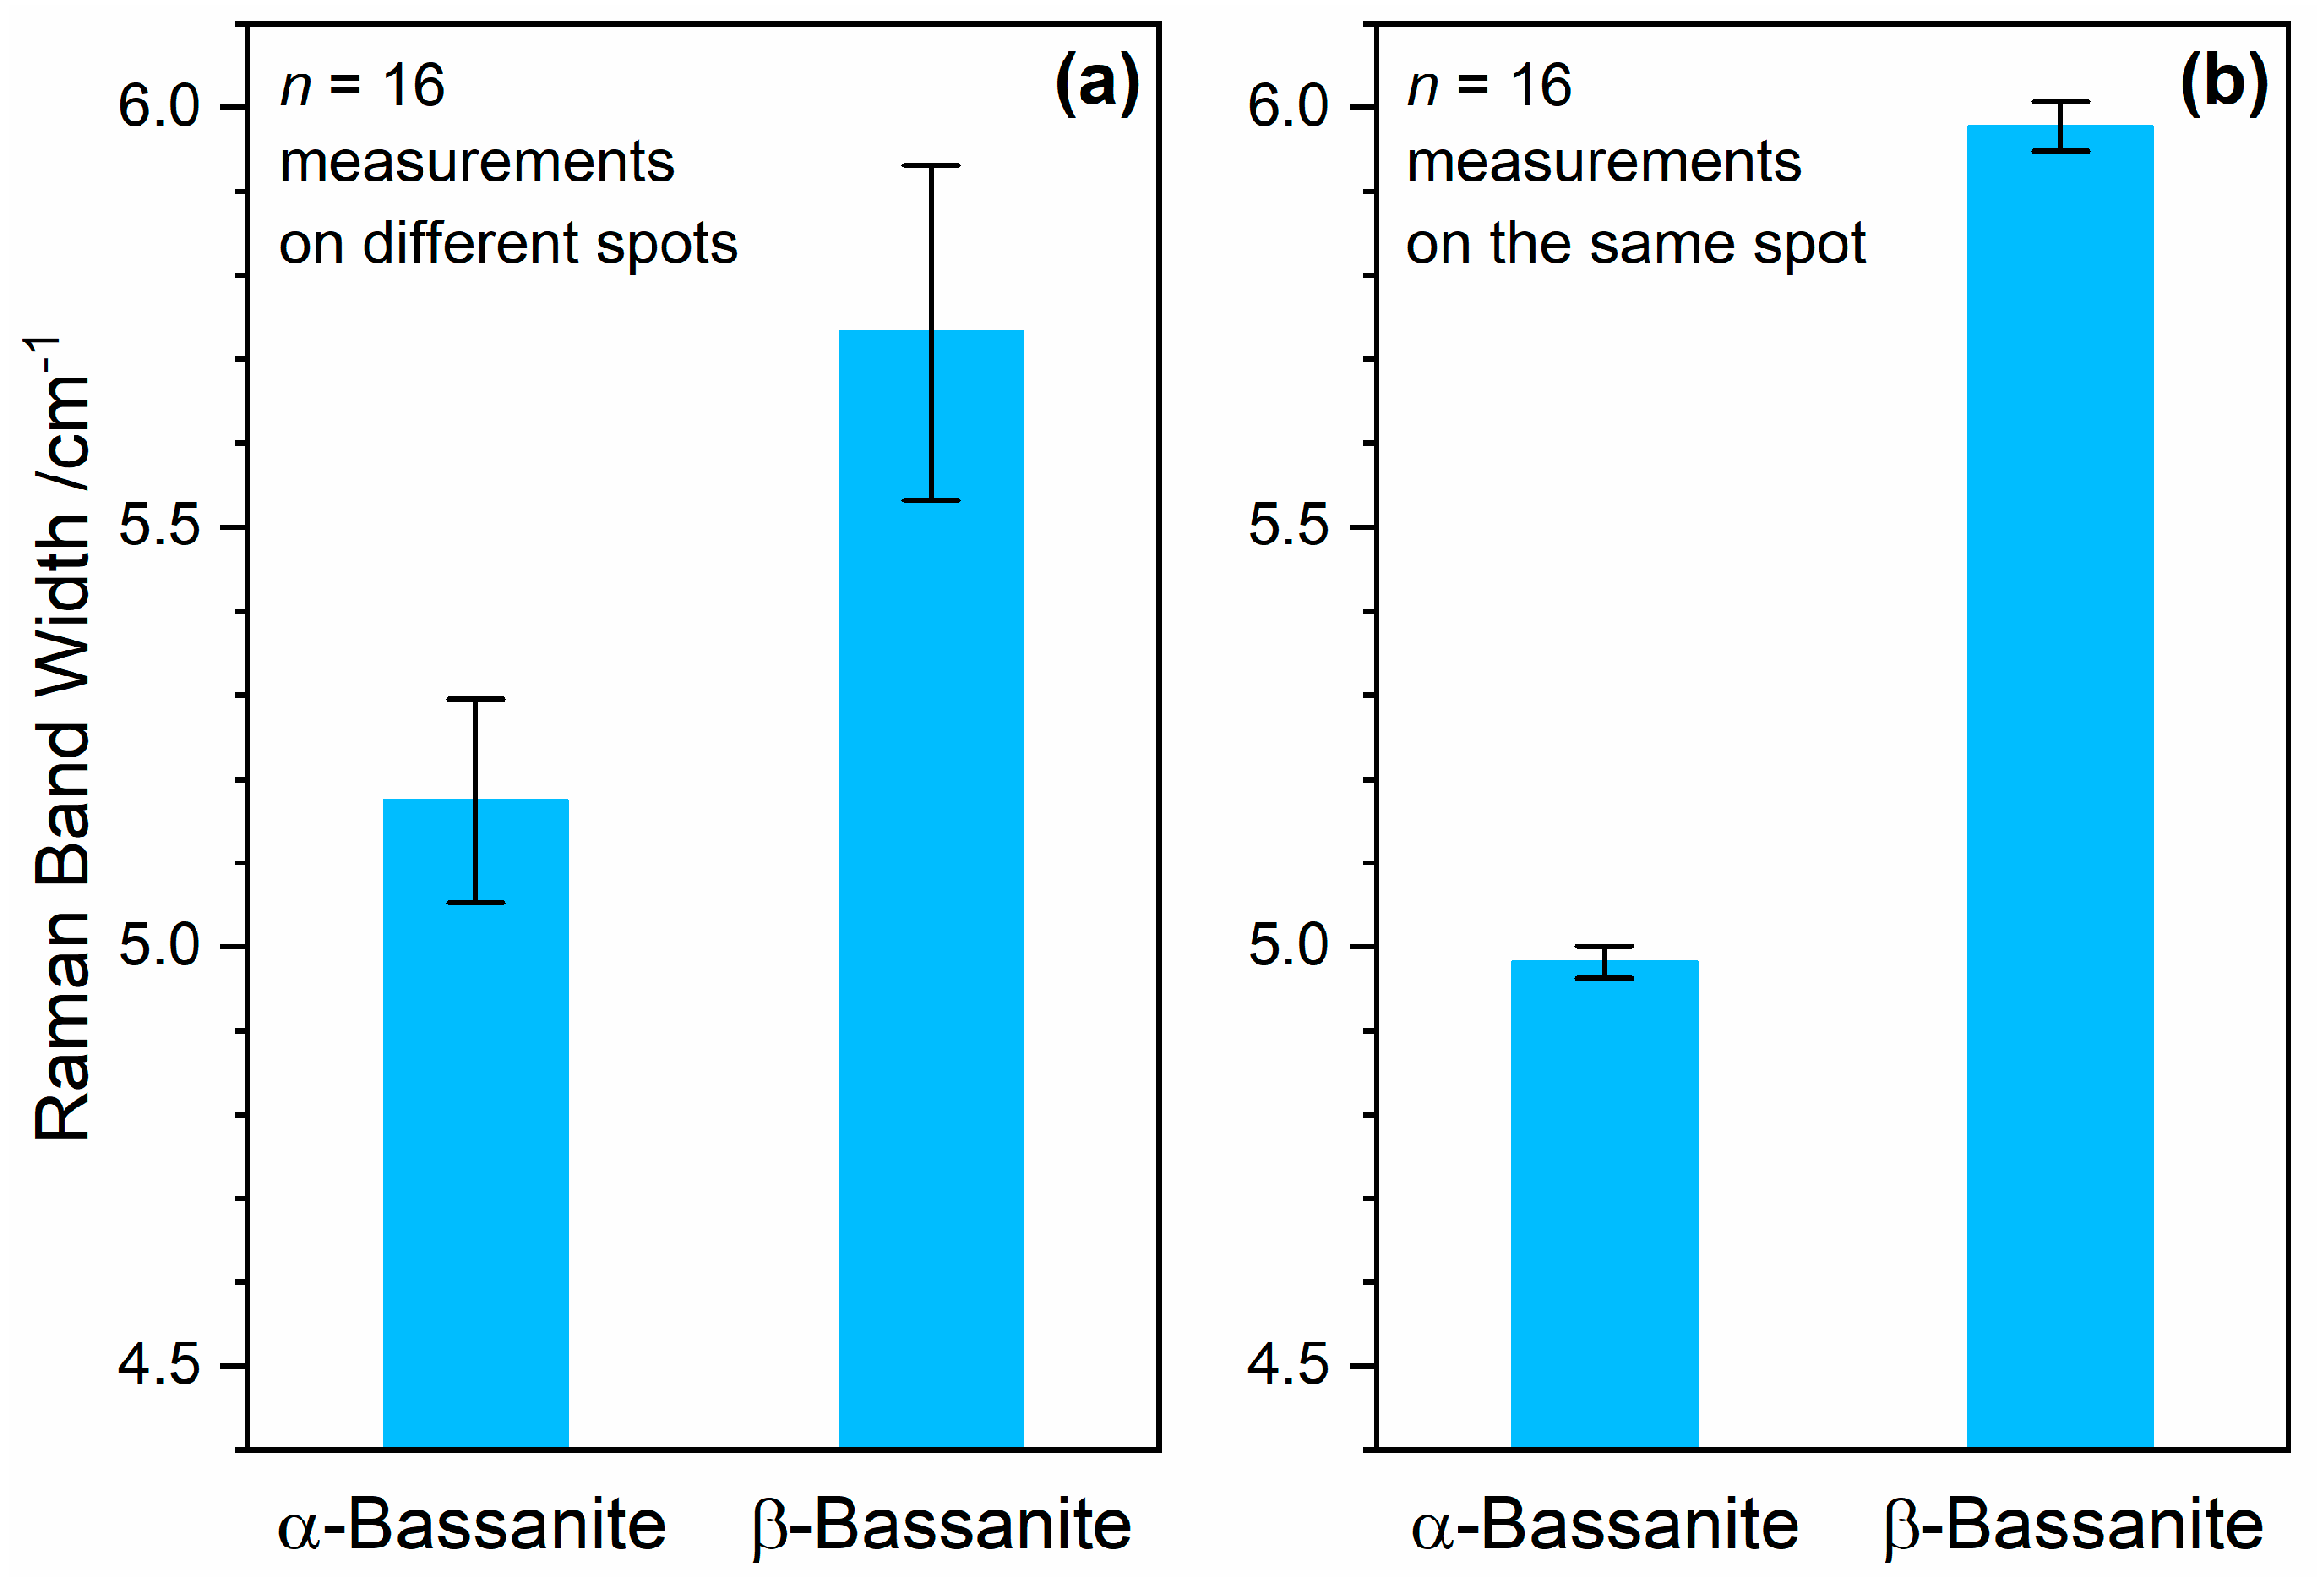
One advantage of Raman microspectroscopy over XRD is its intrinsic spatial resolution. Automated mapping measurements can easily provide insight into the (microscopic) heterogeneity of a material. Figure 13a shows mean values and standard deviations of Raman measurements on 16 different spots of α-bassanite and β-bassanite powder samples. Even though heterogeneities within the sample materials are included, the error bars do not overlap, which indicates a significant difference. A t-test proves this assumption, as detailed in Appendix B.
In order to assess the measurement uncertainty of the method, repeated measurements of the same sample spot were performed, and the mean values and standard deviations are plotted in Figure 13b. Even though, by coincidence, bassanite grains with specifically high (α-bassanite) and low crystallinities (β-bassanite) were measured, very similar values of both FWHMs are included in the data sets represented by Figure 13a. The standard deviations strongly decrease compared to the measurements performed on different sample spots. The latter include both measurement uncertainties and sample heterogeneities, and amount to 2.4% (α-bassanite) and 3.5% (β-bassanite), respectively (n = 16). The measurement uncertainty represented by relative standard deviations of n = 16 measurements repeated on the same sample spot is on the order of only 0.25% (0.2% in the case of α-bassanite and 0.3% for β-bassanite). This demonstrates that Raman band width measurements can be employed to discriminate different sub-types of bassanite and are also suitable to draw conclusions about heterogeneities of mixtures.

3.5. Conversion of Anhydrite III into Bassanite due to its Reaction with Air Humidity

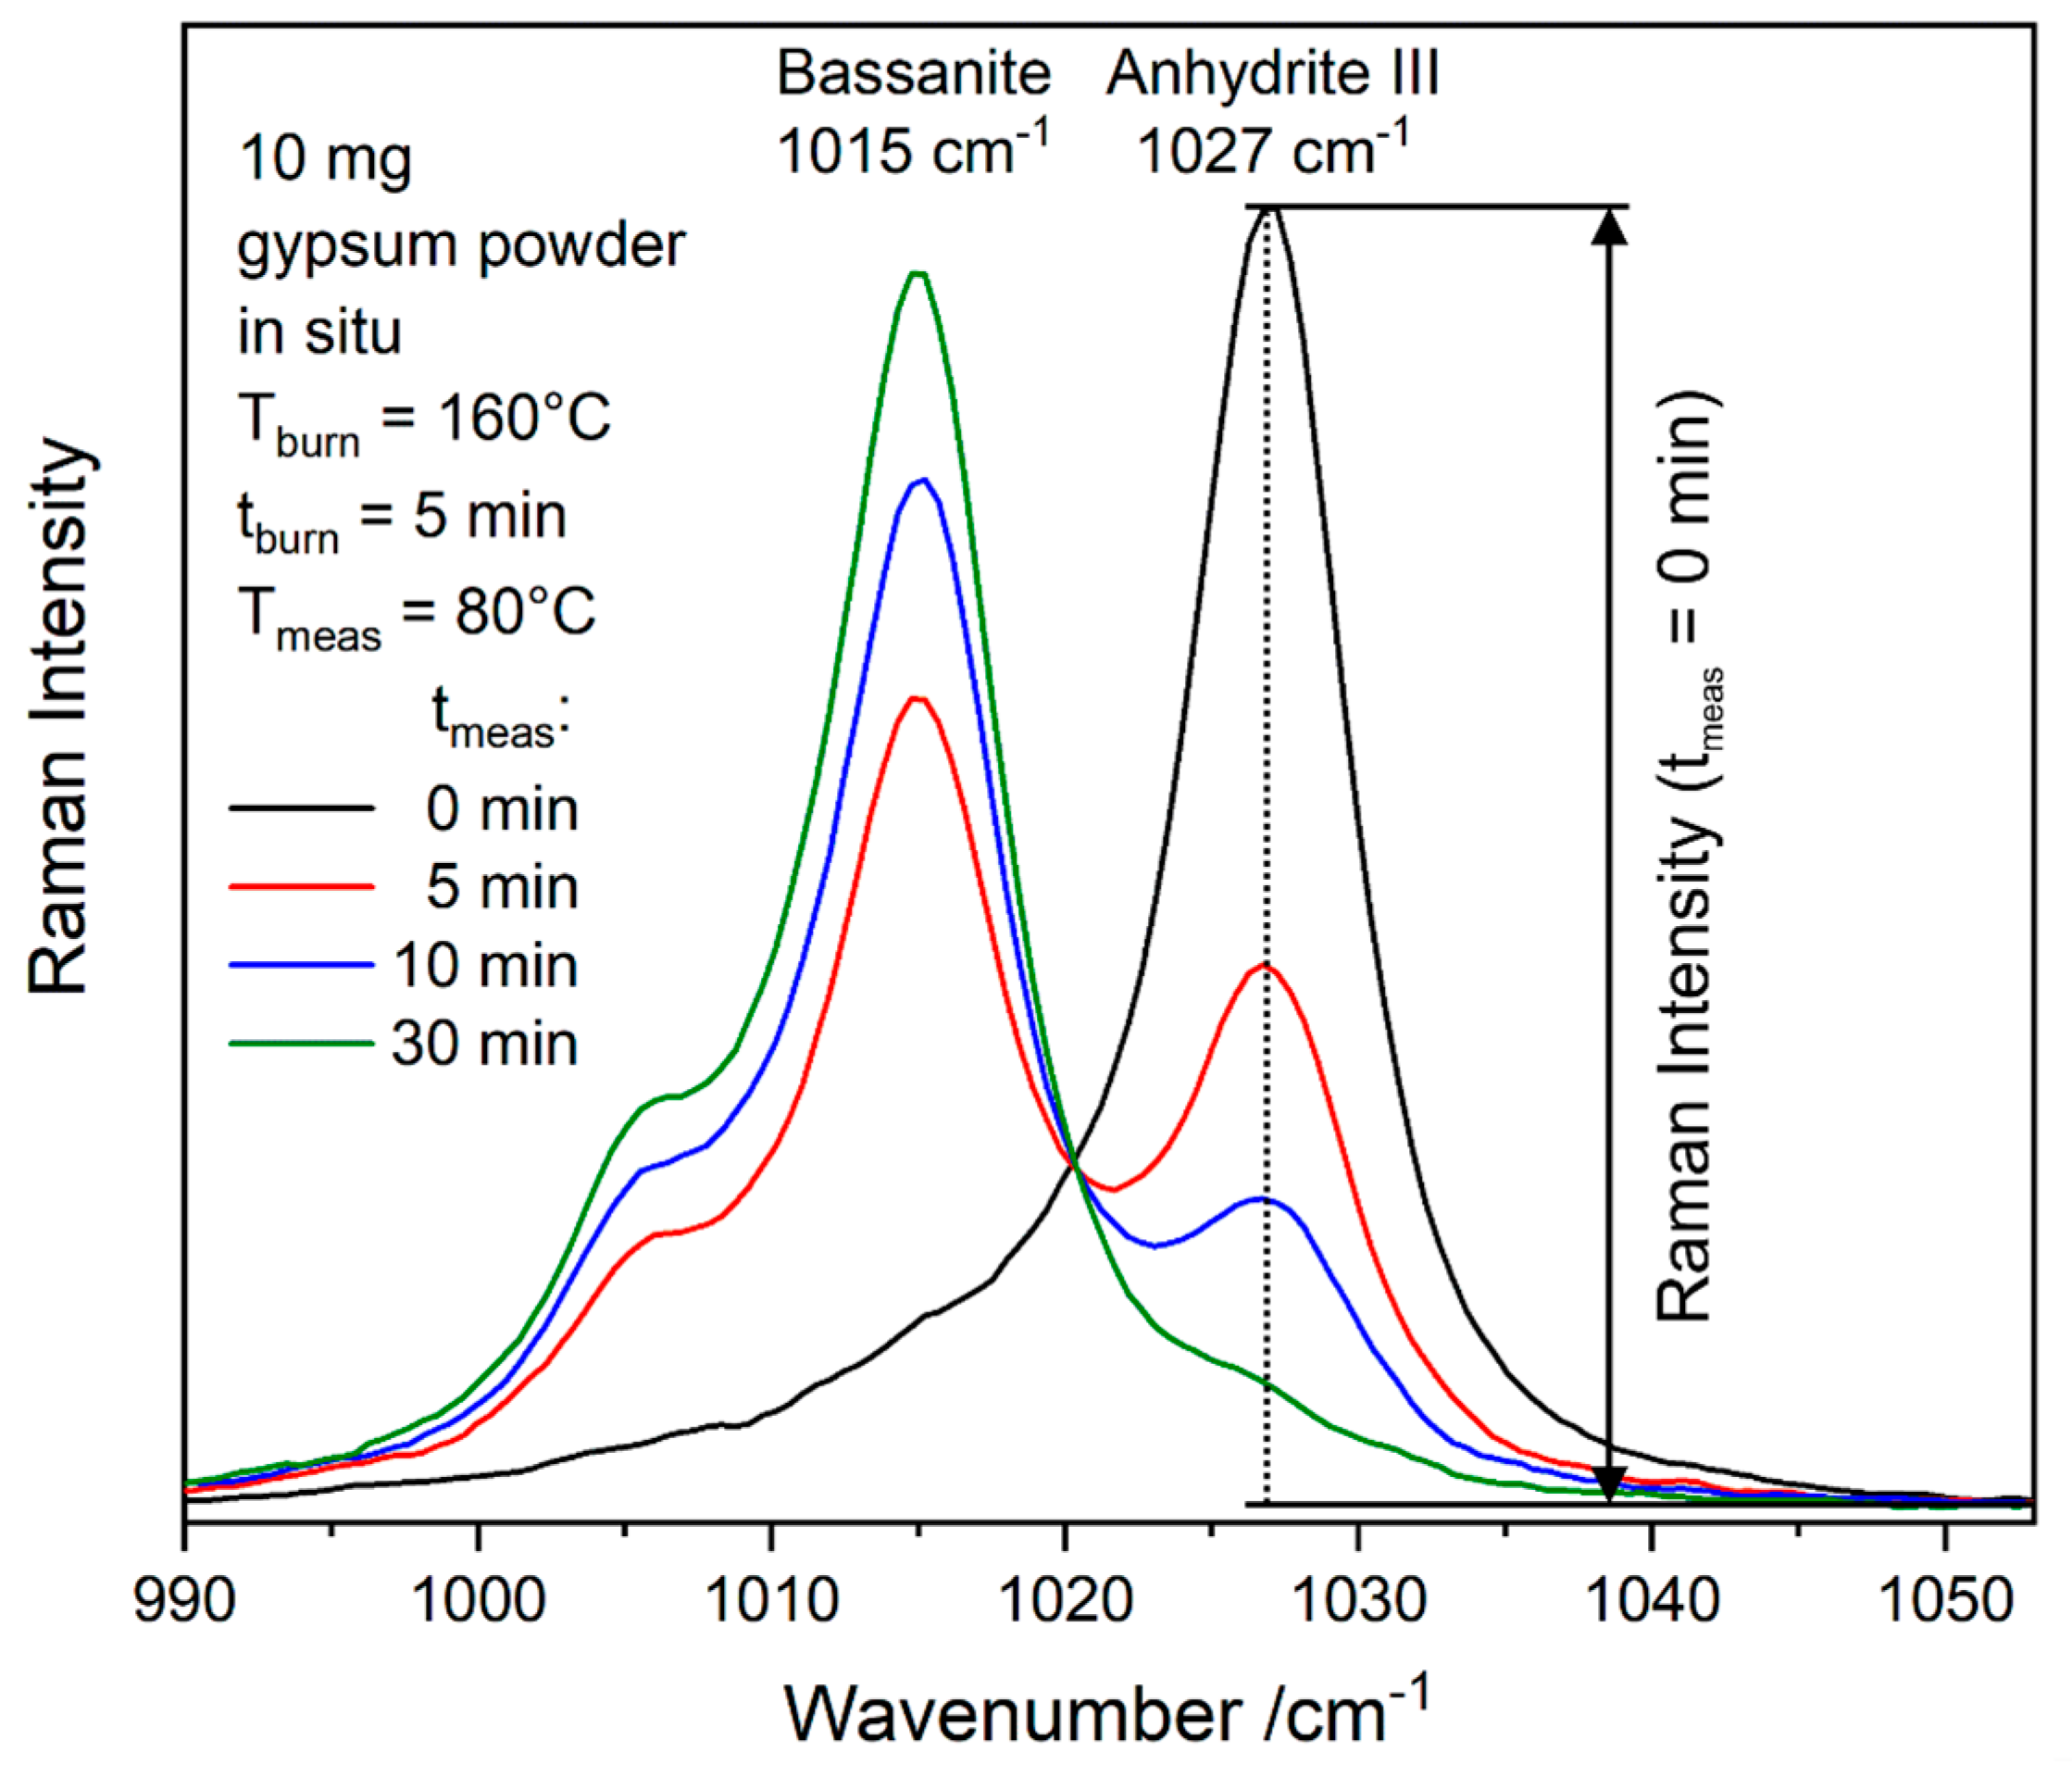
Anhydrite III readily reacts with air humidity into bassanite. The main structural change necessary for the conversions between bassanite and anhydrite III is the transport of water either out or in the channels of the CaSO4 crystal lattice (compare Figure 1). Experiments regarding the back-conversion of anhydrite III into bassanite were performed at different conditions. For a simple semi-quantitative comparison of the data, the height of the anhydrite III ν1 band was determined in each spectrum and normalised to the highest value obtained at the beginning of the experiment, as mathematically described by the equation below.
Inorm(t) = 100% × I(t)/Imax,
with Inorm(t) denoting the normalised Raman intensity at time t, I(t) denoting the peak height of Raman intensity, respectively, as depicted in Figure 14, and Imax is the maximum Raman intensity detected at the beginning of the experiment.
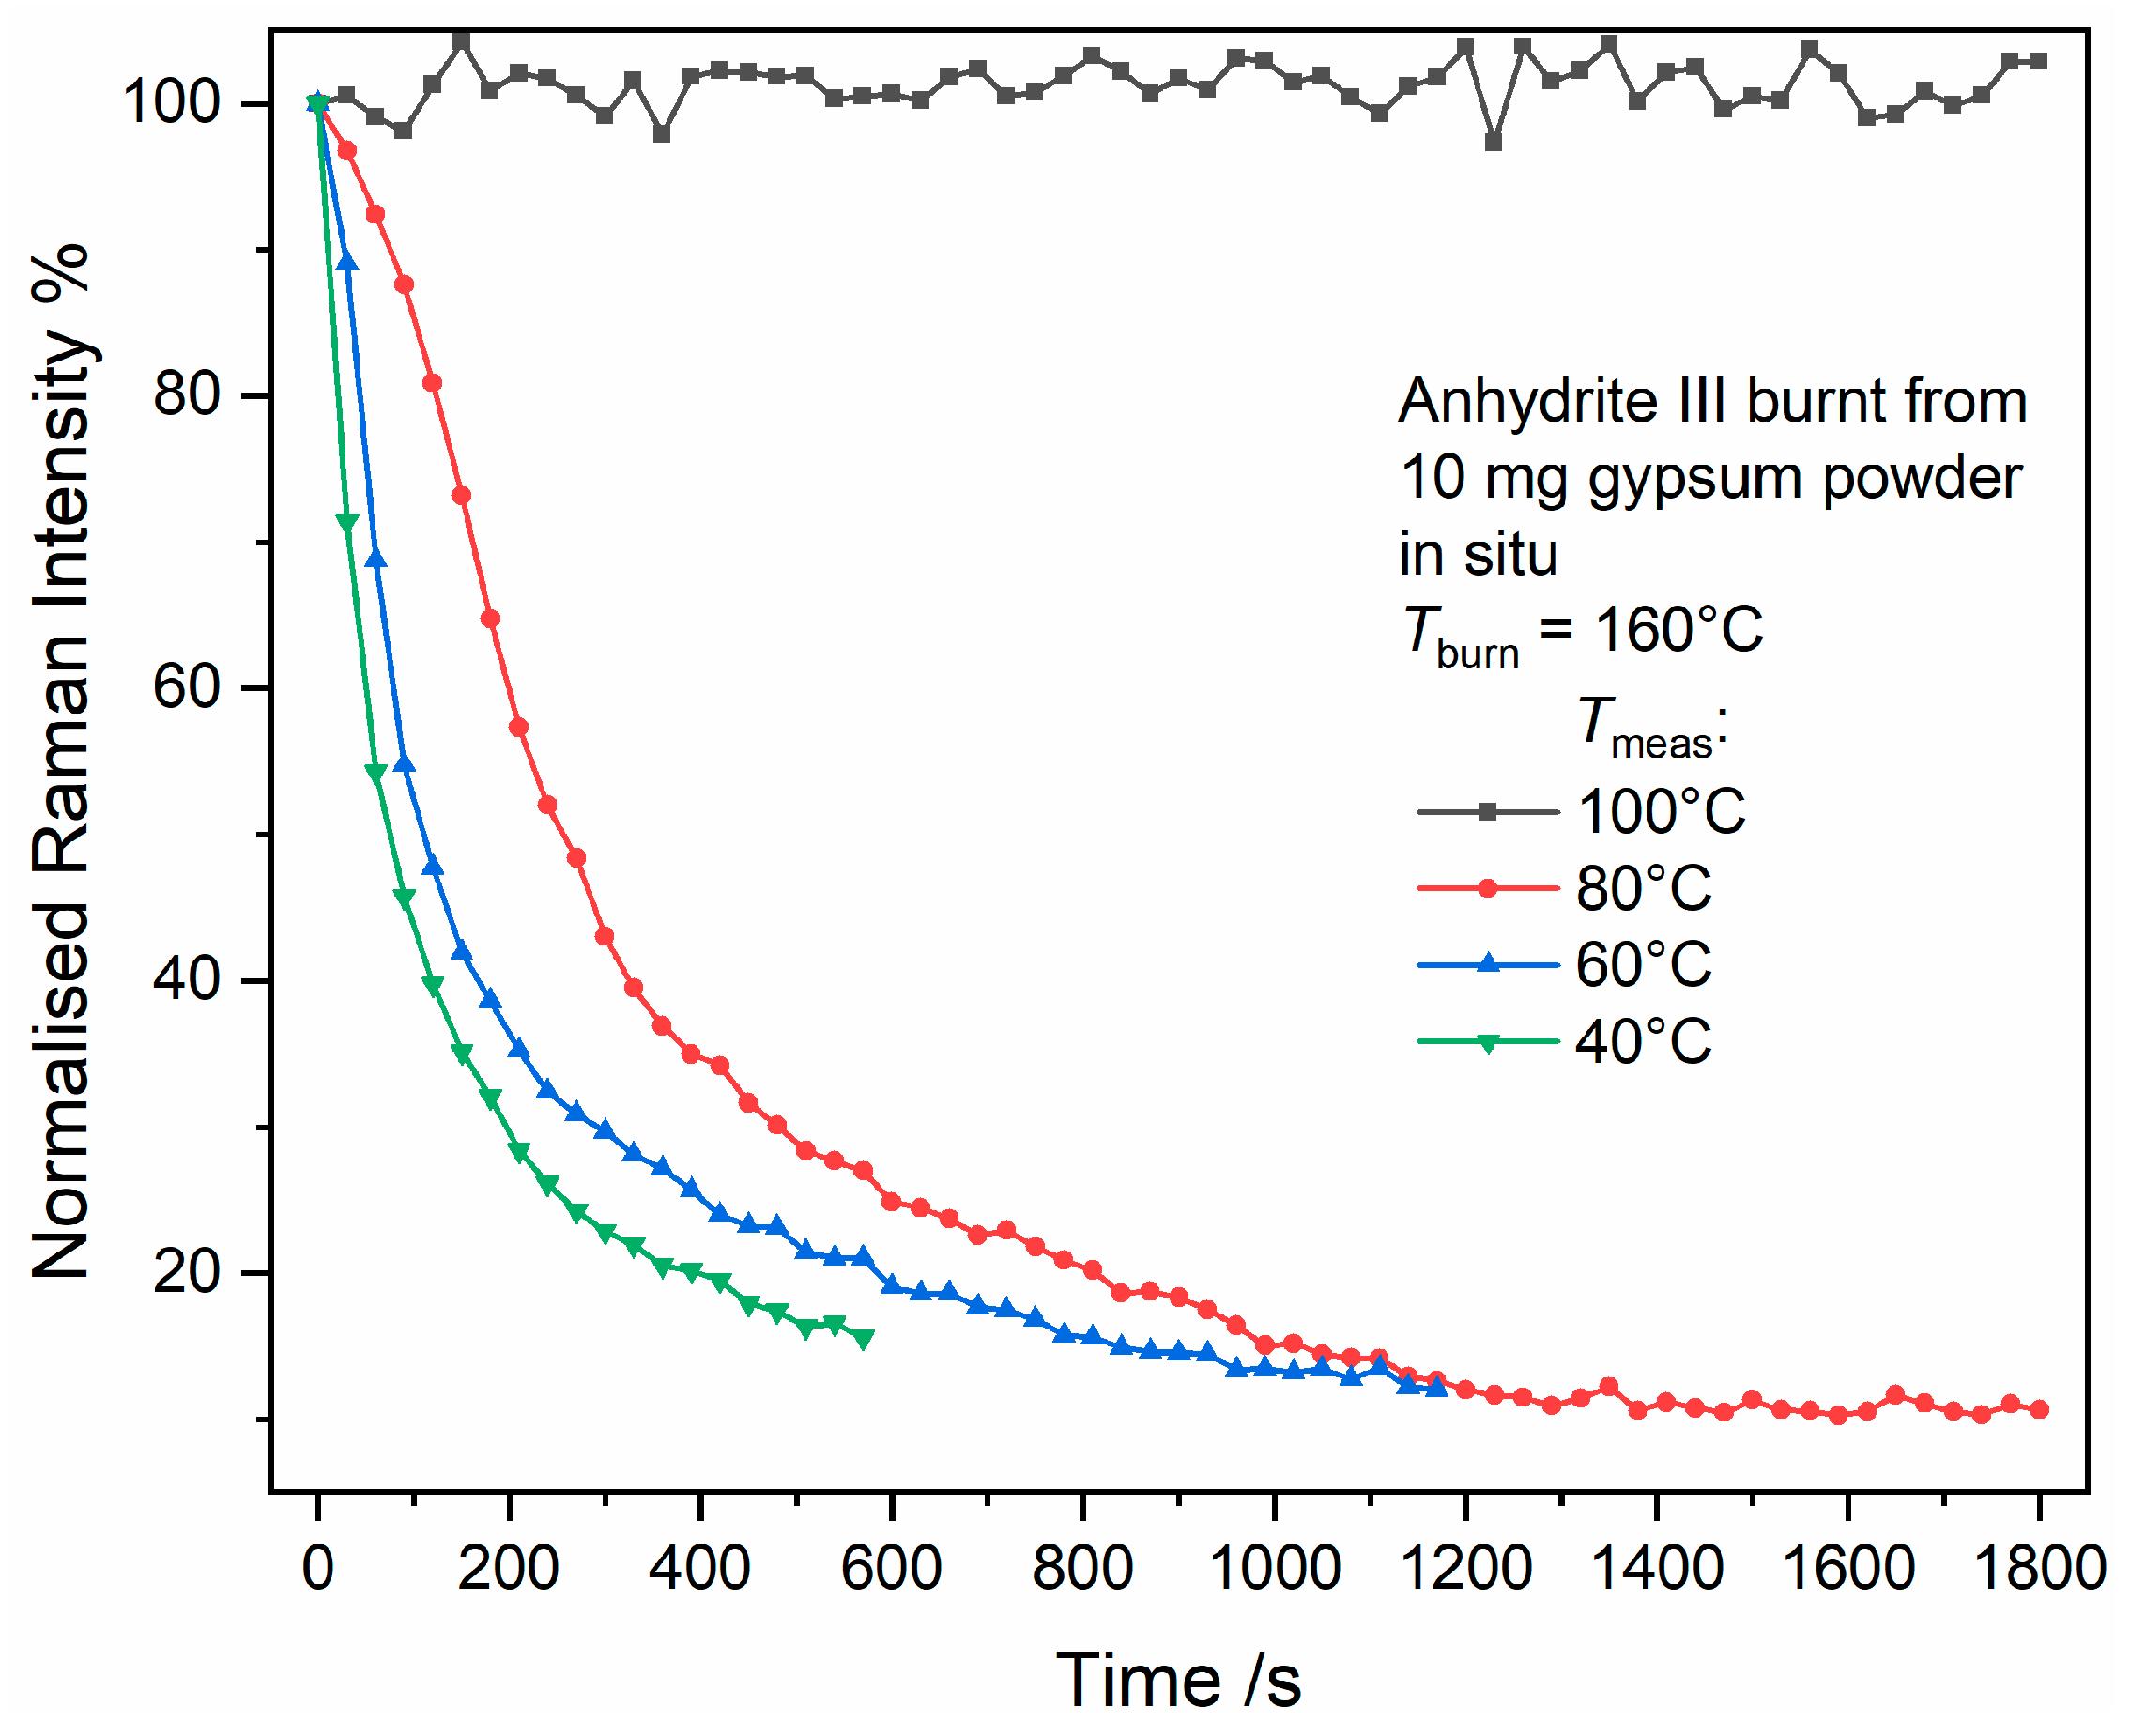
Figure 15 reveals the results of a series of experiments conducted at different temperatures by using anhydrite III burnt from 10 mg gypsum powder as starting material. The reaction of anhydrite III with water vapour in ambient air only happens at temperatures below 100 °C. This means that anhydrite III is stabilised at 100 °C and, thus, can be studied even when exposed to ambient air. With a decreasing temperature, the rate of the reaction increases. Temperatures below 40 °C were not accessible for this experiment because the time needed for cooling from 160 °C (or even from only 100 °C) down to the setpoint temperature (e.g., 30 °C) already included partial phase conversion. According to our experience, conversion of anhydrite III in the small amounts needed for microscopy studies at room temperature takes place within a few minutes.
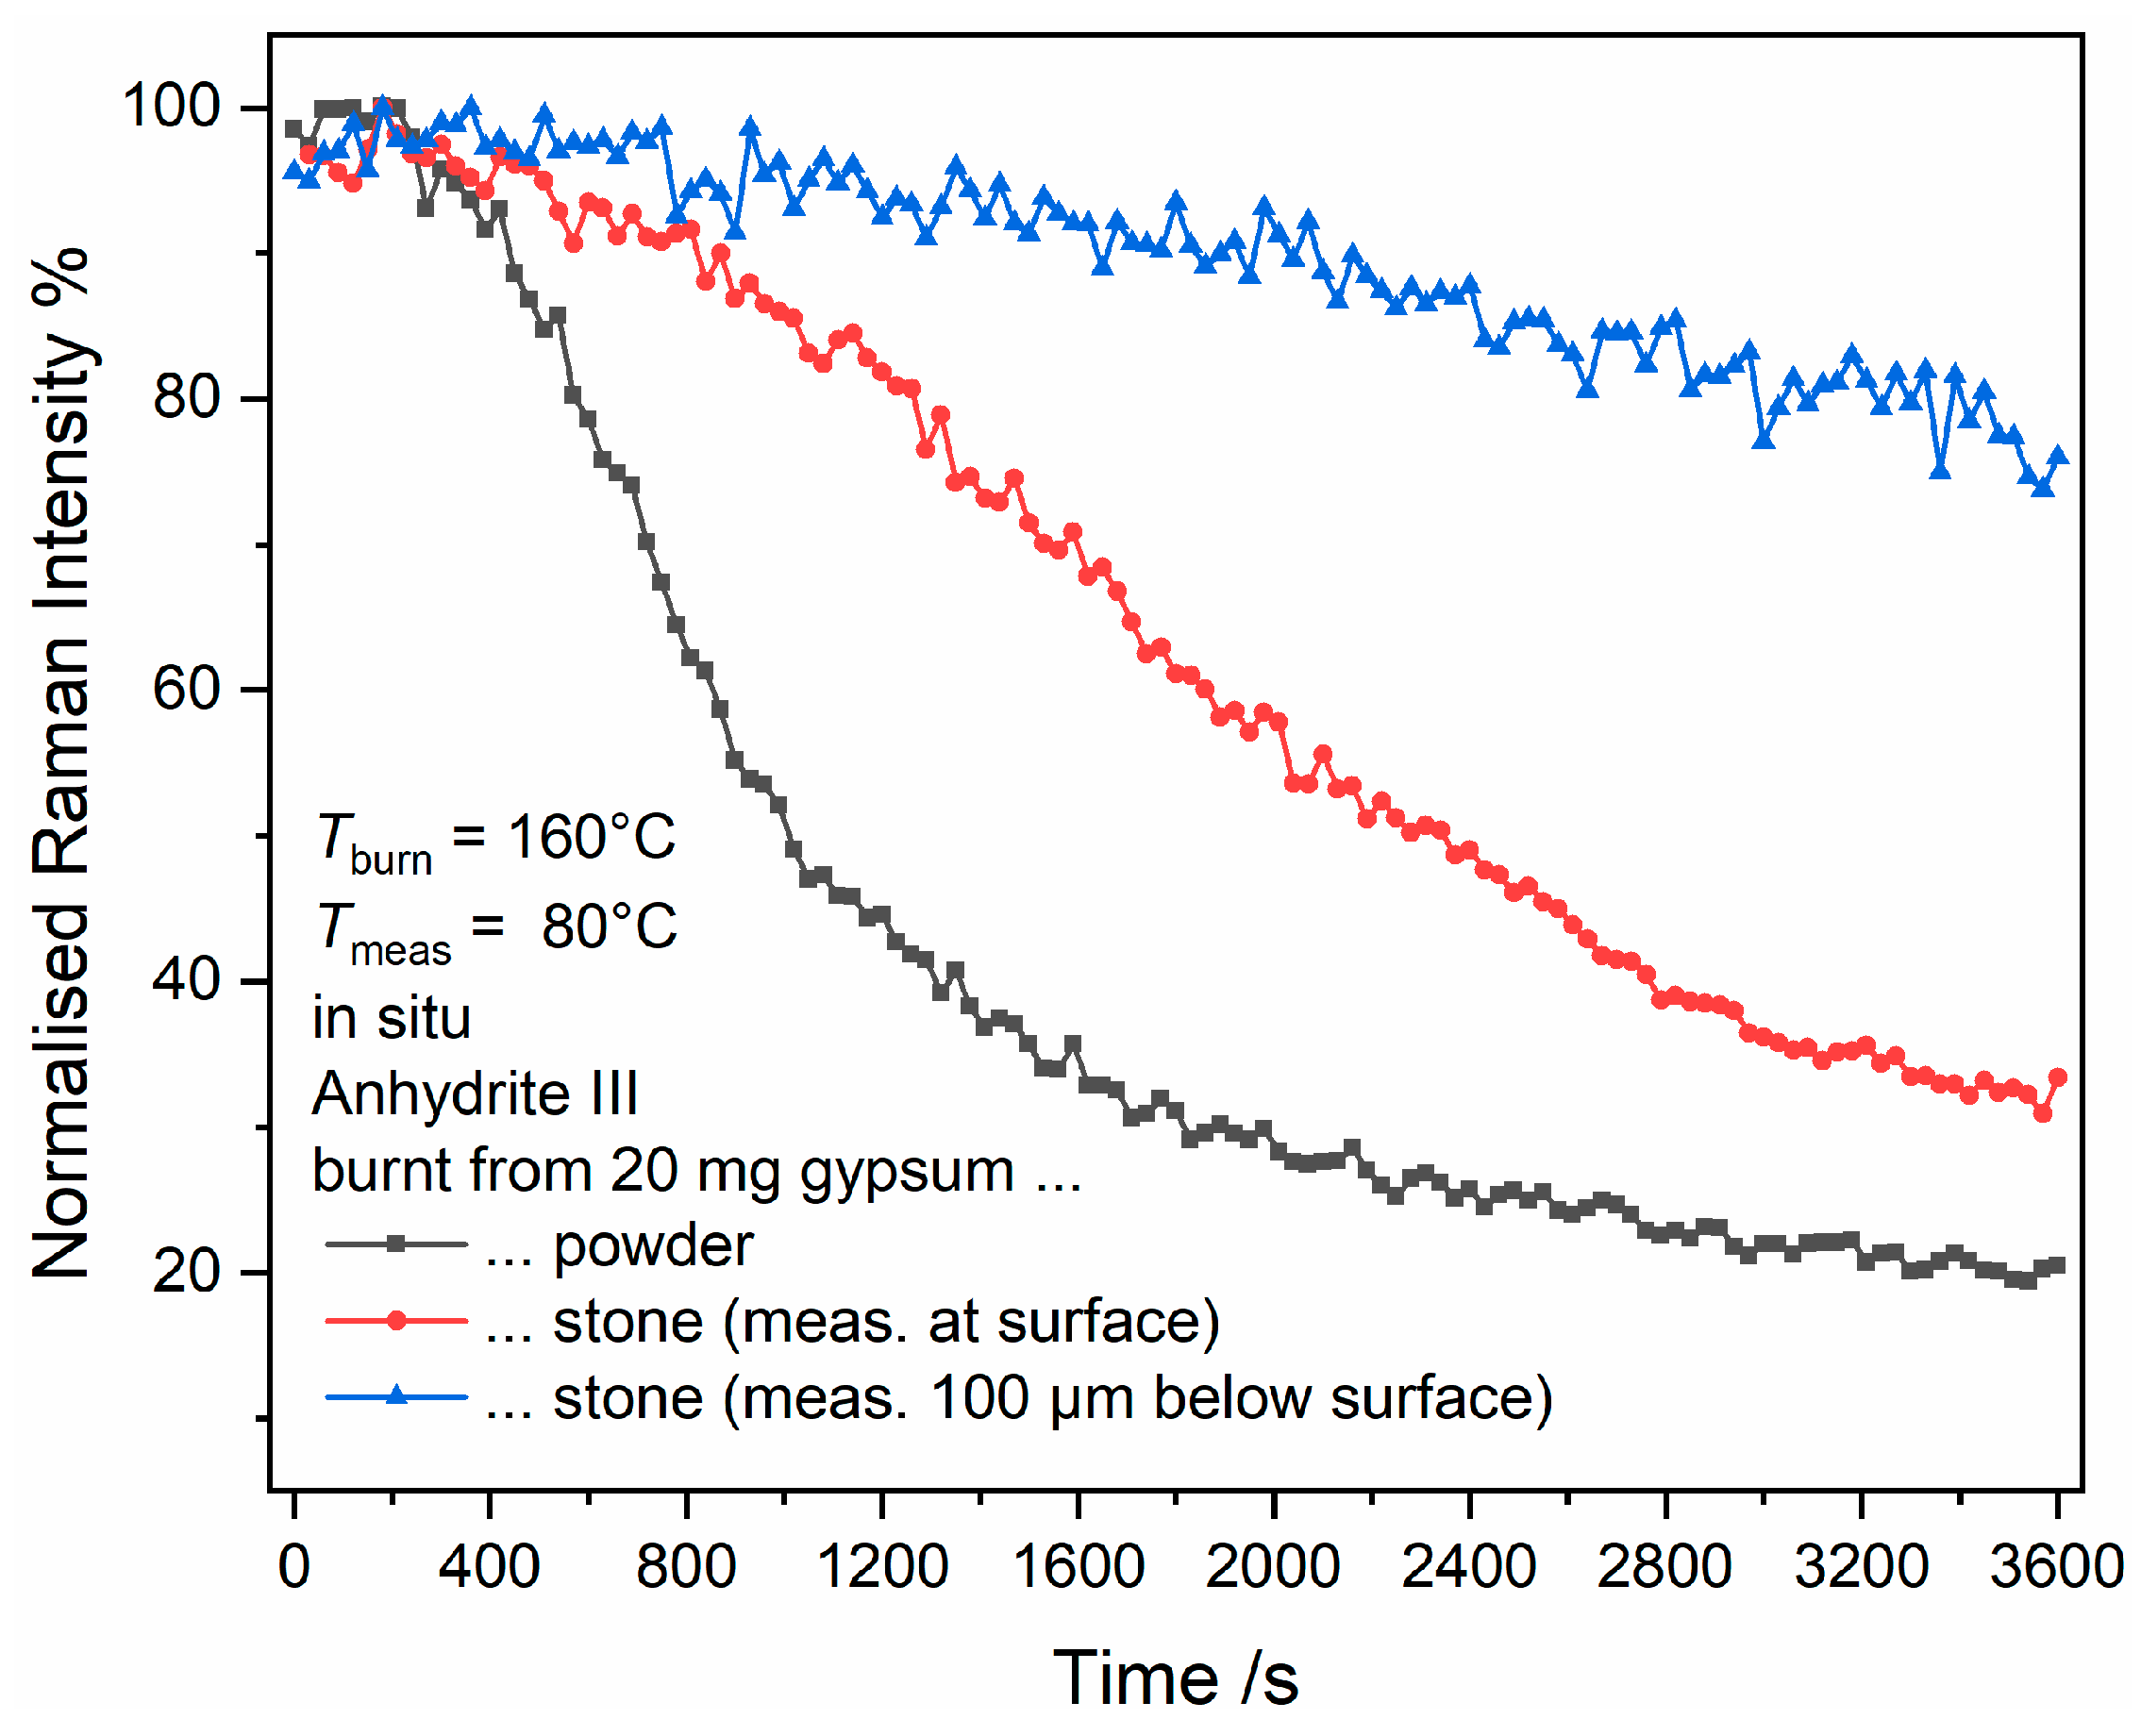
The back-conversion of anhydrite III into bassanite strongly depends on the mass transport rate of water, as it is the case for the the gypsum–bassanite–anhydrite III conversion discussed above. Thus, comminution and the amount of anhydrite III play an important role. As shown in Figure 16, the rate of reaction significantly drops when 20 mg instead of 10 mg starting material are used (note the different scales of Figure 15 and Figure 16). Thus, it is also not a surprise that the reaction slows further down if a massive stone fragment is used instead of powdered material. The reaction is faster at the surface than within the sub-surface, which is due to mass transport limitation. In contrast to the reaction of gypsum via bassanite into anhydrite III in the studied stone samples, there is only one continuous decrease of anhydrite III concentration throughout all measurements. The simple explanation is that, in contrast to the “drying” reaction, there is only one anhydrite III–bassanite reaction front, or one water front, respectively, moving from the outside inwards.
Within the studies of the conversion reaction of anhydrite III into anhydrite II discussed in the following Section 3.6 and Section 3.7, anhydrite III is either stabilised by using the ampulla method (see Section 2.2) or by measuring the Raman spectra at 100 °C, since Figure 15 proves the stability of this metastable phase under these conditions.

3.6. Anhydrite III–Anhydrite II Conversion Reaction

Figure 17 summarises the results of the calcination of gypsum powder according to the ampulla method (see Section 2.2) in the temperature range of 150–500 °C. Traces of anhydrite II can be detected at Tburn ≥ 180 °C, while anhydrite III is present at burning temperatures up to 500 °C (depending on the measurement spot, the anhydrite III signal can be detected as a weak shoulder at this temperature).
This measurement series is a sequel to the experiments summarised by Figure 5. A comparison with the gypsum–bassanite–anhydrite III reaction shown there reveals significant differences. While the holding time tburn of either 4 h or 20 h was shown to have a strong influence on the composition of the mixture of reaction products at burning temperatures ≤150 °C, this is not the case for the transformation of anhydrite III into anhydrite II. Differences of relative peak heights at some temperatures are most likely within the overall uncertainty of this experiment. As demonstrated by both ex situ and in situ measurements in Section 3.3, mass transport of water has a significant influence on the time needed for the gypsum–bassanite–anhydrite III transformation. It is rate-determining for the relatively small amounts of 10 mg or 20 mg of gypsum powder employed in the in situ experiments, as twice the amount almost doubles the reaction times (compare Figure 8 and Figure 9). When 0.5 g gypsum powder is burnt as in the ex situ experiments, water transport further slows down, which explains different results obtained at the same temperature but different holding time. This time dependence vanishes at temperatures exceeding 150 °C, which is further evidence for water transport as a rate-determining step in the gypsum–bassanite–anhydrite III conversion—at least in many cases—as the effect of holding time vanishes if removal of crystal water is not involved in a conversion reaction. This is shown in this scenario for anhydrite III → anhydrite II.

3.7. Structural Changes within the Stability Range of Anhydrite II

As pointed out in the Introduction, three sub-phases of anhydrite II are proposed due to different hydration reactivities: sparingly soluble AII (AII-s), insoluble AII (AII-u), and estrich gypsum (AII-E) [19,20]. There has been no spectroscopic study in the literature on the possible structural reasons for these differences in behaviour until our previous publication in 2017 [21], which revealed decreases of Raman band width, specific surface area (according to the Brunauer–Emmett–Teller method) and strain, and an increase in crystallite size (as determined by XRD) in the burning temperature range of 500 °C to 900 °C. The following studies included Tburn = 400 °C and 1000–1100 °C, and the sharpening of Raman bands along the temperature axis was attributed to an increase in crystallinity of anhydrite II [22,23]. All mentioned property changes agree with the known decrease in reactivity.
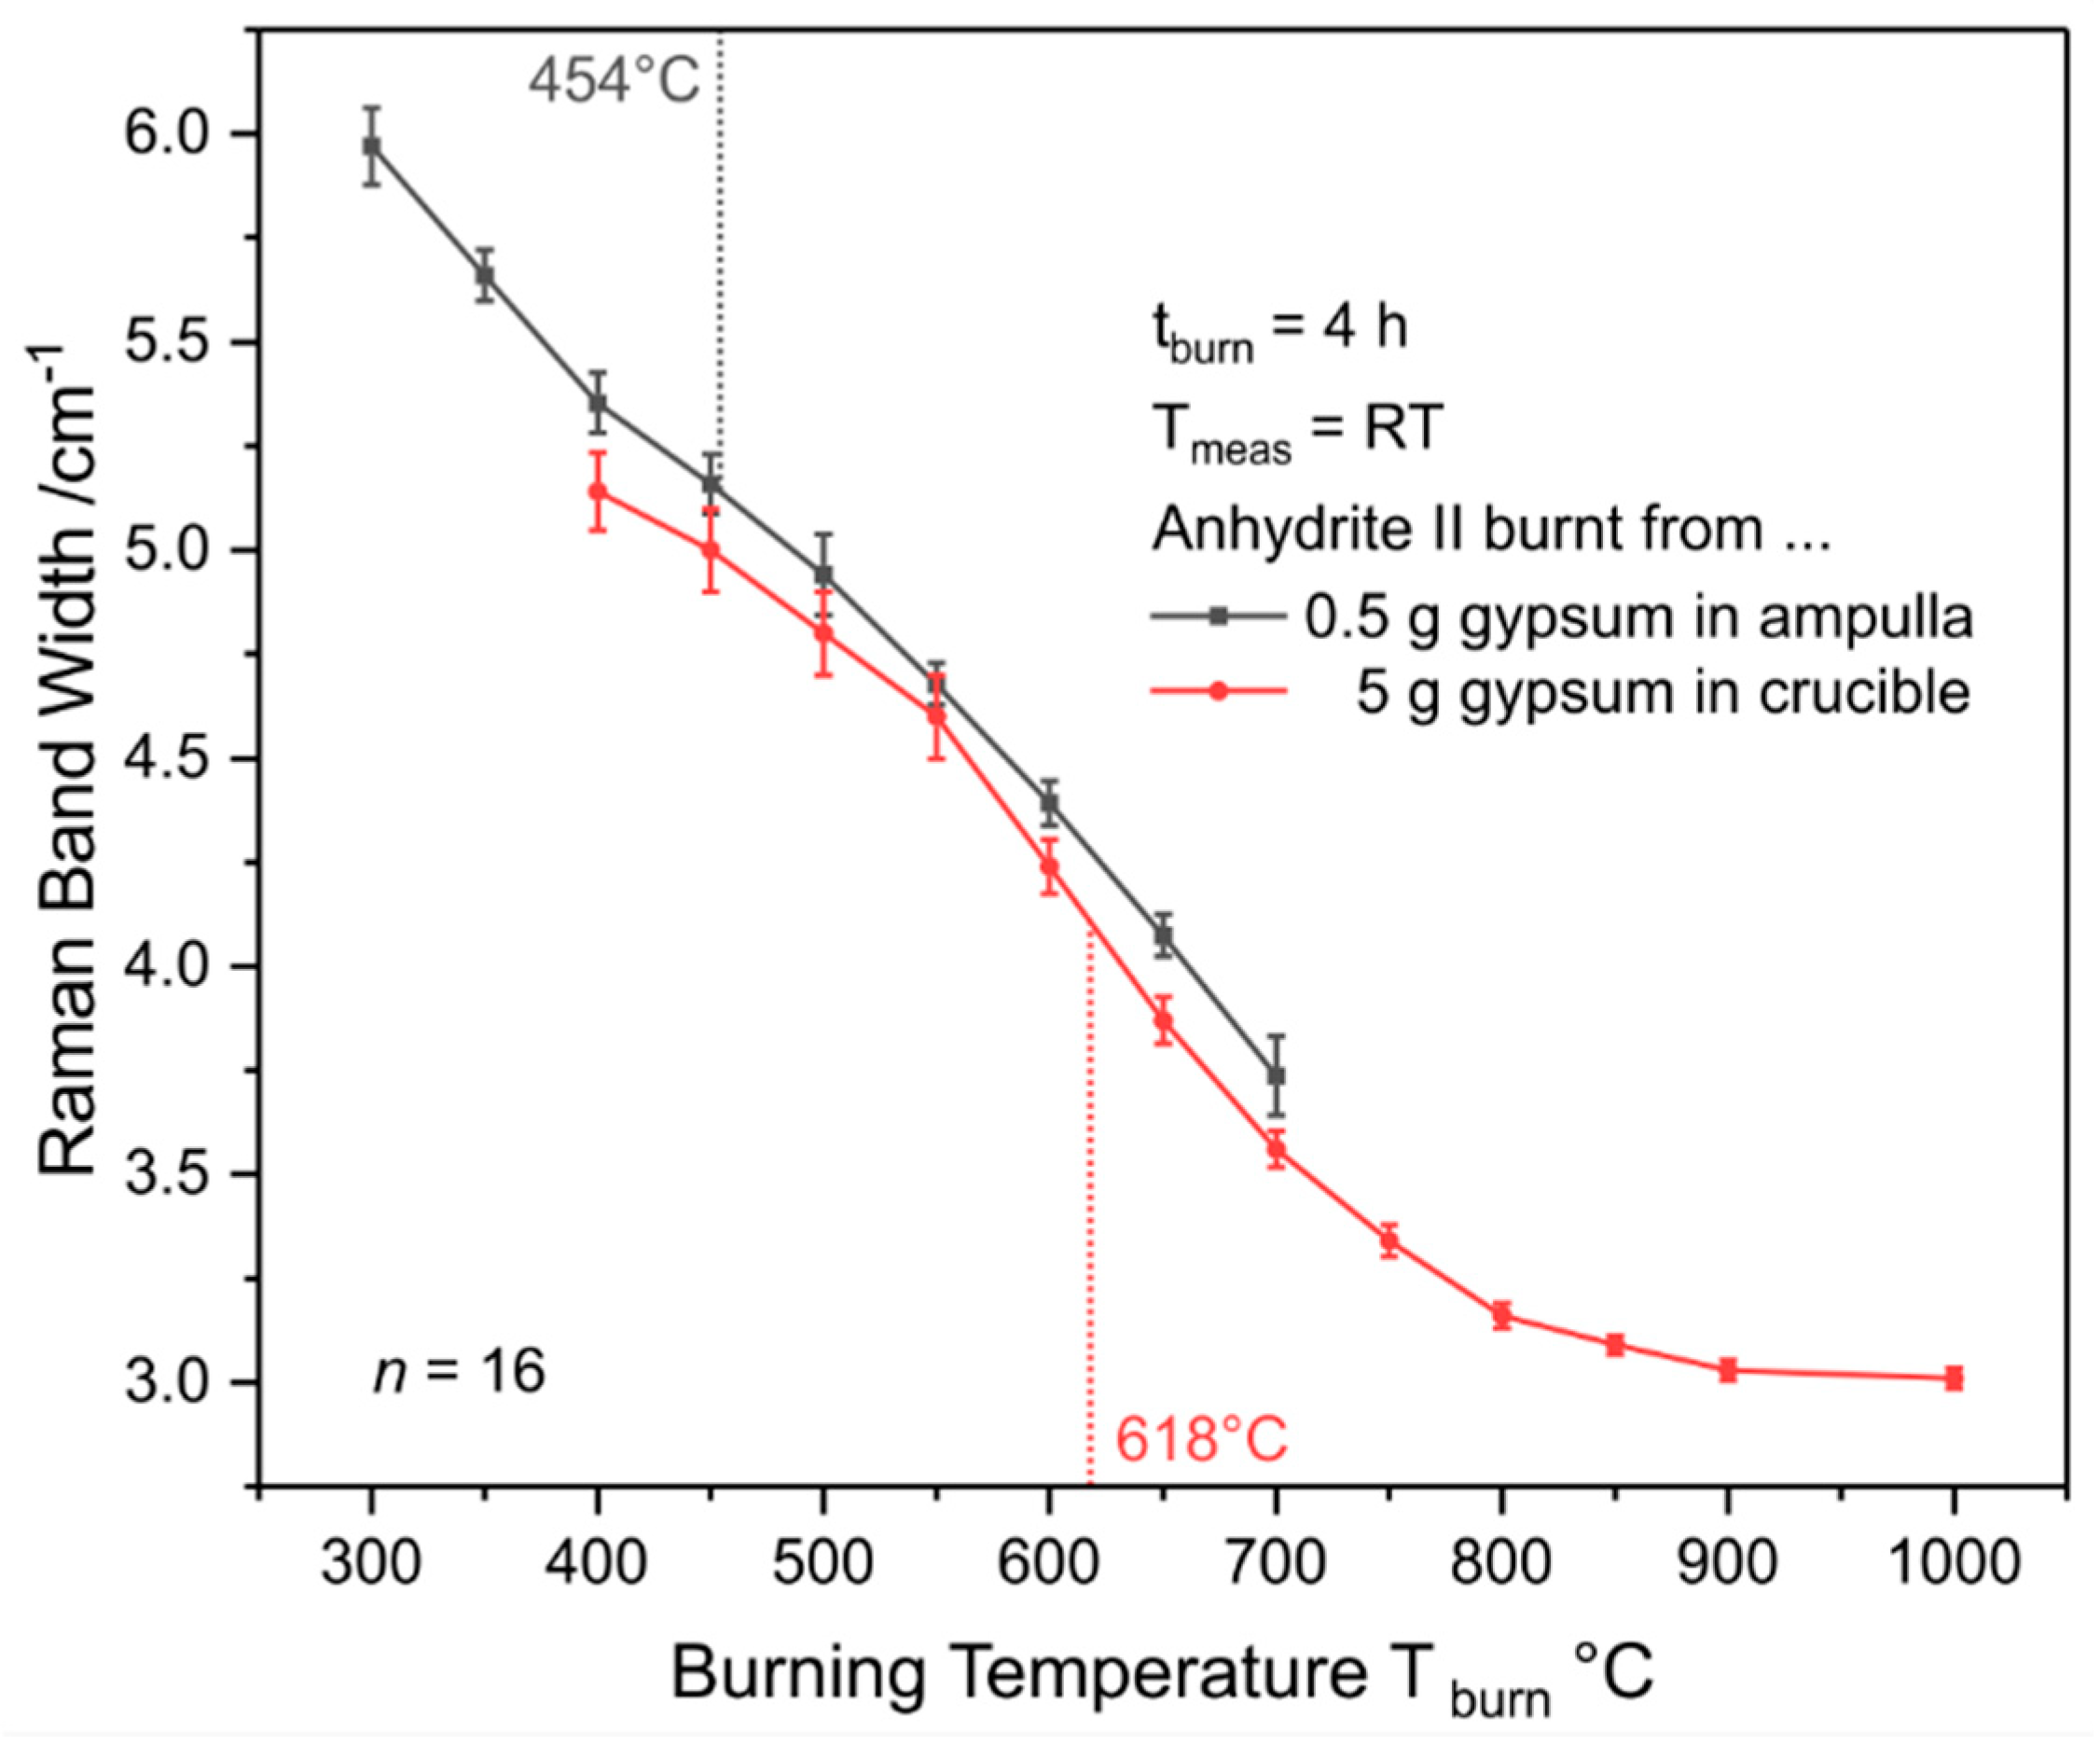
So far, all studies used 5 g gypsum as starting material, which was burnt in open crucibles [21,22,23]. Even though it was placed in a desiccator during cooling and for storage, at least during Raman measurements at ambient air, the significant amounts of anhydrite III present in samples with Tburn < 400 °C (see Figure 17) readily convert into bassanite (compare Figure 15). As a consequence, the clearly separated bands seen in Figure 17 merge into one peak consisting of the ν1 modes of bassanite at 1015–1016 cm−1 and anhydrite II at 1016.5–1017.5 cm−1 (see Figure 2b). Due to these strongly overlapping peaks, deconvolution into two Lorentzian profiles for exact band width determination does not yield meaningful or reproducible results in most cases, which is the reason why the range below 400 °C is not accessible by such an experiment. The red curve in Figure 18 shows Raman band widths of the anhydrite II ν1 mode determined after burning in crucibles, which reproduces the sigmoidal trend of previous studies [21,22,23].
In order to overcome the issue of overlapping bassanite and anhydrite II bands, gypsum powder was calcinated by employing the ampulla method described in Section 2.2. That way, spectra as shown in Figure 17 were obtained. Band widths (FWHMs) were determined as described in Section 2.6. Ampulla experiments can only be performed up to Tburn = 700 °C due to melting of the glass during the holding time at higher burning temperatures while experiments with crucibles can be used to cover the range of AII-E. There is a slight discrepancy between both data sets, which is not significant at a few temperatures when taking the standard deviations into account. An average difference of approximately 0.15 cm−1 between ampulla and crucible FWHMs was observed, which we presumably attribute to the different conditions during gypsum burning. While water can easily leave a crucible via its surface of a diameter of 3.5 cm, the opening of a glass ampulla is only 0.5 cm in width. Thus, due to mass transport limitation, gypsum–bassanite–anhydrite III conversion is expected to take longer in the ampullae, so that the starting point of the anhydrite III–anhydrite II conversion is later in that case, which results in a slightly (from 450 °C to 550 °C not significantly) less crystalline product.
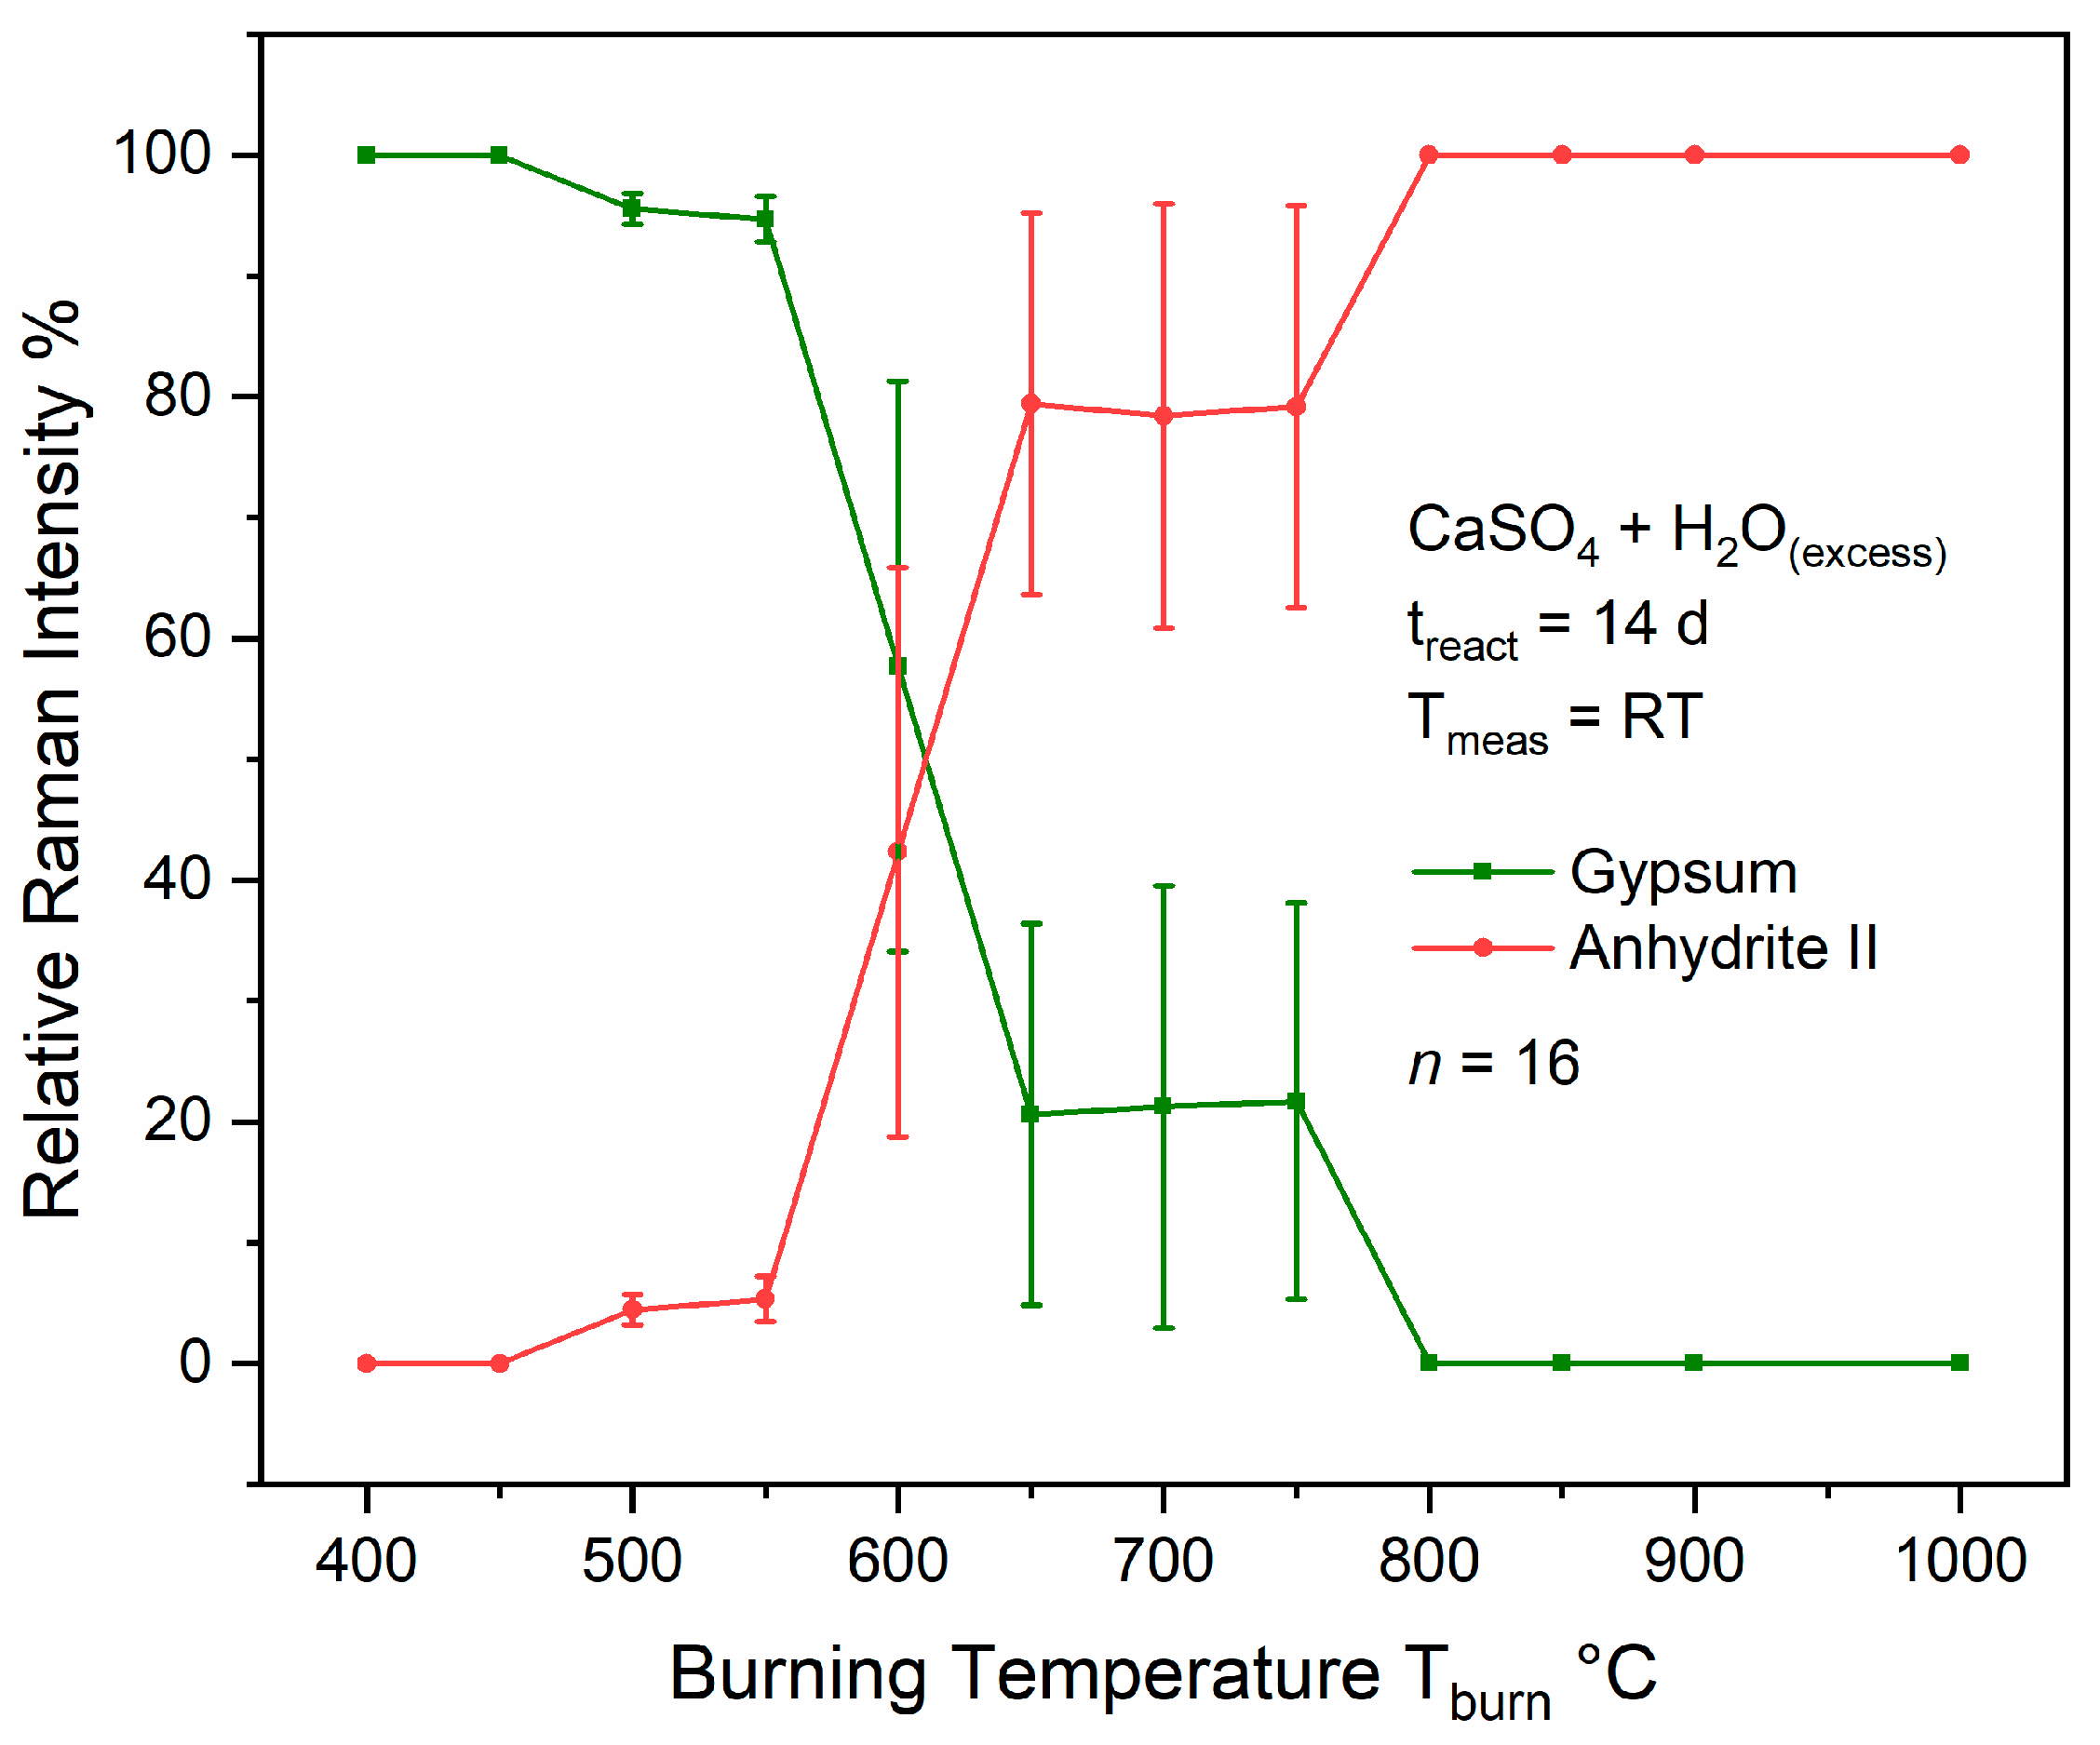
Both curves can be mathematically approximated by sigmoidal or double-sigmoidal functions, respectively, as detailed in Appendix C. Curve fitting reveals a plateau at 454 °C within the ampulla data and an inflexion point at the steepest negative slope of the sigmoid at 618 °C within the crucible curve. Both temperatures highlighted in Figure 18 are near the postulated AII-s–AII-u and AII-u–AII-E transition points, and, thus, seem to coincide with changes in the material’s reactivity. Therefore, a simple reactivity test was performed as described in Section 2.4. Relative Raman intensities calculated according to Equation (1) and plotted in Figure 19 are measures for the relative amounts of anhydrite II and gypsum in the product mixtures obtained after exposing the different anhydrites to an excess of water for 14 days. Note that the large standard deviations in some experiments are most likely because the reactions were conducted without shaking or stirring of the mixtures.
Full conversion into gypsum was achieved for anhydrites burnt at <500 °C, while small amounts of anhydrite were still present when using anhydrite II calcinated at 500–550 °C. Only partial hydration with relative Raman intensities of anhydrite II between approximately 40% and 80% in the product mixture was observed at Tburn ranging from 600 °C to 750 °C, while the material did not react with water within 14 days when burnt at >800 °C, which is in accordance with previous studies [52,53,54,55]. This simple reactivity test can be discussed based on the three postulated sub-phases AII-s, AII-u, and AII-E. A comparison of the reactivity with the FWHM curve shows that the plateau coincides with the AII-s–AII-u conversion, while the inflexion point at the steepest slope falls within the range of partial conversion, i.e., of strongest changes in reactivity (at 618 °C, by coincidence almost identical relative Raman intensities of anhydrite II and gypsum are predicted by this data). At the transition to AII-E, the FWHM curve reaches the final plateau phase exhibiting only small changes in crystallinity and approximates the values of natural anhydrite crystals [21,23].
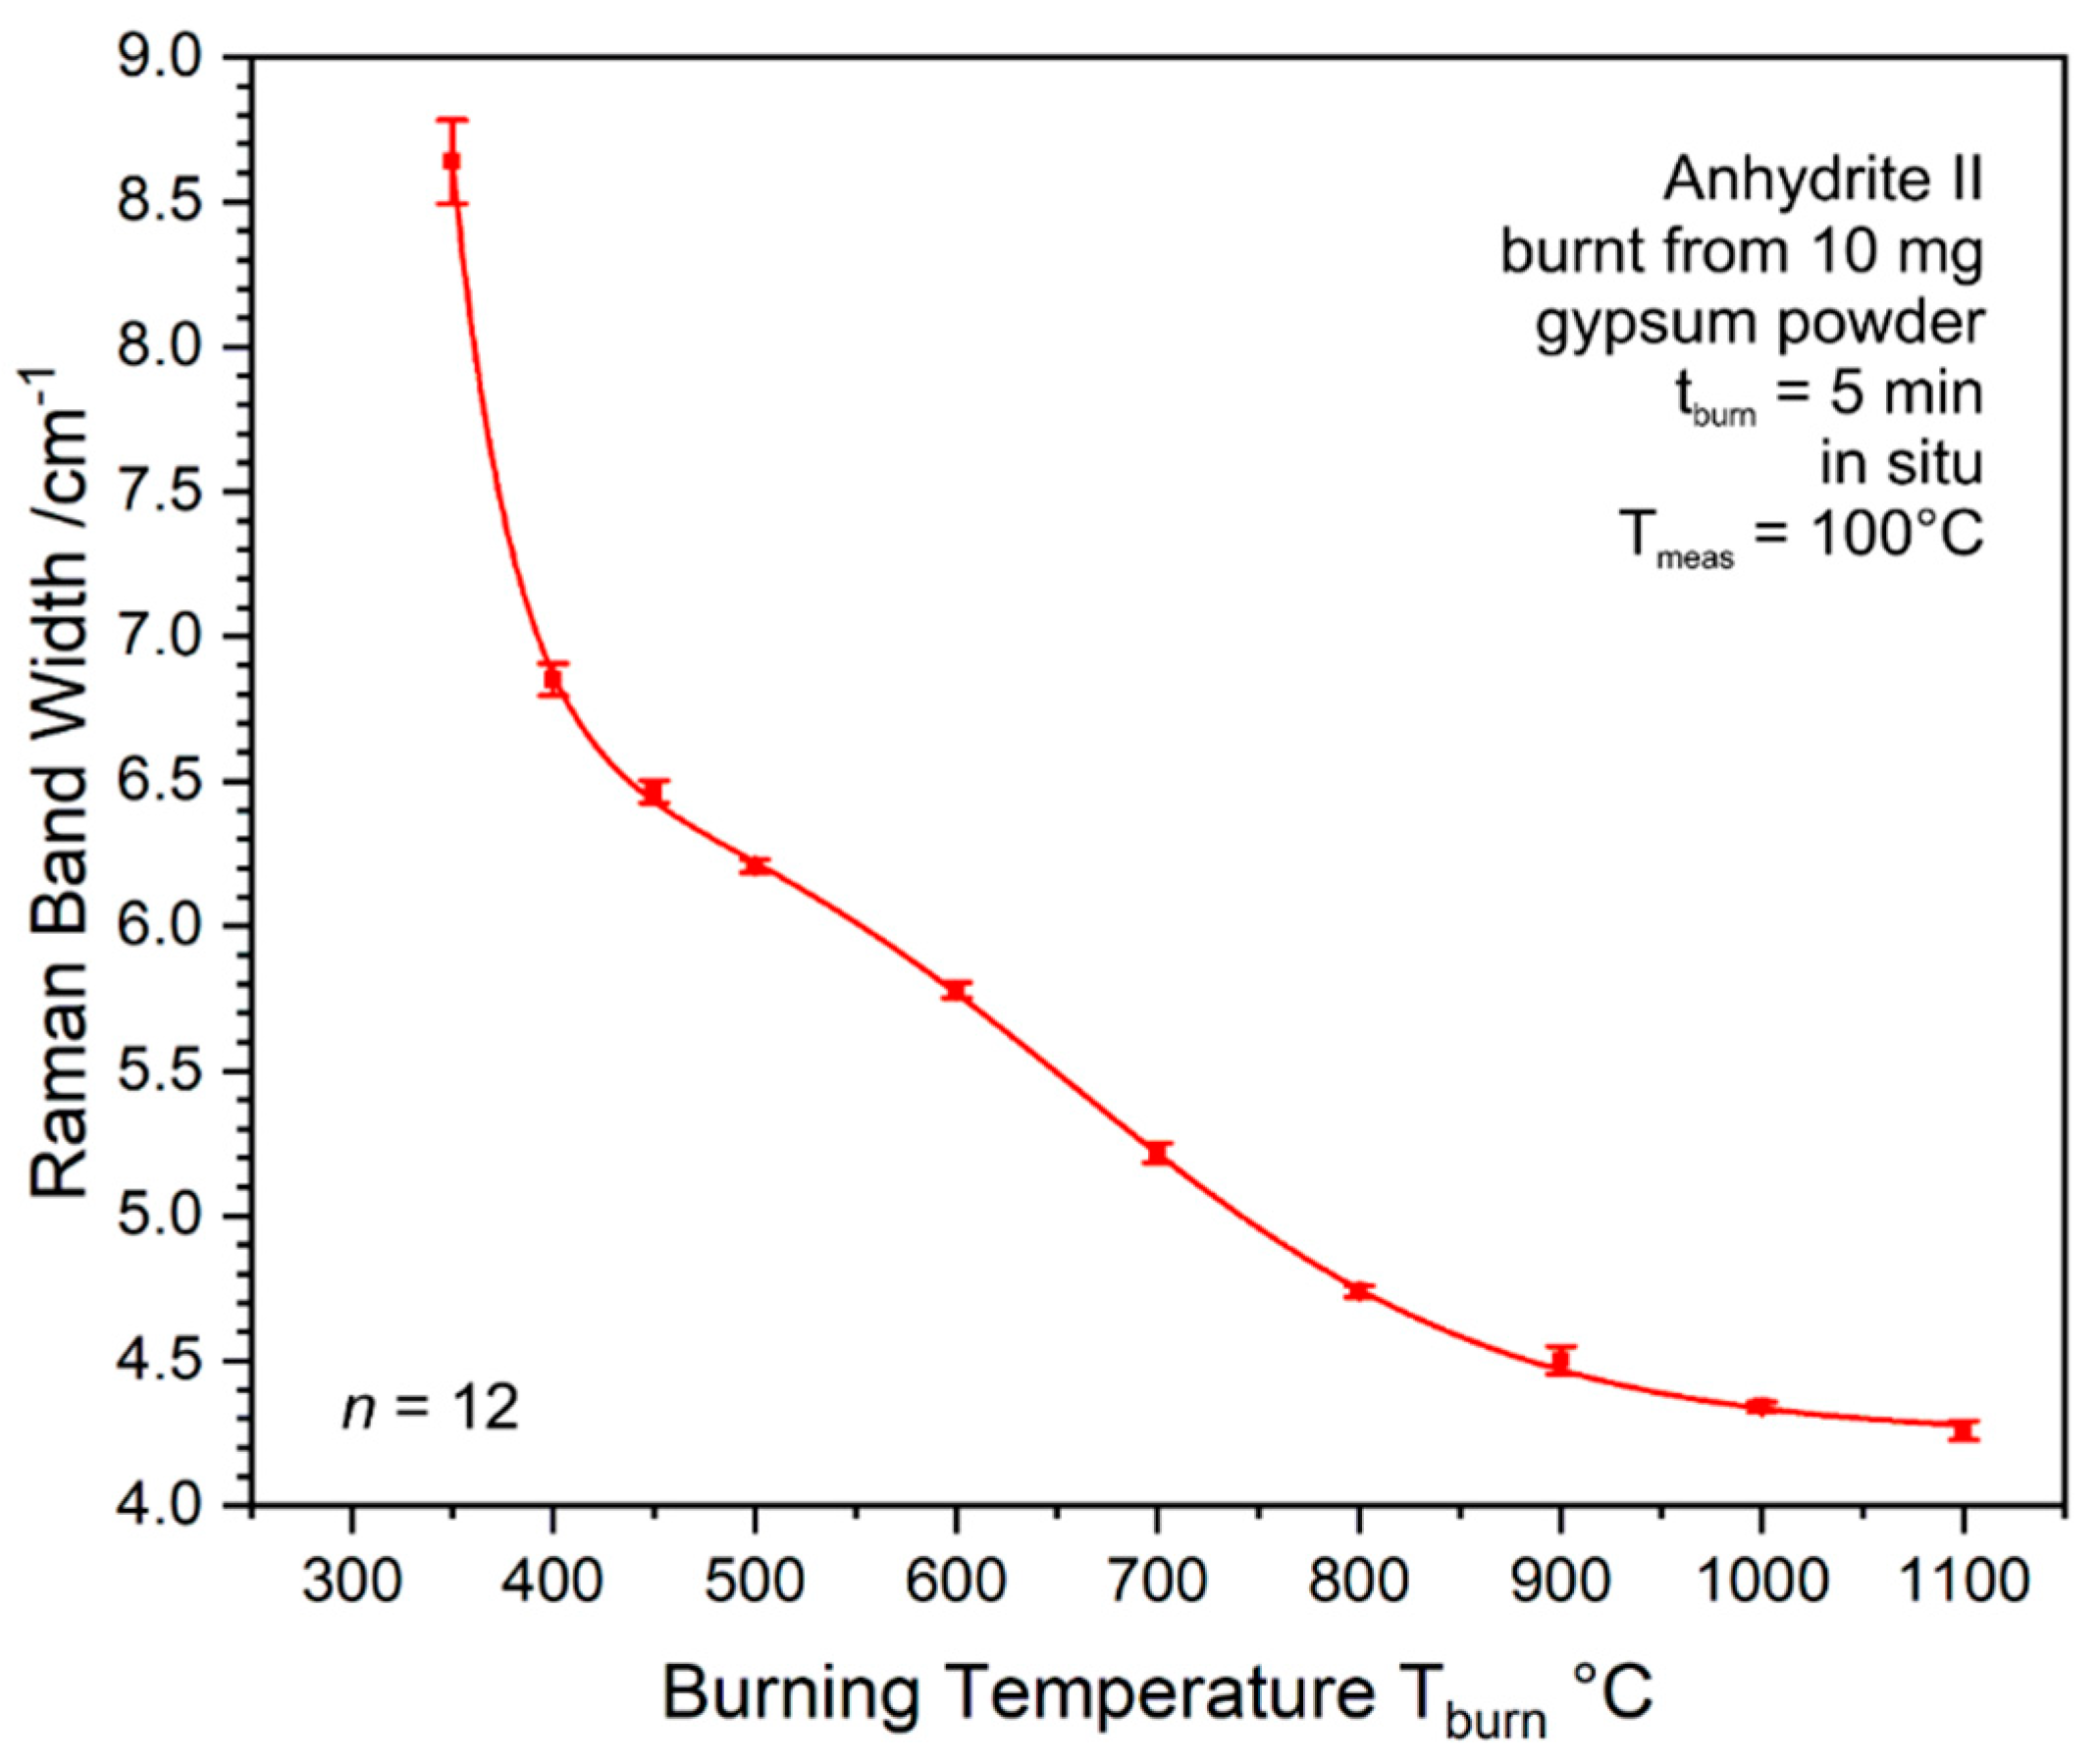
Due to the mentioned experimental limitations, a continuous measurement of the FWHM development throughout the whole stability range of anhydrite II can only be achieved by in situ analyses (see Section 2.3 for experimental details). In order to protect anhydrite III present in the product at Tburn ≤ 500 °C (see Figure 17) from air humidity, we made use of the finding shown in Figure 15 by heating gypsum to different burning temperatures and subsequent cooling down to the measurement temperature of Tmeas = 100 °C at which anhydrite III is stabilised. Within this experiment, n = 12 measurements were performed at the same sample spot for each temperature step. Therefore, the resulting standard deviations are smaller than in ex situ measurements (compare Figure 18), where they also reflect sample heterogeneities. Figure 20a shows the relative Raman intensities assigned to anhydrite II and anhydrite III, which are in good agreement with a previous XRD investigation [56] and confirm the observation of anhydrite III at Tburn ≤ 500 °C (see Figure 17).
Because the anhydrite II ν1 mode was too weak to be analysed at Tburn ≤ 300 °C, the FWHM curve in Figure 20b starts at 350 °C. The curve confirms the double-sigmoidal trend predicted based on the ampulla and crucible data shown in Figure 18. As described in Appendix C, curve fitting yields a plateau at 494 °C and an inflexion point at 659 °C. Both characteristic temperatures are shifted up by approximately 40 K, which might be due to a slightly too low burning time or generally due to the different conditions of 5 g, 0.5 g, and 10 mg starting material as well as 4 h vs. 5 min holding time period but is most likely within the overall uncertainty of these experiments. Generally, we can conclude that ex situ and in situ experiments agree well and result in a plateau phase at around 460–500 °C and an inflexion point reflecting the strongest change of properties at approximately 620–660 °C, while the system reaches a final plateau at around 800 °C.
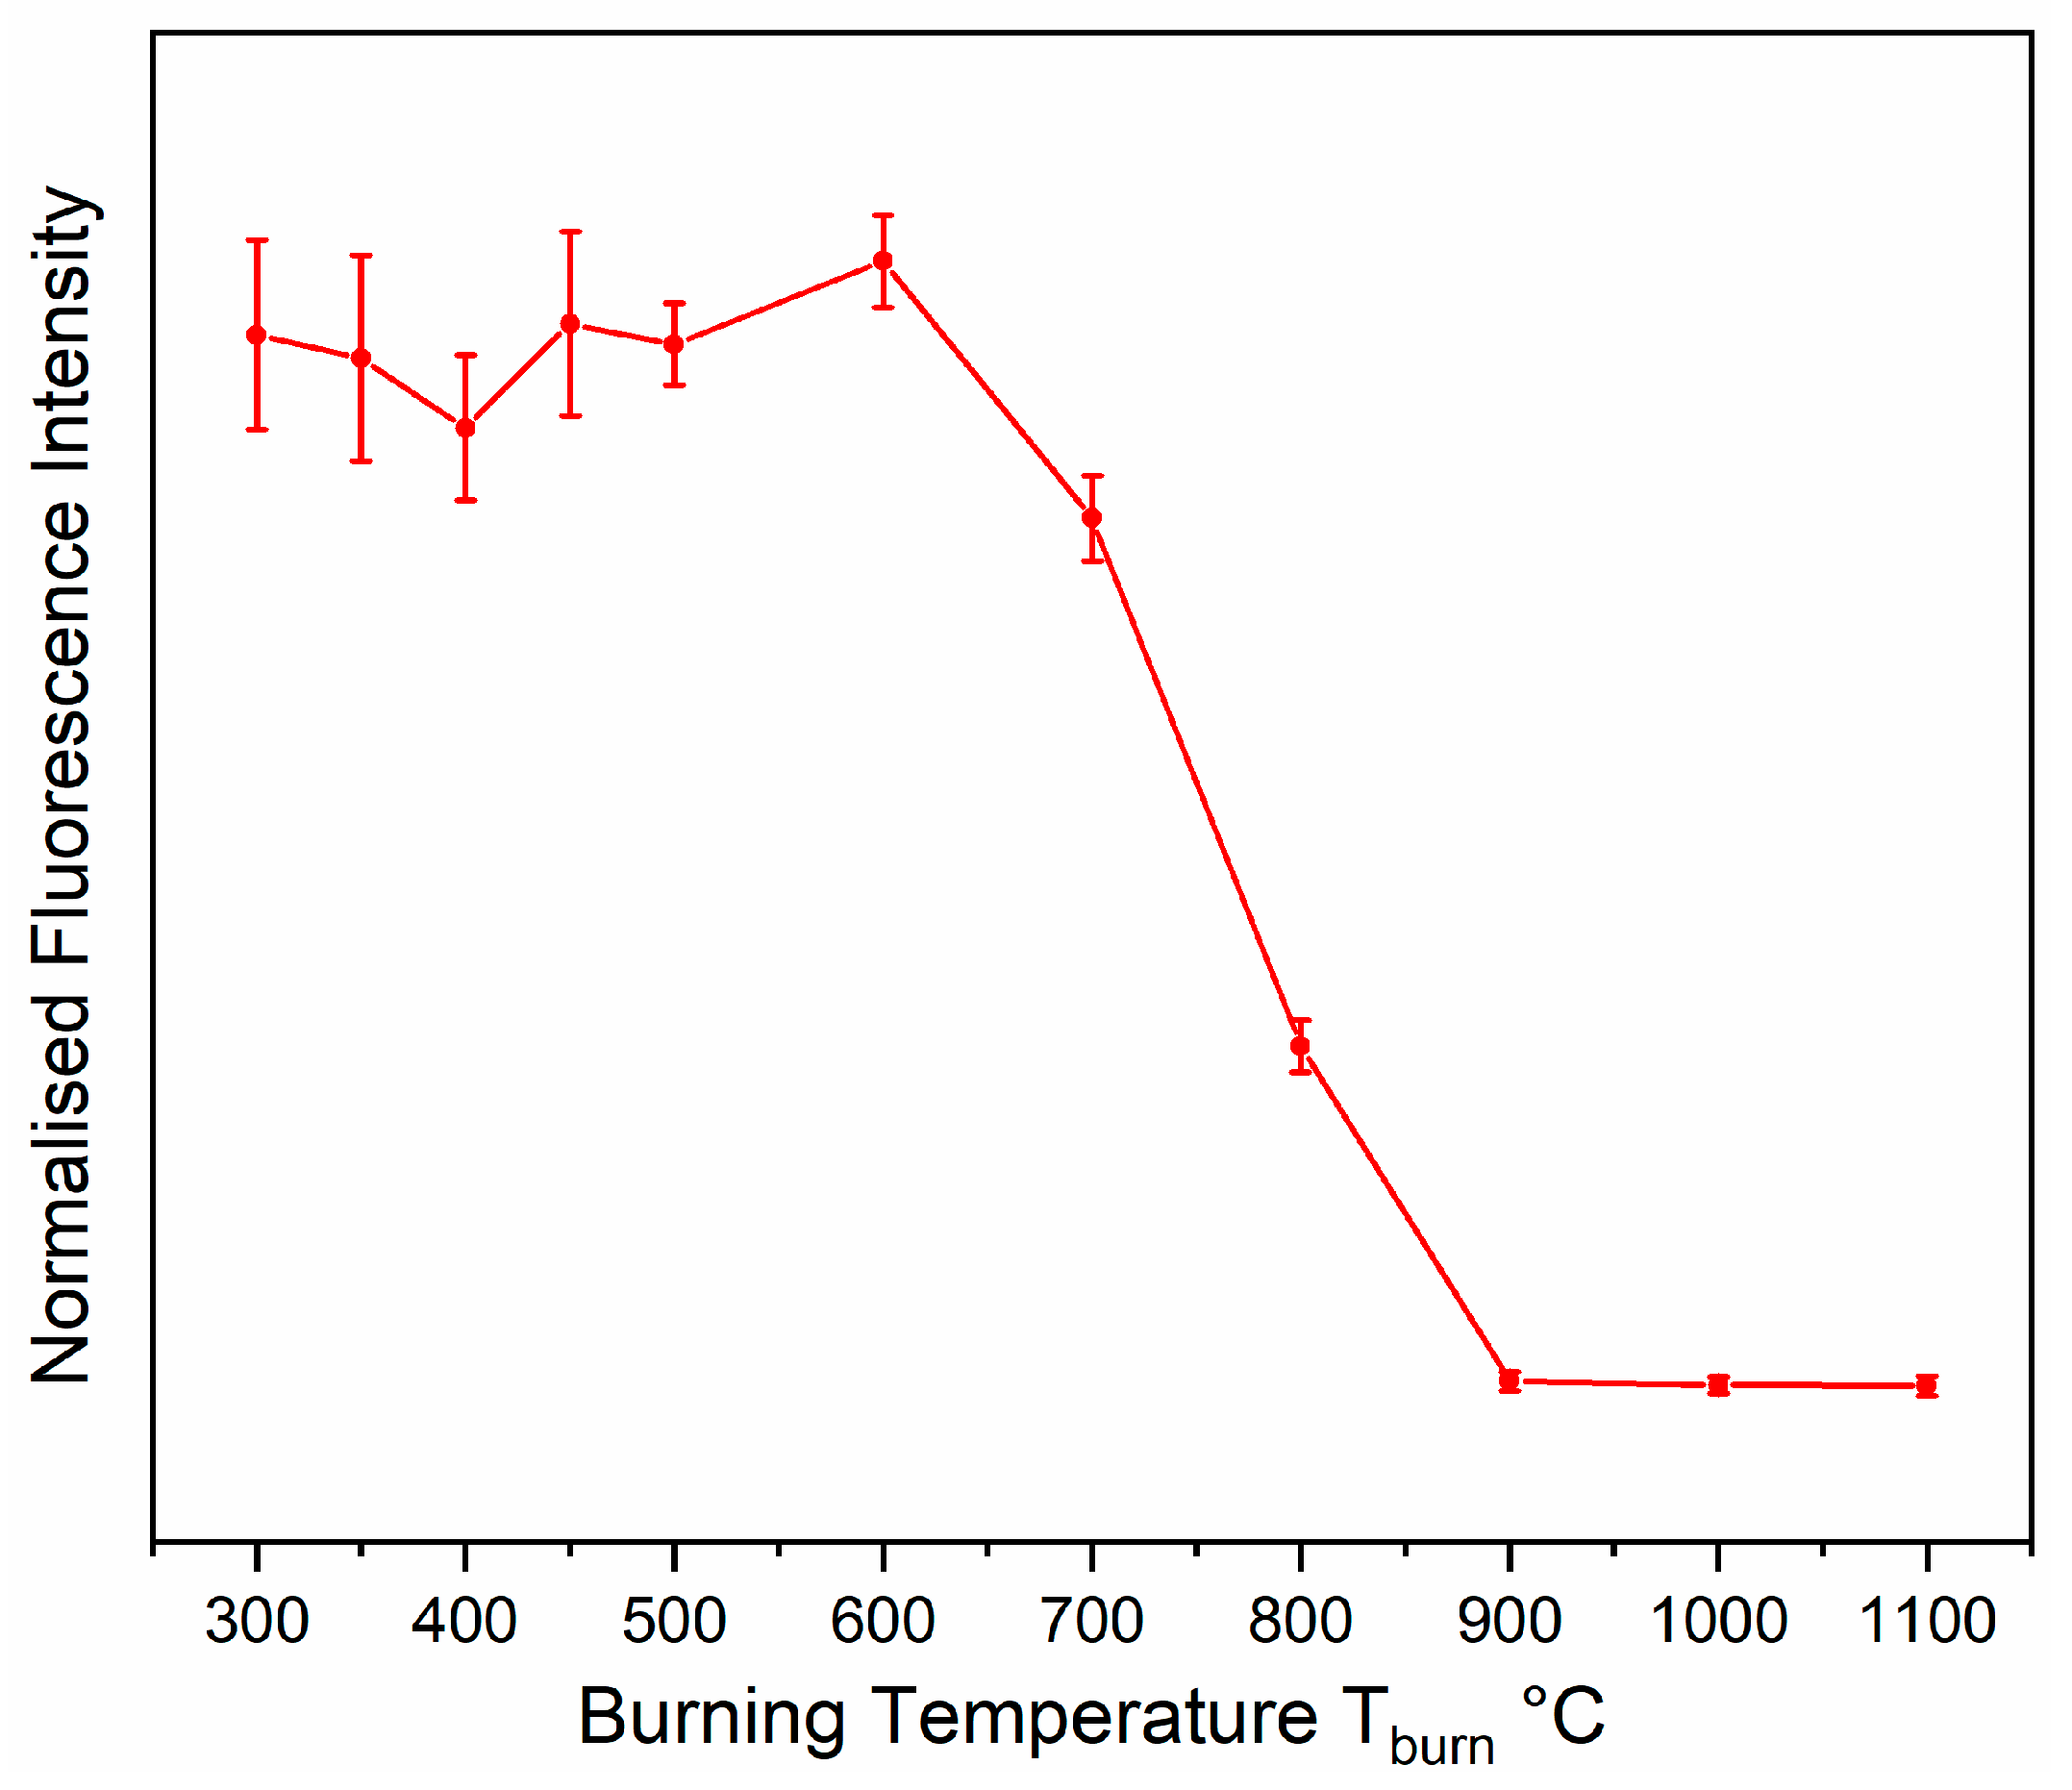
The evaluation of autofluorescence of the material can provide a deeper insight. Fluorescence was observed in the form of a raised baseline of the Raman spectra. Previous studies have shown an emission maximum of anhydrite II at approximately 695 nm in the red spectral range [21] and varying intensities depending on the temperature applied during its synthesis, i.e., increase of the emission at low burning temperatures and vanishing of the fluorescence at around Tburn = 900 °C [21,22,23]. Quantitative measurements are difficult to perform in ex situ experiments because of high variabilities within the samples. Within in situ experiments, measurements can be performed at the same sample spot while only varying the calcination temperature, which leads to quantitatively comparable results. Figure 20c reveals an increase of fluorescence emission measured at 570 nm (i.e., 1253 cm−1 Stokes-shifted from the laser emission wavelength 532 nm within the actual green spectral range, which is still on the rising edge of the spectrally broad red emission) at burning temperatures from 300°C to 600 °C, which is followed by a decrease and its disappearance at Tburn = 900 °C.
Fluorescence emission in inorganic materials can have several reasons including organic contaminants, integration of foreign ions (d-block or f-block elements) into crystal lattices, or colour centre defects (F-centres) in crystals. Organic contaminants can be ruled out because the gypsum powder used as starting material was free from fluorescence emission [23]. In case of the integration of foreign ions into the anhydrite II lattice, the decrease of fluorescence at high temperatures is difficult to explain since a constant or steadily increasing emission (due to further integration of ions) would be expected. Yet, this behaviour agrees with the generation and healing of fluorescing crystal lattice defects. Thus, fluorescence intensity can be employed as an indicator for internal crystal lattice defects, whereas the observed changes in Raman band width under simultaneous conservation of the approximately Lorentzian peak shape are attributed to changes of both inner defects and crystallite surfaces [48,49,50,51]. Therefore, evaluation of fluorescence and Raman band widths in the same spectra (Figure 20b,c) enables us to separate these two effects.
The increase of emission within Tburn = 300–500 °C can be explained by the proportionality between fluorescence intensity and concentration. The curves representing the relative Raman (Figure 20a) and fluorescence intensities (Figure 20c) not only follow the same trend, the ratio of fluorescence and relative Raman intensity yields almost constant values within this range (see Appendix D). This means that the phase transition from anhydrite III to anhydrite II generates a defective material with an almost constant defect concentration. Lattice defects can only heal if diffusion within the material is enabled by temperature. Therefore, the defect concentration slightly further increases toward 600 °C, which is followed by a healing phase within approximately Tburn = 600–900 °C.
Coming back to the trend of the Raman band widths representing changes in both crystallite surfaces and crystal lattice defects, the plateau at approximately 500 °C can be understood as a coincidence of two effects: (1) while in the low burning temperature range, individual anhydrite II crystallites are formed within anhydrite III, which grow during the progress of the reaction, full conversion is reached at approximately 500 °C and crystallites can further reduce their specific surface areas only by sintering, and (2) the highest concentration of crystal lattice defects is reached. The loss of surface area slows down over further increasing burning temperatures, following an exponential decay [21], while the ongoing increase in crystallinity is dominated by the healing of inner defects. Thus, the Raman band width and fluorescence curves follow a very similar trend within Tburn = 600–800 °C, with the strongest overall change in crystallinity at the inflexion point at approximately 620–660 °C and the steepest trend in fluorescence depletion at around 770 °C. At higher burning temperatures, both effects reach a plateau phase toward highest crystallinity and weakest reactivity.
Summarising these findings, we can conclude that the reactivity of anhydrite produced at Tburn ≥ 300 °C is influenced by (1) the presence of anhydrite III and its reaction product bassanite (according to Section 3.5) at Tburn ≤ 500 °C, (2) the healing of crystal-lattice defects within anhydrite II at Tburn > 600 °C (reflected by changing autofluorescence), and (3) the increase of overall crystallinity by growth and sintering of crystallites as well as healing of inner defects, which reveals the strongest changes at around 620–660 °C and leads to a final plateau at Tburn ≥ 800 °C (shown by sharpening of Raman bands). A comparison with the postulated sub-phases AII-s, AII-u, and AII-E reveals sparingly soluble anhydrite II as a mixture of low-crystalline AII and bassanite, while AII-u is pure anhydrite II of medium and strongly changing reactivity with the strongest variations at approximately 650 °C ± 50 K (conservatively estimated by taking the measurement uncertainty according to Reference [23] into account), and AII-E is anhydrite II of the lowest reactivity due to the highest crystallinity. This sub-phase might gain reactivity from calcium oxide, which is not necessarily formed by CaSO4 decomposition [19], but might be derived from calcite (and dolomite) present in both gypsum obtained from flue-gas desulphurisation and many natural gypsum stones.
When only looking at the data from reactivity and spectroscopy studies, it seems contradictive to sub-divide AII into three sub-phases, with the middle, AII-u, being characterised by strongly changing crystallinity and reactivity. There are several indications from both literature and our own studies pointing toward a two-fold separation at the mentioned transition temperature of 650 °C ± 50 K. The simple reactivity test shown in Figure 19 reveals a transition from a reactive anhydrite II form into a much less reactive form at approximately this temperature. Paul Rohland mentions the temperature range of 525–600 °C to be ideal for synthesis of reactive anhydrite II, which coincides with the reactive and pure (bassanite-free) anhydrite II of the present study [57]. Our previous studies of several examples of high-fired medieval gypsum mortars yielded anhydrite II grains assigned to burning temperatures ranging from approximately 650 °C up to 900 °C (uncertainty of measurement: ± 50 K), [21,22,23,24] confirming previous light microscopic observations reported in References [58,59,60]. Even though heterogeneous heat distribution in medieval kilns is expected, including lower burning temperatures as well, anhydrite grains generated at the latter were completely converted into gypsum over the centuries, and only the much less reactive grains survived. In this case, the characteristic temperature of 650 °C ± 50 K seems to mark the lower limit. The arguments for this hypothesis are completed by an infrared-spectroscopic study by John Bensted and Satya P. Varma [61] who relate changes within the ν3 bands of anhydrite to two different modifications: β’-CaSO4 (or anhydrite II’, respectively, when translated into the nomenclature employed in the present study) in the burning temperature range of ≤600 °C (determined with a temperature resolution of 100 K) and β-CaSO4 (or anhydrite II, respectively) in the range of ≥700 °C. Additionally, these authors describe different stabilities and reactivities of these two forms and further explain that the modifications are not different crystal structures, but, according to X-ray diffractometry, are related to different stacking arrangements within the same orthorhombic crystal lattice.
Our previous study proofs the indifferent crystal structures within the stability range of anhydrite II as reflected by exactly the same Raman spectra in terms of wavenumbers of bands [23], and our investigations of anhydrite II so far (including the present) elucidate the known differences in reactivity as being due to an increase in overall crystallinity (loss of a specific surface area and healing of crystal lattice defects) as a function of an increasing burning temperature [21,22,23,24]. Since we do not want these to be confused with polymorphs and we would like to point out the structural reason for this classification, we propose the terminology “disordered anhydrite II” and “crystalline anhydrite II” for the different crystallinities obtained by heat treatment either below or above 650 °C ± 50 K.
Further studies are needed to investigate the processes in the high-temperature range including generation of anhydrite I and thermal dissociation of calcium sulphate [8,62,63,64]. So far, our in situ experiments did not show clear changes of Raman spectra pointing to a high-temperature phase transition (see Figure 3). This might be related to the practical difficulties that arise from black-body radiation emitted by anhydrite and the crucible material around the conversion temperature, but also Raman-inactivity of anhydrite I cannot be ruled out, as XRD studies point toward a sodium-chloride crystal structure, which typically leads to solely Raman-inactive 1st order vibrational modes [65,66]. Since calcium oxide is Raman-inactive for the same reason [67], analytical techniques other than Raman spectroscopy are better suited to study calcium sulphate decomposition.
4. Conclusions

The present study confirmed the complexity of the CaSO4–H2O system into which the high structural sensitivity and in situ measurement capability of Raman spectroscopy enabled unique insight. Some open questions needing further research were underlined as well. We would like to highlight the following results of this study.
  • A comprehensive collection of Raman spectroscopic data of the four room-temperature-stable phases of the CaSO4–H2O system was provided: gypsum, bassanite, anhydrite III, and anhydrite II. The spectra of bassanite and anhydrite III were only partially known so far. The wavenumbers of the most prominent ν1 (and other) bands are distinctive for these phases.
  • A shoulder at 1006 cm−1 of the ν1 mode of bassanite at 1016 cm−1, which seemed an altered gypsum mode, was identified as an intrinsic part of the bassanite spectrum and explained with band splitting of all sulphate stretch bands due to coupling of vibrational motions. Further experimental and theoretical work is needed to explain this effect.
  • Mass transport of water is the rate-determining step of the gypsum–bassanite–anhydrite III conversion in many cases. Parallels exist with a physical drying process, which is characterised by different regimes at the surface and within the bulk and is based on water fronts (and reaction fronts) moving from the bulk toward the surface of a stone or particle. Therefore, the composition of the product mixture strongly depends on the amount, density, and comminution of the starting material, water vapour pressure in the reaction volume, and time of calcination.
  • The two forms of the hemihydrate—α-bassanite and β-bassanite—have different macroscopic properties, which are related to altered crystallinities. Raman band width determination enables quantitative discrimination of the two forms.
  • Anhydrite III readily reacts to bassanite when exposed to ambient air humidity, but can be stabilised at T ≥ 100 °C.
  • The known decrease of hydration reactivity of anhydrite II as a function of calcination temperature is related to an increase of crystallinity, which can be quantified by Raman band width determination and can be explained by (1) the reduction of specific surface area, and (2) the healing of internal crystal lattice defects at burning temperatures exceeding 600 °C.
  • In contrast to the sub-division of anhydrite II (AII) into AII-s (<500 °C), AII-u (500–700 °C), and AII-E (>700 °C), we propose to focus onto a critical temperature of 650 °C ± 50 K, which corresponds to the strongest changes in crystallinity and hydration reactivity and separates reactive ”disordered AII” (<650 °C) from a much less reactive “crystalline AII” (>650 °C).
While several questions regarding the four phases of the CaSO4–H2O system stable at room temperature were solved by Raman spectroscopy, conversions at temperatures beyond 1200 °C have been out of reach for this analytical approach due to Raman-inactivity of the decomposition product calcium oxide and a speculated Raman-inactivity of anhydrite I both crystallising in the cubic sodium chloride crystal lattice.

Author Contributions

Conceptualisation, T.S. and P.D.; Methodology, T.S. and P.D.; Software, T.S.; Investigation, T.S., R.J., and P.D.; Resources, T.S. and P.D.; Data curation, T.S. and R.J.; Writing—original draft preparation, T.S. and P.D.; Writing—review and editing, T.S. and P.D.; Visualisation, T.S. and R.J.; Project administration, P.D.; Funding acquisition, P.D. Parts of this study (ex situ measurements) are based on R.J.’s MSc thesis “Thermischer Anhydrit: Make & Measure” (thermal anhydrite: make & measure), Humboldt-Universität zu Berlin, Berlin, Germany, 2019, whose topic was conceptualised by P.D. and T.S. All authors have read and agreed to the published version of the manuscript.

Funding

We gratefully acknowledge a scholarship and funding of the equipment from DFG GSC 1013 SALSA.

Acknowledgments

The authors thank Uwe Kolitsch from the Natural History Museum Vienna (Vienna, Austria) for providing gypsum stones from Cavalese (Italy) and Sebastian Förthner from Knauf Gips KG (Iphofen, Germany) for making samples of α-bassanite and β-bassanite available.

Conflicts of Interest

The authors declare no conflict of interest. The funders had no role in the design of the study, in the collection, analyses, or interpretation of data, in the writing of the manuscript, or in the decision to publish the results.

Appendix A. Characterisation of the Starting Materials

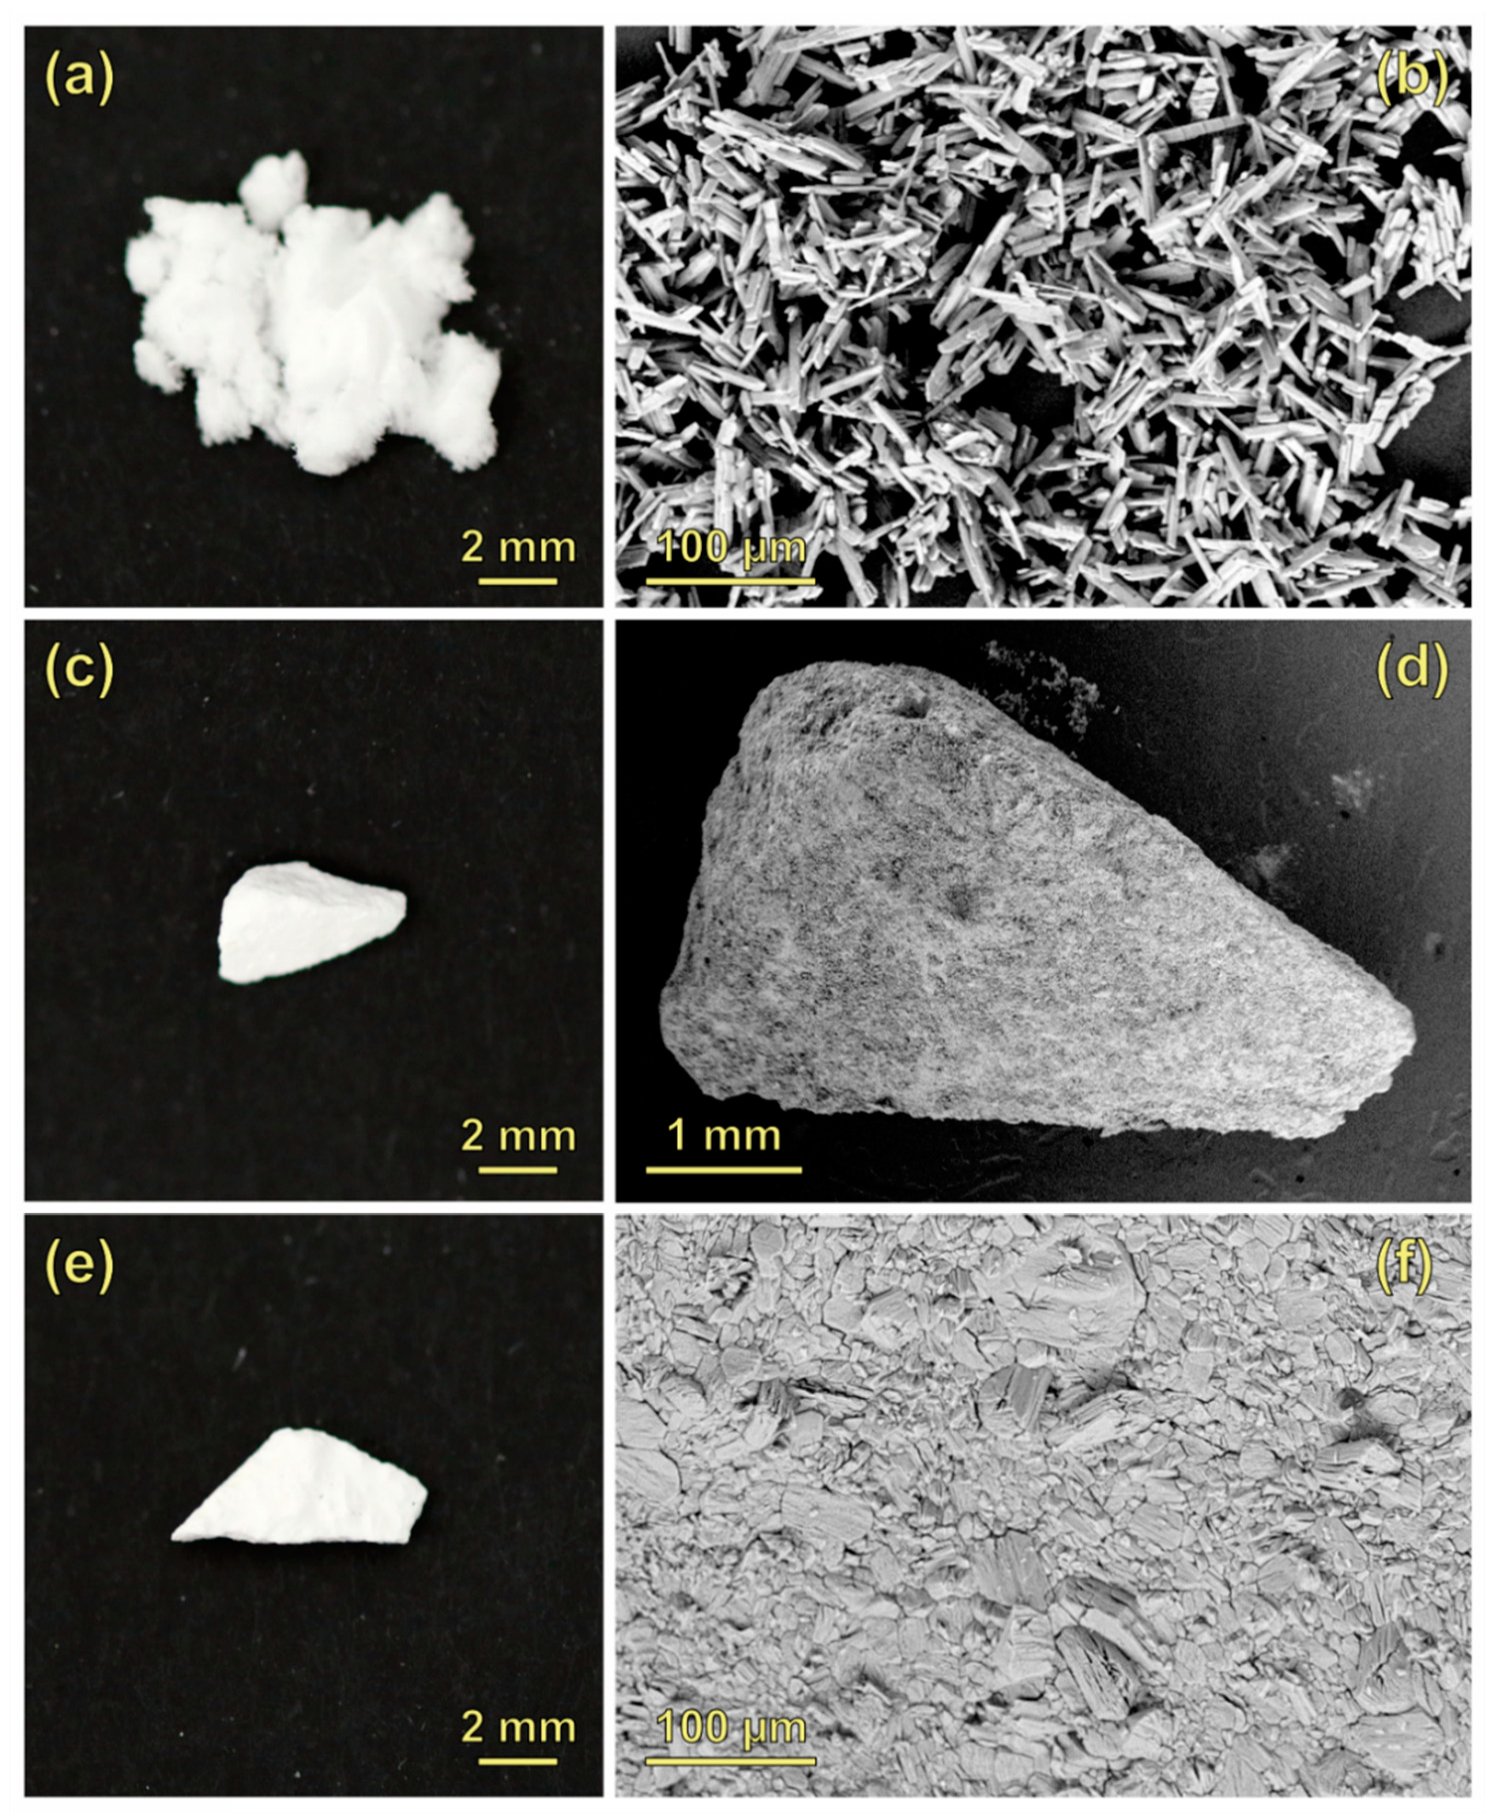
Figure A1. (a) 20 mg of gypsum powder and (b) a scanning electron microscopy (SEM) image acquired in backscattered electron (BSE) imaging mode of a cluster of gypsum powder. (c) 20 mg of gypsum stone employed for in situ measurements on the surface and (d) its SEM-BSE image. (e) A total of 20 mg gypsum stone used for in situ measurements within the sub-surface and (f) SEM-BSE image of its surface.
Minerals 10 00115 g0a1
Most gypsum calcination experiments started with gypsum powder with specified purity of ≥98%. Figure A1a shows a photograph of 20 mg of such powder, as it was used in some in situ measurements. The scanning-electron micrograph (Figure A1b) reveals the typical prismatic form of gypsum. A 20-mg gypsum stone fragment, which was used for in situ measurements at its surface, is shown in Figure A1c,d. Another piece of gypsum stone used for sub-surface measurements and an excerpt of its surface, which reveals tabular crystals, are represented by Figure A1e,f.
X-ray diffraction (XRD) measurements demonstrated that this particular stone material consists of 99.3% gypsum and 0.7% calcite, and energy-dispersive X-ray emission spectroscopy (EDX) performed in the scanning electron microscope described in Section 2.7 confirmed this purity by only detecting the elements Ca, S, and O in quantifiable amounts in an atomic percentage ratio of 14%:13%:73%, which almost resembles the theoretical values of 14.3%:14.3%:71.4%. Deviations arise from statistical and systematic errors of the employed calibration-free semi-quantitative evaluation method.

Appendix B. Statistical Test of α-Bassanite and β-Bassanite Data

The question about a significant difference between the mean values of the n = 16 Raman band widths of α-bassanite and β-bassanite, respectively, plotted in Figure 13a can be graphically solved. The error bars represent the standard deviations. Since there is a clear spacing between them, the data sets and mean values can be considered significantly different. A t-test with the null hypothesis that both mean values are the same can be employed to proof this assumption. An unpaired test of the 16 β-bassanite vs. 16 α-bassanite values yields t = 9.6. Thus, the validity of the null hypothesis has a probability of P < 0.001%. This means that the obtained mean values are significantly different despite including both, measurement uncertainties and sample heterogeneities.

Appendix C. Sigmoidal Fits to Raman Band Width Data of Anhydrite II

Figure 18 summarises the developments of Raman band widths of anhydrite II synthesised at different temperatures, either in open crucibles or glass ampullae (see Section 2.2 for details). The ampulla curve is shifted to slightly higher FWHMs by an offset of approximately 0.15 cm−1. Data obtained in the crucible experiments can be described by a sigmoidal function of the form below.
FWHM(Tburn) = FWHMmin + (FWHMmax − FWHMmin)/[1 + exp(k × (Tmid − Tburn))],
with FWHM(Tburn), FWHMmin, and FWHMmax denoting the full widths at half maximum at a certain burning temperature, at Tburn → ∞ (FWHMmin), and at Tburn → 0 (FWHMmax), respectively. The variables in the exponent are the slope k, the midpoint of the sigmoid Tmid, and the burning temperature Tburn. A fit of such a function to the data results in good agreement (R2 = 0.9994, χ2 = 0.13) and yields FWHMmax = 5.24 cm−1, FWHMmin = 2.99 cm−1, and k = −0.013 K−1. At the midpoint Tmid, the sigmoidal curve has an inflexion point and the steepest slope, which, in this case, is located at 618 °C.
Data obtained in ampulla experiments is well described by a double sigmoid function.
FWHM(Tburn) = FWHMmin + (FWHMmax − FWHMmin) × {µ/[1 + exp(k1 × (Tmid,1 − Tburn))] + (1 − µ)/[1 + exp(k2 × (Tmid,2 − Tburn))]},
with k1 and k2 as well as Tmid,1 and Tmid,2 describing the slopes and midpoints of the first and second part of the double sigmoid, while µ is a scalar factor. A fit of this function yields a good description of the measured data when FWHMmin + 0.15 cm−1 and Tmid,2 = Tmid derived from the crucible data (according to Equation (A1)) are used as constants. With R2 = 0.9996 and χ2 = 0.08, the resulting parameters are FWHMmax = 6.26 cm−1, Tmid,1 = 340°C, k1 = −0.005 K−1, k2 = −0.012 K−1 (in good agreement with k derived from crucible data), and µ = 0.27. The first derivative of Equation (A2) using the mentioned parameters yields negative values throughout the given temperature range where a local maximum indicates a plateau at Tburn = 454 °C, while a local minimum is due to the inflexion point at 618 °C mentioned above. The lines in Figure A2 are graphical representations of these sigmoidal functions.
In addition, in situ data in Figure 20b can be described by the double-sigmoidal function (A2). A fit of this function to the experimental data yields the following parameters (with R2 = 0.9997, χ2 = 0.79): FWHMmin = 4.24 cm−1, k1 = –0.033 K−1, k2 = –0.009 K−1, Tmid,2 = 659 °C, and µ = 0.97. Note that all FWHMs are larger than the corresponding values obtained in the ampulla and crucible experiments (Figure 18 and Figure A2) because of the raised measurement temperature of 100 °C (compare Figure 4a and its description in Section 3.2), while also explaining some of the seeming discrepancies in the obtained parameters. Most clear is the difference in FWHM at the final plateau: FWHMmin = 2.99 cm−1 in the crucible experiments, while 4.24 cm−1 when measured at 100 °C. The inflexion point at 659 °C is also seen as a local minimum in the first derivative, which is accompanied by a plateau identified as local maximum of the first derivative at 494 °C. Figure A3 shows this double-sigmoidal function along with the data points.
Figure A2. Band widths of the ν1 Raman mode of anhydrite II as a function of burning temperature. While the points are the data shown in Figure 18, the lines represent sigmoidal functions fitted to this data.
Minerals 10 00115 g0a2
Figure A3. Double-sigmoidal function fitted to Raman band widths data of anhydrite II from in situ measurements.
Minerals 10 00115 g0a3

Appendix D. Normalisation of Autofluorescence Data of Anhydrite II

The ratio of autofluorescence emission of anhydrite II (see Figure 20c) and the intensity of the ν1 Raman mode of anhydrite II (see Figure 20a) reveals that the increase in fluorescence, which is observed in the burning temperature range of 300–500 °C, can be simply explained with anhydrite II formation out of anhydrite III. The conversion reaction yields defective anhydrite II, and the observed fluorescence is a measure for its concentration. The ratio plotted in Figure A4 is almost constant within this range, and healing of internal crystal lattice defects starts at 600 °C. Error bars in Figure A4 were calculated from the standard deviations of fluorescence intensities sF(Tburn) and relative Raman intensities sR(Tburn), according to the equation below.
sNF(Tburn) = NF(Tburn) × √[(sF(Tburn)/F(Tburn))2 + (sR(Tburn)/R(Tburn))2],
where sNF(Tburn) denotes the resulting uncertainty of the normalised fluorescence intensity, and NF(Tburn), F(Tburn), and R(Tburn) are normalised fluorescence, measured fluorescence, and relative Raman intensities, respectively.
Figure A4. Normalised fluorescence intensity of anhydrite II as a function of its burning temperature calculated as the ratio of measured autofluorescence and Raman intensities.
Minerals 10 00115 g0a4

References

  1. Posnjak, E. The system CaSO4–H2O. Amer. J. Sci. 1938, 35, 247–272. [Google Scholar]
  2. Le Chatelier, H. Recherches expérimentales sur la constitution des mortiers hydrauliques, 1st ed.; Dunod: Paris, France, 1887. [Google Scholar]
  3. Wisniak, J. Henry-Louis Le Châtelier. Educación Química 2003, 14, 105–116. [Google Scholar] [CrossRef]
  4. van’t Hoff, J.; Armstrong, E.; Hinrichsen, W.; Weigert, F.; Just, G. Gips und Anhydrit. Z. Phys. Chem. 1903, 45, 257–306. [Google Scholar]
  5. Davis, W. The nature of the changes involved in the production and setting of plaster of Paris. J. Soc. Chem. Ind. 1907, 26, 727–738. [Google Scholar]
  6. Weiser, H.; Millligan, W.; Ekholm, W. The mechanism of the dehydration of calcium sulfate hemihydrate. J. Amer. Chem. Soc. 1936, 58, 1261–1265. [Google Scholar] [CrossRef] [Green Version]
  7. Grahmann, W. Vergleich der Sulfate der Erdalkalien und des Bleis in den Temperaturkonzentrationsdiagrammen mit Kaliumsulfat unter besonderer Berücksichtigung der Dimorphie von Anhydrit, Cölestin, Baryt und Anglesit. Z. Anorg. Chem. 1913, 81, 257–314. [Google Scholar] [CrossRef]
  8. Newman, E. Behaviour of calcium sulfate at high temperatures. J. Res. Natl. Bur. Stand. 1941, 27, 191–196. [Google Scholar] [CrossRef]
  9. Gruver, R. Differential Thermal-analysis studies of ceramic materials: Characteristic heat effects of some sulfates. J. Am. Ceram. Soc. 1951, 34, 353–357. [Google Scholar] [CrossRef]
  10. Flörke, O. Kristallographische und röntgenometrische Untersuchungen im System CaSO4-CaSO4⋅2H2O. Neues Jb. Mineral. Abh. 1952, 84, 189–240. [Google Scholar]
  11. Flörke, O. Die Hochtemperaturmodifikationen von Kalzium-, Strontium- und Bariumsulfat. Naturwissenschaften 1952, 39, 478–479. [Google Scholar] [CrossRef]
  12. Gutt, W.; Smith, M. The alpha form of calcium sulphate. Trans. Brit. Ceram. Soc. 1967, 66, 337–345. [Google Scholar]
  13. Gay, P. Some crystallographic studies in the system CaSO4-CaSO4⋅2H2O: The polymorphism of anhydrous CaSO4. Mineral. Mag. 1965, 35, 347–353. [Google Scholar]
  14. Momma, K.; Izumi, F. VESTA 3 for three-dimensional visualization of crystal, volumetric and morphology data. J. Appl. Crystallogr. 2011, 44, 1272–1276. [Google Scholar] [CrossRef]
  15. Comodi, P.; Nazzareni, S.; Zanazzi, P.F.; Speziale, S. High-pressure behavior of gypsum: A single-crystal X-ray study. Am. Mineral. 2008, 93, 1530–1537. [Google Scholar] [CrossRef]
  16. Abriel, W.; Nesper, R. Bestimmung der Kristallstruktur von CaSO4(H2O)0.5 mit Rontgenbeugungsmethoden und mit Potentialprofil-Rechnungen. Z. Kristallogr. 1993, 205, 99–113. [Google Scholar]
  17. Bezou, C.; Nonat, A.; Mutin, J.C.; Christensen, A.N.; Lehmann, M.S. Of the crystal structure of gamma-CaSO4, CaSO4∙0.5(H2O), and CaSO4∙0.6(H2O) by powder diffraction methods. J. Solid State Chem. 1995, 117, 165–176. [Google Scholar] [CrossRef]
  18. Hawthorne, F.C.; Ferguson, R.B. Anhydrous sulphates. II. Refinement of the crystal structure of anhydrite. Can. Mineral. 1975, 13, 289–292. [Google Scholar]
  19. Wirsching, F. Calcium sulfate. In Ullmann’s Encyclopedia of Industrial Chemistry; Wiley-VCH Verlag GmbH & Co. KGaA: Weinheim, Germany, 2012; pp. 519–550. [Google Scholar]
  20. Bundesverband der Gipsindustrie e.V. Gips-Datenbuch; Self-publisher: Berlin, Germany, 2013. [Google Scholar]
  21. Dariz, P.; Jakob, C.; Ectors, D.; Neubauer, J.; Schmid, T. Measuring the burning temperatures of anhydrite micrograins in a high-fired medieval gypsum mortar. ChemistrySelect 2017, 2, 9153–9156. [Google Scholar] [CrossRef]
  22. Dariz, P.; Schmid, T. Phase composition and burning history of medieval high-fired gypsum mortars studied by Raman microspectroscopy. Mater. Charact. 2019, 151, 292–301. [Google Scholar] [CrossRef]
  23. Schmid, T.; Jungnickel, R.; Dariz, P. Raman band widths of anhydrite II reveal the burning history of high-fired medieval gypsum mortars. J. Raman Spectrosc. 2019, 50, 1154–1168. [Google Scholar] [CrossRef]
  24. Schmid, T.; Dariz, P. Raman microspectroscopic imaging of binder remnants in historical mortars reveals processing conditions. Heritage 2019, 2, 1662–1683. [Google Scholar] [CrossRef] [Green Version]
  25. Berenblut, B.; Dawson, P.; Wilkinson, G. A comparison of the Raman spectra of anhydrite (CaSO4) and gypsum (CaSO4·2 H2O). Spectrochim. Acta A 1973, 29, 29–36. [Google Scholar] [CrossRef]
  26. Herzberg, G. Infrared and Raman Spectra of Polyatomic Molecules; Van Nostrand Co.: Princeton, NJ, USA; New York, NY, USA, 1945. [Google Scholar]
  27. Berenblut, B.; Dawson, P.; Wilkinson, G. The Raman spectrum of gypsum. Spectrochim. Acta A 1970, 27, 1849–1863. [Google Scholar] [CrossRef]
  28. Sarma, L.P.; Prasad, P.S.R.; Ravikumar, N. Raman Spectroscopic Study of Phase Transitions in Natural Gypsum. J. Raman Spectrosc. 1998, 29, 851–856. [Google Scholar] [CrossRef]
  29. Prasad, P. Raman intensities near gypsum–basanite transition in natural gypsum. J. Raman Spectrosc. 1999, 30, 693–696. [Google Scholar] [CrossRef]
  30. Prasad, P.; Pradhan, A.; Gowd, T. In situ micro-Raman investigation of dehydration mechanism in natural gypsum. Curr. Sci. 2001, 80, 1203–1207. [Google Scholar]
  31. Prieto-Taboada, N.; Gómez-Laserna, O.; Martínez-Arkarazo, I.; Olazabal, M.; Madariaga, J. Raman spectra of the different phases in the CaSO4–H2O system. Anal. Chem. 2014, 86, 10131–10137. [Google Scholar] [CrossRef]
  32. Bensted, J. Uses of Raman Spectroscopy in Cement Chemistry. J. Am. Ceram. Soc. 1976, 59, 140–143. [Google Scholar] [CrossRef]
  33. Kosztolanyi, C.; Mullis, J.; Weidmann, M. Measurements of the phase transformation temperature of gypsum–anhydrite, included in quartz, by microthermometry and Raman microporbe techniques. Chem. Geol. 1987, 61, 19–28. [Google Scholar] [CrossRef]
  34. Chio, C.H.; Sharma, S.K.; Muenow, D.W. Micro-Raman studies of gypsum in the temperature range between 9 K and 373 K. Am. Mineral. 2004, 89, 390–395. [Google Scholar] [CrossRef]
  35. Hauke, K.; Kehren, J.; Böhme, N.; Zimmer, S.; Geisler, T. In situ hyperspectral Raman imaging: A new method to investigate sintering processes of ceramic material at high-temperature. Appl. Sci. 2019, 9, 1310. [Google Scholar] [CrossRef] [Green Version]
  36. Seufert, S.; Hesse, C.; Götz-Neunhoeffer, F.; Neubauer, J. Quantitative determination of anhydrite III from dehydrated gypsum by XRD. Cem. Concr. Res. 2009, 39, 936–941. [Google Scholar] [CrossRef]
  37. Ballirano, P.; Melis, E. Thermal behaviour and kinetics of dehydration of gypsum in air from in situ real-time laboratory parallel-beam X-ray powder diffraction. Phys. Chem. Miner. 2009, 36, 391–402. [Google Scholar] [CrossRef]
  38. Prieto-Taboada, N.; Larrañaga, A.; Gómez-Laserna, O.; Martínez-Arkarazo, I.; Olazabal, M.; Madariaga, J. The relevance of the combination of XRD and Raman spectroscopy for the characterizatio of the CaSO4–H2O system compounds. Microchem. J. 2015, 122, 102–109. [Google Scholar] [CrossRef]
  39. Chang, H.; Huang, P.; Hou, S. Application of thermo-Raman spectroscopy to study dehydration of CaSO4∙2H2O and CaSO4·0.5H2O. Mater. Chem. Phys. 1999, 58, 12–19. [Google Scholar] [CrossRef]
  40. Freyer, D.; Voigt, W. Can mixtures of α- und β-hemidrates be quantified by means of thermoanalysis? ZKG Int. 2009, 62, 47–53. [Google Scholar]
  41. Berthold, C.; Presser, V.; Huber, N.; Nickel, K. 1+1=3: Coupling µ-XRD and DTA. New insights in temperature-dependent phase transitions. The gypsum-bassanite-anhydrite system as an example. J. Therm. Anal. Calorim. 2011, 103, 917–923. [Google Scholar] [CrossRef]
  42. Schmid, T.; Schäfer, N.; Levcenko, S.; Rissom, T.; Abou-Ras, D. Orientation-distribution mapping of polycrystalline materials by Raman microspectroscopy. Sci. Rep. 2015, 5, 18410. [Google Scholar] [CrossRef] [Green Version]
  43. Onwude, D.; Hashim, N.; Janius, R.; Nawi, N.; Abdan, K. Modeling the thin-layer drying of fruits and vegetables: A review. Compr. Rev. Food Sci. F. 2016, 15, 599–618. [Google Scholar] [CrossRef]
  44. Jerger, E. Mechanism of moisture movement in the drying of organic granular solids. PhD Thesis, Iowa State College of Agriculture and Mechanic Arts, Ames, IA, USA, 1951. [Google Scholar]
  45. Singh, N.; Middendorf, B. Calcium sulphate hemihydrate hydration leading to gypsum crystallization. Prog. Cryst. Growth Charact. 2007, 53, 57–77. [Google Scholar] [CrossRef]
  46. Morris, R. X-ray diffraction identification of the alpha- and beta-forms of calcium sulphate hemihydrate. Nature 1963, 198, 1298–1299. [Google Scholar] [CrossRef]
  47. Christensen, A.; Jensen, T.; Nonat, A. A new calcium sulfate hemi-hydrate. Dalton Trans. 2010, 39, 2044–2048. [Google Scholar] [CrossRef] [PubMed]
  48. Behringer, J. The Shape and Width of Resonance Raman Spectral Lines. J. Raman Spectrosc. 1975, 4, 141–157. [Google Scholar] [CrossRef]
  49. Mignuzzi, S.; Pollard, A.J.; Bonini, N.; Brennan, B. Effect of disorder on Raman scattering of single-layer MoS2. Phys. Rev. B 2015, 91, 195411. [Google Scholar] [CrossRef] [Green Version]
  50. Surovtsev, N.V.; Kupriyanov, I. Effect of Nitrogen Impurities on the Raman Line Width in Diamond, Revisited. Crystals 2017, 7, 239. [Google Scholar] [CrossRef] [Green Version]
  51. Califano, S.; Schettino, V. Vibrational relaxation in molecular crystals. Int. Rev. Phys. Chem. 1988, 7, 19–57. [Google Scholar] [CrossRef]
  52. Michaëlis, W. Zur Wasseraufnahme des gebrannten Gipses. Notizblatt des Deutschen Vereins für Fabrication von Ziegeln, Thonwaaren, Kalk und Cement 1871, 7, 332–335. [Google Scholar]
  53. Schott, F. Über die hydraulischen Eigenschaften des in der Glühhitze behandelten Gypses. Polytech. J. 1871, 202, 355–364. [Google Scholar]
  54. Müller, R. Untersuchungen über Gips. PhD Thesis, University of Tübingen, Tübingen, Germany, 1904. [Google Scholar]
  55. Moye, A. Der Gips, 2nd ed.; Theodor Thomas: Leipzig, Germany, 1906. [Google Scholar]
  56. Christensen, A.; Olesen, M.; Cerenius, Y.; Jensen, T. Formation and transformation of five different phases in the CaSO4-H2O system: Crystal structure of the subhydrate β-CaSO4·0.5H2O and soluble anhydrite CaSO4. Chem. Mater. 2008, 20, 2124–2132. [Google Scholar] [CrossRef]
  57. Rohland, P. Der Stuck- und Estrichgips, 1st ed.; Quandt & Händel: Leipzig, Germany, 1904. [Google Scholar]
  58. Lenz, R.; Sobott, R. Beobachtungen zu Gefügen historischer Gipsmörtel. In Gipsmörtel im historischen Mauerwerk und an Fassaden; Auras, M., Zier, H.-W., Eds.; WTA Publications: Munich, Germany, 2008; pp. 23–34. [Google Scholar]
  59. Schlütter, F. Mittelalterlicher Hochbrandgips. In 800 Jahre Kunststein—Vom Imitat zum Kunstgut; Brandenburgisches Landesamt für Denkmalpflege und Archäologisches Landesmuseum, Ed.; Wernersche Verlagsgesellschaft mbH: Worms, Germany, 2012; pp. 27–39. [Google Scholar]
  60. Schlütter, F.; Jakubek, M.; Juling, H. Charakterisierung und Eigenschaften historischer Gipsmörtel aus unterschiedlichen Epochen und Anwendungsgebieten. In Gips als Baugrund, Mörtel und Dekorationsmaterial; Institut für Steinkonservierung e.V., Ed.; IFS: Mainz, Germany, 2012; pp. 49–59. [Google Scholar]
  61. Bensted, J.; Varma, S.P. Infrared spectroscopic studies of calcium sulphate heated to high temperatures. Z. Naturforsch. 1971, 26b, 690–693. [Google Scholar] [CrossRef]
  62. Voellmy, A. Die Prüfung der Gipse und Gipsmörtel. In Handbuch der Werkstoffprüfung, 1st ed.; Graf, O., Ed.; Springer: Berlin, Germany, 1941; Volume 3, pp. 592–643. [Google Scholar]
  63. Marchal, G. Recherches sur la décomposition des sulfates métalliques par la chaleur. J. Chim. Phys. 1926, 23, 38–60. [Google Scholar] [CrossRef]
  64. Hofman, H.-O.; Mostowitsch, W. Behaviour of calcium sulphate at elevated temperatures with some fluxes. Trans. Am. Inst. Min. Metall. Eng. 1909, 39, 628–653. [Google Scholar]
  65. Galtier, M.; Montane, A. Propriétés thermodynamiques et optiques des oxydes alcalino-terreux. Phys. Stat. Sol. B 1975, 70, 163–172. [Google Scholar] [CrossRef]
  66. Raptis, C. Evidence of temperature-defect-induced first-order Raman scattering in pure NaCl crystals. Phys. Rev. B 1986, 33, 1350–1352. [Google Scholar] [CrossRef]
  67. Schmid, T.; Dariz, P. Shedding light onto the spectra of lime: Raman and luminescence bands of CaO, Ca(OH)2 and CaCO3. J. Raman Spectrosc. 2015, 46, 141–146. [Google Scholar] [CrossRef]
Figure 1. Crystal structures of the four main phases of the CaSO4–H2O system, which are stable at room temperature. The graphical representations were designed by employing the software VESTA (Visualisation for Electronic and STructural Analysis) [14] and structural data available in References [15,16,17,18].
Minerals 10 00115 g001
Figure 2. (a) Raman spectra of the four phases of the CaSO4–H2O system is stable at room temperature. (b) Excerpt showing the most prominent modes and their typical wavenumber ranges. (c) Glass ampulla with burnt gypsum powder. (d) Raman bands of crystal water in gypsum and bassanite.
Minerals 10 00115 g002
Figure 3. Raman spectra of anhydrite II (Tburn = 1200 °C) acquired in situ at different measurement temperatures (Tmeas). Spectra in (a) are shown as measured (the intensity of the 1300 °C spectrum was reduced by a factor of 0.5), and spectra in (b) were normalised and stacked by adding offset values.
Minerals 10 00115 g003
Figure 4. Development of (a) width (full width at half maximum, FWHM) and (b) peak centre of the most prominent Raman band of anhydrite II (ν1) as a function of measurement temperature.
Minerals 10 00115 g004
Figure 5. Raman spectra of gypsum calcination products generated in a laboratory furnace.
Minerals 10 00115 g005
Figure 6. Raman spectra acquired in situ during conversion of 10 mg gypsum powder via bassanite into anhydrite III at Tburn = 120 °C.
Minerals 10 00115 g006
Figure 7. Selected spectra from the in situ Raman measurements shown in Figure 6 demonstrating their deconvolution into linear combinations of two or three Lorentzian peak profiles. The spectra were acquired at burning times tburn of (a) 300 s, (b) 600 s, (c) 900 s, and (d) 1200 s, respectively.
Minerals 10 00115 g007
Figure 8. Temporal development of (a) relative Raman Intensities and (b) Raman band positions during burning of 10 mg gypsum powder at a constant temperature of Tburn = Tmeas = 120 °C.
Minerals 10 00115 g008
Figure 9. Change of relative intensities of the ν1 bands of gypsum, bassanite, and anhydrite III during calcination of 20 mg gypsum powder at 120 °C.
Minerals 10 00115 g009
Figure 10. Change of relative intensities of the ν1 bands of gypsum, bassanite, and anhydrite III during heating of a 20-mg gypsum stone to 120 °C. The measurements were carried out at the surface.
Minerals 10 00115 g010
Figure 11. Change of relative intensities of the ν1 bands of gypsum, bassanite, and anhydrite III during heating of a 20-mg gypsum stone to 120 °C. The measurements were carried out 100 µm below the surface.
Minerals 10 00115 g011
Figure 12. Raman spectra of two samples of α-bassanite and β-bassanite. The inset shows a baseline-corrected and normalised version of the spectral range around the ν1 band of bassanite.
Minerals 10 00115 g012
Figure 13. Band widths (full widths at half maximum) of the ν1 mode of α-bassanite and β-bassanite from 16 measurements (a) performed at different spots and (b) repeated at the same spot of powder samples. The bar heights represent mean values and the error bars represent standard deviations.
Minerals 10 00115 g013
Figure 14. Raman spectra measured in situ after exposing anhydrite III to ambient air at 80 °C. Anhydrite III was synthesised by burning of 10 mg gypsum powder at 160 °C (tburn = 5 min).
Minerals 10 00115 g014
Figure 15. Trend of normalised Raman intensities of anhydrite III ν1 band during exposure to ambient air at different temperatures. Anhydrite III was synthesised by burning 10 mg gypsum powder at 160 °C for 5 min.
Minerals 10 00115 g015
Figure 16. Decrease of relative Raman intensities during exposure of anhydrite III to ambient air at 80 °C. Anhydrite III was synthesised at 160 °C either from 20 mg gypsum powder or a stone fragment of the same mass, and, in the latter case, the measurements were performed either at the surface or within the sub-surface.
Minerals 10 00115 g016
Figure 17. Raman spectra of gypsum calcination products generated in a laboratory furnace in the temperature range from 150 °C to 500 °C. The measurements were performed at room temperature.
Minerals 10 00115 g017
Figure 18. Full widths at half maximum of the ν1 mode of anhydrite II, which was burnt from gypsum at different temperatures—either in glass ampullae or open crucibles—in a laboratory furnace. The measurements were performed after cooling the kiln run to room temperature.
Minerals 10 00115 g018
Figure 19. Reactivity test of the anhydrite II samples synthesised in crucibles mentioned in Figure 18. Anhydrite was exposed to an approximate three-fold excess of water for 14 days, and relative Raman intensities assigned to gypsum and anhydrite II were determined at 16 sample spots as measures for the compositions of the end products.
Minerals 10 00115 g019
Figure 20. Results of in situ Raman measurements regarding the conversion reaction of anhydrite III to anhydrite II: (a) relative Raman intensities, (b) full widths at half maximum, and (c) intensity of autofluorescence emission by the material as functions of burning temperature Tburn. All measurements were performed at Tmeas = 100 °C.
Minerals 10 00115 g020
Table 1. Wavenumbers (unit: cm−1) of Raman modes of gypsum, bassanite, and anhydrite III and II.
Band AssignmentsGypsumBassaniteAnhydrite IIIAnhydrite II(SO42−)aq
Crystal-lattice phonons (external modes)Ca2+–SO42− crystal-lattice vibrations110
122 121123
133128 132
145149151151
163
171173175169
181196 233
211 269
Sulphate ion modes (internal modes)ν2
δsymm(SO42−)
415430422417451 1
493489491499
ν4
δasymm(SO42−)
606 609613 1
619629632628
670668676675
ν1
νsymm(SO42−)
1008(1006)
1016
10281017981 1
ν3
νasymm(SO42−)
11171116 11111104 1
11351129 1129
11511145
116711521160
11811172
OH stretch modes of crystal waterνsymm(H2O)34043554
νasymm(H2O)34933616
1 Raman modes of the sulphate ion in aqueous solution according to Reference [25].