Article

Implicit Geomodelling of the Merensky and UG2 Reefs of the Bushveld Complex from Open-Source Data: Implications for the Complex’s Structural History

1
Department of Earth Sciences, Stellenbosch University, Private Bag X1, Matieland 7601, South Africa
2
Tect Geological Consulting, Unit 3 Metrohm House, 20 Gardner Williams Avenue, Paardevlei, Somerset West 7130, South Africa
*
Author to whom correspondence should be addressed.
Minerals 2020, 10(11), 975; https://doi.org/10.3390/min10110975
Submission received: 28 September 2020 / Revised: 21 October 2020 / Accepted: 29 October 2020 / Published: 1 November 2020
(This article belongs to the Special Issue 3D-Modelling of Crustal Structures and Mineral Deposit Systems)

Abstract

:
The Bushveld Complex (BC) is the world’s largest source of platinum group metals. Extensive studies on the complex have focused on its geochemistry, magma and platinum group mineral genesis, mineral characterization and intrusion mechanisms. However, relatively little work has been undertaken on the overall 3D geometry of the complex, which detracts from the adequate contextualization of such studies. Furthermore, the absence of a broader 3D model of the complex does not permit the identification of structural trends and mineralization patterns. This contribution details the construction of 3D implicitly-modelled Merensky and UG2 Reefs across the Rustenburg Layered Suite of the BC, using Seequent’s Leapfrog software. Multiple open-source and public-domain data sources and modelling workflows were explored to account for disparities in data resolution, data spacing and clustering, and the resolution of model outputs. Key outcomes are (1) a representative, fully-implicit, dynamic geological model of the Merensky and UG2 Reefs over the main chamber of the BC; (2) identification of modelled features that augment the current understanding of the BC’s kinematic history and cumulative deformation; and (3) identification and analysis of subtle geometrical trends and patterns, such as inter-reef spacing and modelled depths, as well as structural domains that may not have been apparent from numerous, more focused or isolated petrological or geochemical studies. It is anticipated that this baseline 3D model will form the foundation for future, possibly localized, dynamic updates as further information becomes available. The addition of proprietary (viz., non-open-source) data, such as 2D seismic sections and 3D seismic surveys, would enhance the overall resolution and quality of such a model and resulting interpretations.

1. Introduction

The Bushveld Complex (BC) represents the world’s largest source of platinum group metals (PGM), which are critical for multiple industrial applications, from automotive catalysts to components in medical equipment. The BC has been the focus of numerous studies, predominantly on whole rock geochemistry and mineralogy, which seek to develop models for PGM genesis and intrusion mechanisms [1,2,3,4,5]. The majority of these studies examine the cumulate layering across various mines and exploration projects, albeit with limited or only very local contextualization within the overall complex. Without adequate contextualization, analytical results and interpretations from such studies tend to be piecemeal and more subtle trends, that might only become apparent from larger datasets or across larger domains, are not evident. Such subtle trends may hold valuable clues regarding the formation of the complex. Furthermore, relatively little work has been undertaken on the overall 3D structural geometry of the complex, as noted by numerous authors [6,7,8,9,10,11].
There have been several initiatives to model the BC at various scales [9,10,11]. These studies typically focus on a single or primary data type, be it geophysics or mine-based drillhole data. As a result, these tend to be either too broad in scope, or too focused on limited datasets or a specific type of data, to provide a regional structural context. Although the majority of available academic and industry data remain mineralogical or geochemical in nature, exploration and mining companies provide information in technical and CP reports (JORC, NI43-101 and SAMREC) on major platiniferous reefs and marker horizons. Maps and figures in these reports are amenable to georeferencing and digitization. To address this general lack of 3D contextualization, an implicit 3D model of the locally well-constrained Merensky and UG2 Reefs, incorporating available open-source data, was constructed. Data includes drillhole logs and maps from the South African Council for Geoscience (CGS), academic research articles and competent persons (CP) reports. This “crowdsourcing” of disparate data sets is being increasingly utilized by the mining industry and mineral exploration companies [10].
These data sets, sourced from over 254 georeferenced maps and the extensive South African Council for Geosciences drillhole database, combined with implicit modelling, form a sound basis for constructing a robust, statistically-relevant and coherent 3D model of the UG2 and Merensky Reefs in the Rustenburg Layered Series (RLS) of the main chamber of the BC. This model is therefore the first of its kind, in terms of the volume of data, its coverage and the use of multidisciplinary data sets at several scales. Implicitly-modelled surfaces and derived products, such as modelled UG2/Merensky reef depth, reef dip and calculated inter-reef separation provide insight into the deformational history of the BC.

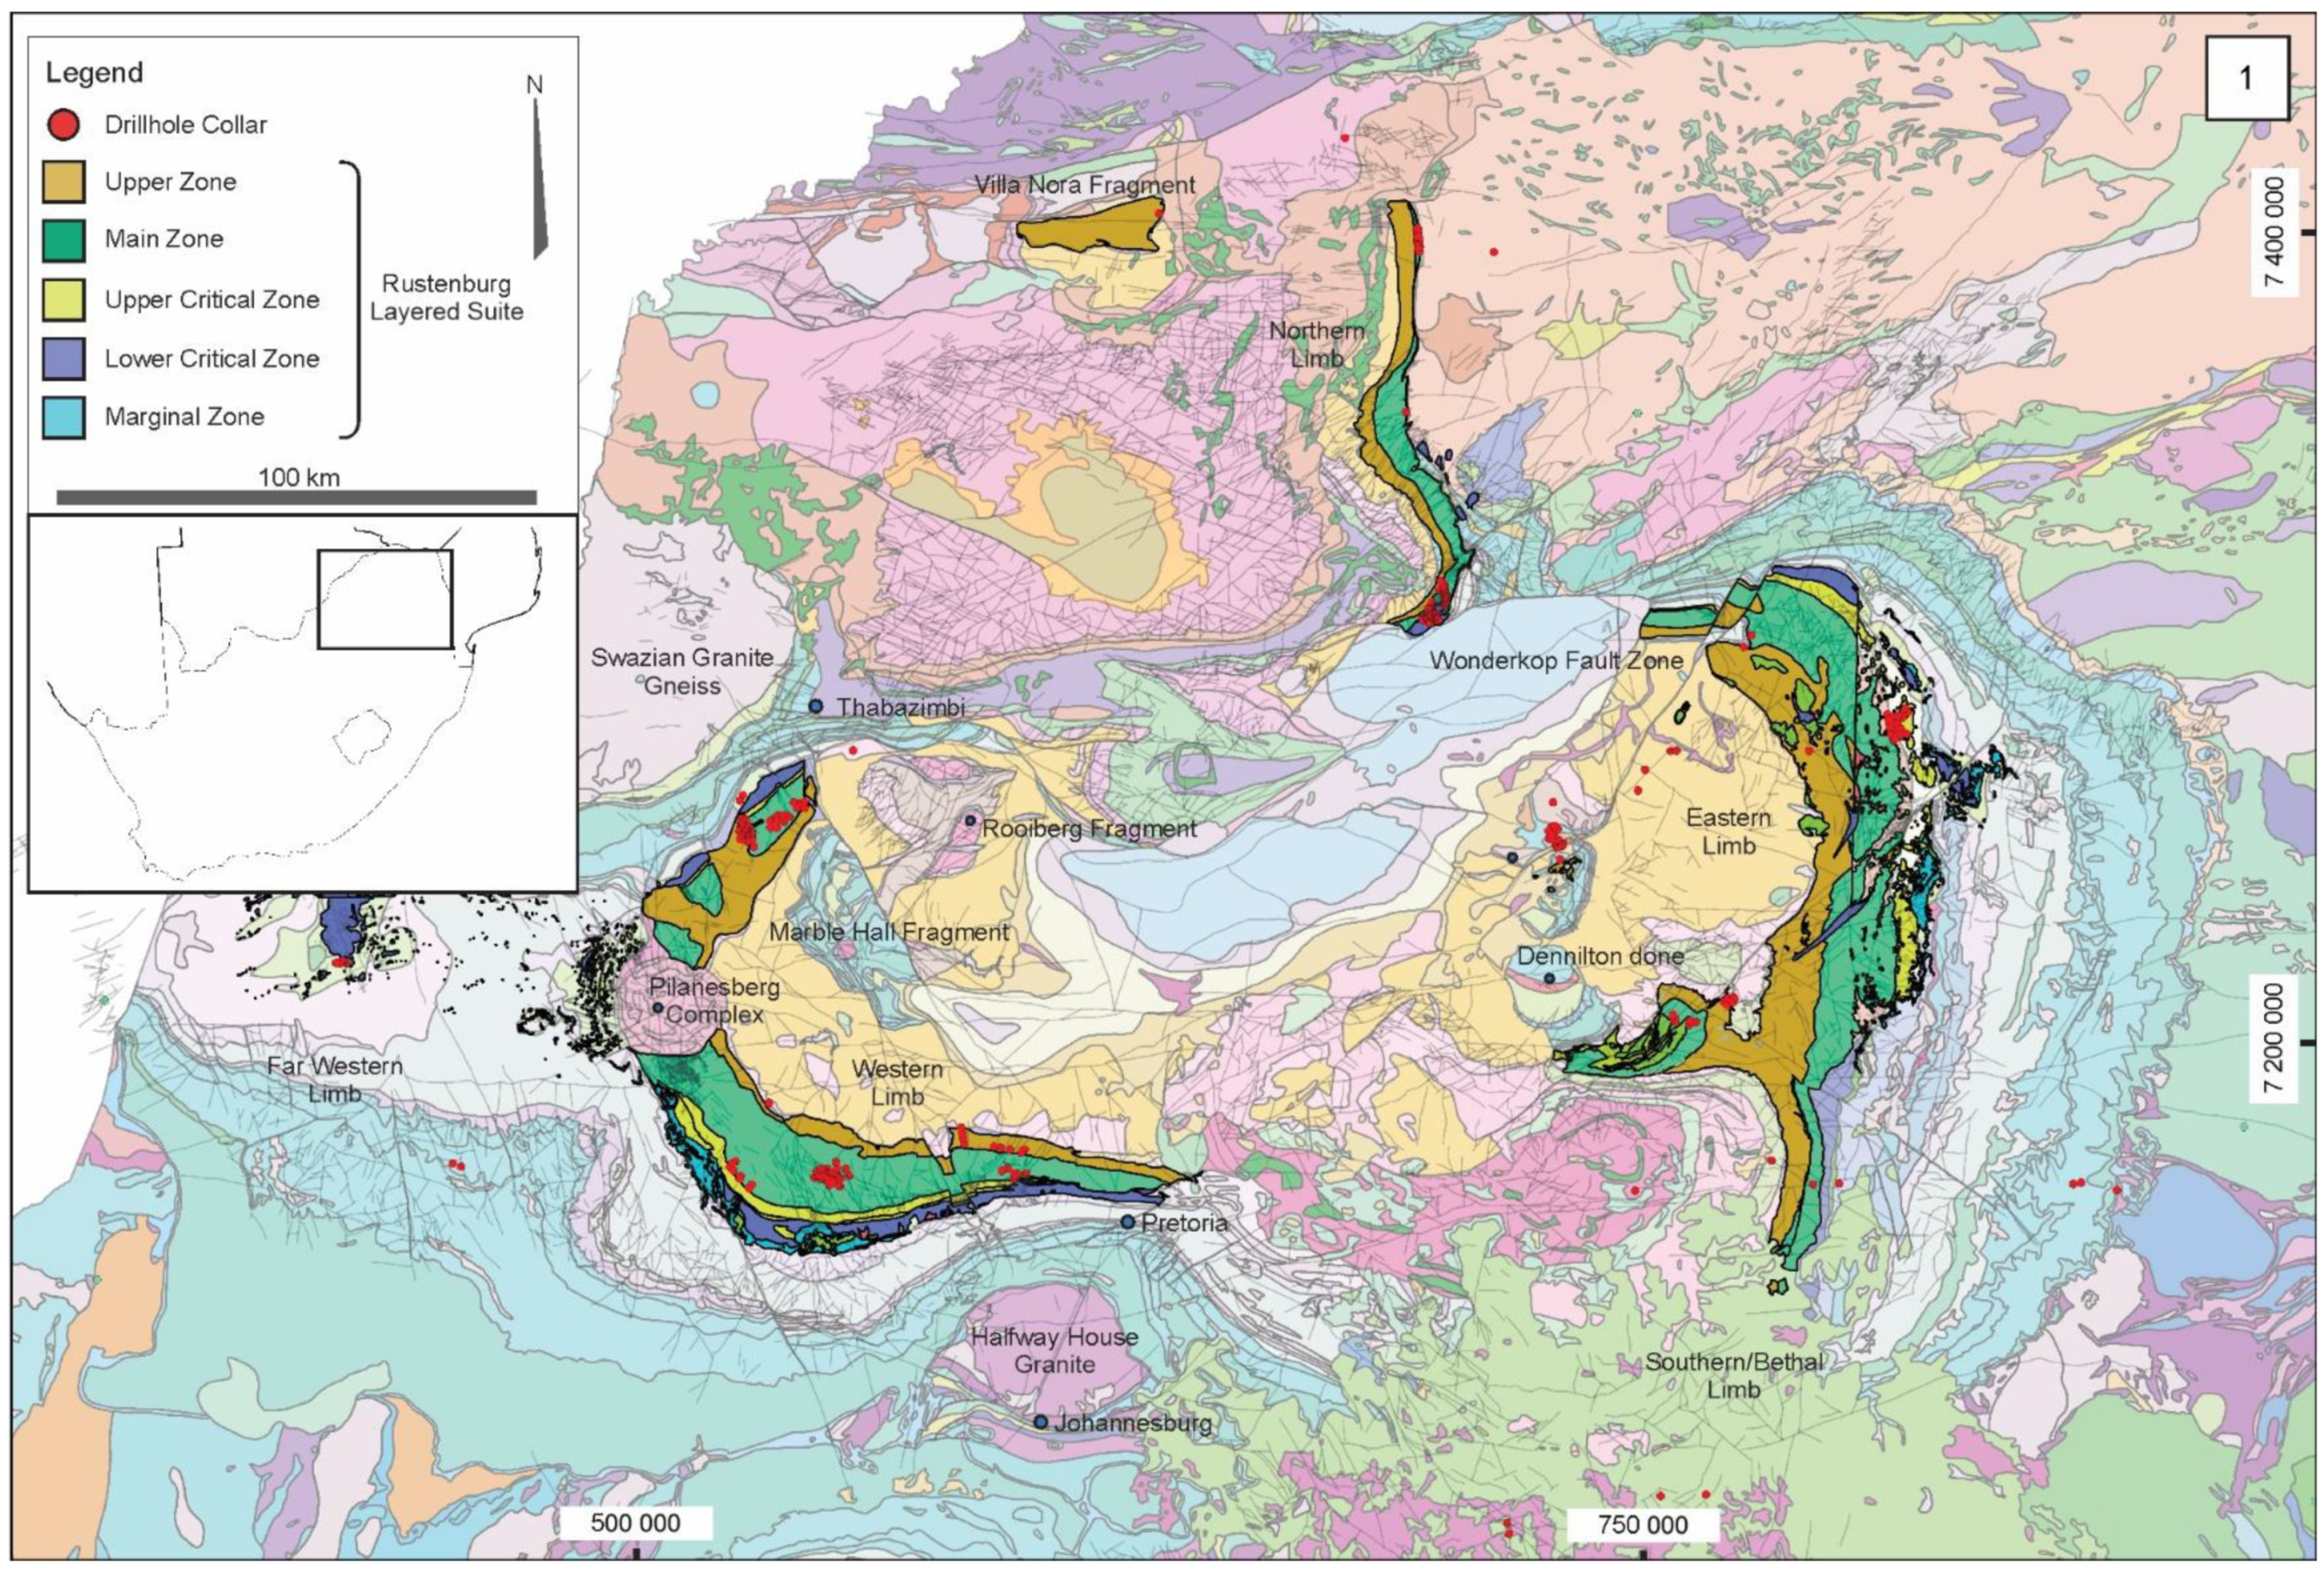
1.1. Geological Context

The BC is the world’s largest layered intrusion, with an estimated average thickness between 7 km and 9 km, and an original regional coverage of >100,000 km2 [12,13,14]. Present-day outcrops cover an area in excess of 65,000 km2 [15,16]. The complex represents the largest known concentration of Cr and PGM globally [17,18]. It consists of four major limbs: Eastern (EL), Western (WL), Northern (NL) and Southern (SL), and the Far Western Limb (Figure 1). Recent models suggest that the complex was emplaced as a series of broad, flat-lying sheets or protrusions, with the main body of the complex intruding into Proterozoic Pretoria Group sediments [19,20,21].
Emplacement of the RLS was preceded by the extrusion of the relatively undeformed and unmetamorphosed Rooiberg Group [16], which is inferred to be the latest component of the Transvaal Supergroup [14,22,23,24]. The ultramafic-mafic sequence of the RLS is compositionally subdivided into five zones [15], including several marker horizons, based primarily on observations and data from the EL and WL [14]. These zones, grading from the base of the RLS, are the Marginal (MZ), Lower (LZ), Critical (CZ), Main and Upper Zones (UZ), with the CZ being host to the majority of economic Cr and PGM mineralization.
The CZ is between 1300 m and 1800 m thick [25] and bounded basally by the first occurrence of cumulus chromite bands, whilst the Giant Mottled (poikilitic) Anorthosite, positioned several meters above the well-documented and highly economic Merensky Reef, represents the Critical Zone’s upper contact. The CZ is characterized by the regular layering of chromitites, pyroxenites, dunites, and harzburgites [23]. It is subdivided into the Upper Critical Zone (UCZ) and Lower Critical Zone (LCZ), [6,14,15,26,27].
The UCZ consists of thick anorthosite and noritic anorthosite, with intercalated pyroxenite units and chromite reefs, remarkably regular in mineralogy and thickness, that represent laterally-continuous cyclical units [28]. The UCZ displays well-defined layering, exhibits extraordinary enrichment in PGMs and chromite [15], and represents 50% and 75% of the world’s Pd and Pt resource, respectively [26,28]. Given this mineral endowment, concentrated in two main reefs within the CZ, and even though the CZ represents only a relatively small interval of the BC, this interval has been the primary focus of research and mining efforts.
Both the Merensky and the UG2 (Upper Group 2) reefs formed as distinct, persistent layers within the CZ. The Merensky Reef in its “normal” configuration consists predominantly of a coarse-grained, pegmatoidal, feldspathic pyroxenite that contains appreciable phlogopitic mica, varying in thickness from 15 cm to 40 cm, with upper and lower contacts of coarse-grained material typically marked by thin chromitite layers several millimeters thick. Immediately above the top chromitite layer is a brownish pyroxenite known as the Merensky Pyroxenite [1].
The UG2 is a platiniferous chromitite reef that ranges in thickness from 0.4 m to 2.5 m, although occurrences greater than >2.5 m are occasionally observed. This package typically comprises 2 to 9 chromitite layers, intercalated with melanocratic host material that contains a thin chromitite leader [29]. The UG2 footwall comprises either anorthositic units or pegmatoidal pyroxenite [28], with the hangingwall units differing between the EL and WL: The WL hangingwall typically comprises an olivine-enriched pyroxenite, while the EL is predominantly overlain by pyroxenite [29,30]. The position of the UG2 within the cumulate pile is variable, situated between 15 m and 400 m below the Merensky Reef [30,31,32].
Despite its age (2055 Ma [33]), the complex is generally not thought to have undergone any significant metamorphism or deformation other than tectonic subsidence [1,14]. This has been recently challenged by Basson [11], who suggested that deformation of the deeper, central portion of the RLS was responsible for fluid expulsion and generation of the (1) Transvaalide Fold-and-Thrust Event, (2) intrusion of the High-Titanium Suite (HITIS); (3) anticlockwise rotation of the eastern two thirds of the main chamber; (4) thrusting of the northern margin of the main chamber southwards and over the displaced SL and (5) detachment and shearing of the SL from the southern end of the WL.

1.2. Geomodelling Theory

Implicit modelling is a spatial interpolation-based modelling methodology. The most widely-used function in 3D geomodelling is the radial basis function (RBF) [34]. Modelled surfaces produced via implicit modelling represent iso-potentials of a scalar field in 3D space [34,35,36]. Generated surfaces are therefore visual representations of isosurfaces based on a 3D scalar field. This allows modelled surfaces to utilize non-contacting data, such as structural trends [34,36]. The advantages of implicit modelling versus explicit modelling are:
(1)
Modelled surfaces may be pinned locally with hard data, such as drillhole intersections and reef outcrops;
(2)
Surfaces may be guided by non-contacting data, such as density contrasts from unconstrained geophysical data inversions [37];
(3)
Surfaces may be adjusted by user-defined orientation values, in regions where there are no or only sparse available data [38,39];
(4)
Extrapolation away from known or hard data, into areas where there is effectively no data, may be achieved intelligently and logically using trends. Such inputs remove, for example, instances where Merensky and UG2 reefs cross one another; and
(5)
Directional interpretation bias, inherent in section-based explicit modelling, is minimized.
An additional advantage of implicit modelling is the negation of ad-hoc rules during digitization and assembly of lithological solids in explicit, sectional-based digitization, which may be abused in cases where there is complex lithological logging or where the Geologist undertaking the digitization does not or cannot fully understand the overall geological context. Implicit modelling is not, however, without limitations. For instance, multiple, mathematically-induced artefacts have been noted [40,41,42]. These authors noted that local data density has a greater influence on the resultant surfaces, rather than the specific RBF interpolation that is employed. For this contribution, Leapfrog Geo V4.5 was utilized for 3D model construction.

1.3. Conceptual Models: Connectivity between Eastern and Western Limbs

The large-scale geometry of the BC has been extensively researched and debated [3,8,35,43,44,45,46,47,48]. This discussion is constrained by a relatively limited outcrop distribution, a paucity of information at depth—particularly in the central region of the RLS—and the overall scale of the BC. Despite these challenges, several models have been proposed. The EL and WL show marked geochemical, geophysical and textural similarities and, as a result, connectivity between these limbs has been repeatedly proposed (e.g., [1,3,47,48,49,50,51]). Furthermore, the distribution of intermittent exposures of mafic units, believed to be associated with the BC, suggest the possibility that the complex is also developed or preserved in the center of the two main limbs. As a result, a range of models have been developed for the complex, summarized by Cole et al. [47], each revolving around the degree and/or mode of limb interconnectivity.
Discussions on continuity and geometry towards the central portion of the main chamber of the RLS are hampered by a lack of deep drillholes, forcing a reliance on scattered information from non-PGM/Cr mines and geophysical data inversion (e.g., [11,52]). For instance, the separate dipping sheets model, proposed by Cousins (1959) [51], was initially supported by an apparent lack of RLS distribution at depth and between the two main limbs. The same study interpreted intrusions with separate vertical feeders (see also Viljoen, 1999 [52]), such as those that emanate from the edges of a mantle diapir penetrating the crust. Older gravimetric studies and geoelectric surveys [7,53,54,55] surmised a lack of mafic units between the Dennilton Dome and the Rooiberg Fragment (Figure 1). Additional geophysical work by Cheney and Twist (1991) [54] appeared to support the absence of RLS at depth, between the EL and WL. Models of individual, inward-dipping sheets and discrete or separate limbs have also been presented by several authors [7,55,56,57,58].
The intrusion of a relatively flat sill into a broadly folded basin was proposed by Gruenewaldt, (1979) [57], while Eales et al., (1993) [26] surmised that these sheets were initially emplaced horizontally. In the main chamber, the RLS either shallowly cross-cuts the upper Pretoria Group or follows its contact, while the later Lebowa and Rashoop Suite granites intruded into the upper portions of the RLS and Rooiberg felsites [10]. Several authors have suggested that deformation preceded the complex’s intrusion and that strain or folding may be attributed to the subsidence of the encompassing sedimentary basin [51,59,60]. Regional geological mapping outlined large fold structures and large country rock xenoliths in the floor of the complex [61,62,63]. Tectonic fabrics and signs of dynamic metamorphism, including bedding-parallel fabrics in Pretoria Group pelites, were recorded. However, Button (1973) [64], Blain (1975) [65], and Walraven (1981) [66] noted that Transvaal Supergroup units within the vicinity of the complex appear to be “relatively undeformed and display the original basin shape rather well”. More recent studies support inter-limb continuity—or at least greater inter-limb continuity—at depth [1,3,9,59,67,68]. Geophysical data modelling by Cole et al. (2013) [47] indicated a significant volume of BC material between the EL and WL, west of the Wonderkop and Stofpoort Faults (fault positions indicated in Figure 2), which supports the concept of continuous mafic units at depth. Cole et al. (2013) [47] also noted that magnetic anomalies of the RLS are heavily influenced by magnetite-rich UCZ units, which cause the majority of discernible positive magnetic anomalies and identifiable layering.
Work by Kinnaird and McDonald (2005) [61] and Kinnaird et al. (2017) [69] indicated that the NL is likely detached from the main part of the main chamber by the ENE-trending Thabazimbi Murchison Lineament, which may have comprised a dyke-like feeder for Bushveld and other magmas, resulting in an impediment between the NL and the main body of the complex. Gravity models by Finn et al. (2015) [48] indicate moderately thicker and/or high(er)-density materials at fault intersections, within the western and central TML, which have been interpreted as feeders, although this interpretation may rely on the assumption that deformation in these areas was fairly limited.
There are four main geometrical models for the main chamber: (1) The EL and WL are separate or discrete entities [51]; (2) The complex is continuous at depth, viz., the connected lobes model as suggested by [1,3,9,70]; (3) The complex is mostly continuous, with local disruption by major structures or domes; the separate dipping sheets model [7,55] or (4) The central part of the RLS has been extensively displaced by southwards-directed thrusting, the EL and WL at depth have undergone a degree of thrusting and folding and the eastern portion of the main chamber has undergone anticlockwise rotation of approximately 35° [11]. Basson (2019) [11] proposes that the geometry in the central portion of the main chamber is structurally complex and does not reflect the original emplacement geometry.

2. Materials and Methods

A broad overview of the modelling methodology will be addressed, outlining the workflow and development of the BC implicit geomodel from data incorporation to results and analysis. In the case of 3D geomodelling in Leapfrog Geo (Software version 4.5.1, Seequent, New Zeeland), this procedure follows a standardized, basic workflow:
(1)
Establishment of a volume of interest;
(2)
Incorporation of data and its quality control;
(3)
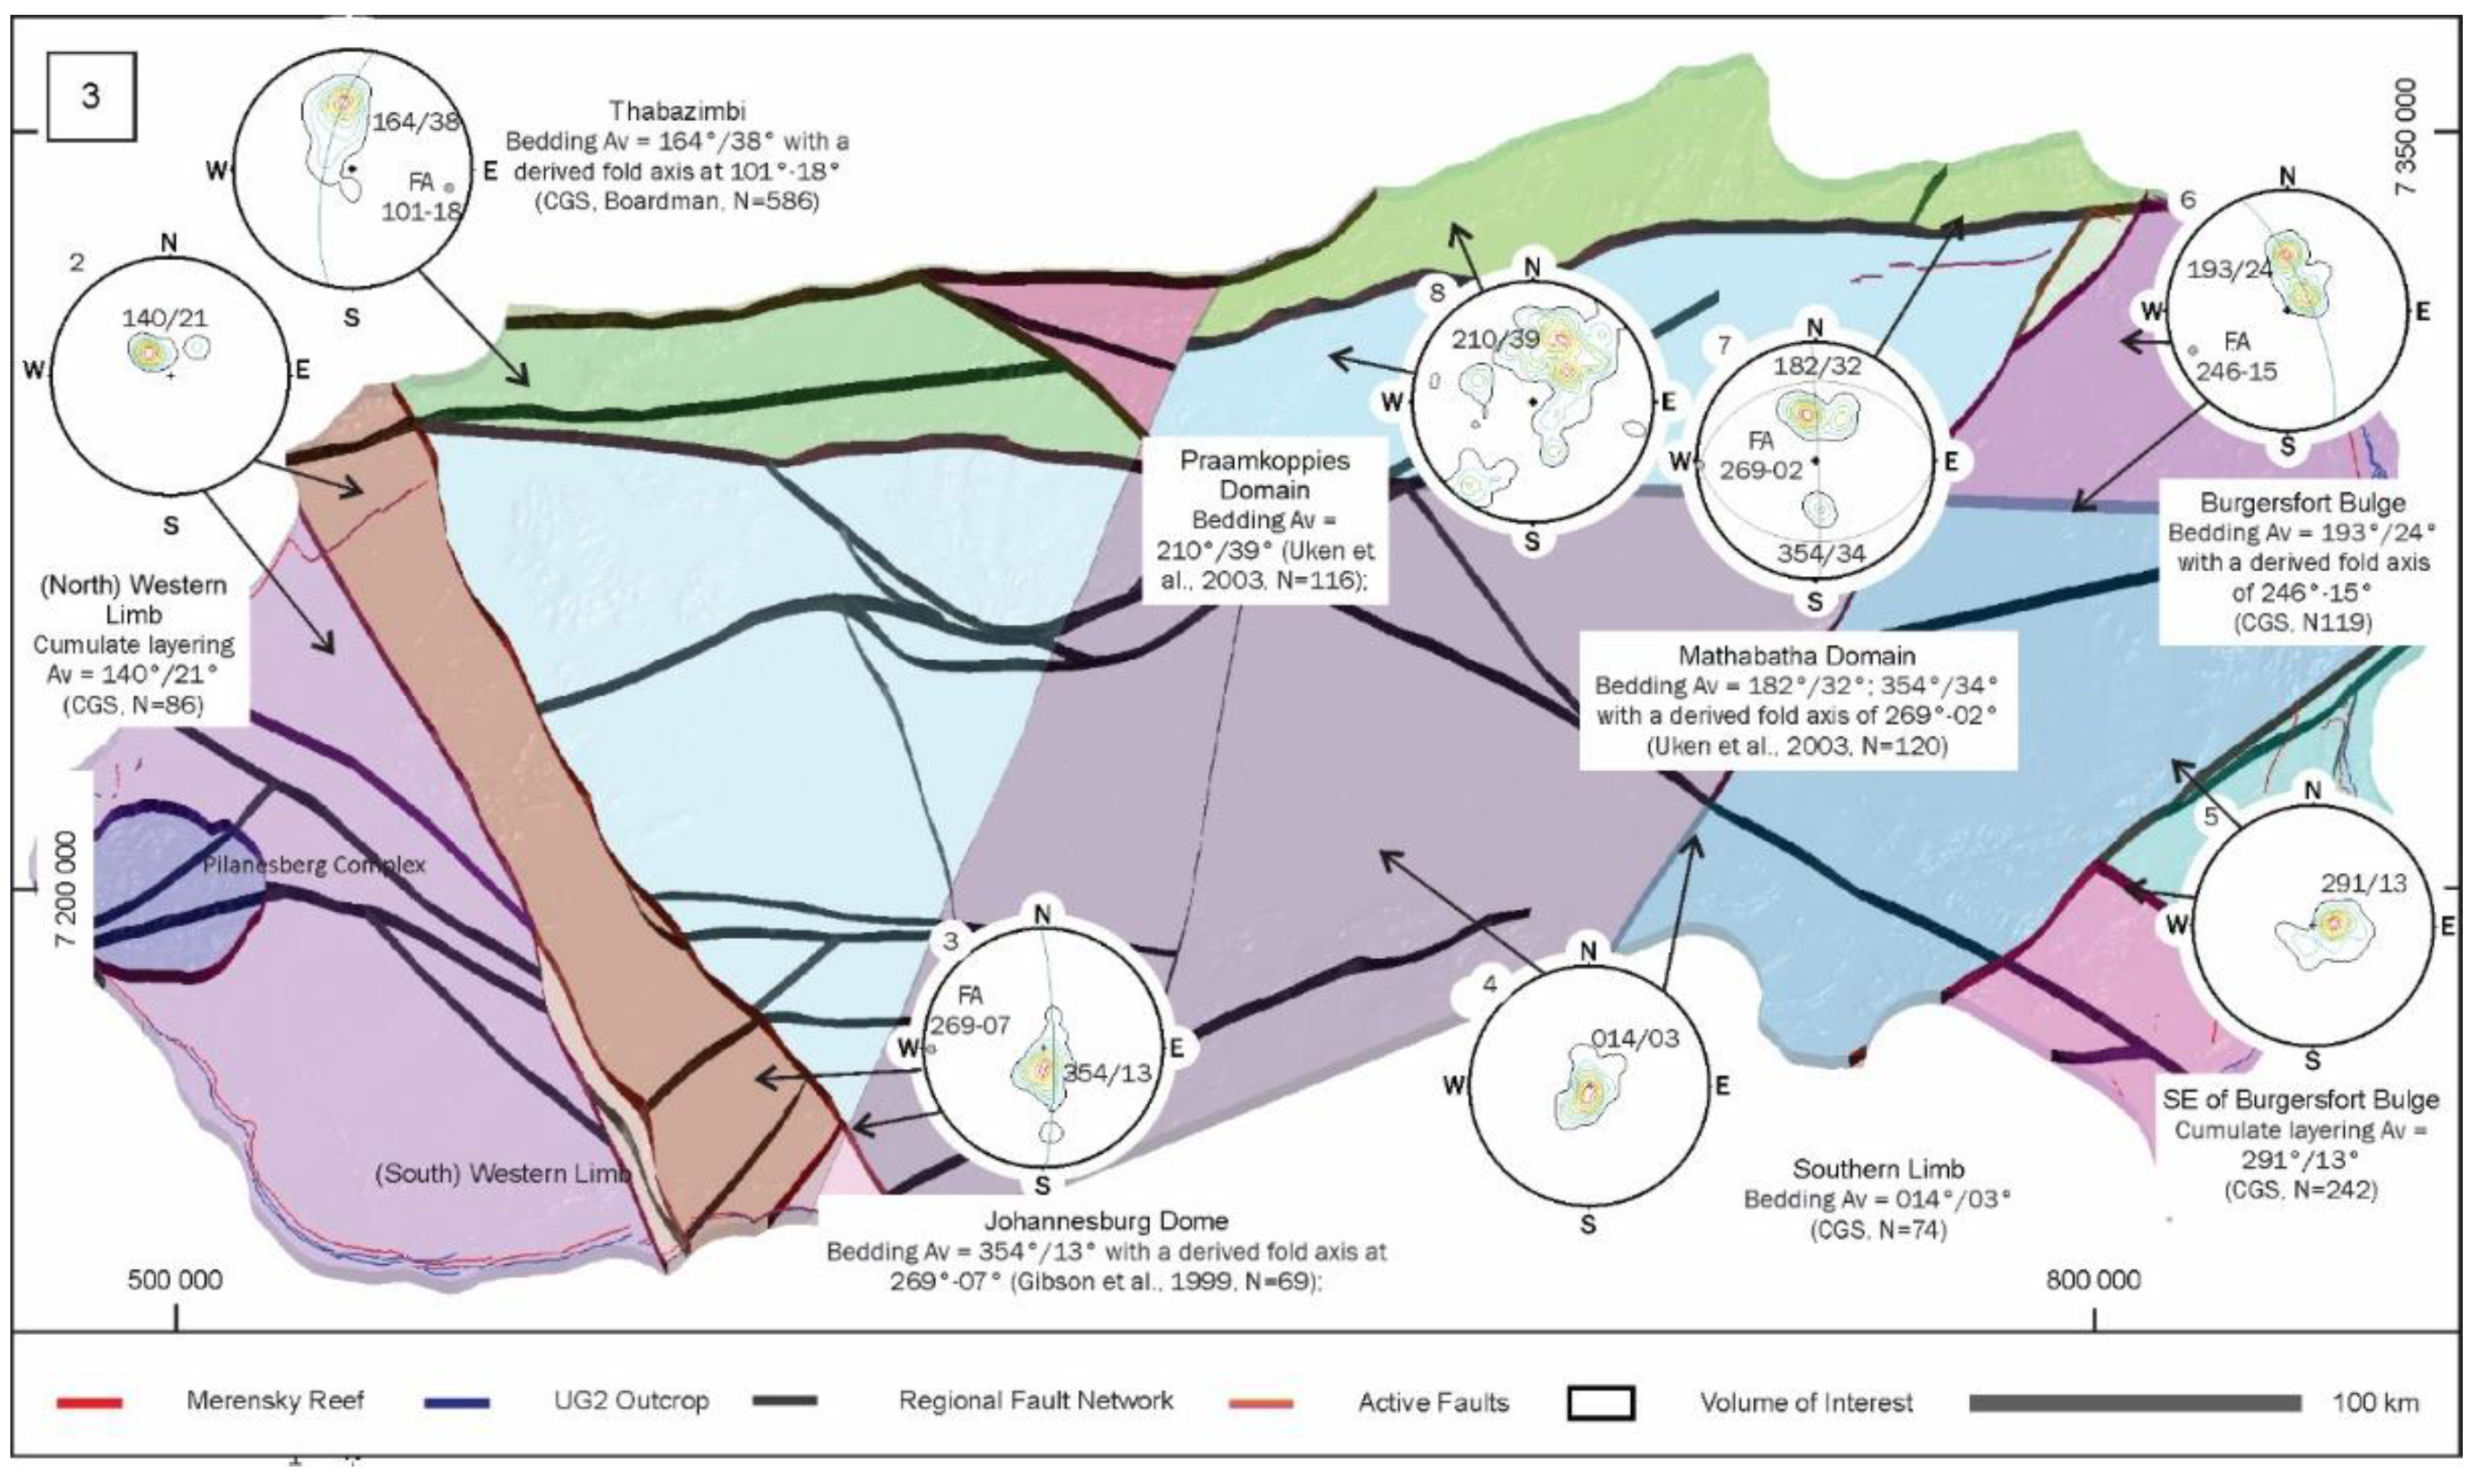
Subdivision into structural domains;
(4)
Subdivision of structural domains into geological units; and
(5)
Review and modification of resultant geological units and volumes.
In Leapfrog Geo, geological relationships are established as a series of conditional assembly rules that are geologically-phrased and must be geologically logical. An example of this is the establishment of a chronological sequence dictating how the stratigraphic or tectonostratigraphic sequence should be assembled. However, this methodology is not without its limitations, and the construction of surfaces and volumes produced during syn-deformational emplacement is difficult without user input, particularly in areas of low data density. Once contacting and age relationships between geological units have been defined, geological parameters are established for each surface. Surfaces may be modified according to additional data or observed deformation style(s). Structural trends may be incorporated via a number of surface construction tools, allowing for greater surface control and the generation of geologically-realistic surface geometries. Once contact surfaces have been used to subdivide the 3D volume into subdomains, resultant outputs are amenable to iterative interrogation, adjustment of parameters and subsequent modification by the insertion of additional controls. Re-running the model, using these updated surfaces, automatically produces updated 3D volumes or wireframes.

2.1. Model Construction

The volume of interest (Figure 2) encompasses the bulk of public-domain data across the RLS of the main chamber of the BC, with its eastern, western and southern margins defined by a buffer region of 500 m outwards from surface UG2 and Merensky Reef outcrops. The northern extent is a 500 m buffer, northwards of structures interpreted to form part of the TML [11,71]. The TML is a well-documented, regional tectonic boundary which, along with the Mohlapitsi Fold-and-Thrust Belt, the Welgevonden/Southern Fault System and the Zebedelia Fault, trends ENE-WSW for approximately 600 km across the Kaapvaal Craton, thereby representing a broad, regional fault-and-shear zone that was active syn- to post-BC emplacement [11,54,72]. Using these constraints and a modelled depth of −4500 MASL, the model has a lateral extent of approximately 400 km by 330 km and a total volume of approximately 270,000 km³. The central and northern areas of the main chamber are largely overlain by sediments of the Waterberg and Karoo Supergroups, with few identifiable BC outcrops or occurrences, although several deep drillholes have indicated the presence of RLS units [73]. The geological model presented herein is constructed in the WGS 1984 Universal Transverse Mercator (UTM) 35S coordinate system, as the majority of available data falls within this UTM zone.

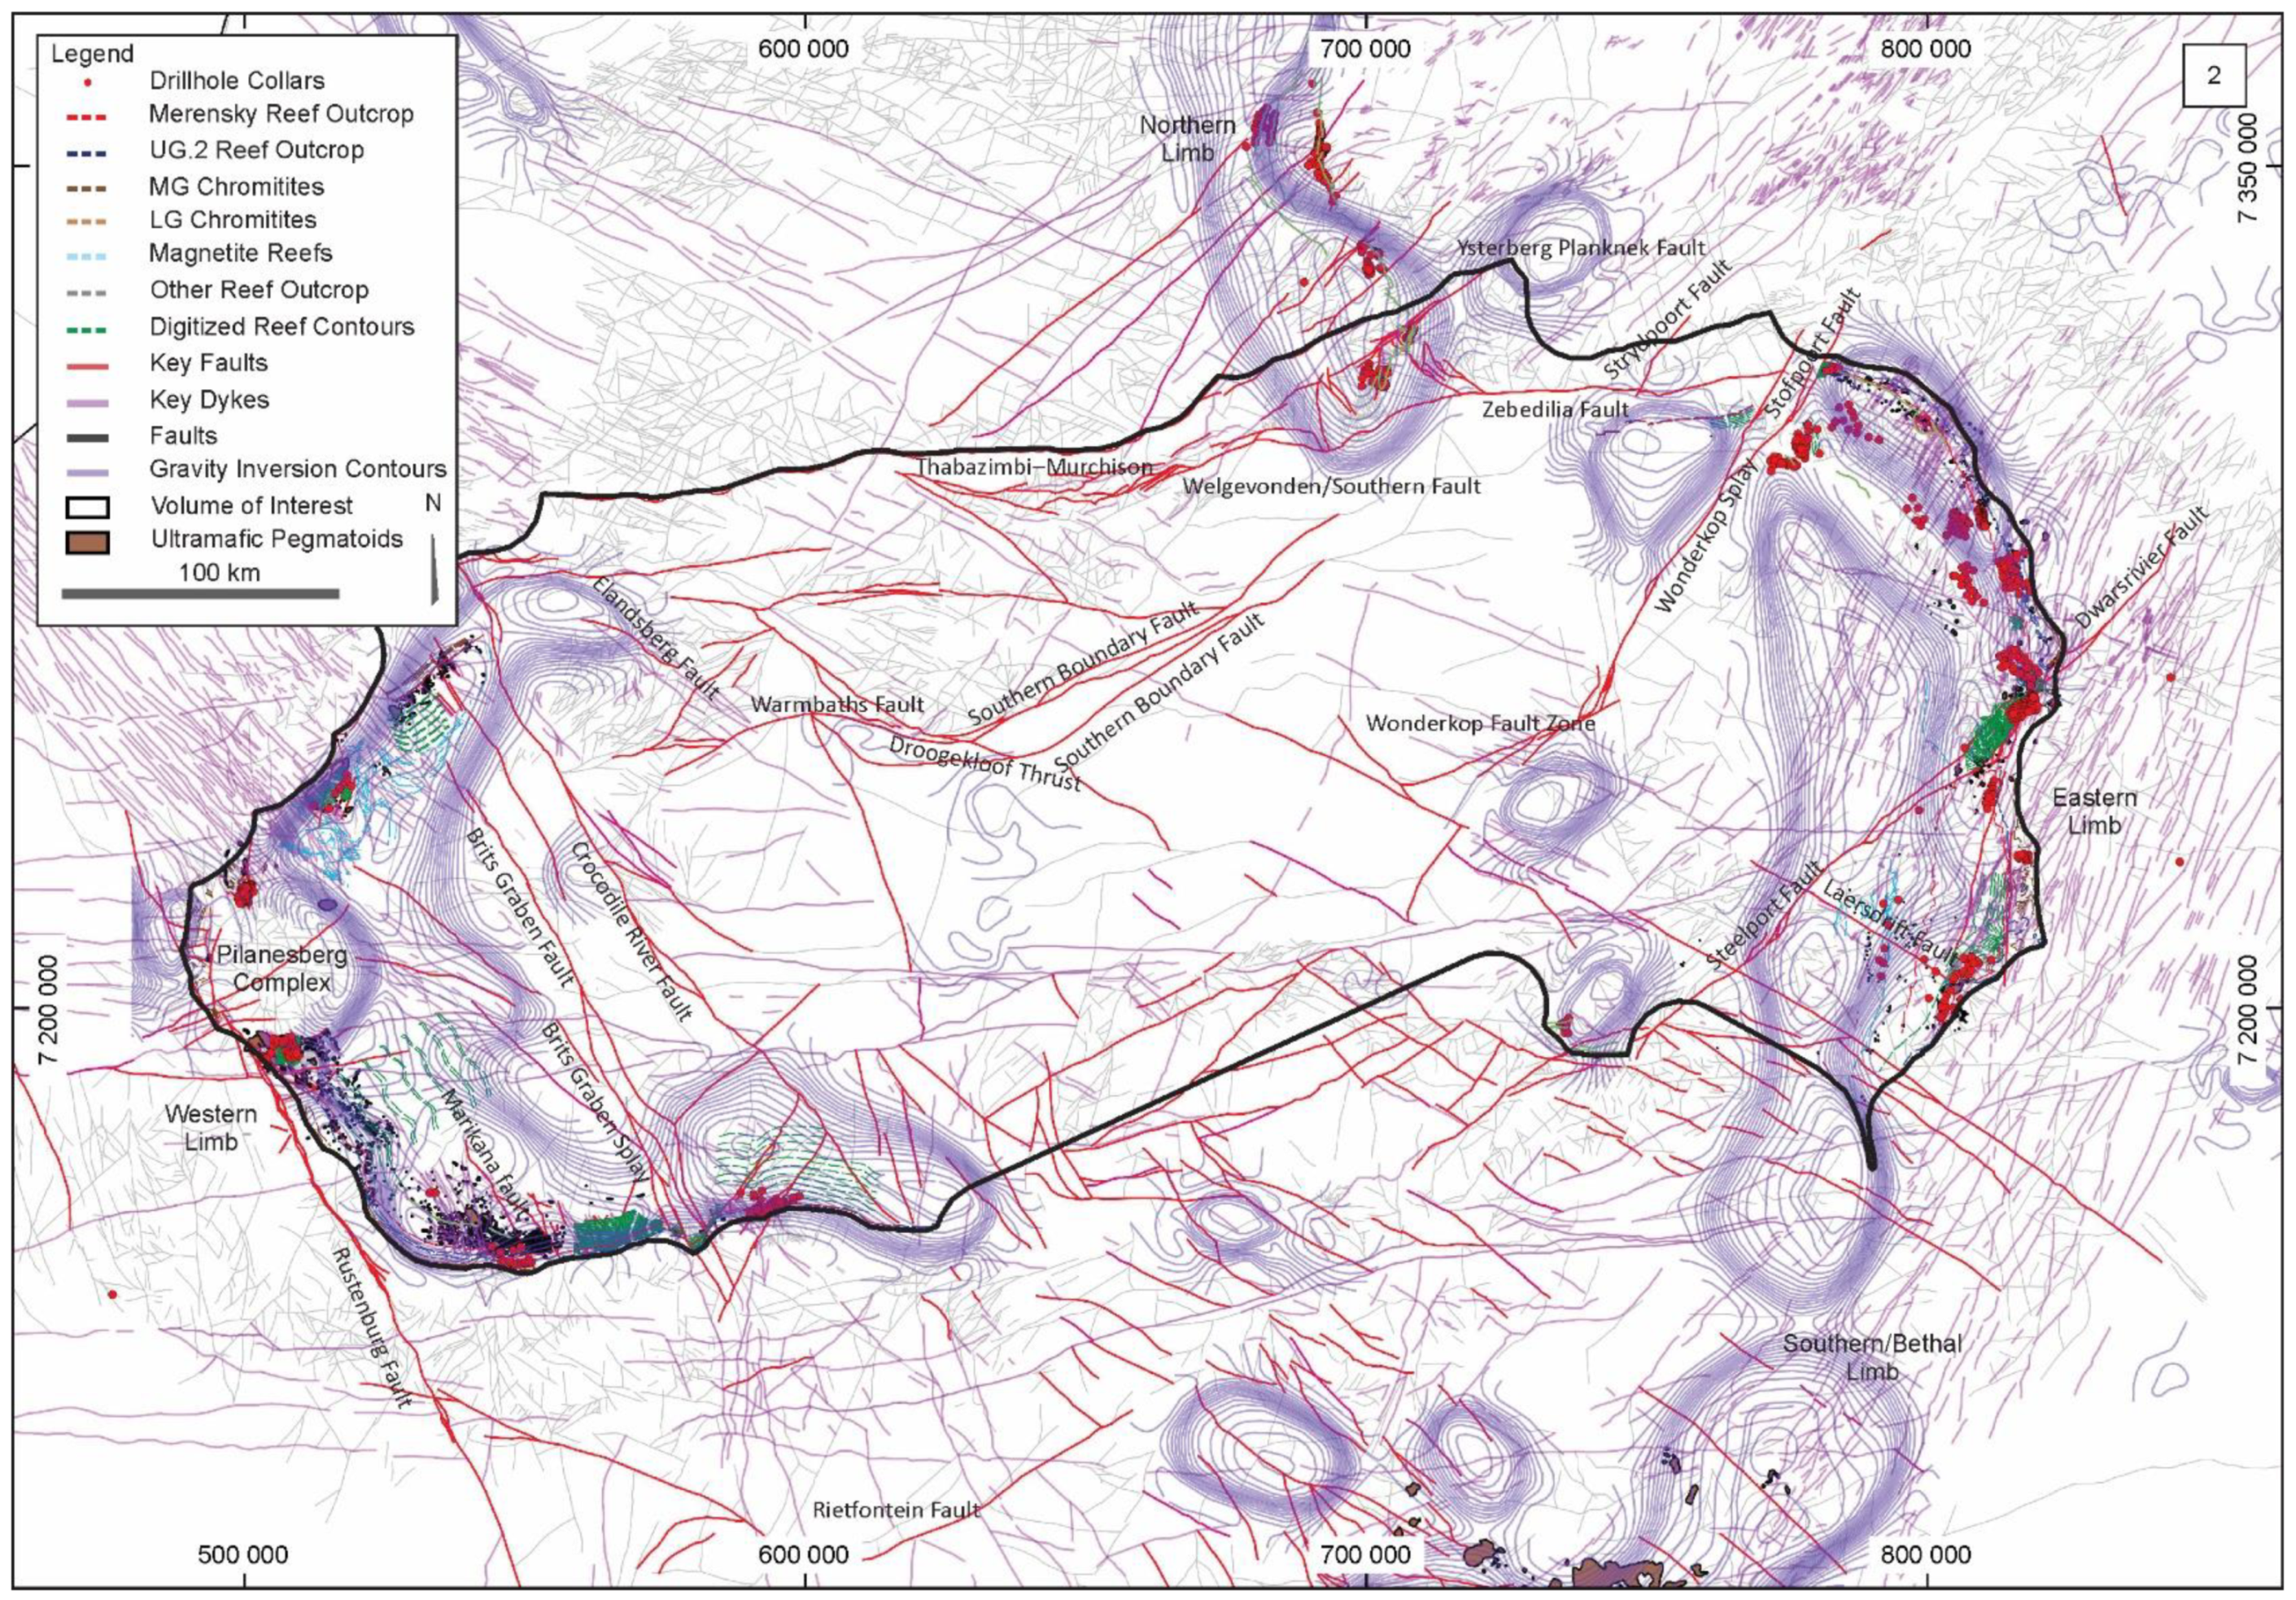
2.2. Structural Network Incorporation

A core component of 3D geomodelling is the early establishment of a representative fault network [38,70], which ideally exhibits a consistent internal deformation history. Key faults are based on the structural framework derived from Basson (2019) [11]. This compiled fault network and additional surface and underground mapping structural data were incorporated into 3D space for fault construction, which further sub-domains field mapping, geophysical, and stratigraphic/drillhole datasets. A total of 63 fault traces were incorporated into a cohesive fault network, re-constructed in Leapfrog Geo. Fault characteristics, such as dip and dip orientations, were captured from available literature and explicitly characterized in terms of their chronology or crosscutting relationships. Thirteen regional faults were selected to sub-domain the 3D volume into 23 individual sub-volumes (Figure 3).

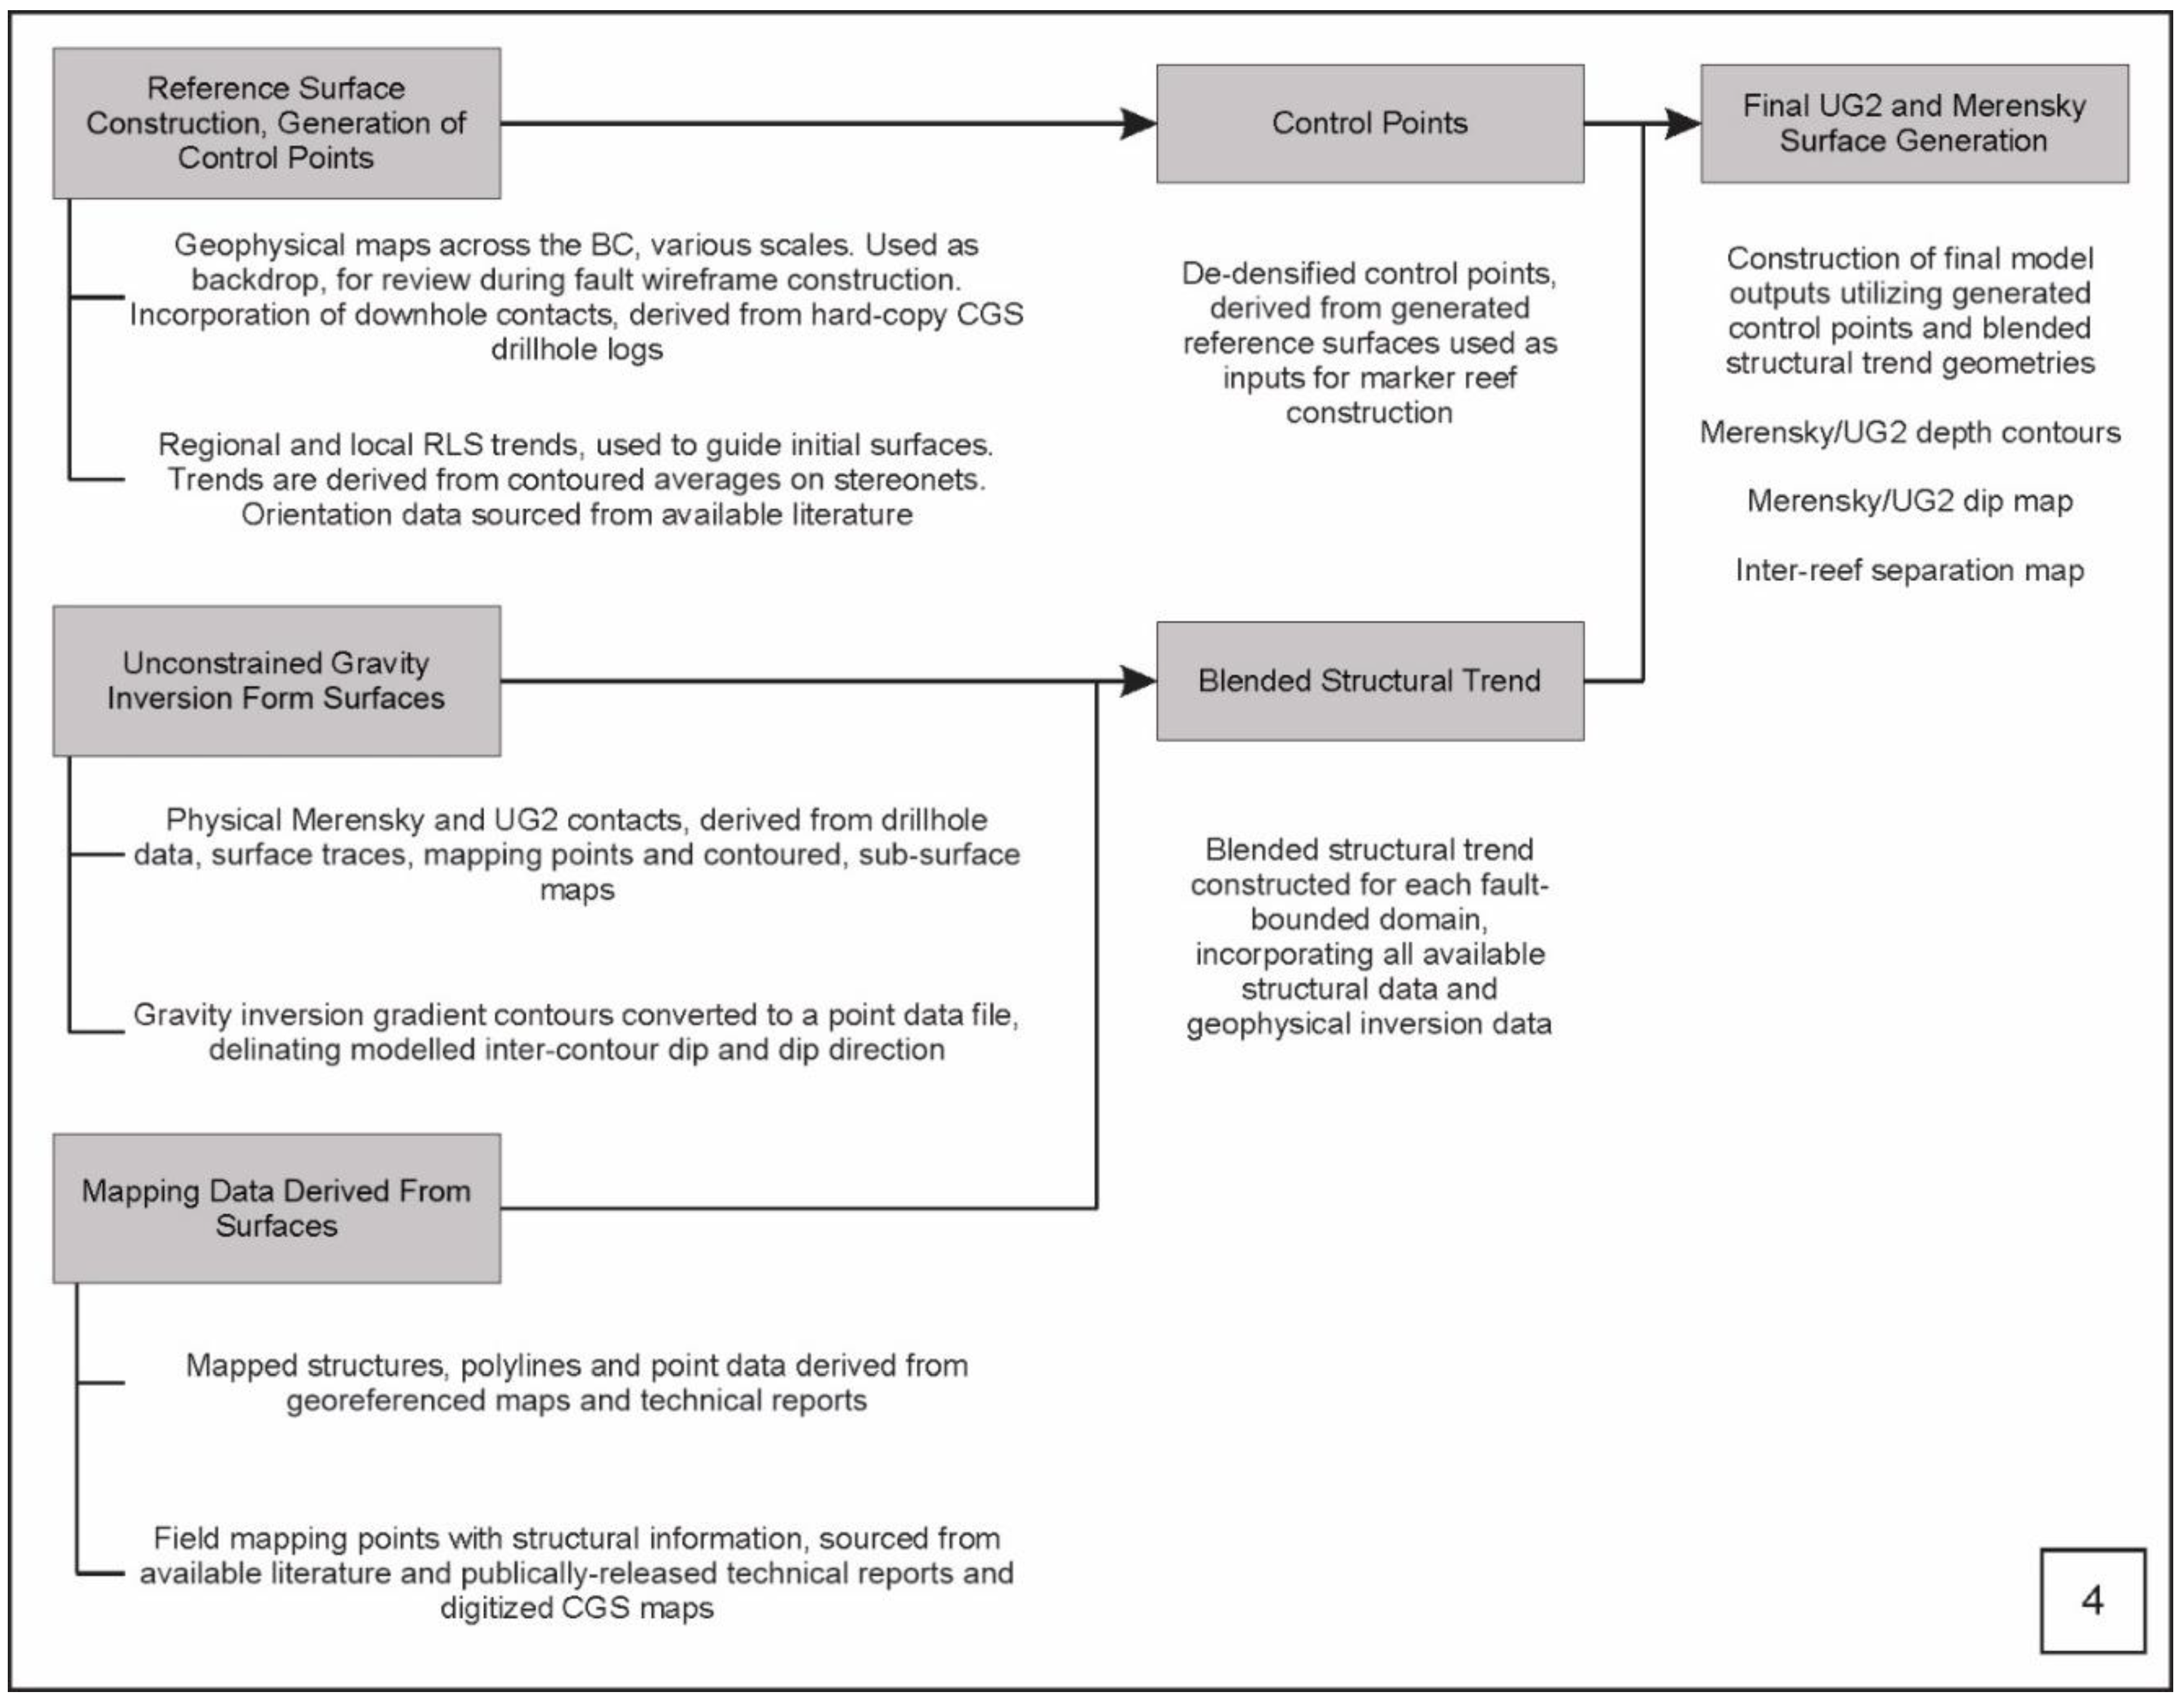
2.3. Surface Construction Technique

Limitations in software capability necessitated a three-stage process to generate the key marker reefs. The modelling workflow is detailed in Figure 4:
(1)
Construction of reference surfaces for both Merensky and UG2 reefs from mapping data, drillhole-derived downhole reef intersections and surface reef contours;
(2)
Construction of structural trends, incorporating trends and surfaces produced in unconstrained geophysical data inversions (see Basson, 2019 [11] for a description of these); and
(3)
Construction of final surfaces.

2.4. Reference Surface Construction

Reference surfaces are required for the application of software-related tools on such widely-distributed and variably-scaled datasets. Foremost amongst these tools is the ability of the software to utilize non-contacting structural data to inform surface construction, using Leapfrog’s Structural Trend tool. This tool produces a scalar field where the gradient of that field is influenced by structural data. Reference surfaces for the UG2 and Merensky Reefs were constructed, utilizing contacts derived from drillhole logs, surface mapping and reef contours. These reference surfaces utilize static guiding trends (fault domain-specific trends displayed in Figure 3), in turn derived from various technical reports, maps and academic studies. Given the data distribution, the deposit surface tool allows for construction of the most robust reference surfaces with a minimum of explicit controls, for the UG2 and Merensky reefs. The deposit surface accomplishes this by explicitly using specified contacts or intervals, even over great distances.
Control points were then derived from the modelled UG2 and Merensky Reef reference surfaces, which denote both the position and orientation of the related surface triangulation [74]. Given the scale of the model, these control points required simplification or declustering prior to downstream use. Declustering is the procedure whereby large datasets are reviewed, sets of typical orientations identified and averages, per set, calculated over specified distances or volumes. The Micromine software package (Software version 2020.5, Micromine, Nedlands, WA, Australia) was utilized to decluster the resultant reference surface control point files within a 1 km buffer zone, as these tools are not available within the Leapfrog modelling package. This provided a calculated mean orientation at a centroid for all points within a 1 km radius. These control points were subsequently reimported into the Leapfrog modelling environment.

2.5. Construction of Structural Trends

The Structural Trend tool generates an ellipsoidal anisotropy that varies in direction and strength according to an input triangulation, surface, or structural measurement. These ellipsoid ratios determine the local weighting of data informing surface construction. These structural trends may be viewed or envisaged as a series of “flattened spheres” in 3D space, where the orientation of a sphere provides the direction of the anisotropy, while the size of a sphere or disk is proportional to the local anisotropic strength. A structural trend was constructed per fault domain, to inform final surface construction trends within each individual domains. These structural trends incorporated field mapping, drillhole contacts, reef contours and geophysical inversion products [37,52,74], which all have disparate or different scales, densities and coverage [75].
As indicated previously, contoured isoshells of gravity contrasts, representing inferred depths and geometries of key contacts of the RLS [11], were used to guide RBF-generated UG2 and Merensky surfaces at depth, away from borehole-derived contacts, reef contours or reef traces, similar to the statistical approach used by Gupta and Sutcliffe (1990) [76]. Incorporating the gravity inversion products required additional upfront processing. Unconstrained gravity inversion contours were used to construct a series of reference surfaces, from which control points, which indicate the spatial position and orientation of key contacts, could be extracted. Multiple surface iterations were reviewed to ensure that the most geologically-representative surface was selected for downstream modelling.
Gravity highs were identified where the RLS approaches the surface towards the West in the WL and towards the East in the EL. Upon review of the control point file, it was noted that several control points indicated a down-dipping geometry just beyond RLS surface outcrops to the West and East of their respective limbs. This apparent down-dipping geometry was due to the decrease in the density signal beyond the surface exposure of RLS and consequently these non-representative down-dip control points were selectively removed.
To ensure that both unconstrained inversion data as well as regional field mapping trends were effectively utilized, two regional form interpolants were generated. A form interpolant is a representative surface, or series of surfaces, that emulates broad structural anisotropy from strike/dip trends in 3D, which may be used as an input for structural trend generation [74,77,78]. Two separate form interpolants were generated: One derived from the unconstrained gravity inversion and the other from compiled field mapping data. Unconstrained gravity inversion data required post-processing, where resultant isoshells were converted to a series of polylines and orientation points in 3D space. Once generated, these 3D elements were then used to define their resultant form interpolant. The resultant surfaces for these form interpolants were used as primary inputs for fault domain-specific structural trends, resulting in a “blended” structural trend that incorporates all available structural data (Figure 4).

2.6. Construction of Final Surfaces

Final UG2 and Merensky contact surfaces were then generated (Figure 4 and Figure 5), incorporating declustered control points and initial hard lithological contacts/surface traces, with their geometries dictated by fault domain-specific structural trends. These surfaces were constructed initially as intrusion contact surfaces, which allowed for the implementation of the structural trend tool.

3. Results

Modelled contact surfaces, including contoured reef depths, surface dip values and inter-reef separation distances, may have implications for the degree of erosion of reef footwalls. Reef depth maps for the Merensky Reef (Figure 6a) and UG2 Reef (Figure 6b) were contoured at a vertical spacing or interval of 10 m. WL Merensky and UG2 Reef depth contours indicate substantial increases in depth (−3000 m MASL) towards the center of the complex, east of the Crocodile River Fault, although one needs to take into consideration the effects of extrapolation into areas with sparse data constraints, where surface construction defers to the inversion of regional geophysical data. This substantial increase in depth coincides with areas overlain by the Lebowa Granite Suite. Modelled Merensky and UG2 reefs shallow to the east of the Crocodile River Fault, indicating a trough-like depression to the west, possibly accommodated by west-up vertical displacement along the Crocodile River Fault. The Merensky Reef also shows significant variations in depth across the Brits Graben Fault, although this structure appears to have affected the depth and/or depth variation of modelled UG2 in this area to a lesser extent.
UG2 and Merensky Reefs increase in depth (−1700 m MASL) towards the Waterberg Basin, north of Bela-Bela, in an area dominated by faults and thrusts south of the TML, although this increase in depth is more apparent in modelled UG2, possibly suggesting thrust-related splaying. Modelled Merensky and UG2 reefs shallow significantly towards the Marble Hall Fragment, Dennilton Dome and the Steelpoort Fault to the east. Modelled reefs also appear to be locally disrupted by minor domes within the Eastern Limb (e.g., Signal Hill/Boschpoort/Makgane Domes), although reef depths appear to be relatively consistent E and NE of the Burgersfort Bulge. Reefs shallow significantly to the SE of the Steelpoort Fault, north of Booysendal Mine.
Modelled inter-reef separation is presented in Figure 7. Zones of anomalously high inter-reef separation were identified (1–12). Upon review, it was established that several of these anomalous inter-reef separation highs (1–6) may be modelling artefacts, caused by disparities in data availability for the modelled Merensky Reef and the possible effects of over-extrapolation. One of these artefacts is an artificially-uplifted or higher Merensky Reef surface, due to the modelling interpolant attempting to connect data that are positioned at a greater average height than what is appropriate for a given fault-domain across that modelling domain.
Modelled inter-reef separation is consistent along the majority of the WL, particularly in proximity to reef outcrop, with a typical separation of between 10 m and 50 m. The northern part of this limb is known to host many potholes (see Smith and Basson, 2006 [79], circular or ellipsoidal depressions that may range from several meters to several hundred meters in diameter [11,80,81], although at the scale of the model presented herein, inter-reef separation is partially smoothed out. This pattern is locally disrupted east of the Elandsdrift Fault, towards the Krokodildrift Section, where inter-reef separation dramatically increases and in some areas is >400 m (e.g., Point 7). Separation apparently increases around the boundaries of the Pilanesberg Complex, ranging between 100 m and 200 m (Point 8). The model suggests significant inter-reef separation (400 m to 500 m) between the Middellaagte Graben Bounding Fault and the northern portion of the Crocodile River Fault (Point 9). West of the Dennilton Dome (Point 10), to the south of a regional dyke, modelled inter-reef separation increases and may be as high as 350 m. Similar to the WL, the modelled EL Merensky and UG2 Reef separation is largely consistent in proximity to reef outcrop, with separation distances constrained to between 10 m and 100 m. Reef separation increases significantly to the northeast of the Dwarsrivier Splay, in close proximity to Kennedy’s Vale Mine (Point 11), with modelled inter-reef separation ranging from 300 m to 500 m. Similarly, anomalously high modelled inter-reef separation is again evident south of the Laersdrift Fault (Point 12). Moderate inter-reef spacing is apparent in the vicinity of the Marble Hall Fragment (100 m to 200 m), increasing dramatically towards the SE, although high inter-reef separation appears to dissipate or is inconsistent near several regional dykes (Point 13), which may represent areas of fault-related drag.
Modelling artefacts, particularly those relating to modelling at depth, are to be anticipated in a geological model of this scale and complexity [79], using widely separated, locally disparate data sets at a variety of scales. As the spatial RBF function attempts to generate a smooth surface through control points, areas of sparse data are likely to produce over-simplified surfaces or surfaces that are locally unrepresentative of geological features or processes, particularly where the tectonostratigraphy changes its geometry abruptly and/or where data are sparse. Furthermore, implicitly modelled surfaces and resultant solids may extrapolate unrealistically outwards and away from their constraining data, towards model boundaries. These instances have to be noted and mitigated, where possible. Notwithstanding this, implicit 3D geomodelling over such a large area is eminently possible, with the application of a suite of modelling assumptions and controls.
Dip maps of the modelled Merensky and UG2 Reefs are displayed in Figure 8 and Figure 9. Areas of dip maps, in the context of the Bushveld Complex, which show steep dips may denote slumping or potholing of reefs. Dips steepen towards surface reef outcrops across both the WL and EL of the BC. Anomalously steeply-dipping modelled Merensky and UG2 Reef occurs towards the northern and southern terminations of the WL (see cross-section on Figure 9). These steep dips possibly extend eastwards from the Crocodile River Fault system, for approximately 5 to 6 km (Point 1). Extensive or pervasive steepening of the modelled Merensky and UG2 Reefs is observed to the north of the Welgevonden Fault Zone, although such steep dips are more apparent in the contoured UG2 Reef dip map (Point 2). Anomalously steep dips are observed to the north of the Wonderkop Fault splay and extend southwards towards the Stavoren/Makekaan Fragment (Points 3). Broad zones of almost horizontal reef are noted towards the apparent or inferred center of the RLS in the main chamber (Point 4), and towards the southern portion of the EL (Point 5), forming broadly concentric “domes” of low average dips, although this may partially be due to the lack of data in these areas. A general steepening of the modelled UG2 Reef surface and cumulate layering (<50°; stereonets in Figure 5) is observed towards the Zebedelia Fault and the northern edge of the EL (Point 6).

4. Discussion

Multiple data sources, modelling workflows and solutions were explored during this study to account for the disparities in data resolution, data spacing/clustering, model scale and output. Resultant geometries and interpretations are nevertheless dependent on data distribution and quality, which is the case for any 3D model. Added to this is the modeler’s explicit controls, choice of modelling technique, and available tools within software packages such as Leapfrog and Micromine. However, the position and incorporation of additional data will have a significant impact on modelling results and such data, be it “softer” geophysical data or ”hard” drillhole data, are likely to have much greater influence towards the center of this geological model where currently-available data are sparse. Seismic sections, which may have already been obtained by mining and exploration companies, would be particularly helpful in refining the 3D model, which, together with the workflow, was constructed with the intent of iteratively incorporating future additional data, in parallel with the activation of existing or even additional faults as required. This, in conjunction with more local- or mine-scale comparisons, would provide a series of increasingly better-constrained outputs that may be similarly subjected to interpretation, benefitting, in particular, where higher-resolution data have an impact on smaller fault domains wherein information is currently relatively sparse or diluted.
The northern portion of the EL appears to be absent to the west of Messina Mine. The modelled Merensky and UG2 Reefs shallow, and then steepen north-upwards, towards and along the TML–Zebediela–Welgevonden/Southern Fault systems. In addition, the EL becomes progressively more faulted, evidenced or accompanied by rapid shallowing of both reefs (Figure 8 and Figure 9), towards the northern margin of the main chamber and in proximity to the left-lateral Stofpoort/Wonderkop Fault system. This apparent uplift and steepness along the northern model margin, in conjunction with the development of the Stofpoort/Wonderkop Fault System(s), likely developed in response to N-S compression of the complex [11,72]. This southward vergence and asymmetry are also evident from the Droogekloof Thrust—Southern Boundary Fault system near the Thabazimbi/Rooiberg area. The variation in modelled inter-reef separation in this area may represent the effects of a forward-propagating thrust system that acted through the central part of the main chamber, as proposed by Basson (2019) [11].
Elevation plots suggest deep, relatively undeformed, relatively flat-lying Merensky and UG2 Reef geometries east of the Crocodile River Fault, with Merensky and UG2 Reefs apparently shallowing eastwards. Notwithstanding this, the RLS to the west of the Crocodile River Fault appears to have accommodated N-S flattening, if one assumes an initially more rounded, flatter-dipping magma chamber, by developing steeper northern and southern edges (see cross-section in Figure 9). The southern side of the section on Figure 9 suggests that the presence of the Johannesburg Dome, as proposed by Basson (2019) [11], was instrumental in steepening reef dips. Anomalous inter-reef separation, significant depths and steep bedding angles at the northern and southern terminations of the WL likely indicate that southward vergence due to N-S compression is more clearly or unambiguously evident in these parts of the WL, and particularly in proximity to the termination of the Krokodildrift Section. Low-angle bedding or cumulate-layer parallel shears, recorded in underground platinum mines on the southern part of the WL [11,21,79,80] and sheared contacts between tectonically-interlayered Transvaal Supergroup metasediments and Bushveld Complex-related Norite [11,49,50,67] only occur to the east of the section shown on Figure 9. In contrast, the section shown as an inset to Figure 8, across the EL, is markedly different from that across the WL. This shows significant steepening in the north, but an uplifted area in the vicinity of the Phepane Dome, and relatively flat-lying geometries across the remainder of the section to the south. This suggests that N-S strain was accommodated in a different manner in the EL, combined with the rotation, proposed by Basson (2019) [11] of the eastern 2/3rds of the main chamber.
These observations, in conjunction with the homogenous reef dip in the area, indicate that the Crocodile River Fault has likely acted as a regional strain barrier, effectively partitioning strain between the WL, which shows that N-S flattening was accommodated by the upliftment and steepening of its northern edge, and impingement and steepening, against the Johannesburg Dome, of its southern edge. The remaining 2/3rds of the main chamber accommodated N-S flattening, by anticlockwise rotation and the probable development of a forward-propagating thrust splay system. As a result, the WL also appears to be deeper, i.e., it has been relatively more down-faulted along the Crocodile River Fault. While still exposed at surface it is more “bowed” compared to the EL, which accommodated the N-S imposed strain by rotating.
Another pattern emerges from the inter-reef separation map: there is a zone of apparently low inter-reef separation, approximately 50 km SW of the Dennilton Dome. Deformed Transvaal Supergroup inliers occur in the BC, the most prominent of which are the Crocodile River Dome (western Transvaal Basin), the Dennilton-Marble Hall Dome and Stavoren Fragment (eastern Transvaal basin), which consist predominantly of deformed lower Transvaal units that underwent low grade metamorphism [81,82]. Positions and distributions of low dip angles, in conjunction with the positions of various domes towards and in the EL, may again support the concept of a forward propagating thrust system to the east of the Crocodile River Fault, which could have transported fragments (including “domes”) of the northern margin of the main chamber southwards.
In the area between the southern terminations of the EL and WL, moderate to low reef depths, moderate to low reef dips and low inter-reef separations emerge from the 3D modelling exercise, suggesting that reefs from the southern margin of the main chamber, in this area, are likely to have experienced layer-parallel shearing during southerly vergence or have been transposed into parallelism with thrusts, probably within a forward-propagating thrust system that stems from or is rooted in the TML. In addition, Basson (2019) [11] proposed that the offset between the SL and the southern termination or tip of the WL was right-lateral, accommodating an apparent 35° anticlockwise rotation of the volume to the east of the Crocodile River Fault, with the initial BC body behaving in a ductile manner at depth. Strain accommodation near-surface was brittle or brittle–ductile, in a collection of mutually cross-cutting “relay faults” in and around Cullinan Mine. The coincidence of deep reef and the overlying presence of the Lebowa Granite Suite is apparent from this study.

5. Conclusions

Modelled reef geometries support a model of various modes of stress accommodation, and thereby modes of strain, within the main chamber of the BC to the south of the TML. The WL shows steepening at its northern and southern extremities, against the TML and Johannesburg Dome, respectively, resulting in downward “bowing” of reef surfaces and E-up displacement along the Crocodile River Fault and related, parallel right-lateral faults in the vicinity.
The EL, on the other hand, probably preserves the original geometry of the intrusion somewhat better, suggesting very flat dips of the original cumulate pile. However, the EL is not undeformed. It displays steepening of its northern margin, against the TML, but it appears that strain was accommodated by a degree of (real or partially apparent) left-lateral shearing along the TML and anticlockwise rotation of the eastern 2/3rds of the main chamber [11]. The most likely structural configuration of the area immediately to the east of the Crocodile River Fault, which would have aided in the preservation of flat reef dips, is a southward- and forward-propagating thrust system, evidenced by entrained BC material within the Cullinan Mine [11,73]. The Crocodile River Fault therefore acts as a strain delimiter, separating modes or styles of deformation.

Author Contributions

Conceptualization, B.S. and I.J.B.; methodology, B.S.; software, I.J.B.; validation, B.S., I.J.B.; formal analysis, B.S., I.J.B.; investigation, B.S.; resources, I.J.B.; data curation, I.J.B.; writing—original draft preparation, B.S.; writing—review and editing, I.J.B. and J.M.; visualization, B.S.; project administration, B.S.; I.J.B. and J.A.M.; funding acquisition, I.J.B. All authors have read and agreed to the published version of the manuscript.

Funding

This research was funded Tect Geological Consulting.

Acknowledgments

The first author thanks Ian Basson for supplying the substantial underlying database, as well as his time and expertise during the completion of this study, without which this project would not have been possible. The author acknowledges the financial, logistical and software support provided by Tect Geological Consulting. The assistance of Marietjie Schalekamp from the South African Council for Geoscience (CGS), in the sourcing of drillhole data, is further acknowledged.

Conflicts of Interest

The funders of this study assisted in the collection, analyses of data; and provided support in the writing of this manuscript.

References

  1. Cawthorn, R.G.; Webb, S.J. Connectivity between the Western and Eastern Limbs of the Bushveld Complex. Tectonophysics 2001, 330, 195–209. [Google Scholar] [CrossRef]
  2. Cawthorn, R.G. The Residual or Roof Zone of the Bushveld Complex, South Africa. J. Petrol. 2013, 54, 1875–1900. [Google Scholar] [CrossRef] [Green Version]
  3. Lee, C.A. Post-deposition structures in the Bushveld Complex mafic sequence. J. Geol. Soc. 1981, 138, 327–341. [Google Scholar] [CrossRef]
  4. Webb, S.J.; Cawthorn, R.G.; Nguuri, T.; James, D. Gravity modeling Bushveld complex connectivity supported by Southern African Seismic Experiment results. S. Afr. J. Geol. 2004, 107, 207–218. [Google Scholar] [CrossRef]
  5. Letts, S.; Torsvik, T.H.; Webb, S.; Ashwal, L.D. Palaeomagnetism of the 2054 Ma Bushveld Complex (South Africa): Implications for emplacement and cooling. Geophys. J. Int. 2009, 179, 850–872. [Google Scholar] [CrossRef] [Green Version]
  6. Vermaak, C.F.; Hendriks, L.P. A review of the mineralogy of the Merensky Reef, with specific reference to new data on the precious metal mineralogy. Econ. Geol. 1976, 71, 1244. [Google Scholar] [CrossRef]
  7. Du Plessis, A.; Kleywegt, R.J. A dipping sheet model for the mafic lobes of the Bushveld Complex (South Africa). S. Afr. J. Geol. 1987, 90, 1–6. [Google Scholar]
  8. Uken, R.; Watkeys, M.K. Diapirism initiated by the Bushveld Complex, South Africa. Geology 1997, 25, 723–726. [Google Scholar] [CrossRef]
  9. Cawthorn, R.G.; Walraven, F. Emplacement and crystallization time for the Bushveld Complex. J. Petrol. 1998, 39, 1669–1687. [Google Scholar] [CrossRef]
  10. Bamisaiye, O.A.; Eriksson, P.G.; Van Rooy, J.L.; Brynard, H.M.; Foya, S.; Billay, A.Y.; Nxumalo, V. Subsurface mapping of Rustenburg Layered Suite (RLS), Bushveld Complex, South Africa: Inferred structural features using borehole data and spatial analysis. J. Afr. Earth Sci. 2017, 132, 139–167. [Google Scholar] [CrossRef]
  11. Basson, I.J. Cumulative deformation and original geometry of the Bushveld Complex. Tectonophysics 2019, 750, 177–202. [Google Scholar] [CrossRef]
  12. Hunter, D.R. The Regional Geologic Setting of the Bushveld Complex (An Adjunct to the Provisional Tectonic Map of the Bushveld Complex); Economic Geology Research Unit, University of the Witwatersrand: Johannesburg, South Africa, 1975; pp. 1–18. [Google Scholar]
  13. Uken, R. The Geology and Structure of the Bushveld Complex Metamorphic Aureole in the Olifants River Area; University of Natal: Durban, South Africa, 1998. [Google Scholar]
  14. Eales, H.V.; Cawthorn, R.G. The Bushveld Complex. Dev. Petrol. 1996, 15, 181–229. [Google Scholar]
  15. Cawthorn, R.G.; Eales, H.V.; Walraven, F.; Uken, R.; Watkeys, M.K. The bushveld complex. In The Geology of South Africa; Johnson, M.R., Anhaeusser, C.R., Thomas, R.J., Eds.; Geological Society of South Africa: Pretoria, South Africa, 2006; pp. 261–281. [Google Scholar]
  16. Lenhardt, N.; Eriksson, P.G. Volcanism of the Palaeoproterozoic Bushveld Large Igneous Province: The Rooiberg Group, Kaapvaal Craton, South Africa. Precambrian Res. 2012, 214–215, 82–94. [Google Scholar] [CrossRef] [Green Version]
  17. Du Plessis, C.P.; Walraven, F. The tectonic setting of the Bushveld Complex in Southern Africa, Part 1. Structural deformation and distribution. Tectonophysics 1990, 179, 305–319. [Google Scholar] [CrossRef]
  18. Hulbert, L.J.; von Gruenewald, G. Nickel Copper, and Platinum Mineralization in the Lower Zone of the Bushveld Complex, South of Potgietersrus. Geology 1982, 77, 1296–1306. [Google Scholar] [CrossRef]
  19. Buick, I.S.; Maas, R.; Gibson, R. Precise U–Pb titanite age constraints on the emplacement of the Bushveld Complex, South Africa. J. Geol. Soc. 2001, 158, 3–6. [Google Scholar] [CrossRef]
  20. Kruger, F.J. Filling the Bushveld Complex magma chamber: Lateral expansion, roof and floor interaction, magmatic unconformities, and the formation of giant chromitite, PGE and Ti-V-magnetitite deposits. Miner. Depos. 2005, 40, 451–472. [Google Scholar] [CrossRef]
  21. Clarke, B.; Uken, R.; Reinhardt, J. Structural and compositional constraints on the emplacement of the Bushveld Complex, South Africa. Lithos 2009, 111, 21–36. [Google Scholar] [CrossRef]
  22. Boorman, S.; Boudreau, A.; Kruger, F.J. The Lower Zone-Critical Zone transition of the Bushveld Complex: A quantitative textural study. J. Petrol. 2004, 45, 1209–1235. [Google Scholar] [CrossRef]
  23. Eales, H.V.; Botha, W.J.; Hattingh, P.J.; de Klerk, W.J.; Maier, W.D.; Odgers, A.T.R. The mafic rocks of the Bushveld Complex: A review of emplacement and crystallization history, and mineralization, in the light of recent data. J. Afr. Earth Sci. 1993, 16, 121–142. [Google Scholar] [CrossRef]
  24. Hunter, D.R.; Hamilton, P.I. The Bushveld complex. In Evolution of the Earth’s Crust; Tarling, D.H., Ed.; Academic Press: London, UK, 1978; pp. 103–107. [Google Scholar]
  25. Naldrett, T.; Kinnaird, J.; Wilson, A.; Chunnett, G. Concentration of PGE in the Earth’s Crust with Special Reference to the Bushveld Complex. Earth Sci. Front. 2008, 15, 264–297. [Google Scholar] [CrossRef]
  26. Eales, H.V.; Costin, G. Crustally-contaminated komatiite: Primary source of the chromitites and marginal, Lower, and Critical zone magmas in a staging chamber beneath the Bushveld Complex. Econ. Geol. 2012, 107, 645–665. [Google Scholar] [CrossRef]
  27. Seabrook, C.L.; Cawthorn, R.G.; Kruger, F.J. The Merensky reef, Bushveld Complex: Mixing of minerals not mixing of magmas. Econ. Geol. 2005, 100, 1191–1206. [Google Scholar] [CrossRef]
  28. Cameron, E.N. Chromite in the central sector of the Eastern Bushveld Complex, South Africa. Am. Mineral. 1977, 62, 1082–1096. [Google Scholar]
  29. Cawthorn, R.G. The platinum and palladium resources of the Bushveld Complex. S. Afr. J. Sci. 1999, 95, 481–489. [Google Scholar]
  30. Voordouw, R.; Gutzmer, J.; Beukes, N. Zoning of platinum group mineral assemblages in the UG2 chromitite determined through in situ SEM-EDS-based image analysis. Miner. Depos. 2010, 45, 147–159. [Google Scholar] [CrossRef]
  31. Cawthorn, R.G.; Spies, L. Plagioclase content of cyclic units in the Bushveld Complex, South Africa. Contrib. Mineral. Petrol. 2003, 145, 47–60. [Google Scholar] [CrossRef]
  32. Schouwstra, R.P.; Kinloch, E.D.; Lee, C.A. A Short Geological Review of the Bushveld Complex. Platin. Met. Rev. 2000, 44, 33–39. [Google Scholar]
  33. Scoates, J.S.; Friedman, R.M. Precise Age of The Platiniferous Merensky Reef, Bushveld Complex, South Africa, by the U-Pb Zircon Chemical Abrasion Id-Tims Technique. Econ. Geol. 2008, 103, 465–471. [Google Scholar] [CrossRef]
  34. Vollgger, S.; Cruden, A.; Ailleres, L.; Cowan, J. Regional dome evolution and its control on ore-grade distribution: Insights from 3D implicit modelling of the Navachab gold deposit, Namibia. Ore Geol. Rev. 2015, 69, 268–284. [Google Scholar] [CrossRef]
  35. Bloomenthal, J.; Wyvill, B. Introduction to Implicit Surfaces; Morgan Kaufmann Publishers Inc.: San Francisco, CA, USA, 1997. [Google Scholar]
  36. Caumon, G.; Gray, G.; Antoine, C.; Titeux, M. Three-Dimensional Implicit Stratigraphic Model Building from Remote Sensing Data on Tetrahedral Meshes: Theory and Application to a Regional Model of La Popa Basin, NE Mexico. IEEE Trans. Geosci. Remote. Sens. 2013, 51, 1613–1621. [Google Scholar] [CrossRef]
  37. Rezaie, M.; Moradzadeh, A.; Kalate, A.; Aghajani, H.; Kahoo, A.; Moazam, S. 3D modelling of Trompsburg Complex (in South Africa) using 3D focusing inversion of gravity data. J. Afr. Earth Sci. 2017, 130, 1–7. [Google Scholar] [CrossRef]
  38. Stoch, B.; Anthonissen, C.J.; McCall, M.-J.; Basson, I.J.; Deacon, J.; Cloete, E.; Botha, J.; Britz, J.; Strydom, M.; Nel, D.; et al. 3D implicit modeling of the Sishen Mine: New resolution of the geometry and origin of Fe mineralization. Miner. Depos. 2017, 53, 835–853. [Google Scholar] [CrossRef]
  39. Vollgger, S.A.; Saumur, B.-M.; Cowan, J.; Cruden, A.R. Implicit 3D geological modelling applied to structurally complex mineral deposits—It’s all about geometry. In Proceedings of the International Geological Congress, Brisbane, Australia, 5–10 August 2012. [Google Scholar]
  40. Fornberg, B.; Driscoll, T.A.; Wright, G.; Charles, R. Observations on the behaviour of radial basis function approximations near boundaries. Comput. Math. Appl. 2002, 43, 473–490. [Google Scholar] [CrossRef] [Green Version]
  41. Driscoll, T.A.; Heryudono, A.R.H. Adaptive residual subsampling methods for radial basis function interpolation and collocation problems. Comput. Math. Appl. 2007, 53, 927–939. [Google Scholar] [CrossRef] [Green Version]
  42. Jessel, M.; Aillères, L.; de Kemp, E.; Lindsay, M.; Wellmann, F.; Hillier, M.; Laurent, G.; Carmichael, T.; Martin, R. Next generation three-dimensional geologic modeling and inversion. In Building Exploration Capability for the 21st Century; Society of Economic Geologist: Littleton, CO, USA, 2014; pp. 261–272. [Google Scholar]
  43. Hall, A.L. The Bushveld Igneous Complex of the Central Transvaal; Department of Mines and Industries: Pretoria, South Africa, 1932.
  44. Coetzee, J.; Twist, D. Disseminated tin mineralization in the roof of the Bushveld Granite Pluton at the Zaaiplaats Mine, with implications for the genesis of magmatic hydrothermal tin systems. Econ. Geol. 1989, 84, 1817–1834. [Google Scholar] [CrossRef]
  45. Gerya, T.V.; Uken, R.; Reinhardt, J.; Watkeys, M.K.; Maresch, W.V.; Clarke, B.M. “Cold” diapirs triggered by intrusion of the Bushveld Complex: Insight from two-dimensional numerical modeling. In Gneiss Domes in Orogeny; Whitney, D.L., Teyssier, C., Siddoway, C.S., Eds.; Geological Society of America Special Paper; Geological Society of America: Boulder, CO, USA, 2004; Volume 380, pp. 117–127. [Google Scholar]
  46. Clarke, B.M.; Uken, R.; Watkeys, M.K. Intrusion mechanisms of the southwestern Rustenburg Layered Suite as deduced from the Spruitfontein inlier. S. Afr. J. Geol. 2000, 103, 120–127. [Google Scholar] [CrossRef]
  47. Cole, J.; Finn, C.A.; Webb, S.J. Overview of the magnetic signatures of the palaeoproterozoic Rustenburg layered suite, bushveld complex, South Africa. Precambrian Res. 2013, 236, 193–213. [Google Scholar] [CrossRef]
  48. Finn, C.A.; Bedrosian, P.A.; Cole, J.C.; Khoza, T.D.; Webb, S.J. Mapping the 3D extent of the Northern Lobe of the Bushveld layered mafic intrusion from geophysical data. Precambrian Res. 2015, 268, 279–294. [Google Scholar] [CrossRef]
  49. Ashwal, L.D.; Webb, S.J.; Knoper, M.W. Magmatic stratigraphy in the Bushveld northern lobe: Continuous geophysical and mineralogical data from the 2950 m Bellevue drillcore. S. Afr. J. Geol. 2005, 108, 199–232. [Google Scholar] [CrossRef]
  50. Ashwal, L.D.; Webb, S.J.; Knoper, M.W. Physical and mineralogical properties of Bushveld rocks: Magnetic susceptibility, density and mineral chemistry profiles in the 2950 m Bellevue drillcore, Northern Lobe. S. Afr. J. Geol. 2005, 108, 199–232. [Google Scholar] [CrossRef]
  51. McCall, M.-J. Mineralogical and Geochemical Variations in the UG2 Reef at Booysendal and Zondereinde Mines, with Implications for Beneficiation of PGM. Ph.D. Thesis, Stellenbosch University, Stellenbosch, South Africa, 2016. [Google Scholar]
  52. Cousins, C.A. The Structure of the Mafic Portion of the Bushveld Igneous Complex. Geol. Soc. S. Afr. 1959, 1, 179–201. [Google Scholar]
  53. Armit, R.J.; Ailleres, L.; Baines, A.G.; Betts, P.G. Understanding the limitations provided by unconstrained potential-field inversions on 3D models: A case study from the Mount Painter Inlier, SA. In Proceedings of the Geo-Computing Conference, Brisbane, Australia, 10 October 2010. AIG Bulletin No. 49. [Google Scholar]
  54. Viljoen, M.J. The nature and origin of the Merensky Reef of the western Bushveld Complex based on geological facies and geophysical data. S. Afr. J. Geol. 1999, 102, 221–239. [Google Scholar]
  55. Cheney, E.S.; Twist, D. The conformable emplacement of the Bushveld mafic rocks along a regional unconformity in the Transvaal succession of South Africa. Precambrian Res. 1991, 52, 115–132. [Google Scholar] [CrossRef]
  56. Meyer, R.; de Beer, J.H. Structure of the Bushveld Complex from resistivity measurements. Nature 1987, 325, 610. [Google Scholar] [CrossRef]
  57. Molyneux, T.G.; Klinkert, P.S. A structural interpretation of part of the eastern mafic lobe of the Bushveld Complex and its surrounds. Trans. Geol. Soc. S. Afr. 1978, 81, 359–368. [Google Scholar]
  58. Von Gruenewaldt, G. A Review of Some Recent Concepts of the Bushveld Complex, with Particular Reference to Sulfide Mineralization. Can. Mineral. 1979, 17, 233–256. [Google Scholar]
  59. Sharpe, M.R.; Snyman, J.A. A model for the emplacement of the eastern compartment of the bushveld complex. Tectonophysics 1980, 65, 85–110. [Google Scholar] [CrossRef]
  60. Liebenberg, L. The sulphides in the layered sequence of the Bushveld igneous complex. In Symposium on the Bushveld Complex and other Layered Intrusions; Visser, D.J.L., von Gruenewaldt, G., Eds.; Special Publication I Geological Society of South Africa: Silverton, Pretoria, 1970; pp. 108–207. [Google Scholar]
  61. Vermaak, C.F. The Geology of the Lower Portion of the Bushveld Complex and its Relationship to the Floor Rocks in the Area West of Pilansberg, Western Transvaal; Special publication of the Geological Society of South Africa; Geological Society of South Africa: Silverton, Pretoria, 1970; Volume 1, pp. 242–262. [Google Scholar]
  62. Schwellnus, J.S.I. The basal portion of the Bushveld Igneous Complex and the adjoining metamorphosed sediments in the northeastern Transvaal. Ph.D. Thesis, University of Pretoria, Pretoria, South Africa, 1956; p. 207, unpublished. [Google Scholar]
  63. Schwellnus, J.S.I.; Engelbrecht, L.N.J.; Coertze, F.J.; Russel, H.D.; Malherbe, S.J.; van Rooyen, D.P.; Cooke, R. The Geology of the Olifants River Area, Transvaal. Geological Survey of South Africa, Explanation of Sheets 2429B (Chuniespoort) and 2430A (Wolkberg); SA Geological Survey: Adelaide, South Australia, 1962.
  64. Bastin, H.A. Zur Tectonic und Stratigraphie am Nord-iJstlichen Bushveld-Rand. Ph.D. Thesis, Technische Hochschule, Aachen, Germany, 1968; p. 52, unpublished. [Google Scholar]
  65. Button, A. A Regional Study of the Stratigraphy and Development of the Transvaal Basin in the Eastern and Northeastern Transvaal. Ph.D. Thesis, University Witwatersrand, Johannesburg, South Africa, 1973; p. 352, Unpublished. [Google Scholar]
  66. Blain, M.R. The Occurrence of Andalusite in the Metamorphic a Ureole of the Bushveld Complex in the Eastern Transvaal; Unpub. Report of the Geological Survey of South Africa; Geological Survey of South Africa: Silverton, Pretoria, 1975; p. 103. [Google Scholar]
  67. Walraven, F. The Geology of the Rustenburg Area: Explanation of Geological Map Sheet 2526; South Africa Geological Survey: Silverton, Pretoria, 1981; 37p. [Google Scholar]
  68. Cawthorn, R.G.; McKenna, N. The extension of the Western Limb, Bushveld Complex (South Africa), at Cullinan Diamond Mine. Mineral. Mag. 2006, 70, 241–256. [Google Scholar] [CrossRef]
  69. Webb, S.J.; Ashwal, L.D.; Cawthorn, R.G. Continuity between eastern and western Bushveld Complex, South Africa, confirmed by xenoliths from kimberlite. Contrib. Mineral. Petrol. 2011, 162, 101–107. [Google Scholar] [CrossRef]
  70. Kinnaird, J.A.; McDonald, I. An introduction to mineralisation in the Northern Limb of the Bushveld Complex. Appl. Earth Sci. Trans. Inst. Min. Metall. Sect. B 2005, 114, 194–198. [Google Scholar] [CrossRef] [Green Version]
  71. Kinnaird, J.A.; Yudovskaya, M.; McCreesh, M.; Huthmann, F.; Botha, T.J. The Waterberg platinum group element deposit: Atypical mineralization in mafic-ultra- mafic rocks of the Bushveld Complex, South Africa. Econ. Geol. 2017, 112, 1367–1394. [Google Scholar] [CrossRef]
  72. Cole, J.; Webb, S.J.; Finn, C.A. Gravity models of the Bushveld Complex—Have we come full circle? J. Afr. Earth Sci. 2014, 92, 97–118. [Google Scholar] [CrossRef]
  73. Good, N.; De Wit, M.J. The Thabazimbi-Murchison Lineament of the Kaapvaal Craton, South Africa: 2700 Ma of episodic deformation. J. Geol. Soc. 1997, 154, 93–97. [Google Scholar] [CrossRef]
  74. Masse, P.; Laurent, O. Geological exploration of Angola from Sumbe to Namibe: A review at the frontier between geology, natural resources and the history of geology. Comptes Rendus Geosci. 2016, 348, 80–88. [Google Scholar] [CrossRef] [Green Version]
  75. Hillier, M.; de Kemp, E.; Schetselaar, E. 3D form line construction by structural field interpolation (SFI) of geologic strike and dip observations. J. Struct. Geol. 2013, 51, 167–179. [Google Scholar] [CrossRef]
  76. Jones, M.Q.W. Thermophysical properties of rocks from the Bushveld Complex. J. S. Afr. Inst. Min. Metall. 2017, 115, 1–14. [Google Scholar] [CrossRef]
  77. Gupta, K.H.V.; Sutcliffe, R. Mafic-ultramafic intrusives and their gravity field: Lac des Iles area, northern Ontario. Geol. Soc. Am. Bull. 1990, 102, 1471–1483. [Google Scholar] [CrossRef]
  78. Latypov, R.; Chistyakova, S.; van der Merwe, J.; Westraat, J. A note on the erosive nature of potholes in the Bushveld Complex. S. Afr. J. Geol. 2019, 122, 555–560. [Google Scholar] [CrossRef]
  79. Smith, D.S.; Basson, I.J. Shape and distribution analysis of Merensky Reef potholing, Northam Platinum Mine, western Bushveld Complex: Implications for pothole formation and growth. Miner. Depos. 2006, 41, 281–295. [Google Scholar] [CrossRef]
  80. Funtowicz, S.O.; Ravetz, J.R. Uncertainty and Quality in Science for Policy; Netherlands Academic Publishers: Amsterdam, The Netherlands, 1990. [Google Scholar]
  81. Gibson, R.L.; Courtnage, P.M.; Charlesworth, E.G. Bedding-parallel shearing and related deformation in the lower Transvaal Supergroup north of the Johannesburg Dome, South Africa. S. Afr. J. Geol. 1999, 102, 99–108. [Google Scholar]
  82. Hartzer, F.J. Constraints on the Origin of Layered Intrusions: The Bushveld Complex, South Africa Transvaal Supergroup inliers: Geology, tectonic development and relationship with the Bushveld complex, South Africa. J. Afr. Earth Sci. 1995, 21, 521–547. [Google Scholar] [CrossRef]
Figure 1. Overview of the Bushveld Complex, indicating the position of its primary limbs: Eastern, Western, Northern, Southern/Bethal, and Far Western. The Eastern and Western Limbs, constituting the main chamber of the complex, are hosted in Pretoria Group sediments, to the east and west, respectively. Lithologies from the open-source Council for Geosciences’ (CGS) ArcMap project, with the position of the Rustenburg Layered Suite highlighted.
Minerals 10 00975 g001
Figure 2. Boundary of the Volume of Interest and data distribution. Notable features include: (1) North-up reverse faulting along the Thabazimbi-Murchison Lineament (TML), Zebediela, Welgevonden/Southern, Bobejaanswater Fault systems; (2) SSE-directed thrusting along the Droogekloof Thrust, Boschpoort Fault/Thrust and Southern Boundary Fault system; (3) Lack of dome development within the Western Limb.
Minerals 10 00975 g002
Figure 3. Modelled fault network. A total of 63 key regional structures were identified and modelled in 3D. Of these, 13 were activated within the 3D modelling software (Leapfrog), to create 23 discrete fault-bounded domains. Merensky Reef and/or UG2 Reef surfaces were not modelled in several fault domains due to a paucity or lack of outcrop or downhole data. Static structural trends were utilized for initial reference surface construction, which varied across fault domains. These structural trends were derived from stereonet analysis and contoured averages of cumulate layering measurements and, if available, regional bedding orientations (stereonets are equal area, lower hemisphere). Data sourced and modified/augmented after Basson (2019) [11].
Minerals 10 00975 g003
Figure 4. Schematic of modelling workflow, detailing key inputs used for the construction of the UG2 and Merensky Reef surfaces.
Minerals 10 00975 g004
Figure 5. Modelled Merensky and UG2 Reef surfaces. Distribution of drillhole data and modelled fault network.
Minerals 10 00975 g005
Figure 6. Modelled Merensky (a) and UG2 (b) elevation contours, in MASL.
Minerals 10 00975 g006
Figure 7. Calculated inter-reef separation or middling (m) between the UG2 and Merensky reefs. Numbered points of interest are discussed in the text.
Minerals 10 00975 g007
Figure 8. Modelled Merensky Reef surface dips. Position of section line B–B’ indicated on map. Section line highlights high dip angles towards the Stofpoort Fault zone (Point 3). Numbered points of interest are discussed in the text.
Minerals 10 00975 g008
Figure 9. Modelled UG2 Reef surface dips. Position of section line A–A’ indicated on map. Numbered points of interest are discussed in the text.
Minerals 10 00975 g009
Publisher’s Note: MDPI stays neutral with regard to jurisdictional claims in published maps and institutional affiliations.

