Article

Study on the Liberation of Organic Macerals in Coal by Liquid Nitrogen Quenching Pretreatment

College of Chemistry and Chemical Engineering, Xi’an University of Science and Technology, Xi’an 710054, China
*
Author to whom correspondence should be addressed.
Minerals 2020, 10(10), 911; https://doi.org/10.3390/min10100911
Submission received: 2 August 2020 / Revised: 8 October 2020 / Accepted: 13 October 2020 / Published: 15 October 2020

Abstract

:
In order to study the liberation characteristics of different macerals in coal, one must improve the liberation degree of macerals in coal and promote the utilization of macerals based on their properties. Based on the idea of quick cooling to change the brittleness and toughness of different macerals, the characteristics of macerals in coal are studied here by liquid nitrogen quenching pretreatment. In particular, coarse-grained samples (with a particle size of 1–3 mm) were. For this study, coal samples were sourced from the Yan’an Formation (J2y), a middle Jurassic coal formation in the Huangling no. 1 coal mine, located in northern Shaanxi Province, China. Firstly, we analyzed the coal properties and coal petrographic characteristics by the Chinese national standard method. Secondly, the distribution characteristics of macerals in different particle sizes (>0.9, 0.5–0.9, 0.1–0.5, and <0.1) were studied. Then, the samples with different particle sizes were quenched with or without liquid nitrogen to obtain the experimental group and blank group products. Finally, the differences in the liberation characteristics between the experimental group and the blank group products were studied via analyzing the micromorphology, specific surface area, pore volume, pore size and liberation degree. Our results for the particles size and liberation degree analysis indicate that inertinite and vitrinite were enriched in the coarse particles (>0.5 mm) and fine particles (<0.1 mm) here, respectively. Moreover, quenching pretreatment could contribute to the liberation of different macerals from coal, mainly because of the different effects of stress on the different components when they suddenly encounter cold, and this kind of liberation is mainly arc-shaped liberation between different macerals. In addition, along with the above results, this paper presents an optimized model for the liberation of macerals based on a combination of screening, liquid nitrogen quenching pretreatment and re-crushing.

1. Introduction

Coal has always been the main fuel type in China, where it has historically accounted for nearly 70% of China’s total energy production [1]. Facing the challenges related to environmental protection and resource shortages, China is pursuing clean, reasonable, and the efficient utilization of coal resources to meet the national strategic demand for green energy. Coal is formed by coal plants through complex biogeochemical processes and has a complex composition [2]. The components of coal are divided into inorganic minerals and organic macerals. The organic components in coal have been identified as macerals, and macerals in coal can be divided into three groups, namely vitrinite, liptinite, and inertinite [2,3,4,5].
Previous studies have shown that there are obvious differences in the chemical composition and physical properties between different macerals [6,7,8,9]. Regarding the chemical structure differences, several studies have shown that the aromatic carbon/aliphatic carbon ratio increases from liptinite to vitrinite and then inertinite and that there are also significant differences in the H–C ratio and in the O–C ratio among different macerals [10,11]. Typically, the aromaticity of vitrinite fractions is significantly lower than that of inertinite fractions [12]. Moreover, vitrinite-rich concentrates exhibit a higher content of volatiles, and liptinite has a higher hydrogen content [13,14].
Regarding the physical property differences, firstly, the densities of different macerals are significantly different and the densities of liptinite, vitrinite and inertinite are 1.0–1.25, 1.28–1.33 and 1.34–1.45 g/mL, respectively [15]. In addition, the surface properties of different macerals are also different. Typically, the hydrophobicity of vitrinite is higher than that of inertinite during floatation processes [16]. Inertinite-rich coal always has fully developed pores and high specific surface areas [17]. Owing to the obvious differences in the compositions, properties, and utilizations of among macerals, property-based utilization is of great significance for the efficient and clean utilization of coal [18,19]. Owing to the obvious differences in the composition, properties and utilization of among macerals, property-based utilization is of great significance for the efficient and clean conversion utilization of coal.
Maceral separation methods are mainly based on their differences in density and surface properties, such as gravity separation and flotation. Previous studies have separated macerals from coal via the density gradient methods and have concluded that density gradient centrifugation can provide more detailed insight into the nature of coal and coal macerals [20,21,22,23,24]. It has been proven that the purity of macerals in coal can be improved by centrifugal floating separation and continuous flow centrifugation [25,26,27]. Flotation is also an important method for the separation of macerals. Previous studies have shown that the separation of macerals can be promoted by adjusting coal particle size, slurry concentration and slurry pH [28,29]; however, these methods are not very significant for upgrading macerals groups [29]. In summary, research on separation methods is relatively mature, and these methods have been widely used for the separation of microscopic components. On the other hand, the degree of the liberation of samples may be a key factor that limits the purification of macerals in mature separation methods.
Previous research has shown that the enrichment purity of macerals is lower than expected, which is closely related to the liberation effect [26,27,30,31]. This view has also been proven by numerous studies with various findings, e.g., that the extent of liberation might not be the same for coal with the same fineness [32], that it is necessary to reduce inferior coals to a grain size of 10 μm for receiving a greater rank of liberation of the components [33], that the liberation and distribution of macerals in bituminous coal was used to predict the maceral separation performance of coal [34], and that the liberation characteristics of macerals have been studied by process intensification and microwave-assisted liberation [35]. Mineral liberation analysis (MLA) has been used to evaluate the release of macerals after impact crushing [36], and the liberation factor has been used to quantify mineral liberation. All these studies indicate that the liberation of macerals from coal also plays an important role in their separation process.
According to the different testing techniques, the determination methods of the mineral monomer liberation degree can be divided into a mineral separation measurement method and mineral microscopic image measurement methods. The latter methods were widely used for the determination of mineral monomer liberation degrees, because of the simple operation of the method and the high measurement accuracy. In recent years, with the continuous development of detection technology, there are many new detection methods for the mineral liberation degree. These methods are mainly based on microscopic image measurement methods, paired energy spectrum detection, X-ray computed tomography and deep learning processing, so as to realize mineral liberation state recognition, three-dimensional imaging, automatic detection, and other functions [37,38,39]. Although these methods are still in the laboratory stage, they provide more convenience for the study of mineral liberation.
However, most studies in the field of maceral liberation in coal have mainly focused on typical mechanical impact breakage. These methods obtain a better liberation degree by using a finer particle size, but the finer the particle size, the lower the liberation efficiency. Traditional impact crushing is the most widely used and studied method, but this method is used to obtain a higher liberation degree through the use of a finer particle size. We all know that the finer the particle size, the greater the crushing power consumption. On the other hand, the finer the particle size, the larger the specific surface area, which will increase the difficulty of continuous separation process. A lot of research work is focused on the crushing and grinding of coal, while, on the contrary, research on its pretreatment is relatively rare. The present study follows the concept that large tissue stress between different materials is readily formed through rapid cooling treatment and aims to explore the effect of “quenching” treatment on maceral liberation from coal before comminution. The size range of the coal particle studied here is 0.1–1 mm, rather than finer sizes. The current research work is expected to provide technical and theoretical support for fine processing and the utilization of coal.

2. Materials and Methods
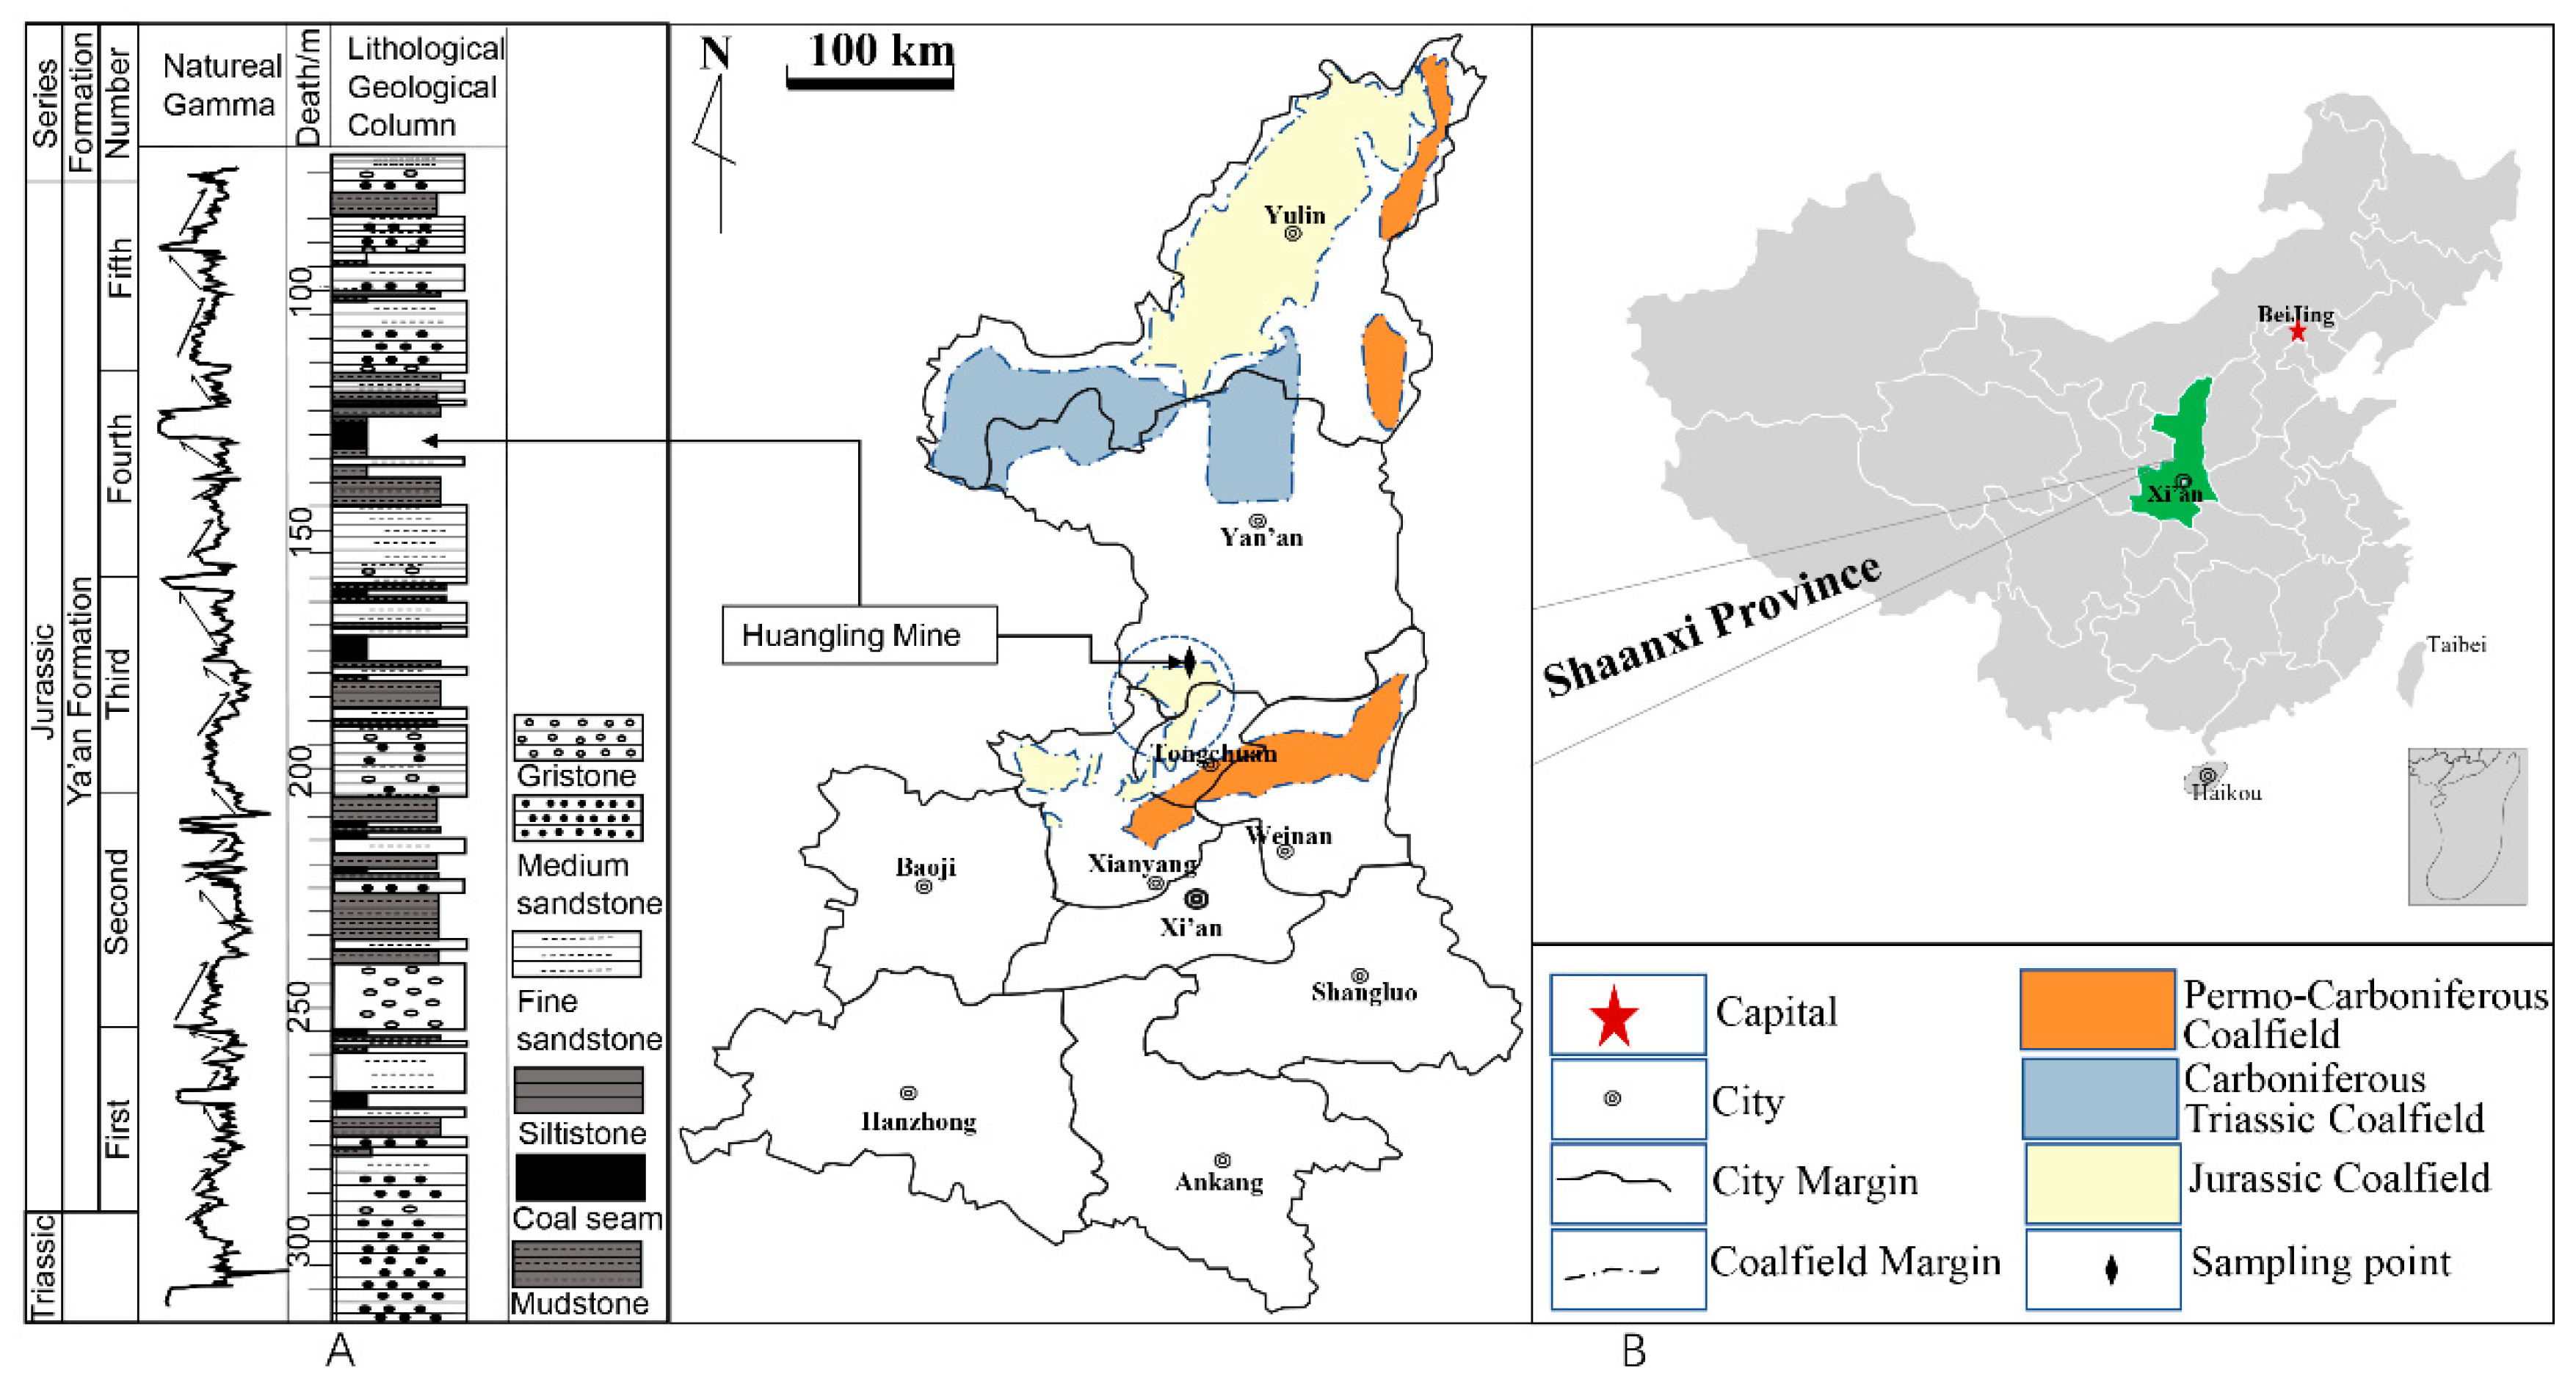
2.1. Materials

The Huangling mining area is located in the northeast of the Huanglong coalfield, which is an important energy base in Shaanxi Province, China. Coal samples were collected from mixed coal in the coal preparation plant of the no. 1 mine of the Huangling mining area. The sampling points and stratigraphic histogram is shown in Figure 1. The Yan’an Formation is a coal-bearing stratum in the area. It is mainly represented by a set of river–lake delta–alluvial plain environmental deposits, which are composed of gray fine-coarse feldspar sandstone, dark gray mudstone, siltstone, black carbonaceous mudstone, coal seam and other sedimentary cycles [40]. According to rock assemblage, coal-bearing characteristics, cycle structure, etc., the coal field department divided the Yan’an Group into five sections, which are the first, second, third, fourth, and fifth sections from bottom to top. The formation thickness is between 195.29–255.07 m, with an average of 223.80 m [40]. The samples were from the fourth section, which is the main mineable coal seam in this area. Sampling is very important for subsequent experiments [41]. According to the national standard method for the manual sampling of coal (GB/T 475-2008 [42]), 15 kg samples with a particle size less than 13 mm were collected by conic quartering. The collected samples were crushed into particles with a size less than 3 mm by a small jaw crusher (EP-2, Xinyun, Hebi, China) with a power of 1.5 kW. The particle size at the outlet of the crusher was set to 3 mm. Samples were crushed by a single-stage open circuit non-circulation process and put into sample bags for later experimentation. In order to prevent the coal samples from weathering due to the long-term exposure to air, the broken samples were put into the sample bags and a vacuum cleaner was used to extract the air in the bag. Then, the bags were finally sealed and stored in a cool and dry storage cabinet.

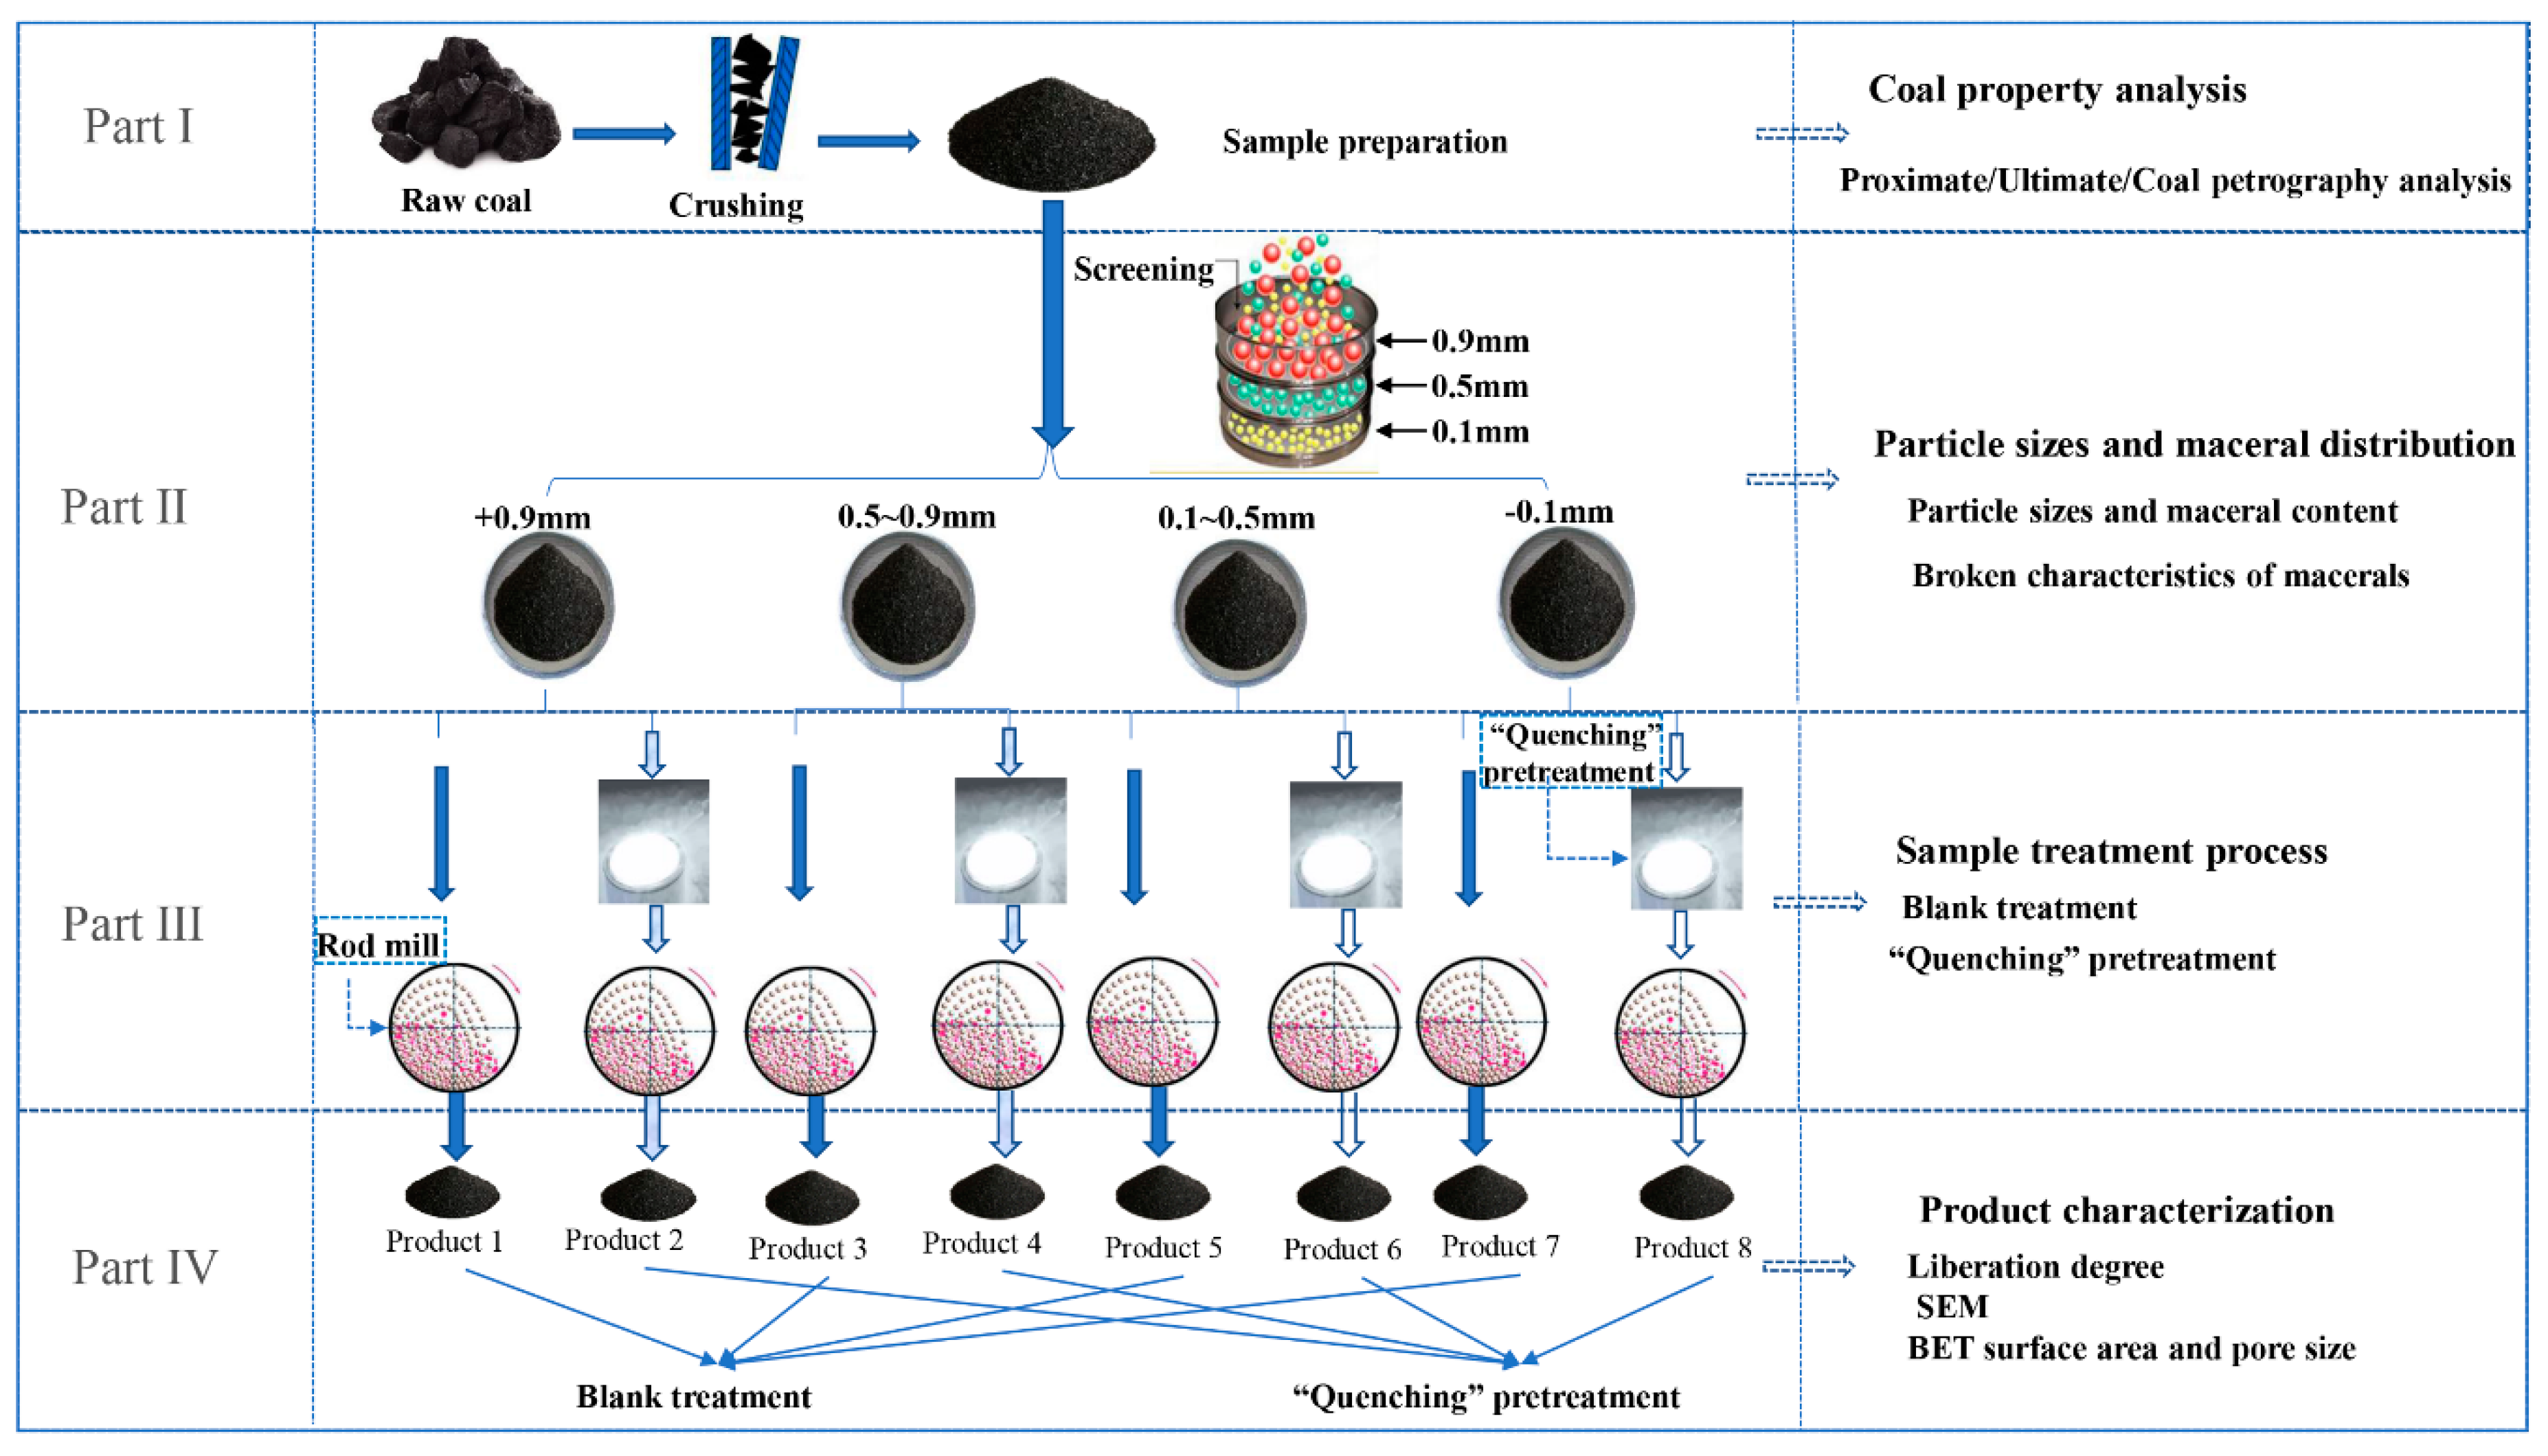
2.2. Experimental Process

It is easy to understand that stress between different components will be spontaneously generated when high temperature objects are rapidly cooled. This is a good example of the phenomenon where materials expand with heat and contract with cold. A method based on quenching into liquid nitrogen may provide the possibility of the selective liberation of macerals from coal. The specific experimental process includes four parts, the detailed technological process is displayed in Figure 2.
(1) The coal samples for coal property analysis were prepared according to the existing method for the preparation of a coal sample (GB/T 474-2008 [43]). Then, the coal property parameters, such as those found by proximate analysis, ultimate analysis, calorific value and coal petrography analysis, were detected by analytical instruments. The coal property detections were carried out according to the national standard methods (GB/T 212-2008 [44], GB/T31391-2015 [45], GB/T213-2008 [46]).
(2) According to the national standard method for the size analysis of coal, the coal samples were sieved into four groups by experimental sieves with pore sizes of 0.1, 0.5 and 0.9 mm for subsequent experiments. The coal particle sizes were >0.9, 0.5–0.9, 0.1–0.5, and <0.1 mm, and the particle size distribution was characterized by a laser particle size meter. The representative samples of each group were divided by the coning and quartering method. In addition, the thermal properties of the samples were detected by a synchronous thermal analyzer (Mettler Toledo TG/DSC-1, TA Instruments, New Castle, DE, USA). The samples were manufactured into powder coal flakes, and the contents and crack distribution characteristics of the macerals were detected by a Leica DM4500P optical microscope (Leica, Wetzlar, Germany) using the method of determining the maceral group composition and mineral of coal (GB/T 8899-2013 [47]).
(3) The four groups of screened samples in the second step were divided into two groups, one as a blank group and the other as an experimental group. The samples in the blank group were grinded directly for 10 s by a rod mill (XF BM, Xianfeng, Hebi, China). The power of the rod mill was 2.2 kW and the rotating speed was 940 rpm, and then the products were collected. The samples in the experimental group were first quenched by liquid nitrogen, and the process of this was the following: (i) first, 50 g samples of each particle size were weighed and put into 70 mL crucibles with a lid; (ii) the crucible containing the sample from the previous step was put into a muffle furnace; (iii) the crucibles containing the sample from the previous step were placed into a muffle furnace that was heated to 200 °C at a rate of 5 °C per minute to completely remove the moisture content; and (iv) the samples dehydrated by heating were quickly placed in liquid nitrogen for quenching which was kept 10 min. Then, the samples quenched with liquid nitrogen were also grinded for 10 s by rod mill (XF BM, Xianfeng, Hebi, China). The power of the rod mill was 2.2 kW and the rotating speed was 940 rpm. Finally, the experimental group products were collected.
(4) The products (including the blank group and experimental group) collected in the step above were characterized by an analytical instrument. The specific surface area and pore size were measured by employing a physical adsorption apparatus (Micromeritics ASAP-2000, Micromeritics Instrument Corporation, Norcross, GA, USA). The morphology and crack distribution characteristics were observed by a scanning electron microscope (JEOL JSM-6460LV, JEOL Ltd., Tokyo, Japan), and an optical microscope (Leica DM4500P, Leica, Wetzlar, Germany). Regarding the liberation degree, the “count particle method” was employed to quantify the maceral liberation [42]. This process was mainly carried out to observe the liberation state of the macerals under the microscope. We moved the stage of the microscope with equal steps of 0.5 mm and observed the whole powder coal flakes with a step-by-step, line-by-line process. At the same time, the number of monomer-liberated particles and undissolved particles was counted. At least 500 valid monomer particles were counted in each observation. If the ratio between the individual maceral and monomer particles was greater than 90%, then it was considered liberated [48]. Otherwise, it was unliberated. The statistical results were converted into the liberation degree using Equation (1) [48]:
F a = f a f a + f b × 100 %
  • Fa: Monomer liberation degree of macerals in coal;
  • fa: Number of liberated monomer particles;
  • fb: Number of unliberated monomer particles.
For the above experimental process, we collected the samples for analysis and detection by conic quartering division method according to the national standard method for the preparation of a coal sample (GB/T-474-2008 [43]). Under the current experimental conditions, in order to improve the accuracy of experimental data as much as possible, we used the average value of three groups’ valid data for each experimental dataset.

3. Results and Discussion

3.1. Coal Property Analysis

The proximate analysis, ultimate analysis and calorific results for these samples are provided in Table 1.
As shown in Table 1, according to the classification methods for quality of coal from the China National Standards (GB/T 15224.1-2018 [49], GB/T 15224.2-2010 [50] and GB/T 15224.3-2010 [51]), this coal is ‘low sulfur’ (LS, 0.51% < St,d < 0.50%), ‘low ash’ (LA, 10.01% <Aad < 20.00%), ‘medium volatile’ (MV, 20% < Vdaf < 28%), and “medium calorific value” (MQ, 21.31 < Qgr.d < 24.30).
Table 2 presents a summary of the statistical results of the coal petrography analysis for the raw coal samples. The results illustrate that vitrinite and inertinite were the main organic macerals, and that both of their contents were approximately 40%. This finding indicates that Huangling coal is rich in inertinite [35]. On the other hand, the 15.45% content of inorganic minerals was higher than that of liptinite but lower than the value of vitrinite and inertinite. The contents of different inorganic minerals range between 1.94% and 7.28% in the order: sulfide minerals (7.28%) > silica minerals (3.26%) > clay minerals (2.16%) > carbonate minerals (1.94%).
In addition, Huangling coal was proven to be a low thermal evolution bituminous coal by its vitrinite reflectance of 0.65. Interestingly, as a low-rank bituminous coal [52], Huangling coal has a high calorific value and low volatile matter, which may be related to its inertinite-rich composition.
As shown in Figure 3, in the process of the identification and statistical analysis of macerals, we also found that vitrinite was prone to cracking (Figure 3A) and that inertinite has many pore structures (Figure 3D). In addition, liptinite is often associated with vitrinite (Figure 3C), and sulfide minerals and silica minerals are often embedded in inertinite (Figure 3B). Moreover, the macrinite and micrinite of the inertinite group are often impregnated with vitrinite (Figure 3E,F), which makes it difficult to separate them.
Previous studies have shown that different macerals and different particle sizes of coal have different thermogravimetric properties [53]. In order to obtain the appropriate heating conditions for subsequent quenching experiments, we need to obtain the thermal properties of different coal samples. To obtain the thermal properties of the different particle size samples, we performed four thermogravimetric experiments at a heating rate of 5 °C per minute in a nitrogen atmosphere. Figure 4A shows the relevant thermogravimetry analysis curves. First, we observed that the sample slowly lost weight with an increasing temperature below 400 °C, while it lost weight sharply at approximately 450 °C. When the temperature was below 400 °C, the weight loss was 3.5%. This process can be divided into two stages. In the first stage, when the temperature is lower than 200 °C, the weight loss is fast, and the weight loss is 3.0%. Between 200 °C and 400 °C, the weight loss is very gentle, and the weight loss is about 0.5%. At the stage below 400 °C, the main loss is moisture in the coal (including internal water). In addition, between 400 and 800 °C, the weight loss was approximately 20%, indicating that the coal properties changed dramatically during this process. Some studies have also shown that coal mainly loses moisture when it is below 350 °C, and that volatile matter will be lost between 400 °C and 800 °C [54]. At this stage, the composition of coal has changed. Therefore, our subsequent quenching heating experiment cannot exceed 400 °C.
As shown in Figure 4B, there were some small weight loss peaks at 100 °C and some large weight loss peaks at 450 °C. These results indicated that the external moisture was generally lost at a temperature less than 100 °C and that the internal moisture and the crystal moisture were mainly lost between 100 °C and 400 °C. However, above 450 °C, the sample rapidly decomposed to produce gas, and the properties of coal also changed greatly. Therefore, the dehydration pretreatment before liquid nitrogen quenching should ideally not exceed 450 °C.

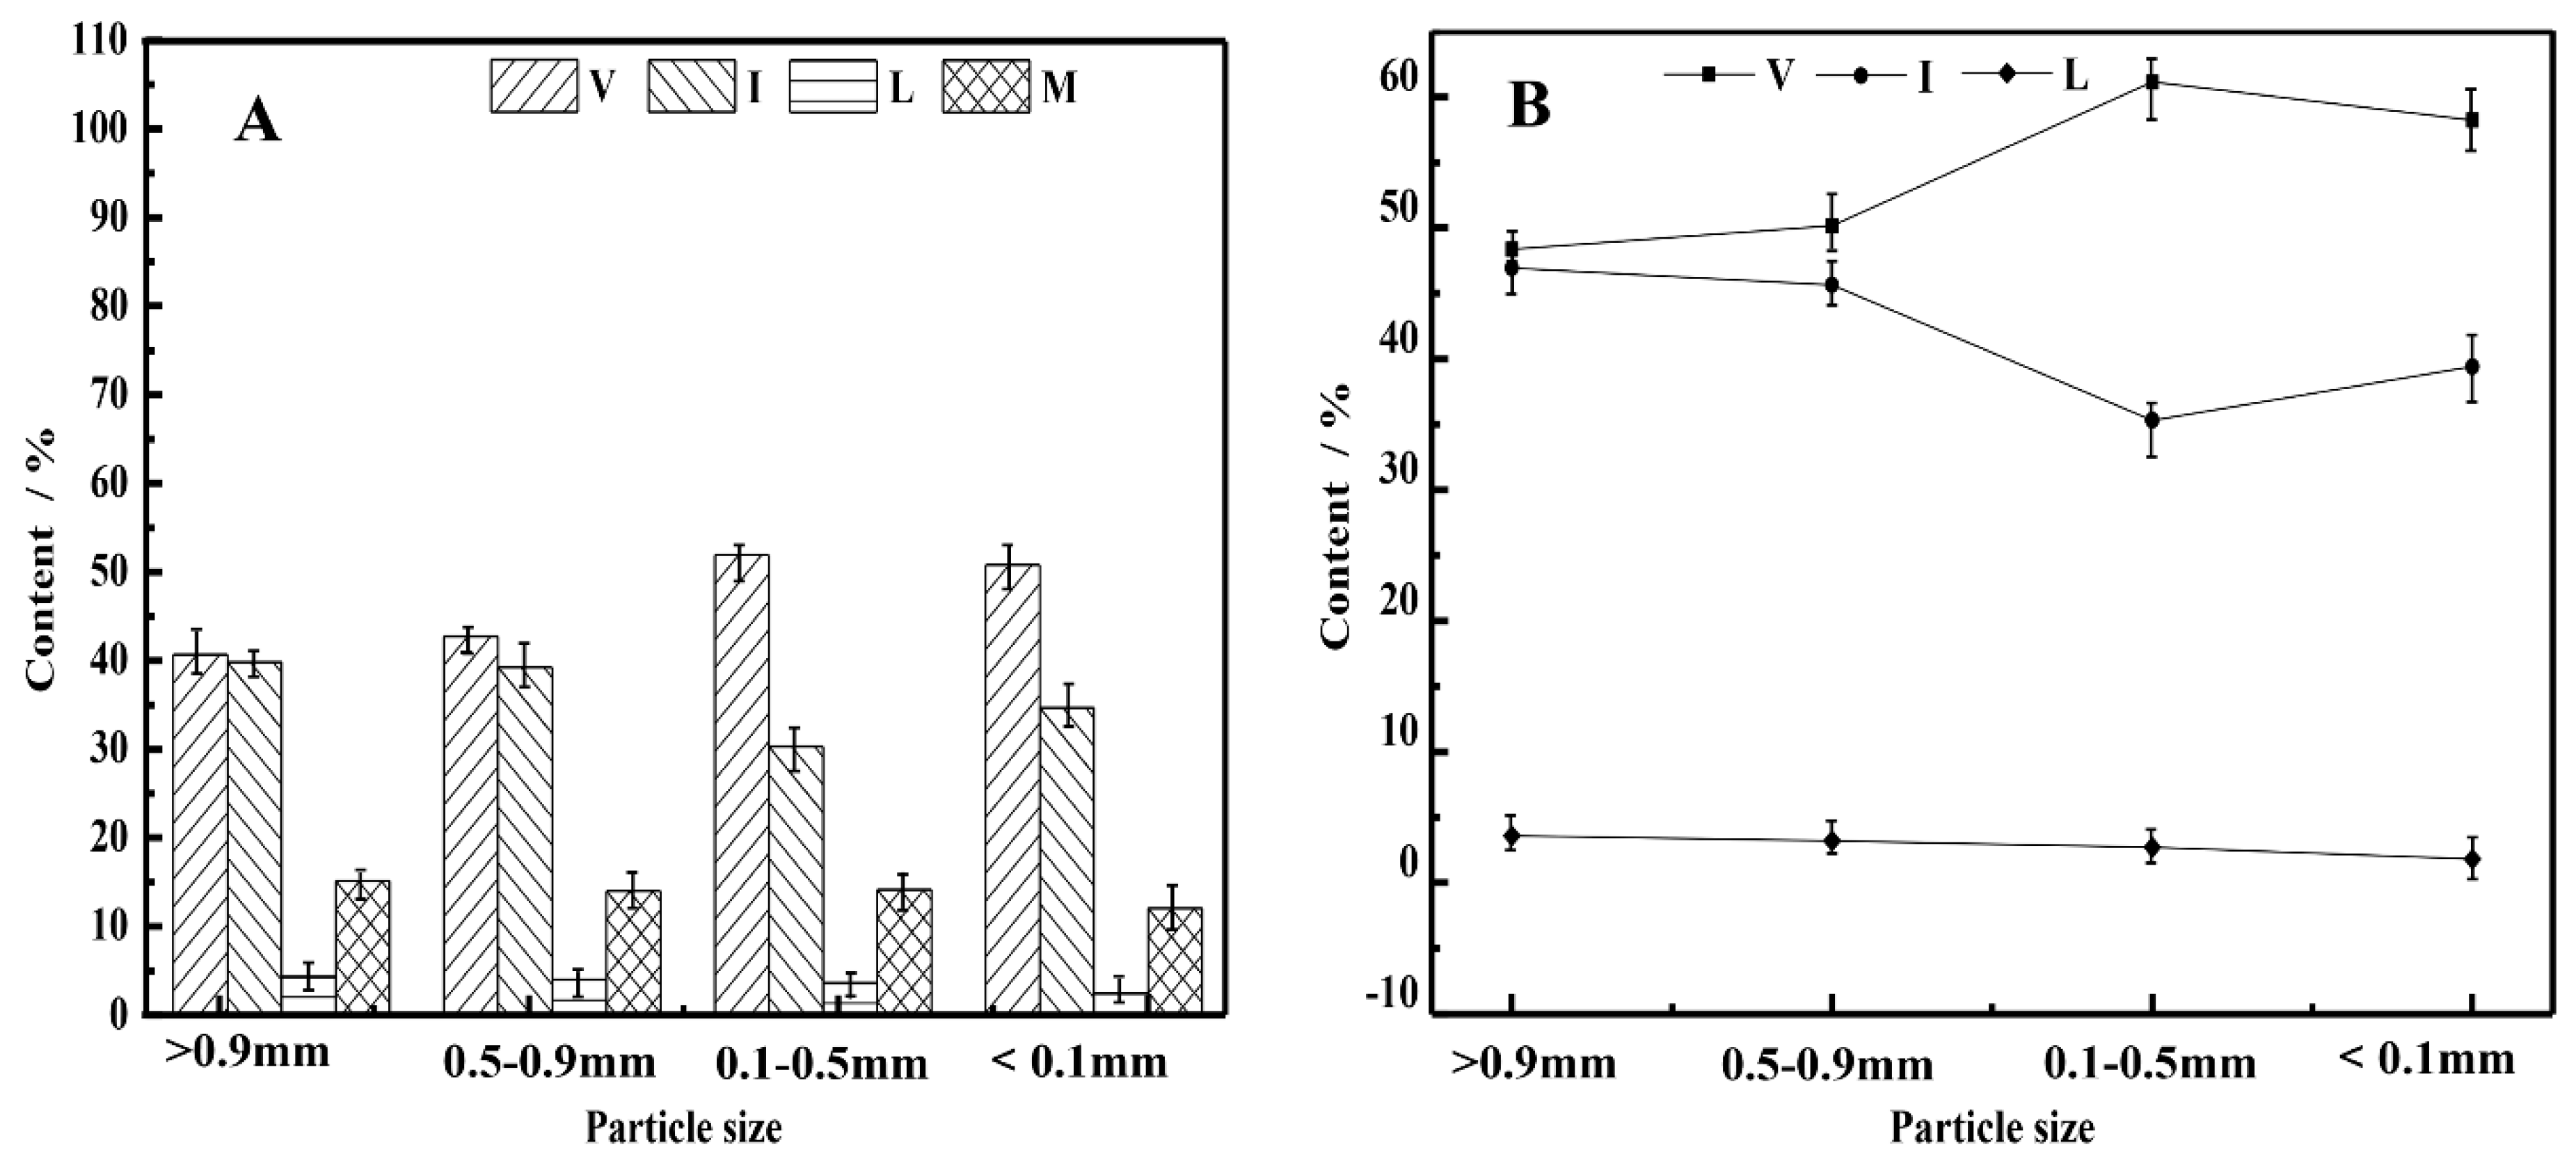
3.2. Particle Sizes and Maceral Distribution

Figure 5 presents the content of macerals in samples with different particle sizes. As shown in the histogram in Figure 5A, vitrinite and inertinite were the main components of coal, and the contents of liptinite and mineral groups were lower. Moreover, the average contents of vitrinite, inertinite, liptinite and minerals were 46.54%, 36.02%, 3.61% and 13.82%, respectively. For samples with different particle sizes, the contents of liptinite and minerals changed minimally, but those of vitrinite and inertinite changed considerably. From the linear graph in Figure 5B, it can be clearly observed that the vitrinite content first increases and then decreases with the decreasing of particle size. This phenomenon may be caused by the high brittleness and high crack susceptibility of vitrinite [35,55,56,57]. In contrast, the inertinite gradually decreased and then increased slightly with a decreasing particle size here. The main reason for this phenomenon is that inertinite has a more porous structure and is more tough than vitrinite [35,55,56,57].
Some images showing the broken characteristics of macerals in coal are shown in Figure 6, which may be able to offer some explanations as one reason for why the above results exist. It is clear that the cracks are mainly in vitrinite but rarely in inertinite, which is the same as the results of the previous research [57]. Furthermore, the number of cracks also dramatically decreased with a decreasing particle size during the observation process. Additionally, as shown in Figure 6A–F, the samples all have one thing in common: the boundaries are line shaped, a phenomenon that can also be seen in a previous study [35], and this phenomenon is known as line-shaped liberation. Furthermore, Figure 6B,C clearly show that the liberated parts can be assembled as a whole along the cracks. Since vitrinite exhibits more cracks than inertinite, the cracks are more likely to be generated, extended, and intersected with vitrinite, subjected to common mechanical crushing and grinding, usually resulting in more line-shaped liberation. This phenomenon is related to the high brittleness and homogeneous structure of vitrinite. When subjected to mechanical forces, inertinite can rely on its toughness and porous structure to buffer or transfer the external pressure (Figure 6G–I), but vitrinite can only produce cracks or expand along said cracks to release pressure (Figure 6E,F).

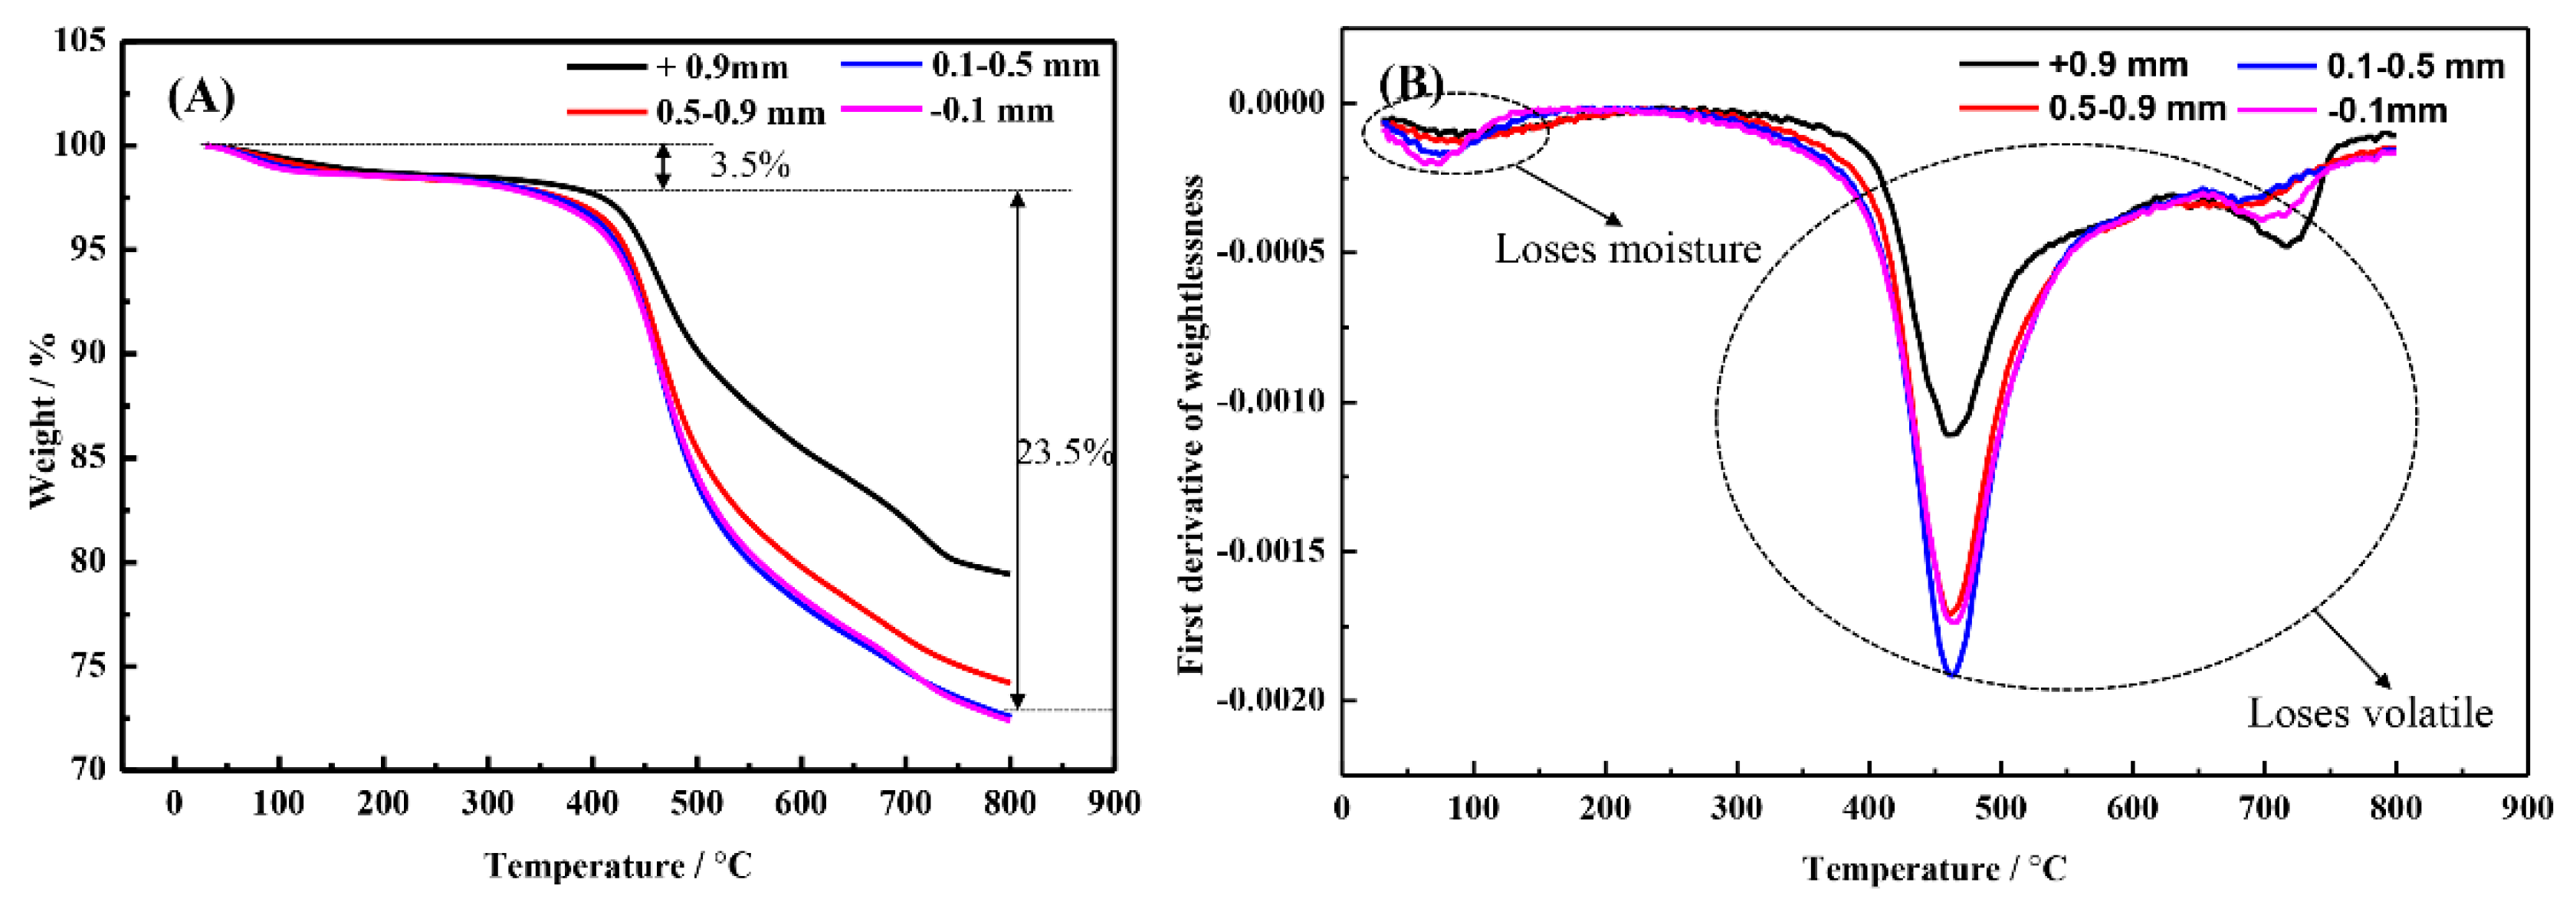
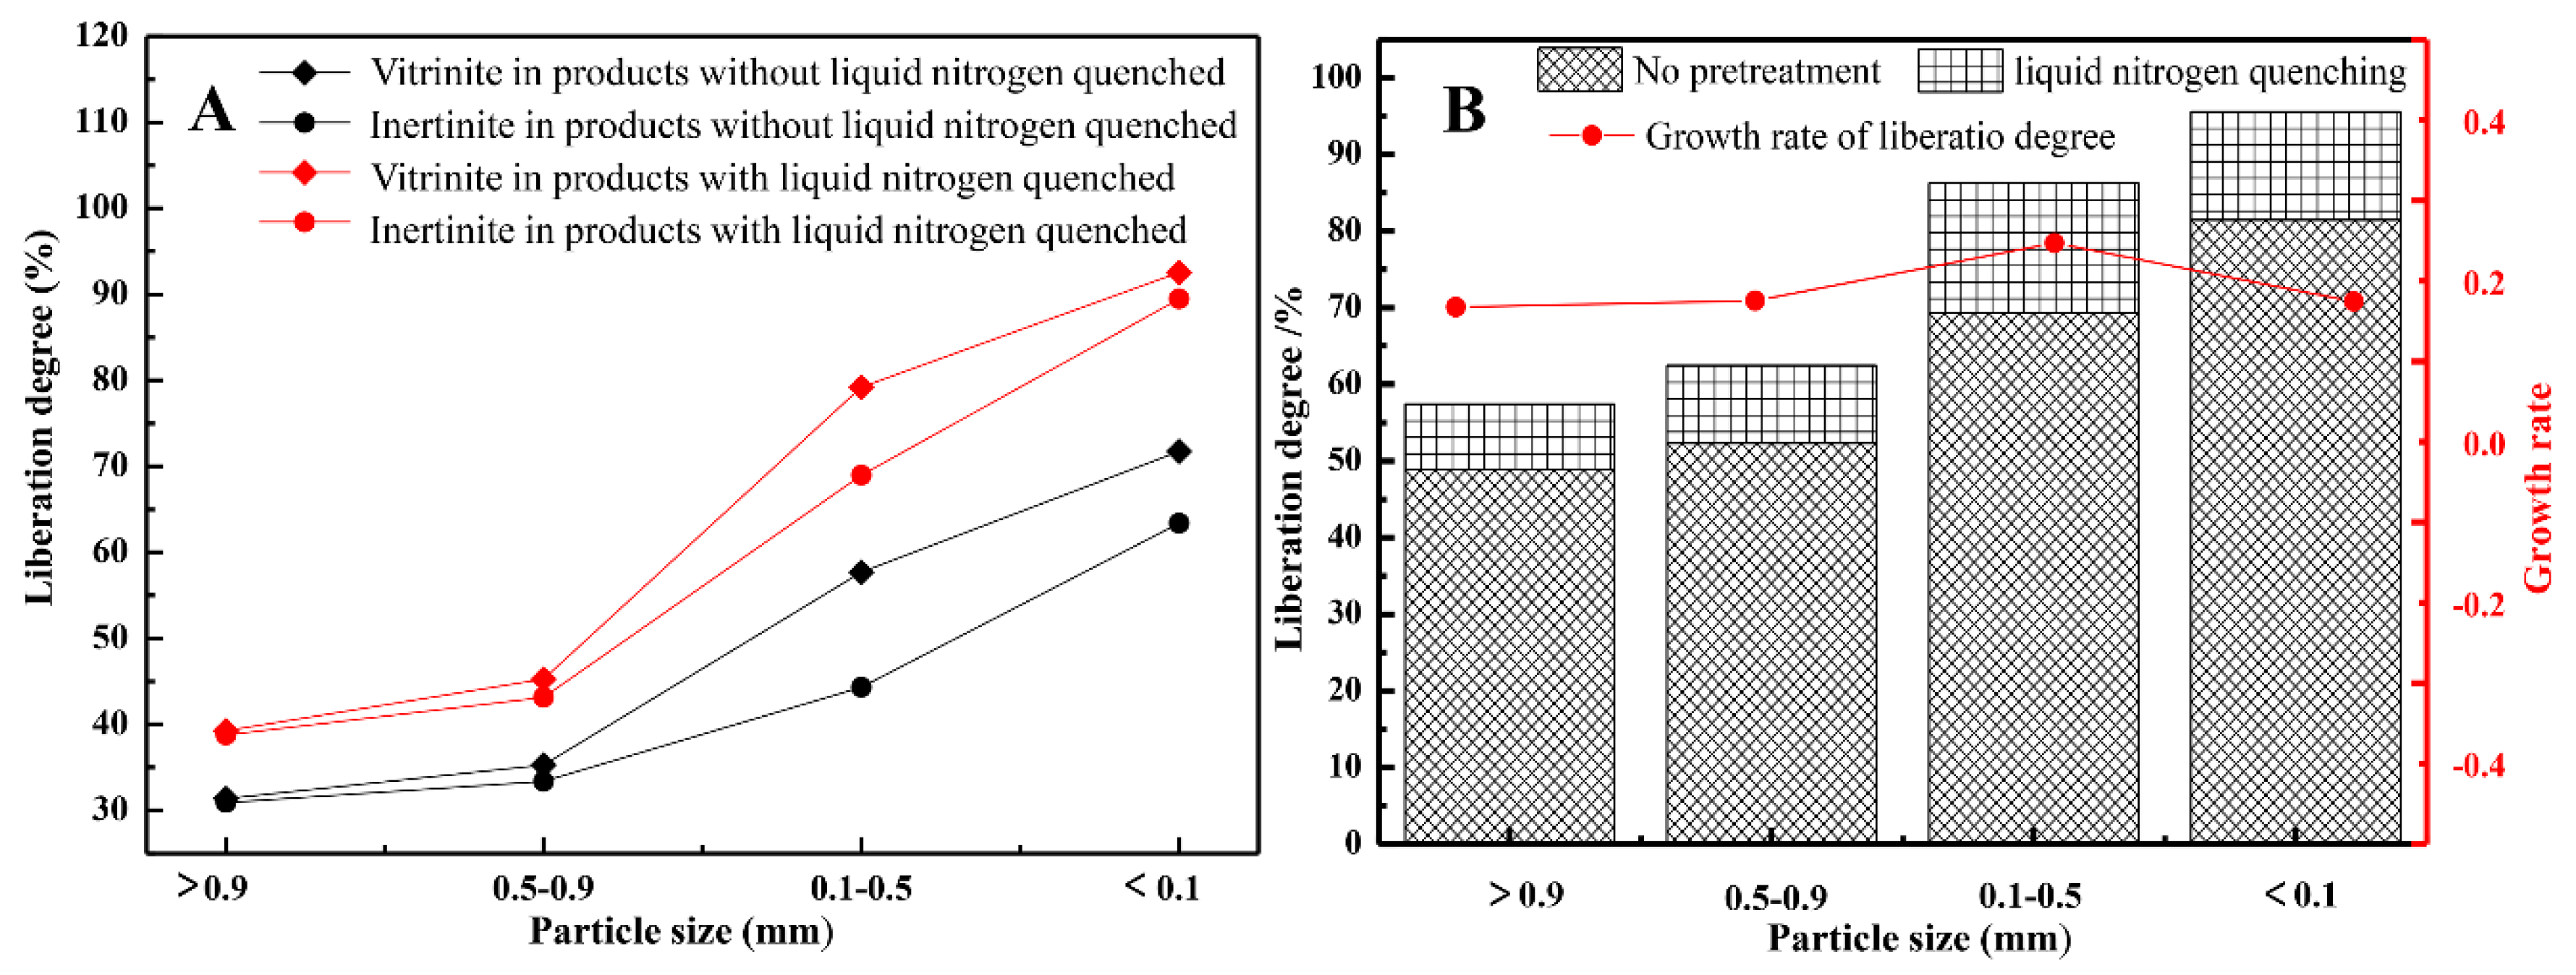
3.3. Pretreatment with “Quenching”

As shown in the previous experiment, the particle size has an effect on the distribution of coal macerals. Accordingly, a pre-grading experiment was designed in this study. Using a standard sieve, the raw coal sample was divided into four different particle size ranges, namely >0.9, 0.5–0.9, 0.1–0.5, and <0.1 mm. Each sample of different particle sizes was quenched with liquid nitrogen, and the liberation of the raw coal and quenched samples is displayed in Figure 7.
Figure 7A shows the liberation degree of various macerals with different particle sizes. Products were obtained from coal samples with a particle size greater than 0.9 mm without being quenched by liquid nitrogen, and the liberation degree of vitrinite and inertinite was 31.38% and 30.93%, respectively. Products obtained from coal samples with a particle size greater than 0.9 mm were quenched by liquid nitrogen, and the liberation degree of vitrinite was 39.26%, an increase of 7.88%, and that of inertinite was 38.76%, an increase of 7.83%. Products obtained from coal samples with a particle size between 0.5 and 0.9 mm without quenching by liquid nitrogen, the liberation degree of vitrinite and inertinite was 35.29% and 33.38%, respectively. Products obtained from coal samples with a particle size between 0.5 and 0.9 mm were quenched by liquid nitrogen, and the liberation degree of vitrinite was 45.26%, an increase of 9.97%, and that of inertinite was 43.16%, an increase of 9.78%. Products were obtained from coal samples with a particle size between 0.1 and 0.5 mm without being quenched by liquid nitrogen, and the liberation degree of vitrinite and inertinite was 57.7% and 44.32%, respectively. Products obtained from coal samples with a particle size between 0.1 and 0.5 mm were quenched by liquid nitrogen, and the liberation degree of vitrinite was 79.21%, an increase of 21.51%, and that of inertinite was 68.98%, an increase of 24.66%. Products were obtained from coal samples with a particle size less than 0.1 mm without being quenched by liquid nitrogen, and the liberation degree of vitrinite and inertinite was 71.74% and 63.4%, respectively. Products obtained from coal samples with a particle size less than 0.9 mm were quenched by liquid nitrogen, and the liberation degree of vitrinite was 92.56%, an increase of 20.82%, and that of inertinite was 89.46%, an increase of 23.06%. The histogram in Figure 7B shows that the maceral liberation degree of samples with a different particle sizes, as expected, increases with a decrease in particle size. The previous research results also show that the finer the grinded particle, the higher the degree of the liberation of minerals [58,59], which is consistent with our experimental results. Unsurprisingly, the liberation degree of samples with quenching pretreatment also follows this rule. In addition, compared to that of the samples without pretreatment, the liberation degree of the samples with quenching pretreatment was improved. However, the liberation degree of samples with coarse particle sizes (>0.5 mm) was lower than expected, and their average liberation degree increased by only 9.37%. This may be because coarse particles are difficult to quench uniformly. Coal is not a material with good thermal conductivity [60,61,62,63]. During the heating process, the macerals will expand when heated, and the moisture in the macerals can be removed to prevent moisture from solidifying during liquid nitrogen quenching. In the process of rapid cooling, each maceral will produce an inward contraction force when it is cooled. Different macerals have different compositions and structures, and they also have different brittleness and toughness [54,64], so that the contact surface of the different macerals will produce different deformations. In addition, on the contact surface of vitrinite and inertinite, the direction of the contraction force is opposite, which helps to produce microcracks for selective liberation. The coarser the coal particles, the slower the heat conduction and the more heat loss, which is not conducive to the generation of shrinkage force during cold quenching. When coarse coal particles are quenched by liquid nitrogen, the coarser the particles are, the greater the heat loss is, which makes it difficult to achieve uniform quenching. The effect of liquid nitrogen quenching is naturally poor for coarse coal particles.
The line graph in Figure 7B presents the increasing liberation rate of samples with different particle sizes after being quenched. In general, the liberation degree increased first and then decreased with a decreasing particle size, and the liberation of samples with a particle sizes between 0.1 and 0.5 mm was more effective than that of samples with a particle size less than 0.1 mm. The liquid nitrogen is boiling when quenching, and the bubbles will carry fine particles (<0.1 mm) and move violently. The finer the particles are, the more intense the motion is. This movement is that of whole particles, not the different macerals in the particles, and it is far greater than the stress between the different macerals in the particles. This intense movement will reduce the interaction effect between different components by liquid nitrogen quenching. The results show that particle size plays a major factor in this phenomenon, where fine (−0.1 mm) particles are more prone to movement than stress between different components when they are quenched.
Representative microscopic images of the samples obtained from the quenching pretreatment experiment are provided in Figure 8.
Figure 8A–F display the morphologies of the maceral liberation shape obtained following the quenching treatment. We conclude that the liberated macerals all have one thing in common; that the boundaries are arc shaped, so we call this phenomenon arc-shaped liberation. The ratio of macerals which have the “arc-shaped liberation” structure of coal with a particle size of >0.9, 0.5–0.9, 0.1–0.5 and <0.1 mm is 9.8%, 10.36%, 16.82% and 11.86%, respectively. Compared with the conventional mechanical crushing and grinding (Figure 7), Figure 8G–I show that vitrinite and inertinite were liberated along their edges. Different macerals have diverse compositions and structures, and their brittleness and toughness are obviously different [54,64]. When quenched in liquid nitrogen, various macerals are cooled, which causes the macerals to shrink inside. This suggests that this selective liberation phenomenon occurs because these macerals are more likely to produce differential stress after quenching.
Figure 8K,L display the maceral morphology of difficult liberation. There are two points that we must pay attention to. First, the contact surface between vitrinite and inertinite is long and straight. Second, there are no cracks between the macerals. The results show that cracks and liberation do not directly occur along the long and straight contact surfaces between different macerals upon quenching pretreatment and that a long and straight contact surface between different macerals is not conducive to the realization of arc-shaped liberation.
Representative scanning electron microscope (SEM) images of samples obtained from the quenching pretreatment experiment are provided in Figure 9. Compared with the sample without pretreatment (Figure 9A–C), the sample subjected to quenching pretreatment exhibited more cracks formed on the contact surface between vitrinite and inertinite after quenching (Figure 9D–I). Considered statistically, the increase in the interface cracks between the vitrinite and inertinite of coal with a particle size >0.9, 0.5–0.9, 0.1–0.5 and <0.1 mm is 9.82%, 11.64%, 18.12% and 15.24%, respectively, which was conducive to the selective liberation between different macerals. A more interesting phenomenon appeared in Figure 9J–L. We observed some pollens and sieve tubes of coal-forming plants in the fragmentation powder that were produced during the liquid nitrogen quenching process, and they all have complete shape structures [40]. This finding again verified that the quenching process would induce arc-shaped liberation between different components.

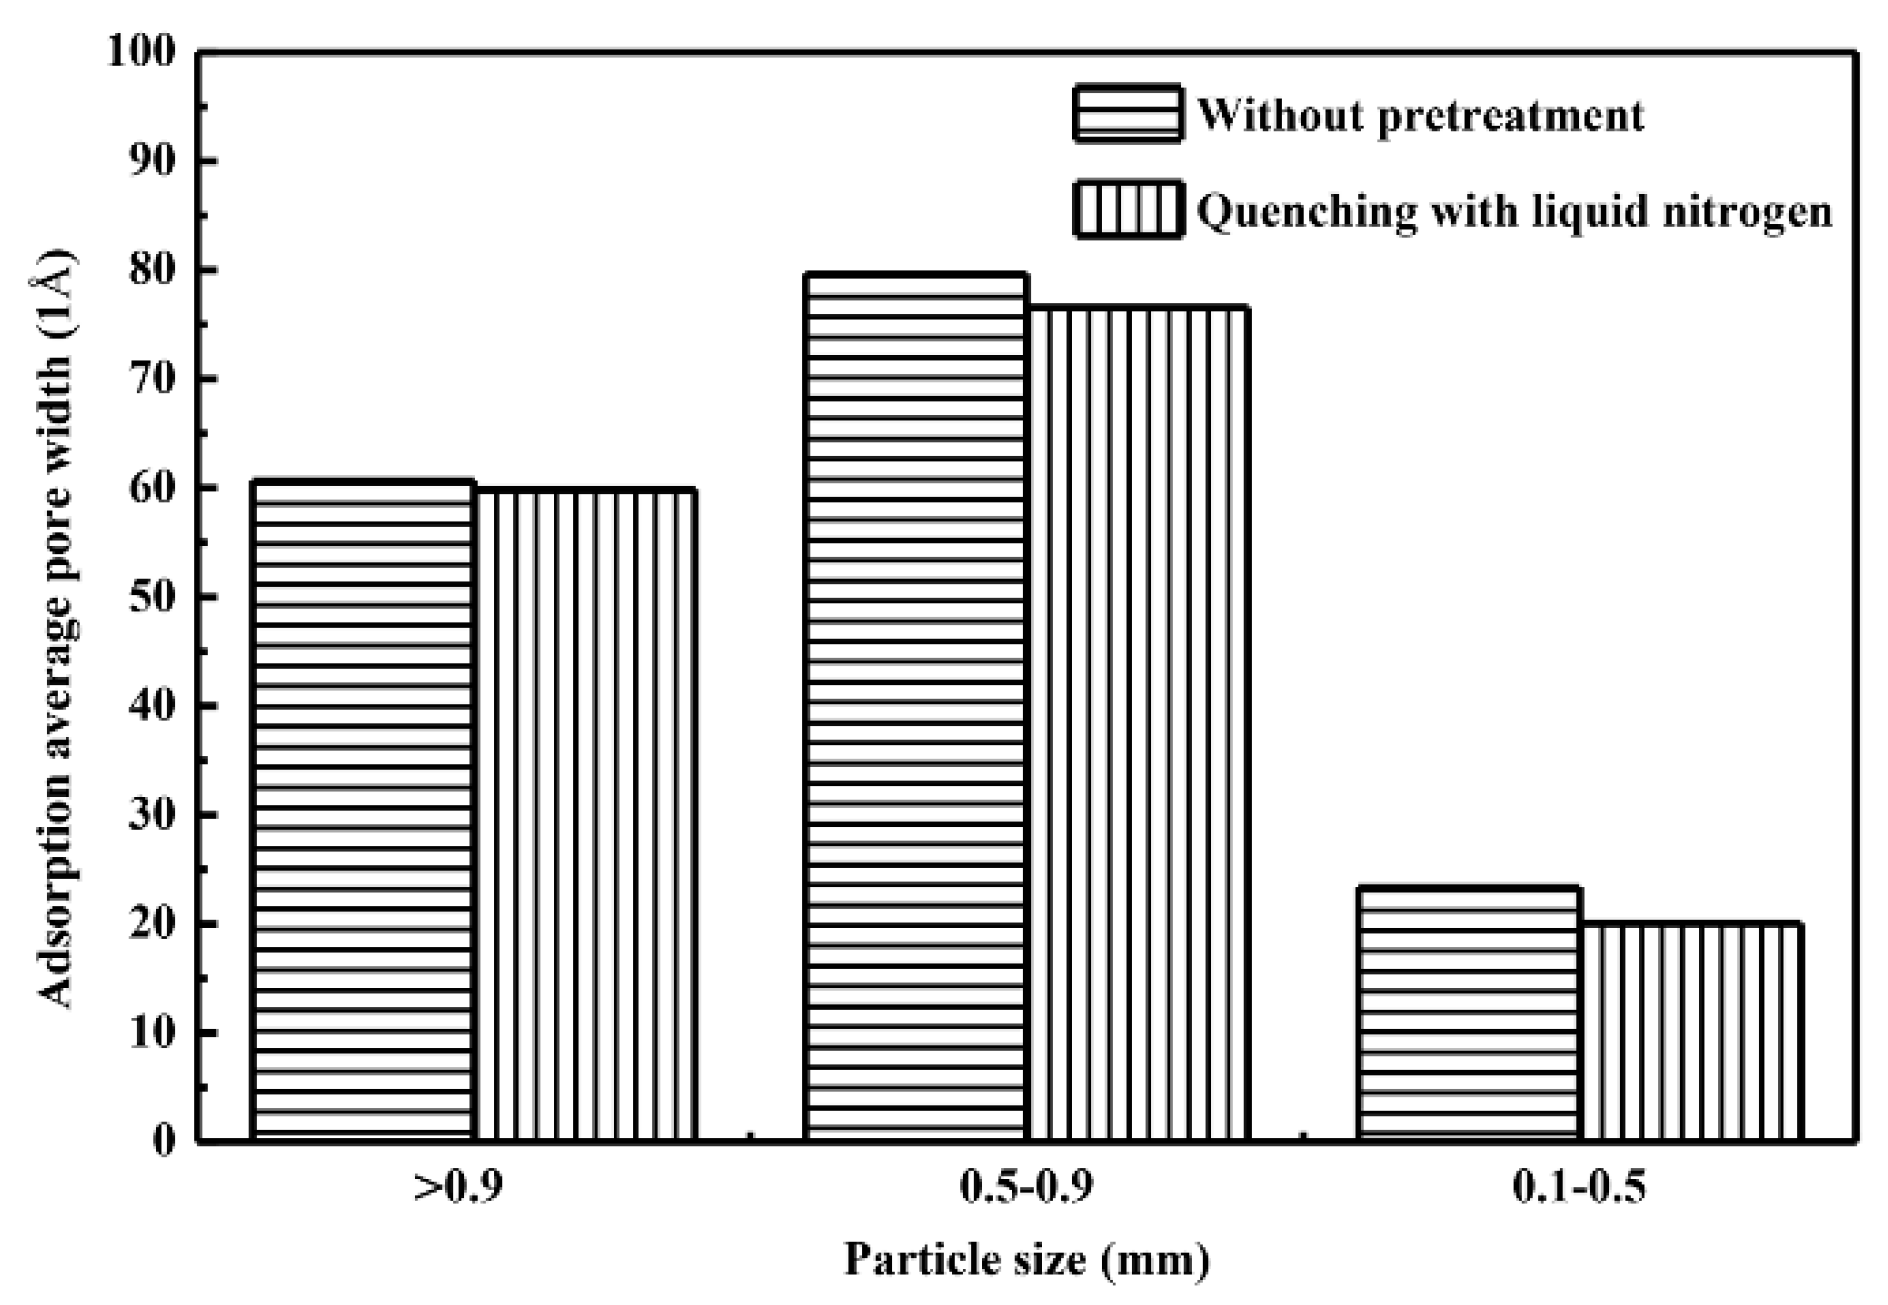
3.4. BET Surface Area and Pore Size

We attempted to identify the qualitative structural differences between the quenching fractions and samples without pretreatment by using a micromeritics experiment. The Brunauer–Emmett–Teller (BET) surface area results are shown in Figure 10, and the average pore width results are shown in Figure 11.
Figure 10A–C display the isotherms of non-pretreated samples with a particle sizes of >0.9, 0.5–0.9, and 0.1–0.5 mm. The specific surface area increased with a decreasing particle size. Figure 10A shows the adsorption–desorption curve of coal with a particle size greater than 0.9 mm without quenching by liquid nitrogen. On the one hand, the larger the particle size, the smaller the surface free energy, and the weaker the ability to capture adsorbate molecule (N2). On the other hand, the larger the particle size, the more difficult it is for the adsorbate molecule (N2) to enter into the micropores inside the particles, so as to stabilize the adsorption. Therefore, under low relative pressure, adsorbate molecule (N2) cannot form stable adsorption on coal surface. With the change of pressure environment, the adsorbed molecule will desorb. Therefore, in the relatively low-pressure range, the adsorption capacity decreases with the increase in pressure. In addition, Figure 10D–F display isotherms of liquid nitrogen quenched samples with particle sizes of >0.9, 0.5–0.9, and 0.1–0.5 mm, respectively. A similar trend in the specific surface area change was obtained. Compared to the samples without pretreatment, the samples treated with liquid nitrogen quenching had a larger specific surface area. Notably, the specific surface area of samples with particle sizes coarser than 0.5 mm increased less after quenching by liquid nitrogen, and that of samples with particle sizes between 0.1 and 0.5 mm increased more. This change law is similar to that of the liberation degree of different particle sizes. This result suggests that the samples with a coarse particle size (0.5–3 mm) are not evenly and fully quenched. Therefore, we speculate that the quenching effect on the sample with an appropriate particle size (0.1–0.5 mm) is more efficient than that of the other samples.
Figure 11 shows the adsorption average pore widths of the samples with different particle sizes before and after quenching. Compared to the samples without pretreatment, the samples treated with liquid nitrogen quenching have a slightly smaller pore size, which should be caused by the cold-induced shrinkage of the object. On the other hand, when there was no other change, the smaller the pore size, the smaller the specific surface area. However, the above results show that the specific surface areas of the sample were increased by liquid nitrogen quenching. In particular, this contradiction is remarkably noticeable in the samples with a particle size less than 0.5 mm. Therefore, it is natural to conclude that the increase in the specific surface area of the sample quenched by liquid nitrogen is not caused by the increase in the pore diameter but instead arises from other reasons. As shown by the results from Section 3.2 in this study, the average value of the selective breakage at maceral boundaries of the products quenched by liquid nitrogen was 12.5%. For different coal particle sizes, the improvement of the liberation degree increases first and then decreases as the particle size decreases. The liberation degree improvement of coal with a particle size of >0.9, 0.5–0.9, 0.1–0.5 and <0.1 mm increased by 8.6%, 10.44%, 17.02% and 14.1%, respectively. Combined with micro morphology analysis (Figure 8 and Figure 9), the cracks caused by quenching are mainly distributed in the interface of different macerals. By comprehensive analysis, it was determined that the large number of cracks and fissures generated between different macerals after cold quenching should be the main reason for this observation.

3.5. Model of Maceral Liberation and Optimization

Based on the above analysis results, a model of maceral liberation and optimization was proposed, as shown in Figure 12.
Figure 12A shows a macerals liberation model under the action of common mechanical crushing and grinding methods. This model shows that the cracks in coal contribute to the liberation of macerals. The components with high brittleness first produce cracks that then extend to the intersection with other cracks and become fine particles upon crushing, realizing the liberation of the microstructure. The disadvantage of this liberation model is that the particle size is sacrificed to exchange an increase in liberation degree by increasing the energy consumption [65].
Figure 12B shows a macerals liberation model under quenching pretreatment. This model indicates that different internal stresses are produced between the macerals by quenching pretreatment before crushing and grinding, which is helpful for liberating macerals that are not easily liberated via normal crushing. However, according to the experimental results mentioned above, this liberation model does not work well for coarse particle sizes (>1 mm).
For model A and model B, we utilized their advantages and eliminated their disadvantages. Consequently, we naturally obtained an optimized model. Figure 12C reveals the optimized liberation model of macerals from coal based on common mechanical crushing and grinding methods. First, the macerals with appropriate particle sizes (0.1–0.5 mm) were obtained by sieving, then macerals with coarse particles (>1 mm) were returned and broken again. Then, macerals that were not easily liberated were liberated by pretreatment with quenching, and the brittleness of the macerals was significantly increased during this process, which benefits the subsequent crushing process by reducing energy consumption. Furthermore, mechanical crushing was used to further liberate the macerals that were not easily liberated and to improve the liberation degree of a single component. Finally, single macerals with a high purity were obtained by gravity separation or flotation.

4. Conclusions

By analyzing the general petrographic and the distribution characteristics of macerals in different particle sizes, as well as characterizing the micromorphologies, specific surface areas, pore volumes and pore sizes of the products quenched with or without liquid nitrogen pretreatment for different particle sizes, their liberation characteristics were studied here. We summarize this work with the following conclusions:
(1)
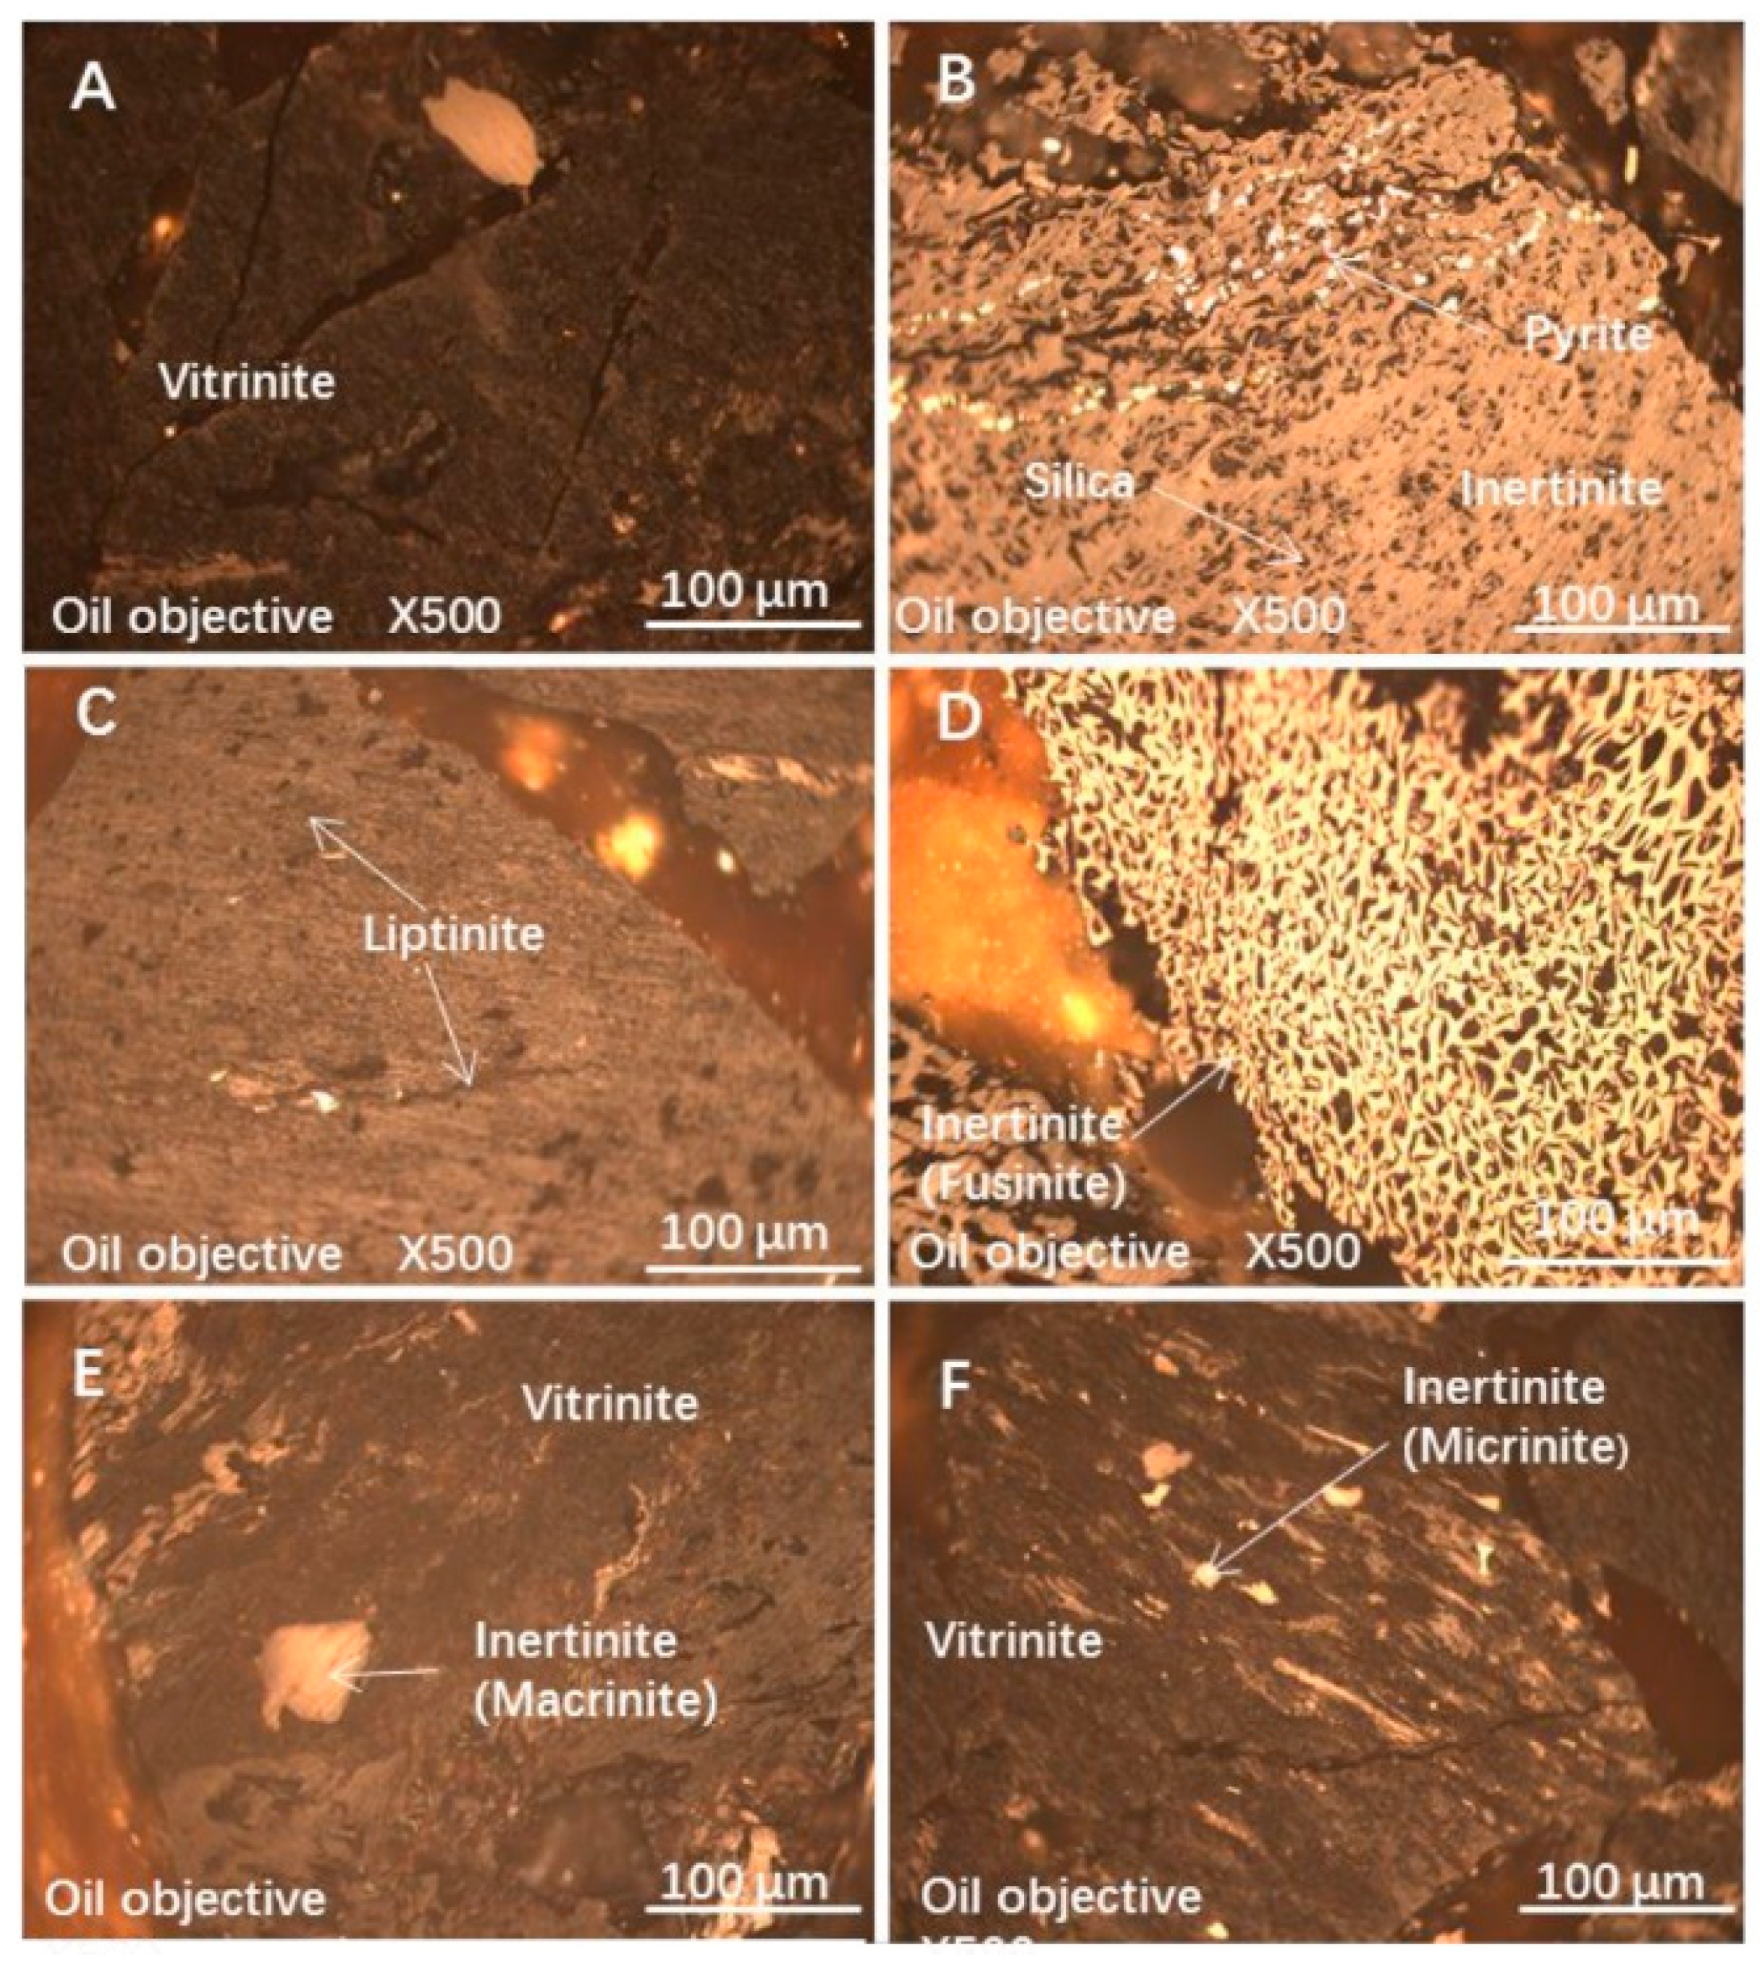
Huangling coal is a low-rank bituminous coal with low sulfur, low ash and medium calorific value, and it is rich in inertinite, which may be the reason for its relatively higher calorific value;
(2)
Screening can preconcentrate macerals because the distribution of macerals is related to the particle size, such as inertinite with a high content in coarse particles and vitrinite with a high content in fine particles;
(3)
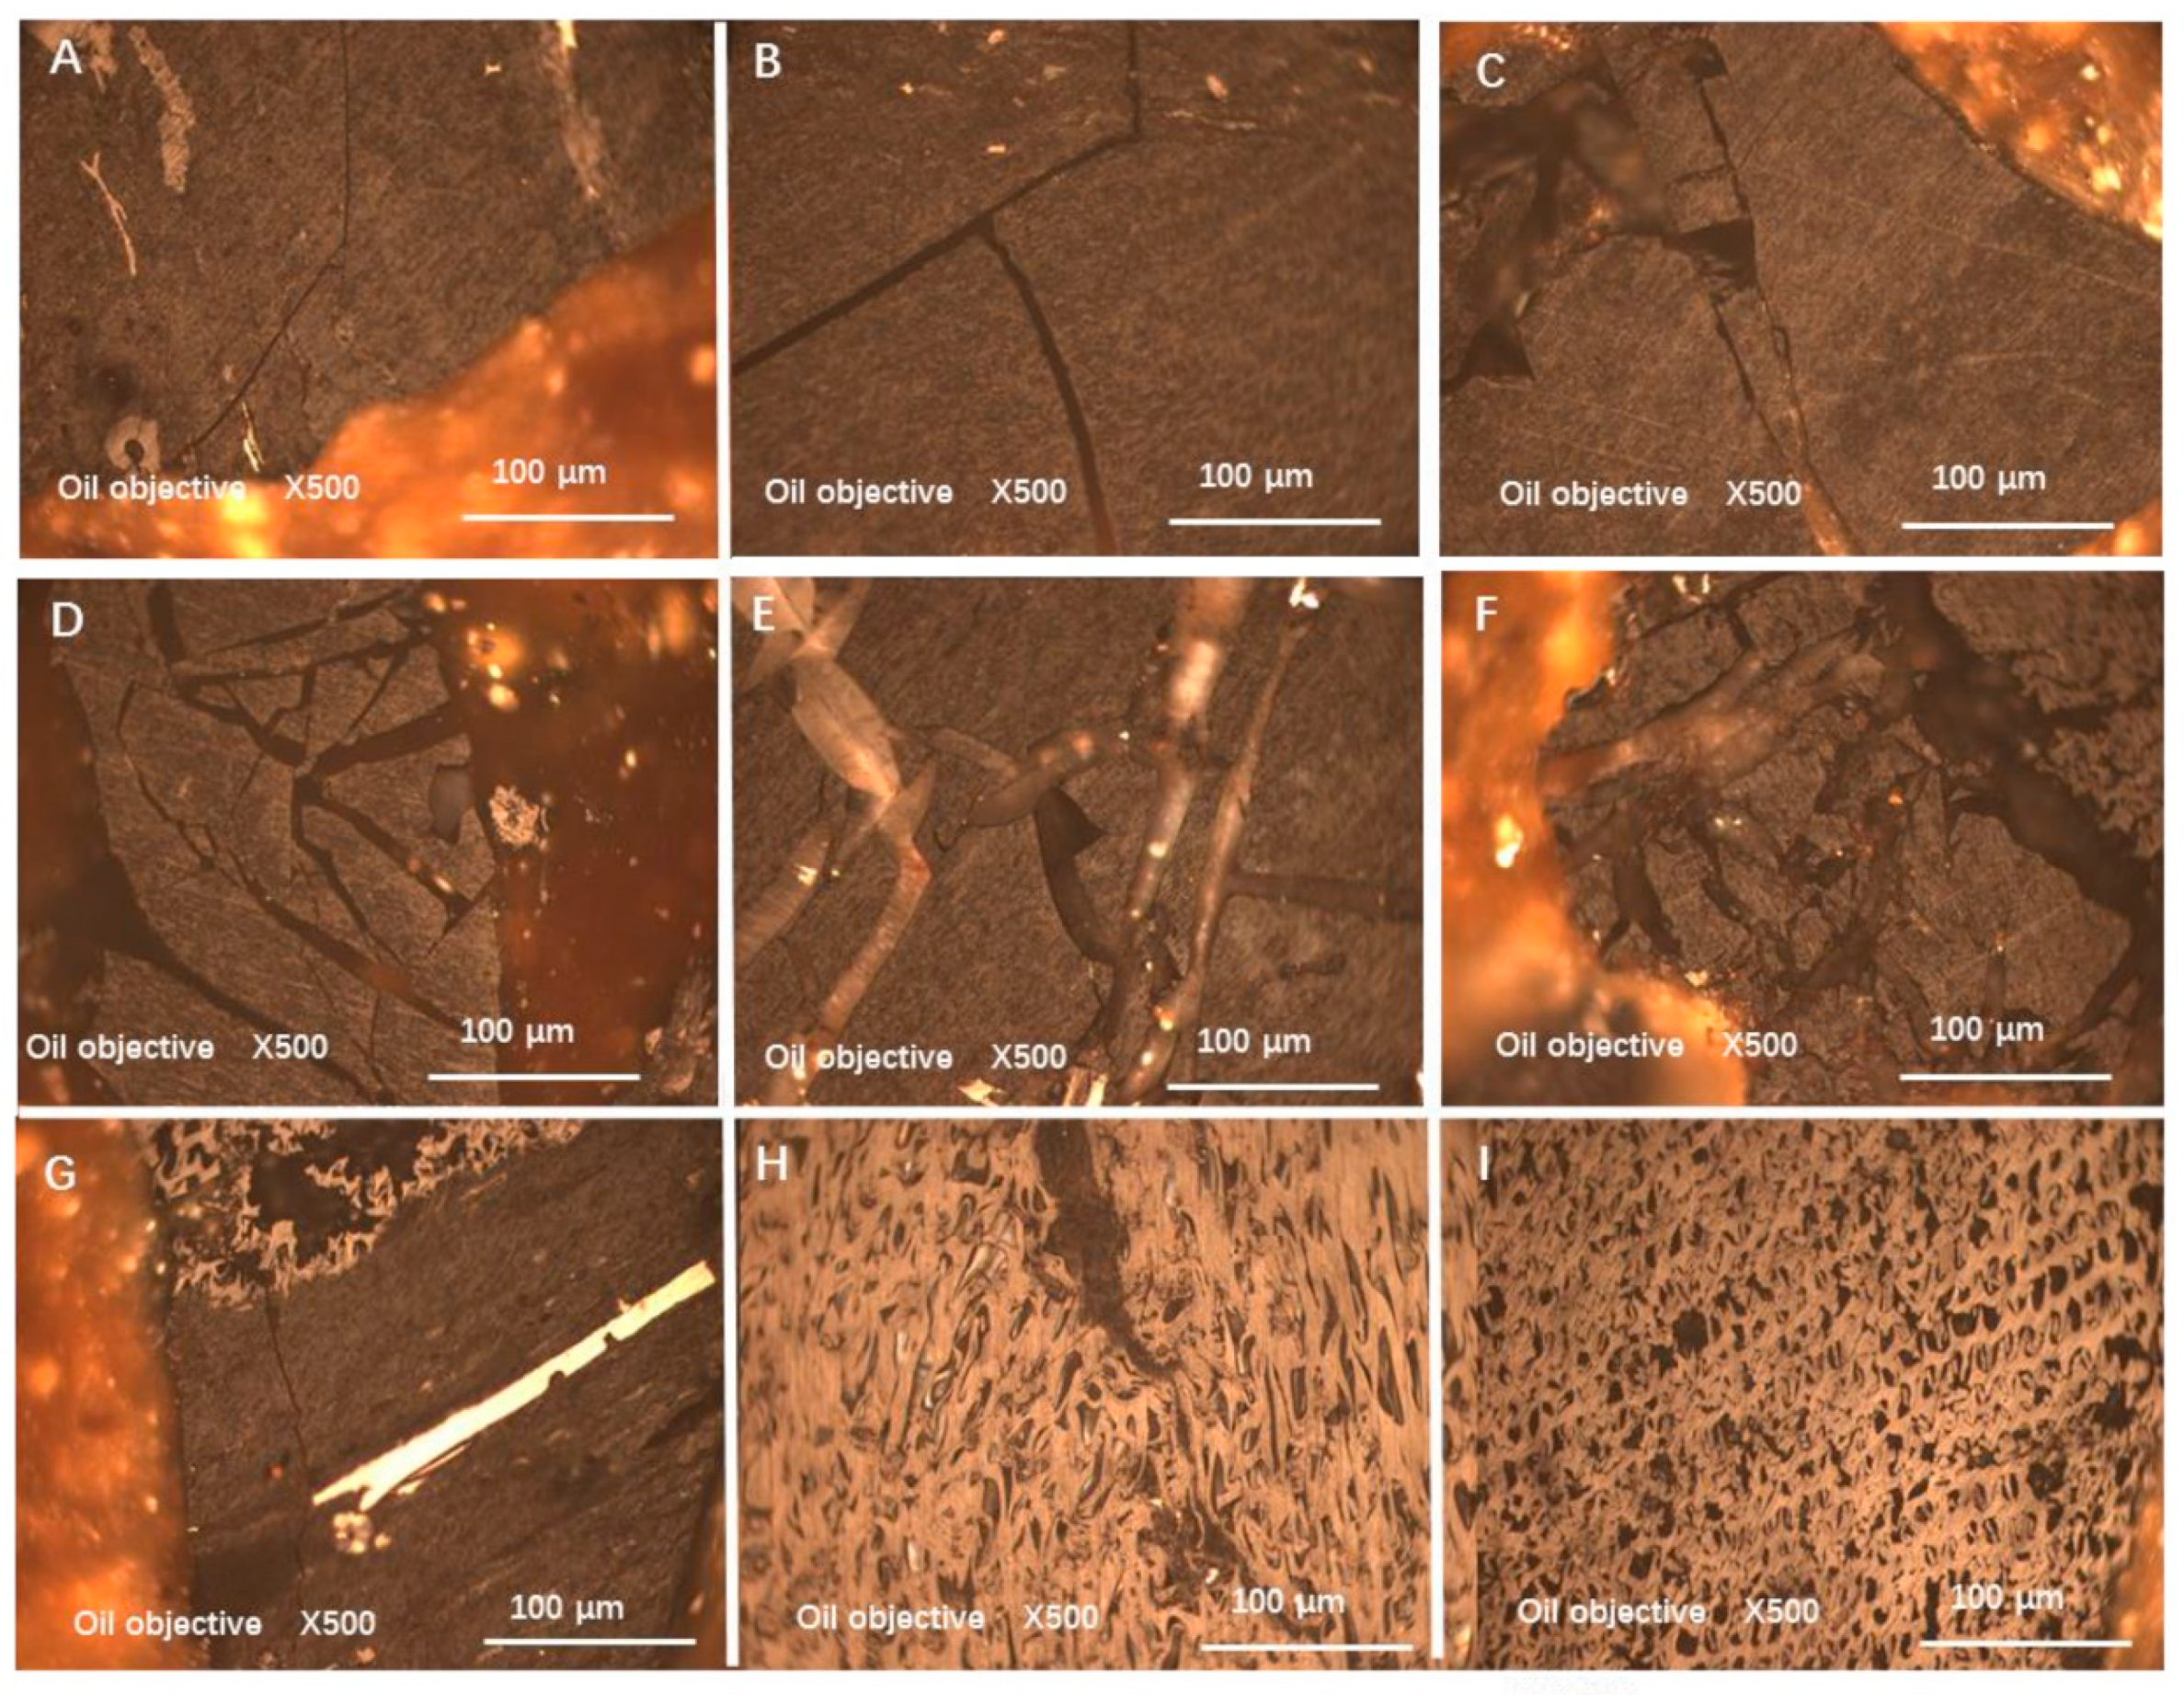
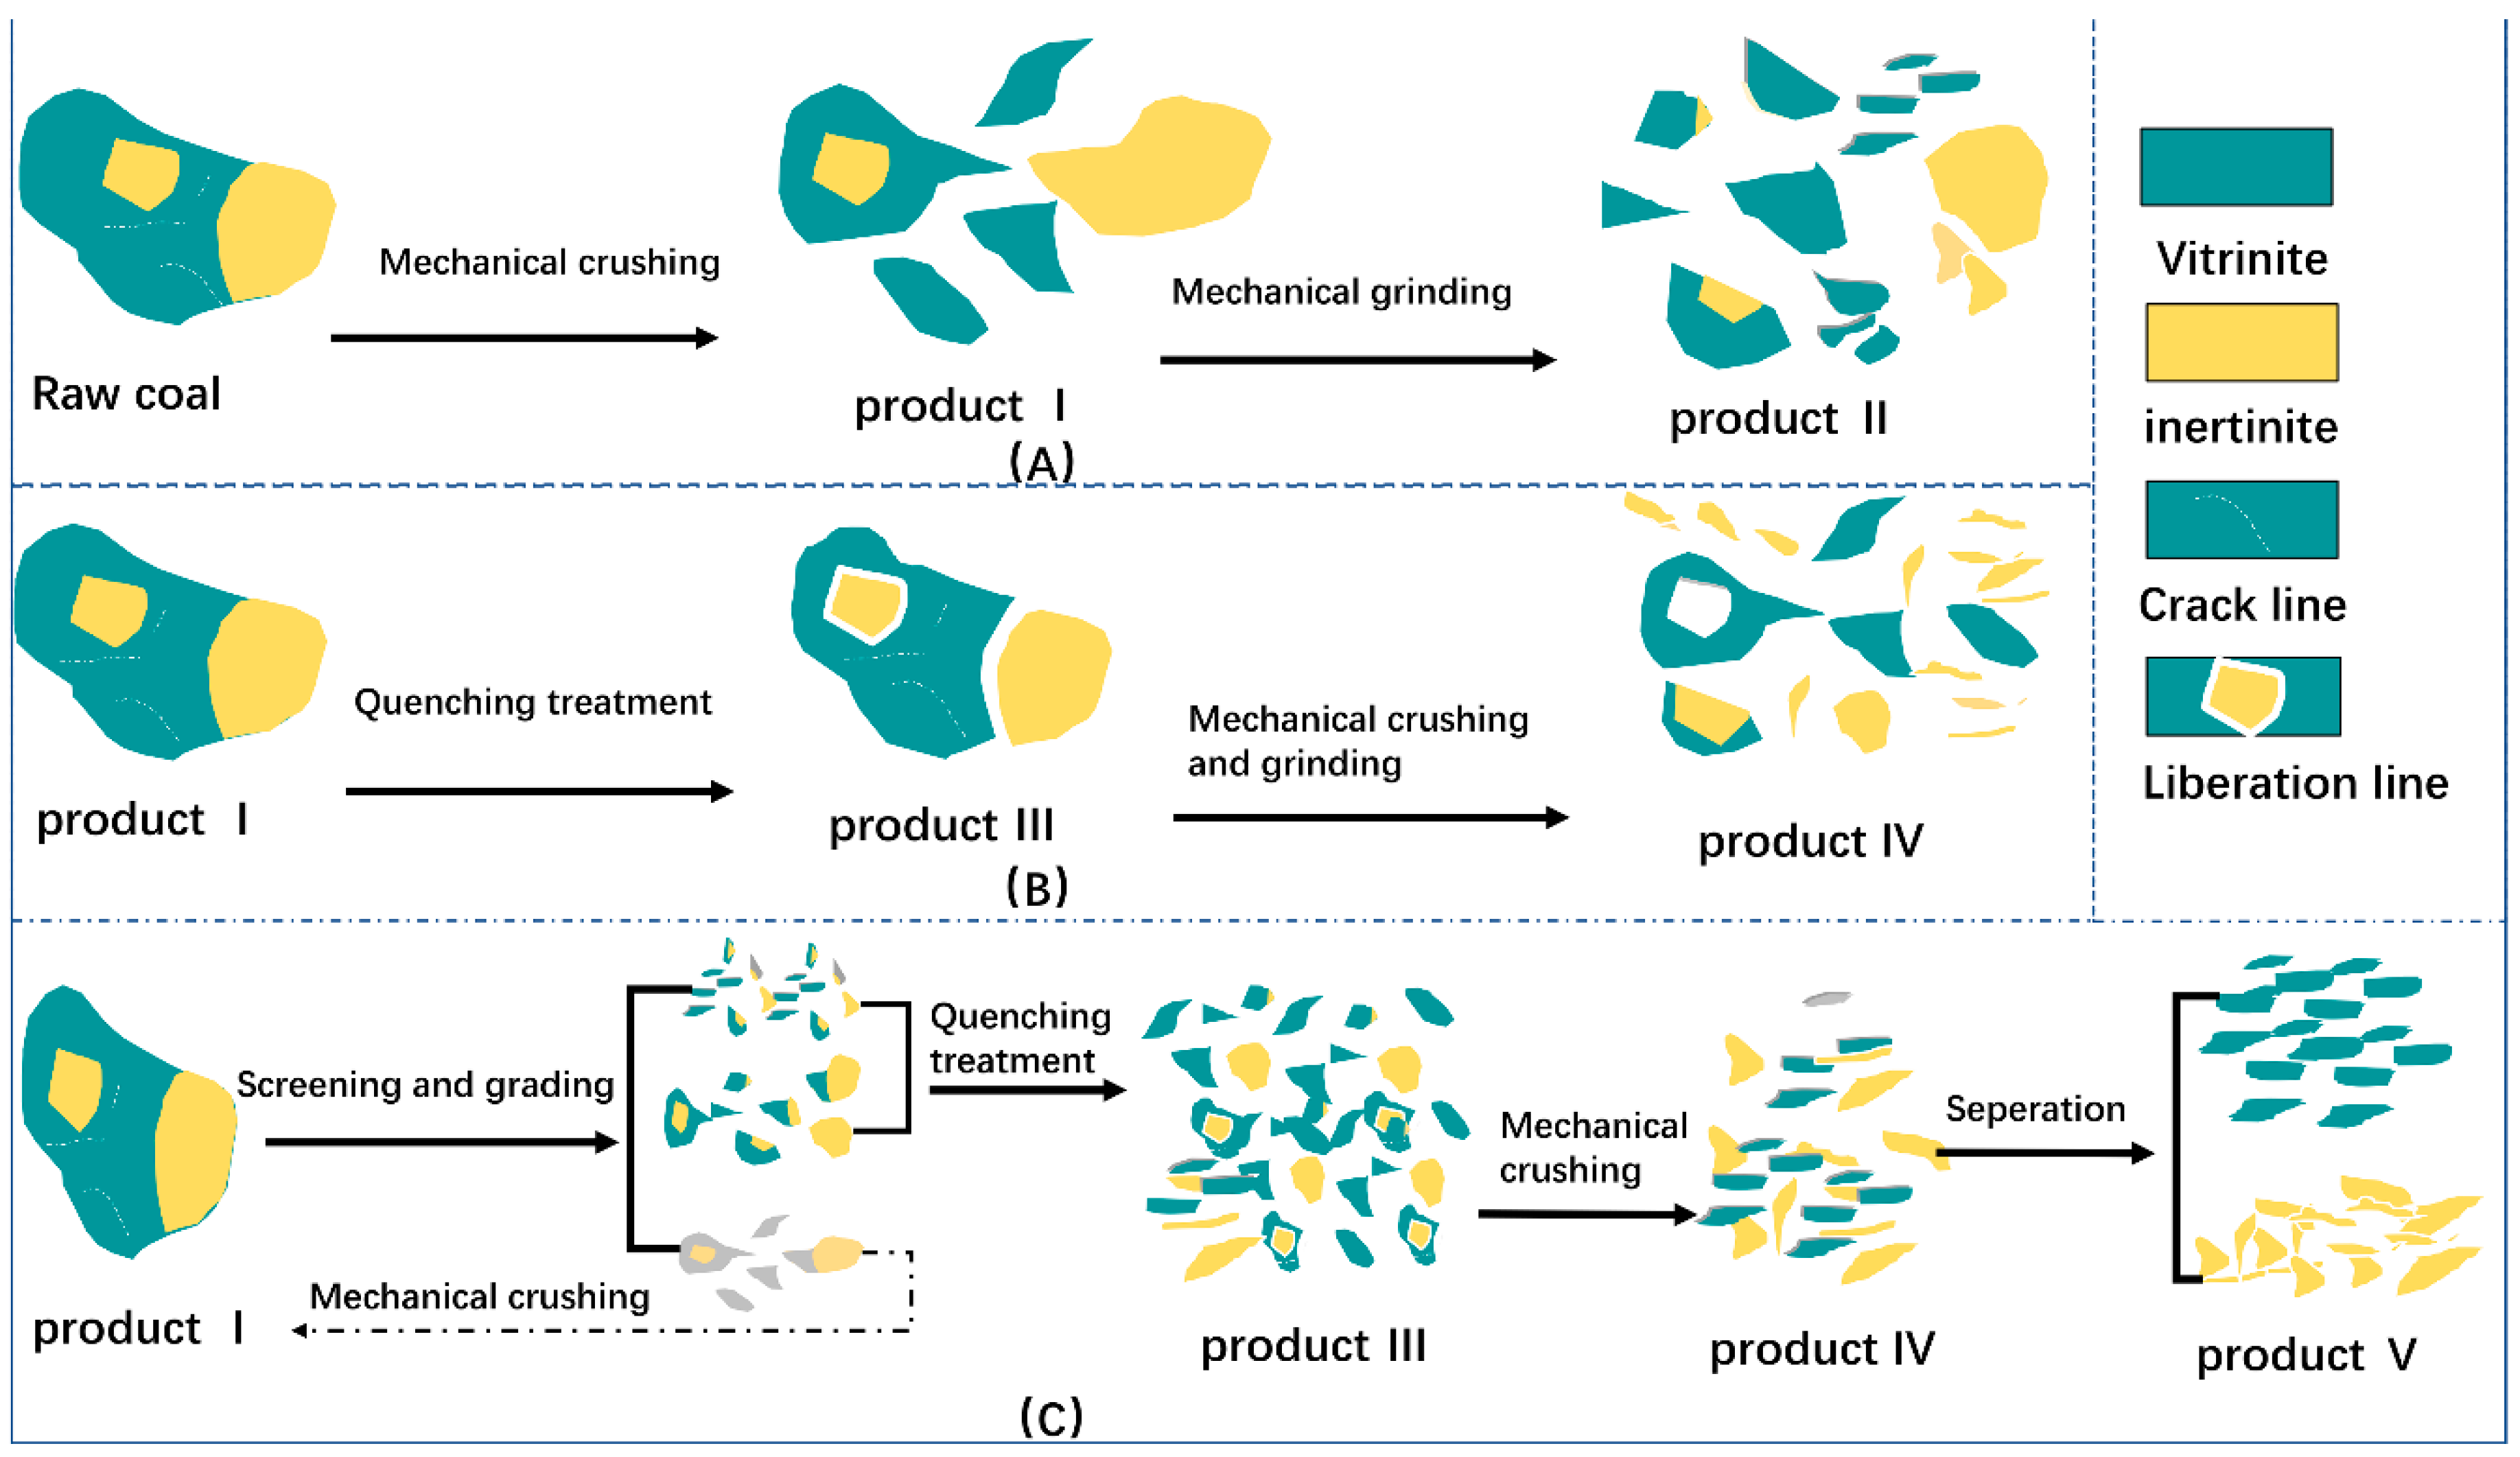
Liquid nitrogen quenching pretreatment can promote the liberation of different macerals before crushing and grinding. Compared with mechanical crushing alone, the liquid nitrogen quenching pretreatment yields different macerals that exhibit different microscopic characteristics and this affects the liberation or pre-liberation of different macerals from coal. Moreover, the liberation pattern is mainly arc-shaped, which is different from line-shaped liberation induced by mechanical fracturing methods alone;
(4)
Along with the above results, we believed that liquid nitrogen quenching pretreatment has the best liberation effect for samples with a particle size of 0.1–0.5 mm and that this presents an optimized model for the liberation of macerals based on the combination of screening, liquid nitrogen quenching pretreatment and re-crushing.
This work presents a basic study on understanding the results and phenomena of organic macerals in coal under liquid nitrogen quenching pretreatment, and the mechanisms of this process need to be studied in further detail. In addition, this paper only presents a simple study of the samples with different particle sizes, but the effect of different ranks of coal is still unknown.

Author Contributions

Conceptualization, M.D. and J.F.; Methodology, J.F.; Validation, M.D., J.F. and L.L.; Formal Analysis, M.D.; Investigation, J.F.; Resources, L.L.; Data Curation, J.F.; Writing—Original Draft Preparation, J.F.; Writing—Review & Editing, M.D.; Visualization, J.F.; Supervision, L.L.; Project Administration, M.D.; Funding Acquisition, M.D. All authors have read and agreed to the published version of the manuscript.

Funding

This work was supported by the National Natural Science Foundation of China (Grant numbers 41172142 and 41672154) and is gratefully acknowledged.

Acknowledgments

We would like to thank the analytical instrumentation center of Xi’an University of Science and Technology for their detection and analysis.

Conflicts of Interest

We declare that we have no financial and personal relationships with other people or organizations that can inappropriately influence our work, there is no professional or other personal interest of any nature or kind in any product, service and/or company that could be construed as influencing the position presented in, or the review of, the manuscript entitled study on the liberation of organic macerals in coal by liquid nitrogen quenching pretreatment.

References

  1. Chai, J.; Du, M.; Liang, T.; Sun, X.C.; Yu, J.; Zhang, Z.G. Coal consumption in China: How to bend down the curve? Energy Econ. 2019, 80, 38–47. [Google Scholar] [CrossRef]
  2. Stach, E.; Mackowsky, M.T.; Teichmuller, M.; Taylor, G.H.; Teichmüller, R. Stach’s Textbook of Coal Petrology, 3rd ed.; Gebruder Borntraeger: Berlin, Germany, 1982; pp. 87–100. [Google Scholar]
  3. Guo, Y.; Bustin, R.M. Micro-FTIR spectroscopy of liptinite macerals in coal. Int. J. Coal Geol. 1998, 36, 259–275. [Google Scholar] [CrossRef]
  4. George, A.M.; Mackay, G.H. The Science of Victorian Brown Coal, 1st ed.; Butterworth-Heinemann: Oxford, UK, 1991; pp. 45–102. [Google Scholar]
  5. Hower, J.C.; O’Keefe, J.M.K.; Eble, C.F.; Raymond, A.; Valentim, B.; Volk, T.J.; Richardson, A.R.; Satterwhite, A.B.; Hatch, R.; Stucker, J.D.; et al. Notes on the origin of inertinite macerals in coal: Evidence for fungal and arthropod transformations of degraded macerals. Int. J. Coal Geol. 2011, 86, 231–240. [Google Scholar] [CrossRef]
  6. Gupta, R. Advanced coal characterization: A review. Energy Fuels 2007, 21, 451–460. [Google Scholar] [CrossRef]
  7. Roberts, M.J.; Everson, R.C.; Neomagus, H.W.J.P.; Niekerk, D.V.; Mathews, J.P.; Branken, D.J. Influence of maceral composition on the structure, properties and behaviour of chars derived from South African coals. Fuel 2015, 142, 9–20. [Google Scholar] [CrossRef]
  8. Huang, Y.H.; Yamashita, H.; Tomita, A. Gasification reactivities of coal macerals. Fuel Process. Technol. 1991, 29, 75–84. [Google Scholar] [CrossRef]
  9. Keogh, R.A.; Taulbee, D.N.; Hower, J.C.; Chawla, B.; Davis, B.H. Liquefaction characteristics of the three major maceral groups separated from a single coal. Energy Fuels 1992, 6, 614–618. [Google Scholar] [CrossRef]
  10. Machnikowska, H.; Krztoń, A.; Machnikowski, J. The characterization of coal macerals by diffuse reflectance infrared spectroscopy. Fuel 2002, 81, 245–252. [Google Scholar] [CrossRef]
  11. Dyrkacz, G.R.; Bloomquist, C.A.A.; Ruscic, L. Chemical variations in coal macerals separated by density gradient centrifugation. Fuel 1984, 63, 1166–1173. [Google Scholar] [CrossRef]
  12. Marotovaler, M.M.; Taulbee, D.N.; Andrésen, J.M.; Hower, J.C.; Snape, C.E. Quantitative 13C NMR study of structural variations within the vitrinite and inertinite maceral groups for a semifusinite-rich bituminous coal. Fuel 1998, 77, 805–813. [Google Scholar] [CrossRef]
  13. Das, T.K. Thermogravimetric characterisation of maceral concentrates of Russian coking coals. Fuel 2001, 80, 97–106. [Google Scholar] [CrossRef]
  14. Roy, M.M. Studies on coal macerals, [Part] 4, Chlorination of exinite and fusinite. Econ. Geol. 1965, 60, 1404–1410. [Google Scholar] [CrossRef]
  15. Taulbee, D.; Poe, S.H.; Robl, T.; Keogh, B. Density gradient centrifugation separation and characterization of maceral groups from a mixed maceral bituminous coal. Energy Fuels 1989, 3, 662–670. [Google Scholar] [CrossRef]
  16. Ding, L.P. Investigation of bituminous coal hydrophobicity and its influence on flotation. Energy Fuels 2009, 23, 5536–5543. [Google Scholar] [CrossRef]
  17. Louw, E.B.; Mitchell, G.D.; Wang, J.; Winans, R.E.; Mathews, J.P. Constitution of drop-tube-generated coal chars from vitrinite-and inertinite-rich South African coals. Energy Fuels 2015, 30, 112–120. [Google Scholar] [CrossRef]
  18. Guo, H.; Lj, S.; Gx, X.B.H. Effects of coal macerals on the pore structure and electrochemical performances of activated carbon. J. China Coal Soc. 2014, 39, 2328–2334. [Google Scholar]
  19. Duxbury, J. Prediction of coal pyrolysis yields by maceral separation. J. Anal. Appl. Pyrolysis 1997, 40, 233–242. [Google Scholar] [CrossRef]
  20. Dyrkacz, G.R.; Horwitz, E.P. Separation of coal macerals. Fuel 1982, 61, 3–12. [Google Scholar] [CrossRef]
  21. Stankiewicz, B.A.; Kruge, M.A.; Crelling, J.C.; Salmon, G.L. Density gradient centrifugation: Application to the separation of macerals of type I, II, and III sedimentary organic matter. Energy Fuels 1994, 8, 1513–1521. [Google Scholar] [CrossRef]
  22. Pugmire, R.J.; Zilm, K.W.; Woolfenden, W.R.; Grant, D.M.; Dyrkacz, G.R.; Bloomquist, C.A.A.; Horwitz, E.P. Carbon-13 NMR spectra of macerals separated from individual coals. Org. Geochem. 1982, 4, 79–84. [Google Scholar] [CrossRef]
  23. Dyrkacz, G.R.; Bloomquist, C.A.A.; Ruscic, L.; Crelling, J.C. An investigation of the vitrinite maceral group in microlithotypes using density gradient separation methods. Energy Fuels 1991, 5, 155–163. [Google Scholar] [CrossRef]
  24. Pandolfo, A.G.; Johns, R.B.; Dyrkacz, G.R.; Buchanan, A.S. Separation and preliminary characterization of high-purity maceral group fractions from an Australian bituminous coal. Energy Fuels 1988, 2, 657–662. [Google Scholar] [CrossRef]
  25. Yan, Y.; Qi, Y.; Marshall, M.; Jackson, W.R.; Chaffee, A.L. Separation and analysis of maceral concentrates from Victorian brown coal. Fuel 2019, 242, 232–242. [Google Scholar] [CrossRef]
  26. Dyrkacz, G.R.; Bloomquist, C.A.A.; Ruscic, L. Investigations into the process of maceral separation by centrifugal techniques. 3. Continuous flow and sink/float maceral separation of-100-mesh coal. Energy Fuels 1993, 7, 655–660. [Google Scholar] [CrossRef]
  27. Dyrkacz, G.R.; Ruscic, L.; Fredericks, J. An investigation into the process of centrifugal sink/float separations of micronized coals. 1. Some inferences for coal maceral separations. Energy Fuels 1992, 6, 720–742. [Google Scholar] [CrossRef]
  28. Jorjani, E.; Esmaeili, S.; Khorami, M.T. The effect of particle size on coal maceral group’s separation using flotation. Fuel 2013, 114, 10–15. [Google Scholar] [CrossRef]
  29. Honaker, R.Q.; Mohanty, M.K.; Crelling, J.C. Coal maceral separation using column flotation. Miner. Eng. 1996, 9, 449–464. [Google Scholar] [CrossRef]
  30. Kopparthi, P.; Singh, R.; Nag, D.; Mukherjee, A.K. Vitrinite maceral separation using column flotation. Int. J. Coal Prep. Util. 2018, 38, 13–29. [Google Scholar] [CrossRef]
  31. Cronauer, D.C.; Joseph, J.T.; Davis, A.; Quick, J.C.; Luckie, P.T. The beneficiation of Martin Lake Texas lignite. Fuel 1992, 71, 65–73. [Google Scholar] [CrossRef]
  32. Cho, H.; Luckie, P.T. Evaluation of liberation characteristics of coal organic components. Min. Metall. Explor. 1998, 15, 29–35. [Google Scholar] [CrossRef]
  33. Gómez Rojas, O.P.; Carmona Lopez, I.; Bustamante Rúa, M.O. Analysis of liberation of the groups of Macerales of the coal: Colombian coals. Boletín Cienc. Tierra 2007, 21, 14. [Google Scholar]
  34. Zhang, L.; Hower, J.C.; Honaker, R.Q.; Liu, W.; Men, D. Flotation rates and zeta potentials of maceral concentrates of bituminous coals. Min. Metall. Explor. 2015, 32, 129–137. [Google Scholar] [CrossRef]
  35. Li, Z.; Fu, Y.; Zhou, A.; Zhu, C.; Yang, C.; Shen, N.; Yang, C. Effect of multi-intensification on the liberation of maceral components in coal. Fuel 2019, 237, 1003–1012. [Google Scholar] [CrossRef]
  36. Fu, Y.; Li, Z.; Zhou, A.; Xiong, S.; Yang, C. Evaluation of coal component liberation upon impact breakage by MLA. Fuel 2019, 258, 116136. [Google Scholar] [CrossRef]
  37. Evans, C.L.; Wightman, E.M.; Yuan, X. Quantifying mineral grain size distributions for process modelling using x-ray micro-tomography. Miner. Eng. 2015, 82, 78–83. [Google Scholar] [CrossRef]
  38. Ueda, T.; Oki, T.; Koyanaka, S. Statistical effect of sampling particle number on mineral liberation assessment. Miner. Eng. 2016, 98, 204–212. [Google Scholar] [CrossRef]
  39. Guntoro, P.I.; Tiu, G.; Ghorbani, Y.; Lund, C.; Rosenkranz, J. Application of machine learning techniques in mineral phase segmentation for x-ray microcomputed tomography (µct) data. Miner. Eng. 2019, 142, 105882. [Google Scholar] [CrossRef]
  40. Fan, J.; Du, M.; Liu, L. Study on the correlation between trace elements in coal and coal-forming plants: A case study. Energy Sources Part A Recovery Util. Environ. Eff. 2020, 3, 1–12. [Google Scholar] [CrossRef]
  41. Pierre, M.G. The sampling of particulate materials—A general theory. Int. J. Miner. Process. 1976, 3, 289–312. [Google Scholar]
  42. China National Coal Association. Method for Manual Sampling of Commercial Coal, 1st ed.; China National Standard Press: Beijing, China, 2008; pp. 1–30. [Google Scholar]
  43. China National Coal Association. Method for Preparation of Coal Sample, 1st ed.; China National Standard Press: Beijing, China, 2008; pp. 1–29. [Google Scholar]
  44. China National Coal Association. Proximate Analysis of Coal, 1st ed.; China National Standard Press: Beijing, China, 2008; pp. 1–14. [Google Scholar]
  45. China National Coal Association. Ultimate Analysis of Coal, 1st ed.; China National Standard Press: Beijing, China, 2015; pp. 1–12. [Google Scholar]
  46. China National Coal Association. Determination of Calorific Value of Coal, 1st ed.; China National Standard Press: Beijing, China, 2009; pp. 1–28. [Google Scholar]
  47. China National Coal Association. Determination of Maceral Group Composition and Minerals in Coal, 1st ed.; China National Standard Press: Beijing, China, 2014; pp. 1–12. [Google Scholar]
  48. Zhou, L. Process Mineralogy, 3rd ed.; Metallurgical Industry Press: Beijing, China, 2002; pp. 243–263. [Google Scholar]
  49. China National Coal Association. Classification for Quality of Coal—Part 1: Ash, 1st ed.; China National Standard Press: Beijing, China, 2018; pp. 1–8. [Google Scholar]
  50. China National Coal Association. Classification of Quality of Coal—Part 2: Sulfur Content, 1st ed.; China National Standard Press: Beijing, China, 2018; pp. 1–8. [Google Scholar]
  51. China National Coal Association. Classification of Quality of Coal—Part 3: Calorific Value, 1st ed.; China National Standard Press: Beijing, China, 2010; pp. 1–8. [Google Scholar]
  52. Fu, Y.; Guo, Y.H.; Zhang, K.X. Effect of three different catalysts (Kcl, Cao, and Fe2O3) on the reactivity and mechanism of low-rank coal pyrolysis. Energy Fuels 2016, 30, 2428–2433. [Google Scholar] [CrossRef]
  53. Solomon, P.R.; Fletcher, T.H.; Pugmire, R.J. Progress in coal pyrolysis. Fuel 1993, 72, 587–597. [Google Scholar] [CrossRef]
  54. Sun, Q.; Li, W.; Chen, H.; Li, B. The variation of structural characteristics of macerals during pyrolysis☆. Fuel 2013, 82, 669–676. [Google Scholar] [CrossRef]
  55. Oki, T.; Tanaka, J.; Harada, T. Cause of Coal Grindability. Correlation of coal rank, maceral composition, hardness, and brittleness. Min. Mater. Process. Inst. Jpn. 1996, 112, 37–42. [Google Scholar]
  56. Falcon, L.M.; Falcon, R.M.S. The petrographic composition of Southern African coals in relation to friability, hardness, and abrasive indices. J. South. Afr. Inst. Min. Metall. 1987, 87, 323–336. [Google Scholar]
  57. Cardott, B.J.; Curtis, M.E. Identification and nanoporosity of macerals in coal by scanning electron microscopy. Int. J. Coal Geol. 2018, 190, 205–217. [Google Scholar] [CrossRef]
  58. Fandrich, R.; Gu, Y.; Burrows, D.; Moeller, K. Modern SEM-based mineral liberation analysis. Int. J. Miner. Process. 2007, 84, 310–320. [Google Scholar] [CrossRef]
  59. Tomas, J.; Schreier, M.; Gröger, T.; Ehlera, S. Impact crushing of concrete for liberation and recycling. Powder Technol. 1999, 105, 39–51. [Google Scholar] [CrossRef]
  60. Badzioch, S.; Gregory, D.; Field, M. Investigation of the temperature variation of the thermal conductivity and thermal diffusivity of coal. Fuel 1964, 43, 267. [Google Scholar]
  61. Chu, Z.; Zhou, G.; Bi, S. Meso-characterization of the effective thermal conductivity of selected typical geomaterials in an underground coal mine. Energy Explor. Exploit. 2018, 36, 488–508. [Google Scholar] [CrossRef]
  62. Wang, Q.; Wang, D.; Li, Q.; Zhang, J. Relationship between Microstructure and Thermal Conductivity in Coal Slags with Variable Silica and Alumina. Energy Fuels 2019, 33, 6226–6233. [Google Scholar] [CrossRef]
  63. Rezaei, H.R.; Gupta, R.P.; Bryant, G.W.; Hart, J.T.; Liu, G.; Bailey, C.W.; Wall, T.F.; Miyamae, S.; Makino, K.; Endo, Y. Thermal conductivity of coal ash and slags and models used. Fuel 2000, 79, 1697–1710. [Google Scholar] [CrossRef]
  64. Wu, H.; Zhang, P.; Dong, S.; Huang, Y.; Zhang, M. Brittleness index analysis of coal samples. Acta Geophysica. 2019, 67, 789–797. [Google Scholar] [CrossRef]
  65. Liu, X.; Zhang, M.; Hu, N.; Yang, H.; Lu, J. Calculation model of coal comminution energy consumption. Miner. Eng. 2016, 92, 21–27. [Google Scholar] [CrossRef]
Figure 1. Sampling points and stratigraphic histogram [40]. (A) Stratigraphic histogram; (B) Sample points.
Minerals 10 00911 g001
Figure 2. Illustration of the experiment process. BET—S. Brunauer, P. Emmett and E. Teller; SEM—Scanning electron microscope.
Minerals 10 00911 g002
Figure 3. The images of maceral characteristics of raw coal: (A) Image of fractures of vitrinite; (B) Image of minerals embedded in the inertinite; (C) Image of the liptinite embedded in the vitrinite; (D) Image of the characteristics of pore structure in inertinite; (E) Image of inertinite embedded in the vitrinite; and (F) Image of inertinite embedded in the vitrinite.
Minerals 10 00911 g003
Figure 4. Thermogravimetric characteristic curves of raw coal with different particle sizes. (A) thermogravimetric curves; and (B) derivative thermogravimetric curve.
Minerals 10 00911 g004
Figure 5. Particle sizes and the maceral content. (A) the macerals content of the mineral base, (B) the macerals content of the removed mineral base. V: vitrinite; I: inertinite; E: liptinite; M: minerals.
Minerals 10 00911 g005
Figure 6. Broken characteristic images of macerals from coal. (A) Broken characteristics of vitrinite from coal with a particle size greater than 0.9 mm; (B,C) broken characteristics of vitrinite from coal with a particle size between 0.5 and 0.9 mm; (D,E) broken characteristics of vitrinite from coal with a particle size between 0.1 and 0.5 mm; (F) broken characteristics of vitrinite from coal with a particle size less than 0.1 mm; (G) broken characteristics between vitrinite and inertinite from coal with a particle size between 0.5 and 0.9 mm; (H) broken characteristics between vitrinite and inertinite from coal with a particle size between 0.5 and 0.9 mm; and (I) broken characteristics between vitrinite and inertinite from coal with a particle size greater than 0.9 mm.
Minerals 10 00911 g006
Figure 7. Particle sizes and liberation degree. (A) Liberation degree of single maceral; and (B) liberation degree of macerals in coal.
Minerals 10 00911 g007
Figure 8. Characteristic images of the maceral liberation from coal by liquid nitrogen quenching. (AC) Liberation characteristics of products from coal with a particle size less than 0.1 mm; (DF) liberation characteristics of products from coal with a particle size between 0.1 and 0.5 mm; (GI) liberation characteristics of products from coal with a particle size between 0.5 and 0.9 mm; and (JL) liberation characteristics of products from coal with a particle size greater than 0.9 mm.
Minerals 10 00911 g008
Figure 9. Representative SEM images of samples pretreated by liquid nitrogen quenching. (AC) Liberation characteristics of products from coal with a particle size greater than 0.9 mm; (DF) liberation characteristics of products from coal with a particle size between 0.5 and 0.9 mm; (GI) liberation characteristics of products from coal with a particle size between 0.1 and 0.5 mm; (JL) liberation characteristics of products from coal with a particle size less than 0.1 mm.
Minerals 10 00911 g009
Figure 10. Specific surface area of samples. (A) Adsorption–desorption curve of the product from coal with a particle size greater than 0.9 mm without quenching by liquid nitrogen; (B) adsorption–desorption curve of the product from coal with a particle size between 0.5 and 0.9 mm without quenching by liquid nitrogen; (C) adsorption–desorption curve of the product from coal with a particle size between 0.1 and 0.5 mm without quenching by liquid nitrogen; (D) adsorption–desorption curve of the product from coal with a particle size greater than 0.9 mm with quenching by liquid nitrogen; (E) adsorption–desorption curve of the product from coal with a particle size between 0.5 and 0.9 mm with quenching by liquid nitrogen; (F) adsorption–desorption curve of the product from coal with a particle size between 0.1 and 0.5 mm with quenching by liquid nitrogen.
Minerals 10 00911 g010
Figure 11. Average pore width of the samples.
Minerals 10 00911 g011
Figure 12. Model of the liberation and optimization of macerals from coal. Product I: products from the primary crushing of raw coal; Product II product obtained by crushing product I (the product without quenching with liquid nitrogen); Product III: product obtained by quenching product I with liquid nitrogen; Product IV: product obtained from the grinding of product III (products obtained by quenching with liquid nitrogen); and Product V: single maceral obtained by separation treatment. (A) AA maceral liberation model under the action of common mechanical crushing and grinding methods; (B) A maceral liberation model under quenching pretreatment; (C) A optimized macerals liberation model.
Minerals 10 00911 g012
Table 1. Characteristic parameters of coal quality.
Proximate Analysis (%)Ultimate Analysis (%)Calorific Value
MadAadVdafFCadCdafHdafNdafOdafSt,dQgr.d/mJ·kg−1
3.6114.6027.9759.9058.803.710.7336.040.7223.89
Mad moisture on an air-drying basis; Aad ash on an air-drying basis; Vdaf volatile matter on an dry ash-free basis; FCad fixed carbon on an air-drying basis; Cdaf carbon content on an dry ash-free basis; Hdaf hydrogen content on an dry ash-free basis; Odaf oxygen content on an dry ash-free basis; Ndaf nitrogen content on an dry ash-free basis; St,d total sulfur content on an dry basis; Qgr.d generating capacity of heat.
Table 2. Characteristic parameters of coal petrography.
Vitrinite
(%)
Inertinite
(%)
Liptinite
(%)
Sulfide Minerals
(%)
Quartz Minerals
(%)
Clay Minerals
(%)
Carbonate Minerals
(%)
Vitrinite Reflectances
(%)
44.0538.602.357.283.622.161.940.65
Publisher’s Note: MDPI stays neutral with regard to jurisdictional claims in published maps and institutional affiliations.

