Abstract
Naturally occurring biogenic pyrite has been found in Holocene fluvial aquifers in the Uphapee watershed, Macon County, Alabama. The electron microprobe (EMP) analysis showed that the pyrite grains contain 0.20–0.92 weight% of arsenic (As). The scanning electron microscope and energy dispersive spectroscopy (SEM-EDS) analysis confirmed a similar concentration of As in the pyrite that was consistent with the EMP analysis. The SEM analysis also confirmed the presence of additional trace elements such as cobalt (0.19 wt.%), and nickel (0.15 wt.%), indicative of pyrite’s capacity to sequester As and other trace elements. Pyrite grains were naturally formed and developed as large (20–200 μm) euhedral (i.e., cube, octahedron) crystals and non-framboid aggregates. However, the inductively coupled plasma mass spectrometry (ICP-MS) analysis showed that the As concentration in the groundwater was not high, and it was within the EPA drinking water standard for As (10 µg/L). These results indicate that dissolved As is sequestered in naturally formed pyrite found in the fluvial sediments. The groundwater was moderately reducing to slightly oxidizing (Eh = 46 to173 mV), and nearly neutral to slightly acidic (pH = 5.53 to 6.51). Groundwater geochemistry data indicated a redox sequence of oxidation, denitrification, Mn(IV) reduction, Fe(III) reduction, and sulfate reduction along the flow path in the fluvial aquifer. The downgradient increases in dissolved Mn and then Fe concentrations reflect increased Mn(II) and Fe(II) production via microbial competition as the aquifer becomes progressively more reduced. Bacterial sulfate reduction seems to dominate near the end of the groundwater flow path, as the availability of Mn- and Fe-oxyhydroxides becomes limited in sediments rich in lignitic wood where increasing sulfate reduction leads to the formation of biogenic pyrite. The groundwater is a Ca-SO4 type and is not SO4 limited; thus, sulfate may serve as an electron acceptor for the bacterial sulfate-reducing reactions that sequester As into pyrite, which in turn results in very low groundwater As concentration (<2 µg/L).
1. Introduction
Naturally occurring arsenic (As) is one of the most common metalloid contaminants found in groundwater, and the mode of occurrence and mobility of As in sedimentary aquifers are mainly influenced by local geology, geomorphology, hydrogeology, and geochemistry of sediments and water [1,2,3,4,5,6,7]. Geogenic As contamination is a widespread problem in Holocene aquifers worldwide [8], and As is relatively abundant in crustal rocks with an average concentration of 10 mg/L [4]. Natural As enrichment in groundwater has been reported in many countries including Argentina, Australia, Bangladesh, China, Chile, India (West Bengal), Pakistan, Taiwan, Thailand, Mexico, Vietnam, and many parts of the United States [4,6,9,10]. The toxic metalloid As is a common minor constituent in pyrite (FeS2) formed in low temperature environments including anoxic marine and estuarine sediments [11,12,13,14], lake sediments [15,16] and groundwater systems [17,18,19,20,21,22]. Arsenic-bearing pyrite is considered the major solid arsenic phase formed under sulfate-reducing conditions in natural systems [17,19,23].
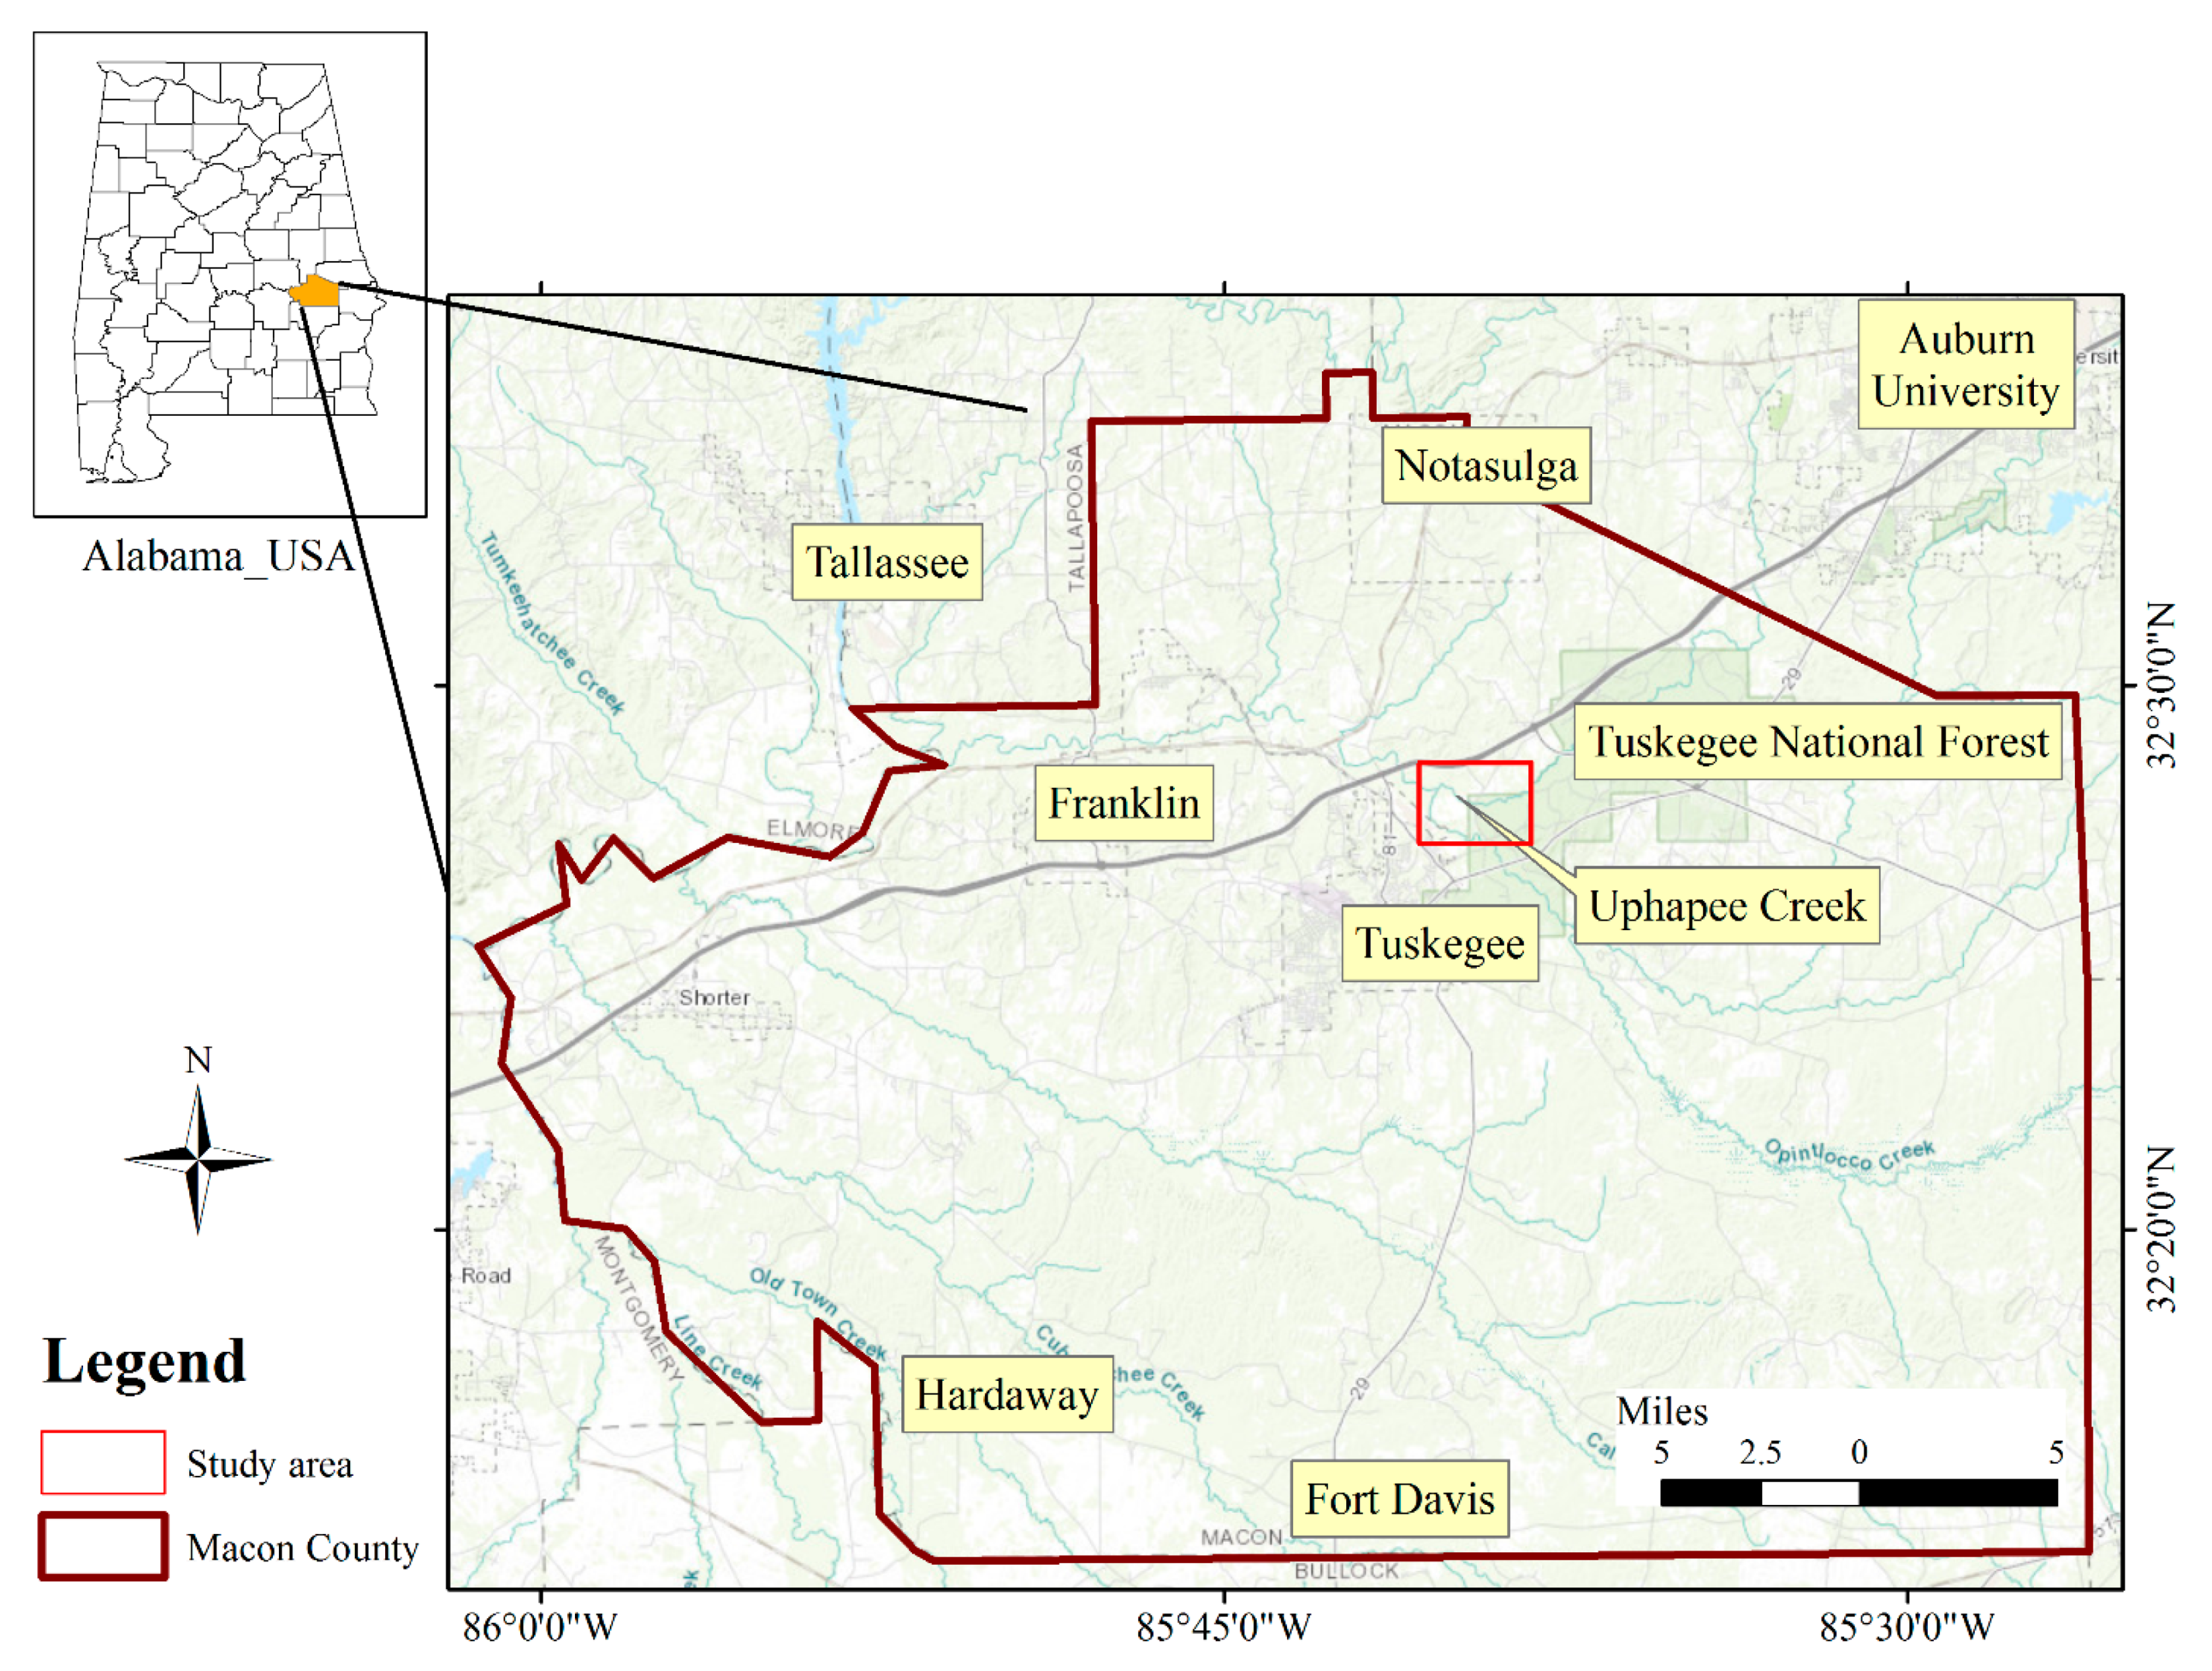
In the United States, As is considered as the second most common contaminant of groundwater [24]. Arsenic concentrations in groundwater vary regionally due to a combination of climate and geology. Higher As concentrations (>10 μg/L) are commonly observed in the western United States [2], as well as in states such as Michigan, Minnesota, Oklahoma, South Dakota, and Wisconsin [25]. Arsenic concentrations in groundwater of the Appalachian Highlands and the Atlantic Coastal Plain are generally very low (≤1 μg/L) and relatively higher in the Interior Plains and the Rocky Mountain System [2]. In contrast with the younger Holocene sediments of Bangladesh, the sediments of the study area in Alabama (Figure 1) are much older, Cretaceous in age, and usually their groundwater As content is low [26]. Saunders et al. [17] studied the geochemistry of a portion of the drainage basin of Uphapee Creek, in east-central Alabama. They found that groundwater in the alluvial aquifer of Holocene floodplain deposits contain 1–10 μg/L of As, 0.10–4 mg/L of Fe, and other trace elements such as Co, Ni, Zn, La, Ce, and Ba. The study indicated that the groundwater chemistry is largely controlled by the reduction and dissolution of ferromanganese coatings mediated by Fe– and Mn–reducing bacteria. Lignitic macro wood fragments were replaced by authigenic euhedral pyrite crystals and their light sulfur isotope signatures (−20–−40‰) indicated that pyrite crystals were precipitated from bacterial sulfate reduction. The authigenic pyrite contains several hundred mg/L of As, Co, and Ni, indicating that these trace elements were coprecipitated in pyrite during bacterial sulfate reduction. Starnes [26] studied the geochemistry and hydrogeology of As contaminated shallow alluvial aquifers in Macon County, Alabama. The study also found that biogenic pyrites were naturally formed, and had removed dissolved As, presumably by co-precipitation and sorption.
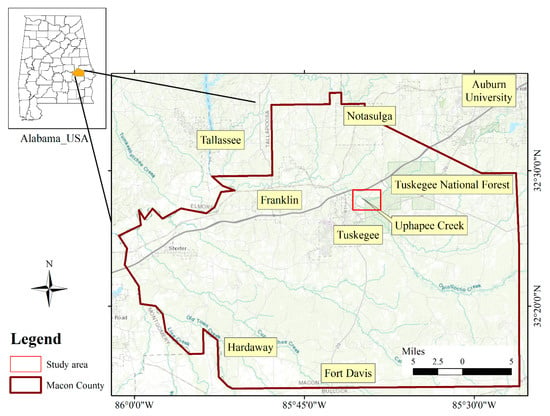
Figure 1.
Location map of the study area in Macon County, Alabama. The red squire indicates the location where the wells were drilled, and naturally occurring arsenic-rich biogenic pyrite replaces wood fragments near the base of the coastal plain alluvial aquifer.
Bangladesh, a South Asian country, has been identified as hotspot of As contamination in groundwater. Although Holocene alluvial aquifers of Bangladesh contain very high As in groundwater, it has a similar geologic setting as that in Macon County, Alabama. In Bangladesh, sediments were derived from weathering and erosion of the Himalayan and Indo-Burman range, and deposited in the Bengal Basin [27]. Similarly, the weathering and erosion of a variety of crystalline rocks in the Appalachians resulted in undifferentiated sediments that were deposited in Holocene floodplain of Alabama. A review research conducted in Bangladesh was helpful discerning the mechanism that caused high groundwater As concentrations there, and for comparison with the geochemical dynamics of As in Macon County, Alabama. Alluvial aquifers in Bangladesh are most affected by natural As contamination [28,29,30,31], and As enrichment is mainly restricted to shallow and intermediate depths [32,33,34,35,36]. Arsenic concentrations were as high as 250–300 μg/L [37,38]. Groundwater is mostly of Ca-Mg-HCO3 and Ca-Na-HCO3 types [36,37]; and low SO42− and high dissolved organic carbon (DOC) concentrations are typical chemical characteristics of the groundwater [27]. Several recent studies have argued that microbial reductive dissolution of Fe-oxyhydroxides and the limited amount of dissolved sulfate that limits precipitation of biogenic sulfide minerals, are the primary release mechanism of As in the groundwaters in Bangladesh [1,33,39,40,41,42,43,44]. Routh et al. [42] observed that where the sediments in the aquifer are rich in organic matter, microbial activity creates a reducing environment, that favors the transformations of Fe(III) to Fe(II) as well as As(V) to As(III) leading to As mobilization in groundwater.
Groundwater in the United States southeastern coastal plain sediments, however, does not normally have high concentrations of As [2] compared to those in Bangladesh. The As concentration fluctuates regionally, due to a combined influence of geology, hydrology, and climate [2]. Based on preliminary hydrogeology data [26], we hypothesize that As (if present) in the US southeastern coastal plain has been largely flushed out by gravity-driven regional flow over a longer geologic period. Moreover, different hydrochemical facies and mineralogy in fluvial sediments may influence the mobilization and transformation of As. The main objectives of this study were to (1) determine the geochemistry of groundwater and naturally occurring biogenic pyrite in a natural fluvial aquifer along groundwater flow path near Uphapee Creek in Macon County, Alabama; (2) understand the biogeochemical reactions controlling the fate and transport of As and other trace elements under changing redox condition; and (3) assess the capability of naturally formed biogenic pyrite to sequester As.
2. Geology of the Study Area
The study area is located within the Tuskegee National Forest in Macon County, Alabama (Figure 1). More specifically it is located along the bank of the Uphapee Creek, a tributary of the lower Tallapoosa River. In the northern side of the drainage basin, Appalachian Piedmont is present which consists of Precambrian-Paleozoic crystalline rocks. The creek flows through the Coastal Plain province of the Southeastern United States, more specifically east-central Alabama (northern Macon County) [17,45]. The Tallapoosa River and Uphapee Creek drain both Piedmont and Coastal Plain terranes, but Uphapee Creek is predominantly a Coastal Plain drainage, incised into the non-marine Upper Cretaceous Tuscaloosa Group [45]. Coastal Plain aquifer materials and associated sediments consist of non-marine alluvial deposits [46]. The sediments are characterized by petrified and lignitic wood fragments, which are commonly associated with crystalline pyrite with no signs of visible organic matter [45]. These undifferentiated sediments consisting of gravel, sand, silt, and lignitic wood, which were derived from the weathering and erosion of the Appalachians; and were deposited in a Holocene floodplain [26]. Weathering of a variety of crystalline rock types may lead to release of As and other metals/metalloids to the hydrosphere.
3. Materials and Methods
3.1. Field Procedures
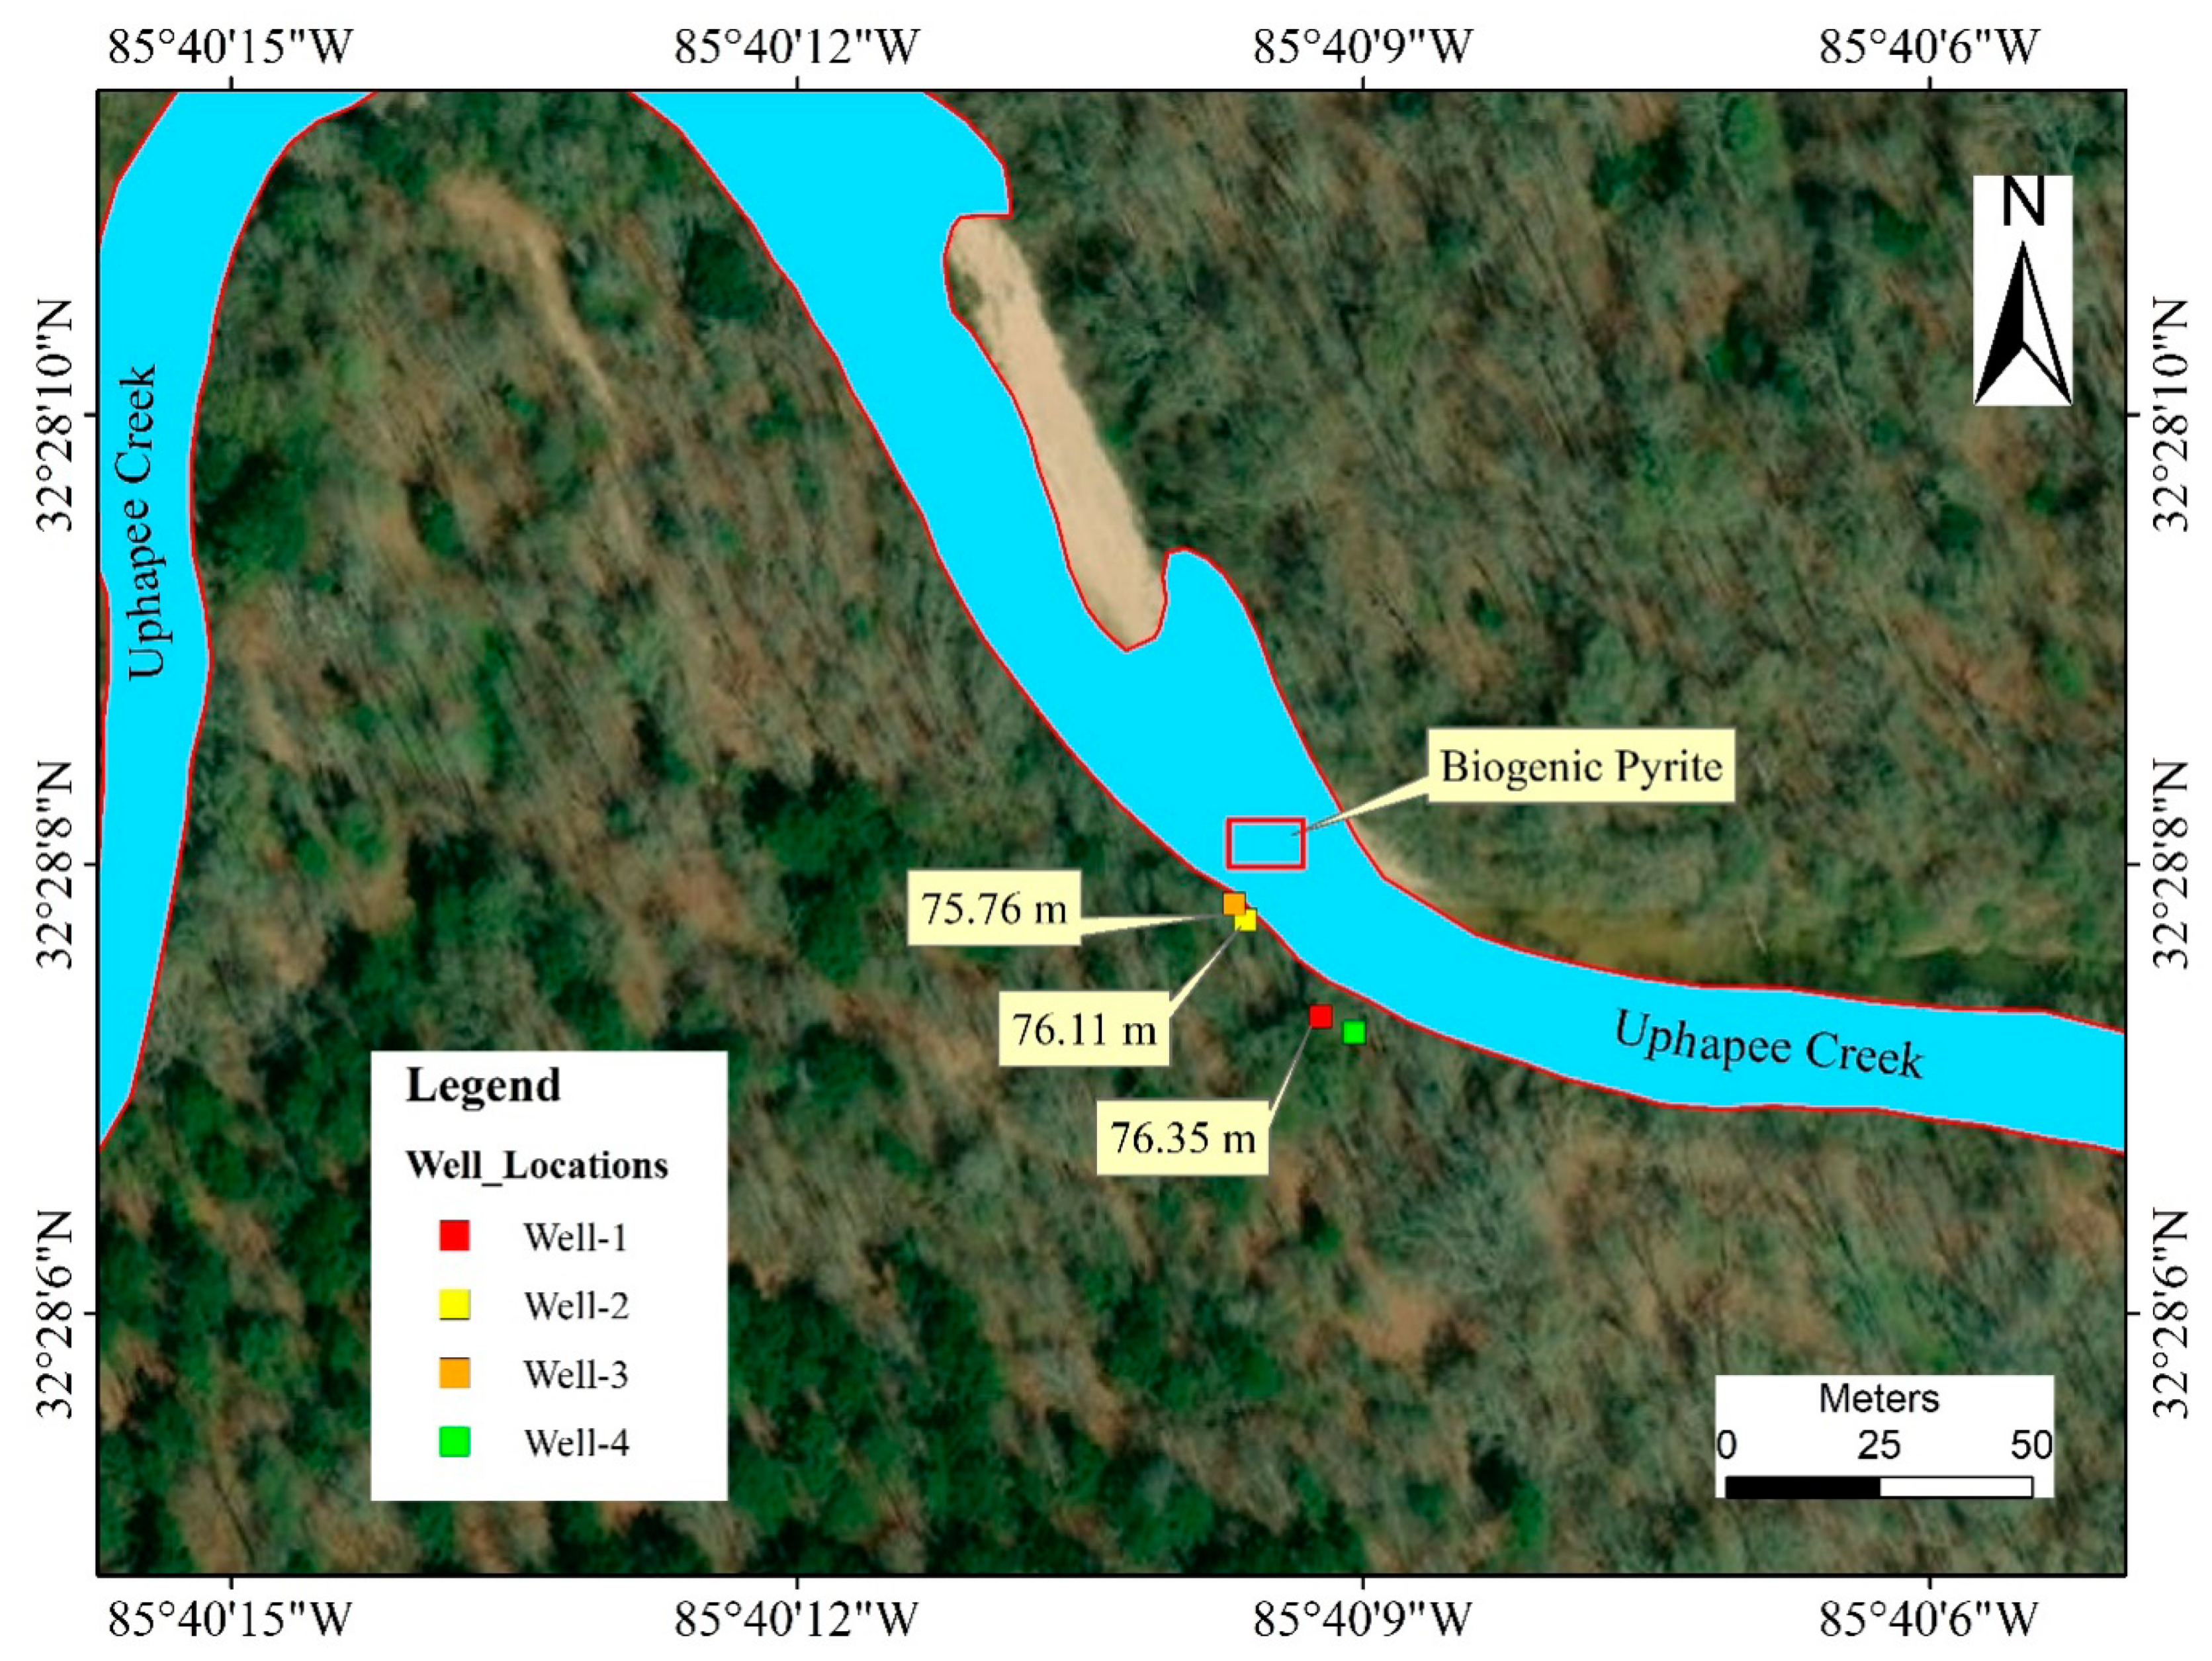
Four new wells were drilled and installed in 2018–2019 using a hand-held auger in the fluvial sediments along a transect where naturally formed authigenic pyrite, and exposed Fe- and Mn- oxidizing surfaces were identified (Figure 2). The diameter of the well was 8.90 cm and the casing material was polyvinyl chloride (PVC). Wells were named based on the sequence of drilling, such as well 1, well 2, well 3, and well 4. Well 1 and well 4 were 1.53 m apart from each other and well 2 and well 3 further downgradient toward the creek were 1.07 m apart from each other. The ground surface elevation for well 1 and well 4 was 81.08 m, and 77.73 m for well 2 and well 3. While drilling the wells, a lignitic wood layer was encountered in well 1 and well 3. Sediment samples were collected and preserved for mineralogical and geochemical analysis.
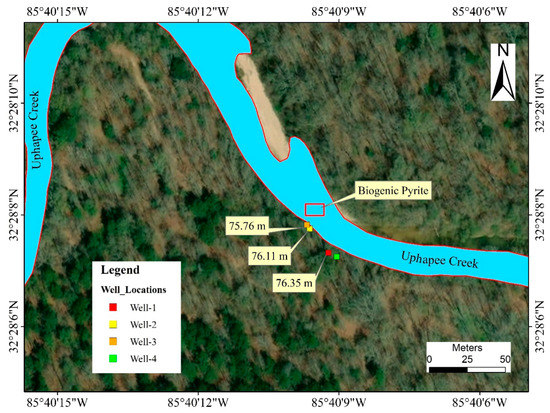
Figure 2.
Map showing the relative position of the wells, and the location where naturally occurring As-rich biogenic pyrite is replacing wood fragments. The numbers (yellow boxes) represent groundwater table elevations relative to sea level on 20th November 2018.
3.2. Water Quality Measurements and Sampling
Representative groundwater samples were collected from the wells for water chemistry analysis. YSI 556 hand-held multiparameter probes (YSI company, Yero Springs, OH, USA) connected to an on-line flow cell, were used in the field to measure water quality parameters including temperature, pH, oxidation reduction potential (ORP). In YSI 556, the pH and the ORP electrodes are built together as a single probe and the ORP is read relative to the standard hydrogen electrode (SHE), therefore, there is no need for converting the ORP readings to Eh values. Prior to sampling, the wells were purged using a peristaltic pump until all the water quality parameters readings became stable. To measure the dissolved sulfide concentration, a HACH DR2700 spectrophotometer (HACH company, Loveland, CO, USA) was used in the field, via the standard Methyl Blue Method (USEPA Method 8131) [22]. A HACH DR820 colorimeter (HACH company, Loveland, CO, USA) was used to measure the ferrous iron concentration via the 1.10 phenanthroline Method (USEPA Method 8146) [22] in the field. The HACH digital titrator test kit was used to measure the alkalinity using the titration method (USEPA Method 8203) [47]. Groundwater samples were filtered through a 0.45-µm filter and purged into three 30 mL vials. In the field, the samples for ICP-MS analysis were acidified and preserved using 70% nitric acid for trace metal and cation analysis.
3.3. Arsenic Speciation Analysis
Another groundwater sample was filtered through 0.45-µm filter and later filtered through a disposable arsenic speciation cartridge [48] to determine arsenic speciation. The first 5 mL of the filtrate that passed through the arsenic speciation cartridge was discarded before collecting the samples. Highly selective aluminosilicate adsorbent present in the speciation cartridge adsorbs the negatively charged arsenic species (such as As(V), H2AsO4−) while allowing the neutral arsenic species (such as As(III), H3AsO3) to pass through [22]. Total As and As(III) concentration in the groundwater were determined by ICP-MS analysis.
3.4. Geochemical Analysis of Groundwater
The groundwater samples were analyzed in different laboratories for water chemistry analyses. An Agilent 7900 Quadrupole Inductively Coupled Plasma Mass Spectrometer (ICP-MS) at ICP-MS laboratory, Auburn University was used to determine major cation and trace element (e.g., arsenic, iron) concentrations in acidified groundwater samples. Un-acidified groundwater samples were packed with dry ice and shipped overnight to Activation Laboratories located in Ontario, Canada for anion analysis. Another set of groundwater sample were sent to the Stable Isotope Ecology Laboratory, University of Georgia for dissolved organic carbon (DOC) analysis.
3.5. Geochemical Analysis of Biogenic Pyrite
The crystalline structure, chemistry, geomorphology, and As contents of the pyrite samples were studied using several techniques: (1) X-ray diffraction (XRD); (2) X-ray fluorescence (XRF), (3) Scanning electron microscope (SEM); and (4) Electron microprobe (EMP). Samples of approximately 50 g of pyrite were powdered and then were analyzed using a portable Bruker Elemental Tracer IV-ED XRF (Bruker, Billerica, MA, USA) for semi-quantitative measurements. The results were used to characterize the bulk elemental composition of the samples including the presence of iron, sulfur, arsenic and other trace elements. The same powdered samples were analyzed using a Bruker D2 Phaser X-ray Diffractometer (Bruker, Billerica, MA, USA). Samples were run from 2-theta values of 5 degrees to 75 degrees with a 0.02 degree step interval, which is considered standard for a geologic sample. The mineral composition of the samples was determined by a peak search and match of the XRD spectra using DIFFRAC.EVA software developed by BRUKER Corporation, Billerica, MA USA. Three selected pyrite samples were sent to National Petrographic Service (Houston, TX, USA) to prepare polished (uncovered) thin sections. Arsenic contents in the pyrite thin sections were quantified more precisely using a JEOL 8600 electron microprobe (JEOL Ltd., Tokyo, Japan) at Auburn University. Unlike XRF, EMP can analyze spots on mineral grains as small as 1-2 microns in diameter in a quantitative manner [49]. Thus, this allows assessing and mapping compositional changes across a single pyrite grain, and more importantly to quantify the amount of As per unit mass. As pyrite is not naturally conductive, the thin sections were carbon coated to increase conductivity for EMP analysis. Backscattered electrons (BSE) and elemental map images were obtained at a current of ~50 mA and an accelerating voltage of 15 KeV. The standards for Fe, S, Si and As were used to obtain the element contents as weight % and to prepare elemental maps of the grains in the thin section. A Zeiss EVO 50VP SEM (ZEISS, Oberkochen, Germany) at the Auburn University Instrumentation Facility was used to determine the size and texture of the pyrite grains. Pyrite samples as well as the carbon coated thin sections were used in SEM studies. An INCA EDS system (Oxford instruments, Concord, MA, USA) was connected to the SEM which was used to study the quantitative elemental composition.
3.6. Geochemical Modeling
Geochemist’s Workbench (GWB) [50] was used to model the speciation of arsenic, iron, and manganese under various Eh-pH conditions, and to calculate saturation index SI (logQ/K) of various Fe- and Mn-minerals, and arsenian-pyrite in the study area. The thermodynamic database Equation (1) presented by Saunders et al. [19] was used to prepare Eh-pH diagram for arsenian-pyrite:
FeS1.99As0.01 + 1.02 H2O + 3.5 O2(aq) = Fe2+ + 1.995 SO42− + 0.01 As(OH)4− + 2 H+,
log K25 = 199.78
log K25 = 199.78
4. Results
4.1. Hydro-Stratigraphy
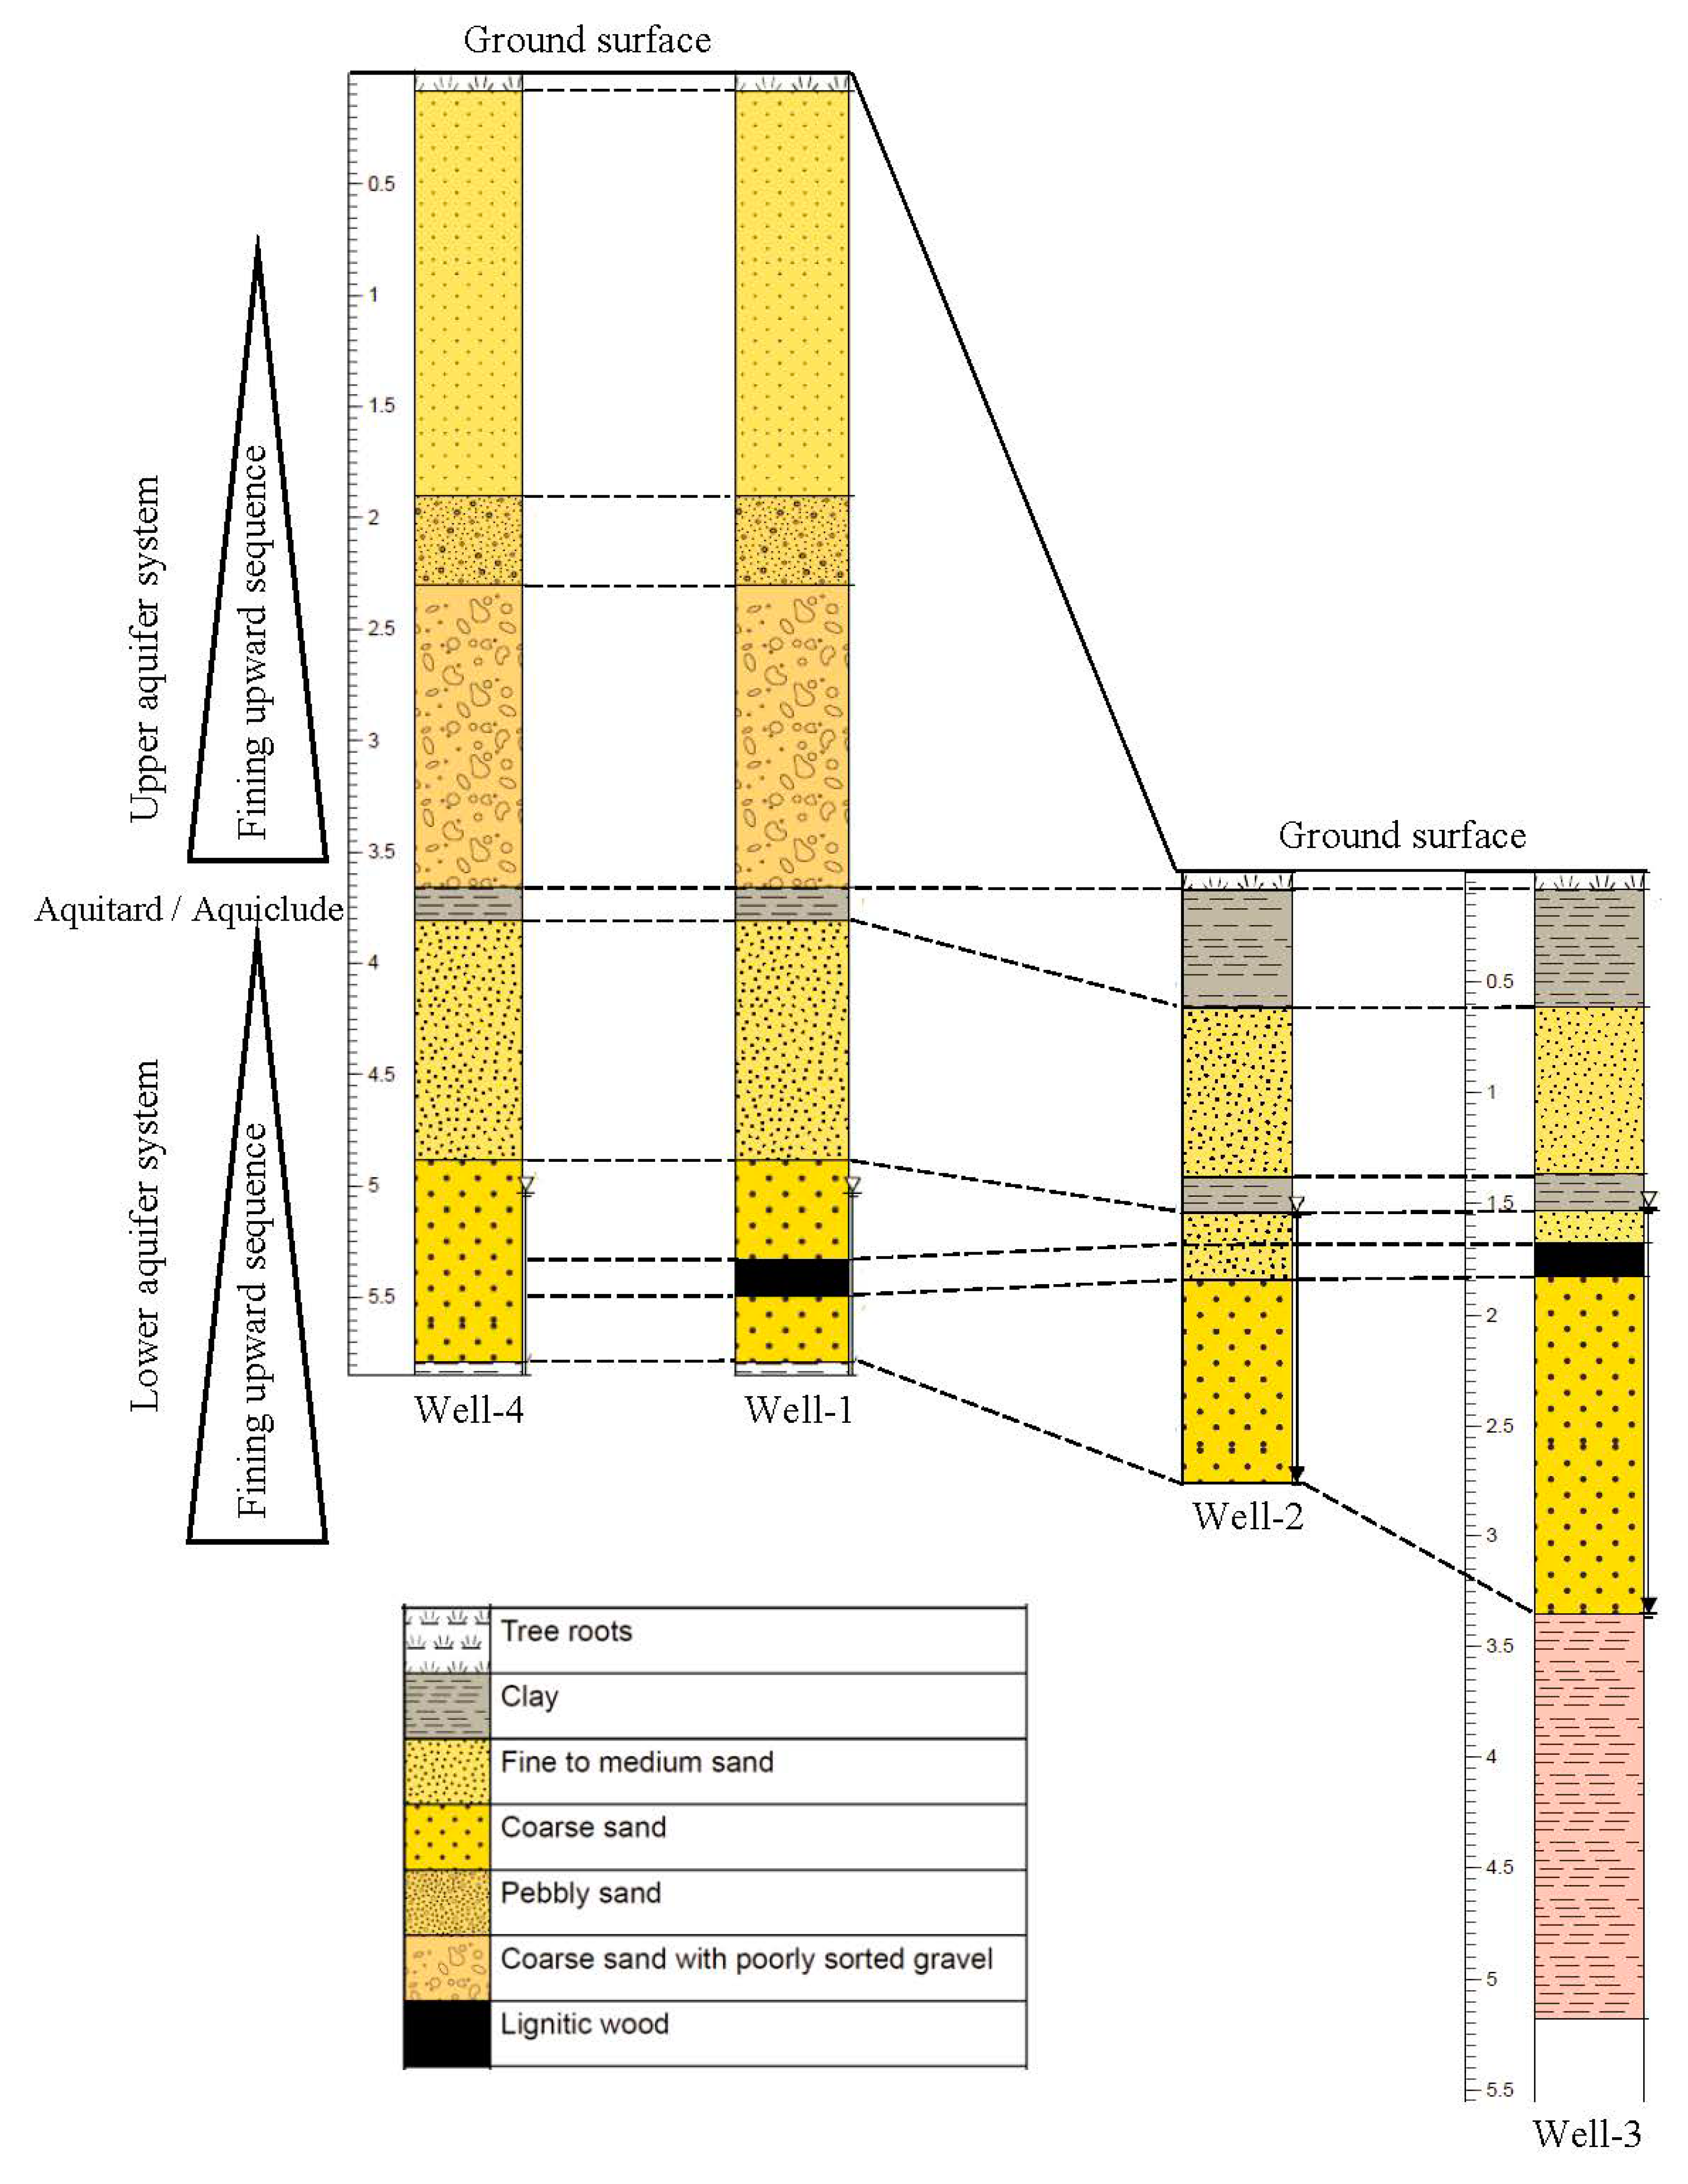
Well logs were prepared based on the visual inspection of the cuttings brought to surface during drilling (Figure 3). The logs showed a consistent lithology among the wells. Two fining upward sequences were identified. The lithology indicates the presence of two aquifers and the lower confined aquifer was the focus of this study.
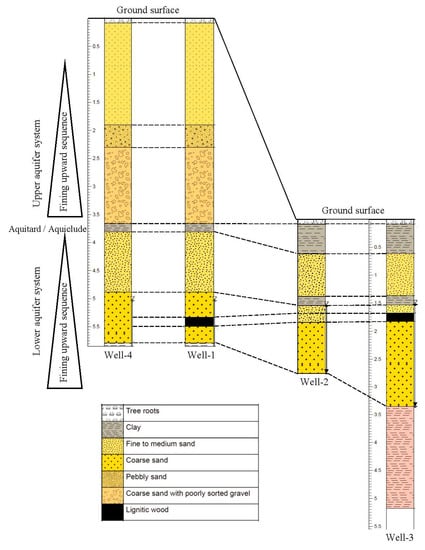
Figure 3.
Stratigraphic column of Macon County study area based on the visual inspection of the cuttings from the wells during drilling. The stratigraphic column is showing a correlation among the wells. Groundwater was flowing in a general direction from south-east (well 4) to north-west (well 3). Vertical scale is in meters, horizontal distance is not in scale.
The total depth for well 1 and well 4 was ~5.79 m. The top 1.83–2 m below the land surface consisted of very fine sand, followed by 0.30 m of pebbly sand. At a depth of 2.30–3.66 m, a gravel layer with coarse sand was observed which was underlain by 0.15 m of clay. Fine to medium sand was found at a depth of 3.81–4.88 m and coarse sands were found at 4.88–5.79 m depth. A lignitic wood layer was encountered at 5.33 m depth from the surface. The water table was at 4.11 m below the ground surface in well 1 on 17 July 2018, but on 9 October 2018 during the completion of the wells, the water level went down to 5.18 m in well 1 indicating a 1.07 m drop in water level. Ground surface elevations of well 1 and well 4 was 3.00–3.65 m higher than those of well 2 and well 3. Groundwater table elevations measured at well 1, well 2, and well 3 on 20 November 2018 were 76.65, 76.11 and 75.96 m, respectively, relative to the mean sea level, indicating that well 1 is an upgradient well. Water table data were not available for well 4 on the same day, as this well was drilled on a later date. The water table elevations and calculated gradient (0.016) suggested groundwater was moving in a general direction from south-east to north-west and eventually discharged into the Uphapee Creek (Figure 2).
The total depths of well 2 and well 3 were about 2.75 and 5.18 m, respectively. For these two wells, the lithology consists of 0.61 m of clay from the top, underlain by fine to medium sand that extends 0.61–1.37 m. A 0.15 m clay layer was found at depth of 1.37 m. A medium to coarse sand layer was encountered at a depth of 1.53 m that extended down to 3.35 m depth. The same lignitic wood layer observed at well 1 and was found at a depth of 1.68 m in well 3. To learn more about the subsurface lithology, well 3 was drilled down to 5.18 m. A clay layer (reddish color) was found at a depth of 3.35–5.18 m, suggesting that the aquifer is confined from above and below by the low permeability clay layers.
4.2. Field Measurements of Groundwater
Table 1 shows water quality parameters and concentrations of ferrous iron, hydrogen sulfide and alkalinity of well water measured in the field. Eh values indicate that groundwater in the fluvial aquifer occurs under slightly oxidizing to moderately reducing conditions (Eh = 46 to173 mV), and is nearly neutral to slightly acidic (pH = 5.53–6.51). The concentrations of ferrous iron are much higher in well 3 (3.30 mg/L) than in well 1 and well 4 (0.08 mg/L and 0.32 mg/L, respectively). By contrast, Eh values are significantly lower in well 2 and well 3 (68.5 and 46 mV, respectively) than those in well 1 and well 4 (121 and 173 mV, respectively). Sulfide concentration in these wells ranges from 16 to 39 µg/L. Iron and sulfide measurements were not taken in well 2 as the water coming from the well had too much sediment.

Table 1.
IC analysis and field parameters of the groundwater samples at the study site in Macon County, Alabama. Units are in mg/L (except as noted).
4.3. Laboratory Measurements of Groundwater Samples
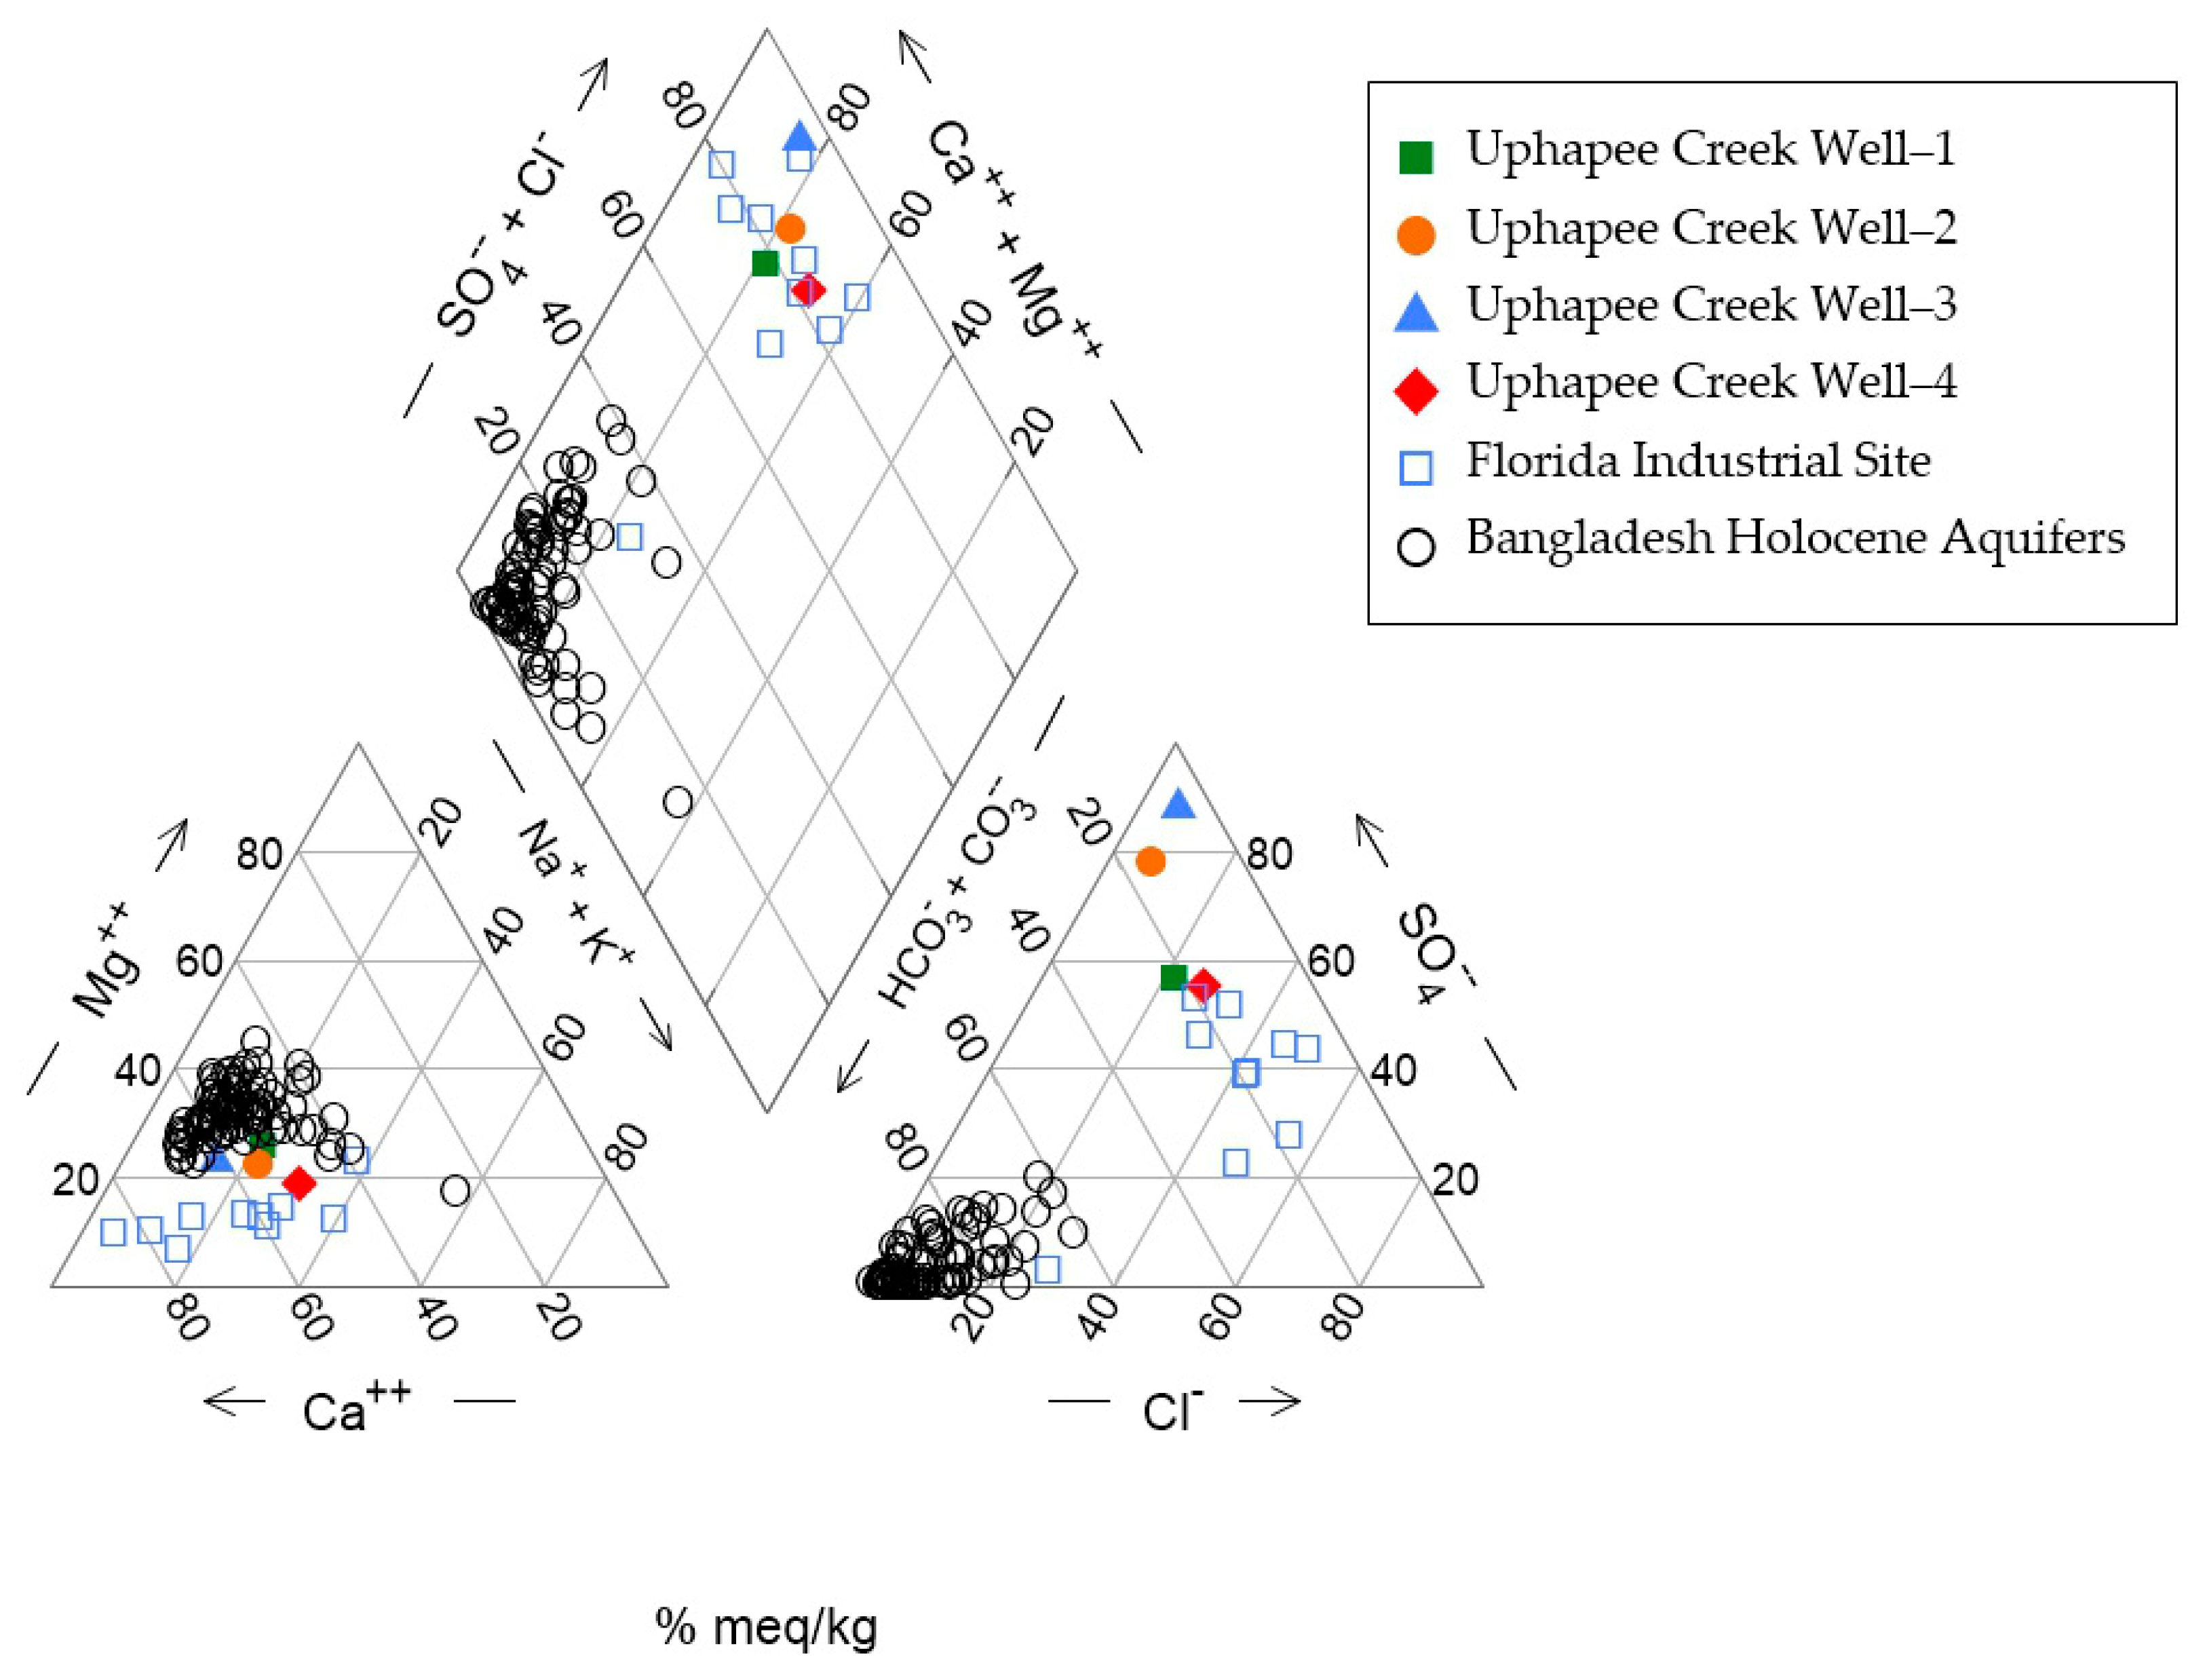
Results of IC analysis of anions in well water are shown in Table 1 and results of ICP-MS analysis of cation and trace elements are showed in Table 2. A Piper diagram was prepared based on the major ion concentrations. The diagram shows that the groundwater from the Uphapee Creek wells is a Ca-SO4 type (Figure 4), different from typical As-rich groundwater in Bangladesh Holocene aquifers which is a Ca-Mg-HCO3 type.

Table 2.
ICP-MS analysis (cation and trace elements) of the groundwater samples at study site, Macon County, Alabama. Units are in µg/L.
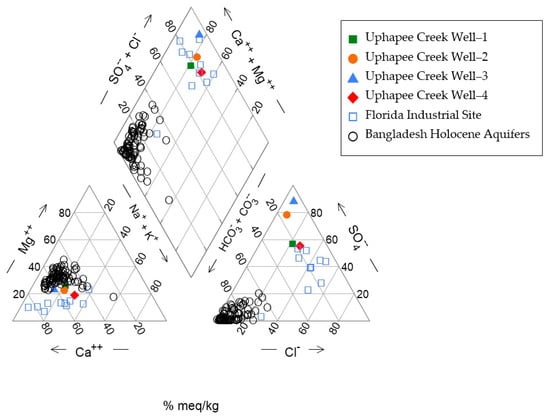
Figure 4.
A piper diagram illustrating the main hydrochemical features of the Macon County, Alabama fluvial aquifer system. It also presents groundwater data from Florida (industrial site) [51], and Bangladesh [6].
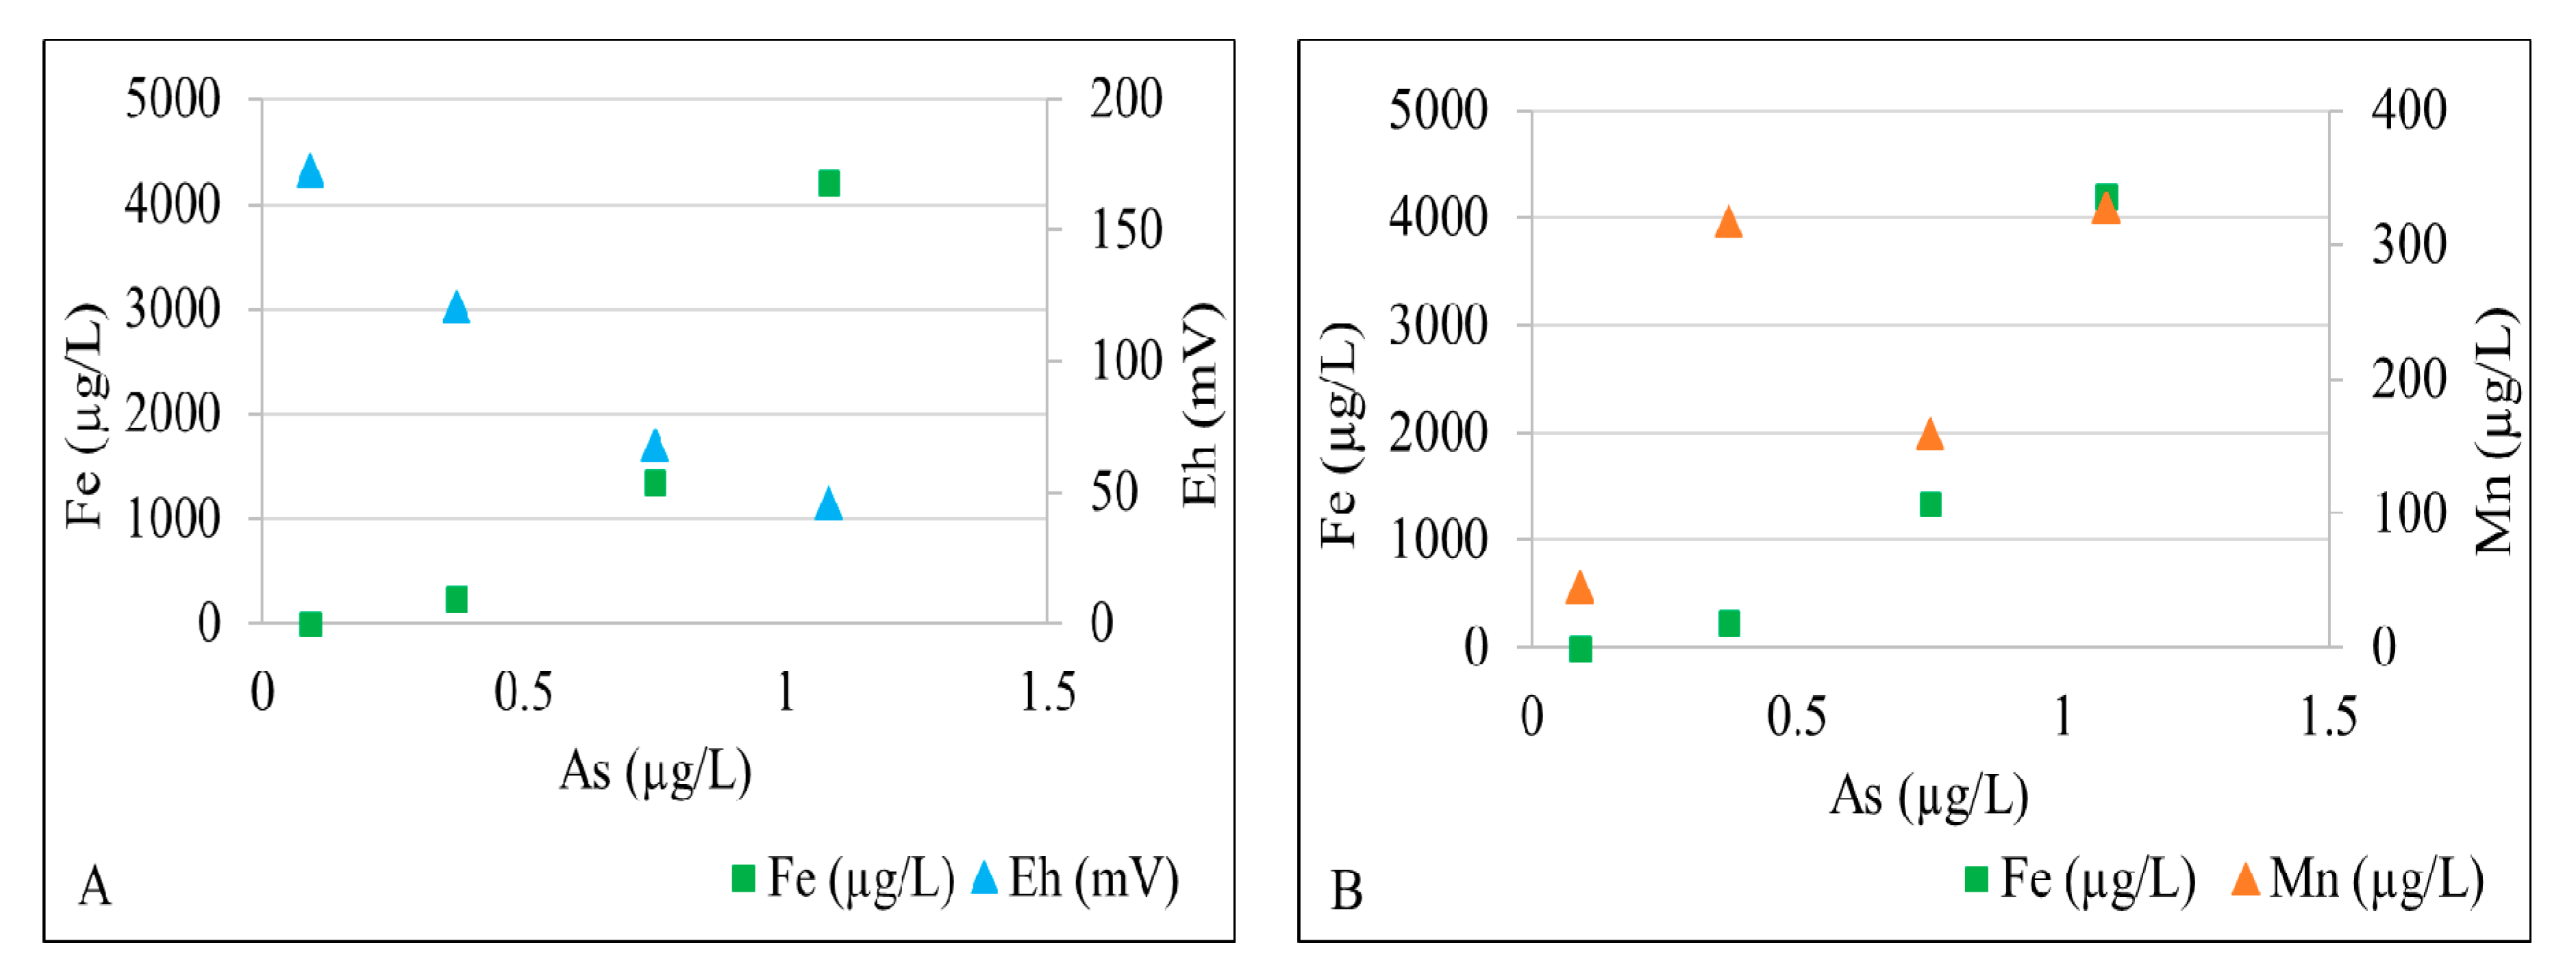
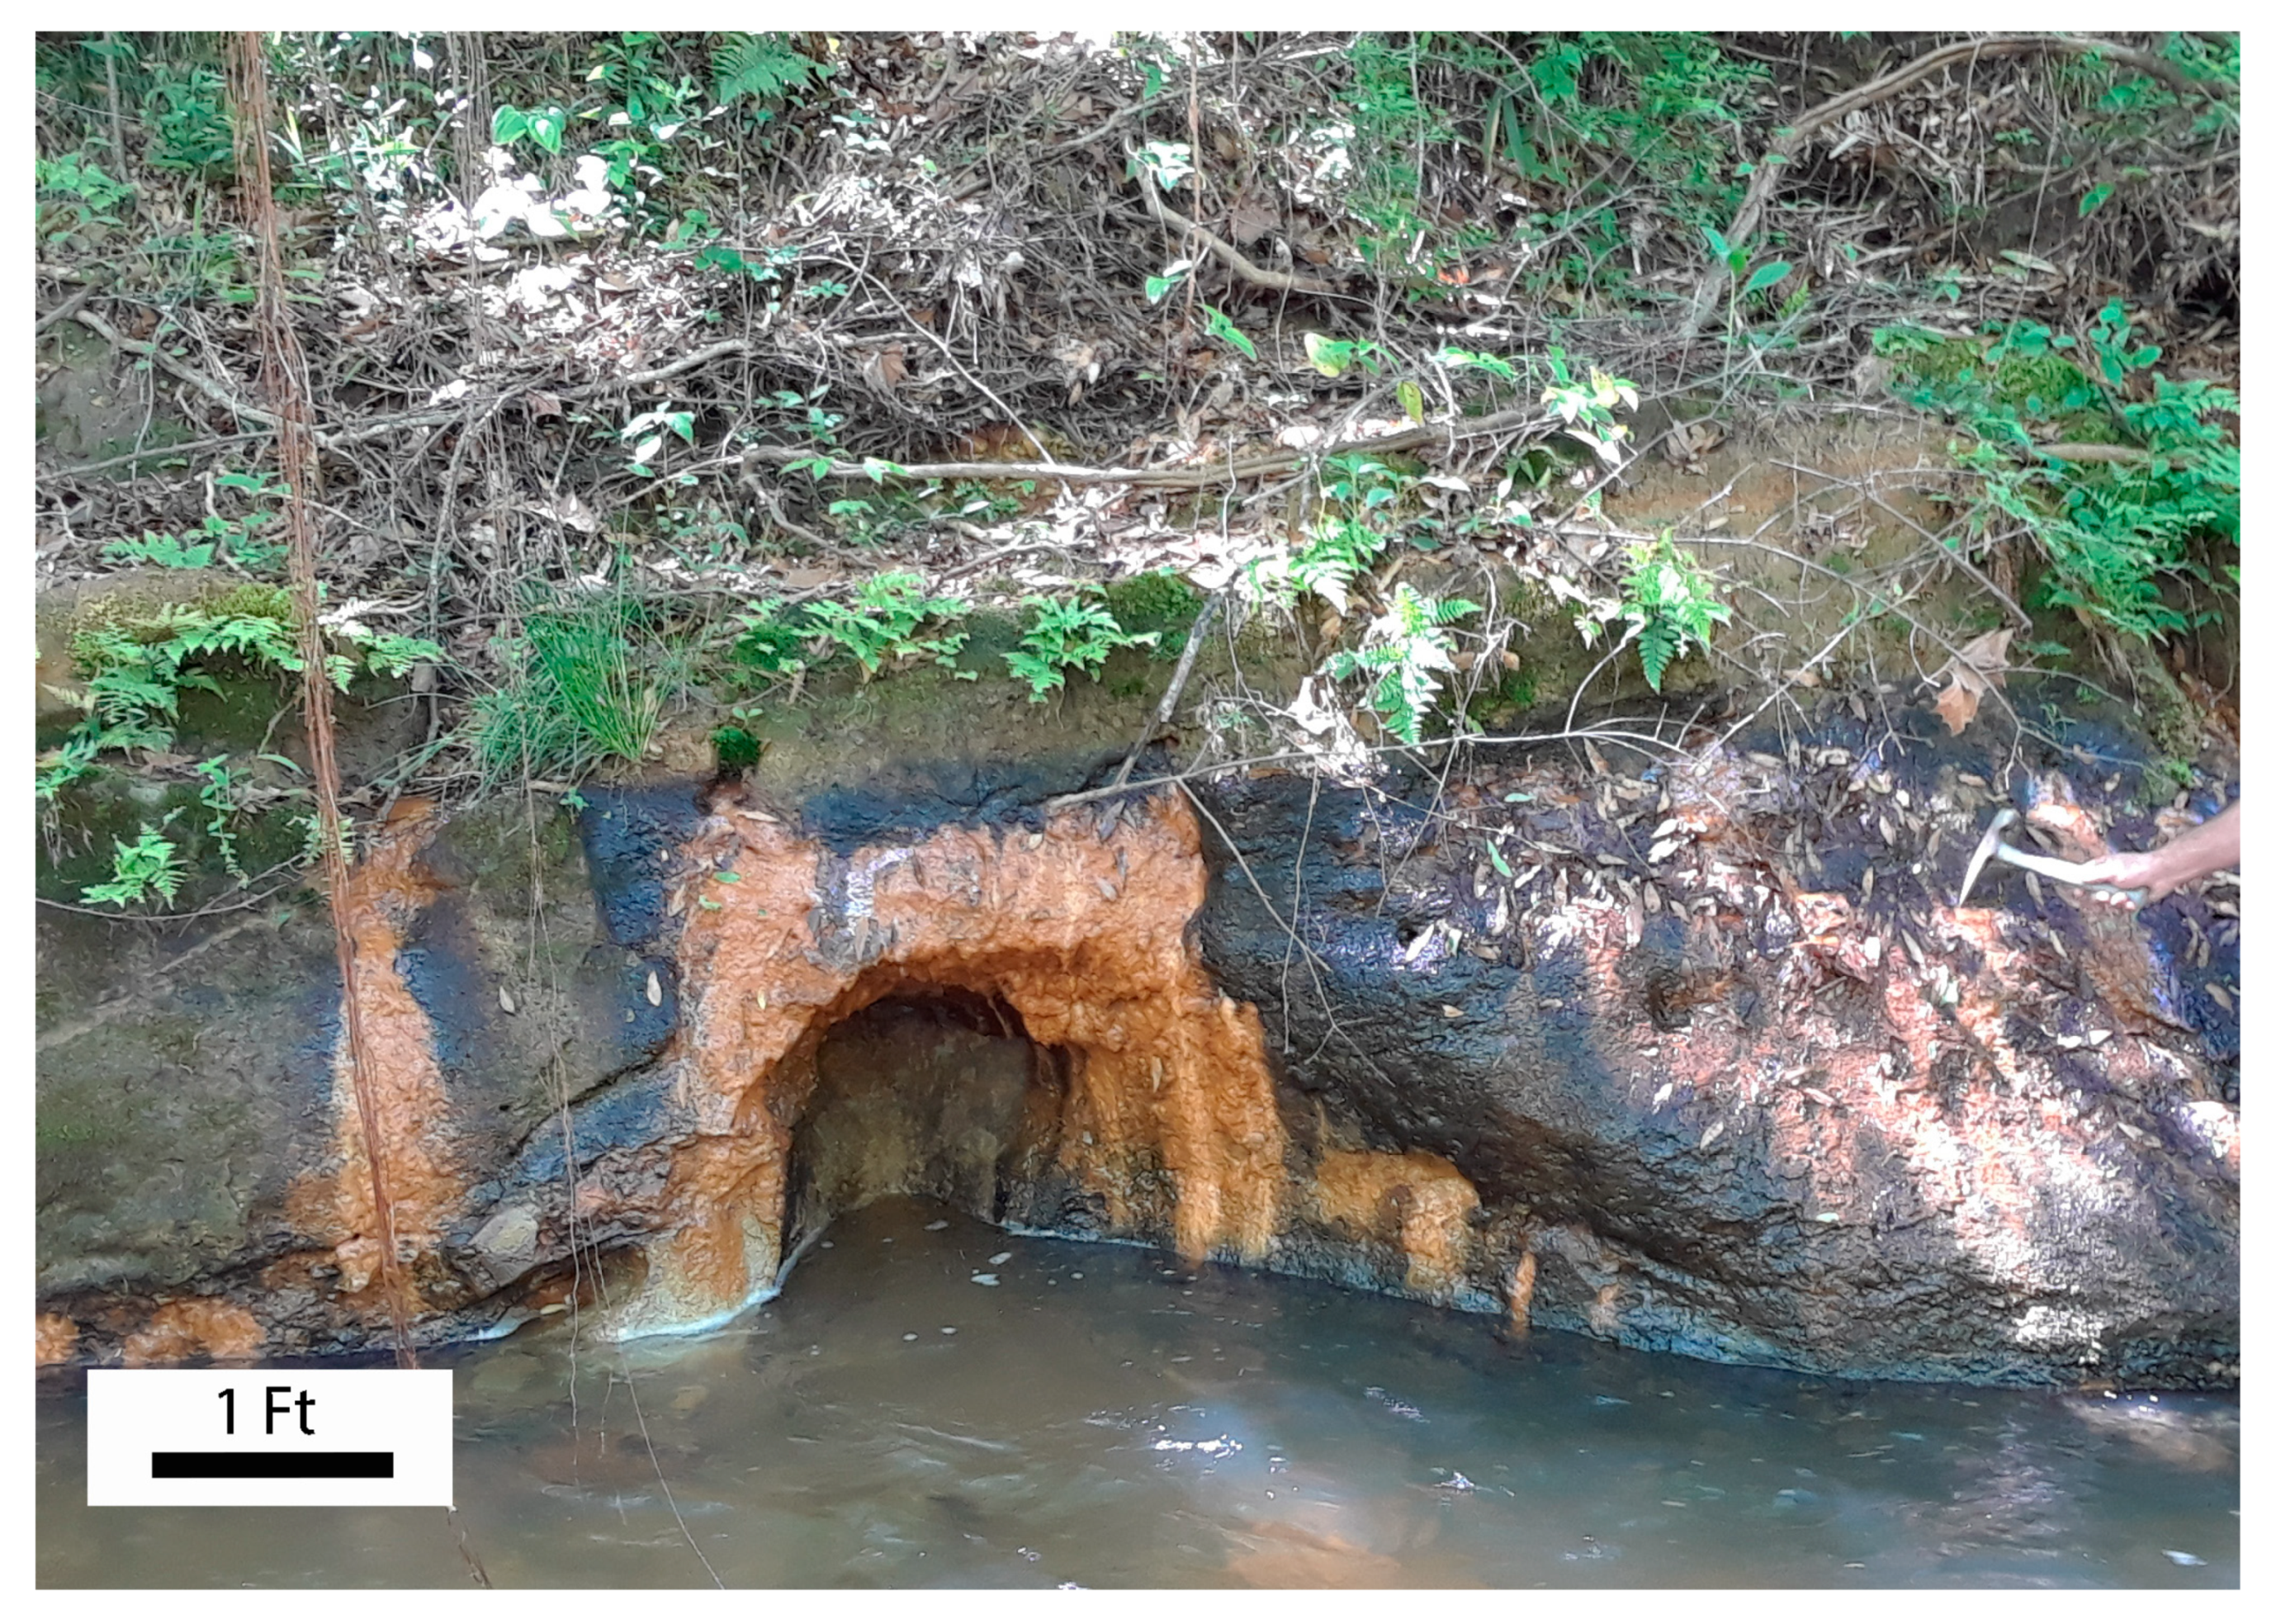
Dissolved total iron and arsenic concentrations are significantly higher in well 2 and well 3 than those in well 1 and well 4. Figure 5A shows that As is positively correlated to Fe and inversely correlated to Eh. Low dissolved Fe, Mn, and As concentrations and relatively high Eh values in well 4 reflect an oxic conditions. The nitrate concentration decreases downgradient from well 1 and well 4 (0.02–0.03 mg/L) to well 2 and well 3 (<0.01 mg/L), indicating the potential for nitrate reduction. The elevated Mn concentration (318 µg/L) and moderately high Fe concentration (239 µg/L) in well 1 suggests that its groundwater is predominantly under Mn-reducing conditions (Figure 5B). The combination of relatively high total Fe (1.30–4.20 mg/L), ferrous Fe, and lower Eh values suggest Fe(III)-reducing conditions further downgradient in well 2 and well 3. Fe- and Mn-rich groundwater oxidizes to form black (Mn-rich) and orange (Fe-rich) solids as it discharges into the creek as springs (Figure 6). The As concentration is slightly higher in well 2 and well 3, suggesting that some As adsorbed by Mn- and Fe-oxyhydroxides maybe released under Mn(IV)- and Fe(III)-reducing conditions. Arsenic mobilized in groundwater is subsequently adsorbed by biogenic pyrite formed under sulfate-reducing conditions further downgradient near where groundwater discharges into the creek. Sulfate concentrations in groundwater (Table 1) are relatively high (up to 53.10 mg/L) in downgradient well 2 and well 3, providing ample electron acceptors for bacterial sulfate reduction. Overall, the fluvial aquifer groundwater is not limited in SO4, Fe, and organic carbon (supplied by the lignite wood), which facilitates bacterial sulfate reduction, precipitation of biogenic pyrite, and sequestration of As in the biogenic pyrite.
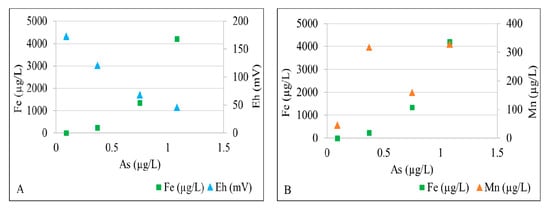
Figure 5.
X-Y plot showing (A) a relation of arsenic concentrations with iron concentrations and Eh values, and (B) a relation of arsenic concentrations with iron and manganese concentrations in different wells.
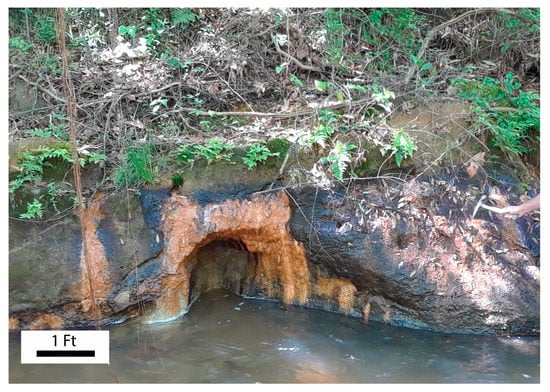
Figure 6.
An outcrop of Fe- and Mn-oxidized zone formed from spring discharge.
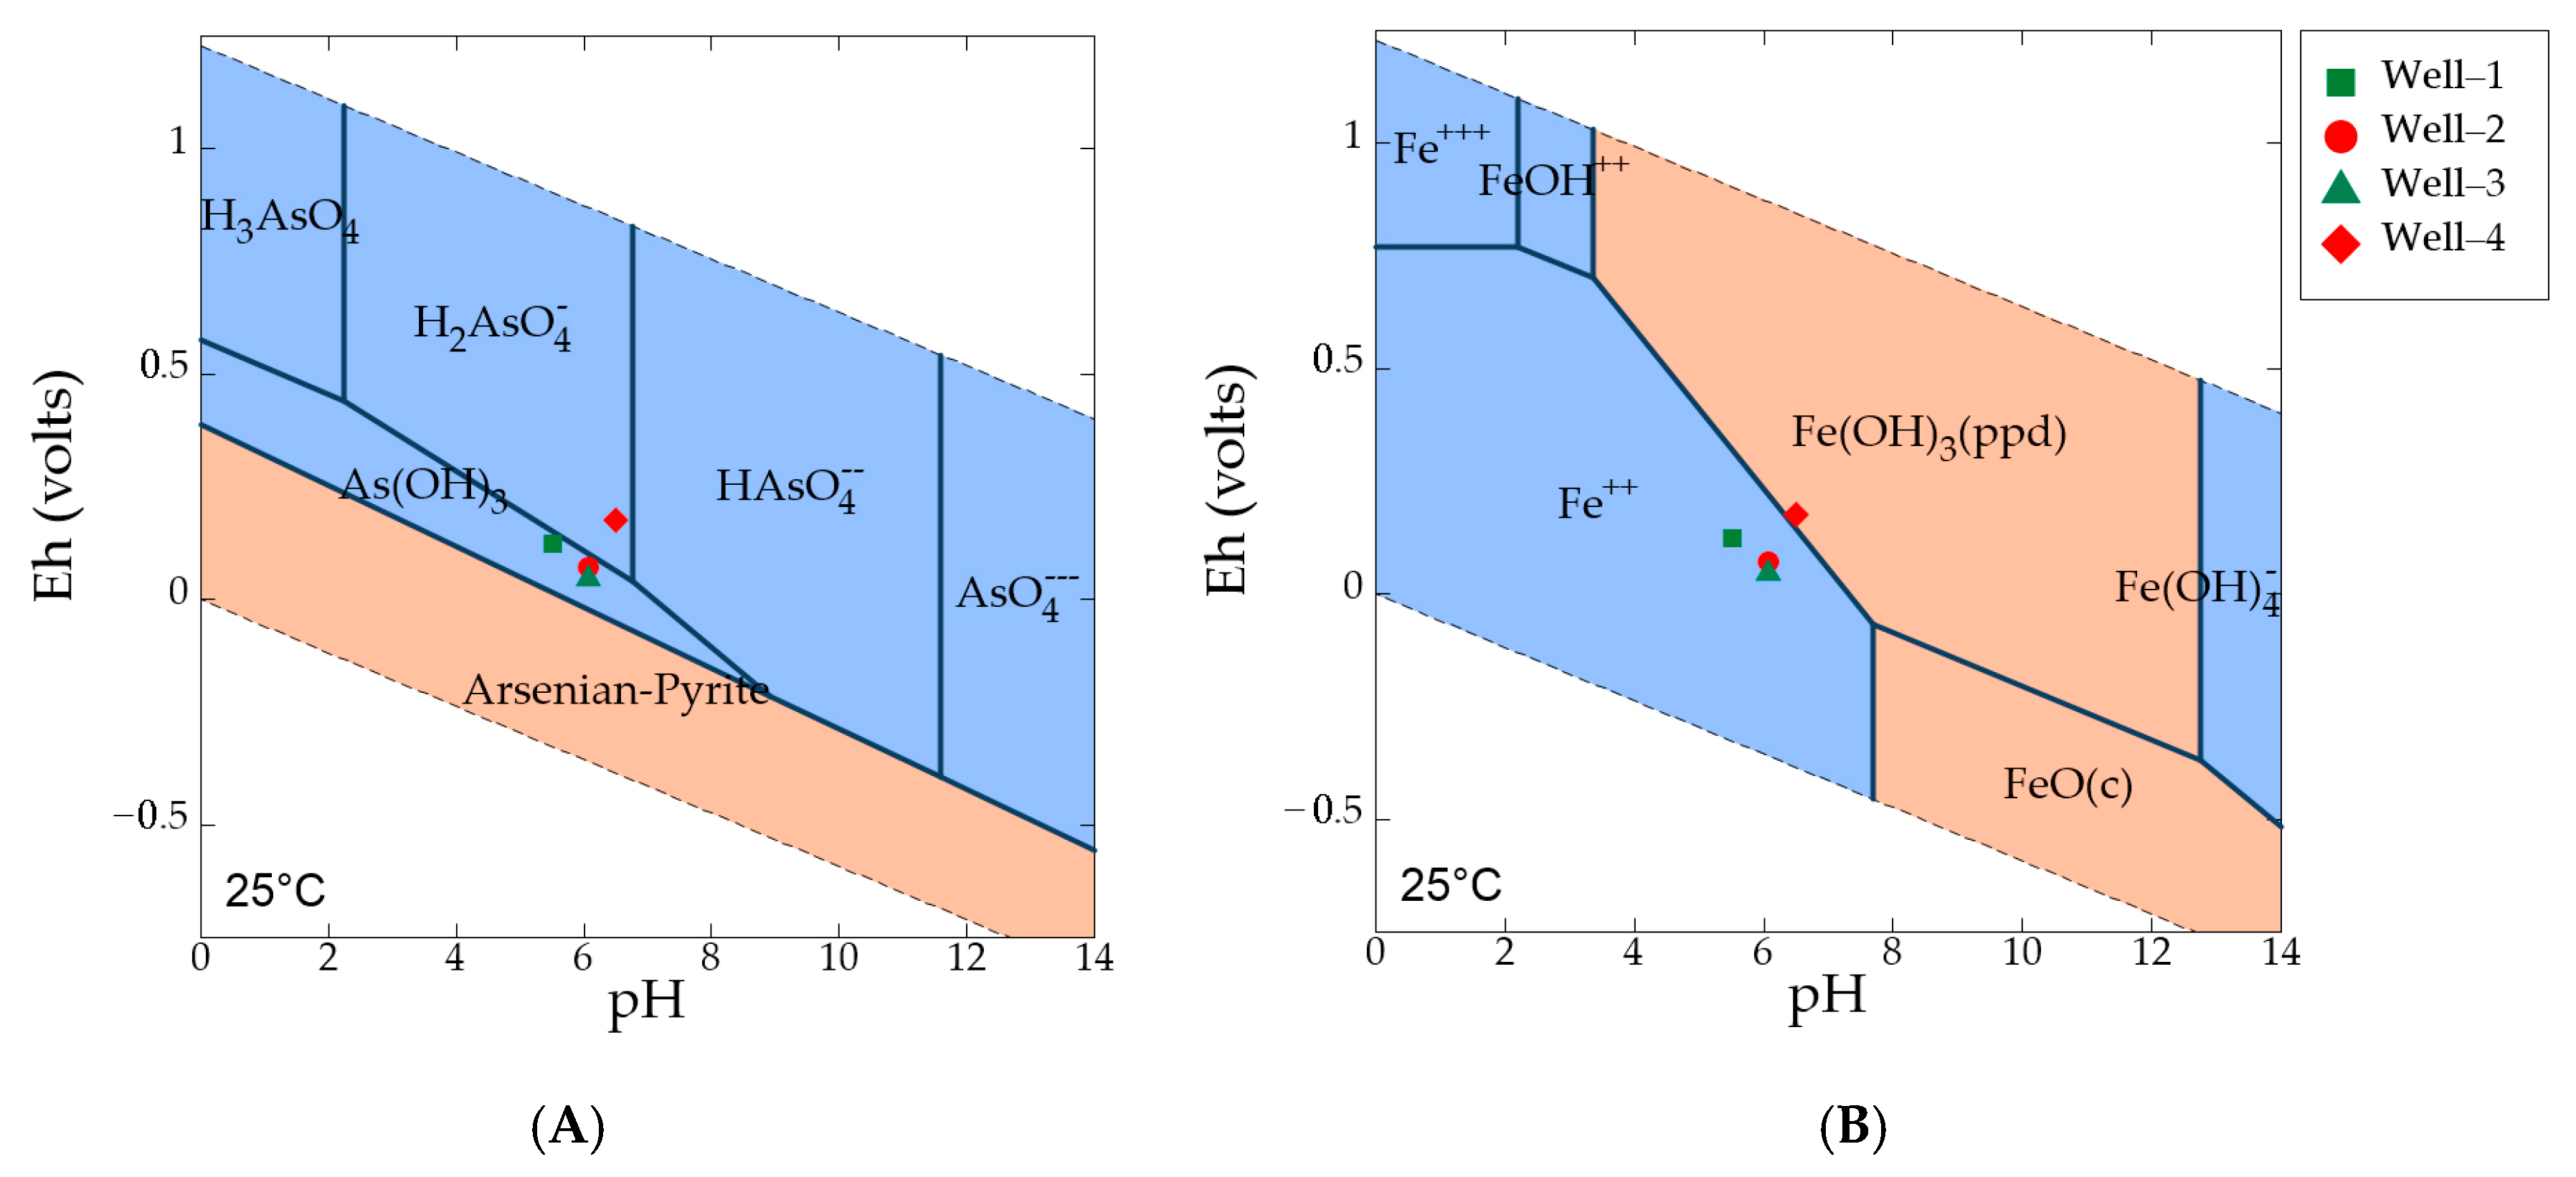
The ICP-MS laboratory analysis showed that highest As concentration (1.08 µg/L) occurs in well 3 and lowest concentration (0.09 µg/L) in well 1. The analysis of groundwater from all the wells showed that both total As and As(III) has similar concentration (Table 2), indicating As(III) is consistently higher in concentration than that of As(V). As(III) is the dominating species of As in the groundwater. These analytical results were consistent with field Eh-pH data and the geochemical models. Field Eh-pH data of wells 1, 2, and 3 (Figure 7A) showed that dominant As aqueous species were found in the form of As(III) (or As(OH)3) under moderately reducing conditions. As(V) is the dominant species in well 4 under oxidized condition.
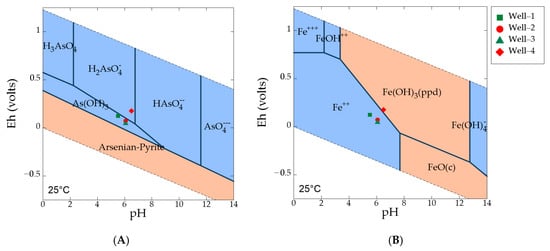
Figure 7.
(A) Eh-pH diagram showing As species under various redox conditions with plotted groundwater samples from the wells, where As log activity is −4, for both Fe and SO42− log activity is −3, and scorodite (As oxides) is suppressed; (B) Eh-pH diagram showing stable Fe species under various redox conditions, where Fe log activity is −4, and goethite, hematite, magnetite are suppressed. Blue fields designate aqueous phases and pink fields are solid phases.
Iron exists in water as either ferrous (Fe2+) or ferric iron (Fe3+). Field measurement of ferrous iron and lab measurement of total iron indicates that ferrous iron is the dominant species in wells 1, 2, and 3 under Fe(III)-reducing conditions (Figure 7B). Fe(III)-oxyhydroxides represent the stable phase in well 4 under oxic conditions. Table 3 shows calculated saturation indices (SI = log Q/K) of various Fe and Mn oxides in groundwater. The results indicate that the dominant amorphous Fe-oxyhydroxides in fluvial sediments are highly under-saturated in well 1, well 2, and well 3, thus bacteria mediated Fe(III) reduction will lead to high-Fe water. Amorphous Fe-oxyhydroxides may convert to more thermodynamically stable phases such as hematite, goethite and magnetite over geologic time. The saturation index for arsenian-pyrite and arseno-pyrite is too negative in well 4, well 2, and well 3. However, from the increasing trend of SI values along the groundwater flow path, it can be predicted that further downgradient, in the sulfate-reducing zone, the saturation index becomes positive for arsenian-pyrite as it is precipitating there. Saturation indices for Mn solid phases (i.e., pyrolusite, bixbyite, hausmannite) are also strongly negative, indicating under saturation. Field Eh-pH data indicate that aqueous Mn(II) is the dominant Mn species in the groundwater. A lower Mn concentration is observed in well 4, where Mn-oxyhydroxides likely form under oxic conditions.

Table 3.
Calculated saturation index (SI) for the groundwater sample from the wells.
4.4. Oxidation Reduction Sequences
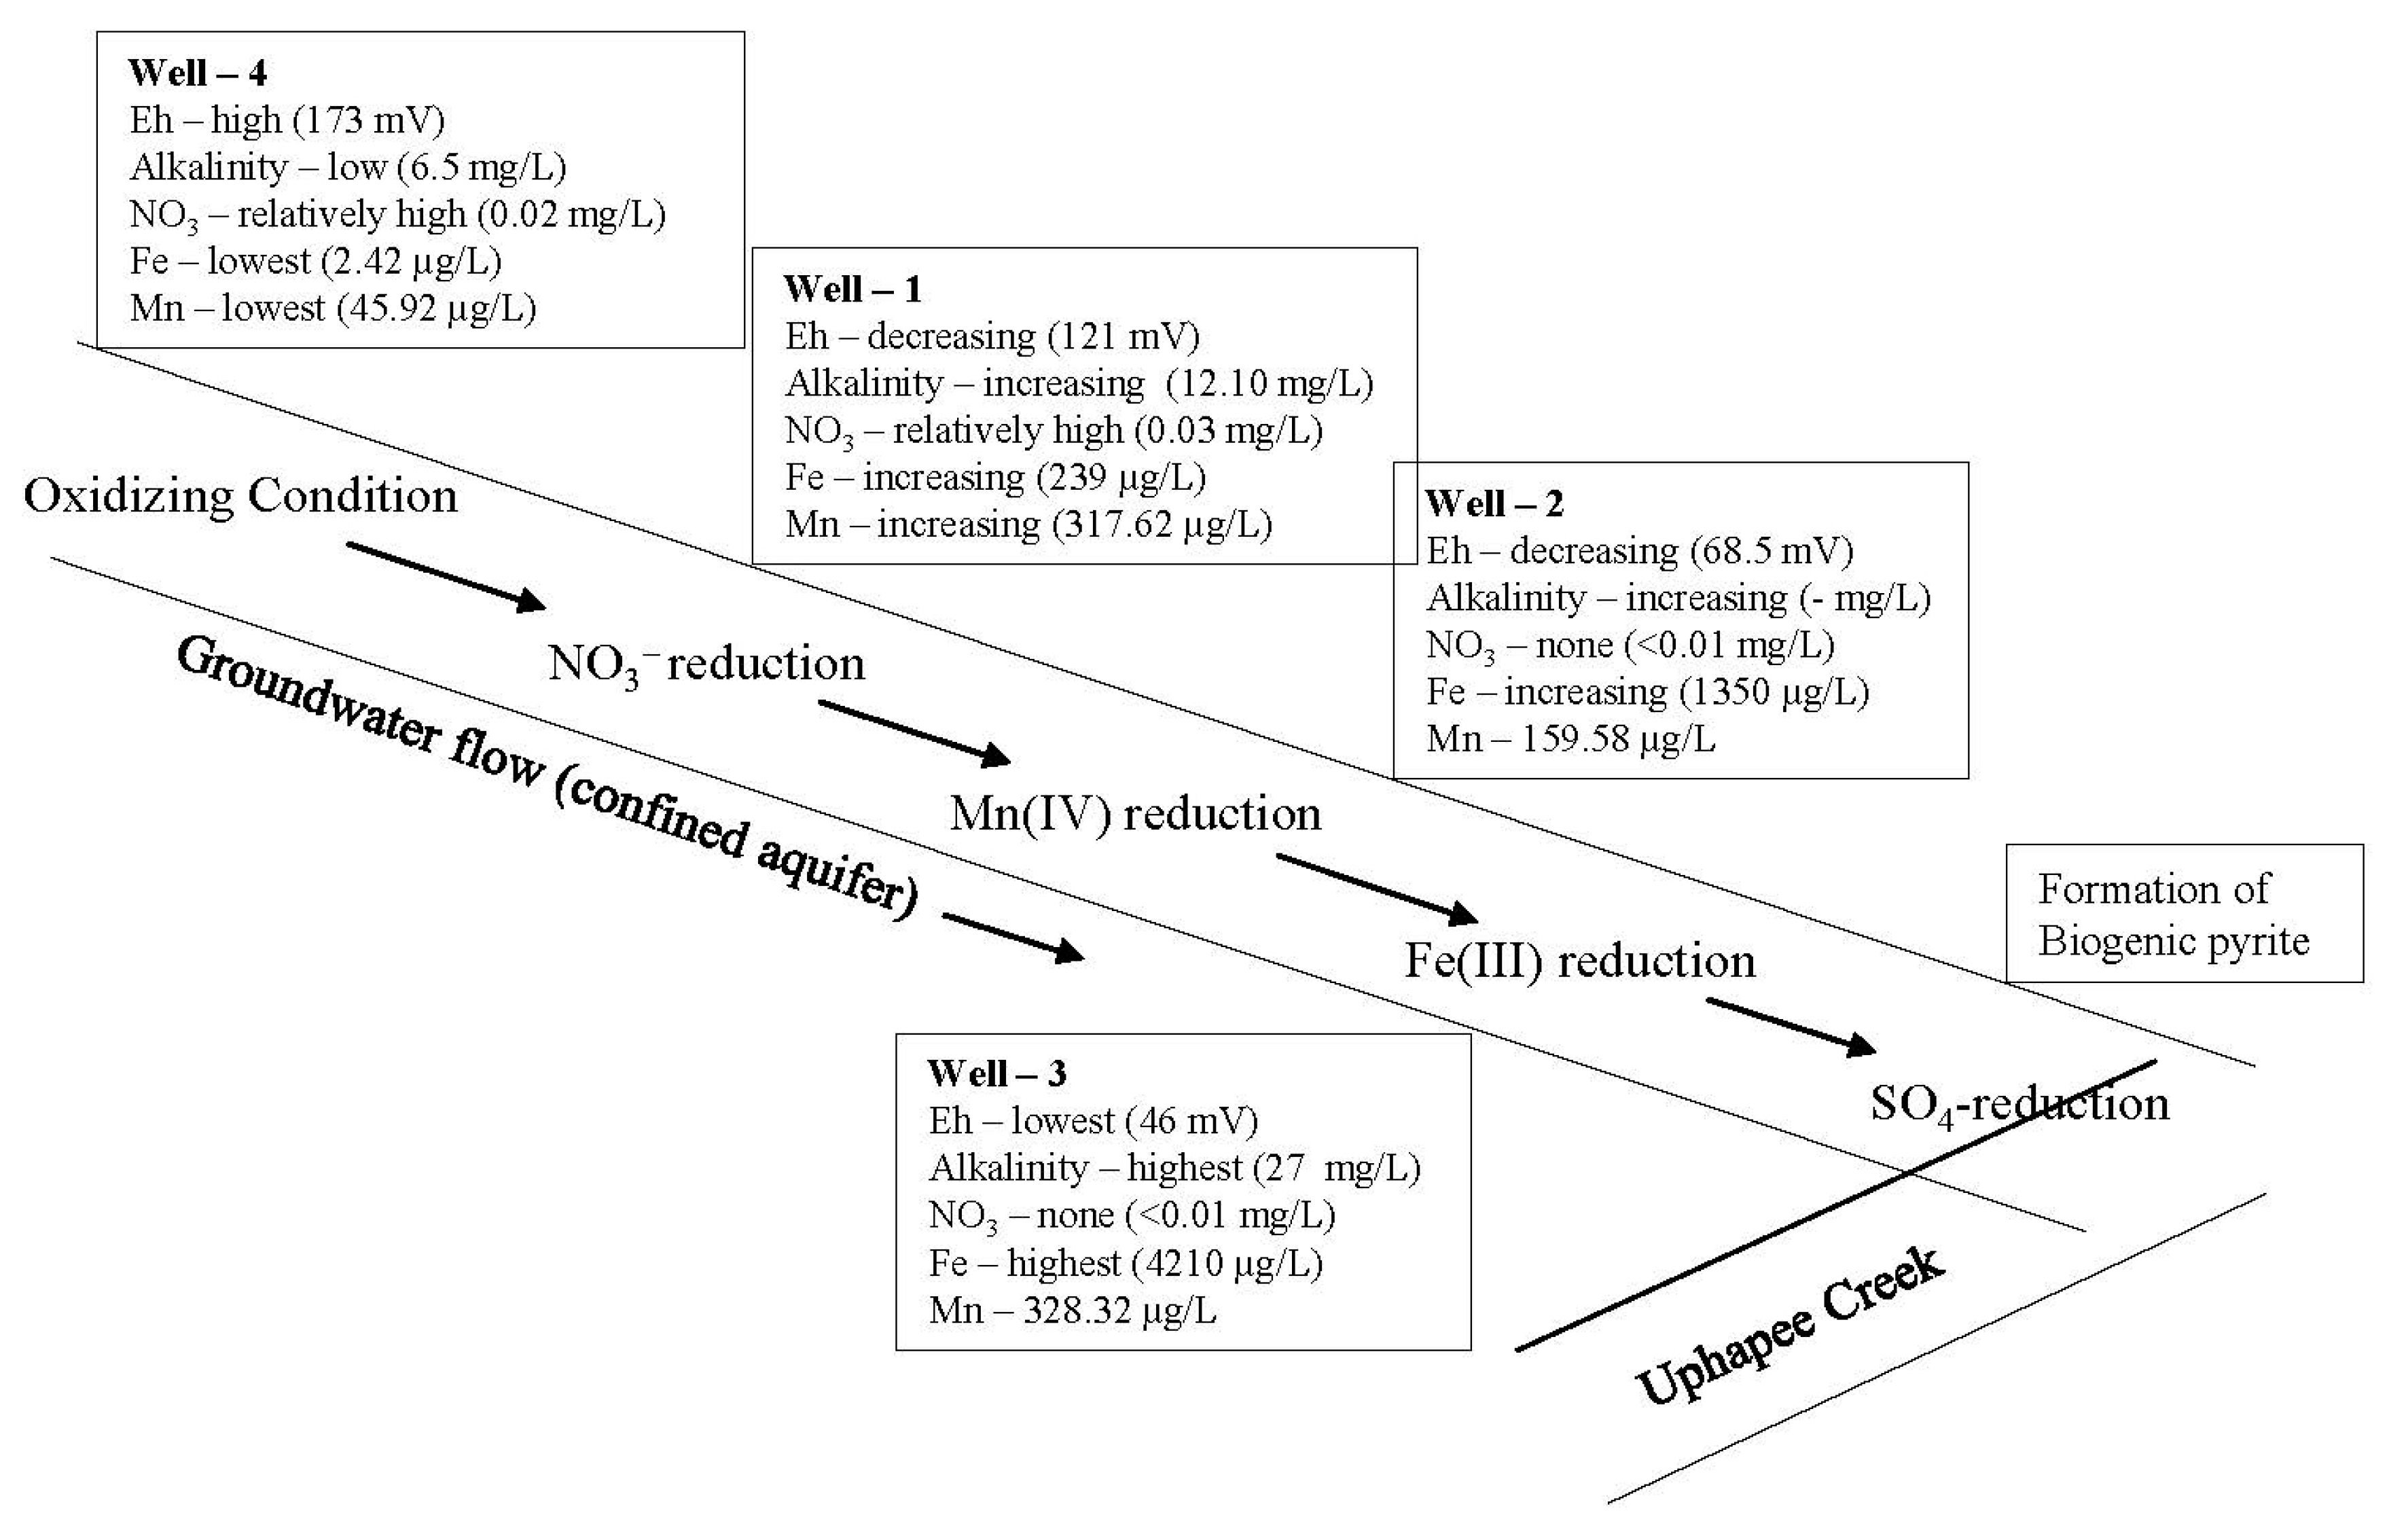
A sequence of redox reactions is likely in natural groundwater in confined aquifers as the groundwater migrates from recharge zones to areas of discharge [52,53,54]. As the reactions proceed downgradient, usually the redox potential (Eh) of the groundwater decreases and alkalinity increases [52,53,54]. These variations in Eh and variations in concentrations of elements with variable oxidation states (e.g., oxic, nitrate reduction, manganese reduction, iron reduction, sulfate reduction, and methanogenesis) can be accounted for by a sequence of oxidation reduction reactions occurring in groundwater flow systems [52]. A similar oxidation reduction sequence has been observed in the fluvial confined aquifer system of the Uphapee Creek watershed (Figure 8) [55]. Oxic conditions were observed in well 4 (Eh = 173 mV) where natural organic matter is being decomposed and oxygen is the dominant terminal electron acceptor. The measured alkalinity was 6.50 mg/L. Well 4 groundwater contains a notable concentration of NO3− (0.02 mg/L) and a very low concentrations of Fe (2.42 µg/L) and Mn (45.92 µg/L). As the groundwater moves downgradient and the nitrate is removed by denitrification (<0.01 mg/L), the aquifer becomes more reducing. A significant increase in Mn (317 µg/L) concentration, and alkalinity (12.10 mg/L) was observed in well 1. Well 1 is probably located in an overlapping zone of NO3− and Mn(IV) reduction. Fe(III)-reducing conditions in well 2 and well 3 are evident from high iron concentrations (1350.60 and 4210.04 µg/L, respectively), high alkalinity (up to 27 mg/L), and relatively low Eh (68 and 46 mV, respectively). Fe(III)-oxyhydroxides were reduced and ferrous iron as well as sorbed As is released into groundwater by bacterial iron reduction. Further downgradient from the iron-rich zone, ferrous iron reacts with H2S generated by bacterial sulfate reduction to form biogenic pyrite in the sulfate reduction zone.
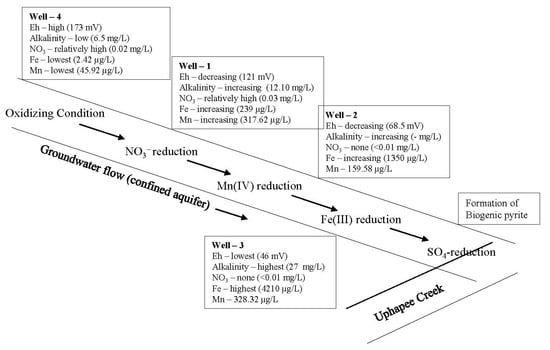
Figure 8.
Oxidation reduction sequences in the Uphapee Creek fluvial groundwater flow.
4.5. Laboratory Analysis of Biogenic Pyrite
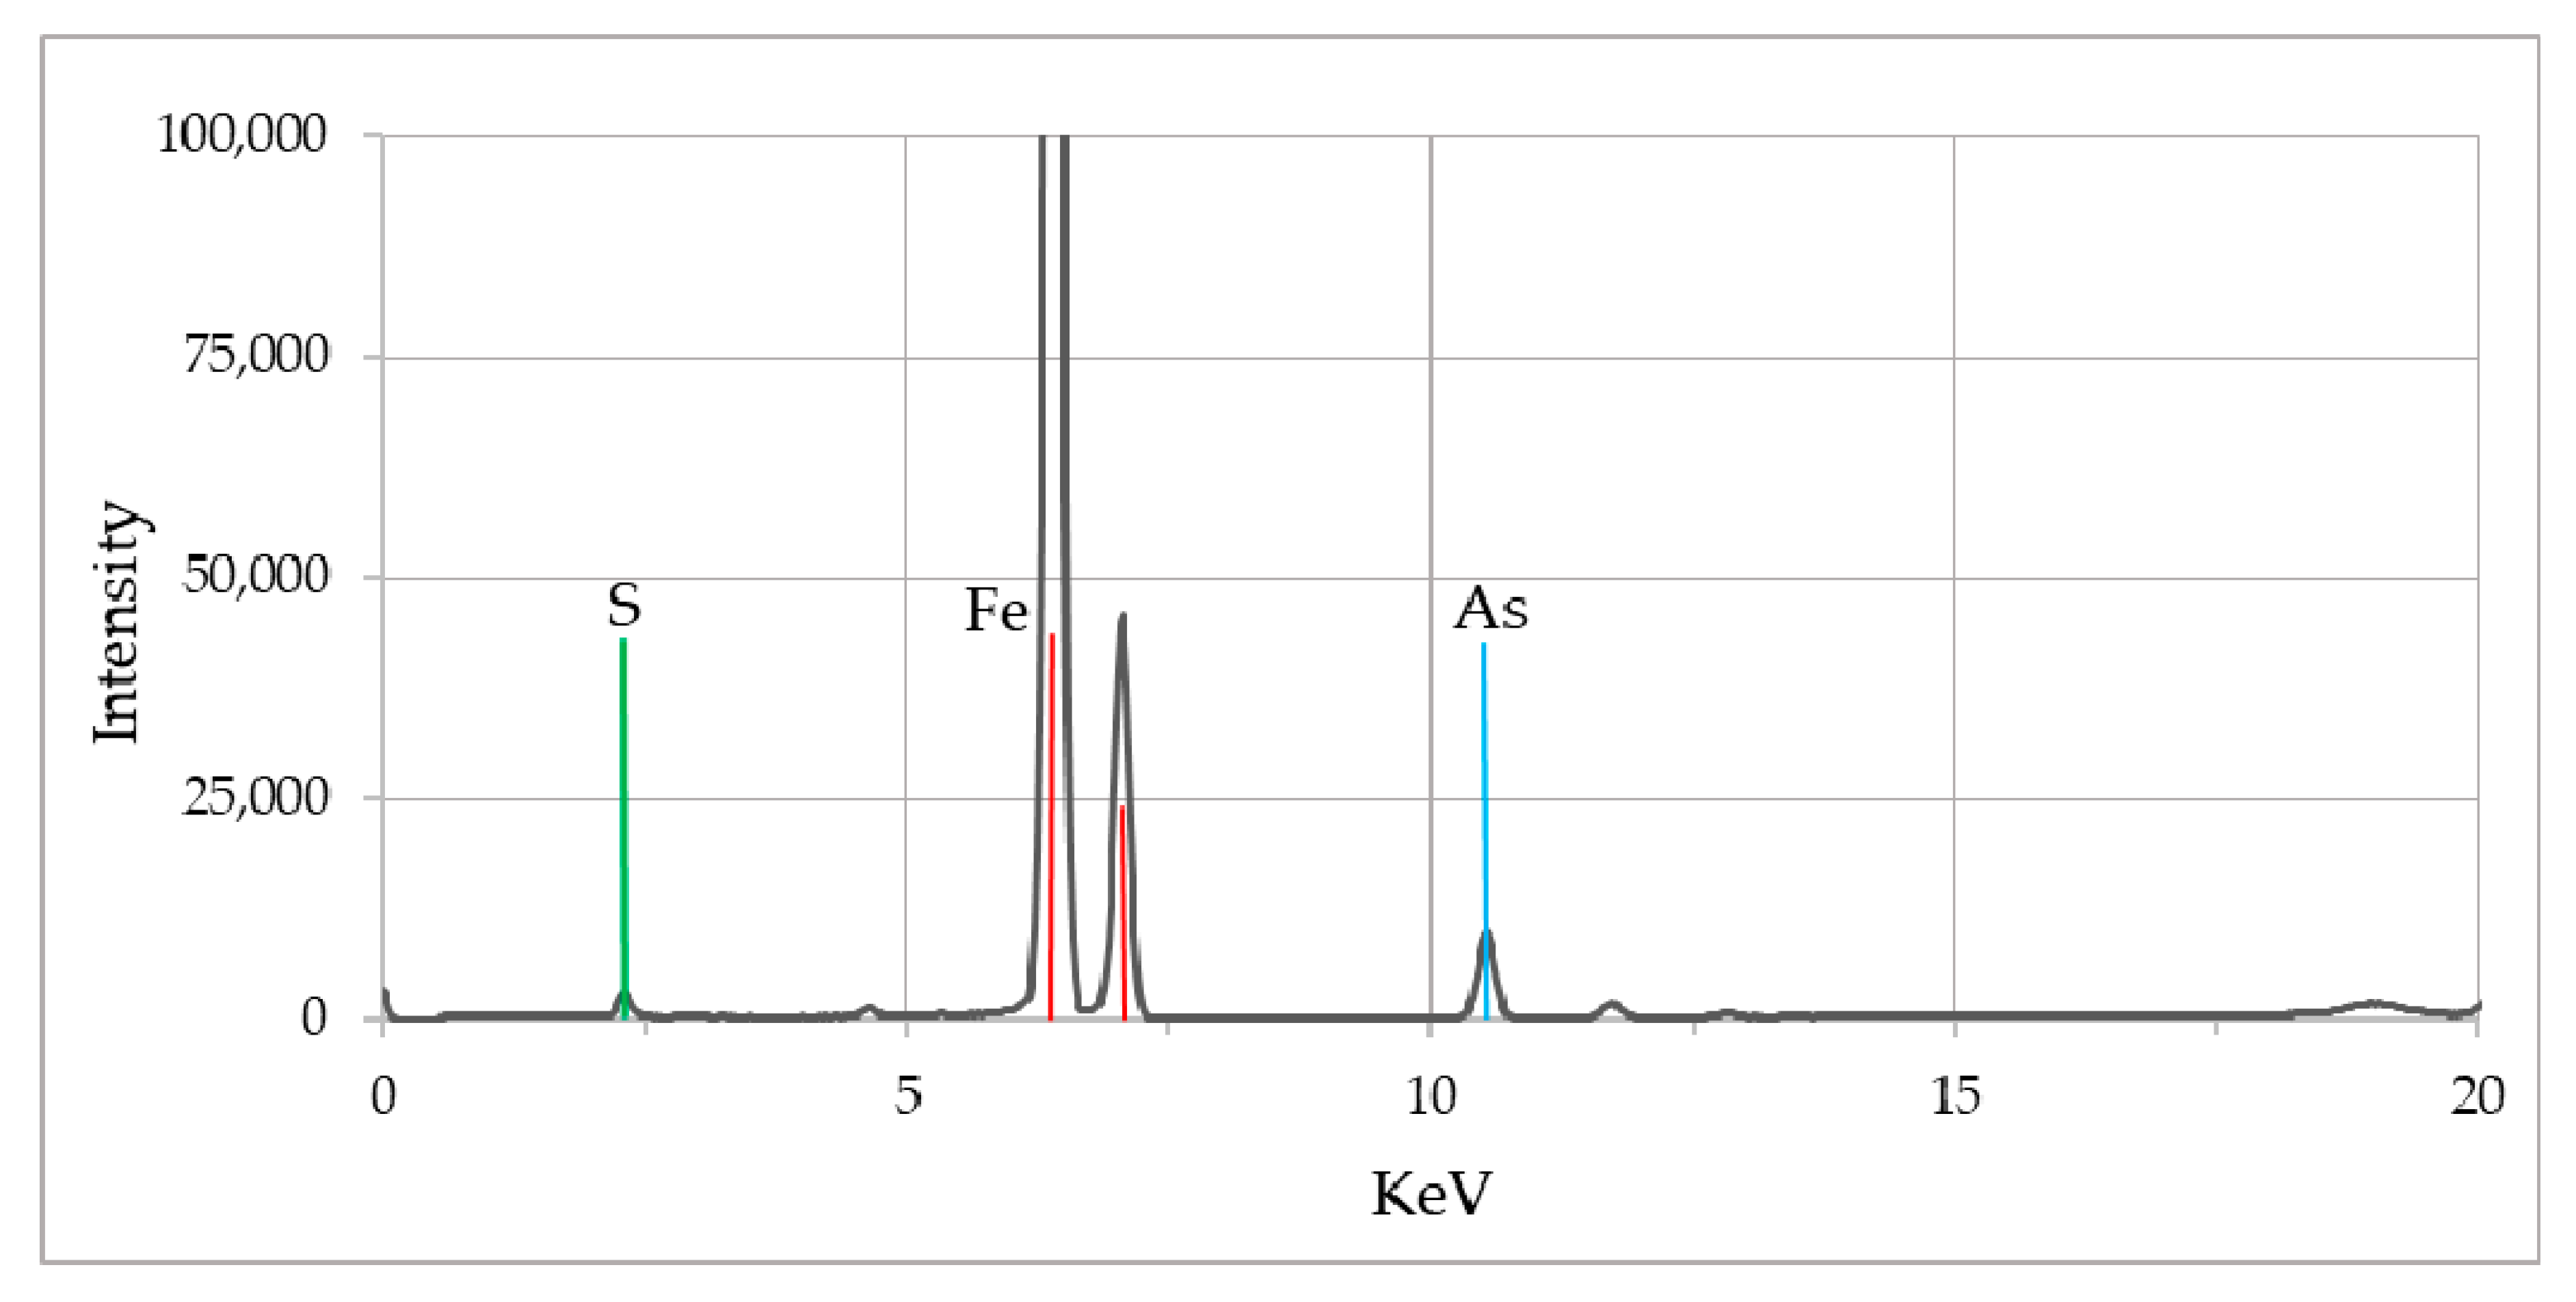
The X-ray fluorescence (XRF) analyses of lignitic wood material (from wells), as well as pyrite samples were conducted to assess the overall chemical composition including the trace elements. In the XRF spectrum (Figure 9) peaks for iron, sulfur and arsenic were clearly observed. Though both lignitic wood and pyrite provided similar spectra, pyrite samples showed a much stronger peak for sulfur and arsenic compared to the lignitic wood.
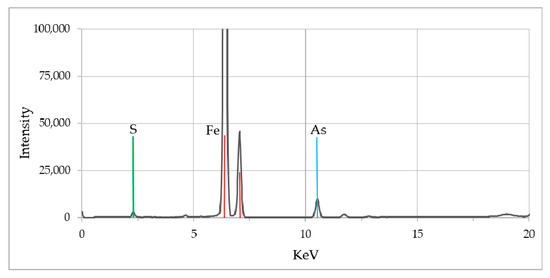
Figure 9.
XRF spectrum of biogenic pyrite samples collected from the fluvial system. The peaks represent presence of As, S, and Fe elements in the solid phase.
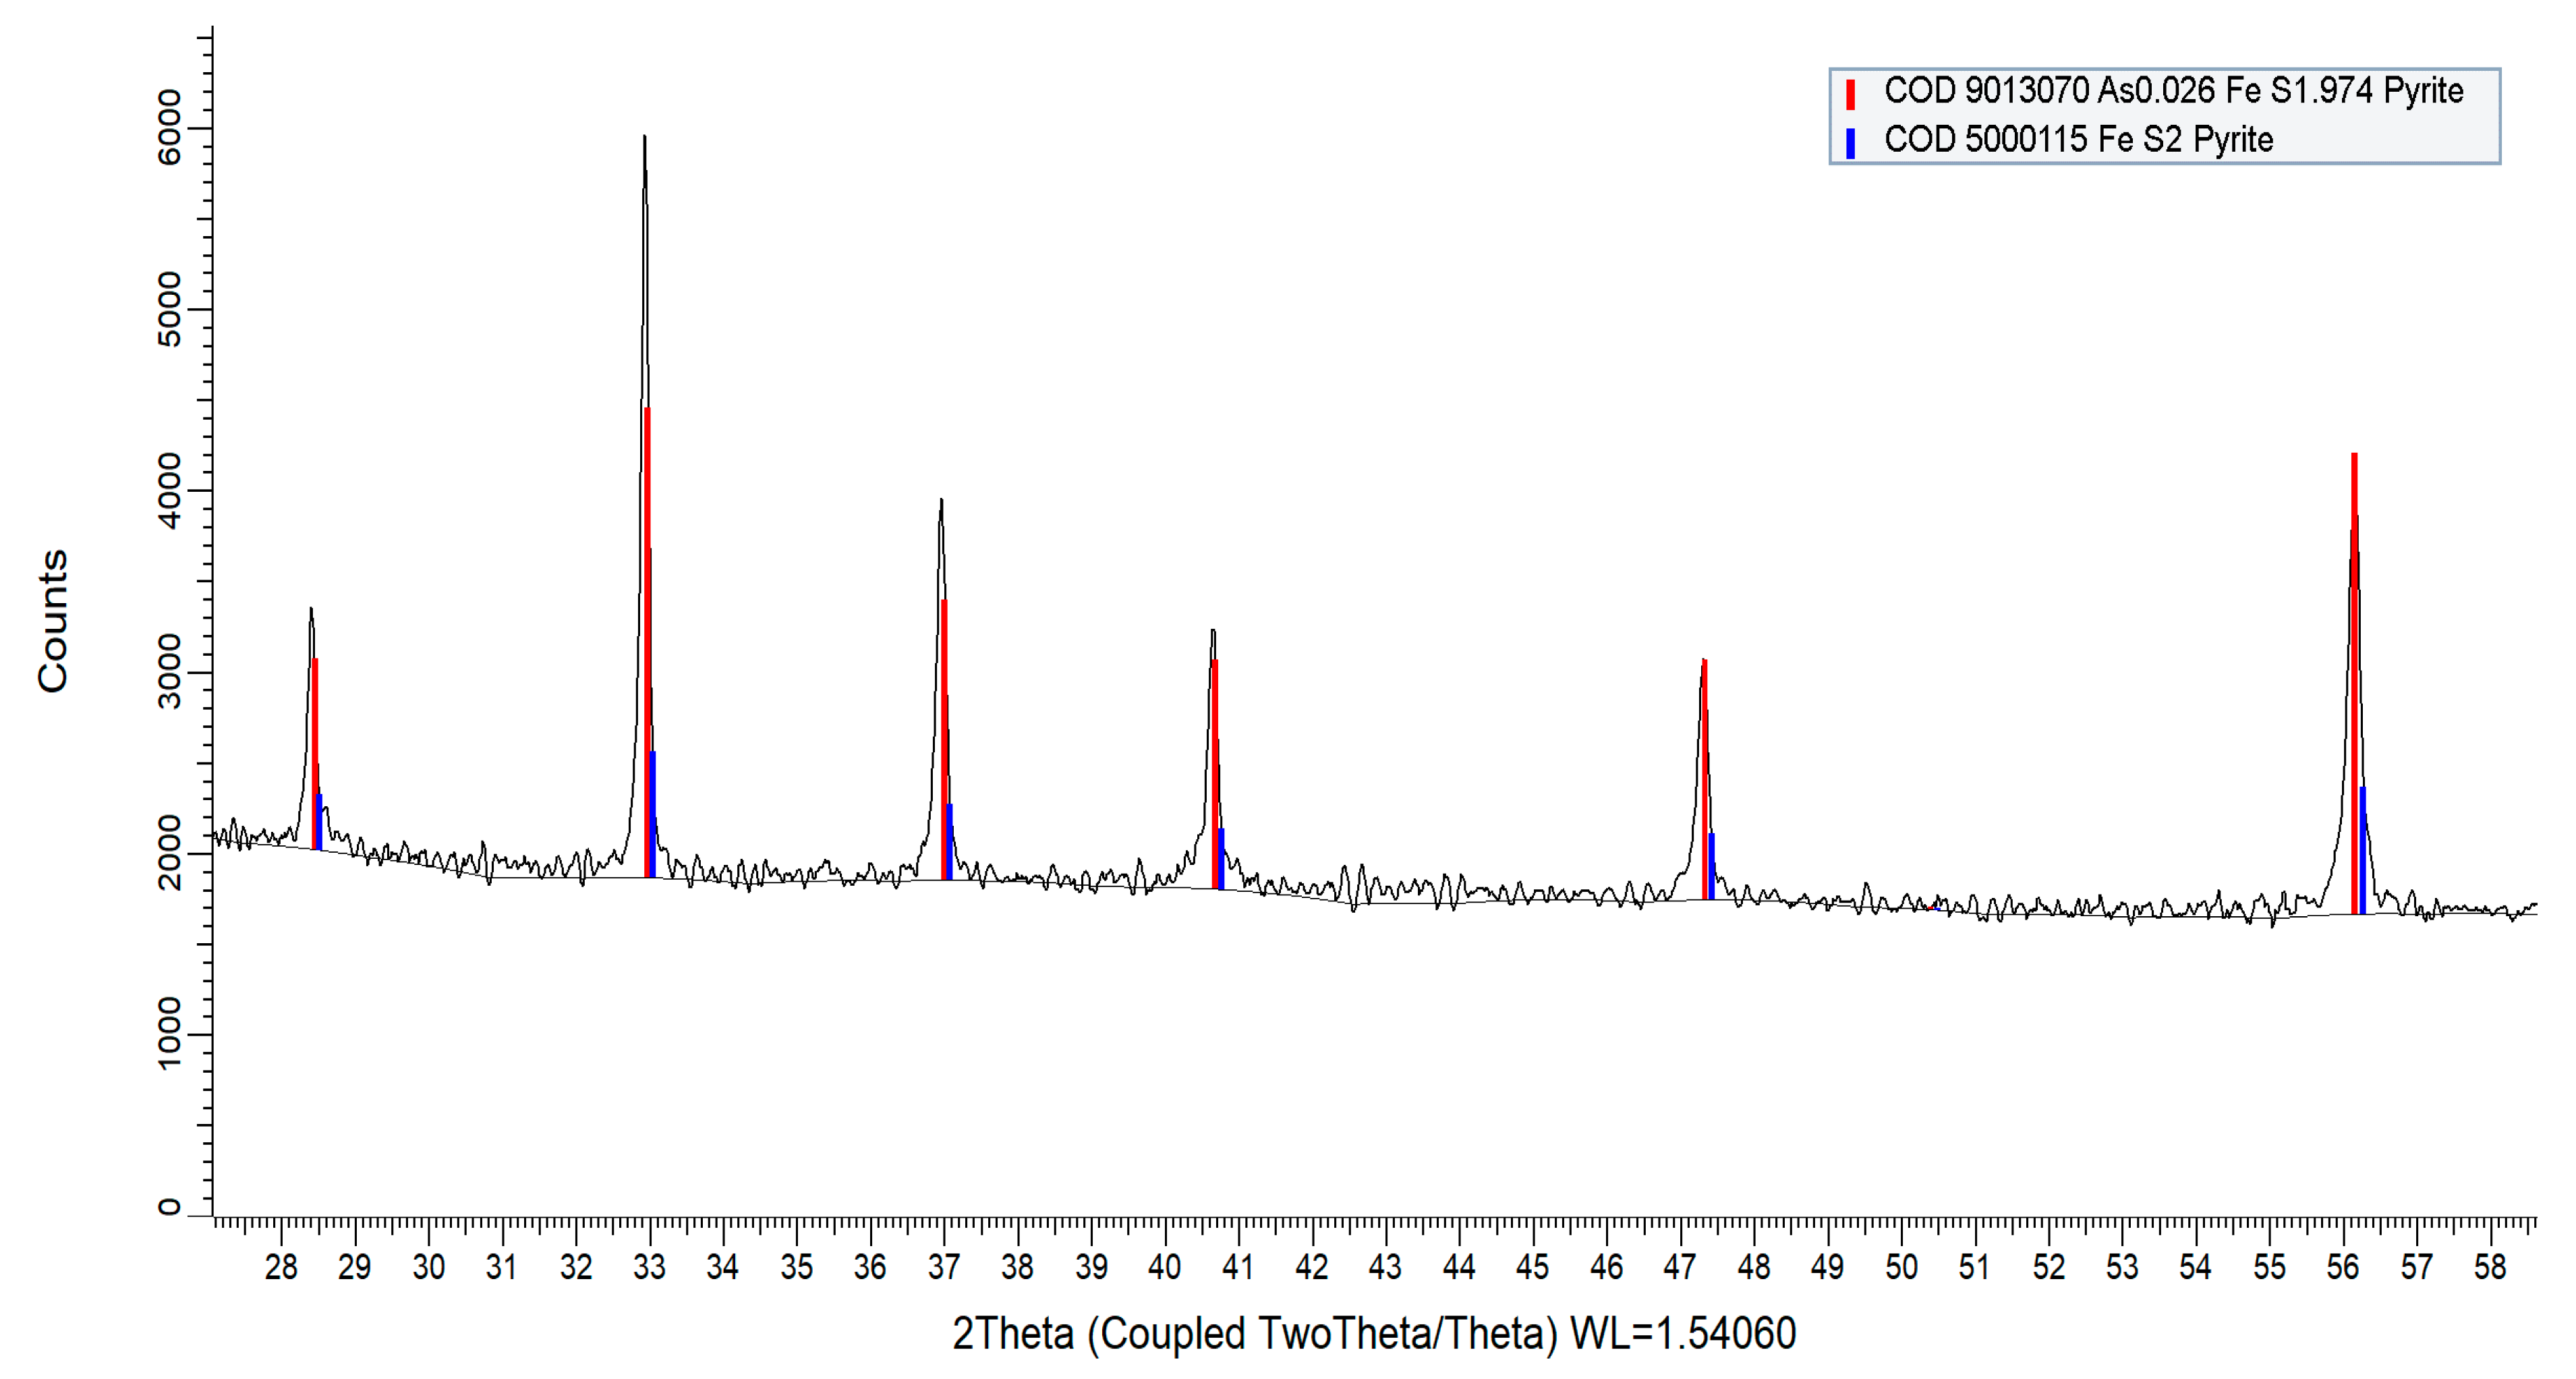
The X-ray diffraction (XRD) analyses confirmed that pyrites samples are naturally formed arsenian-pyrite. The XRD spectrum of the pyrite samples (Figure 10) showed that peaks closely match with arsenian-pyrite (at 2θ = 28.5°, 33.0°, 37.0°, 40.7°, 47.3°, and 56.2°) as reported for lignite from the Czech Republic [56]. The peaks match with peak positions of pure pyrite (COD 5000115, COD 9013069) and arsenian-pyrite (COD 9013070) according to the crystallography open database (COD).
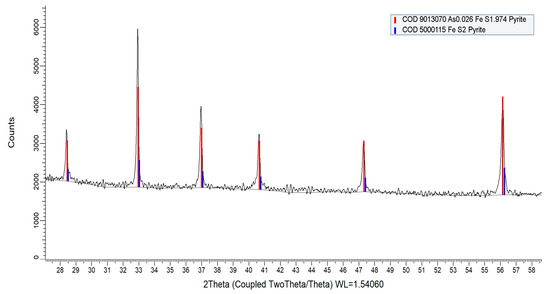
Figure 10.
XRD spectrum of biogenic pyrite samples collected from the fluvial system. Major peaks are located at 2θ = 28.5°, 33.0°, 37.0°, 40.7°, 47.3°, and 56.2° that closely match with pure pyrite—COD 5000115, COD 9013069 (not shown) and arsenian-pyrite—COD 9013070.
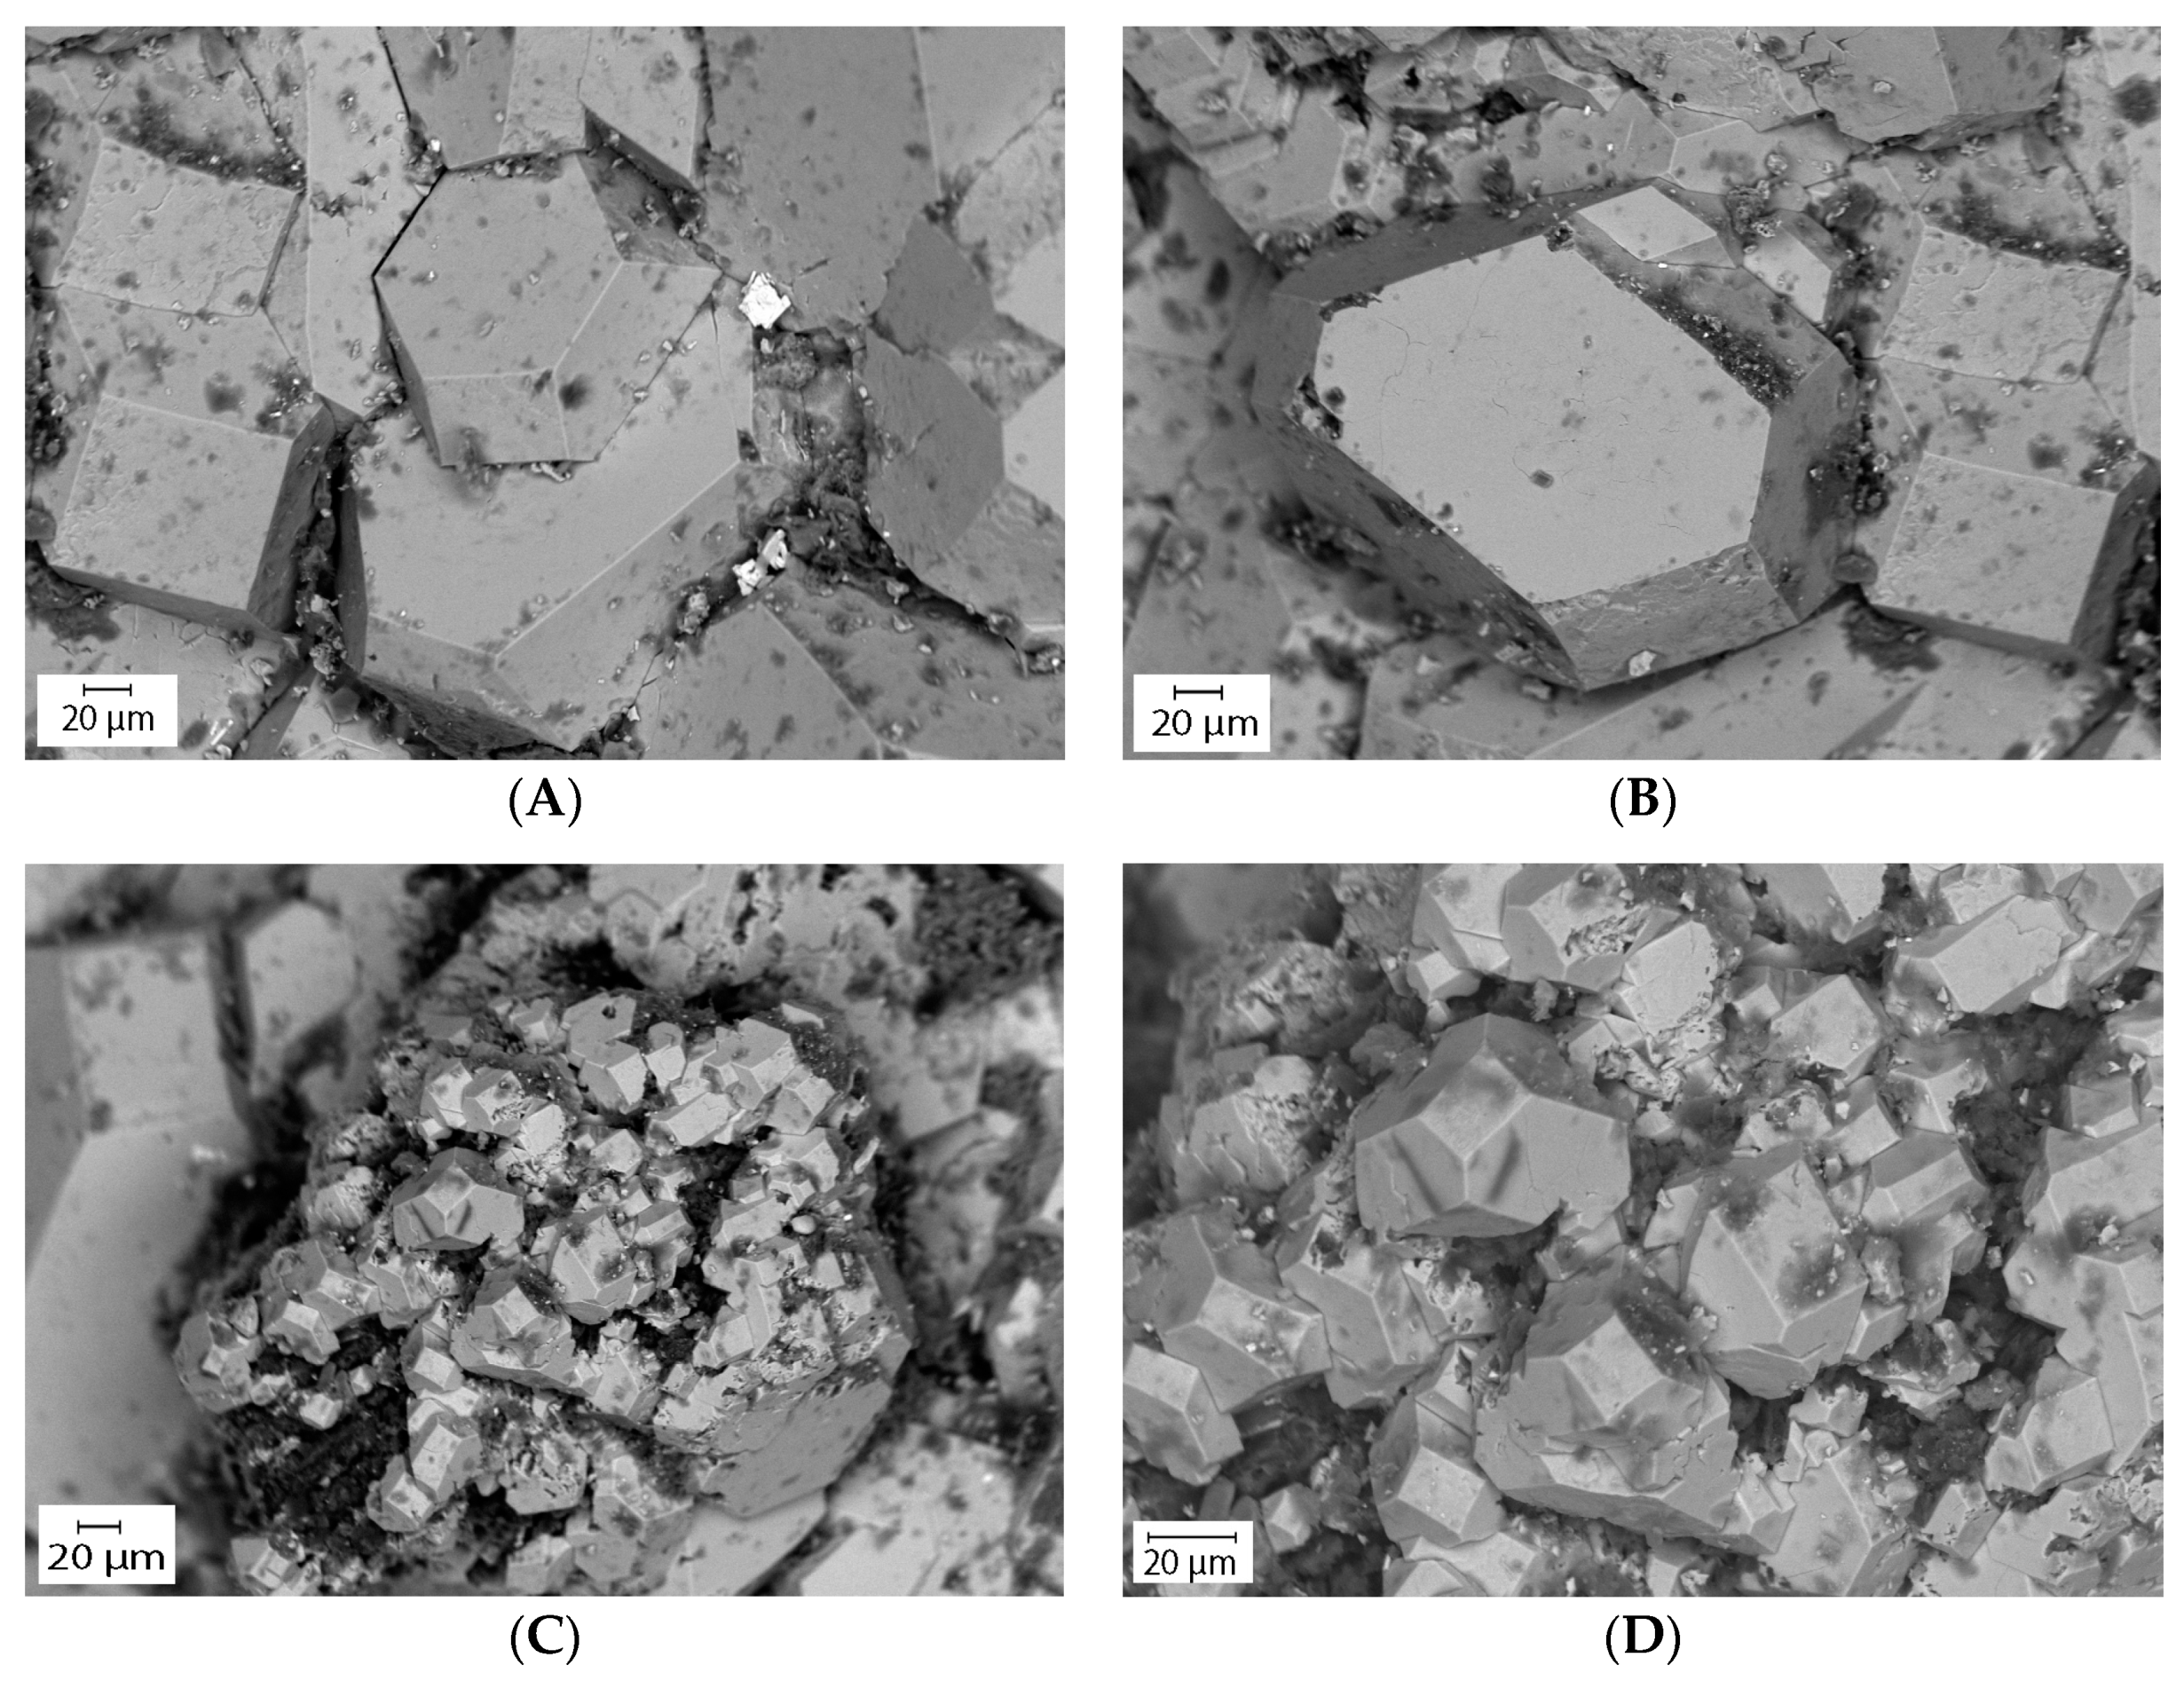
The Scanning Electron Microscope (SEM) connected with an Energy Dispersive Spectroscopy (EDS) provided a quantitative elemental composition of the pyrite grains. The elements were identified from the peaks in the spectrum. The spectrum showed the presence of various elements including iron, sulfur, arsenic, cobalt, and nickel. The results showed that the pyrite grains contain trace elements 0.17 wt.% of As, 0.19 wt.% of Co, 0.15 wt.% of Ni, and 0.18 wt.% of Al in oxide forms (Table 4). The concurrent SEM-EDS peaks of Fe, S, and As and XRD results confirmed that the solids are arsenian-pyrite rather than pure pyrite. Besides As, other trace elements such as Co and Ni are also sequestered into biogenic pyrite. The As concentration of biogenic pyrite observed in the SEM analysis is consistent with the result from the EMP analysis (see next section), suggesting its excellent capacity for As sorption. The ICP-MS analysis of the groundwater showed that measurable amounts of As, Co, and Ni are present in the groundwater (Table 1 and Table 2). The results are also compatible with the previous study by Saunders et al. [17]. The SEM imaging analysis provided more detail about the morphologies (shape and size) of the pyrite crystals. The analysis showed that most of the pyrite grains are euhedral (i.e., cubes, octahedrons) shaped large crystals (20–200 µm) and formed as individual grains (Figure 11A,B). Relatively smaller (20–30µm) pyrite grains were also observed which formed as non-framboidal aggregates (Figure 11C,D) and have a morphology similar to the large crystals. Individual pyrite crystals were reported as large as 1.50 cm by Saunders et al. [17]. Microcrystalline spherical aggregates or pyrite framboids (which usually forms very quickly (in days) by biostimulation [57]) were not found. Though the age of the pyrite grains was not analyzed, from the size of the grains and lack of framboids, it was assumed that it took a long time to develop the large crystals under the conditions in situ.

Table 4.
Elemental composition of the pyrite grains.
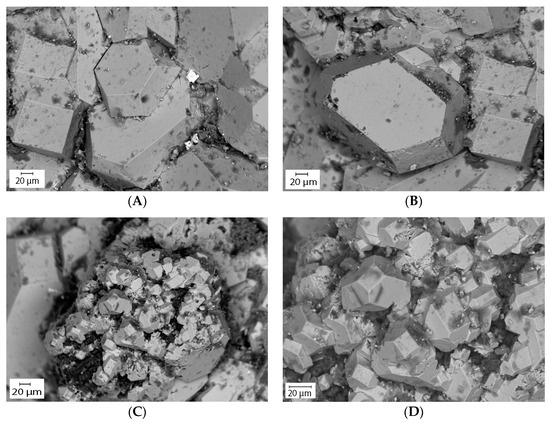
Figure 11.
Scanning electron microscope (SEM) backscatter image of naturally formed biogenic pyrite. (A,B) Pyrite grains formed as large (20–200 µm) euhedral-shaped (i.e., cubes, octahedrons) individual crystals, and (C,D) relatively smaller (20–30µm) non-framboidal aggregates.
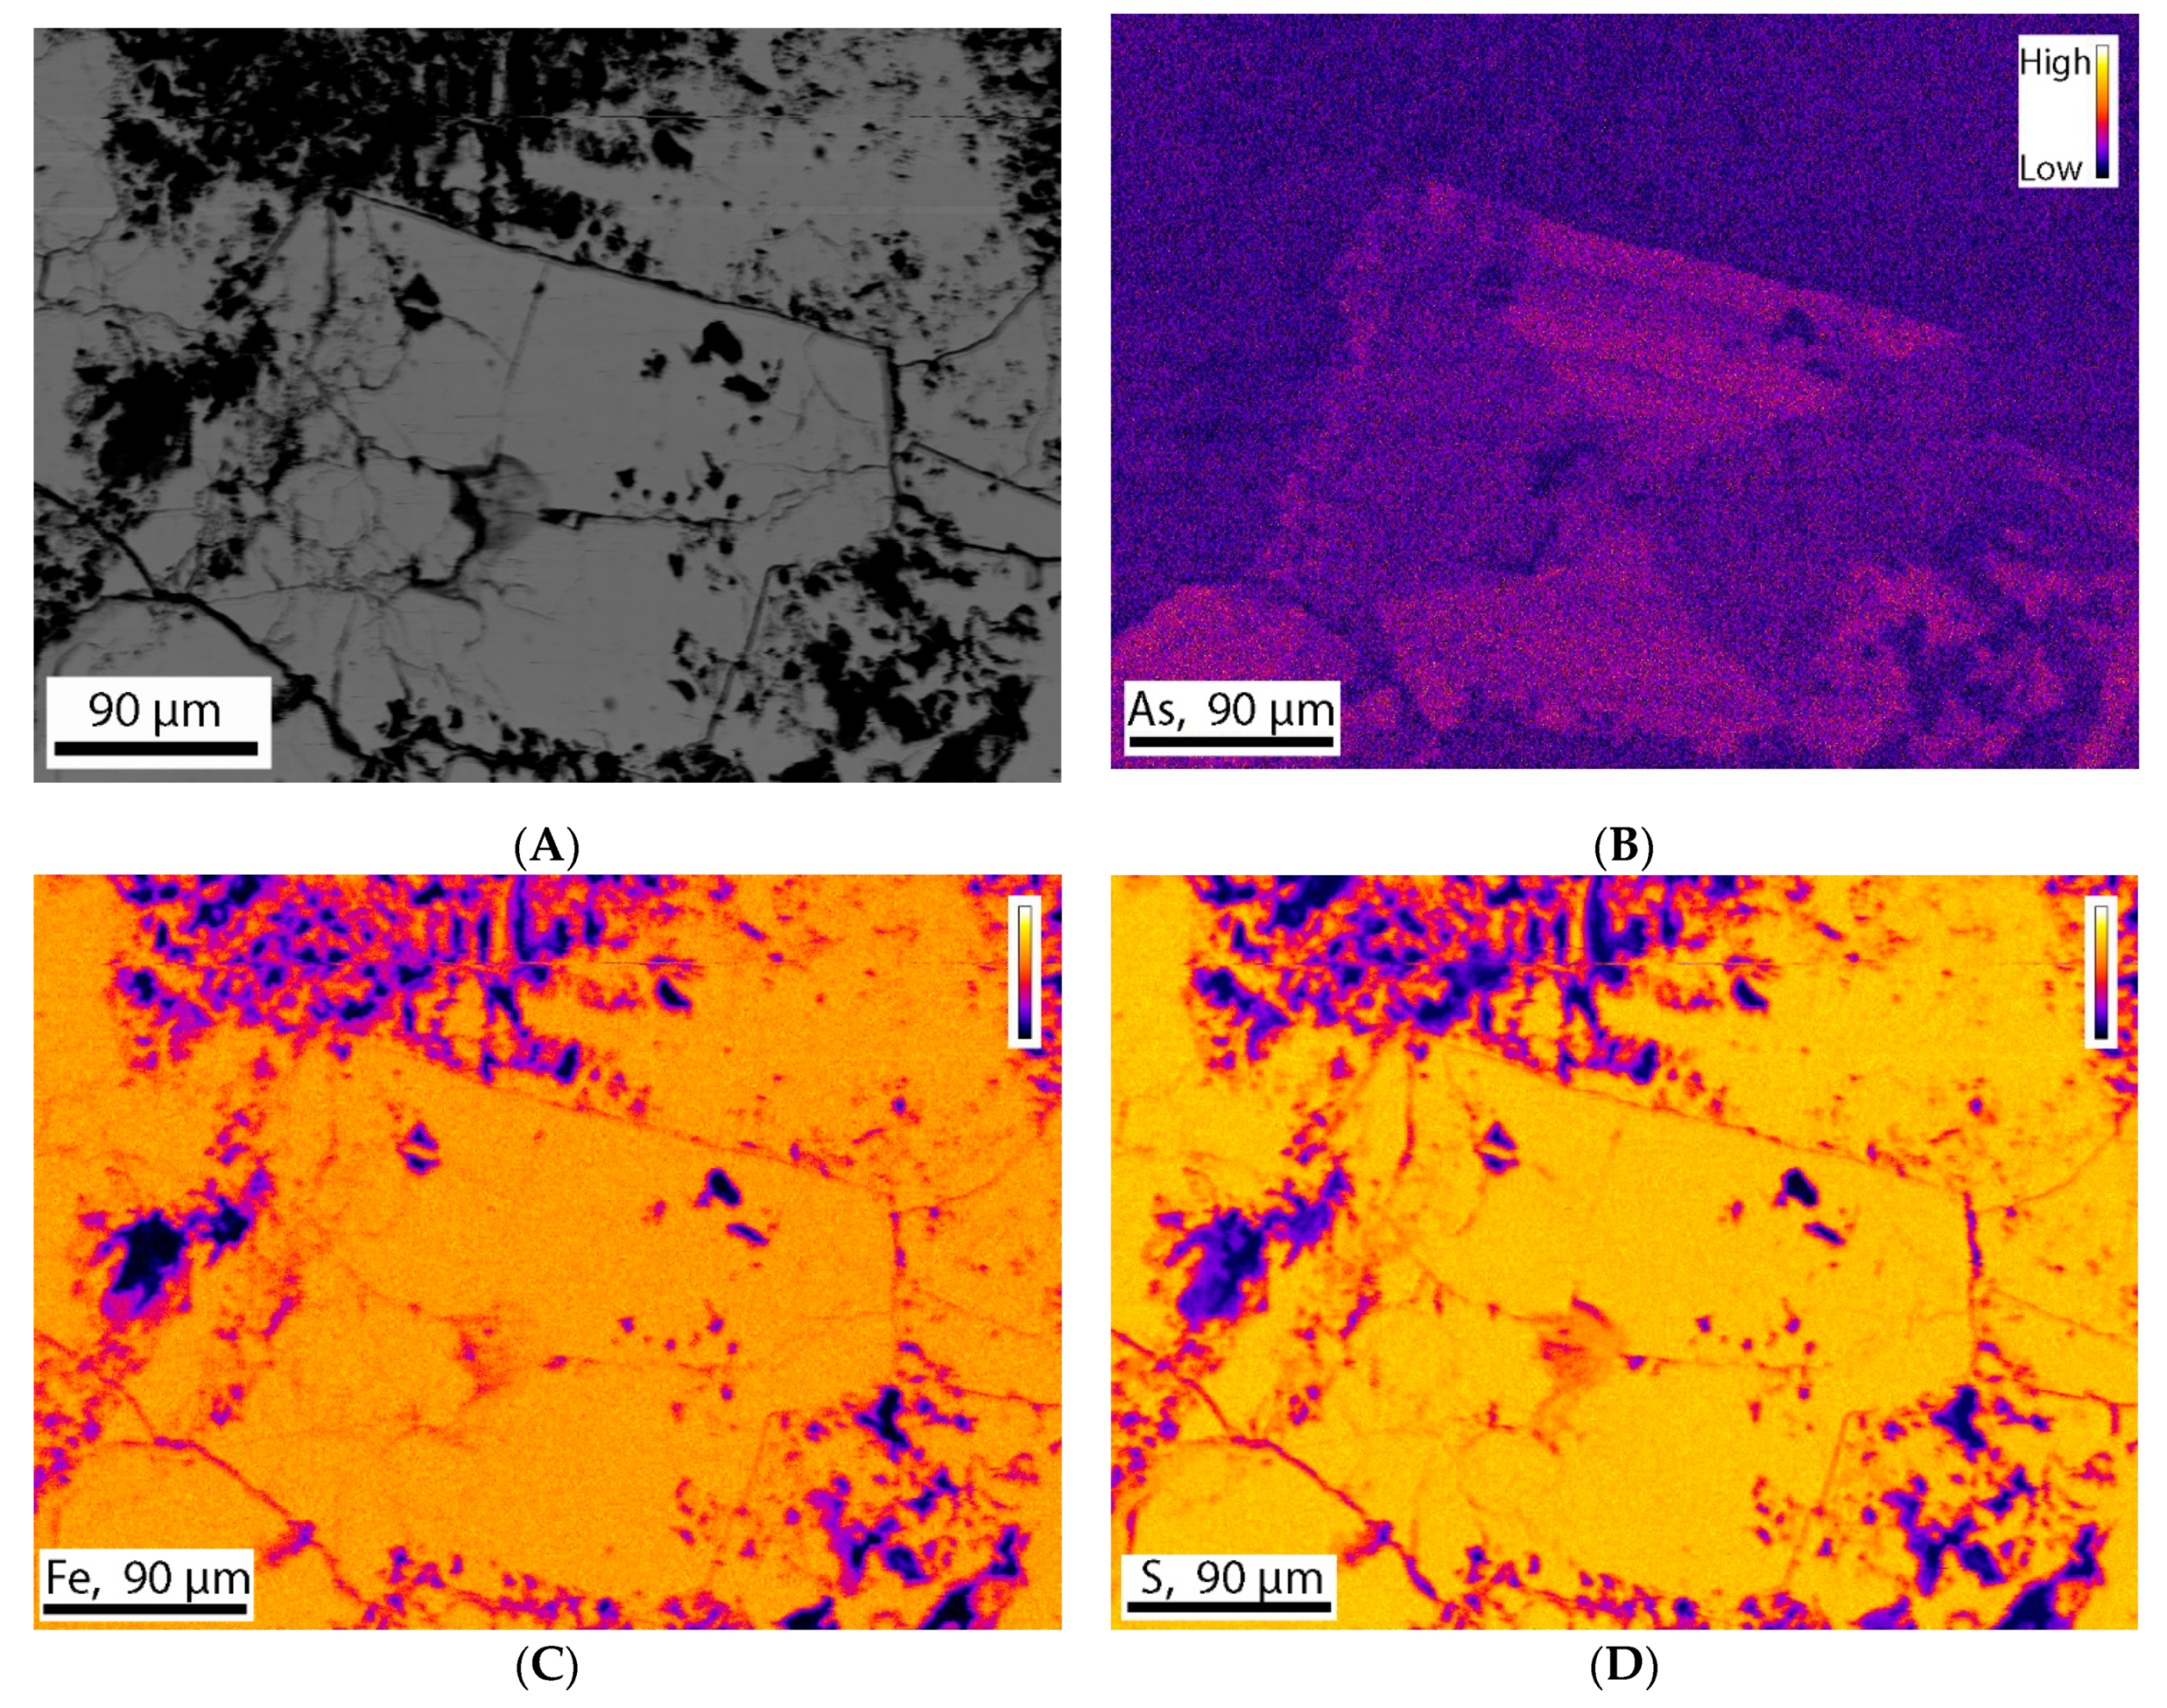
Electron Microprobe (EMP) analysis of three polished thin sections was conducted to obtain quantitative measurements of the abundance of individual elements. Arsenic was the main element of interest in this study. The standards were used for the quantification of As, Fe, S, and Si. The results show that most of the pyrite grains contain 0.20–0.92 wt.% of As. The results are consistent for each thin section and consistent with SEM-EDX results. The standards used do not allow quantification of other trace elements such as Co and Ni. Backscatter images were taken for different pyrite grains (Figure 12A). Elemental maps for As, Fe, S, and Si were also taken to visualize the compositional variation across the grains. The elemental maps showed that silicon is rarely present, whereas sulfur and iron is present in great amount and equally distributed all over the grains (Figure 12C,D). The molar ratio calculated from the data obtained from electron microprobe analysis indicated that sulfur and iron were present at a 2.09:1 ratio, consistent with the stoichiometry of pyrite (FeS2). Arsenic elemental maps showed different types of distribution. In some grains, As is equally distributed all over the grain. On the other hand, in some grains it is distributed in different patterns such as zoning (Figure 12B).
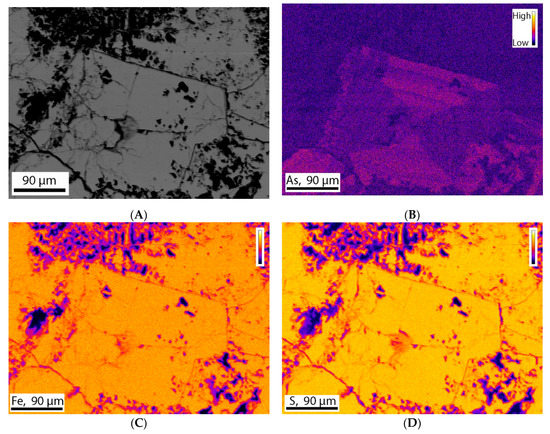
Figure 12.
Stage raster photomicrograph (BSE image) of a pyrite grain. This grain contains 0.92 wt.% of As. This image was taken at 250 magnification, 0.227 µm pixel size, 1000 pixel/line using an instrument setup of 15 KV voltage and 50 nA current. (A) Backscatter image of the pyrite grain, (B) Elemental map showing As is present as trace element and distributed in different pattern such as Zoning, (C,D) Elemental map showing presence of iron and sulfur in significant amount and equal distributed all over the grain.
5. Discussion
In shallow and deep groundwater systems, formation of biogenic iron sulfide minerals has been well documented [17]. In contrast, much less is known about these mineral’s capacity to adsorb or co-precipitate trace elements in different environments. Under sulfate-reducing conditions, trace elements can be incorporated into sulfide minerals such as pyrite or form separate metal sulfide phases when reacting with biogenic H2S. Under oxic conditions, Mn- and Fe-oxidizing bacterial activity controls biogeochemical reactions and favors precipitation of ferromanganese coatings on stream sediments [17]. These ferromanganese coatings adsorb or coprecipitate trace elements such as Fe, Mn, and others that are present in stream waters. These trace elements are released into the aquifer again due to reduction and dissolution of ferromanganese coatings mediated by Mn- and Fe-reducing bacteria. Biogenic pyrites are formed by the activity of sulfate-reducing bacteria within the favorable environment around the wood fragments or other organic matter.
The occurrence of As-, Co-, and Ni-bearing authigenic large pyrite crystals is documented in a shallow alluvial aquifer in the Uphapee watershed [17]. A close association between the pyrite grains and groundwater indicated by the co-occurrence of similar trace elements, such as As, Co, Ni etc. In groundwater As concentration is as low as <2 µg/L, and it is less abundant than cobalt or nickel. In pyrite grains As is more abundant than other trace elements. Electron microprobe and SEM-EDS analyses indicate that the As content in pyrite grains is 0.20–0.92 wt.%. This result is consistent with the study of Saunders et al. [17] that found 0.60 wt.% (6000 mg/kg) As. From the results it is also evident that not only As but also other trace elements (i.e., Co and Ni) were co-precipitated in pyrite.
Pyrite formed within or in proximity to the lignitic wood fragments. This suggests that wood fragments were one of the major sources of organic carbon required by the sulfate-reducing bacteria. Framboidal pyrite framboid is one of the most abundant mineral textures of pyrite in the natural environment, however, it was not observed in the pyrites examined in this study. Pyrite framboids on average take a few hours to 5 days to form [57]. The general coarse-grained euhedral pyrite crystals and the lack of framboidal pyrite suggested that pyrite formation was a relatively slow process in our fluvial setting.
Discrete zones of high-iron and high-manganese groundwater occur in the Holocene fluvial sediments in the Macon County study area. Various terminal electron accepting processes (TEAP’s) in separate redox zones (i.e., Mn(IV)-reducing, Fe(III)-reducing, sulfate-reducing, methanogenesis) during the degradation of organic matter in sediments, are responsible for producing these discrete geochemical zones [58]. The redox potential of groundwater usually decreases along the flow path [59,60]. The consumption of free oxygen by microbial aerobic respiration is followed by reduction of NO3–, reduction of MnO2, and then reduction of iron oxides.
The groundwater in well 4 is under oxidized condition (Eh = 173 mV), and oxygen is the dominant TEAP and dissolved Fe and Mn concentrations are very low. Downgradient well 1 has relatively lower Eh (121 mV) but significantly higher Mn concentration (317 µg/L) and relatively high alkalinity (12.10 mg/L). Mn may be released into the solution by the following Mn (IV) reduction reaction (Equation (2)):
CH2O + 3CO2 + H2O + 2MnO2 → 2Mn2+ + 4HCO3−
This reaction (2) would increase the alkalinity (in the form of HCO3−) in groundwater. Further down-gradient, high iron groundwater in well 2 (Eh = 68 mV) and well 3 (Eh = 46) indicates a shifts into Fe(III)-reducing conditions, where Fe(III)-oxyhydroxides are reduced, and ferrous iron is released into groundwater by bacterial iron reduction.
This reaction (Equation (3)) will also elevate alkalinity and release As sorbed by Fe(III)-oxyhydroxides. This mobilization process leads to widespread groundwater As contamination in Holocene fluvial aquifers worldwide [47]. Dissolved As concentrations in the Macon County study area (<2 µg/L), however, are significantly lower than those in Bangladesh and West Bengal, India (where As concentrations are typically hundreds of µg/L). We propose that, with the long flushing time in our study area, only a small amount of As remains sorbed to Fe(III)-oxyhydroxides, which, combined with strong a hydrologic gradient (transport dominated system), leads to the observed low concentrations of groundwater As. However, further study of As concentrations on the surface of Fe(III)-oxyhydroxides is needed for a more definitive assessment.
CH2O + 7CO2 + 4Fe(OH)3 → 4Fe2+ + 8HCO3− + 3H2O
High iron concentration (>300 µg/L) is a common water quality problem in many coastal plain aquifers [46,61]. The observed close association between dissolved iron and dissolved inorganic carbon (alkalinity) as well as the lack of sulfate consumption indicates that sulfate-reducing bacteria are much less active than Fe(III)-reducing bacteria in this high-iron zone. High iron concentration in groundwater develops only when there is little or no sulfate reduction in the aquifer. Further downgradient from the iron-rich zone, ferrous iron reacts with H2S generated by bacterial sulfate reduction to form pyrite in the sulfate reduction zone.
A recent bioremediation experiment conducted at an industrial site in Florida demonstrated that sulfate-reducing conditions were quickly established by biostimulation one week after the injection of FeSO4 solution and molasses [22]. The redox and geochemical changes were evident from the decreased Eh and increased H2S concentration. The sulfate-reducing conditions led to the formation of arsenian-pyrite and to decrease groundwater As concentration to less than 50 µg/L from the initial concentration of 325 µg/L. Electron microprobe analyses confirmed the amount of sequestered As into arsenian-pyrite ranged between 0.05–0.40 wt.%, similar to the As concentration (0.20–0.92 wt.%) in biogenic pyrite naturally formed in fluvial sediments of Macon County, Alabama. The biostimulation process in Florida allowed rapid formation of well-formed euhedral crystals (1–10 μm diameter) or spherical framboid aggregates (10–50 μm diameter). By contrast, slow bacterial sulfate reduction in fluvial sediments in Alabama produced larger euhedral crystals (tens of μm in diameter) in cubic or octahedral forms (Figure 12A,B).
Thus, active involvement of sulfate-reducing bacteria is evident from both natural and industrial sites. Geochemical analyses indicate that biogenic pyrite removed not only As but also other trace elements such as Co and Ni by co-precipitation and sorption. These studies provide the basis for using biogenic pyrite in sequestering As, Co, Ni and perhaps other trace elements in contaminated groundwater under sulfate-reducing conditions.
6. Conclusions
A redox sequence of oxidation, denitrification, Mn(IV) reduction, Fe(III) reduction, and sulfate reduction was found along the flow path in the fluvial aquifer. Based on the geochemistry data it can be concluded that Fe- and Mn-reducing bacteria reduce and dissolve Fe- and Mn-coated sediments deposited in the fluvial sediments, releasing Fe, Mn, As, Co, Ni, and perhaps other trace elements. Sulfate-reducing bacteria used organic matter from bacterial degradation of wood fragments to reduce dissolved sulfate to H2S, resulting in the formation of biogenic pyrite around the lignitic wood. During formation of euhedral pyrite, dissolved As, Co, and Ni co-precipitated and become sequestered in pyrite. The pyrite grains contain 0.20–0.92 wt.% of As, 0.19 wt.% of Co, and 0.15 wt.% of Ni indicating its excellent capacity to sequester not only As but also other trace elements. As a result, As concentration in groundwater were low (<2 µg/L) as were other trace elements such as Co (0.55 to 2.12 µg/L), Ni (0.066 to 3.97 µg/L). In this fluvial system, the groundwater is found to be mainly a Ca-SO4 type and not SO4 limited, ensuring enough sulfate for sulfate-reducing bacteria. This result implies that groundwater in alluvial aquifers which are sulfate limited and rich in As (i.e., Bangladesh or USA), may be amended with sulfate (i.e., iron sulfate) and labile organic carbon to stimulate the metabolism of indigenous sulfate-reducing bacteria for As sequestration.
Author Contributions
Conceptualization: M.M.R., M.-K.L. and A.U.; Methodology: M.M.R., M.-K.L. and A.U.; Software: M.M.R. (to assess inputs, results, assumptions, etc.); validation: M.M.R., M.-K.L.; writing—original draft preparation: M.M.R.; writing—review and editing: M.M.R., M.-K.L., and A.U.; funding acquisition: M.-K.L., and A.U. All authors have read and agreed to the published version of the manuscript.
Funding
This research was supported by a grant from the National Science Foundation (NSF-1425004) to Ming-Kuo Lee and Ashraf Uddin.
Acknowledgments
This research has greatly benefited by assistance from our colleague Bill Hames (Auburn University) and Zeki Billor in electron microprobe and ICP-MS analyses. Geosciences graduate students (Alicia Fischer, Collin Sutton, Connor Cain, Neeraja Chinchalkar, and Ozan Turkes) and a former graduate student Mohammad Rezaul Huq from Auburn University assisted with logistics during well drilling and field investigation.
Conflicts of Interest
The authors declare no conflict of interest. The funders had no role in the design of the study; in the collection, analyses, or interpretation of data; in the writing of the manuscript, or in the decision to publish the results.
References
- Bhattacharya, P.; Chatterjee, D.; Jacks, G. Occurrence of arsenic-contaminated groundwater in alluvial aquifers from delta plains, eastern India: Options for safe drinking water supply. Int. J. Water Resour. Dev. 1997, 13, 79–92. [Google Scholar] [CrossRef]
- Welch, A.H.; Westjohn, D.B.; Helsel, D.R.; Wanty, R.B. Arsenic in ground water of the United States; occurrence and geochemistry. Groundwater 2000, 38, 589–604. [Google Scholar] [CrossRef]
- Harvey, C.F.; Swartz, C.H.; Badruzzman, B.; Keon, N.E.; Yu, W.; Ali, A.; Jay, J.; Beckie, R.; Niedan, V.; Brabander, D.; et al. Arsenic mobility and groundwater extraction in Bangladesh. Science 2002, 298, 1602–1606. [Google Scholar] [CrossRef]
- Smedley, P.L.; Kinniburgh, D.G. A review of the source, behavior, and distribution of arsenic in natural waters. Appl. Geochem. 2002, 17, 517–568. [Google Scholar] [CrossRef]
- van Geen, A.; Zheng, Y.; Versteeg, R.; Stute, M.; Horneman, A.; Dhar, R.; Steckler, M.; Gelman, A.; Small, C.; Ahsan, H.; et al. Spatial variability of arsenic in 6000 contiguous tubewells of Araihazar, Bangladesh. Water Resour. Res. 2003, 39, 1140. [Google Scholar] [CrossRef]
- Shamsudduha, M. Mineralogical and Geochemical Profiling of Arsenic Contaminated Alluvial Aquifers in the Ganges-Brahmaputra Floodplain, Manikganj, Bangladesh. Master’s Thesis, Auburn University, Auburn, AL, USA, 2007; 183p. Available online: https://etd.auburn.edu/handle/10415/910 (accessed on 15 August 2007).
- Rahman, M.M.; Uddin, A.; Lee, M.-K. Bioremediation of arsenic contaminated groundwater in a Natural site in Macon County, Alabama. Geol. Soc. Am. Abstr. 2019, 51. [Google Scholar] [CrossRef]
- Turner, J.P. Groundwater Geochemistry, Geology and Microbiology of Arsenic Contaminated Holocene Alluvial Aquifers, Manikganj, Bangladesh. Master’s Thesis, Auburn University, Auburn, AL, USA, 2006. Available online: https://etd.auburn.edu/handle/10415/419 (accessed on 15 June 2006).
- Nickson, R.T.; McArthur, J.M.; Shrestha, B.; Kyaw-Myint, T.O.; Lowry, D. Arsenic and other drinking water quality issues, Muzaffargarh District, Pakistan. Appl. Geochem. 2005, 20, 55–68. [Google Scholar] [CrossRef]
- Liu, C.-W.; Wang, S.-W.; Jang, C.-S.; Lin, K.-H. Occurrence of arsenic in groundwater in the Choushui river alluvial fan, Taiwan. J. Environ. Qual. 2006, 35, 68–75. [Google Scholar] [CrossRef]
- Huerta-Diaz, M.A.; Morse, J.W. Pyritization of trace metals in anoxic marine sediments. Geochim. Cosmochim. Acta 1992, 56, 2681–2702. [Google Scholar] [CrossRef]
- Natter, M.; Keevan, J.; Wang, Y.; Keimowitz, A.R.; Okeke, B.C.; Son, A.; Lee, M.-K. Level and degradation of deepwater horizon spilled oil in coastal marsh sediments and pore-Water. Environ. Sci. Technol. 2012, 46, 5744–5755. [Google Scholar] [CrossRef]
- Lee, M.-K.; Natter, M.; Keevan, J.; Guerra, K.; Saunders, J.A.; Uddin, A.; Humayun, M.; Wang, Y.; Keimowitz, A.R. Assessing effects of climate change on biogeochemical cycling of trace metals in alluvial and coastal watersheds. Br. J. Environ. Clim. Chang. 2013, 3, 44–66. [Google Scholar] [CrossRef] [PubMed]
- Neumann, T.; Scholz, F.; Ostermaier, M.; Rausch, N.; Berner, Z. Arsenic in framboidal pyrite from recent sediments of a shallow water lagoon of the Baltic Sea. Sedimentology 2013, 60, 1389–1404. [Google Scholar] [CrossRef]
- Wilkin, R.T.; Ford, R.G. Arsenic solid-phase partitioning in reducing sediments of a contaminated wetland. Chem. Geol. 2006, 228, 156–174. [Google Scholar] [CrossRef]
- Couture, R.M.; Gobeil, C.; Tessier, A. Arsenic, iron and sulfur co-diagenesis in lake sediments. Geochim. Cosmochim. Acta 2010, 74, 1238–1255. [Google Scholar] [CrossRef]
- Saunders, J.A.; Pritchett, M.A.; Cook, R.B. Geochemistry of biogenic pyrite and ferromanganese stream coatings: A bacterial connection? Geomicrobiol. J. 1997, 14, 203–217. [Google Scholar] [CrossRef]
- Lowers, H.A.; Breit, G.N.; Foster, A.L.; Whitney, J.; Yount, J.; Uddin, M.N.; Muneem, A.A. Arsenic incorporation into authigenic pyrite, bengal basin sediment, Bangladesh. Geochim. Cosmochim. Acta 2007, 71, 2699–2717. [Google Scholar] [CrossRef]
- Saunders, J.A.; Lee, M.-K.; Shamsudduha, M.; Dhakal, P.; Uddin, A.; Chowdury, M.; Ahmed, K.M. Geochemistry, and mineralogy of arsenic in (natural) anaerobic groundwaters. Appl. Geochem. 2008, 23, 3205–3214. [Google Scholar] [CrossRef]
- Lee, M.-K.; Saunders, J.A.; Wilkin, R.T.; Shahnewaz, M. Geochemical modeling of arsenic speciation and mobilization: Implications for bioremediation. In Advances in Arsenic Research; Chapter 29; O’Day, P.A., Vlassopoulos, D., Meng, X., Benning, L.G., Eds.; Oxford University Press: Cary, NC, USA, 2005; pp. 398–413. ISBN 978084123913. [Google Scholar]
- Saunders, J.A.; Pivetz, B.E.; Voorhies, N.; Wilkin, R.T. Potential aquifer vulnerability in regions downgradient from uranium in situ recovery (ISR) sites. J. Environ. Manag. 2016, 183, 67–83. [Google Scholar] [CrossRef]
- Lee, M.-K.; Saunders, J.A.; Wilson, T.; Levitt, E.; Ghandehari, S.S.; Dhakal, P.; Redwine, J.; Marks, J.; Billor, M.Z.; Miller, B.; et al. Field-scale bioremediation of arsenic-contaminated groundwater using sulfate-reducing bacteria and biogenic pyrite. Bioremediation J. 2018, 23, 1–21. [Google Scholar] [CrossRef]
- Saunders, J.A.; Lee, M.-K.; Uddin, A.; Mohammad, S.; Wilkin, R.; Fayek, M.; Korte, N. Natural arsenic contamination of Holocene alluvial aquifers by linked tectonic, weathering, and microbial processes. Geochem. Geophys. Geosyst. 2005, 6, 66–81. [Google Scholar] [CrossRef]
- U.S. Environmental Protection Agency. Proven Alternatives of Aboveground Treatment of Arsenic in Groundwater; EPA-542-S-02-002; Office of Solid Waste and Emergency Response, U.S. Environmental Protection Agency: Washington, DC, USA, 2002; 68p.
- Herath, I.; Vithanage, M.; Bundschuh, J.; Maity, J.P.; Bhattacharya, P. Natural Arsenic in Global Groundwaters: Distribution and Geochemical Triggers for Mobilization. Curr. Pollut. Rep. 2016, 2, 68–89. [Google Scholar] [CrossRef]
- Starnes, P.H. Hydrogeology and Geochemistry of Arsenic Contaminated Shallow Alluvial Aquifers in Florida and Alabama. Master’s Thesis, Auburn University, Auburn, AL, USA, 2015; 129p. Available online: https://etd.auburn.edu/handle/10415/5223 (accessed on 13 June 2016).
- Ahmed, K.M.; Bhattacharya, P.; Hasan, M.A.; Akhter, S.H.; Alam, S.M.M.; Bhuyian, M.A.H.; Imam, M.B.; Khan, A.A.; Sracek, O. Arsenic enrichment in groundwater of the alluvial aquifers in Bangladesh: An overview. Appl. Geochem. 2004, 19, 181–200. [Google Scholar] [CrossRef]
- Kinniburgh, D.G.; Smedley, P.L. Arsenic Contamination of Groundwater in Bangladesh; British Geologic Survey Report; British Geologic Survey: Nottingham, UK, 2001; 15p. [Google Scholar]
- Mandal, B.K.; Suzuki, K.T. Arsenic round the world: A review. Talanta 2002, 58, 201–235. [Google Scholar] [CrossRef]
- Nordstrom, D.K. Worldwide occurrences of arsenic in groundwater. Science 2002, 296, 2143–2145. [Google Scholar] [CrossRef] [PubMed]
- Uddin, A.; Shamsudduha, M.; Saunders, J.A.; Lee, M.-K.; Ahmed, K.M.; Chowdhury, M.T. Mineralogical profiling of arsenic-enriched alluvial sediments in the Ganges-Brahmaputra floodplain in central Bangladesh. Appl. Geochem. 2011, 26, 470–483. [Google Scholar] [CrossRef]
- Ahmed, K.M.; Imam, M.B.; Akhter, S.H.; Hasan, M.A.; Khan, A.A. Sedimentology, and mineralogy of arsenic contaminated aquifers in the Bengal Delta of Bangladesh. In Groundwater Arsenic Contamination in the Bengal Delta Plain of Bangladesh; TRITA-AMI Report 3084; Jacks, G., Bhattacharya, P., Khan, A.A., Eds.; KTH Special Publication: Dhaka, Bangladesh, 2001; pp. 97–108. [Google Scholar]
- McArthur, J.M.; Ravencroft, P.; Safiullah, S.; Thirlwall, M.F. Arsenic in groundwater: Testing pollution mechanism for sedimentary aquifers in Bangladesh. Water Resour. Res. 2001, 37, 109–117. [Google Scholar] [CrossRef]
- Mukherjee, A.B.; Bhattacharya, P. Arsenic in groundwater in the Bengal Delta Plain: Slow poisoning in Bangladesh. Environ. Rev. 2001, 9, 189–220. [Google Scholar] [CrossRef]
- Bhattacharya, P.; Frisbie, S.H.; Smith, E.; Naidu, R.; Jacks, G.; Sarkar, B. Arsenic in the environment: A global perspective. In Handbook of Heavy Metals in the Environment; Sarkar, B., Ed.; Marcell Dekker Inc.: New York, NY, USA, 2002; pp. 147–215. [Google Scholar]
- Bhattacharya, P.; Jacks, G.; Ahmed, K.M.; Khan, A.A.; Routh, J. Arsenic in groundwater of the Bengal Delta Plain aquifers in Bangladesh. Bull. Environ. Contam. Toxicol. 2002, 69, 538–545. [Google Scholar] [CrossRef]
- Rahman, M.M.; Hasan, M.A.; Ahmed, K.M. Naturally Occurring Groundwater Arsenic and Salinity Affected South-Western Bangladesh: An Assessment of Managed Aquifer Recharge (MAR) and Sub-surface Arsenic Removal (SAR) as Mitigation Techniques. In Proceedings of the GSA 2020 Connects Online, 26–30 October 2020; Volume 52. [Google Scholar] [CrossRef]
- Rahman, M.M.; Hasan, M.A.; Ahmed, K.M. Alternative Options for Safe Drinking Water in Arsenic and Salinity Affected, Narail District, Bangladesh. Geol. Soc. Am. Abstr. 2018, 50. [Google Scholar] [CrossRef]
- Ahmed, K.M.; Imam, M.B.; Akhter, S.H.; Hasan, M.A.; Alam, M.M.; Chowdhury, S.Q.; Burgess, W.G.; Nickson, R.; McArthur, J.M.; Hasan, M.K.; et al. Mechanism of arsenic release to groundwater: Geochemical and mineralogical evidence. In Proceedings of the International Conference on Arsenic Pollution of Groundwater in Bangladesh: Causes, Effects and Remedy, Dhaka, Bangladesh, 8–12 February 1998; pp. 125–126. [Google Scholar]
- Nickson, R.T.; McArthur, J.M.; Ravenscroft, P.; Burgess, W.G.; Ahmed, K.M. Mechanism of arsenic release to groundwater, Bangladesh, and West Bengal. Appl. Geochem. 2000, 15, 403–413. [Google Scholar] [CrossRef]
- Nickson, R.; McArthur, J.; Burgess, W.; Ahmed, K.M.; Ravenscroft, P.; Rahman, M. Arsenic poisoning of Bangladesh groundwater. Nature 1998, 395, 338. [Google Scholar] [CrossRef]
- Routh, J.; Bhattacharya, P.; Jacks, G.; Ahmed, K.M.; Khan, A.A.; Rahman, M.M. Arsenic geochemistry of Tala groundwater and sediments from Satkhira District, Bangladesh. Eos Trans. Am. Geophys. Union 2000, 81, 550. [Google Scholar]
- Dowling, C.; Poreda, R.; Basu, A.; Peters, S. Geochemical study of arsenic release mechanisms in the Bengal Basin groundwater. Water Resour. Res. 2002, 38, 12-1–12-8. [Google Scholar] [CrossRef]
- Zheng, Y.; Stute, M.; van Geen, A.; Gavrieli, I.; Dhar, R.; Simpson, J.; Ahmed, K.M. Redox control of arsenic mobilization in Bangladesh groundwater. Appl. Geochem. 2004, 19, 201–214. [Google Scholar] [CrossRef]
- Markewich, H.W.; Christopher, T.H. Pleistocene (?) and Holocene Fluvial History of Uphapee Creek, Macon County, Alabama; Geological Survey Bulletin-1522; U.S. Department of the Interior, Geological Survey: Reston, VA, USA, 1982. [Google Scholar] [CrossRef]
- Penny, E.; Lee, M.-K.; Morton, C. Groundwater and microbial processes of the Alabama coastal plain aquifers. Water Resour. Res. 2003, 39, 1320. [Google Scholar] [CrossRef]
- Rahman, M.M. Geochemistry of Groundwater and Naturally Occurring Pyrite in the Holocene Fluvial Aquifers in Uphapee Watershed, Macon County, Alabama. Master’s Thesis, Auburn University, Auburn, AL, USA, 2019; 101p. Available online: https://etd.auburn.edu/handle/10415/6918 (accessed on 9 August 2020).
- Meng, X.; Wang, W. Speciation of arsenic by disposable cartridges. In Proceedings of the Third International Conference on Arsenic Exposure and Health Effects, San Diego, CA, USA, 12–15 July 1998. [Google Scholar]
- Reed, S.J.B. Electron Microprobe Analysis and Scanning Electron Microscopy in Geology, 2nd ed.; Cambridge University Press: Cambridge, UK, 2005. [Google Scholar]
- Bethke, C.M. Geochemical and Biogeochemical Reaction Modeling; Cambridge University Press: New York, NY, USA, 2008. [Google Scholar]
- Levitt, E.J. Bioremediation of Arsenic Contaminated Groundwater in Northwest Florida: Mineralogy, Geochemistry, and Microbiology Changes. Master’s Thesis, Auburn University, Auburn, AL, USA, 2017. Available online: https://etd.auburn.edu/handle/10415/5685 (accessed on 1 April 2012).
- Champ, D.R.; Gulens, J.; Jackson, R.E. Oxidation-reduction Sequences in groundwater flow systems. Can. J. Earth Sci. 1979, 16, 12–23. [Google Scholar] [CrossRef]
- Bethke, C.M.; Ding, D.; Jin, Q.; Sanford, R.A. Origin of microbiological zoning in groundwater flows. Geology 2008, 36, 739–742. [Google Scholar] [CrossRef]
- Naseem, S.; McArthur, J.M. Arsenic and other water-quality issues affecting groundwater, Indus alluvial plain, Pakistan. Hydrol. Process. 2018, 32, 1235–1253. [Google Scholar] [CrossRef]
- Rahman, M.M.; Uddin, A.; Lee, M.-K. Geochemistry of Groundwater and Naturally Occurring Biogenic Pyrite in the Holocene Fluvial Aquifers in Uphapee watershed, Macon County, Alabama. In Proceedings of the GSA 2020 Connects Online, 26–30 October 2020; Volume 52. [Google Scholar] [CrossRef]
- Rieder, M.; Crelling, J.C.; Šustai, O.; Drábek, M.; Weiss, Z.; Klementová, M. Arsenic in iron disulfides in a brown coal from the North Bohemian Basin, Czech Republic. Int. J. Coal Geol. 2007, 71, 115–121. [Google Scholar] [CrossRef]
- Rickard, D. How long does it take a pyrite framboid to form? Earth Planet. Sci. Lett. 2019, 513, 64–68. [Google Scholar] [CrossRef]
- Postma, D.; Jakobsen, R. Redox zonation: Equilibrium constraints on the Fe(III)/SO4reduction interface. Geochim. Cosmochim. 1996, 60, 3169–3175. [Google Scholar] [CrossRef]
- Lee, R.W. Geochemistry of groundwater in Cretaceous sediments of the southeastern Coastal Plain of eastern Mississippi and western Alabama. Water Resour. Res. 1985, 21, 1545–1556. [Google Scholar] [CrossRef]
- Lovley, D.R.; Chapelle, F.H. Deep subsurface microbial processes. Rev. Geophys. 1995, 33, 365–381. [Google Scholar] [CrossRef]
- Chapelle, F.H.; Lovely, D.R. Competitive exclusion of sulfate reduction by Fe(III) reducing bacteria: A mechanism for producing discrete zones of high-iron groundwater. Groundwater 1992, 30, 29–36. [Google Scholar] [CrossRef]
Publisher’s Note: MDPI stays neutral with regard to jurisdictional claims in published maps and institutional affiliations. |
© 2020 by the authors. Licensee MDPI, Basel, Switzerland. This article is an open access article distributed under the terms and conditions of the Creative Commons Attribution (CC BY) license (http://creativecommons.org/licenses/by/4.0/).

