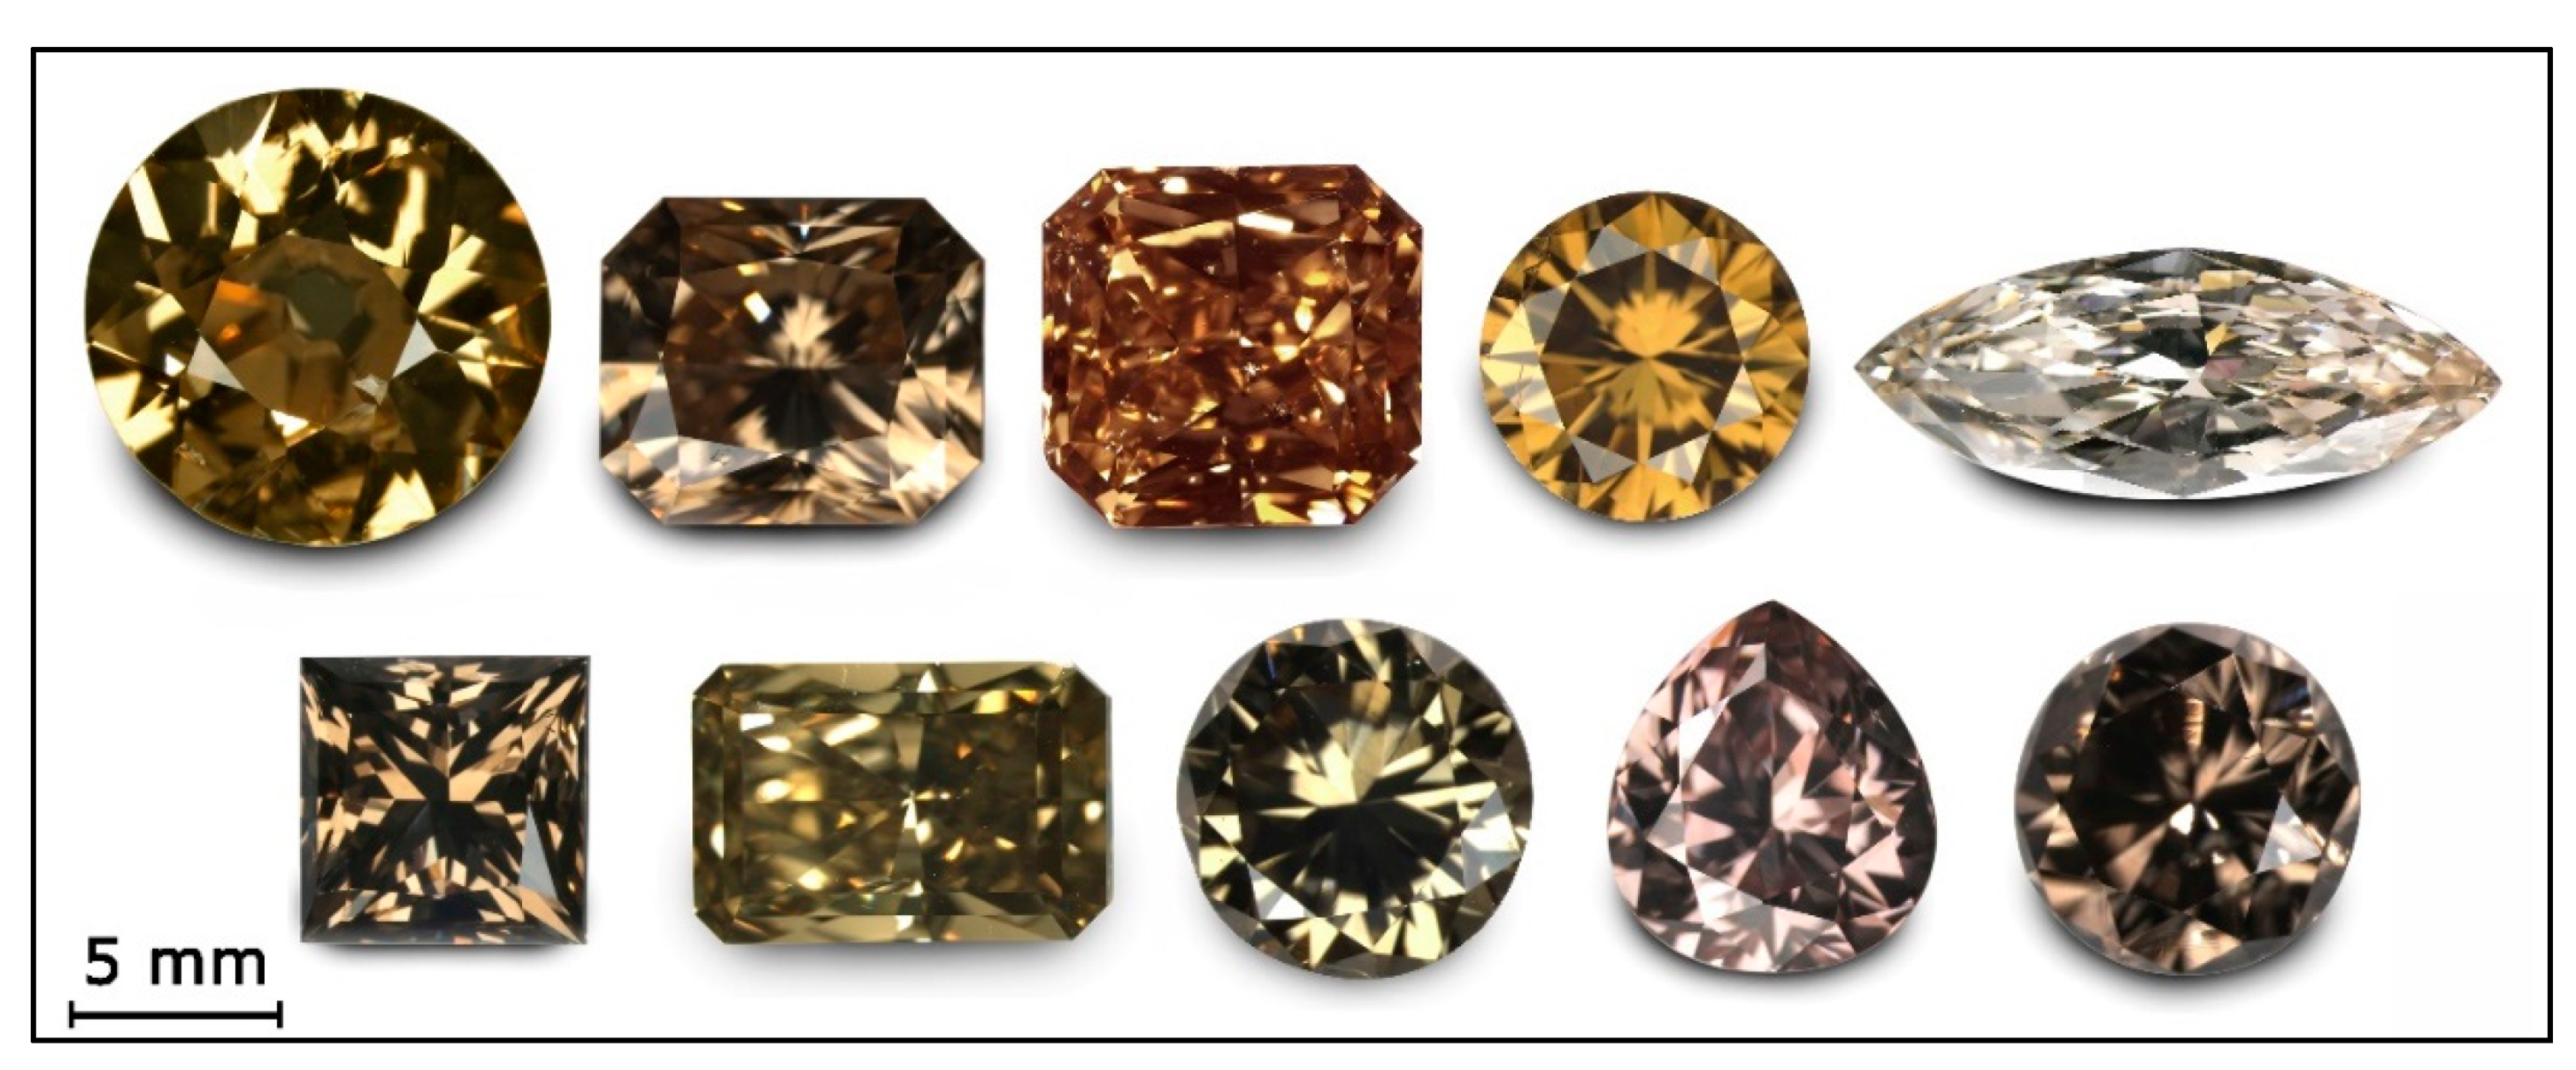
Figure 1.
A variety of differently colored and shaped deformation-related brown diamonds.
Figure 1.
A variety of differently colored and shaped deformation-related brown diamonds.
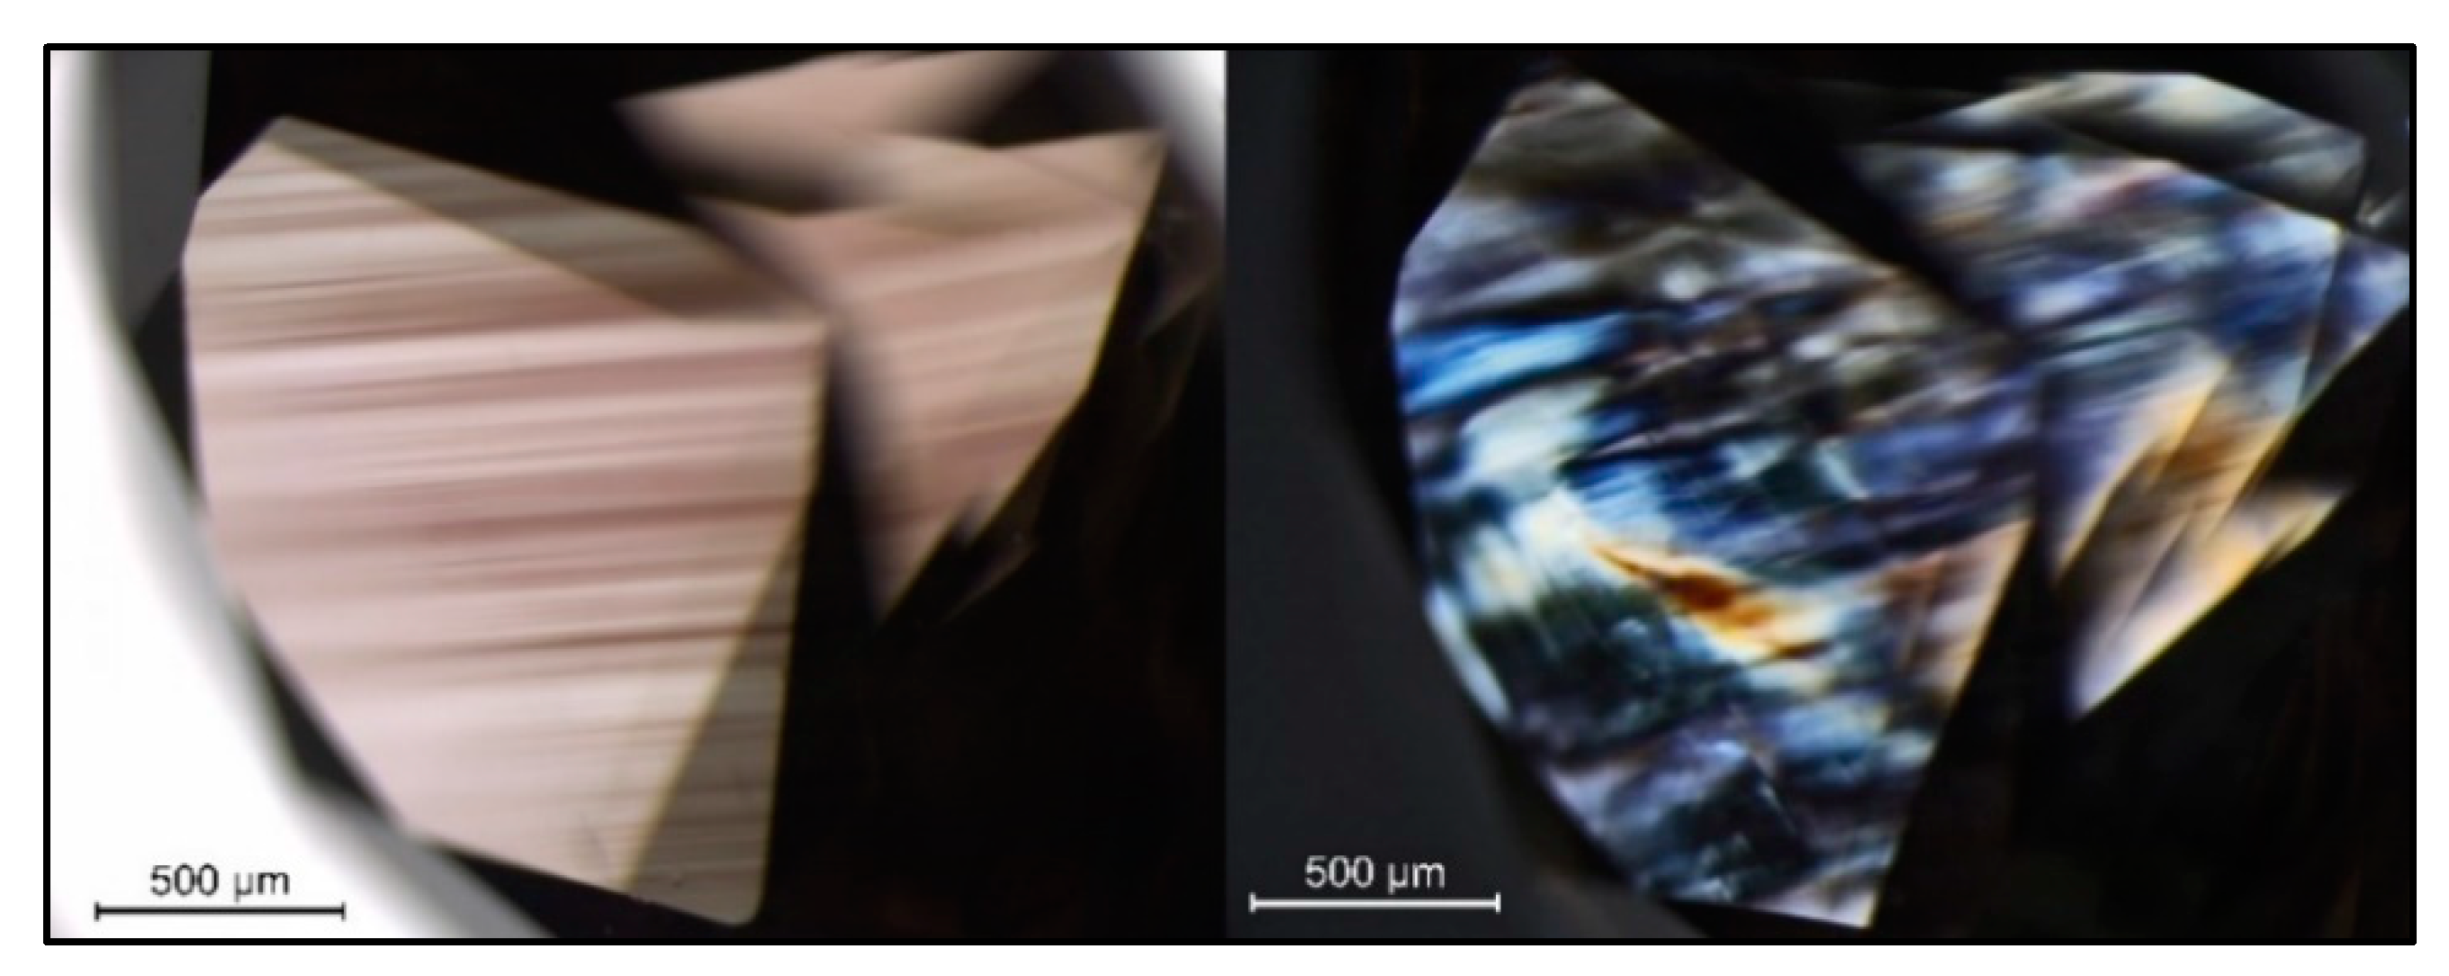
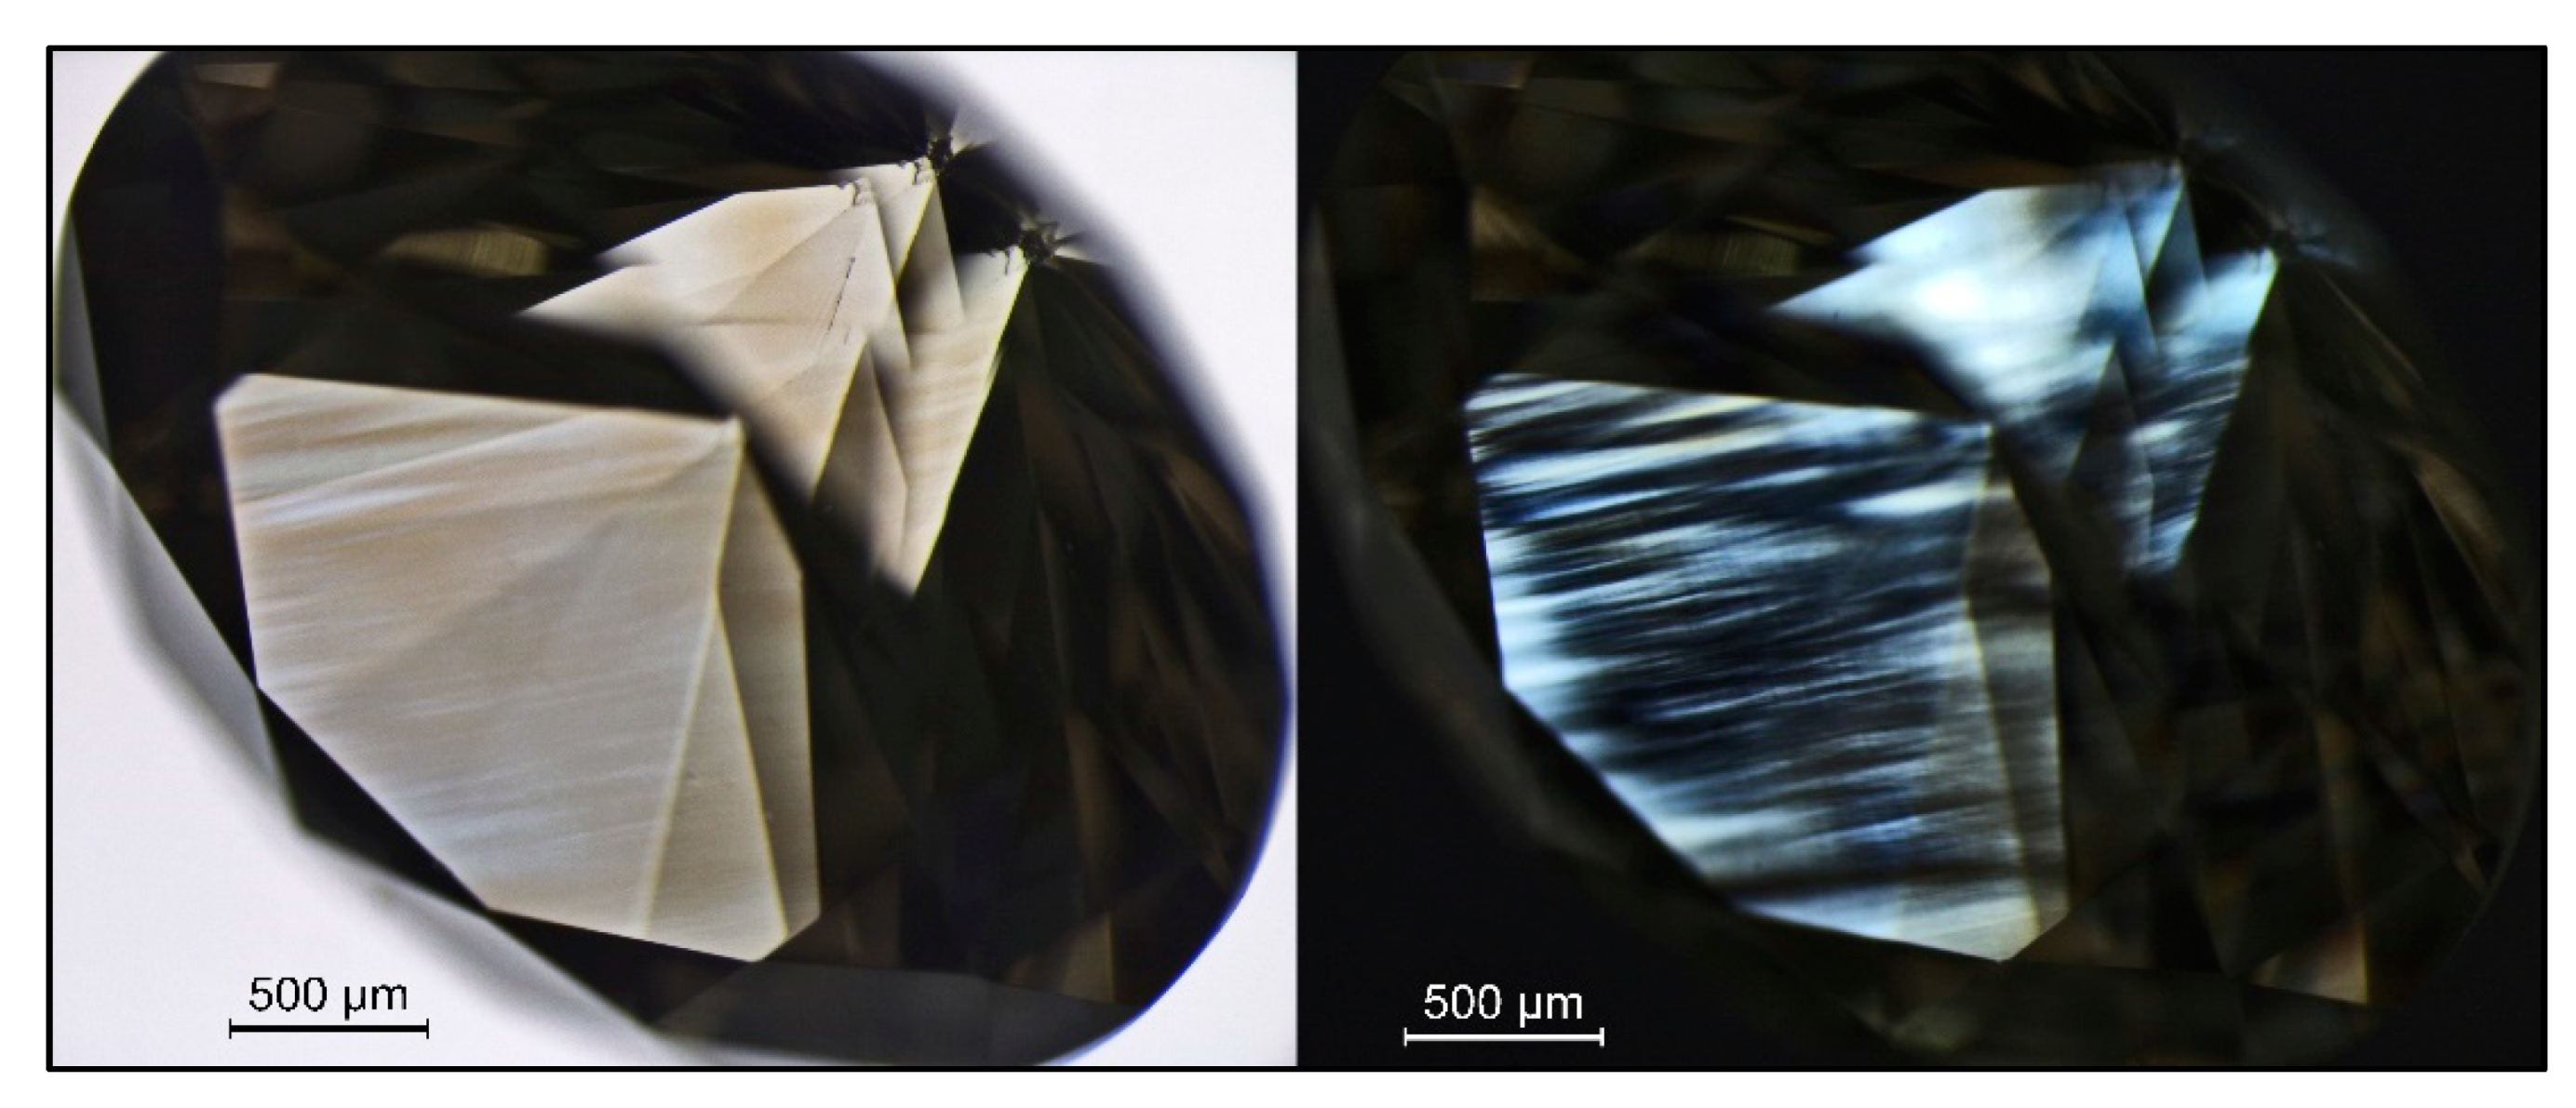
Figure 2.
A pinkish brown type IaA>>B diamond (sample TH 2.440) in immersion (left) showing the characteristic plastic deformation-related brown “graining” along (111) combined with some pink “graining”, and the corresponding extinction and interference patterns as shown under crossed polarizing filters.
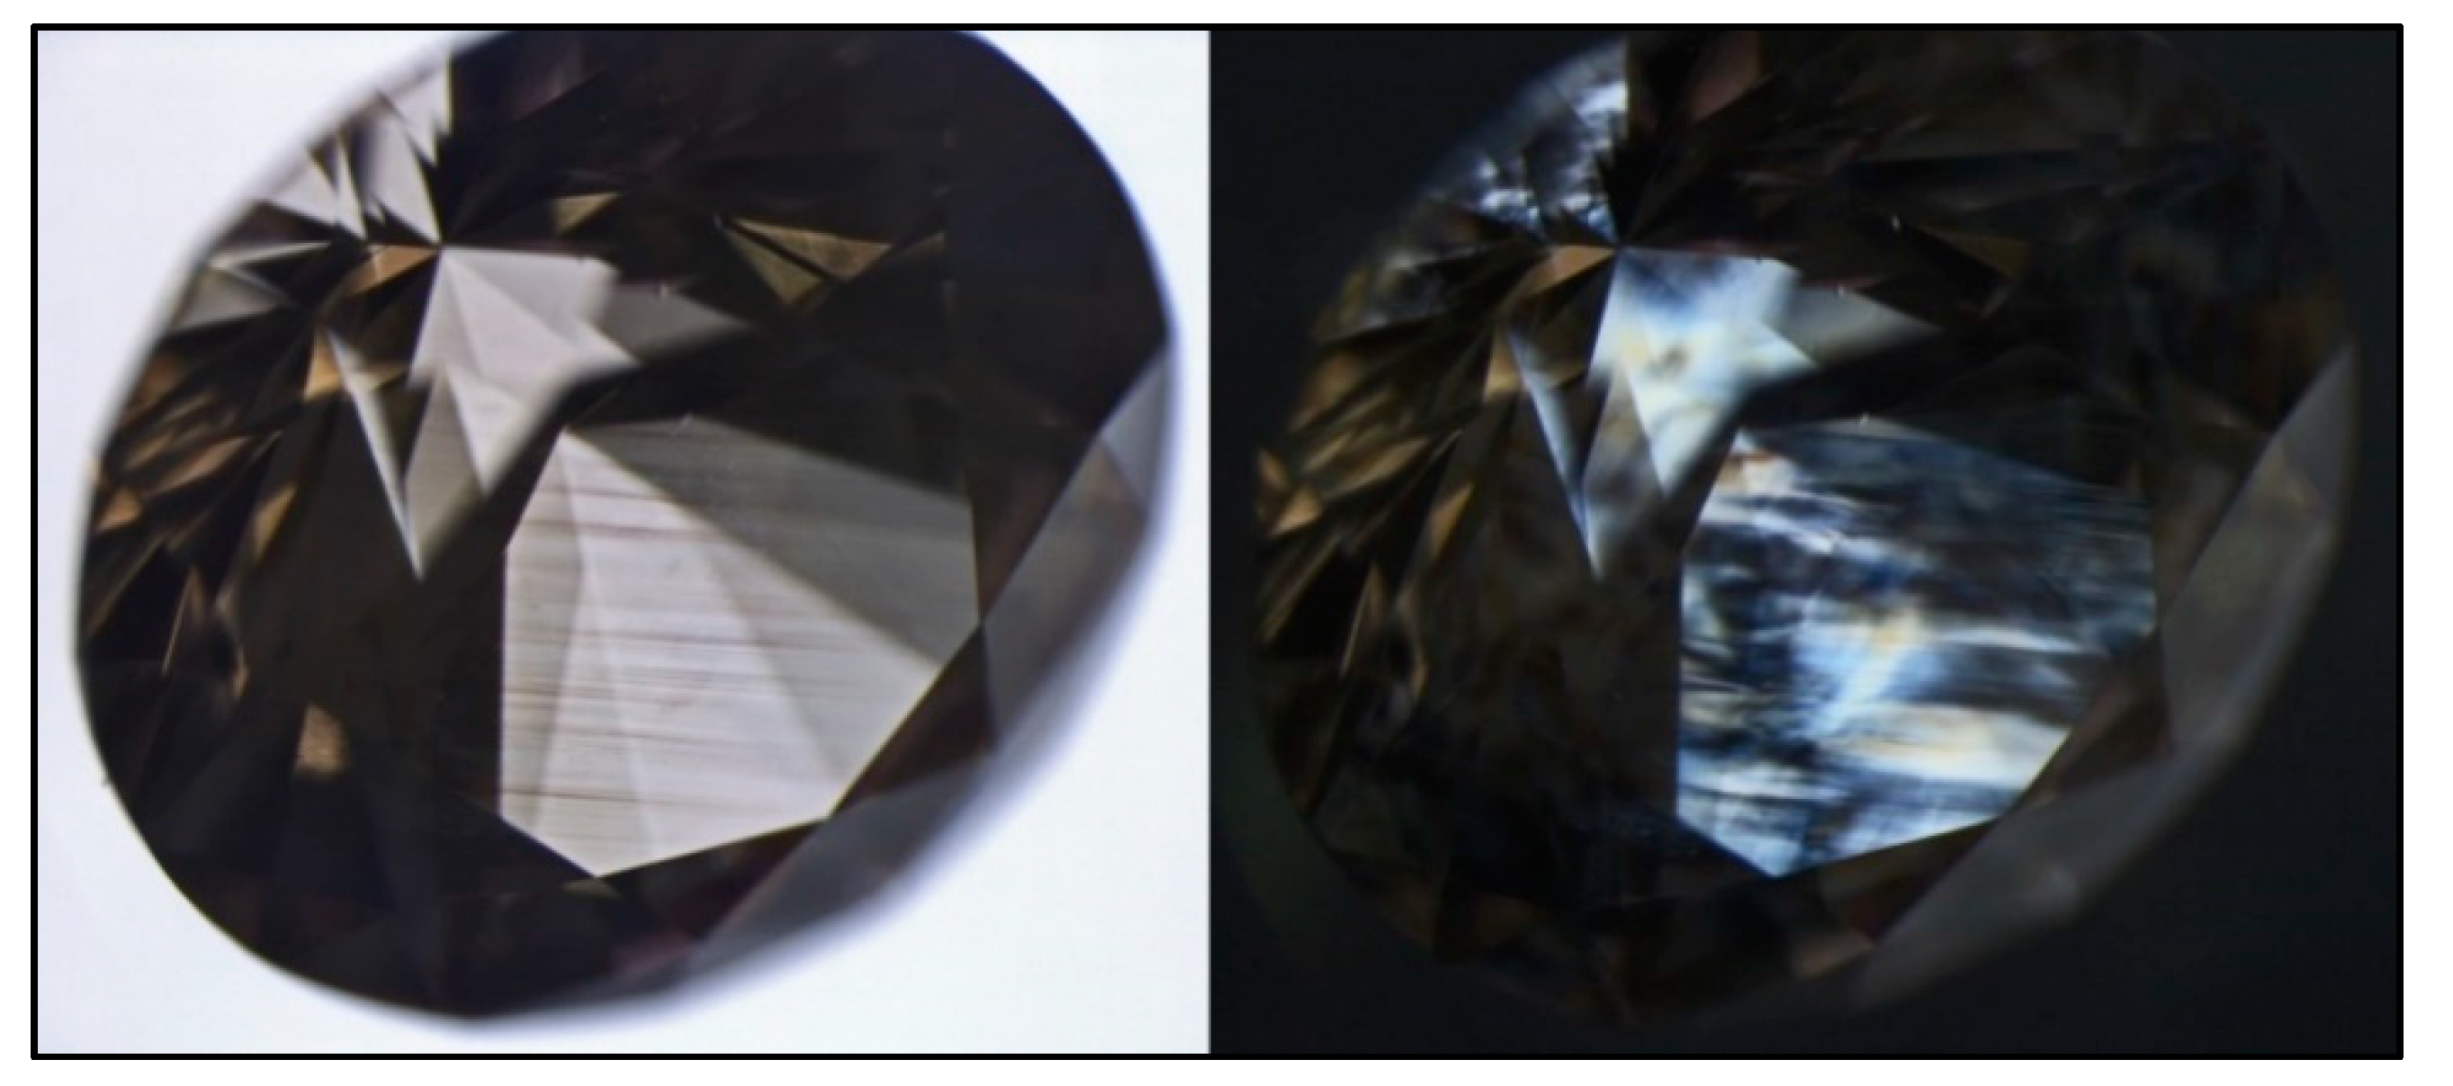
Figure 3.
A brown hydrogen-rich type IaB diamond (sample TH 2.619) that clearly shows its color being caused by deformation-related brown color lamellae (left, immersion) along the octahedral crystal directions; the characteristic extinction patterns following the brown lamellae (“graining”) can be seen on the right (immersion, crossed polarizers).
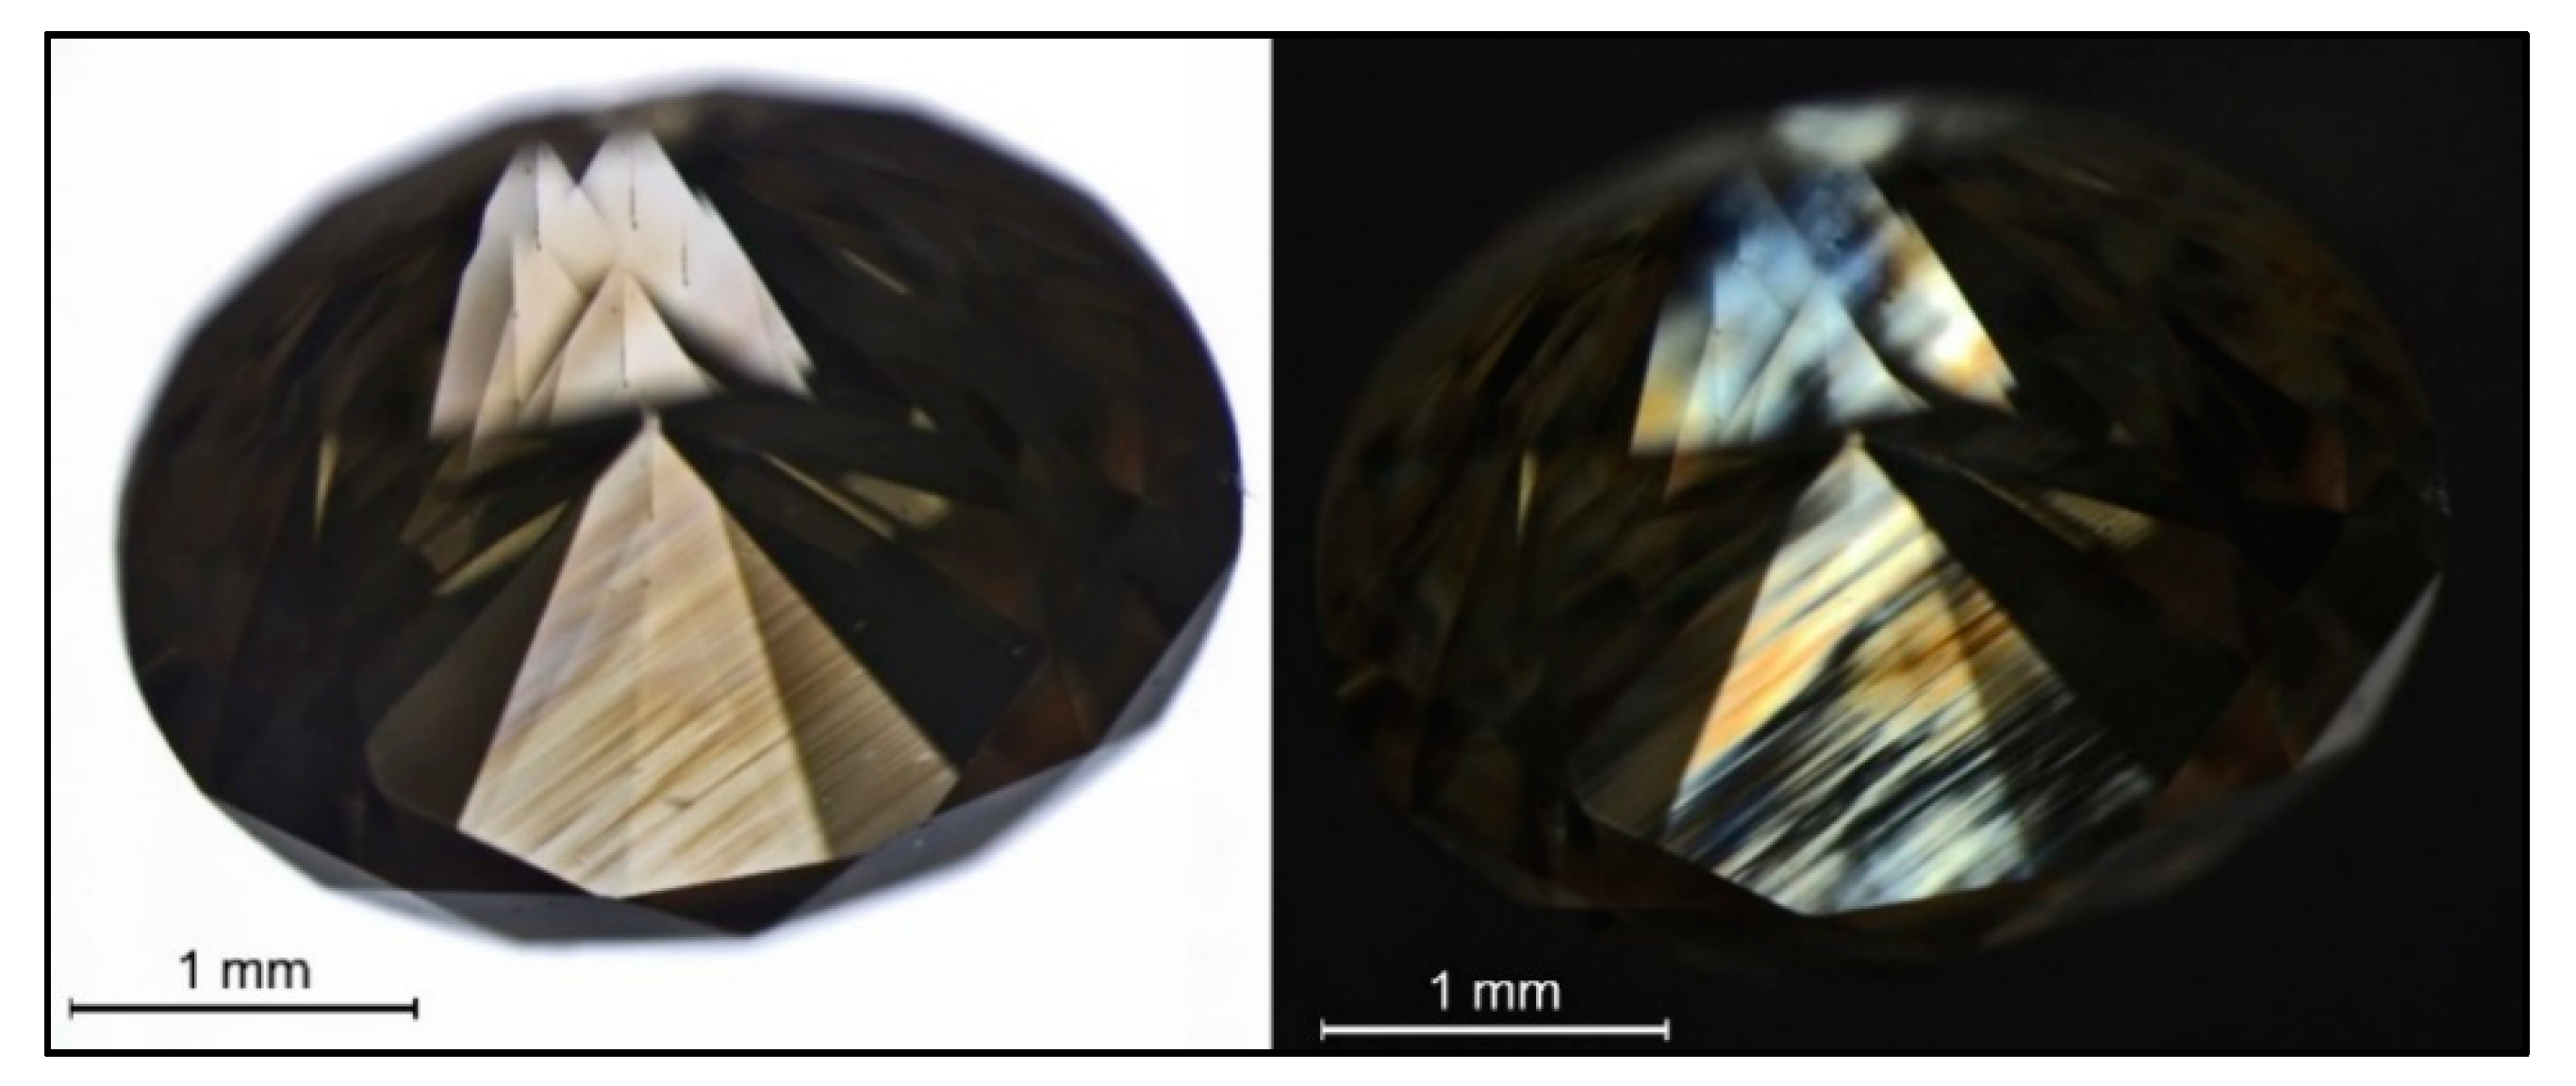
Figure 4.
A brown hydrogen-rich type IaA>>B diamond (sample TH 2.622) that clearly shows its color being caused by deformation-related brown color lamellae (left, immersion) along the octahedral crystal directions, the color lamellae traversing the cuboid growth sectors that were visualized by fluorescence imaging (see Figure 21 below); the characteristic extinction patterns following the brown lamellae (“graining”) can be seen on the right, but additionally to the (111) extinction, some additional extinction/strain patterns can be seen from the strain caused between the different growth sectors (immersion, crossed polarizers).
Figure 5.
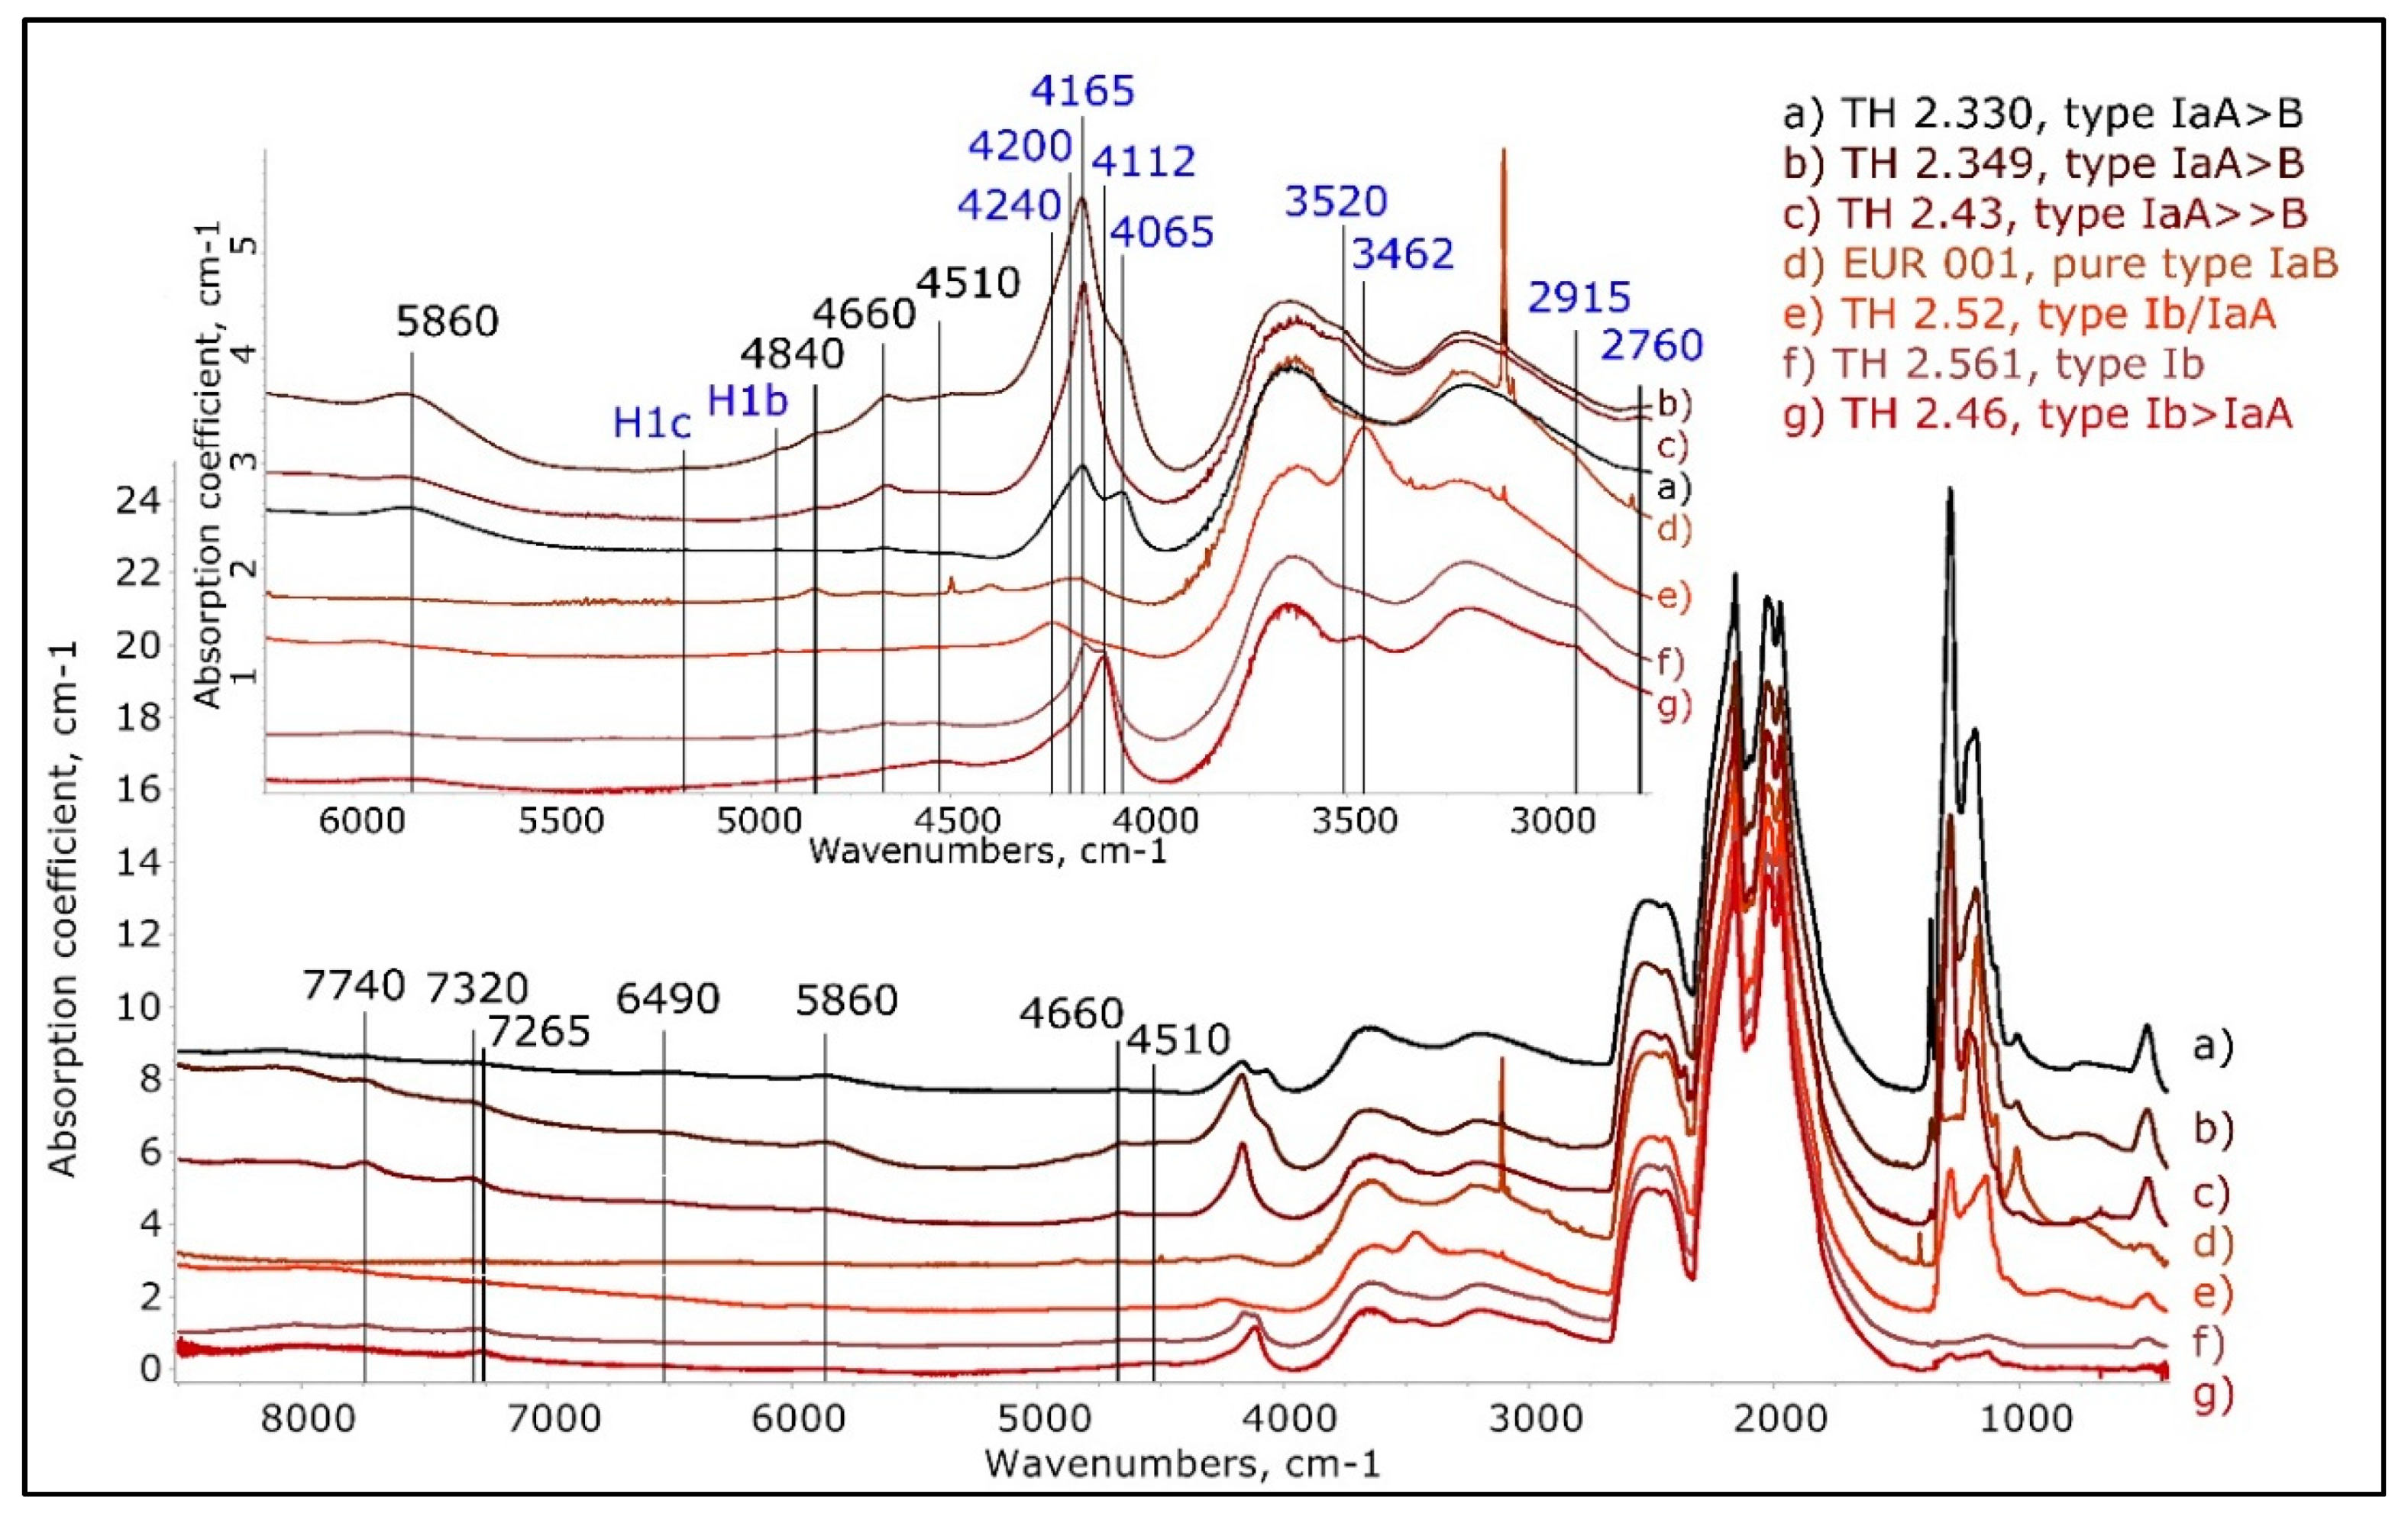
Representative normalized infrared spectra showing the different types of amber centers (ACs) in brown diamonds, recorded at room temperature. Type Ia diamonds show either an AC with the main absorption at 4165 cm−1 or a “double AC” having a double band at 4165 and 4065 cm−1 (traces a, b, and c), with weak bands at 3520 and 2760 cm−1 when the 4165 cm−1 AC is strong; in the spectra of type Ib diamonds, there is a either a single main band at 4112 cm−1 or a double band at 4165 and 4112 cm−1, sometimes with a 3462 cm−1 and a 2915 cm−1 AC (traces e, f, and g); in some type Ib DR brown diamonds, a band at 4240 cm−1 is distinct; it is unclear whether it is another AC zero phonon line (ZPL) or a component of the 3462 cm−1 AC (traces e and g). The spectra were shifted vertically for clarity.
Figure 5.
Representative normalized infrared spectra showing the different types of amber centers (ACs) in brown diamonds, recorded at room temperature. Type Ia diamonds show either an AC with the main absorption at 4165 cm−1 or a “double AC” having a double band at 4165 and 4065 cm−1 (traces a, b, and c), with weak bands at 3520 and 2760 cm−1 when the 4165 cm−1 AC is strong; in the spectra of type Ib diamonds, there is a either a single main band at 4112 cm−1 or a double band at 4165 and 4112 cm−1, sometimes with a 3462 cm−1 and a 2915 cm−1 AC (traces e, f, and g); in some type Ib DR brown diamonds, a band at 4240 cm−1 is distinct; it is unclear whether it is another AC zero phonon line (ZPL) or a component of the 3462 cm−1 AC (traces e and g). The spectra were shifted vertically for clarity.
Figure 6.
The normalized infrared spectra of a color suite of diamonds with a deformation-related brown color. It can be seen that in these type Ia diamonds, the intensity of the AC absorption correlates well with the darkness of the brown color; the lightest brown diamonds have the weakest AC while the darkest brown diamonds have the strongest AC absorption. The spectra were shifted vertically for clarity.
Figure 7.
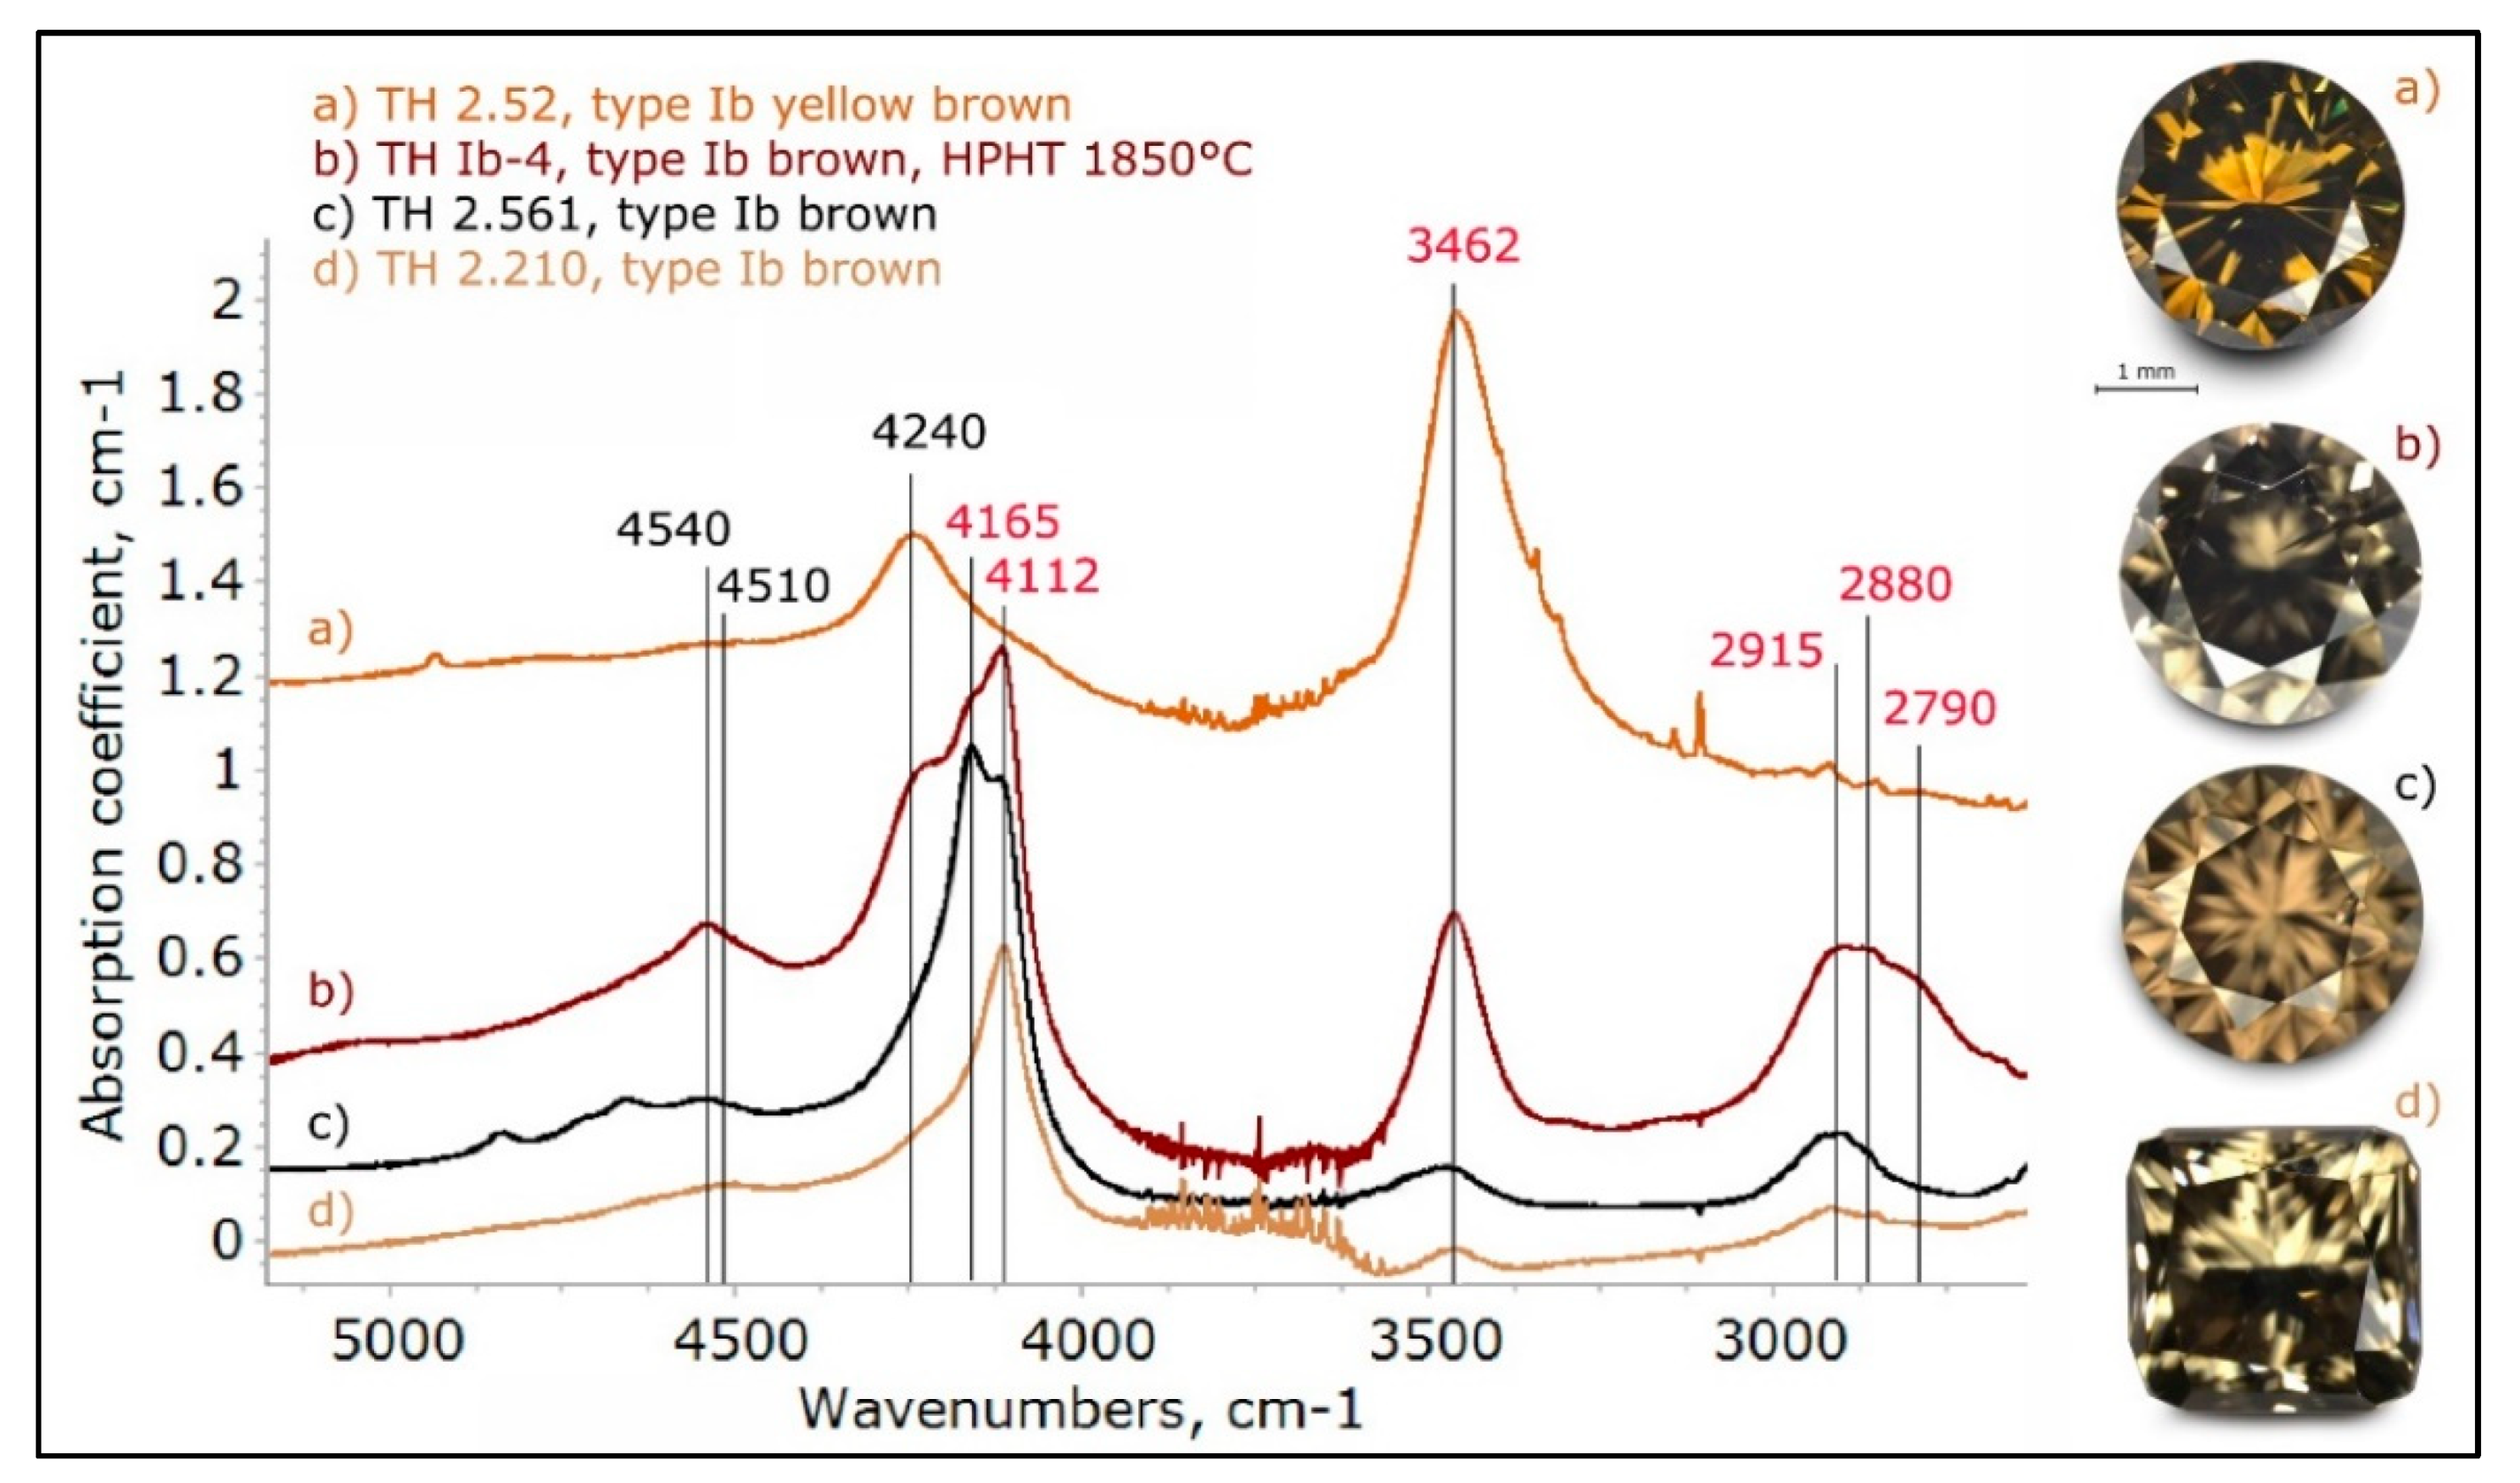
The normalized near infrared spectra of type Ib DR brown diamonds after subtraction of the intrinsic diamond absorptions. All of the spectra show the 3462 cm−1 AC ZPL and its likely vibronic component at 4240 cm−1; this graph demonstrates that the bands between 2915 and 2790 cm−1 do not relate to the 3462 cm−1 absorption. Instead, it is indicated that these bands are additional ACs, and that the bands at 4540 and 4510 cm−1 are likely vibronic components of these ACs. The spectra were shifted vertically for clarity.
Figure 7.
The normalized near infrared spectra of type Ib DR brown diamonds after subtraction of the intrinsic diamond absorptions. All of the spectra show the 3462 cm−1 AC ZPL and its likely vibronic component at 4240 cm−1; this graph demonstrates that the bands between 2915 and 2790 cm−1 do not relate to the 3462 cm−1 absorption. Instead, it is indicated that these bands are additional ACs, and that the bands at 4540 and 4510 cm−1 are likely vibronic components of these ACs. The spectra were shifted vertically for clarity.
Figure 8.
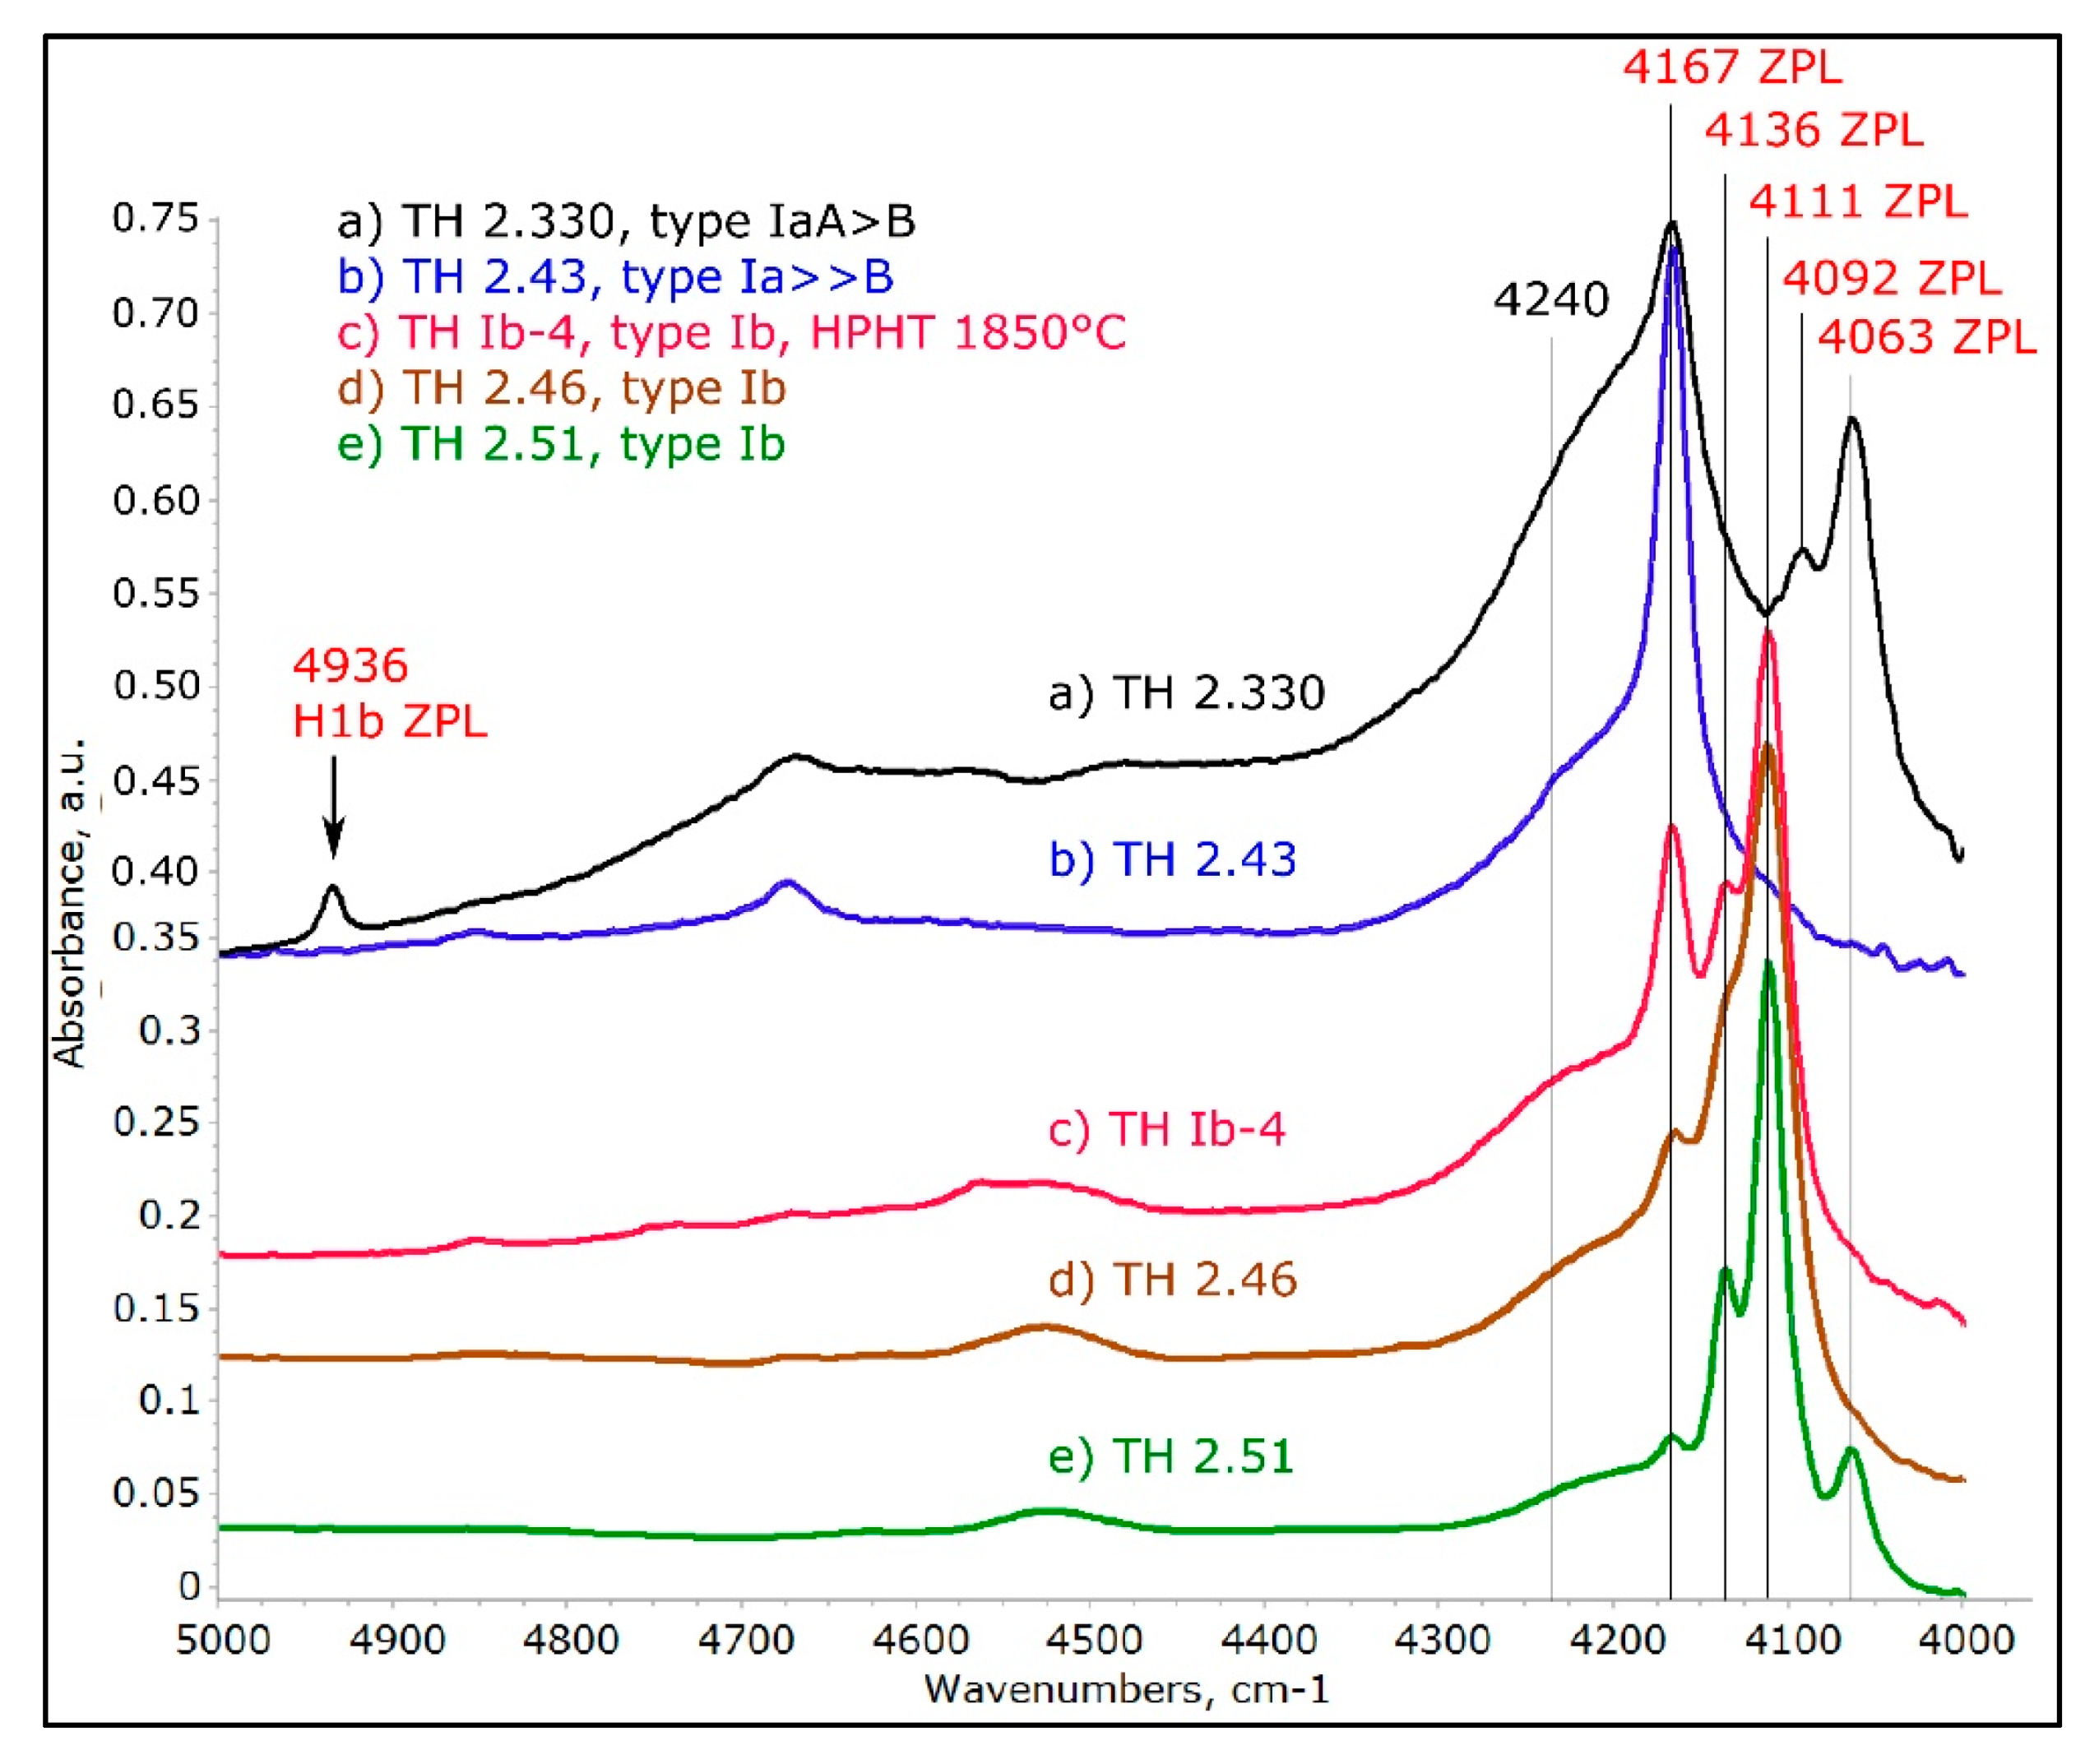
A detailed view of the AC ZPLs when recorded at 77 K. A total of 5 ZPLs can be seen and the band at 4240 cm−1 is very likely identified as a vibronic component, since it does not sharpen significantly. A distinct H1b center can be seen in spectrum (a); when present in diamonds not associated with any type of irradiation/annealing, this peak is always associated with the AC at 4063 cm−1. The spectra were shifted vertically for clarity.
Figure 8.
A detailed view of the AC ZPLs when recorded at 77 K. A total of 5 ZPLs can be seen and the band at 4240 cm−1 is very likely identified as a vibronic component, since it does not sharpen significantly. A distinct H1b center can be seen in spectrum (a); when present in diamonds not associated with any type of irradiation/annealing, this peak is always associated with the AC at 4063 cm−1. The spectra were shifted vertically for clarity.
Figure 9.
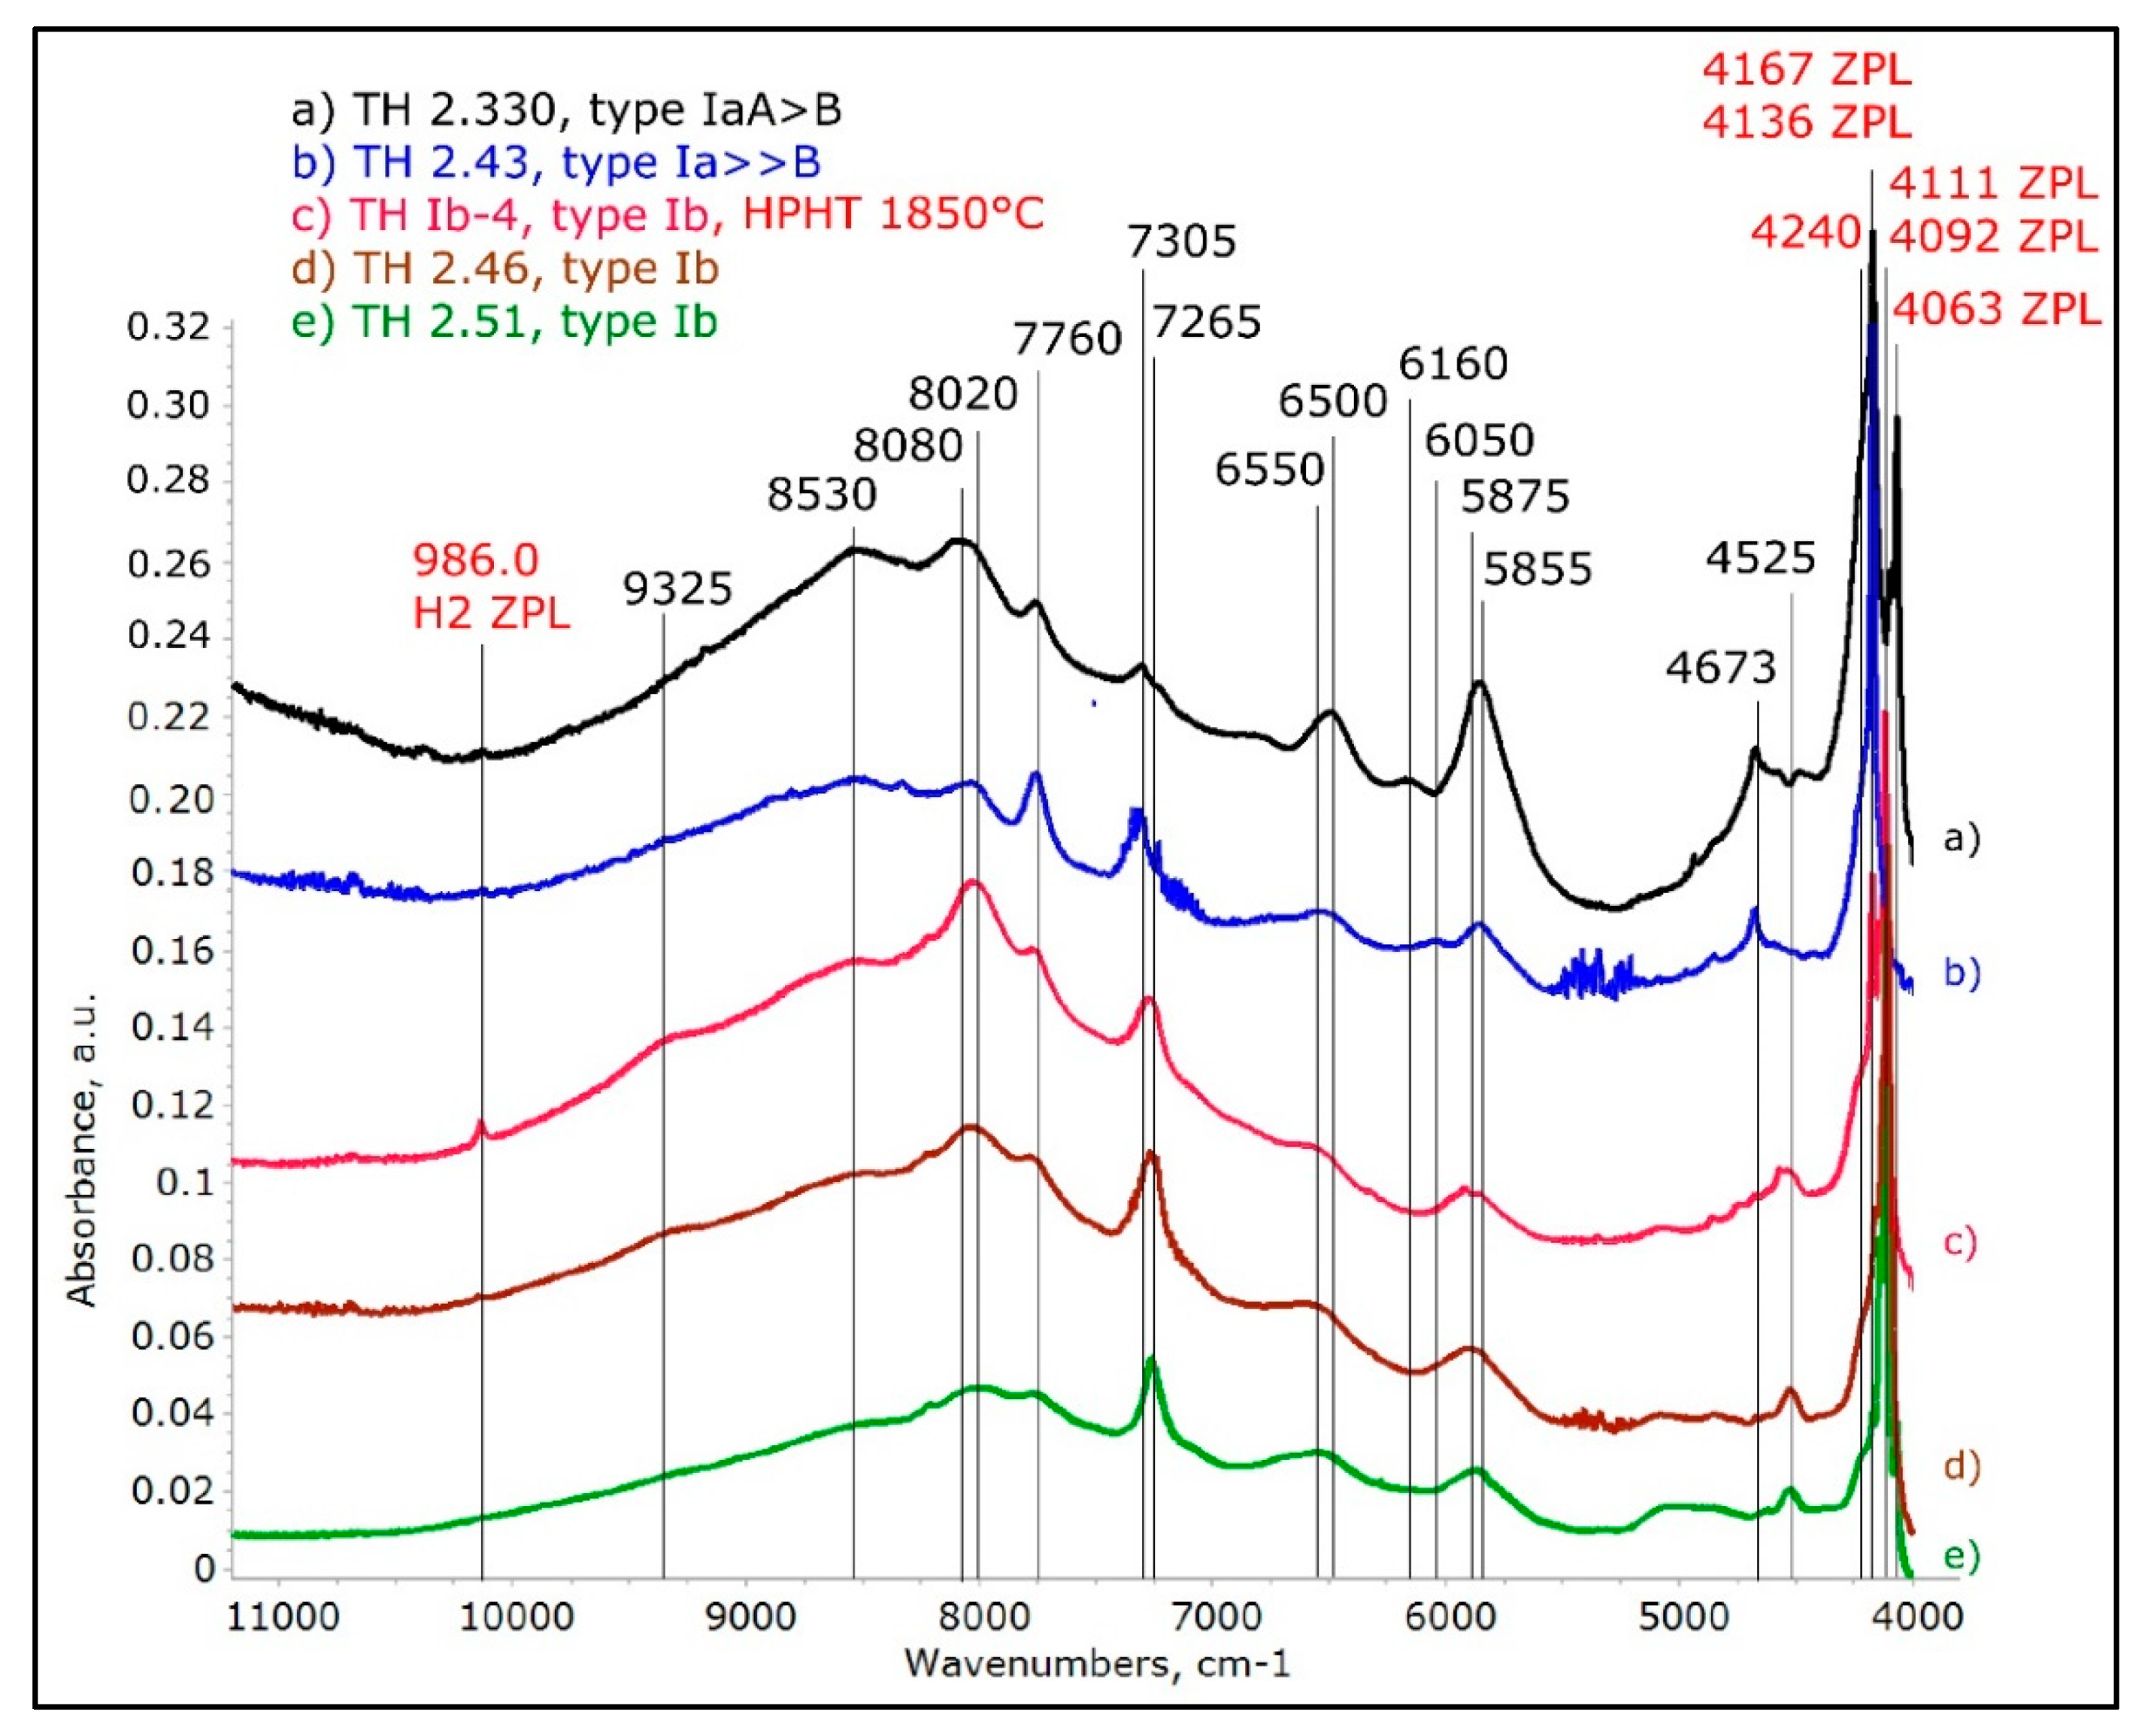
The NIR spectra of the different AC absorptions recorded with the samples at 77 K. The spectra confirm which ones of the absorptions are ZPL’s and which ones are not, and the significant sharpening and splitting of the absorptions reveal much more details about the ACs than the spectra at room temperature. The spectra were shifted vertically for clarity.
Figure 9.
The NIR spectra of the different AC absorptions recorded with the samples at 77 K. The spectra confirm which ones of the absorptions are ZPL’s and which ones are not, and the significant sharpening and splitting of the absorptions reveal much more details about the ACs than the spectra at room temperature. The spectra were shifted vertically for clarity.
Figure 10.
The NIR spectra (at 77 K) of a diamond exhibiting both the DAC (4167/4063 cm−1) as well as H1b/H1c before (a/a*) and after annealing to 1500 °C for 2h (b/b*). It is obvious that the 4063/4092 cm−1 component is annealed out while the 4167 cm−1 ZPL increases distinctly after the annealing experiment. H1b and H1c are also annealed out under these conditions. The 4200 cm−1 band is apparently unaffected. The spectra were shifted vertically for clarity.
Figure 11.
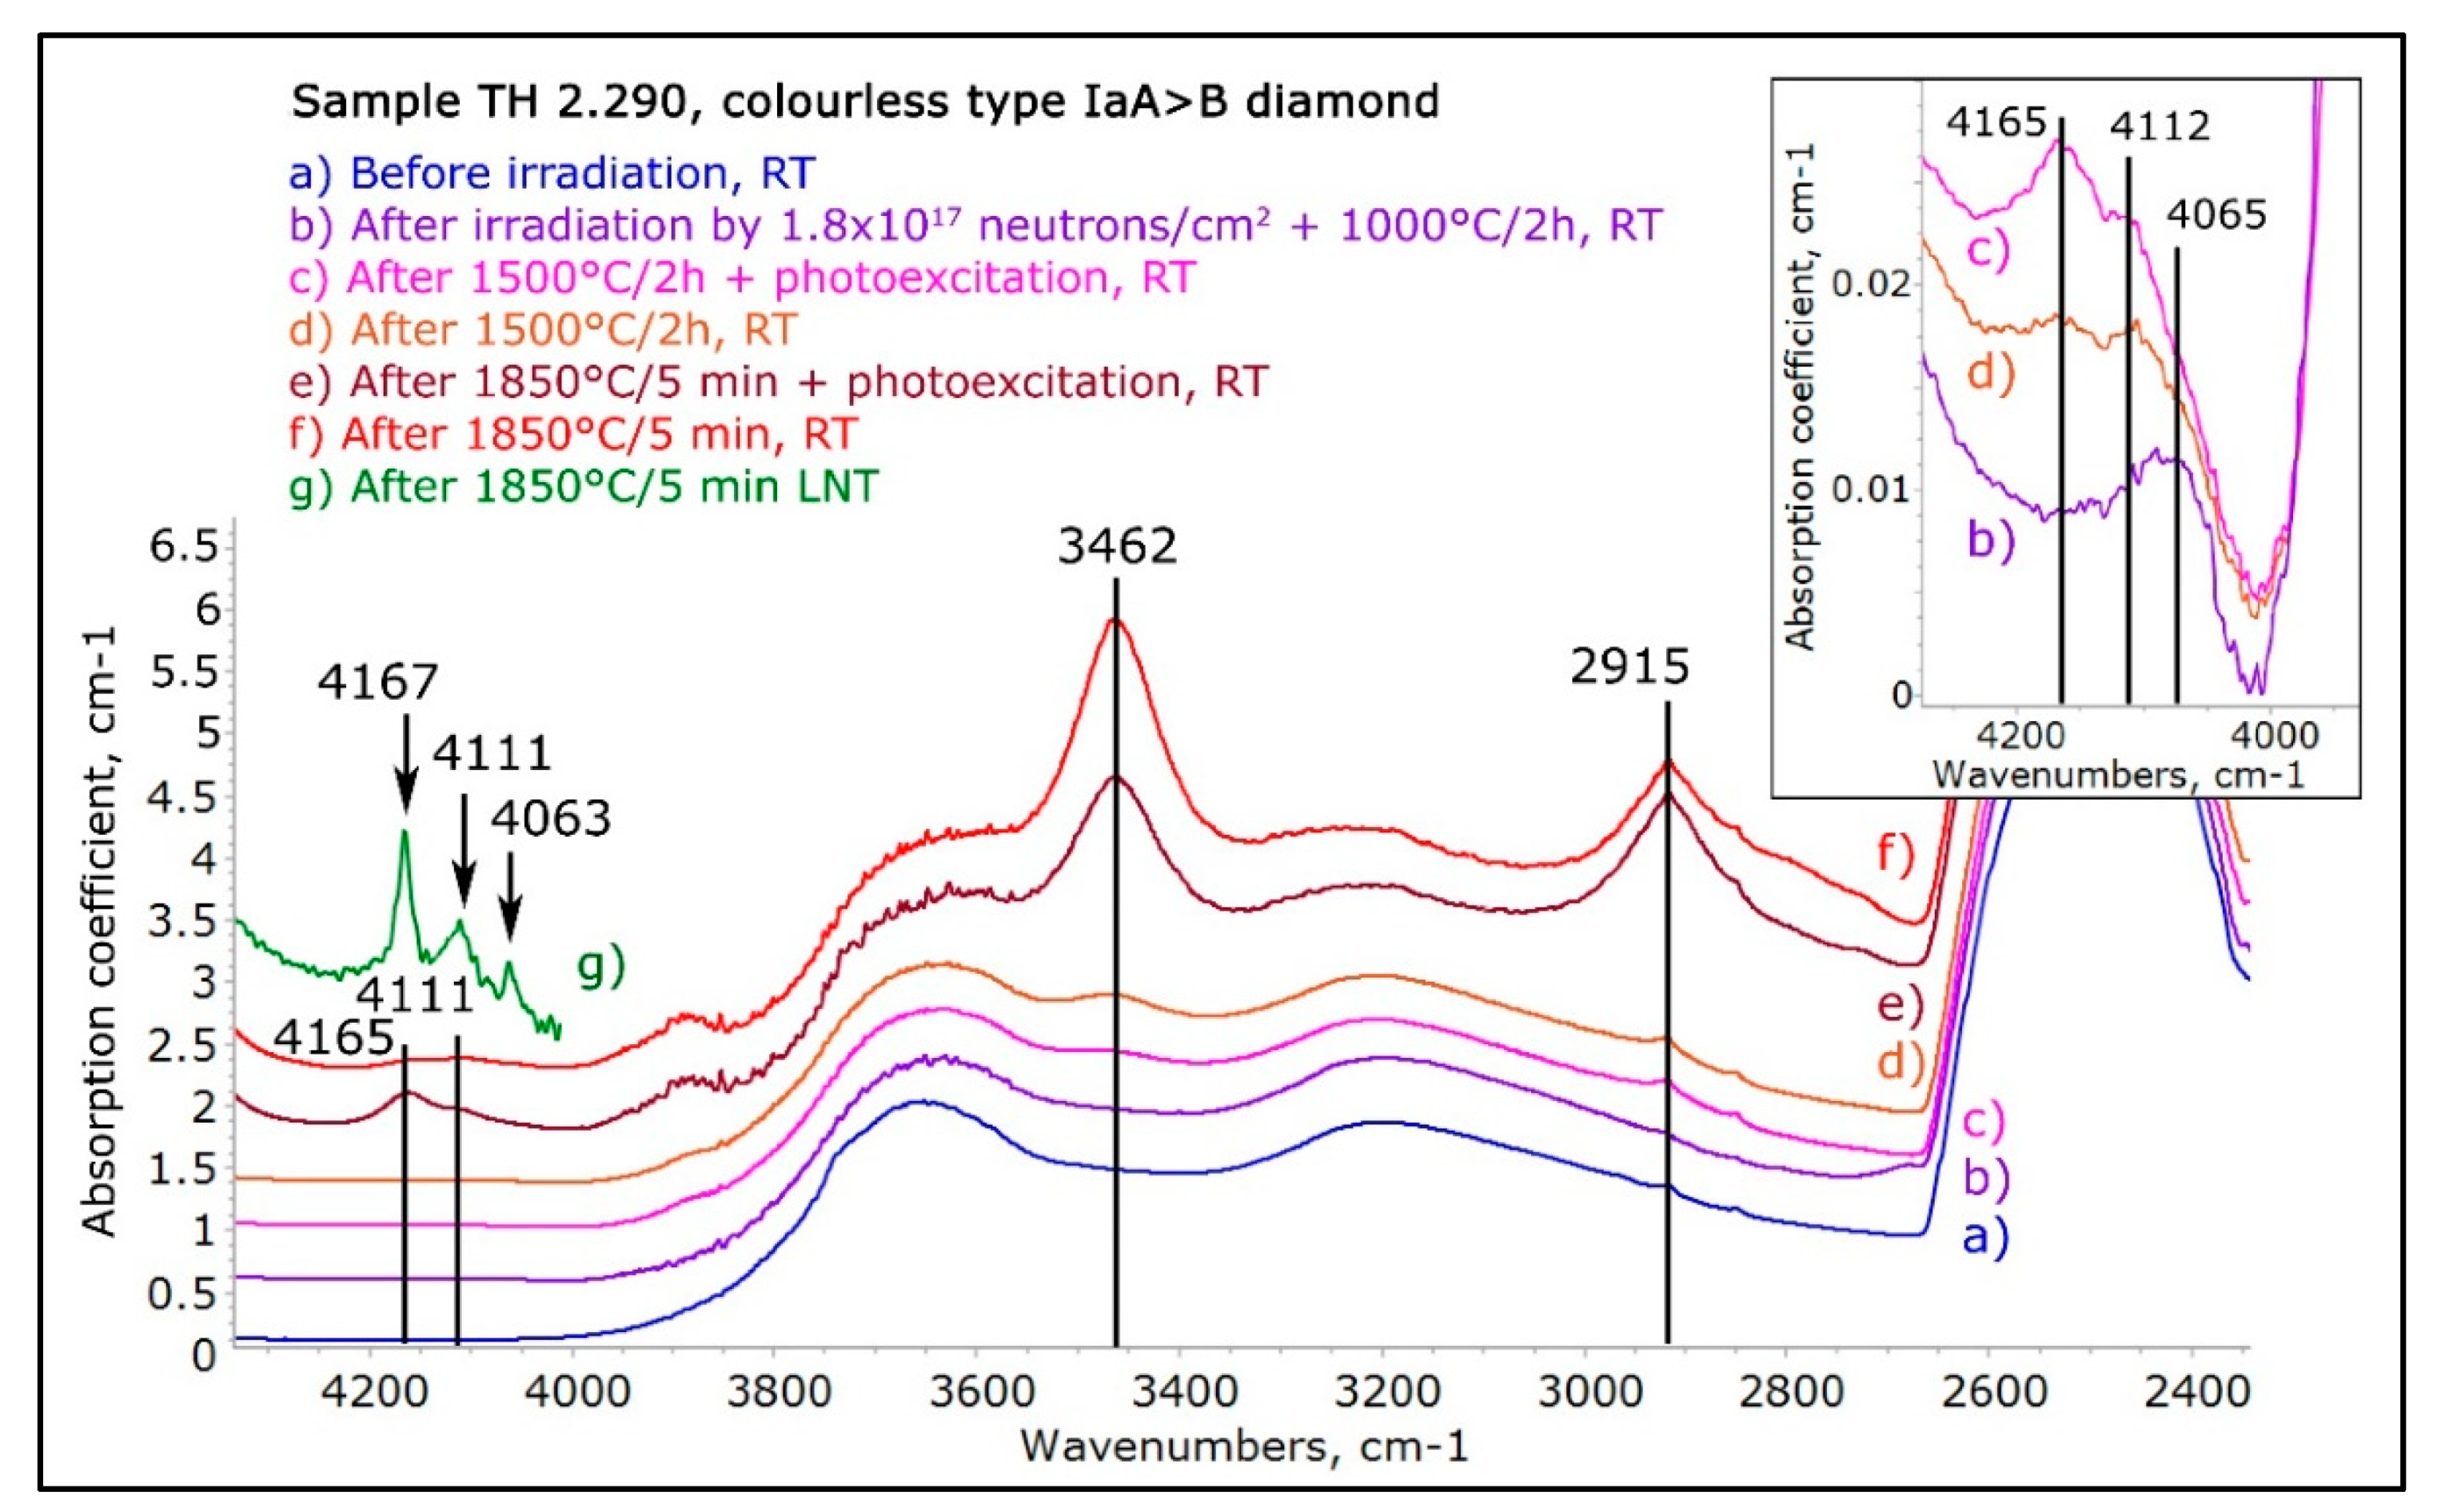
The IR/NIR spectra showing the evolution of an originally colorless type IaA>B “cape series” diamond before neutron treatment (trace a), after heavy neutron irradiation and annealing for 2h at 1000 °C (trace b), after 2h at 1500 °C (trace d), after 2h at 1500 °C with photoexcitation (trace c), after 1850 °C for 5 min (trace f) after 1850 °C for 5 min with photoexcitation (trace e), and, finally, the low temperature NIR spectrum after 1850 °C for 5 min (trace g). At 1000 °C, a weak 4065 cm−1 absorption was formed, After 1500 °C, weak 4165 and 4112 cm−1 absorptions were apparent plus the absorption at 3462 cm−1 appeared and a hint of the 2915 cm−1 absorption was detectable; photoexcitation caused the 3462 cm−1 band to decrease while the 4165 cm−1 peak increased. After 1850 °C, the spectral features detected after annealing at 1500 °C became distinctly stronger, but their behavior remained identical. The spectrum recorded with the diamond at 77 K shown in trace g demonstrates the distinct increase, sharpening and peak shifting of the three peaks at low temperature. The peak shapes, positions, photoexcitation, and low temperature behavior are all identical to what has been described for the ACs, and hence it appears highly likely that what was created are indeed treatment-induced ACs. The spectra were shifted vertically for clarity.
Figure 11.
The IR/NIR spectra showing the evolution of an originally colorless type IaA>B “cape series” diamond before neutron treatment (trace a), after heavy neutron irradiation and annealing for 2h at 1000 °C (trace b), after 2h at 1500 °C (trace d), after 2h at 1500 °C with photoexcitation (trace c), after 1850 °C for 5 min (trace f) after 1850 °C for 5 min with photoexcitation (trace e), and, finally, the low temperature NIR spectrum after 1850 °C for 5 min (trace g). At 1000 °C, a weak 4065 cm−1 absorption was formed, After 1500 °C, weak 4165 and 4112 cm−1 absorptions were apparent plus the absorption at 3462 cm−1 appeared and a hint of the 2915 cm−1 absorption was detectable; photoexcitation caused the 3462 cm−1 band to decrease while the 4165 cm−1 peak increased. After 1850 °C, the spectral features detected after annealing at 1500 °C became distinctly stronger, but their behavior remained identical. The spectrum recorded with the diamond at 77 K shown in trace g demonstrates the distinct increase, sharpening and peak shifting of the three peaks at low temperature. The peak shapes, positions, photoexcitation, and low temperature behavior are all identical to what has been described for the ACs, and hence it appears highly likely that what was created are indeed treatment-induced ACs. The spectra were shifted vertically for clarity.
![Minerals 10 00903 g011]()
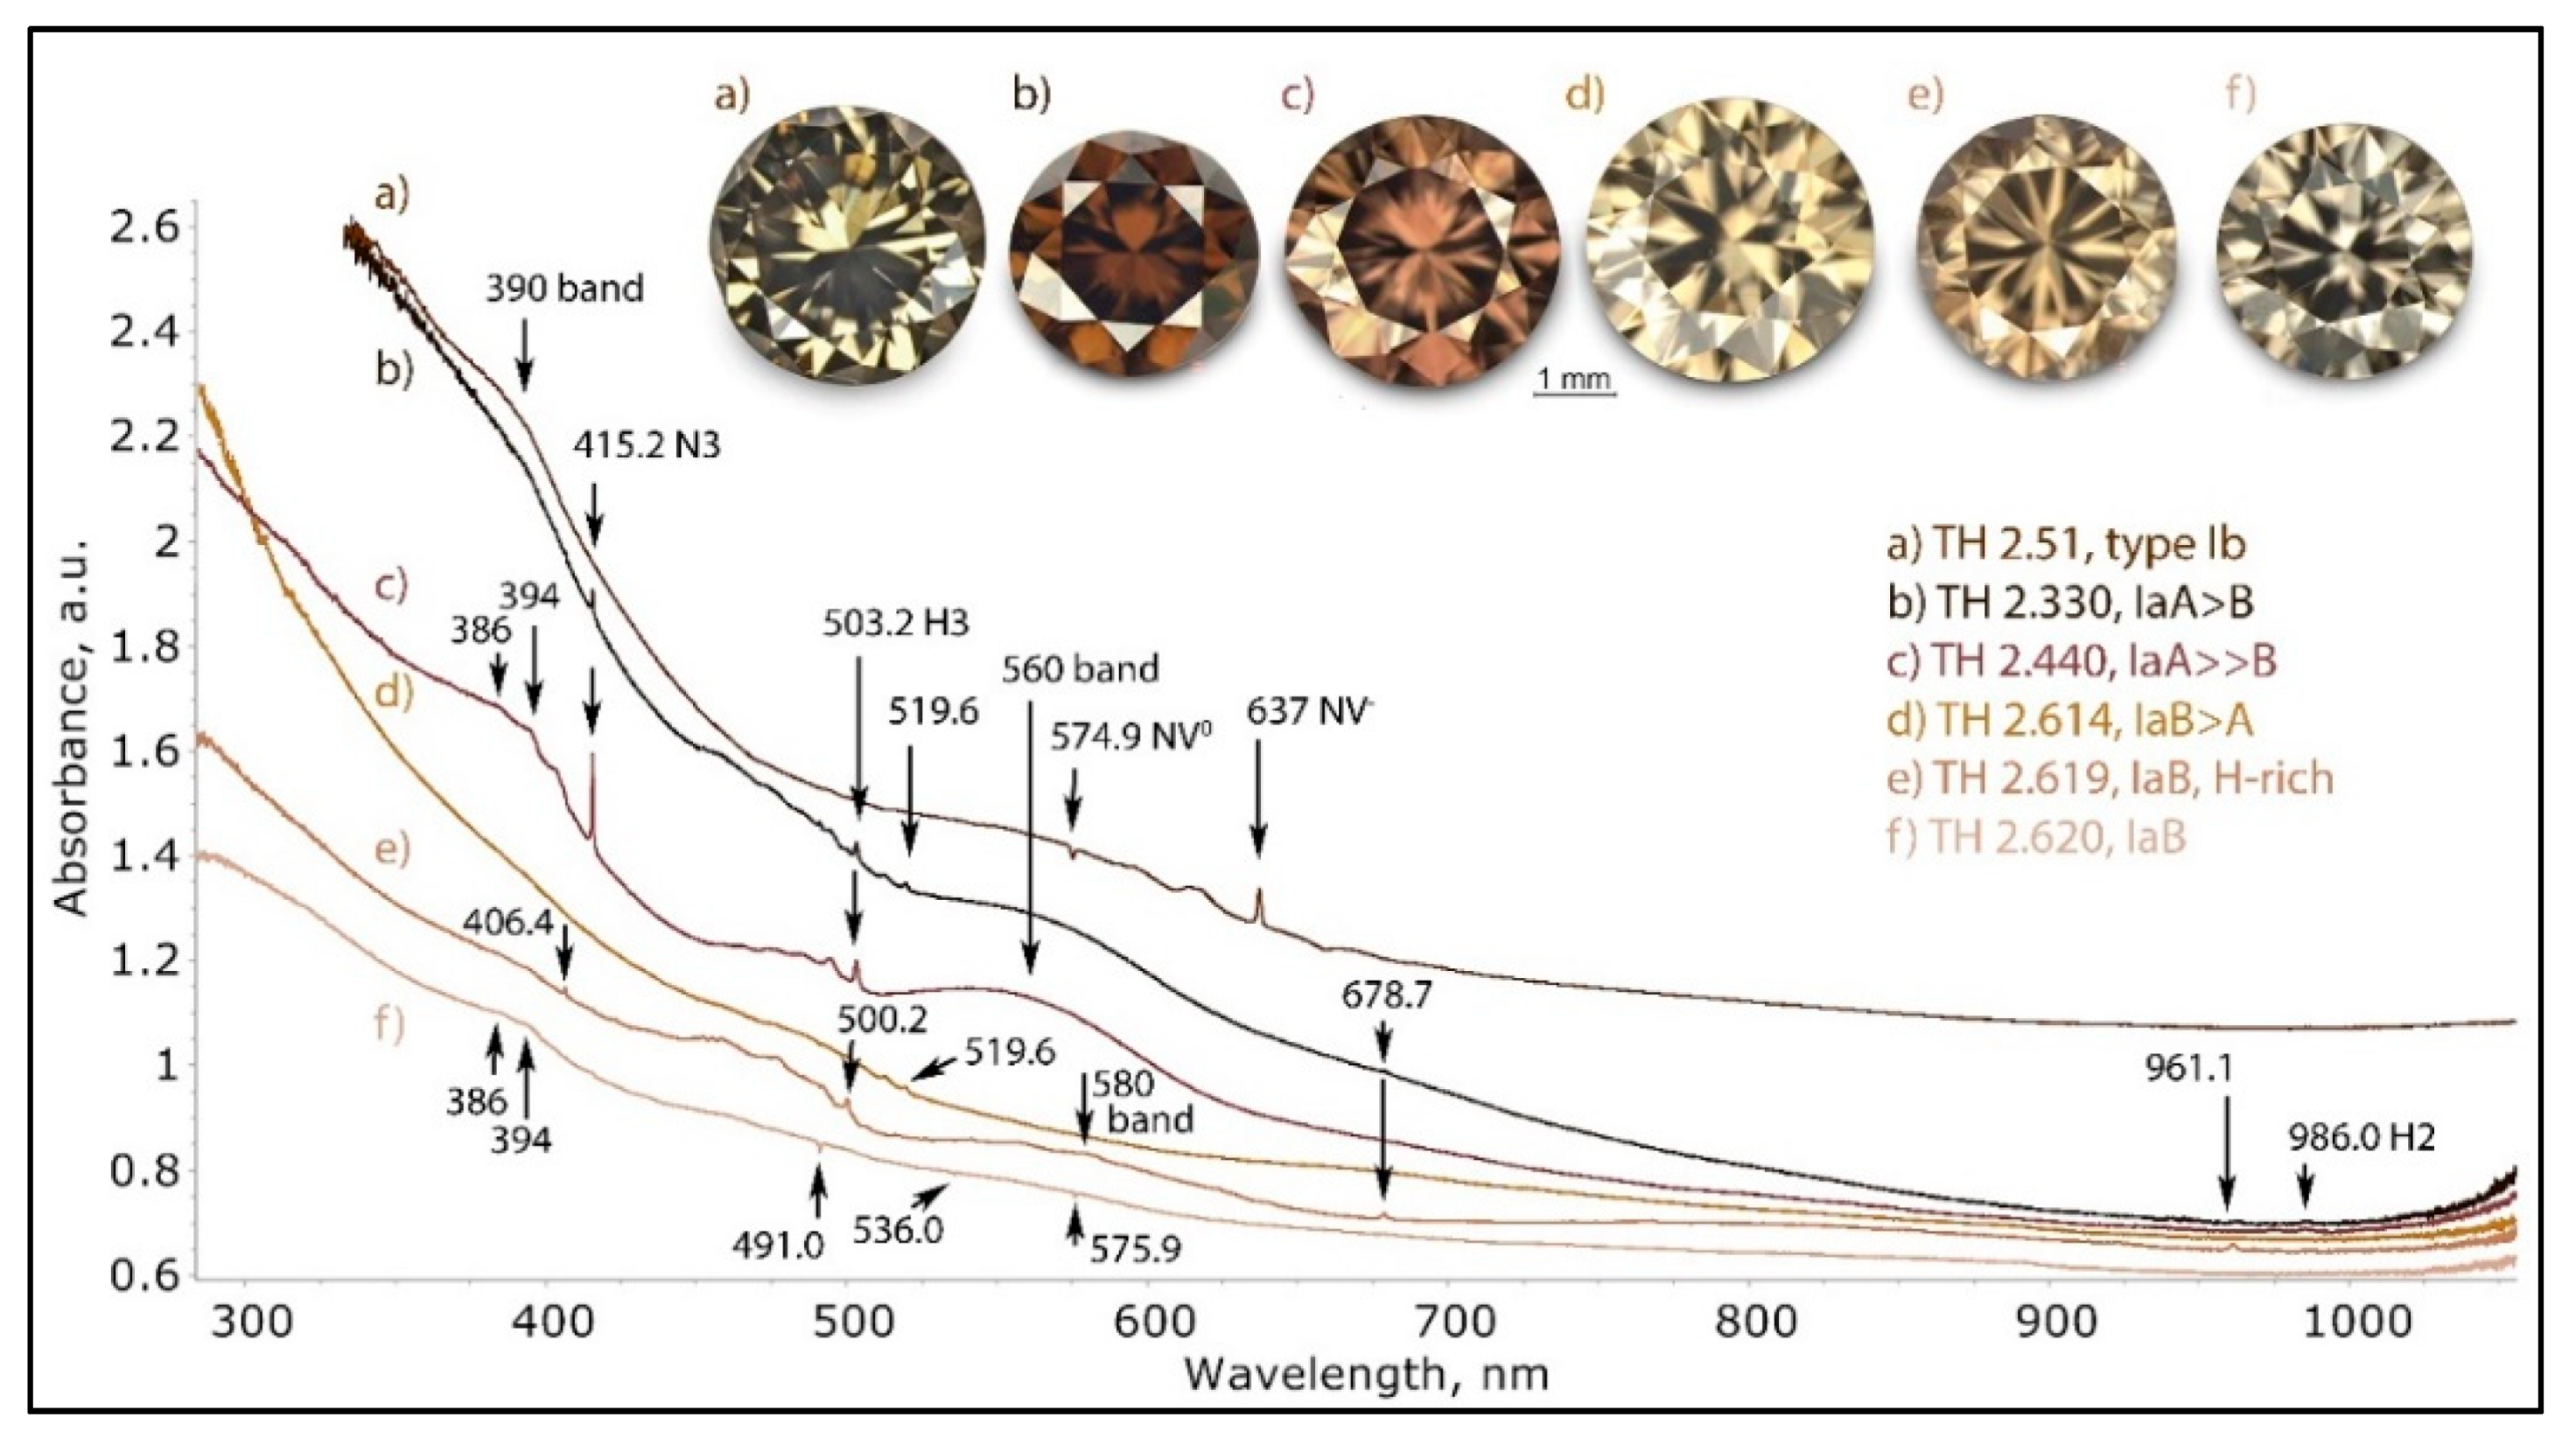
Figure 12.
The range of UV-Vis-NIR spectra of type I brown diamonds with a plastic deformation-related color is shown in this graph. The brown color itself originates in all cases mainly from the continuum absorption that is relatively flat and steadily increasing from the NIR to UV. Since the indexed overlaying absorptions are all comparatively weak, they have only a limited influence on the color. A notable exception is the 560 nm band, which causes a pink hue added to the brown. The spectra were shifted vertically for clarity.
Figure 13.
The UV-Vis-NIR spectra of stones from the color suite shown in
Figure 7 demonstrate that the darkness of the brown diamonds is represented by the steepness of the absorption continuum. The spectra shown are the most common type of UV-Vis-NIR spectra, with a characteristic continuum, weak N3 and H3 absorption and often a detectable 560 nm band. The spectra were shifted vertically for clarity.
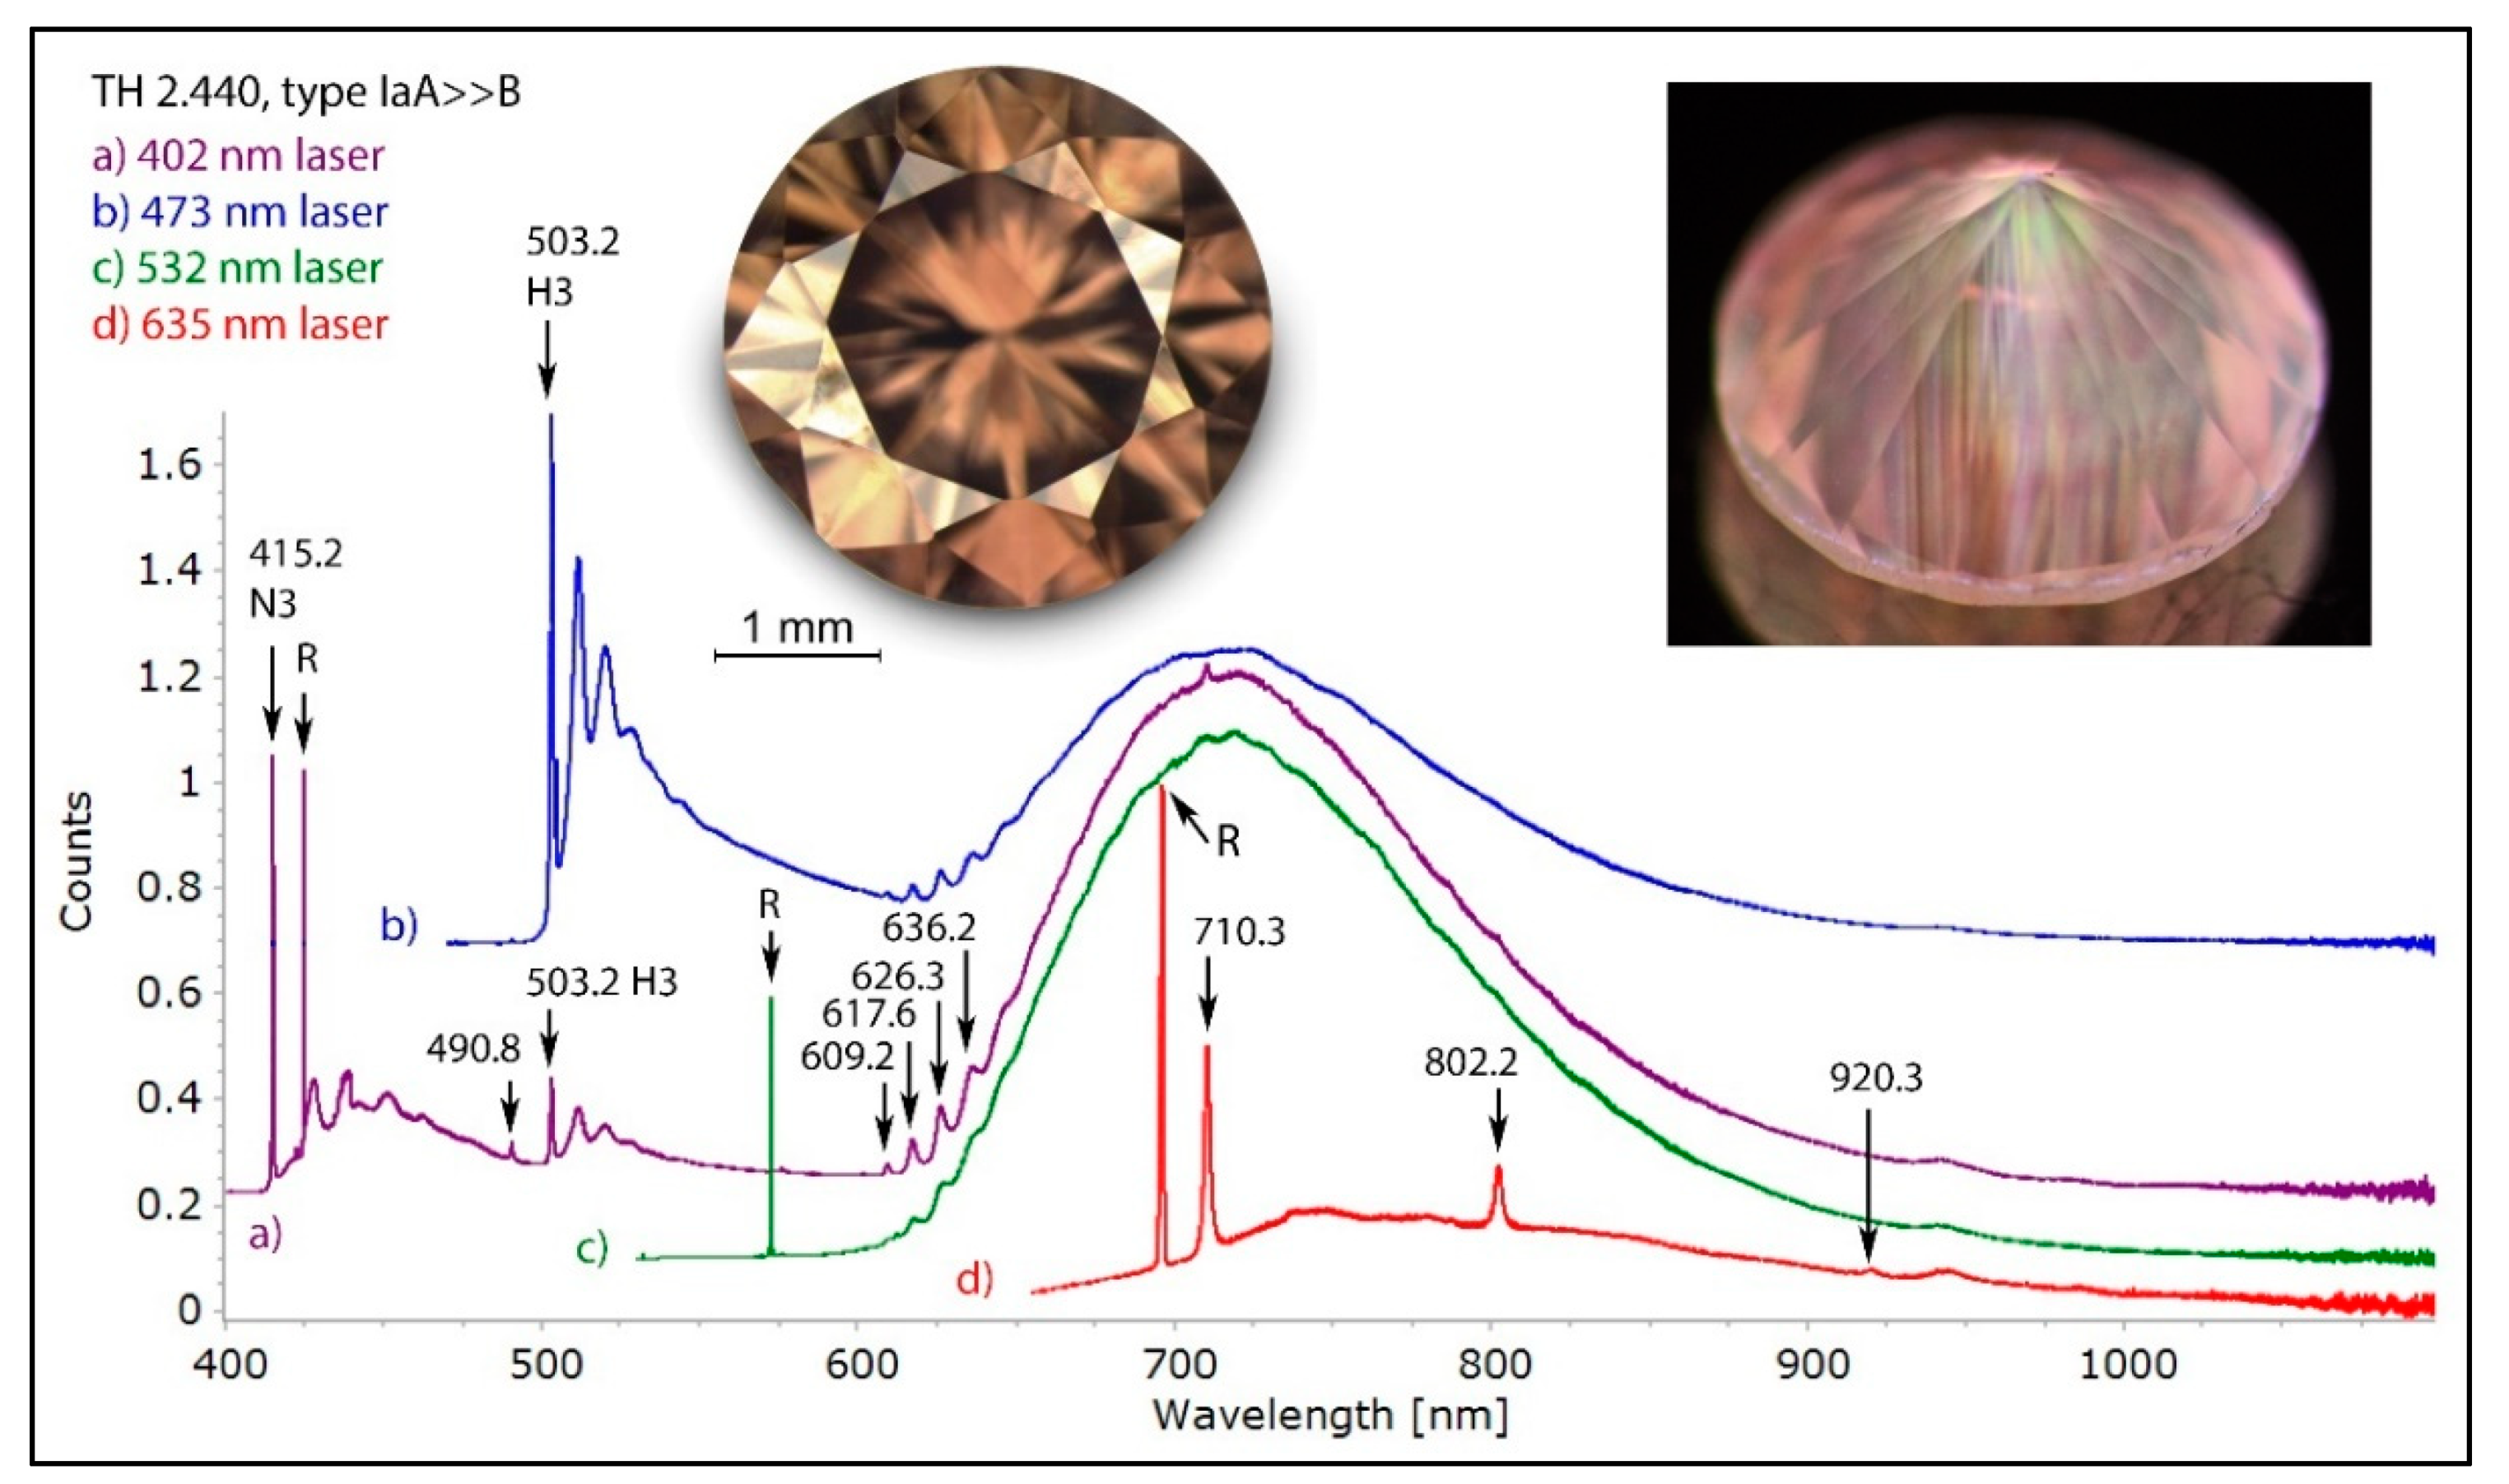
Figure 14.
The low temperature PL spectra of a pinkish brown type IaA>>B diamond with a deformation-related color, recorded with four different lasers. Besides the omnipresent H3 defect and the 490.8 nm defect, the most characteristic band seen in most of such diamonds is the 617.6/626.3 nm defect with its associated broad vibronic band centered approximately at 720 nm. This defect is responsible for the pink fluorescence seen in the diamond under DFI 340 nm excitation (photo inset, right). The spectra were shifted vertically for clarity.
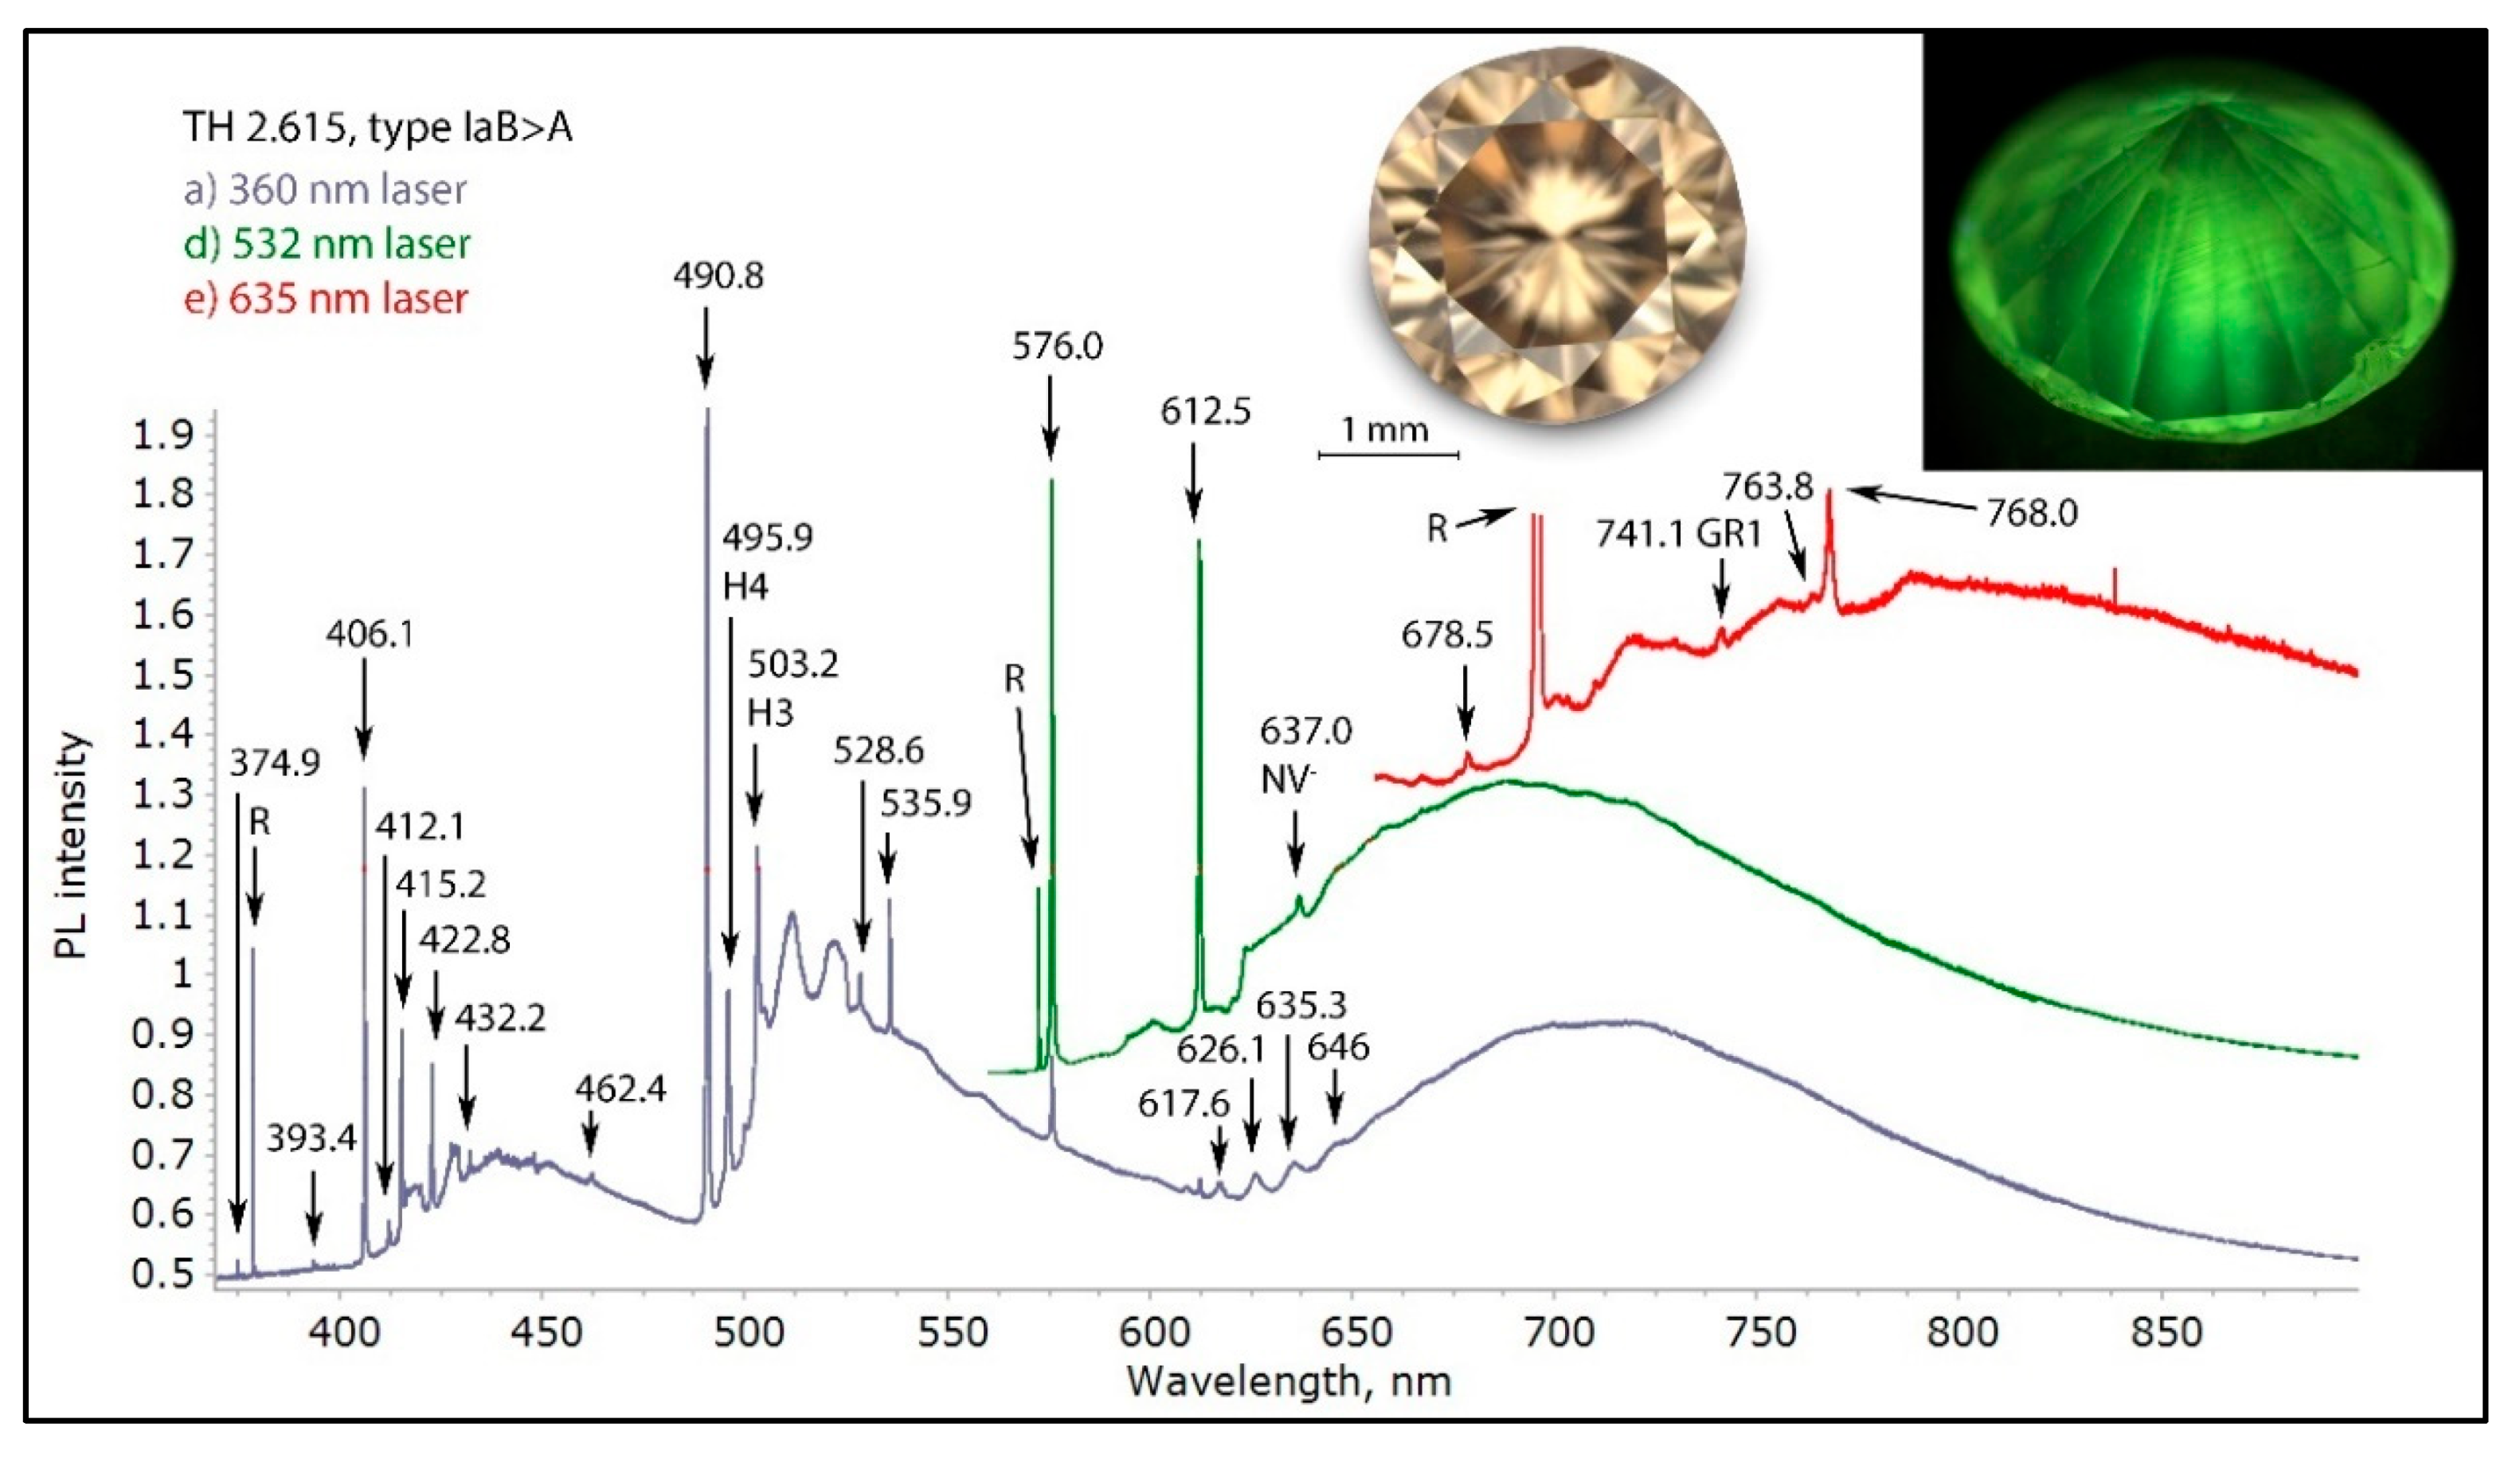
Figure 15.
The low temperature PL spectra of a brown type IaB>A diamond with a deformation-related color, recorded with three different laser excitations. Interesting in this diamond is that the blue component of the fluorescence is not mainly caused by the N3 center, but by the 406.1 nm defect. This defect is very common in DR brown diamonds, but rarely as intense as seen here. The other very typical defects for DR brown diamonds are 490.8, H4, H3, 535.9, 576.0, 612.5 and the 617.6/626.1 nm center. While in most brown diamonds the H3 defect is responsible for the commonly observed green fluorescence, in this diamond the 490.8 nm defect is dominantly responsible for the green fluorescence seen in the photo (inset, right). The spectra were shifted vertically for clarity.
Figure 16.
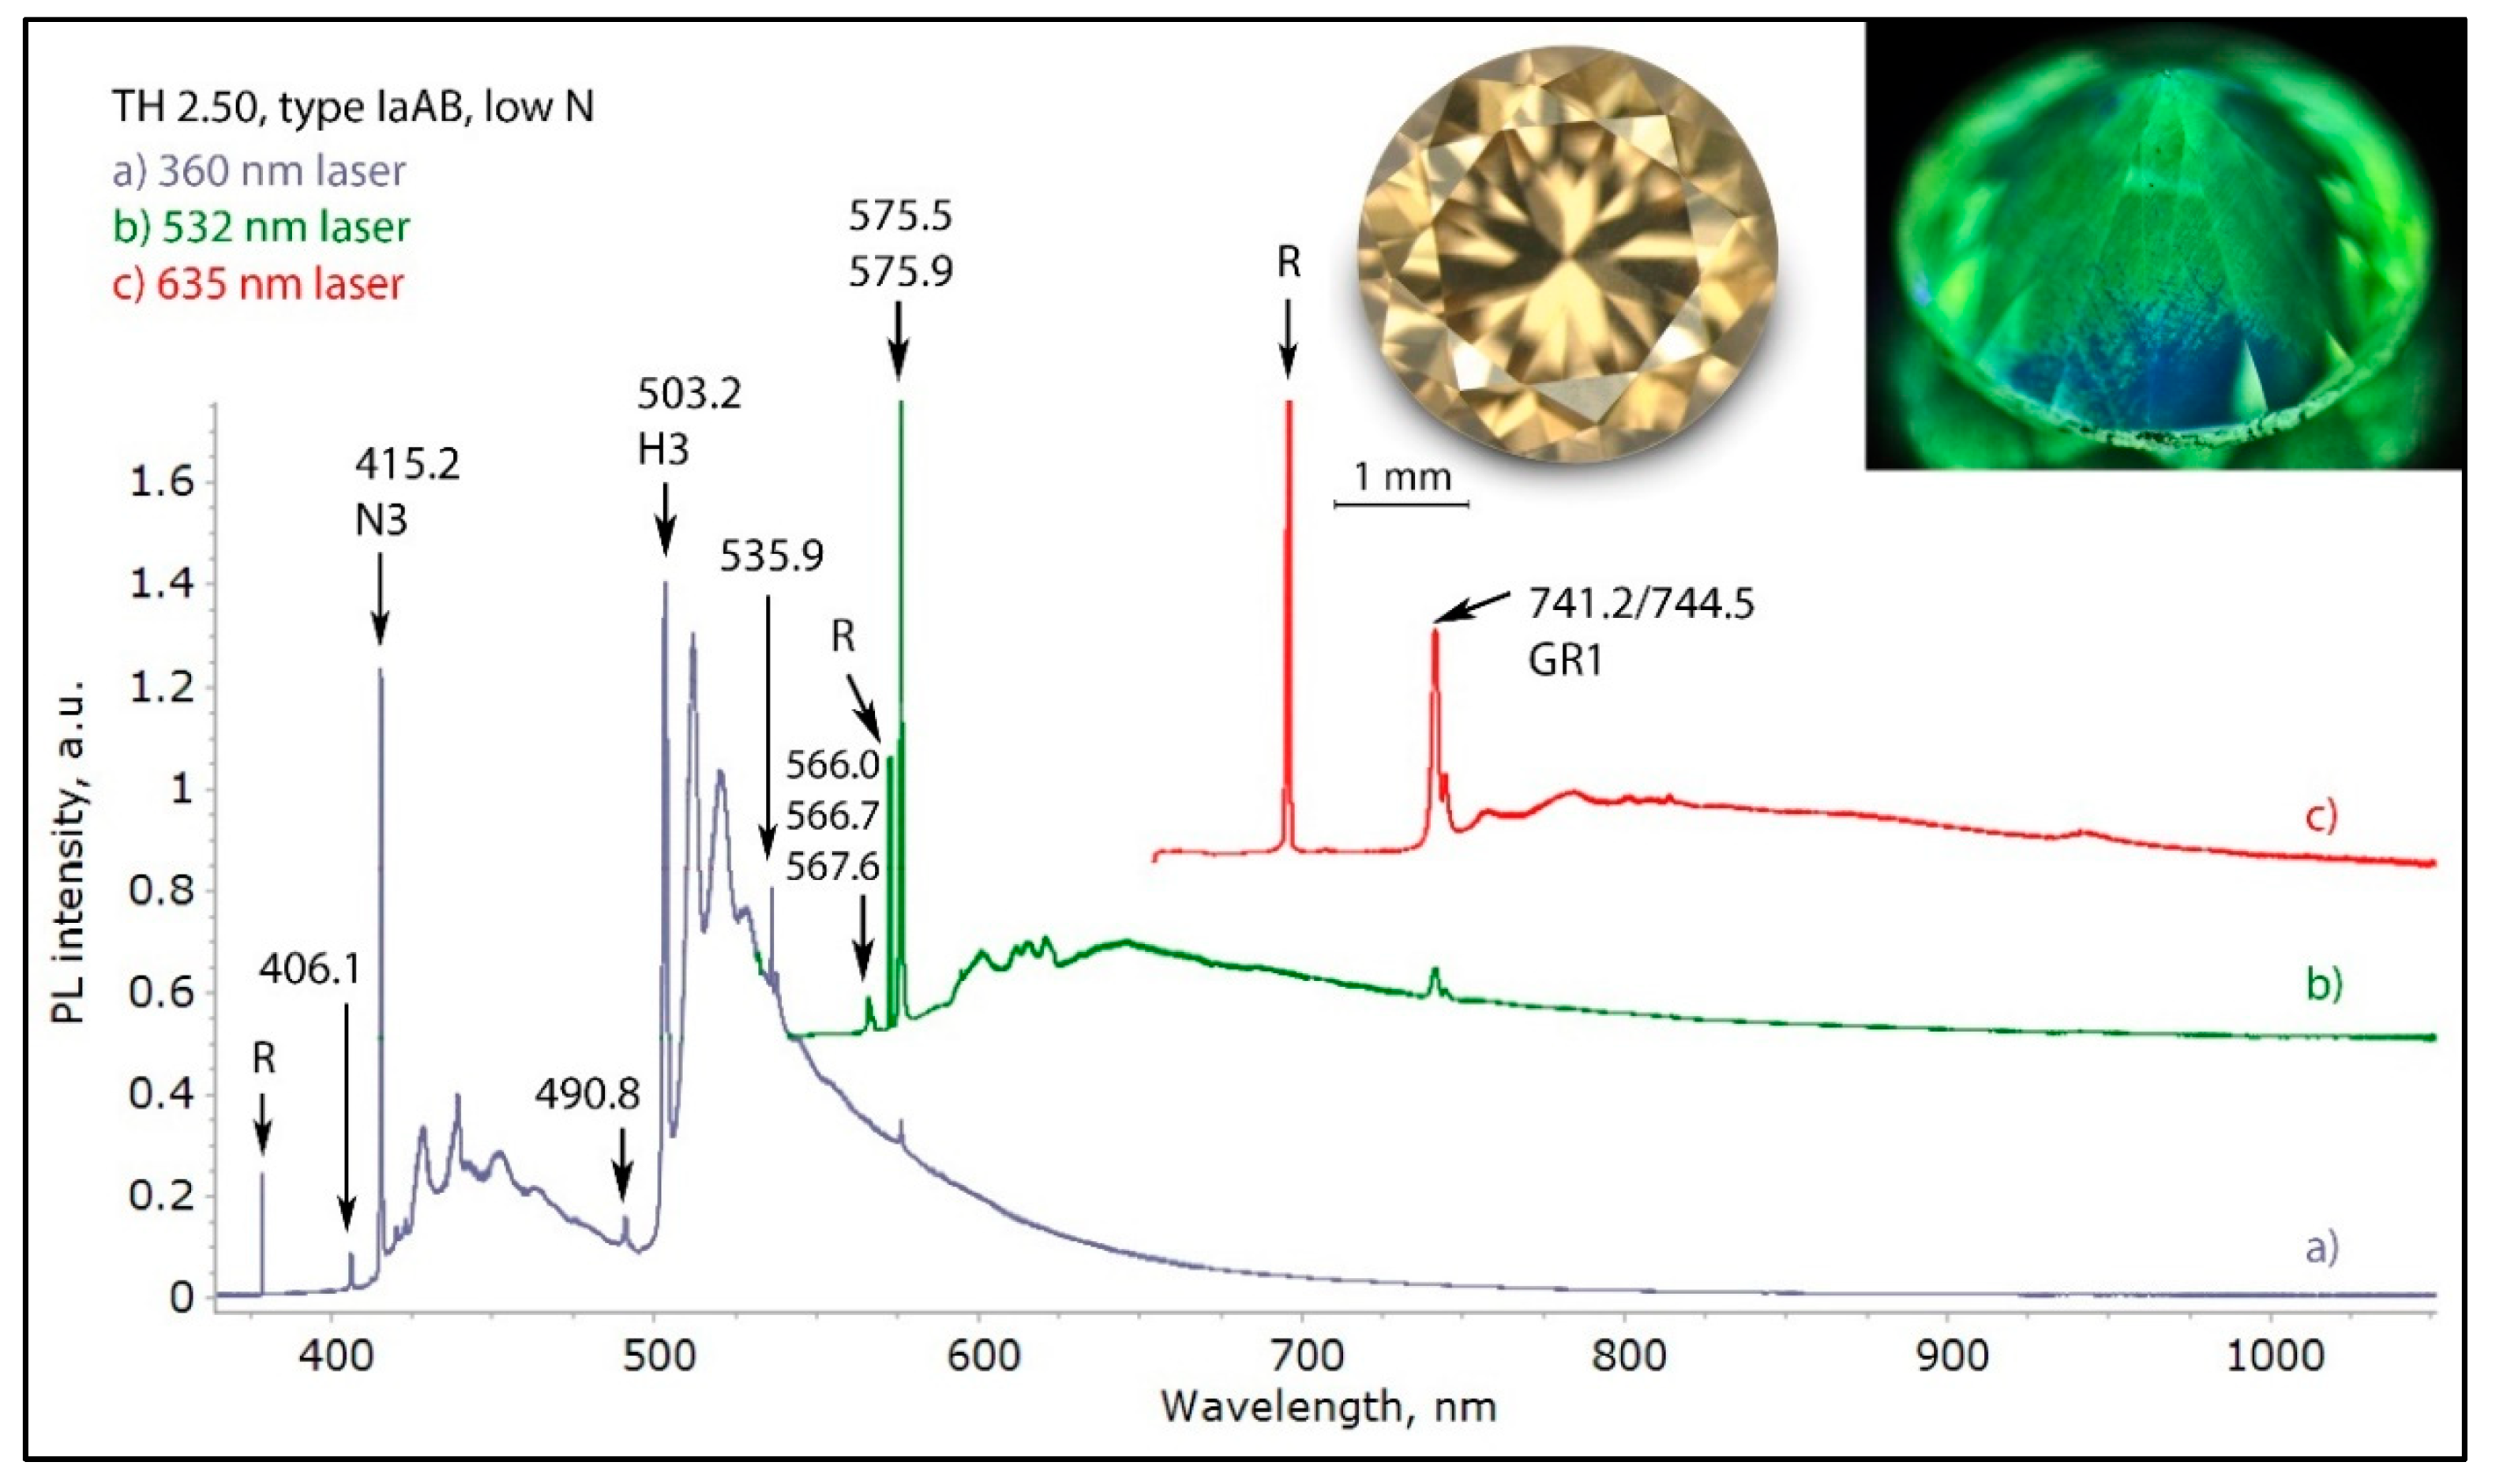
The low temperature PL spectra of a brown-yellow low nitrogen type IaAB diamond with a deformation-related color, recorded with three different laser excitations. While many of the defects observed are the same as the ones observed in higher nitrogen containing brown diamonds, some defects are notably absent with the most noteworthy being the 617.6/626.1 nm center. In this diamond, the H3 and N3 defects are responsible for the green and blue fluorescence seen in the photo (inset, right). This type of spectrum is similar to what can be seen for many type IIa diamonds. The spectra were shifted vertically for clarity.
Figure 16.
The low temperature PL spectra of a brown-yellow low nitrogen type IaAB diamond with a deformation-related color, recorded with three different laser excitations. While many of the defects observed are the same as the ones observed in higher nitrogen containing brown diamonds, some defects are notably absent with the most noteworthy being the 617.6/626.1 nm center. In this diamond, the H3 and N3 defects are responsible for the green and blue fluorescence seen in the photo (inset, right). This type of spectrum is similar to what can be seen for many type IIa diamonds. The spectra were shifted vertically for clarity.
Figure 17.
The 402 nm PL spectra of the pinkish brown type IaA>>B diamond shown in
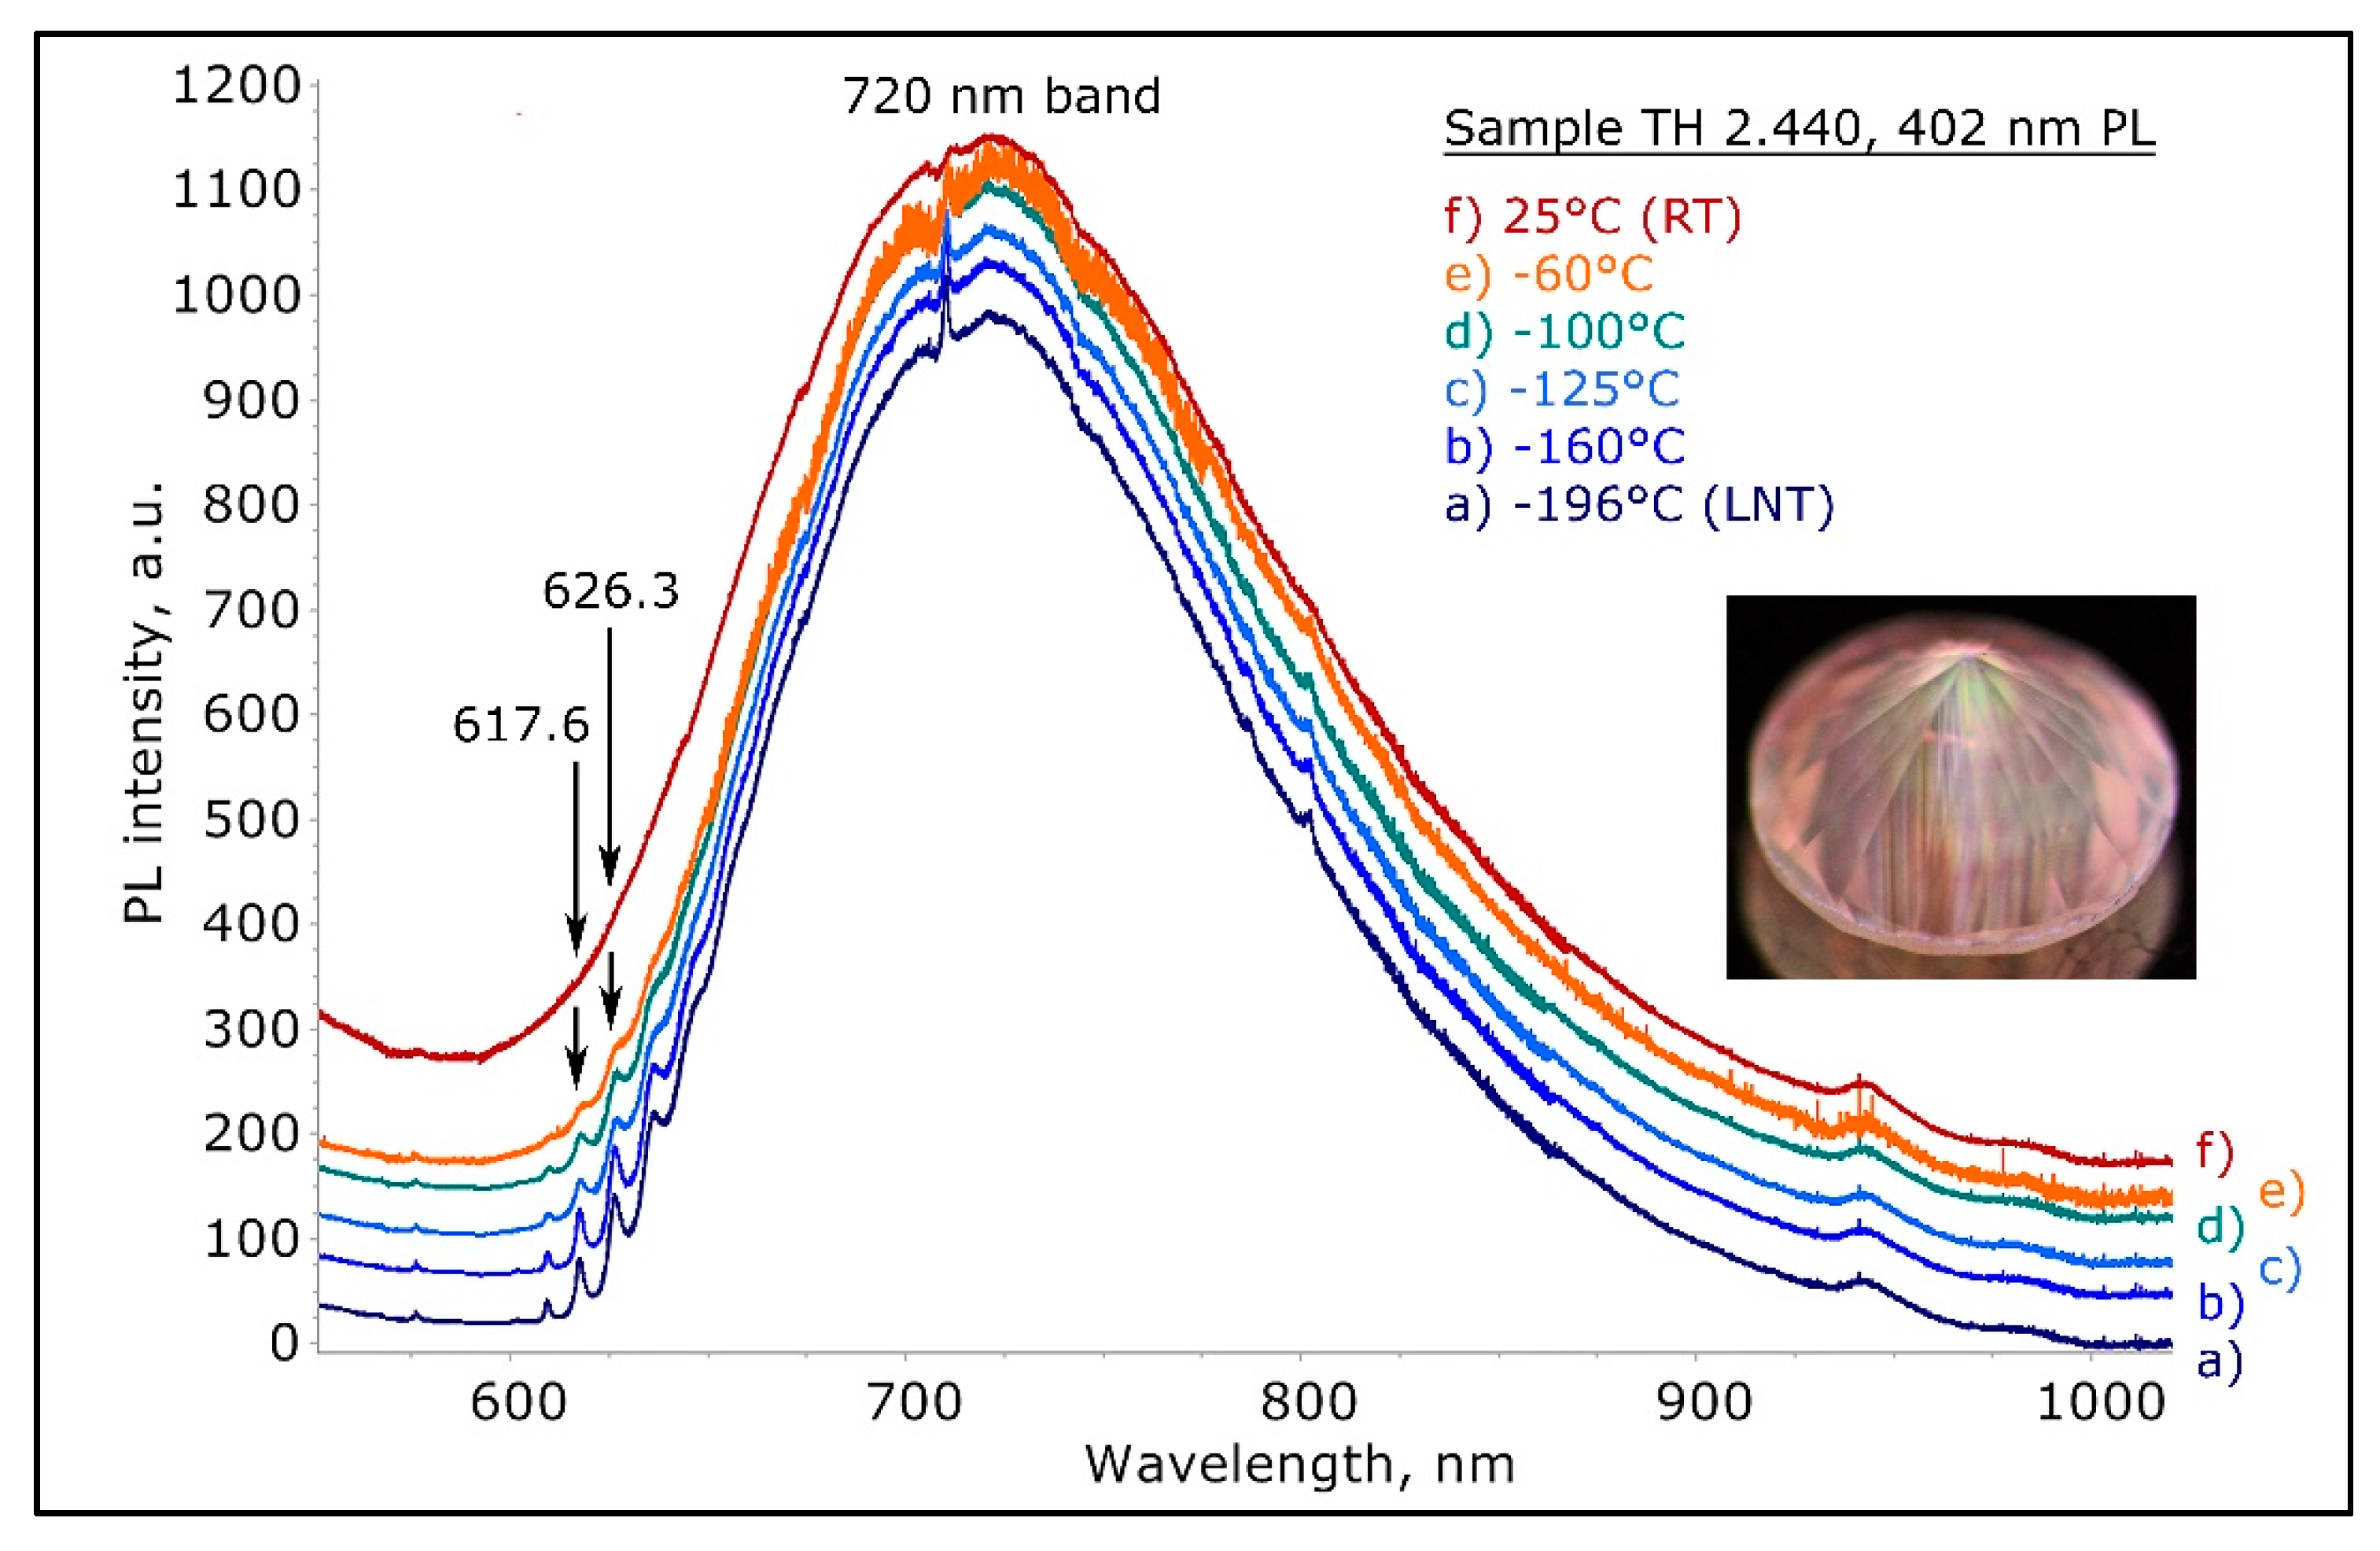
Figure 14, recorded at various temperatures from room temperature to −196 °C (LNT) and normalized to the intensity of the 720 nm band. The shape and behavior of the 617.6/626.3 nm peaks are indicative that these features represent zero phonon lines and not vibronic components. The correlation of these two ZPLs with the broad 720 nm band led us to suggest that they are the ZPLs of the defect responsible for the 720 nm band, hence the 720 nm band is the vibronic component. The spectra were shifted vertically for clarity.
Figure 17.
The 402 nm PL spectra of the pinkish brown type IaA>>B diamond shown in
Figure 14, recorded at various temperatures from room temperature to −196 °C (LNT) and normalized to the intensity of the 720 nm band. The shape and behavior of the 617.6/626.3 nm peaks are indicative that these features represent zero phonon lines and not vibronic components. The correlation of these two ZPLs with the broad 720 nm band led us to suggest that they are the ZPLs of the defect responsible for the 720 nm band, hence the 720 nm band is the vibronic component. The spectra were shifted vertically for clarity.
Figure 18.
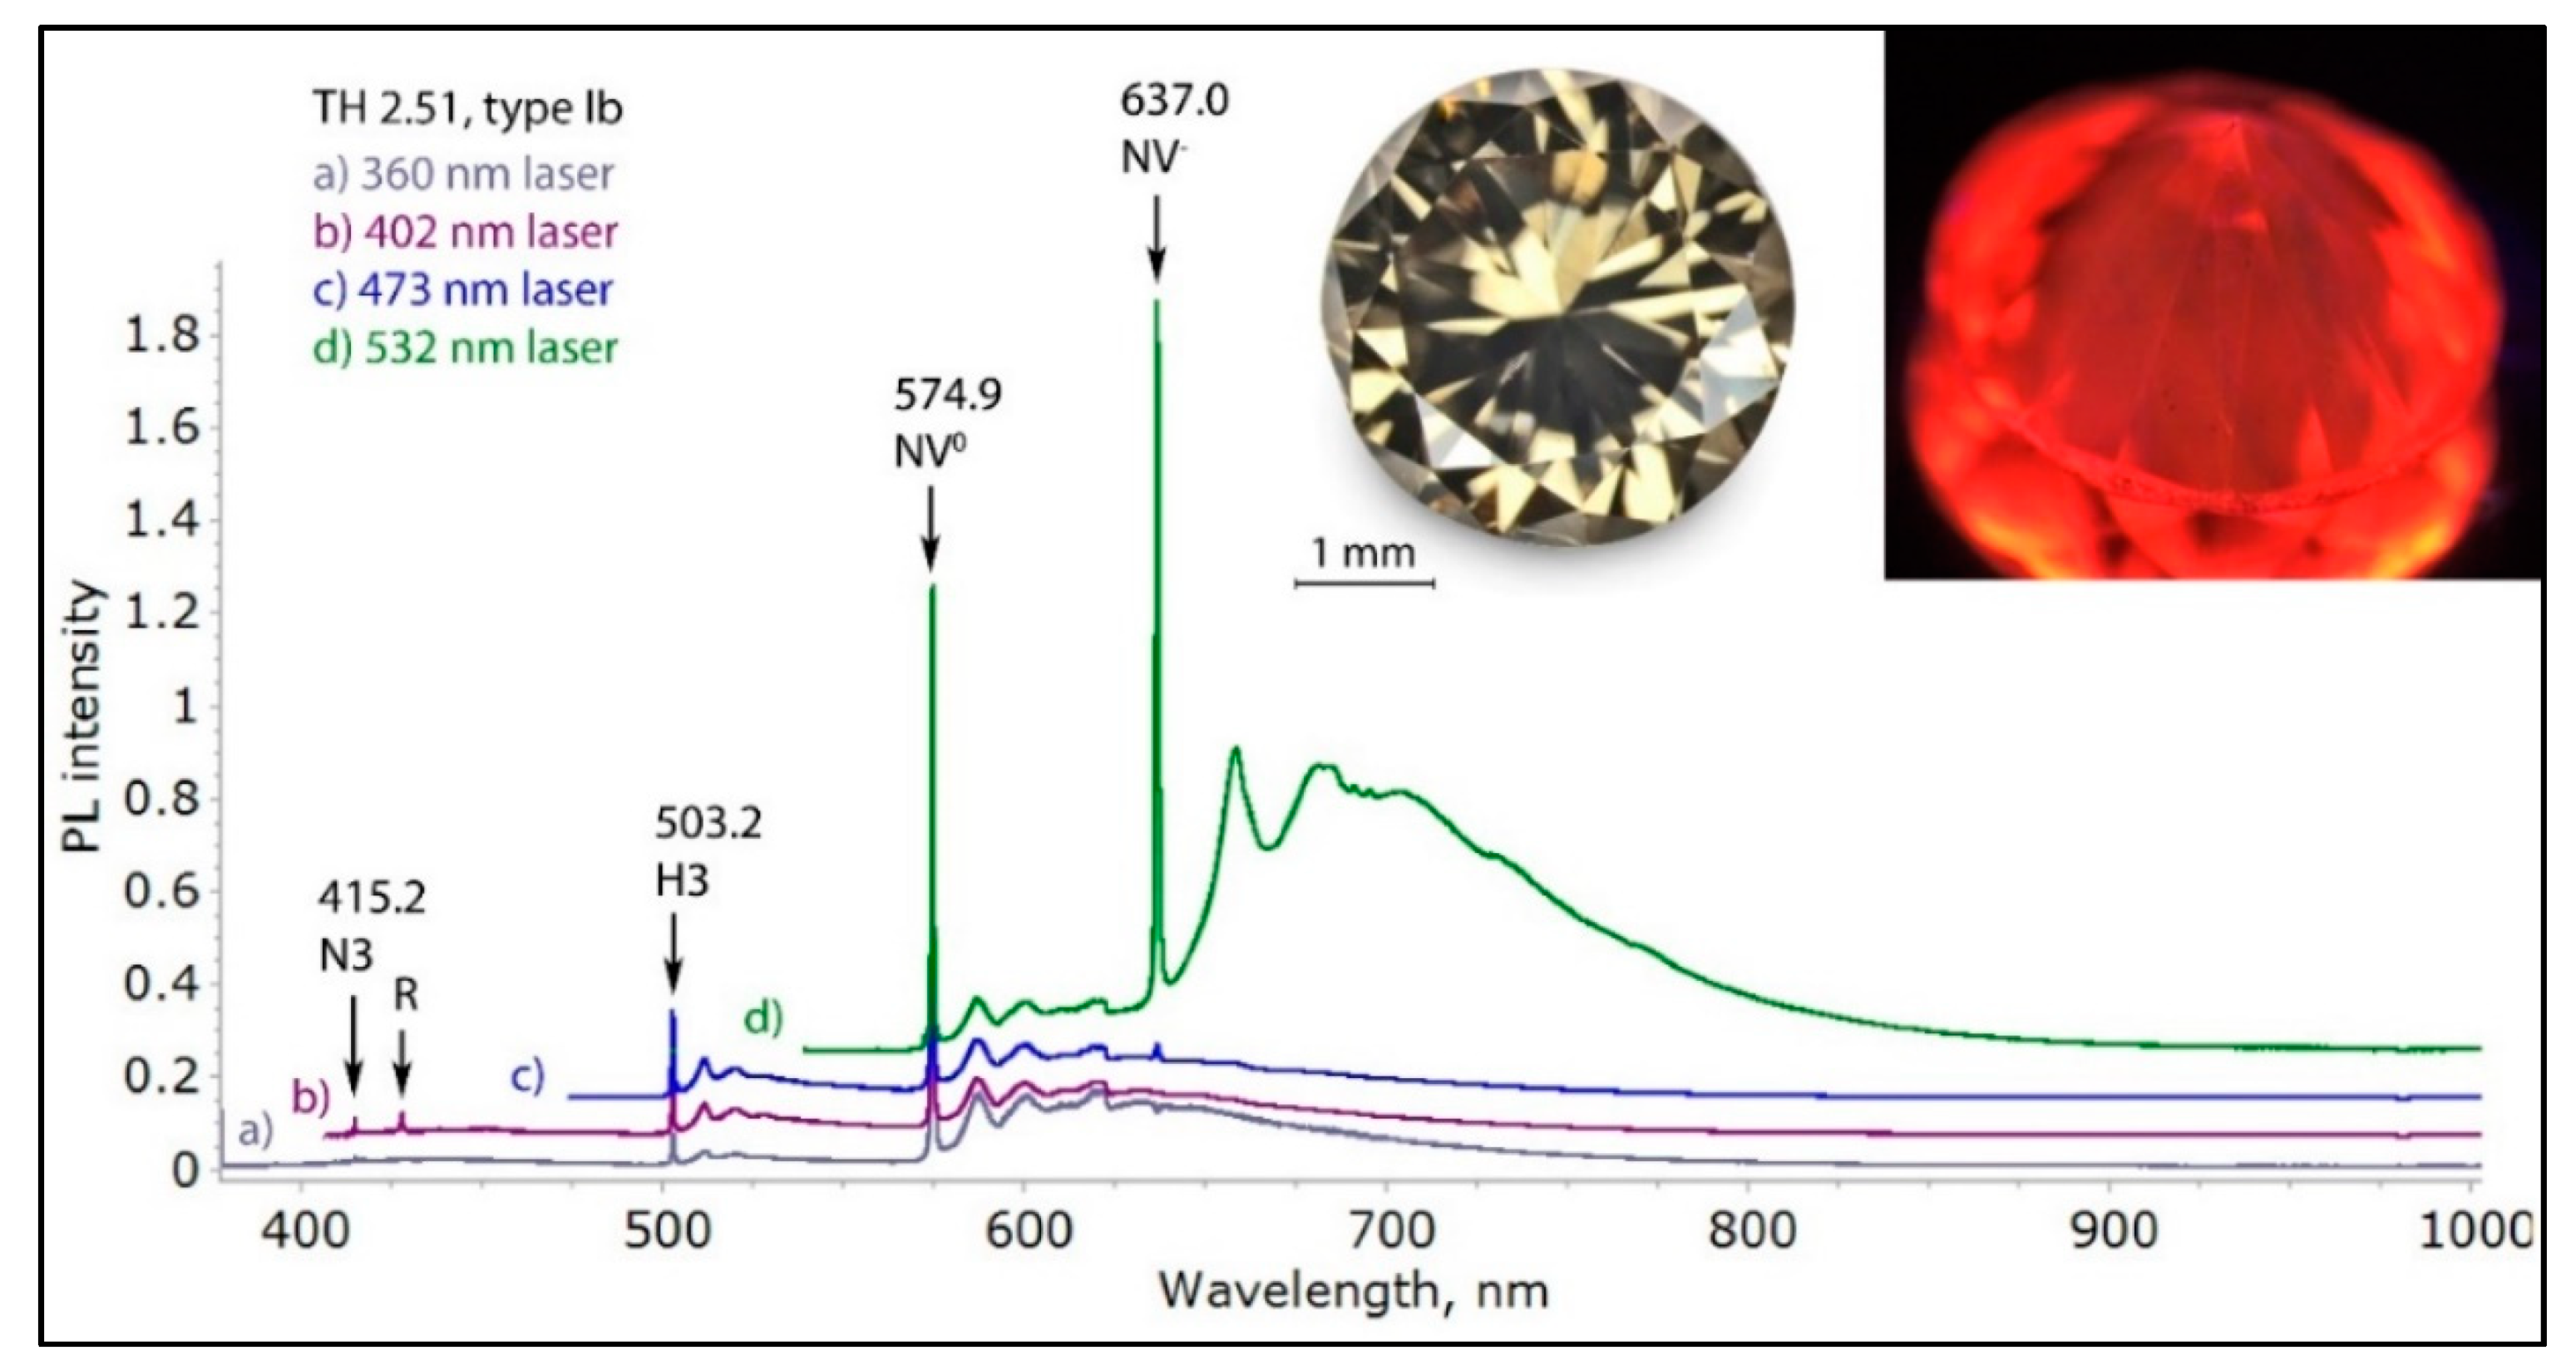
The low temperature PL spectra of a very rare brown low nitrogen type Ib diamond with a deformation-related color, recorded with four different laser excitations. The spectra of such diamonds are always dominated by NV0 and NV− centers, combined with the H3 defect. In this diamond, the NV0 defects are responsible for the red orange fluorescence seen in the photo (inset, right). The spectra were shifted vertically for clarity.
Figure 18.
The low temperature PL spectra of a very rare brown low nitrogen type Ib diamond with a deformation-related color, recorded with four different laser excitations. The spectra of such diamonds are always dominated by NV0 and NV− centers, combined with the H3 defect. In this diamond, the NV0 defects are responsible for the red orange fluorescence seen in the photo (inset, right). The spectra were shifted vertically for clarity.
Figure 19.
A light brown type IaA>B diamond (sample TH 2.435) under three different UV excitations of the DFI system. The images clearly show the defect distribution along the deformation-related slip planes along (111).
Figure 19.
A light brown type IaA>B diamond (sample TH 2.435) under three different UV excitations of the DFI system. The images clearly show the defect distribution along the deformation-related slip planes along (111).
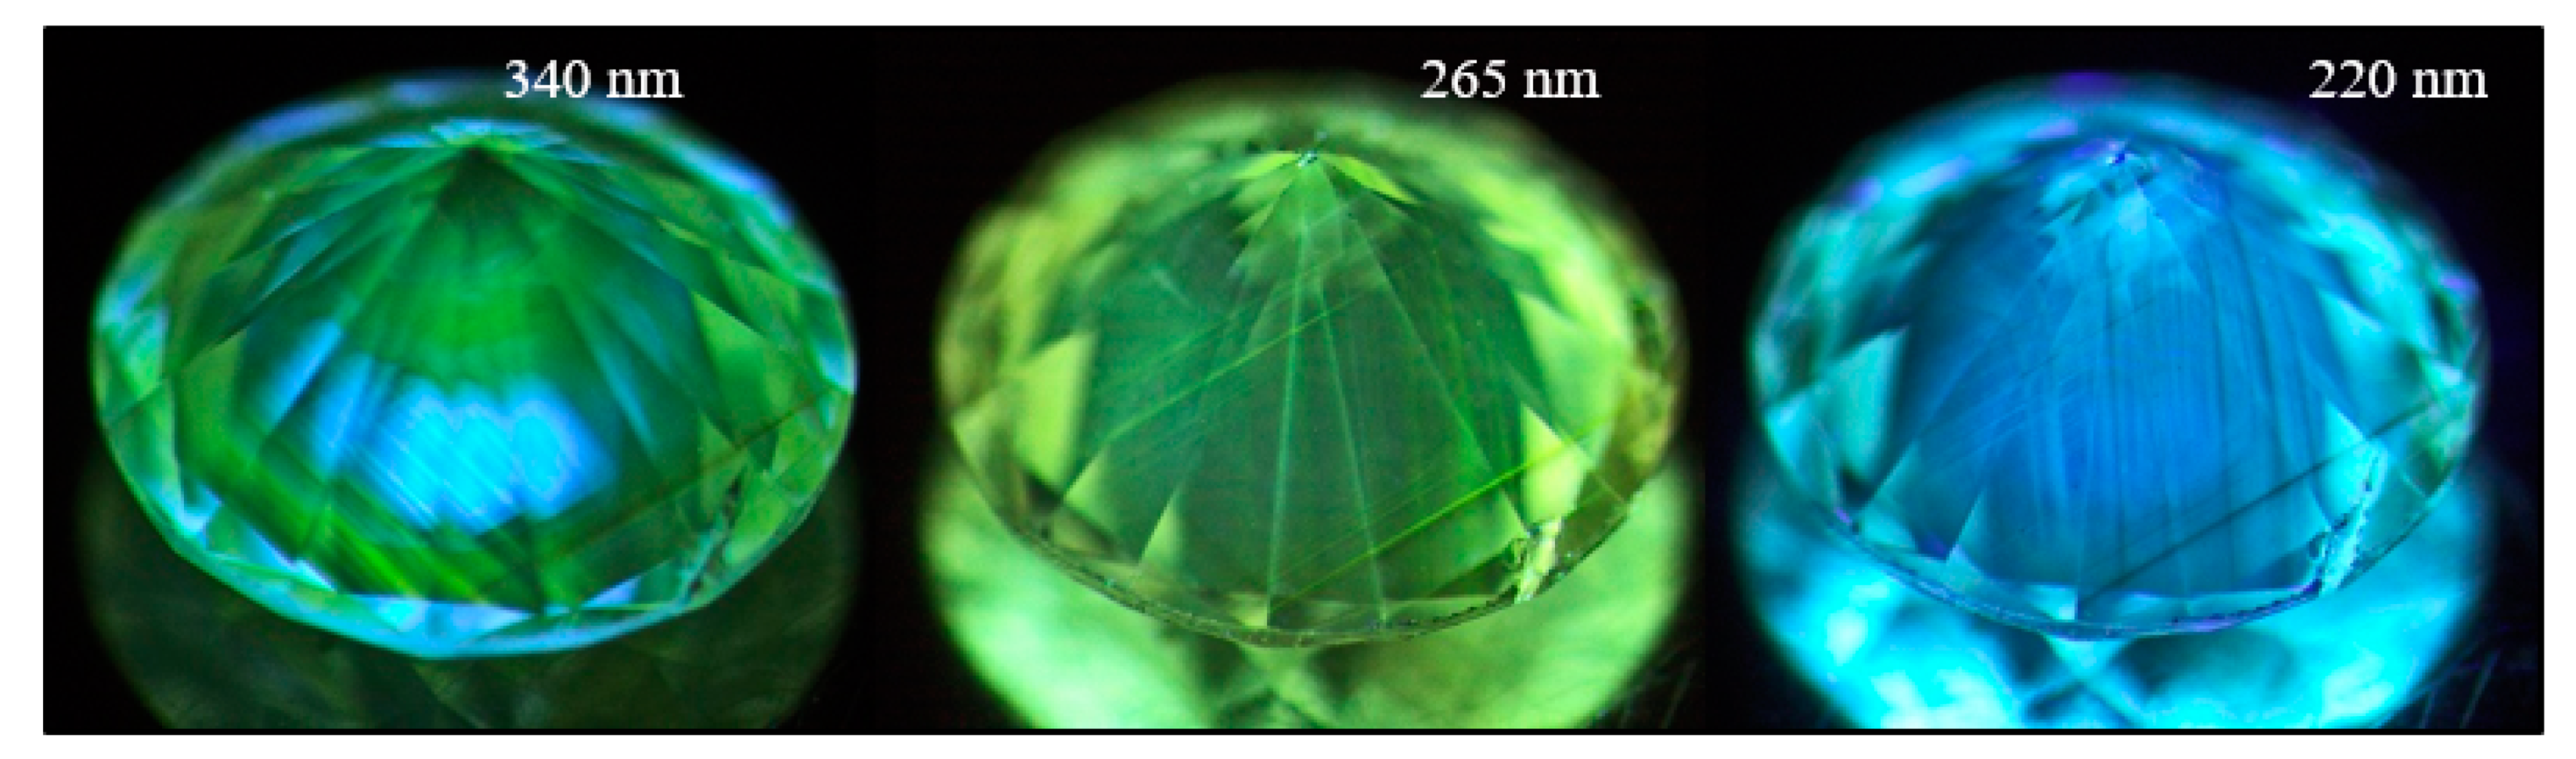
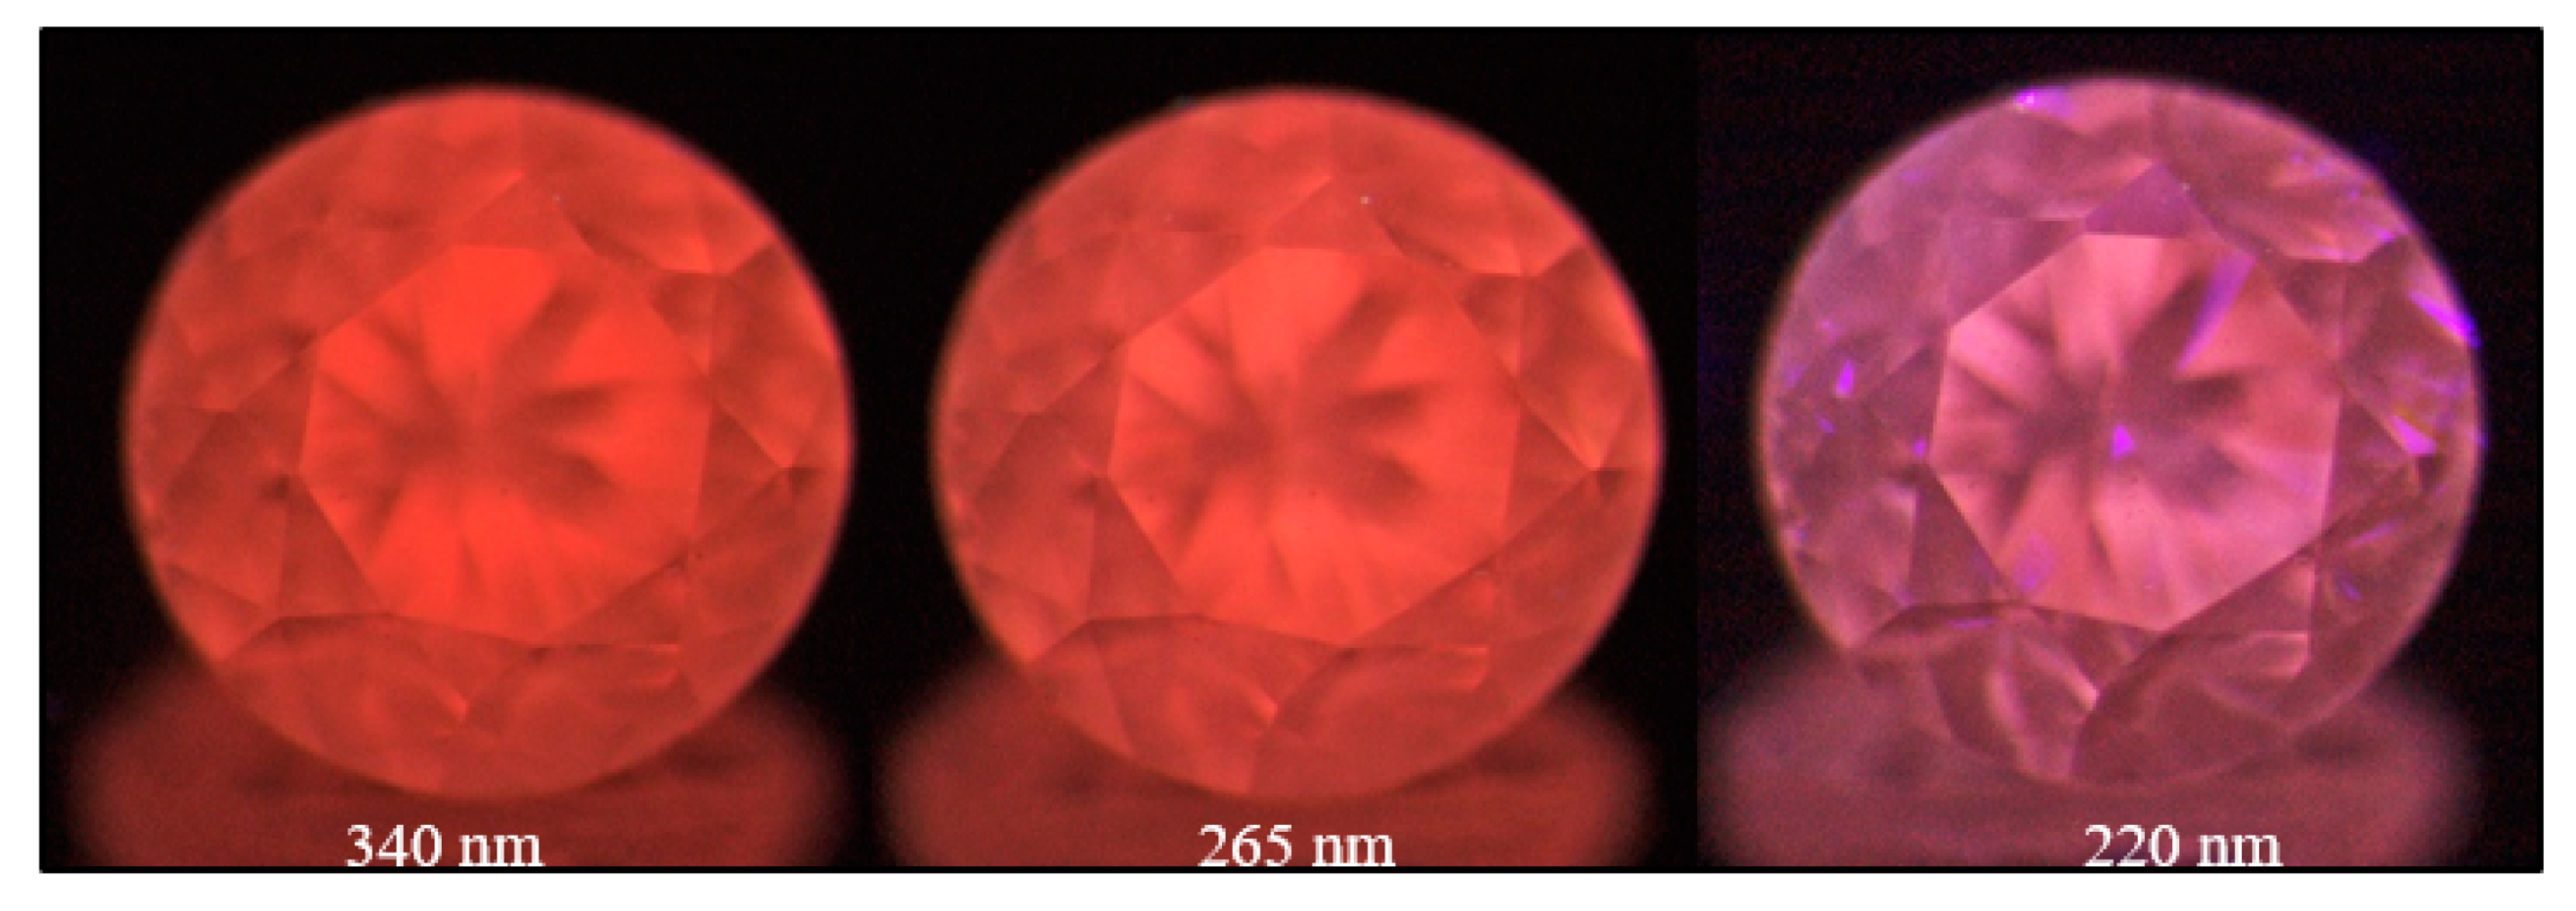
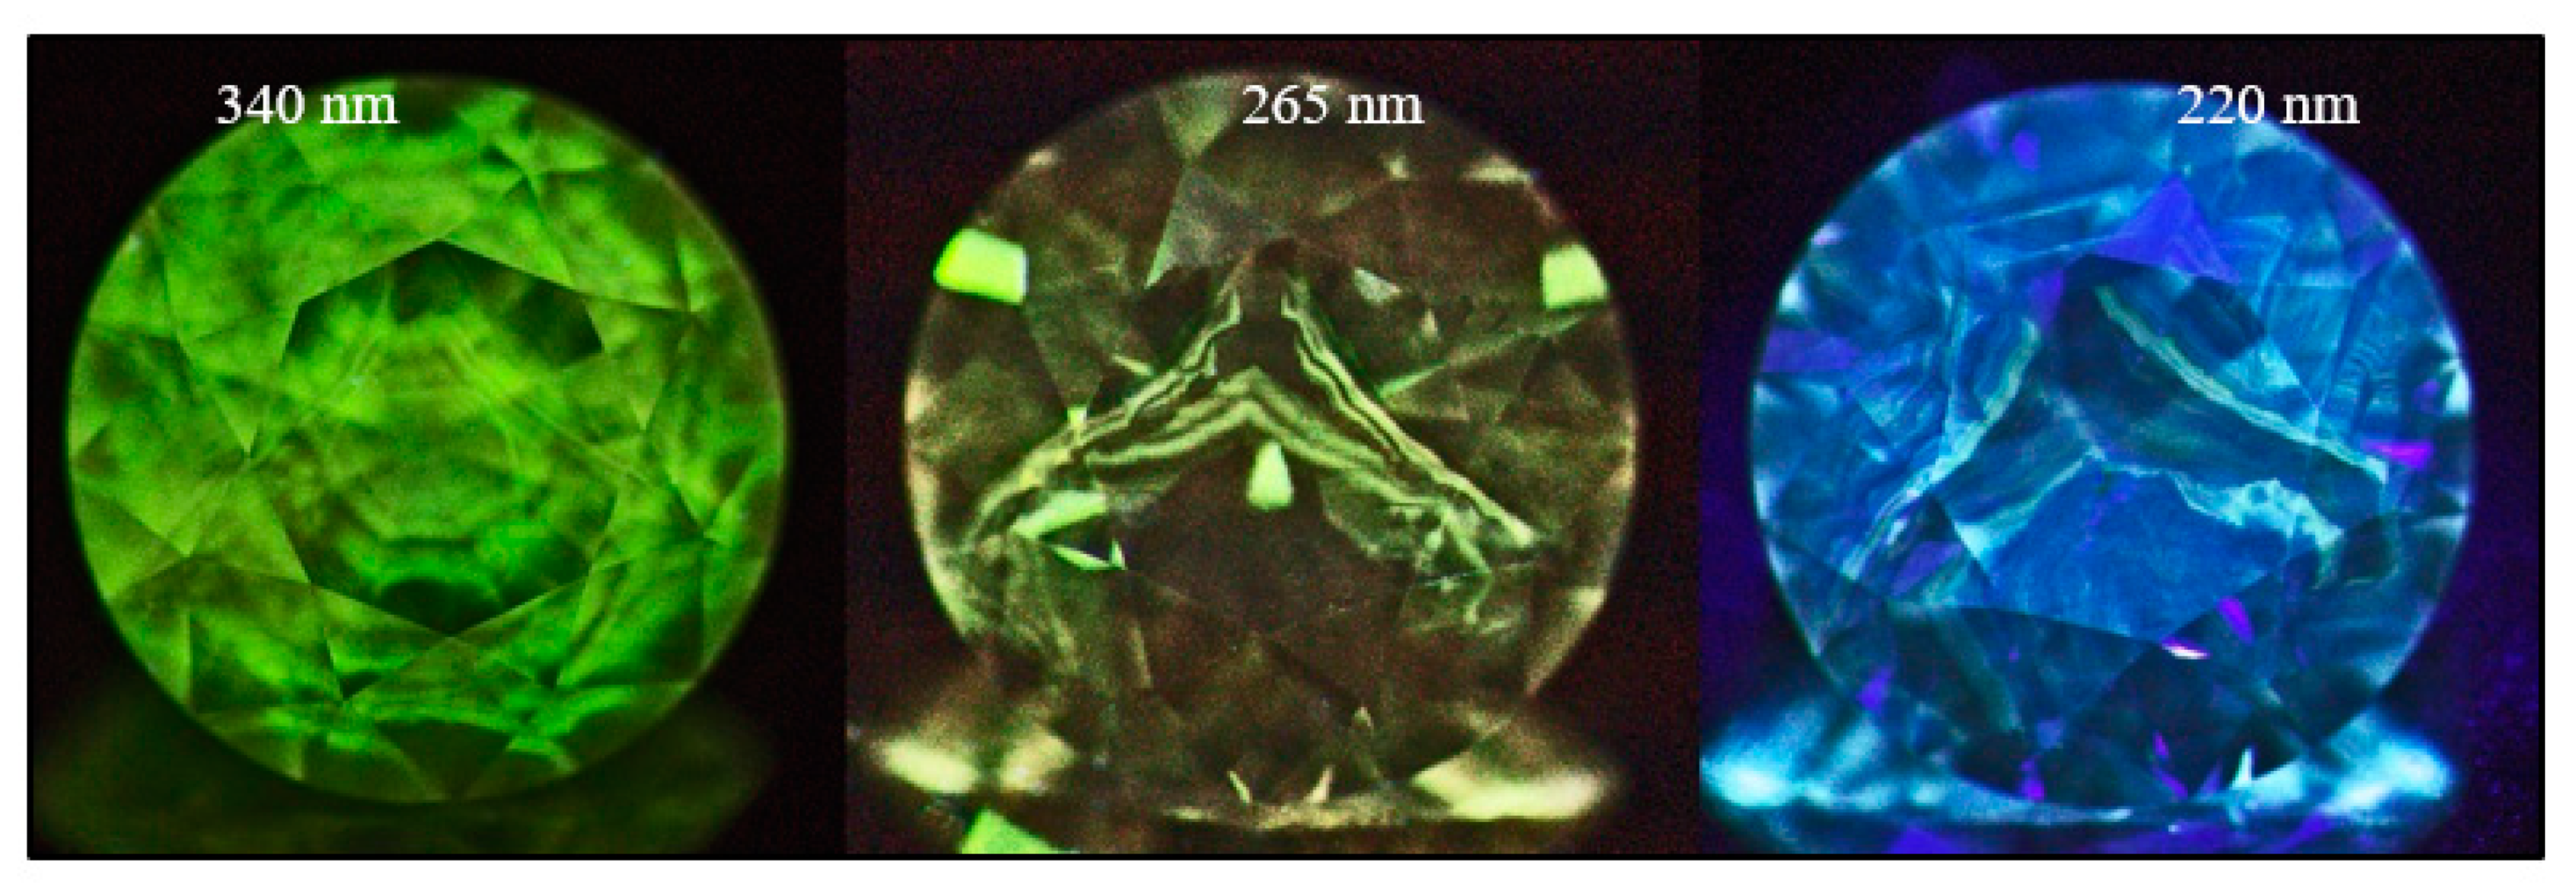
Figure 20.
A pinkish brown type IaA>>B diamond (sample TH 2.440) under three different UV excitations of the DFI system. The images clearly show the defect distribution along the deformation-related slip planes along (111). At 340 nm, the main defect visible as pink PL is the 617.6/626.3 nm defect; the green H3 PL can be seen under all excitations, and at 220 nm the N3 defect is dominant.
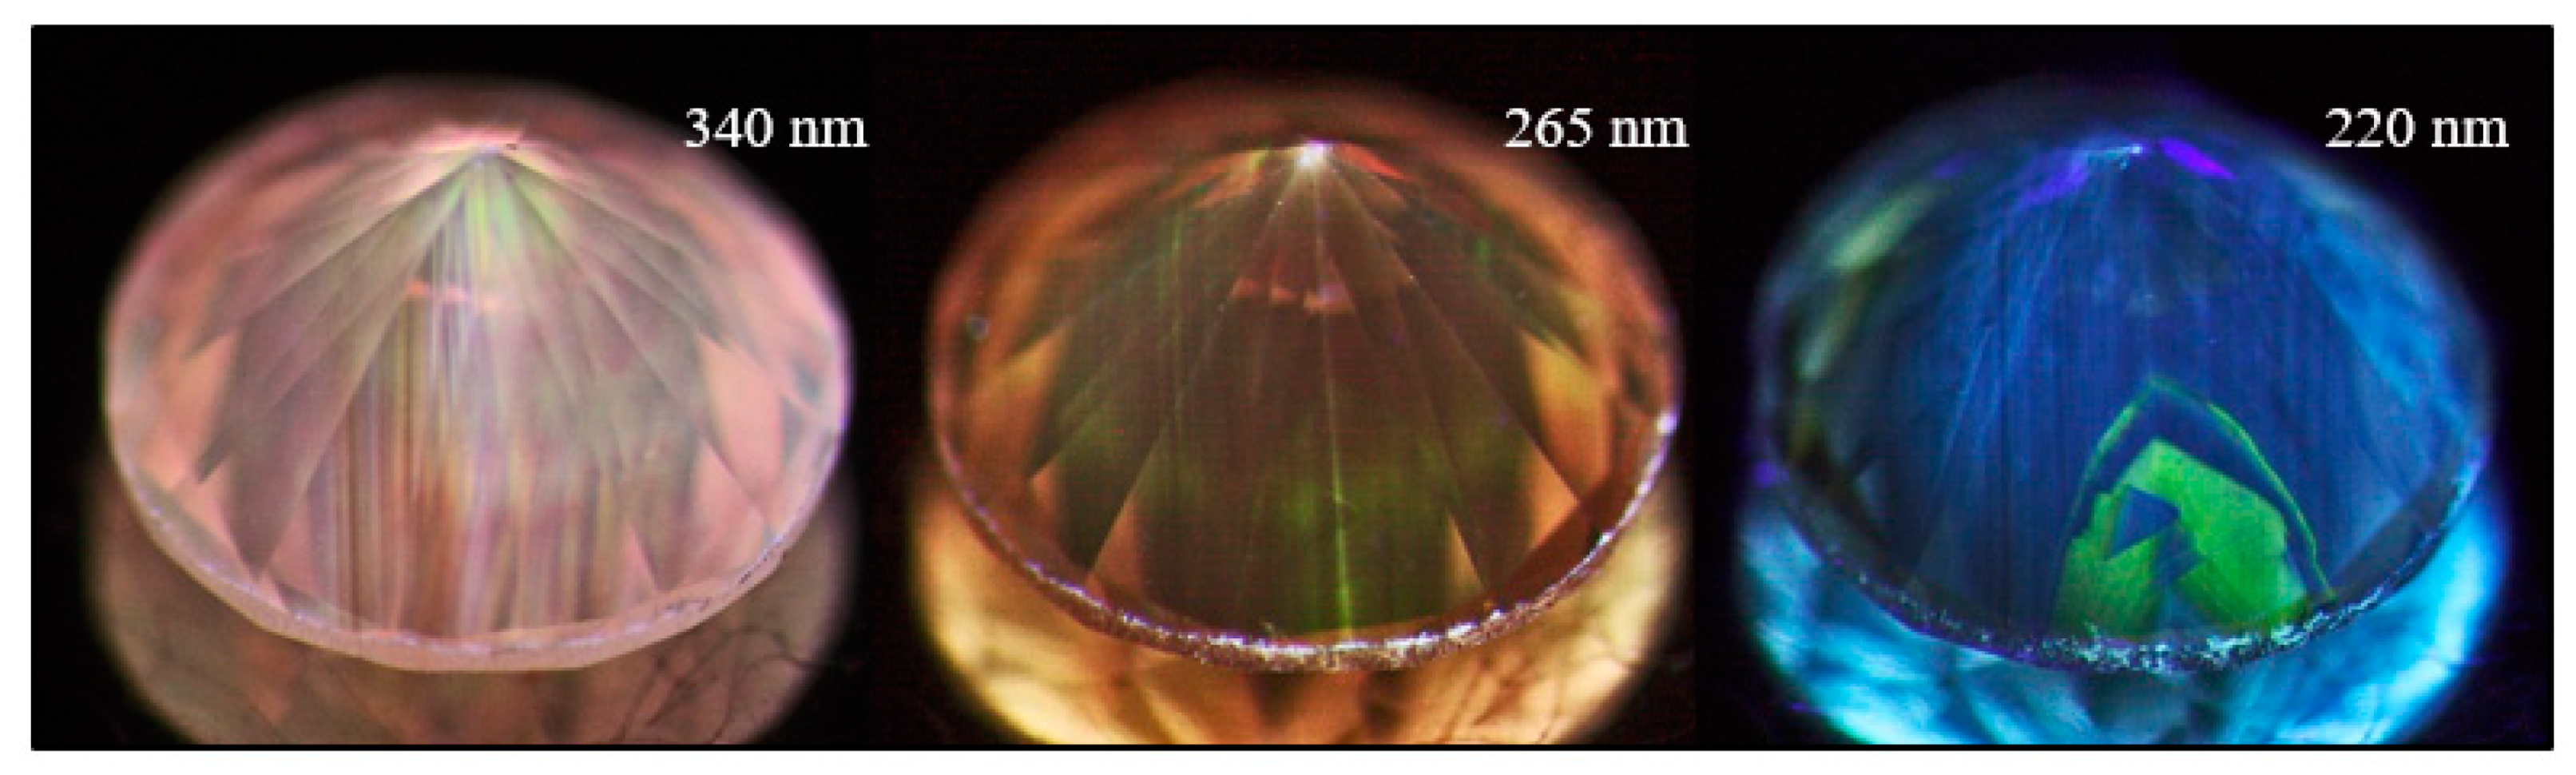
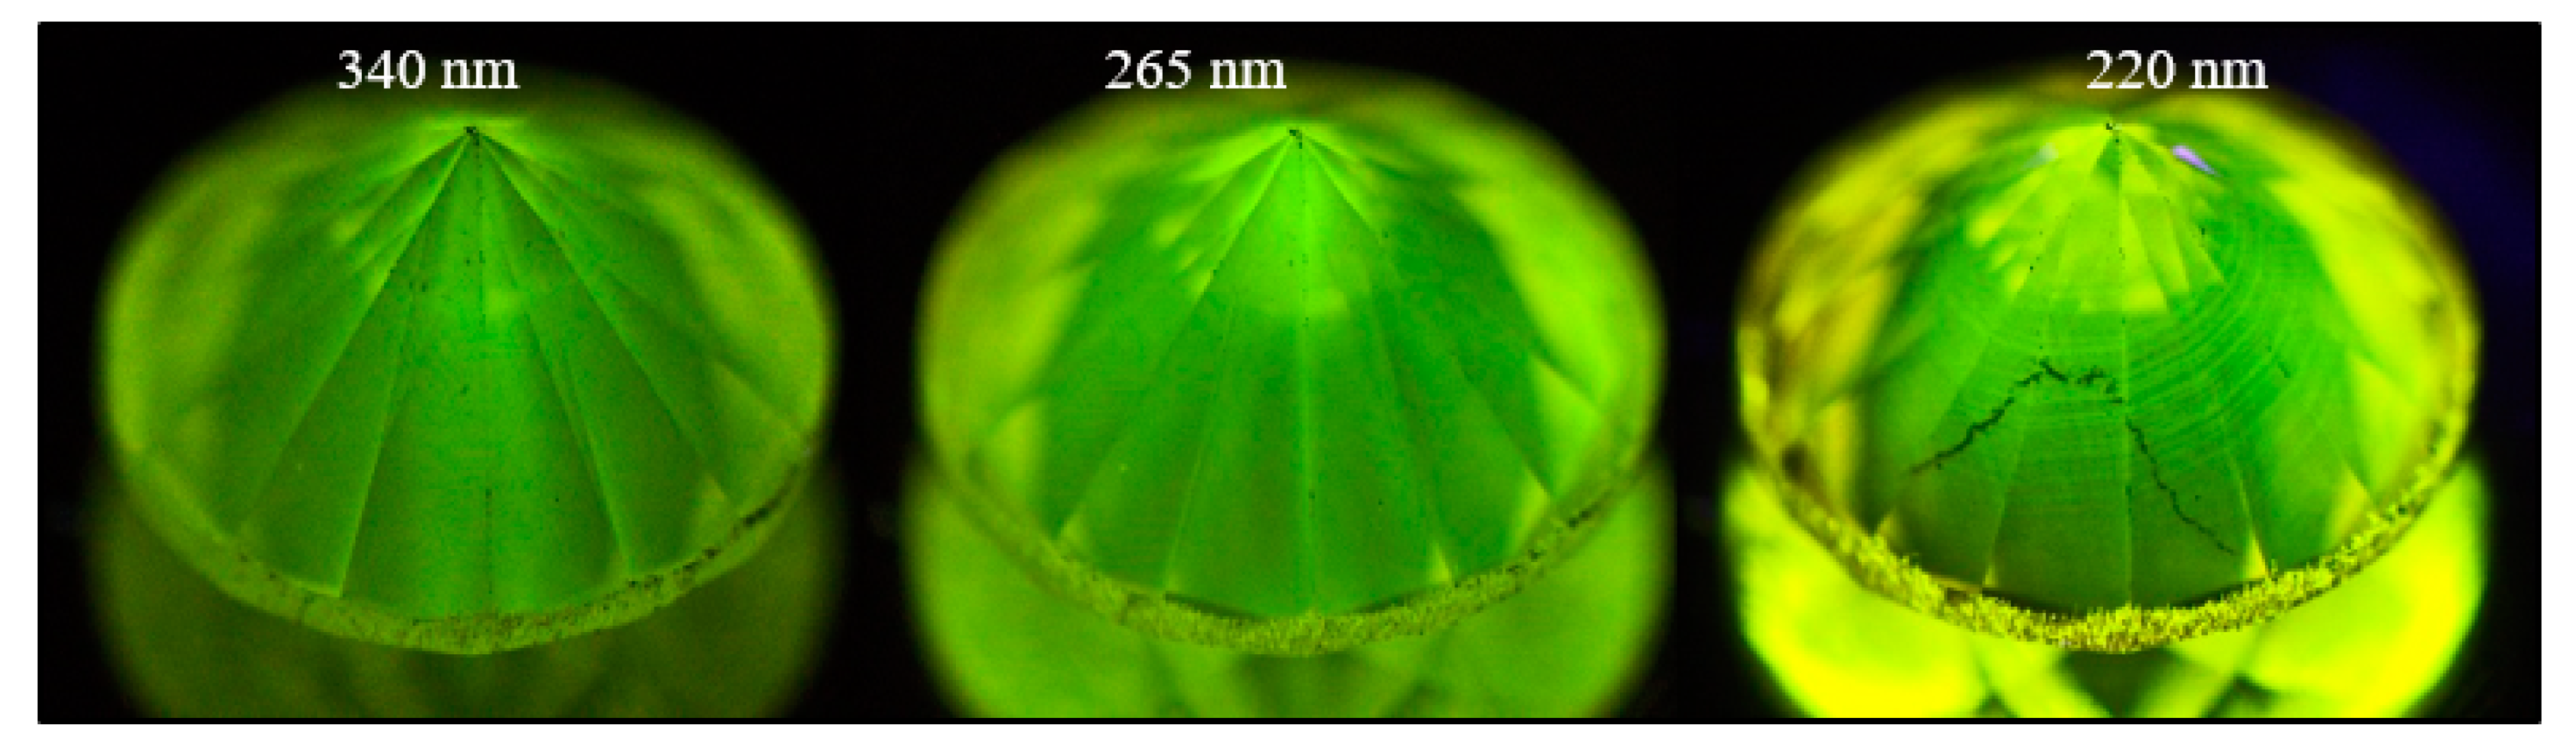
Figure 21.
A DR brown hydrogen- and nitrogen-rich type IaA>>B diamond (sample TH 2.622) under three different UV excitations of the DFI system. The images clearly show the typical “Mercedes-star” pattern visible in mixed cuboid-octahedral growth diamonds. In this diamond, the defects were distributed along the cuboid sectors and along the DR slip planes. Along the cuboid sectors, the S3 defect can be detected, while within the deformation-related slip planes the H3 defect is found. At 340 nm, the main defect visible as green PL is the H3 defect while under 265 nm excitation it is the S3 defect; at 220 nm, the N3 defect combined with the S3 center are dominant.
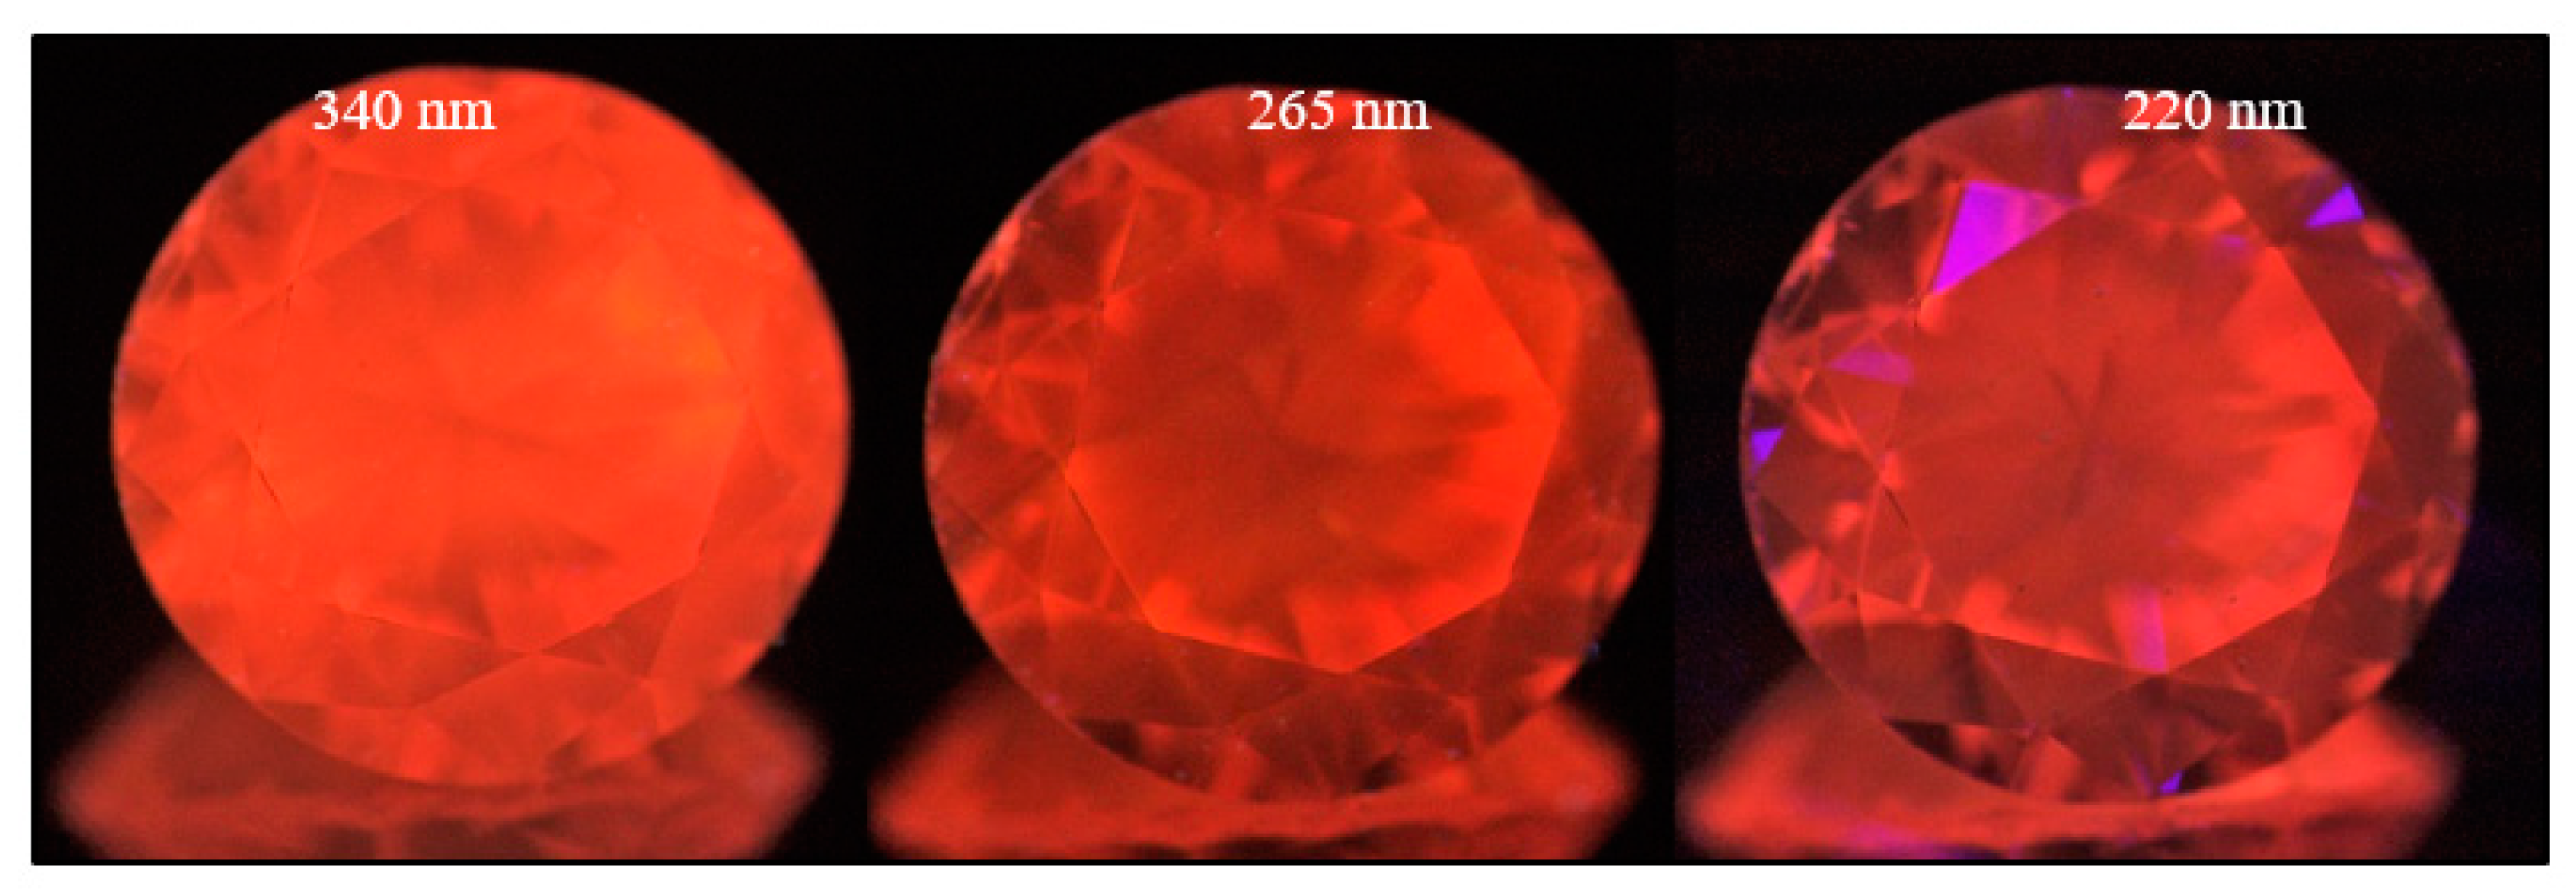
Figure 22.
A pure type Ib brown diamond (sample TH 2.51) under three different UV excitations of the DFI system. The NV0 center is responsible for the luminescence under all excitations, and the distribution of the defects is much less obvious than in other deformation-related samples. Photos: Dr. Thomas Hainschwang.
Figure 23.
A pure type Ib brown diamond (sample TH 2.561) under three different UV excitations of the DFI system. The yellowish green PL is caused by the H3 defect, even though according to the IR spectrum the stone did not contain measurable A aggregate nitrogen.
Figure 23.
A pure type Ib brown diamond (sample TH 2.561) under three different UV excitations of the DFI system. The yellowish green PL is caused by the H3 defect, even though according to the IR spectrum the stone did not contain measurable A aggregate nitrogen.
Figure 24.
A brown type IIa diamond (sample TH 2.612) in immersion (left) showing the characteristic plastic deformation-related brown “graining” along (111), and the corresponding extinction patterns as shown under crossed polarizing filters (right).
Figure 24.
A brown type IIa diamond (sample TH 2.612) in immersion (left) showing the characteristic plastic deformation-related brown “graining” along (111), and the corresponding extinction patterns as shown under crossed polarizing filters (right).
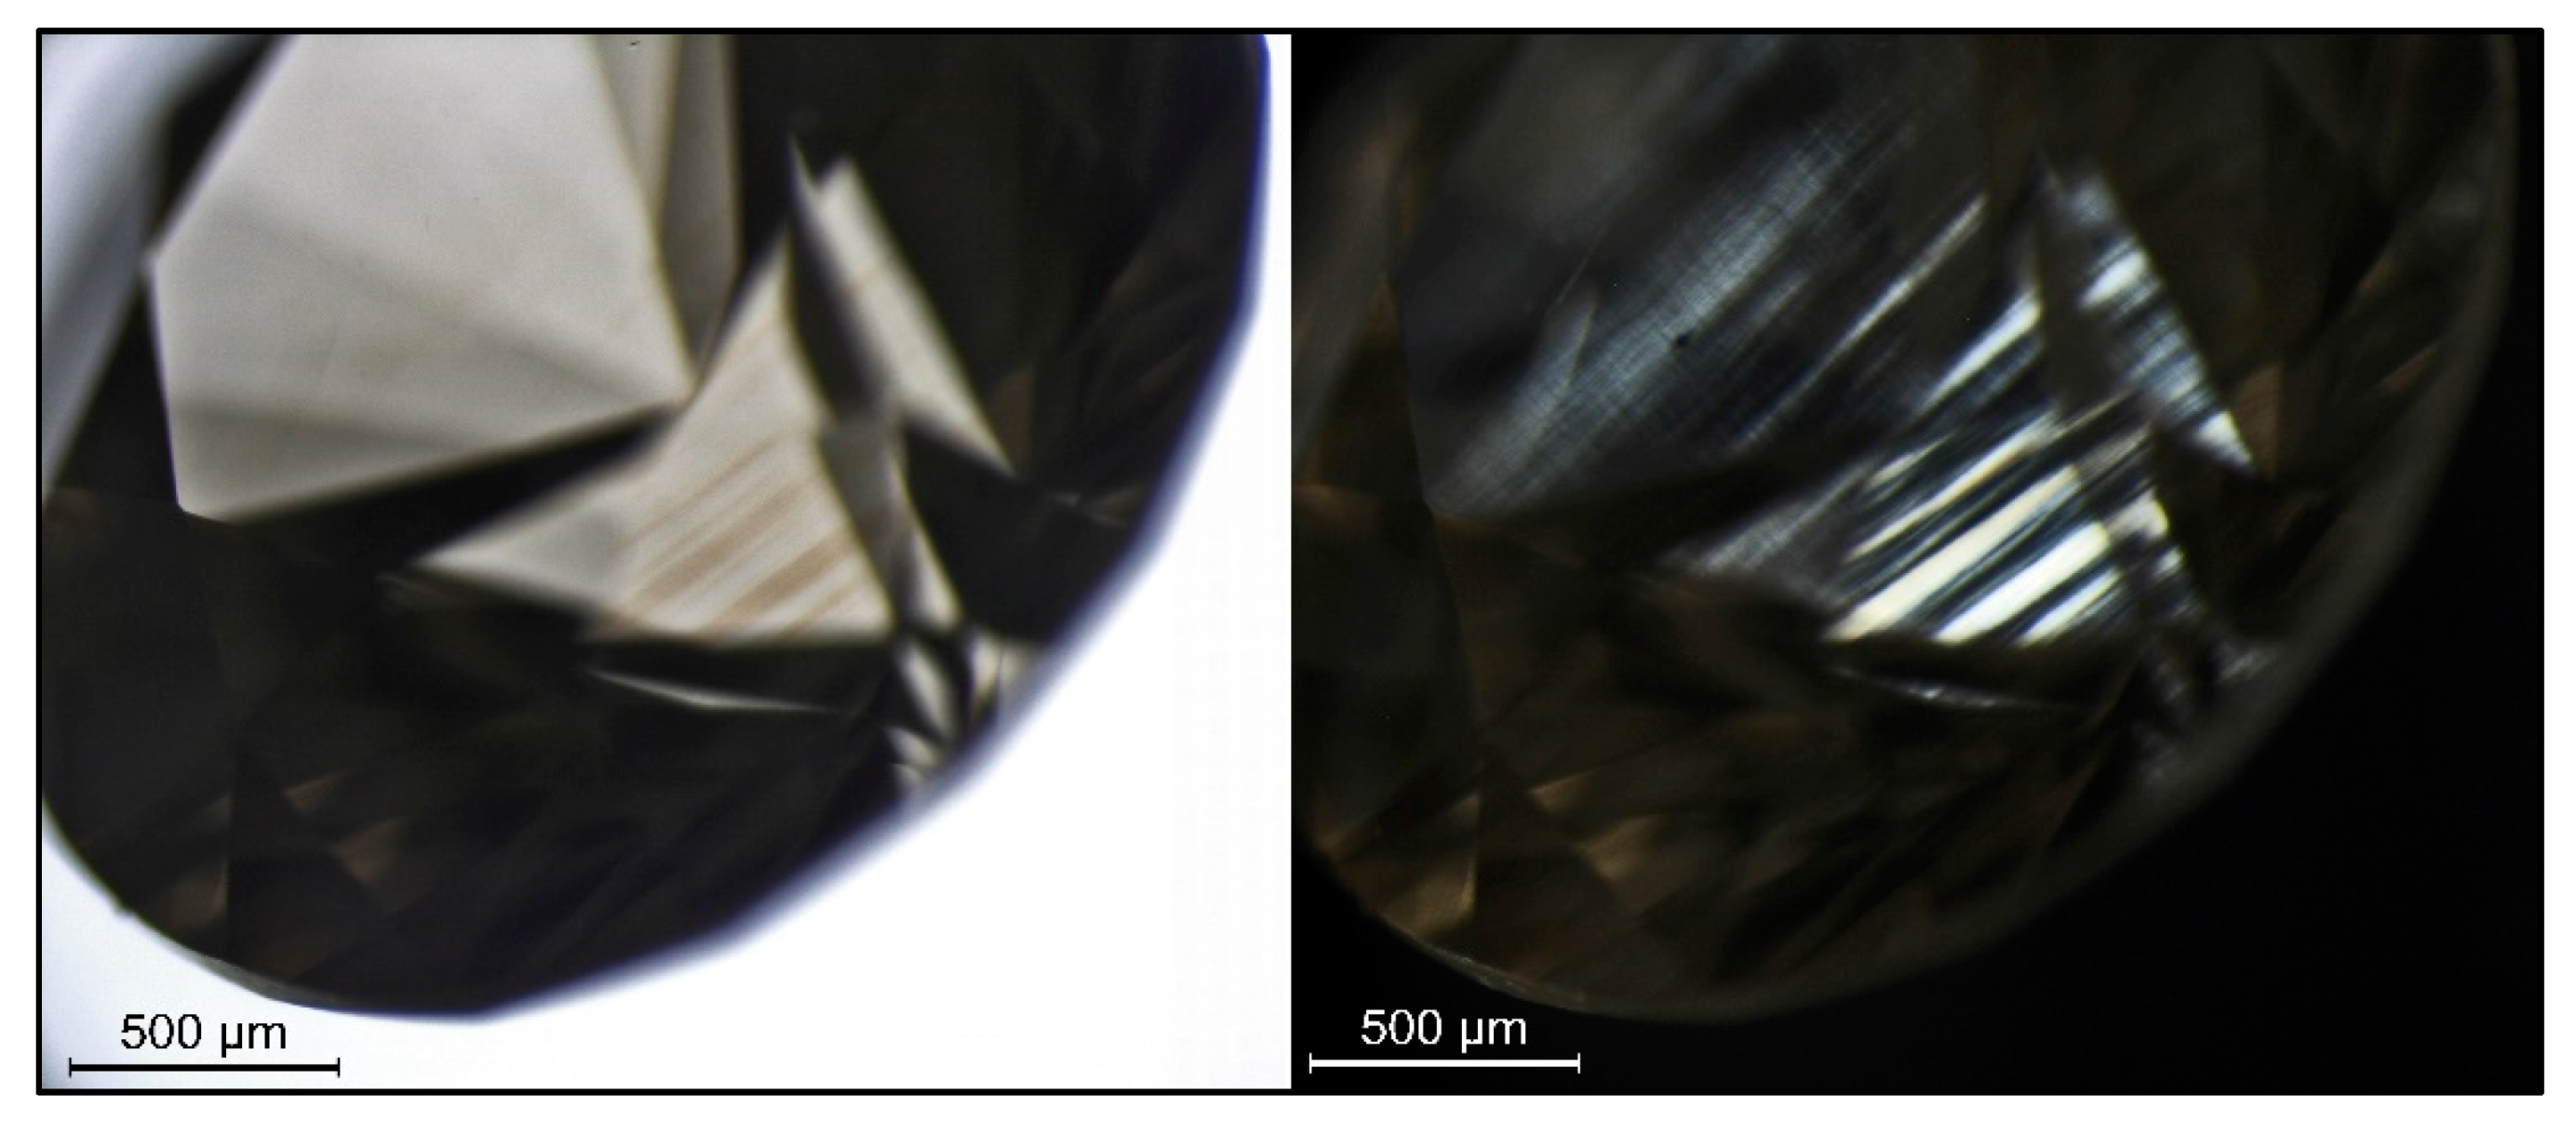
Figure 25.
A brown type IIb diamond (sample TH 2.610) in immersion (left) showing the characteristic plastic deformation-related brown “graining” along (111), and the corresponding extinction patterns as shown under crossed polarizing filters (right), equal to what is seen in type IIa diamonds.
Figure 25.
A brown type IIb diamond (sample TH 2.610) in immersion (left) showing the characteristic plastic deformation-related brown “graining” along (111), and the corresponding extinction patterns as shown under crossed polarizing filters (right), equal to what is seen in type IIa diamonds.
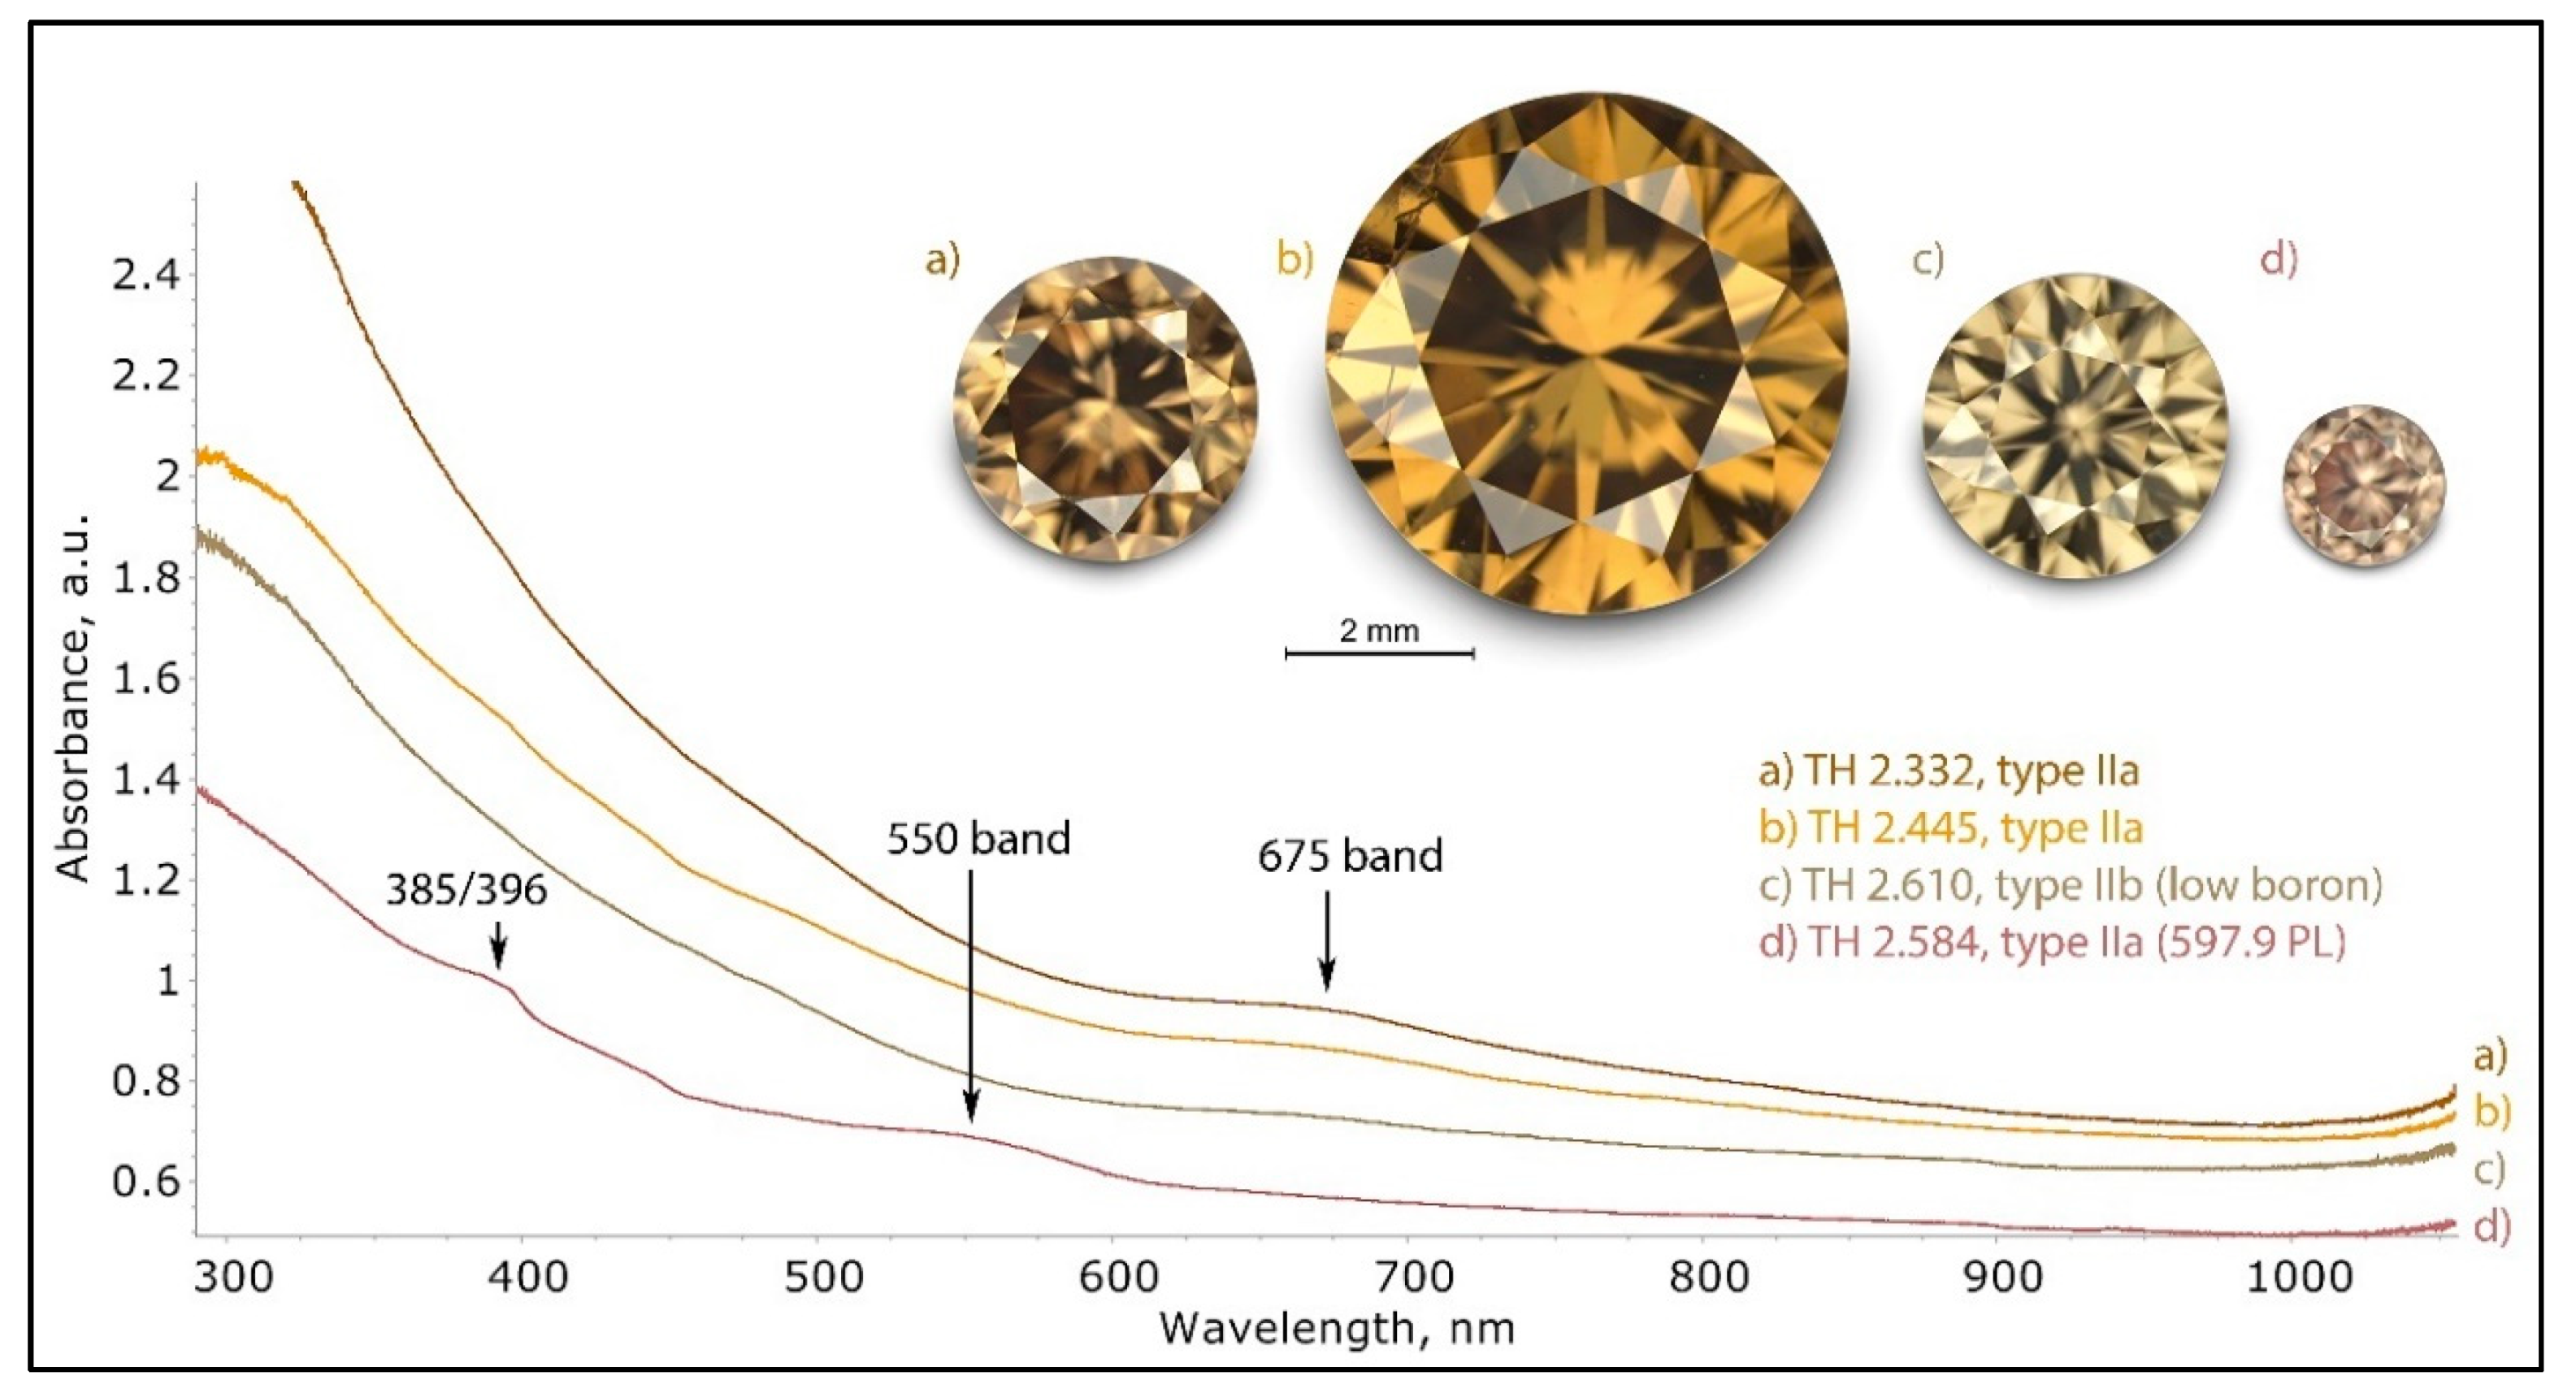
Figure 26.
The different UV-Vis-NIR spectra of brown type II diamonds, recorded at 77 K. As with type I brown diamonds, the color of such stones is the result of the relatively flat and steadily increasing continuum from the NIR to UV. With nitrogen-related absorptions, such as N3 and H3, typically absent, the only features overlaying the continuum are a broad band at 675 nm, and for the very unusual samples with the 597.9 nm PL, a broad band at 550 nm and a double band at 385/396 nm can be seen, which is basically a regular UV-Vis-NIR spectrum for any pink brown type IIa diamond. The spectra were shifted vertically for clarity.
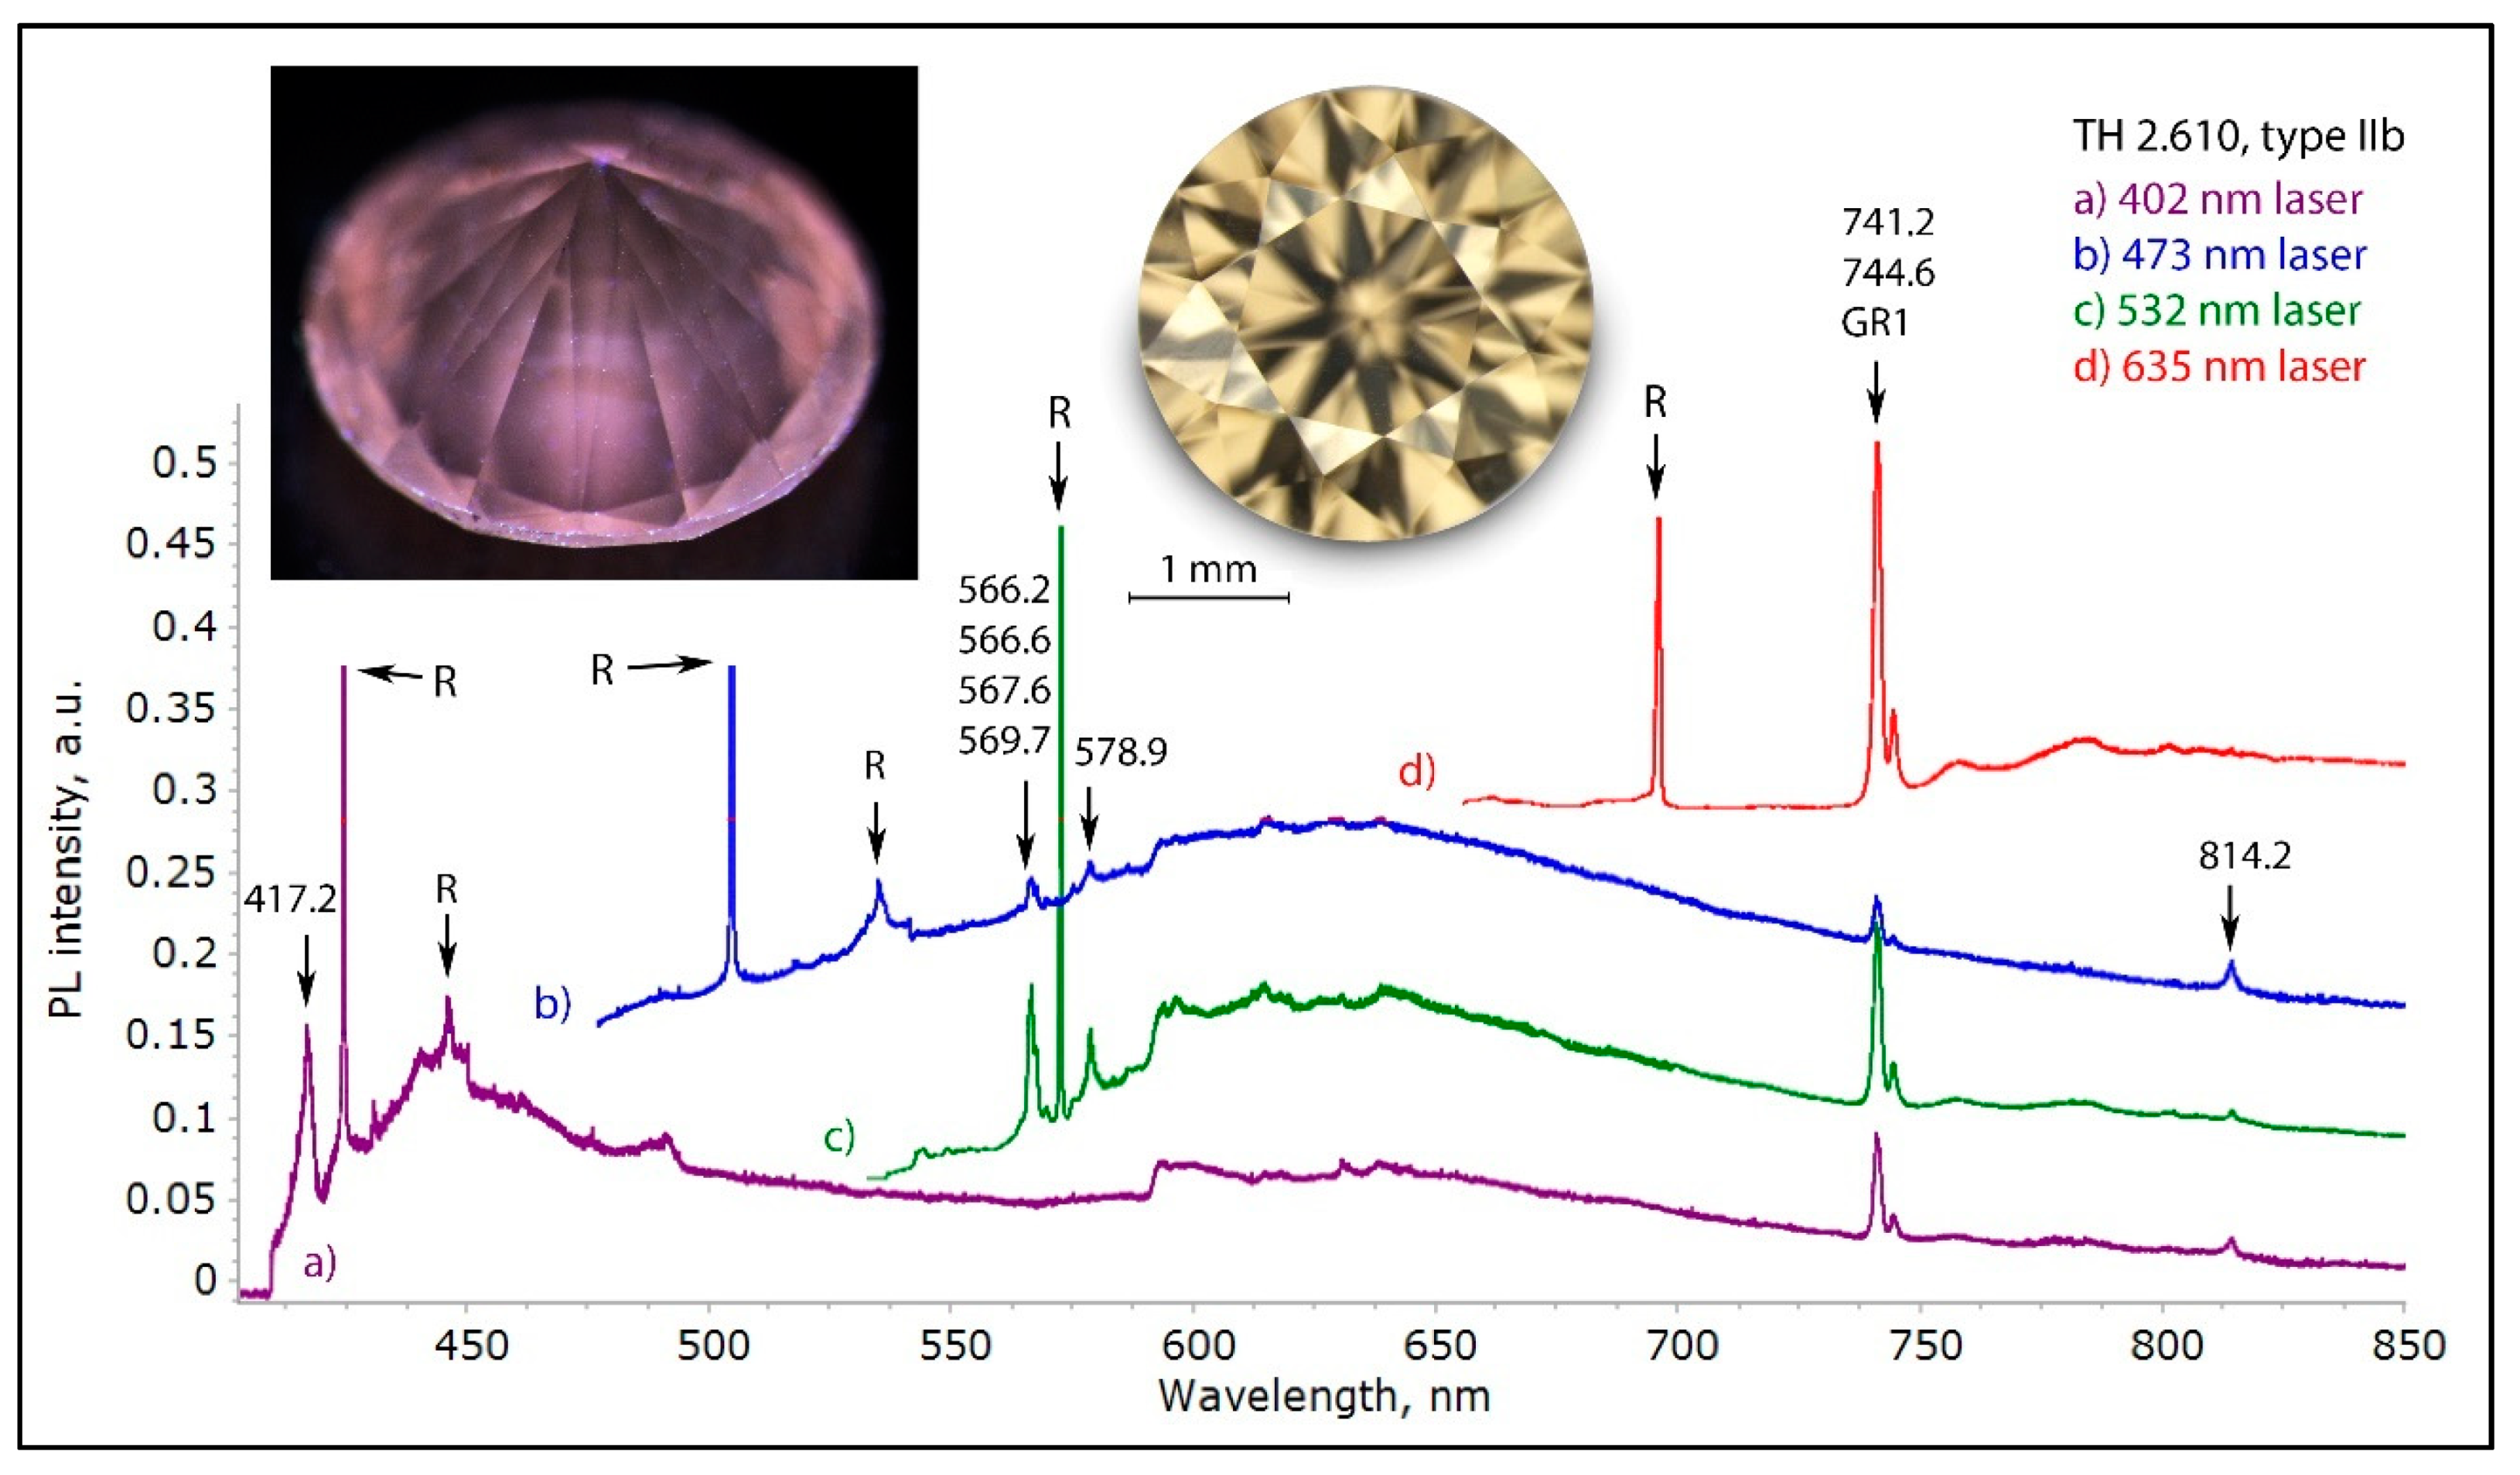
Figure 27.
The photoluminescence spectra of a rare type IIb brown diamond, recorded using four different lasers. With many of the features being characteristic of low nitrogen Ia or type II diamonds, the asymmetric and somewhat large band at 417.2 nm is only rarely found in type IIa diamonds but is very common in type IIb diamonds. The spectra were shifted vertically for clarity.
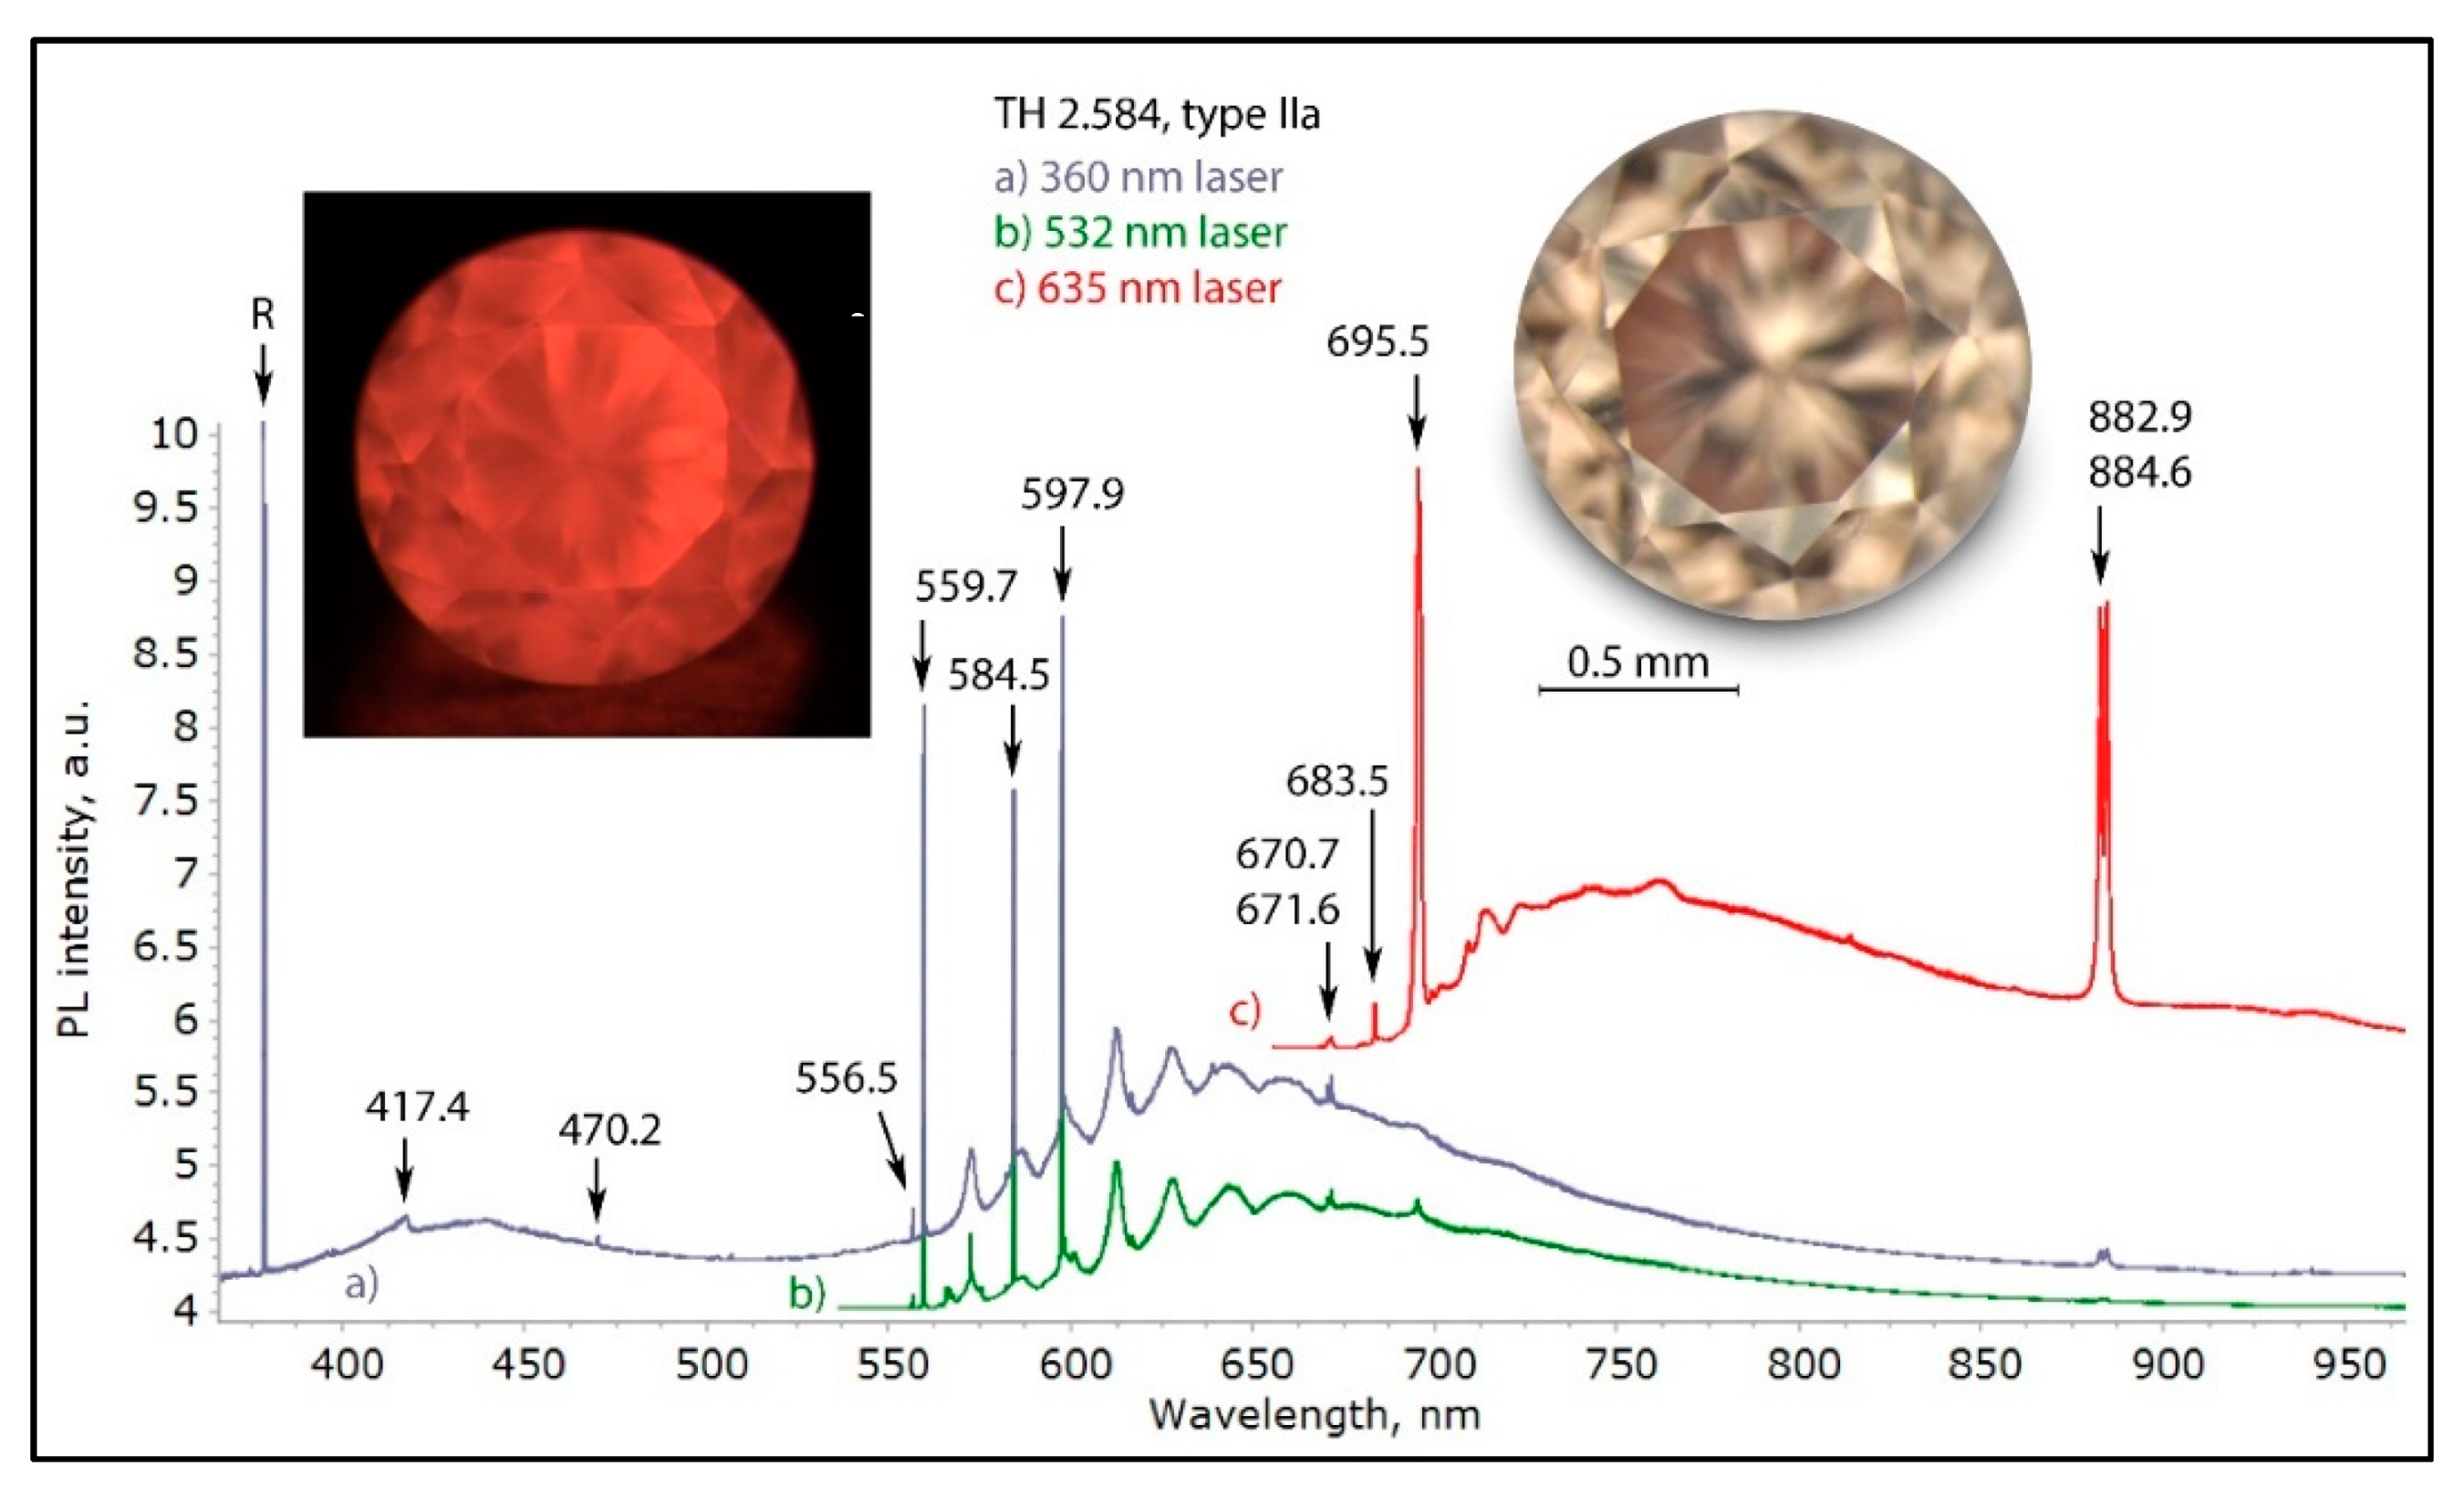
Figure 28.
The photoluminescence spectra of a highly unusual pink brown type IIa diamond with orangey red luminescence not originating from the NV0 center, but from the 559.7, 584.5, and 597.9 nm defects, excited using three different lasers. These are nickel-containing natural type IIa diamonds, as is apparent by the presence of the 882.9/884.6 nm Nii+ doublet; the 584.5 and 597.9 nm defect(s) can possibly be attributed to oxygen or nickel defects. The spectra were shifted vertically for clarity.
Figure 29.
A light yellowish brown near type IIa diamond (sample TH 2.616) under three different UV excitations of the DFI system. The green PL is caused by the 490.7 nm and H4 defects, the blue PL by the 406.1 nm and the N3 defects.
Figure 29.
A light yellowish brown near type IIa diamond (sample TH 2.616) under three different UV excitations of the DFI system. The green PL is caused by the 490.7 nm and H4 defects, the blue PL by the 406.1 nm and the N3 defects.
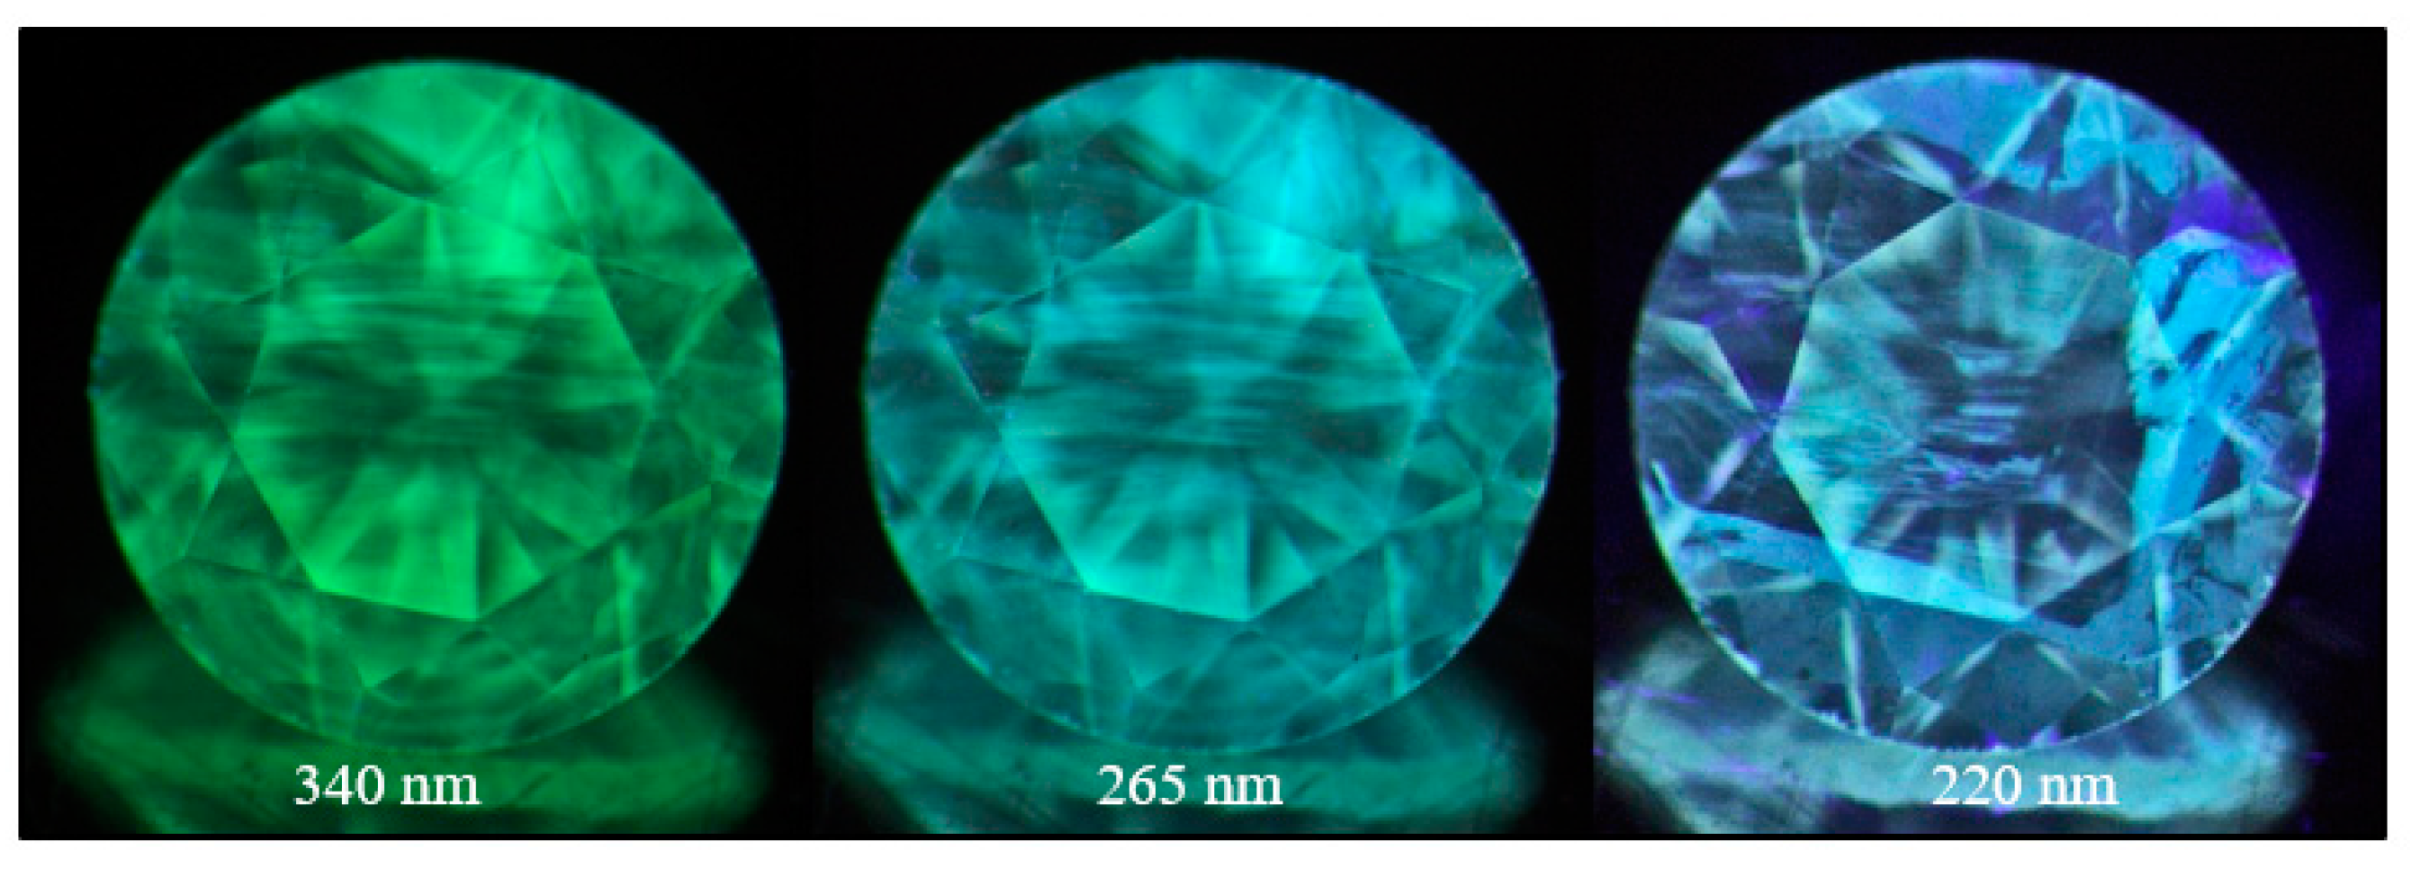
Figure 30.
A pink brown type IIa diamond (sample TH 2.584) under three different UV excitations of the DFI system. The pink to orange red PL is caused by the possibly oxygen- or nickel-related 559.7, 584.5, and 597.9 nm defects.
Figure 30.
A pink brown type IIa diamond (sample TH 2.584) under three different UV excitations of the DFI system. The pink to orange red PL is caused by the possibly oxygen- or nickel-related 559.7, 584.5, and 597.9 nm defects.
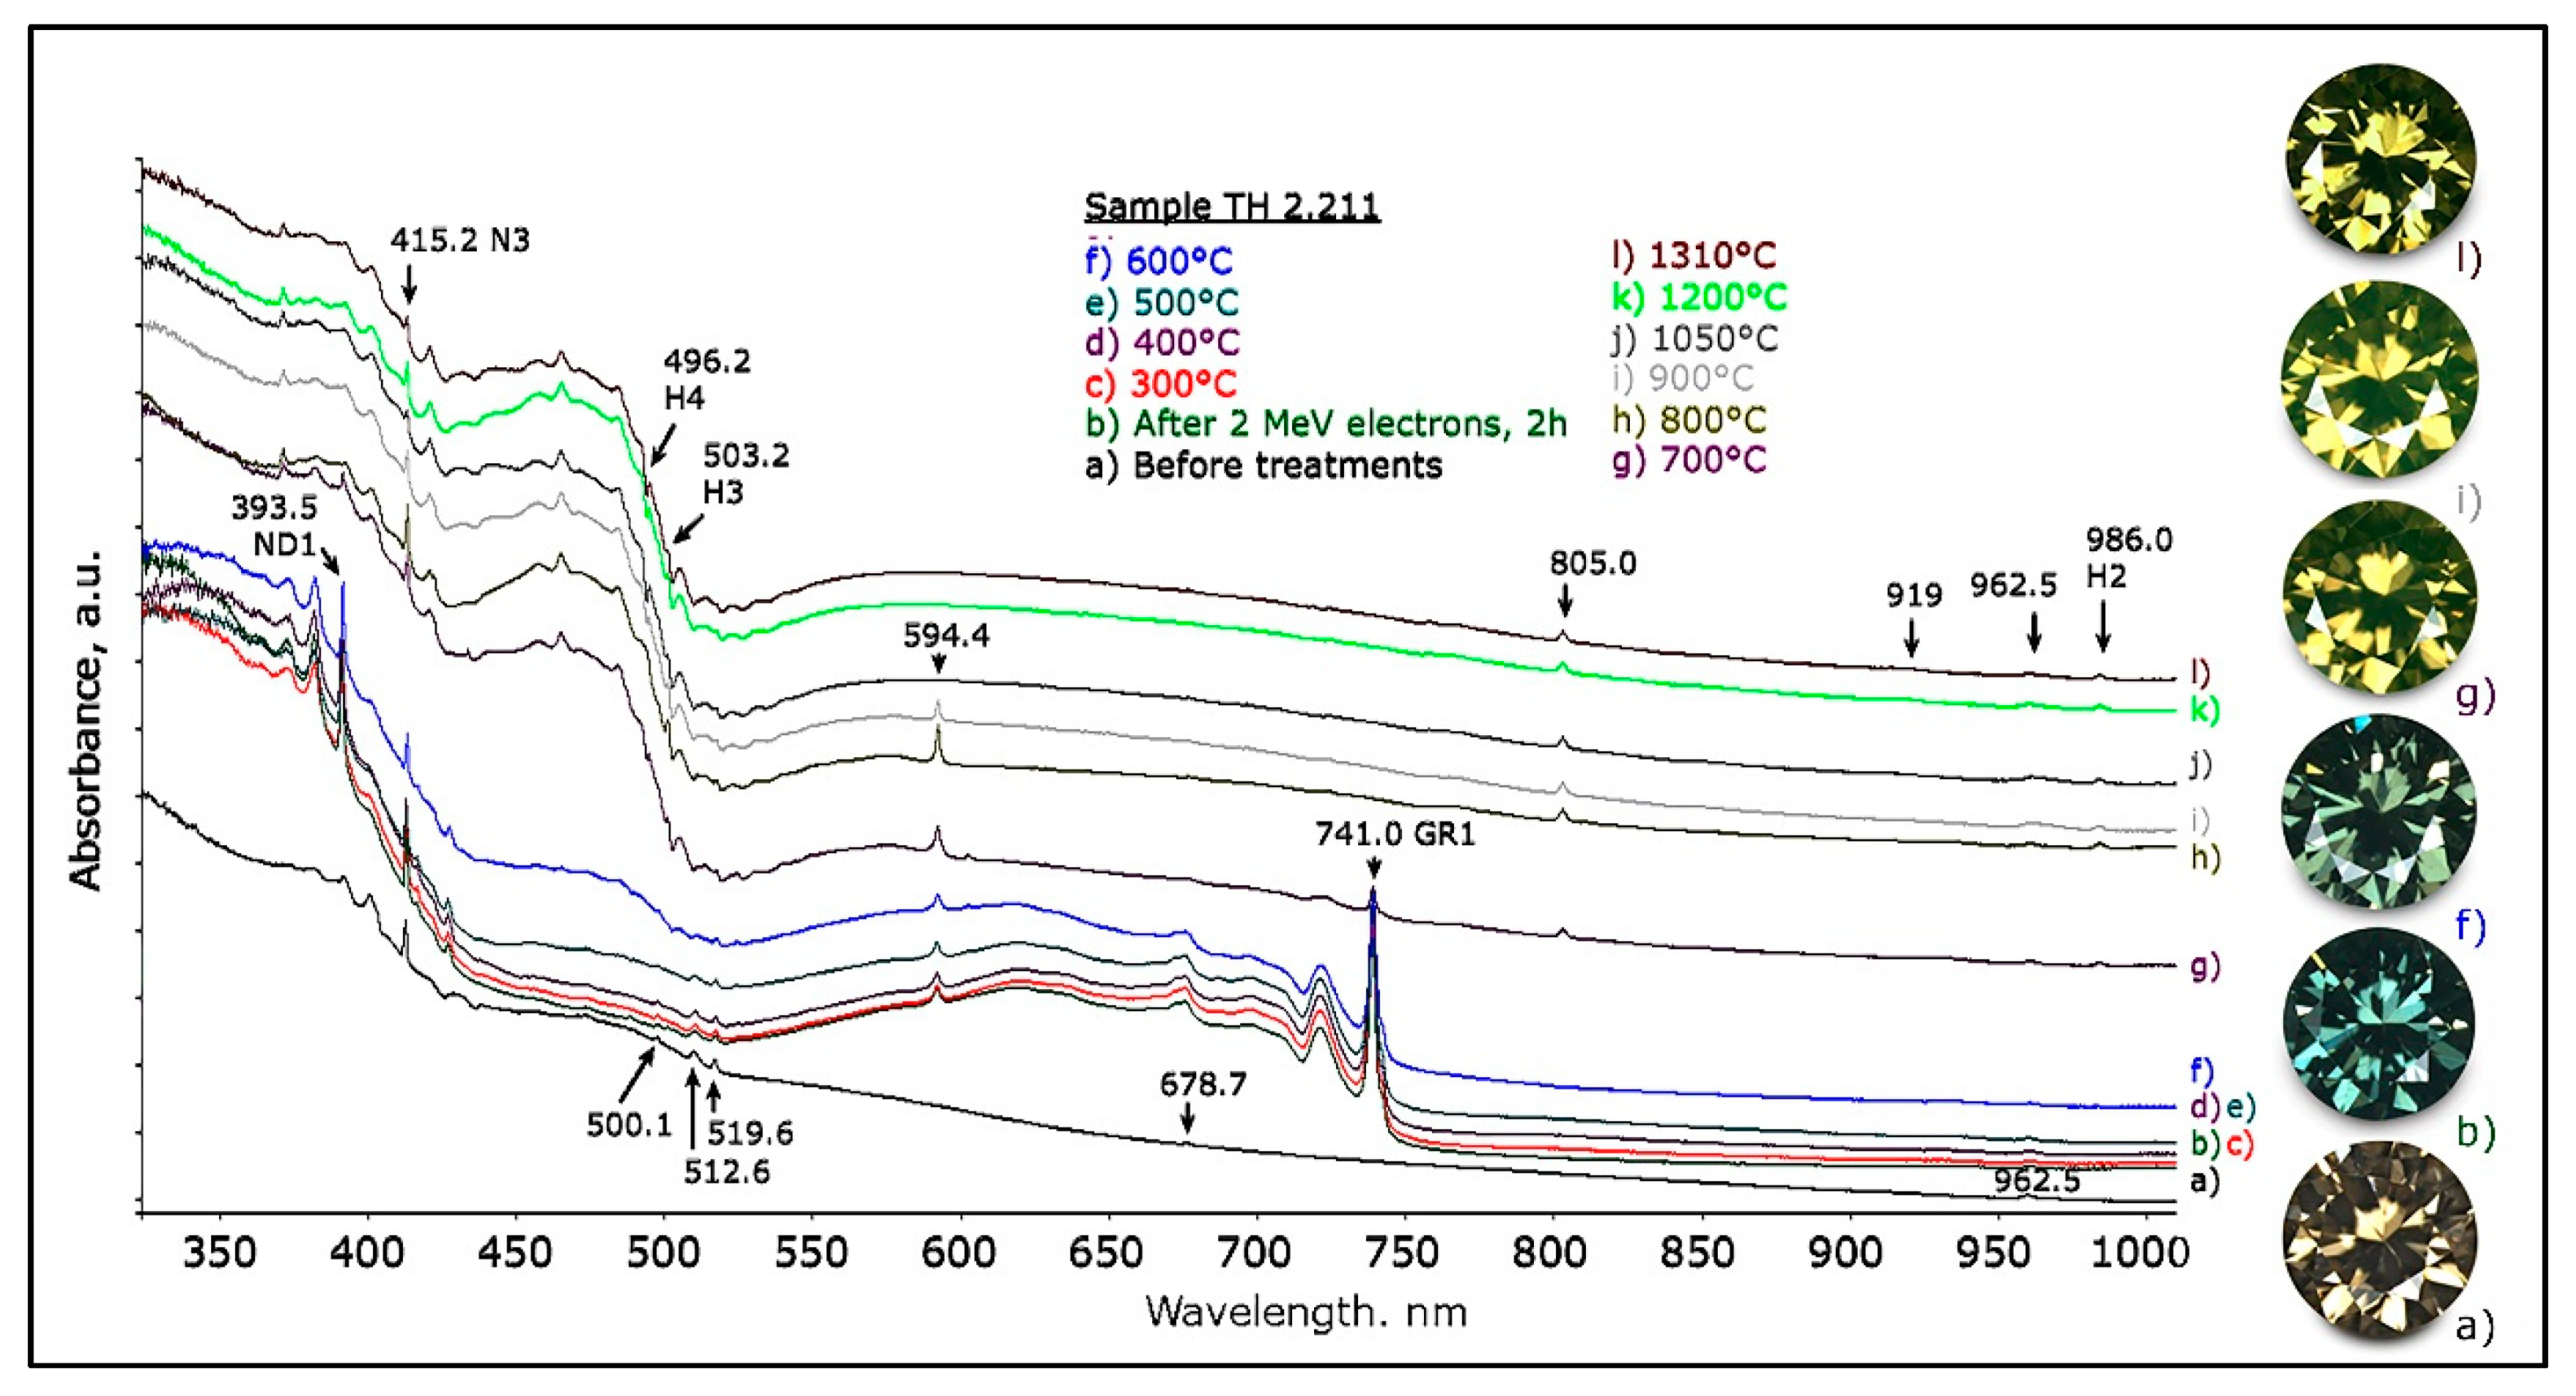
Figure 31.
The evolution of the color and the UV-Vis-NIR spectra of a light brown diamond (sample TH 2.211) after 2 h of 2 MeV electron irradiation and stepwise annealing from 300 °C to 1310 °C. The stone showed the desired color changes from brown via greenish blue to greenish yellow, by formation of GR1 from irradiation and H4 plus H3 via the annealing.
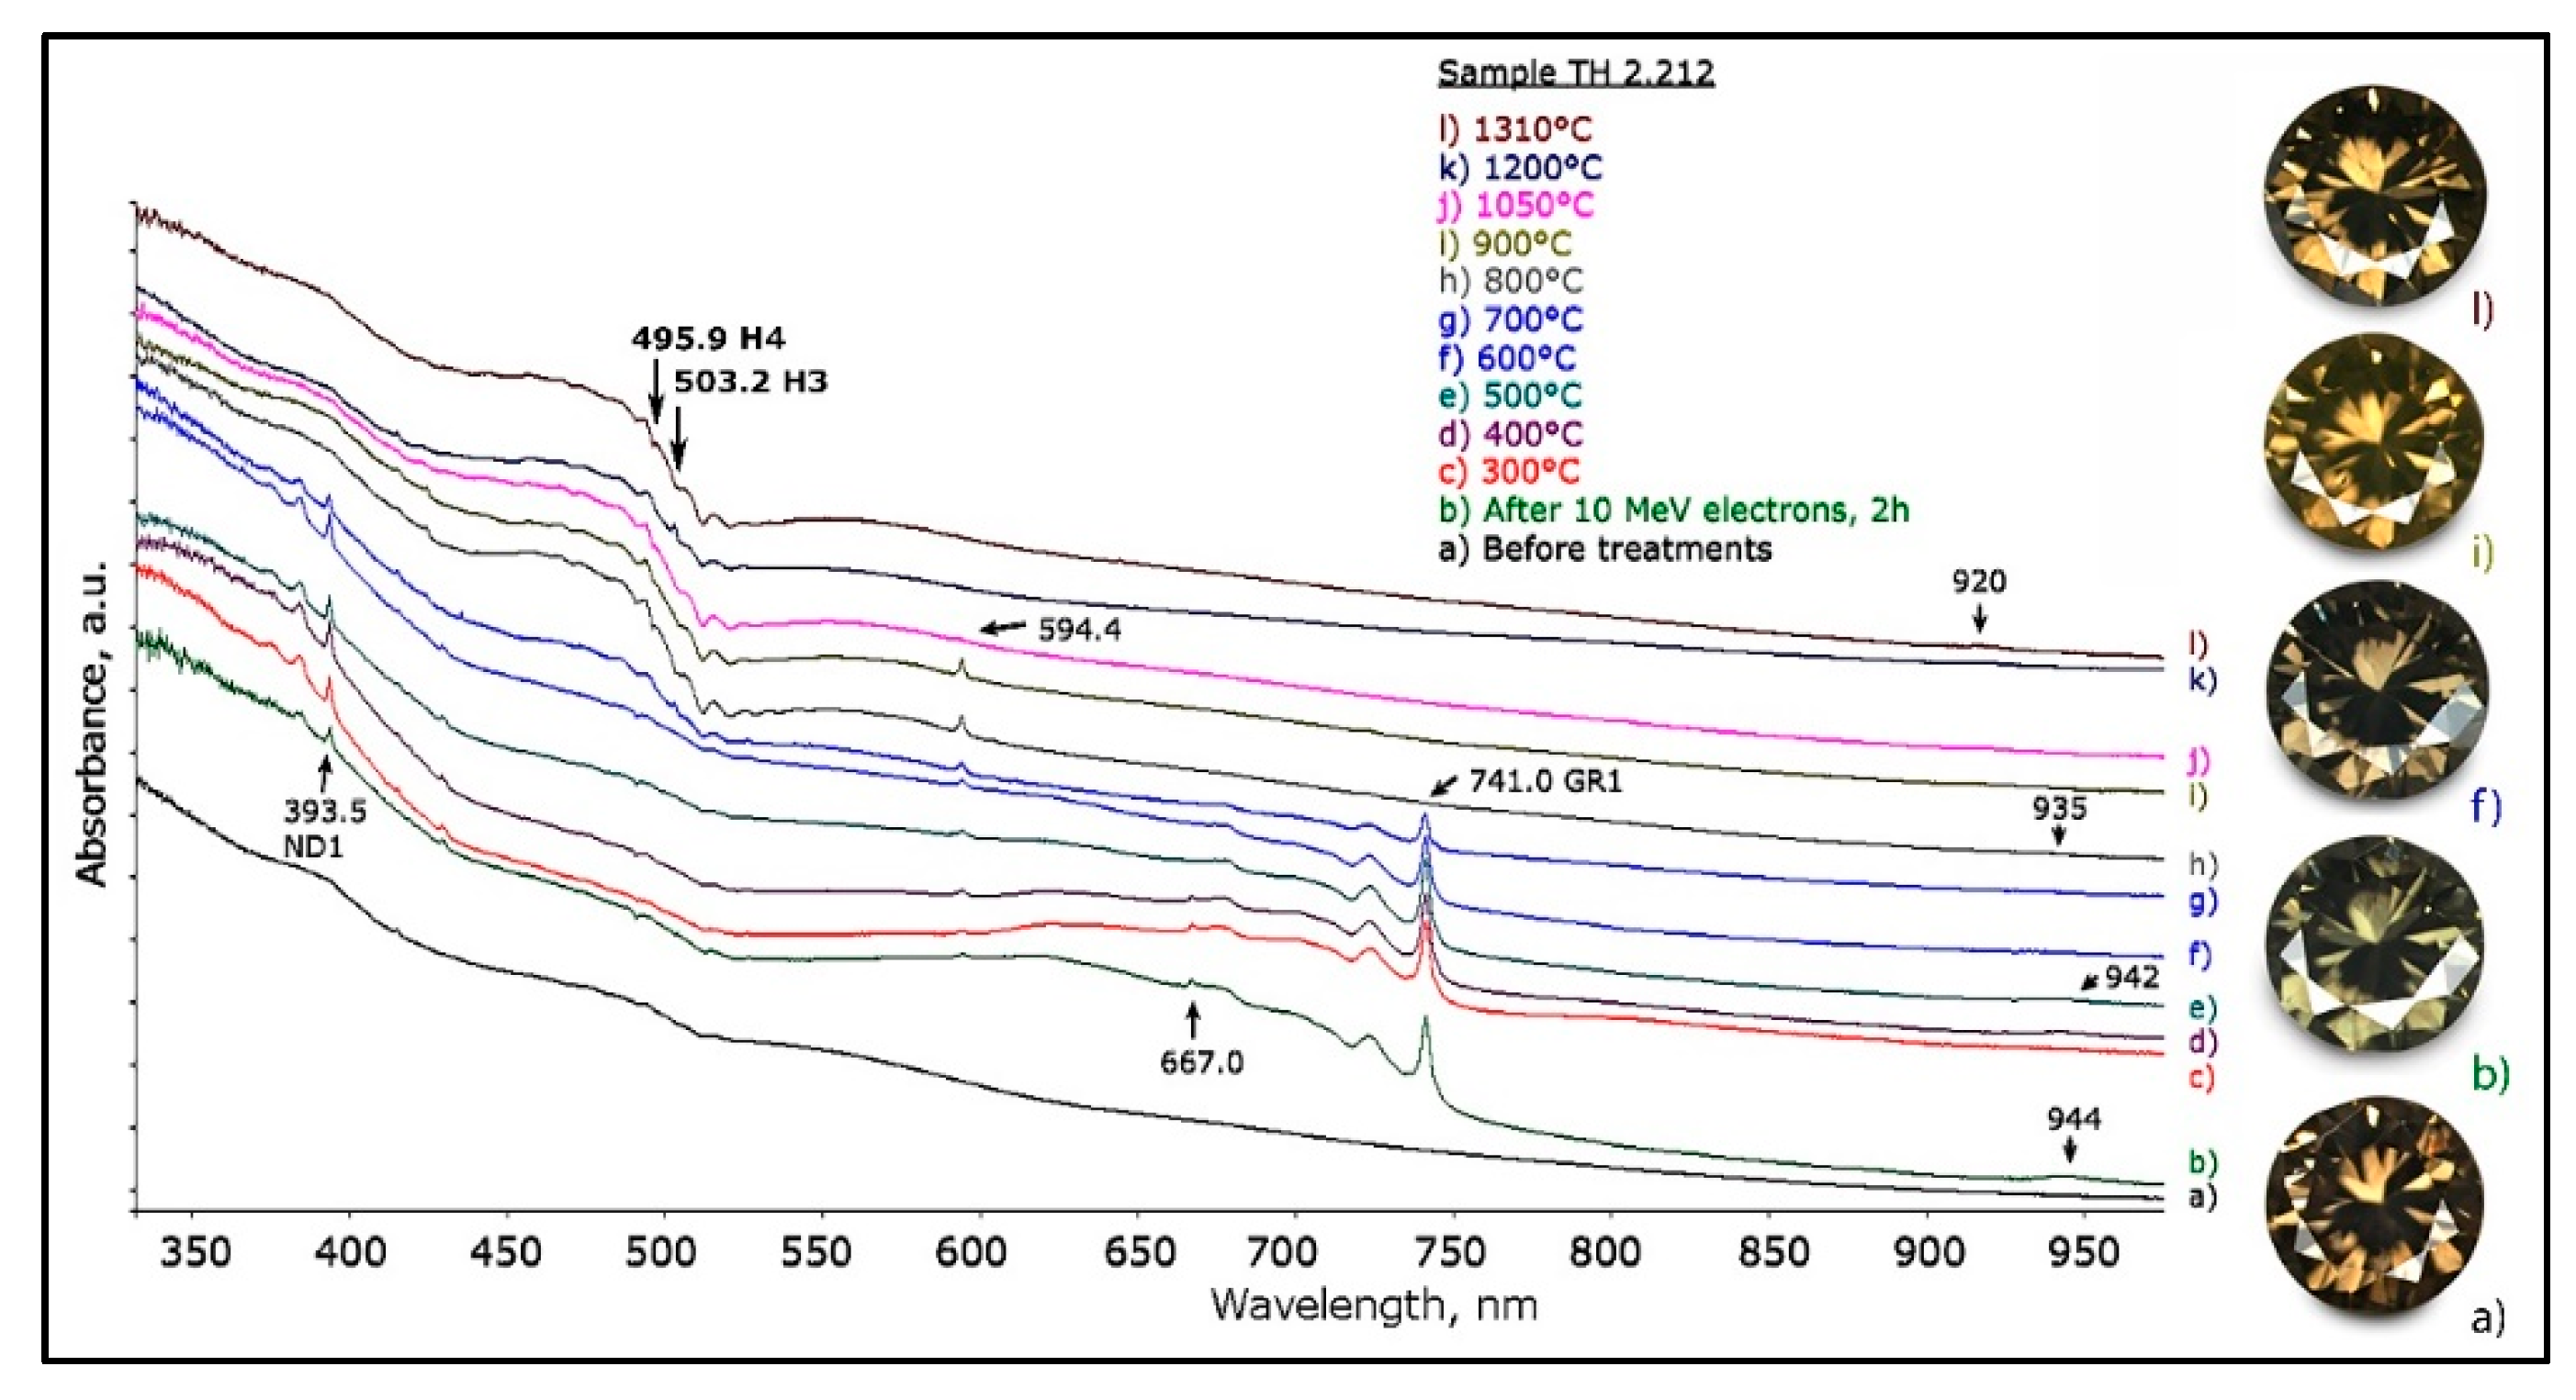
Figure 32.
The evolution of the color and the UV-Vis-NIR spectra of a darker brown diamond (sample TH 2.212) after 2 h of 10 MeV electron irradiation and stepwise annealing from 300 °C to 1310 °C. The stone showed some color changes but remained essentially brown, because neither GR1 nor H4 or H3 had a strong enough influence on the distinct continuum absorption.
Table 1.
An overview of the samples studied with some of their basic optical and infrared spectroscopic properties.
Table 1.
An overview of the samples studied with some of their basic optical and infrared spectroscopic properties.
| Key | Sample | Cut, Weight | Initial Color | Type | N/B Content, ppm (±5%) | IR Characteristics | Treatments Performed |
|---|
| Deformation-related type Ia | TH 2.13 | RBC, 0.086 ct | F. yellowish brown | IaB>>A | ≈186 tot.; 31 A, 155 B | AC4167, irr. peaks | 2 MeV e- irradiation, HT 800 °C |
| TH 2.40 | RBC, 0.080 ct | F. olivish brown | IaA>>B | ≈186 tot.; 166 A, 20 B | AC 4167/4063, H1b | - |
| TH 2.43 | RBC, 0.097 ct | F. dk. brown | IaA>>B | ≈199 tot.; 180 A, 19 B | AC 4167 | - |
| TH 2.44 | RBC, 0.067 ct | F. yellowish brown | IaB>>A | ≈172 tot.; 39 A, 133 B | AC 4167 | - |
| TH 2.47 | RBC, 0.047 ct | F. brown | IaB>>A | ≈300 tot.; 29 A, 271 B | AC 4167 | - |
| TH 2.48 | RBC, 0.042 ct | F.dk olive brown | IaA>B | 470 tot.; 317 A, 153 B | AC 4167/4063, H1b, H1c | - |
| TH 2.50 | RBC, 0.125 ct | F. brown yellow | IaAB | 12.6 tot.; 1.6 A, 12 B | AC4167 | - |
| TH 2.52 | RBC, 0.101 ct | F.dp. yellow brown | Ib/IaA | 81 tot.; 45 A, 36 C | AC 3457/4112/4063, H1b | HT 950 °C, 1050 °C, 1500 °C @2 h |
| TH 2.211 | RBC, 0.116 ct | Light brown | IaB>>A | 358 tot.; 18 A, 340 B | AC 4190/4063 | 2MeV e− irr, HT 400–1310 °C |
| TH 2.212 | RBC, 0.075 ct | F. brown | IaB>>A | 98 tot.; 14 A, 84 B | AC 4167/4063 | 2MeV e− irr, HT 400–1310 °C |
| TH 2.328 | RBC, 0.062 ct | F.dk. olive brown | IaA>B | 279 tot.; 205 A, 74 B | AC 4167/4063, H1b, H1c | HT 1500 °C/2 h |
| TH 2.330 | RBC, 0.107 ct | F.dk. brown | IaA>B | 330 tot.; 253 A, 77 B | AC 4167/4063, H1b, H1c | HT 950 °C–1500 °C @ 2 h |
| TH 2.349 | RBC, 0.034 ct | F. dk. olive brown | IaA>B | 253 tot.; 140 A, 113 B | AC 4167/4063, H1b, H1c | HT 950 °C–1050 °C @ 2 h |
| TH 2.383 | RBC, 0.089 ct | F. brown | IaA>B | 262 tot.; 159 A, 103 B | AC 4190/4063, H1b | 2MeV e− irr. 2 h, HT 140–1250 °C |
| TH 2.384 | RBC, 0.095 ct | F. light brown | IaA>>B | 99 tot.; 92 A, 7 B | AC 4167 | 2MeV e− irr. 2 h, HT 140–1250 °C |
| TH 2.387 | RBC, 0.121 ct | F. brown | IaB>A | 59 tot.; 17 A, 42 B | AC 4167 | 2MeV e− irr. 2 h, HT 140–1250 °C |
| TH 2.388 | RBC, 0.099 ct | F. brown | IaAB | 254 tot.; 114 A, 140 B | AC 4190/4063, H1b | 2MeV e− irr. 2 h, HT 140–1250 °C |
| TH 2.389 | RBC, 0.122 ct | F. brown | IaB>>A | 200 tot.; 7 A, 193 B | AC 4167 | 10MeV e− irr. 2 h, HT 140–1250 °C |
| TH 2.390 | RBC, 0.076 ct | F. dk brown | IaB>>A | 141 tot.; 19 A, 122 B | AC 4167 | 10MeV e− irr. 2 h, HT 140–1250 °C |
| TH 2.391 | RBC, 0.129 ct | F. dk. brown | IaA>>B | 307 tot.; 265 A, 42 B | AC 4167/4063, H1b, H1c | 2MeV e− irr. 2 h, HT 140–1250 °C |
| TH 2.392 | RBC, 0.110 ct | F. brown | IaA>>B | 526 tot.; 477 A, 49 B | AC 4167/4063, H1b, H1c | 2MeV e− irr. 2 h, HT 140–1250 °C |
| TH 2.434 | RBC, 0.154 ct | Very light brown (N-O) | IaB>A | 45 tot.; 10 A, 35 B | AC 4167 | - |
| TH 2.435 | RBC, 0.137 ct | Light brown (X-Y) | IaA>B | 175 tot.; 120 A, 55 B | AC 4167 | - |
| TH 2.436 | RBC, 0.146 ct | Light brown (Z) | IaA>B | 50 tot.; 28 A, 22 B | AC 4167/4063 | - |
| TH 2.437 | RBC, 0.136 ct | F.lt. brown | IaA>B | 59 tot.; 30 A, 29 B | AC 4167/4063 | - |
| TH 2.438 | RBC, 0.129 ct | F. yellowish brown | IaB>>A | 93 tot.; 16 A, 77 B | AC 4167 | - |
| TH 2.439 | RBC, 0.154 ct | F. brown | IaA>B | 220 tot.; 156 A, 64 B | AC 4167 | - |
| TH 2.440 | RBC, 0.143 ct | F. pinkish brown | IaA>>B | 776 tot.; 660 A, 116 B | AC 4167 | - |
| TH 2.441 | RBC, 0.129 ct | F. dk brown | IaA>>B | 134 tot.; 129 A, 5 B | AC 4167 | - |
| TH 2.611 | RBC, 0.113 ct | F. brown | IaA>>B | 105 tot.; 95 A, 10 B | AC 4167 | - |
| TH 2.613 | RBC, 0.081 ct | V.l. yellowish brown (O-P) | IaA>>B | 148 tot.; 125 A, 23 B | AC 4167/4063 | - |
| TH 2.614 | RBC, 0.176 ct | V.l. yellowish brown (O-P) | IaB>A | 97 tot.; 30 A, 67 B | AC 4190/4063 | - |
| TH 2.615 | RBC, 0.078 ct | Light brown (Q-R) | IaB>A | 89 tot.; 25 A, 64 B | AC 4167/4063 | - |
| TH 2.617 | RBC, 0.129 ct | V.lt. brown (O-P) | IaA>B | 78 tot.; 52 A, 26 B | AC 4190/4063 | - |
| TH 2.619 | RBC, 0.152 ct | Light brown (X-Y) | IaB | 643 tot.; 643 B | H rich, AC 4200 | HT 1500 °C/2 h |
| TH 2.620 | RBC, 0.110 ct | V.l. brown (O-P) | IaB | 40 tot.; 40 B | AC 4200 | - |
| TH 2.621 | RBC, 0.068 ct | F. brown | IaA>B | 405 tot.; 265 A, 140 B | AC 4167 | - |
| TH 2.622 | RBC, 0.126 ct | Lt. pinkish brown (S-T) | IaA>>B | 976 tot.; 892 A, 84 B | H rich, AC 4167 | - |
| TH 2.623 | RBC, 0.079 ct | Lt. pinkish brown (S-T) | IaA>>B | 1049 tot.; 946 A, 103 B | H rich, AC 4167 | - |
| EUR 001 | RBC 0.027 ct | F. yellowish brown | IaB | 320 tot.; 320 B | H rich, AC 4200 | - |
| Deformation-related type Ib | TH Ib-4 | RBC, 0.101 ct | F.dk. olive brown | Ib>>IaA | 14 tot.; 1 A, 13 C | AC 4111 | HPHT 1850 °C/5 min |
| TH 2.51 | RBC, 0.154 ct | F. brown | Ib | 4.8 tot.; 4.8 C | AC 4111 | - |
| TH 2.210 | Prin, 0.153 ct | F. yellowish brown | Ib | 6.2 tot.; 0.2 A, 6.0 C | AC 4111 | - |
| TH 2.561 | RBC, 0.135 ct | F. brown | Ib | 2.0 tot.; 2.0 C | AC 4167/4111 | - |
| TH 2.46 | RBC, 0.056 ct | F. dk. olivish brown | Ib | 10 tot.; 3.5 A, 6.5 C | AC 4111 | HT 1500 °C/2 h |
| Deformation-related type II | TH 2.332 | RBC, 0.090 ct | F. yellow brown | IIa | - | AC 4063/4200 | HT 1500 °C/2 h |
| TH 2.445 | RBC, 0.652 ct | F. yellow brown | IIa | - | AC 4063/4200 | - |
| TH 2.562 | RBC, 0.062 ct | Lt. yellowish brown (S-T) | IIa | - | AC 4063/4200 | - |
| TH 2.563 | RBC, 0.071 ct | F.lt. yellowish brown | IIa | - | AC 4063/4200 | - |
| TH 2.564 | RBC, 0.068 ct | F.lt. brown yellow | IIa | - | AC 4063/4200 | - |
| TH 2.565 | RBC, 0.037 ct | Lt. yellowish brown (S-T) | IIa | - | AC 4063/4200 | - |
| TH 2.584 | RBC, 0.017 ct | F.lt. brown pink | IIa | - | AC 4063/4200 | HT 1500 °C/2 h |
| TH 2.610 | RBC, 0.083 ct | F.lt. grayish yellowish brown | IIb | 0.05 (= 50 ppb) boron | - | - |
| TH 2.612 | RBC, 0.164 ct | Lt. yellowish brown (O-P) | IIa | - | AC 4063/4200 | - |
| TH 2.616 | RBC, 0.090 ct | Lt. yellowish brown (U-V) | Near IIa | <2 tot (A and B) | AC 4063/4200 | - |
Type Ia colorless
(cape type) | TH 2.163 | RBC, 0.109 ct | Colorless (E color) | IaA>>B | 144 tot.; 136 A, 8 B | - | 1.8 × 10¹⁷ neutrons/cm2, HT 1000 to 1500 °C, 2 h/step |
| TH 2.290 | Plate, 0.080 ct | Colorless (F color) | IaAB | 225 tot.; 105 A, 120 B | - | 1.8 × 10¹⁷ neutrons/cm2, HT 1000 to
1500 °C, 2 h/step; HPHT 1850 °C/5 min. |
Table 2.
The different AC ZPLs and tentative details of their associated structure and spectral features.
Table 2.
The different AC ZPLs and tentative details of their associated structure and spectral features.
| ZPL | Likely Associated Structure and other Associated Spectral Features (LNT) |
|---|
| 4200 (LNT) | 4854 (ZPL?), 5115 | 5990, 5890, 5770 | 6700 | 7919 (ZPL?) | 8115 | 8410 | 8810 |
| 4167 (LNT) | 4673 | 5855 | 7305 | 7760 | 8020 | 8530 | |
| 4136 (LNT) | Too weak to determine associated structure |
| 4111 (LNT) | 5875 | 7265 | 8020 | 8530 | 9325 | | |
| 4092 (LNT) | Too weak to determine associated structure |
| 4063 (LNT) | 5875 | 7305 | 8080 | 8530 | | | |
| 3520 (RT) | Too weak to determine associated structure |
| 3462 (RT) | 4240 | 5850 | 7960 | | | | |
| 2915 (RT) | 4525 |
| 2880 (RT) | 4525? |
| 2790 (RT) | Too weak to determine associated structure |
| 2760 (RT) | Too weak to determine associated structure |
Table 3.
The ZPL positions of the ACs, their annealing behavior in type I DR brown diamonds, and their possible interpretations.
Table 3.
The ZPL positions of the ACs, their annealing behavior in type I DR brown diamonds, and their possible interpretations.
| ZPL LNT | ZPL RT | Annealing Behavior | Possible Interpretation |
|---|
| 4200 | 4200 | Anneals out at >1850 °C | Multi-vacancy defect involving the B center |
| 4167 | 4165 | Without 4063 cm−1 AC: anneals out at >1850 °C. With 4063 cm−1 AC: increases from 1150 °C to 1500 °C while 4063 cm−1 AC decreases, then anneals out at >1850 °C | Multi-vacancy defect involving the A center |
| 4136 | - | Anneals out at >1850 °C | Likely different charge state of one of the defects causing the ACs at 4167/4092/4063 |
| 4111 | 4112 | When dominant it reduces by 30% at 1500 °C, anneals out at >1850 °C. When accompanied by 4063 cm−1 AC then unaffected until it anneals out at >1850 °C | Likely different charge state of one of the defects causing the ACs at 4167/4092/4063 |
| 4092 | - | Decreases from 1450 °C, anneals out at 1500 °C | Multi-vacancy defect |
| 4063 | 4065 | Decreases from 1150 °C, anneals out at 1500 °C | Multi-vacancy defect—precursor defect of the 4167 cm−1 AC and the 4111 cm−1 AC |
| n/a | 3520 | Anneals out at >1850 °C | Multi-vacancy defect involving the A center |
| n/a | 3462 | Anneals out at >1850 °C | Likely different charge state of one of the defects causing the ACs at 4167/4092/4063 |
| n/a | 2915, 2880, 2790 | Anneal out at >1850 °C | Likely different charge states of one of the defects causing the ACs at 4167/4092/4063 |
| n/a | 2760 | Anneals out at >1850 °C | Multi-vacancy defect involving the A center |
Table 4.
The newly elaborated classification of natural, untreated DR brown diamonds.
Table 4.
The newly elaborated classification of natural, untreated DR brown diamonds.
| | Deformation-Related (DR) Brown Diamonds |
|---|
| Main type | Type I | Type II |
|---|
| Sub type | Type Ia | Type Ib | Type IIa | Type IIb |
| Main AC (RT) | 4167 cm−1 AC | 4167/4063 cm−1 ACs | 4111 cm−1 AC | 4111/4063/3462 cm−1 ACs | None or very weak | None |
| Other characteristic IR features | None | May exhibit H1b and H1c | No Y center present | Higher C center content, Y center, may show H1b | None | None |
| Characteristic PL features | 617.6/626.3 nm, 612.4 nm | H3, NV0, NV− | 565.7, H3, NV0, NV− | Various | 417.2 |
| Characteristic UV-Vis-NIR features | Absorption continuum from NIR to the UV, 560 nm band | Absorption continuum from NIR to the UV, NV− center | Steeper absorption continuum from NIR to the UV, weak NV− center | Absorption continuum from NIR to the UV |
| Class name | 4167 AC DR brown diamond | 4167/4063 DAC DR brown diamond | 4111 AC
Ib DR brown diamond | 4111/4063/3462 TAC Ib brown diamond | IIa DR brown diamond | IIb DR brown diamond |


