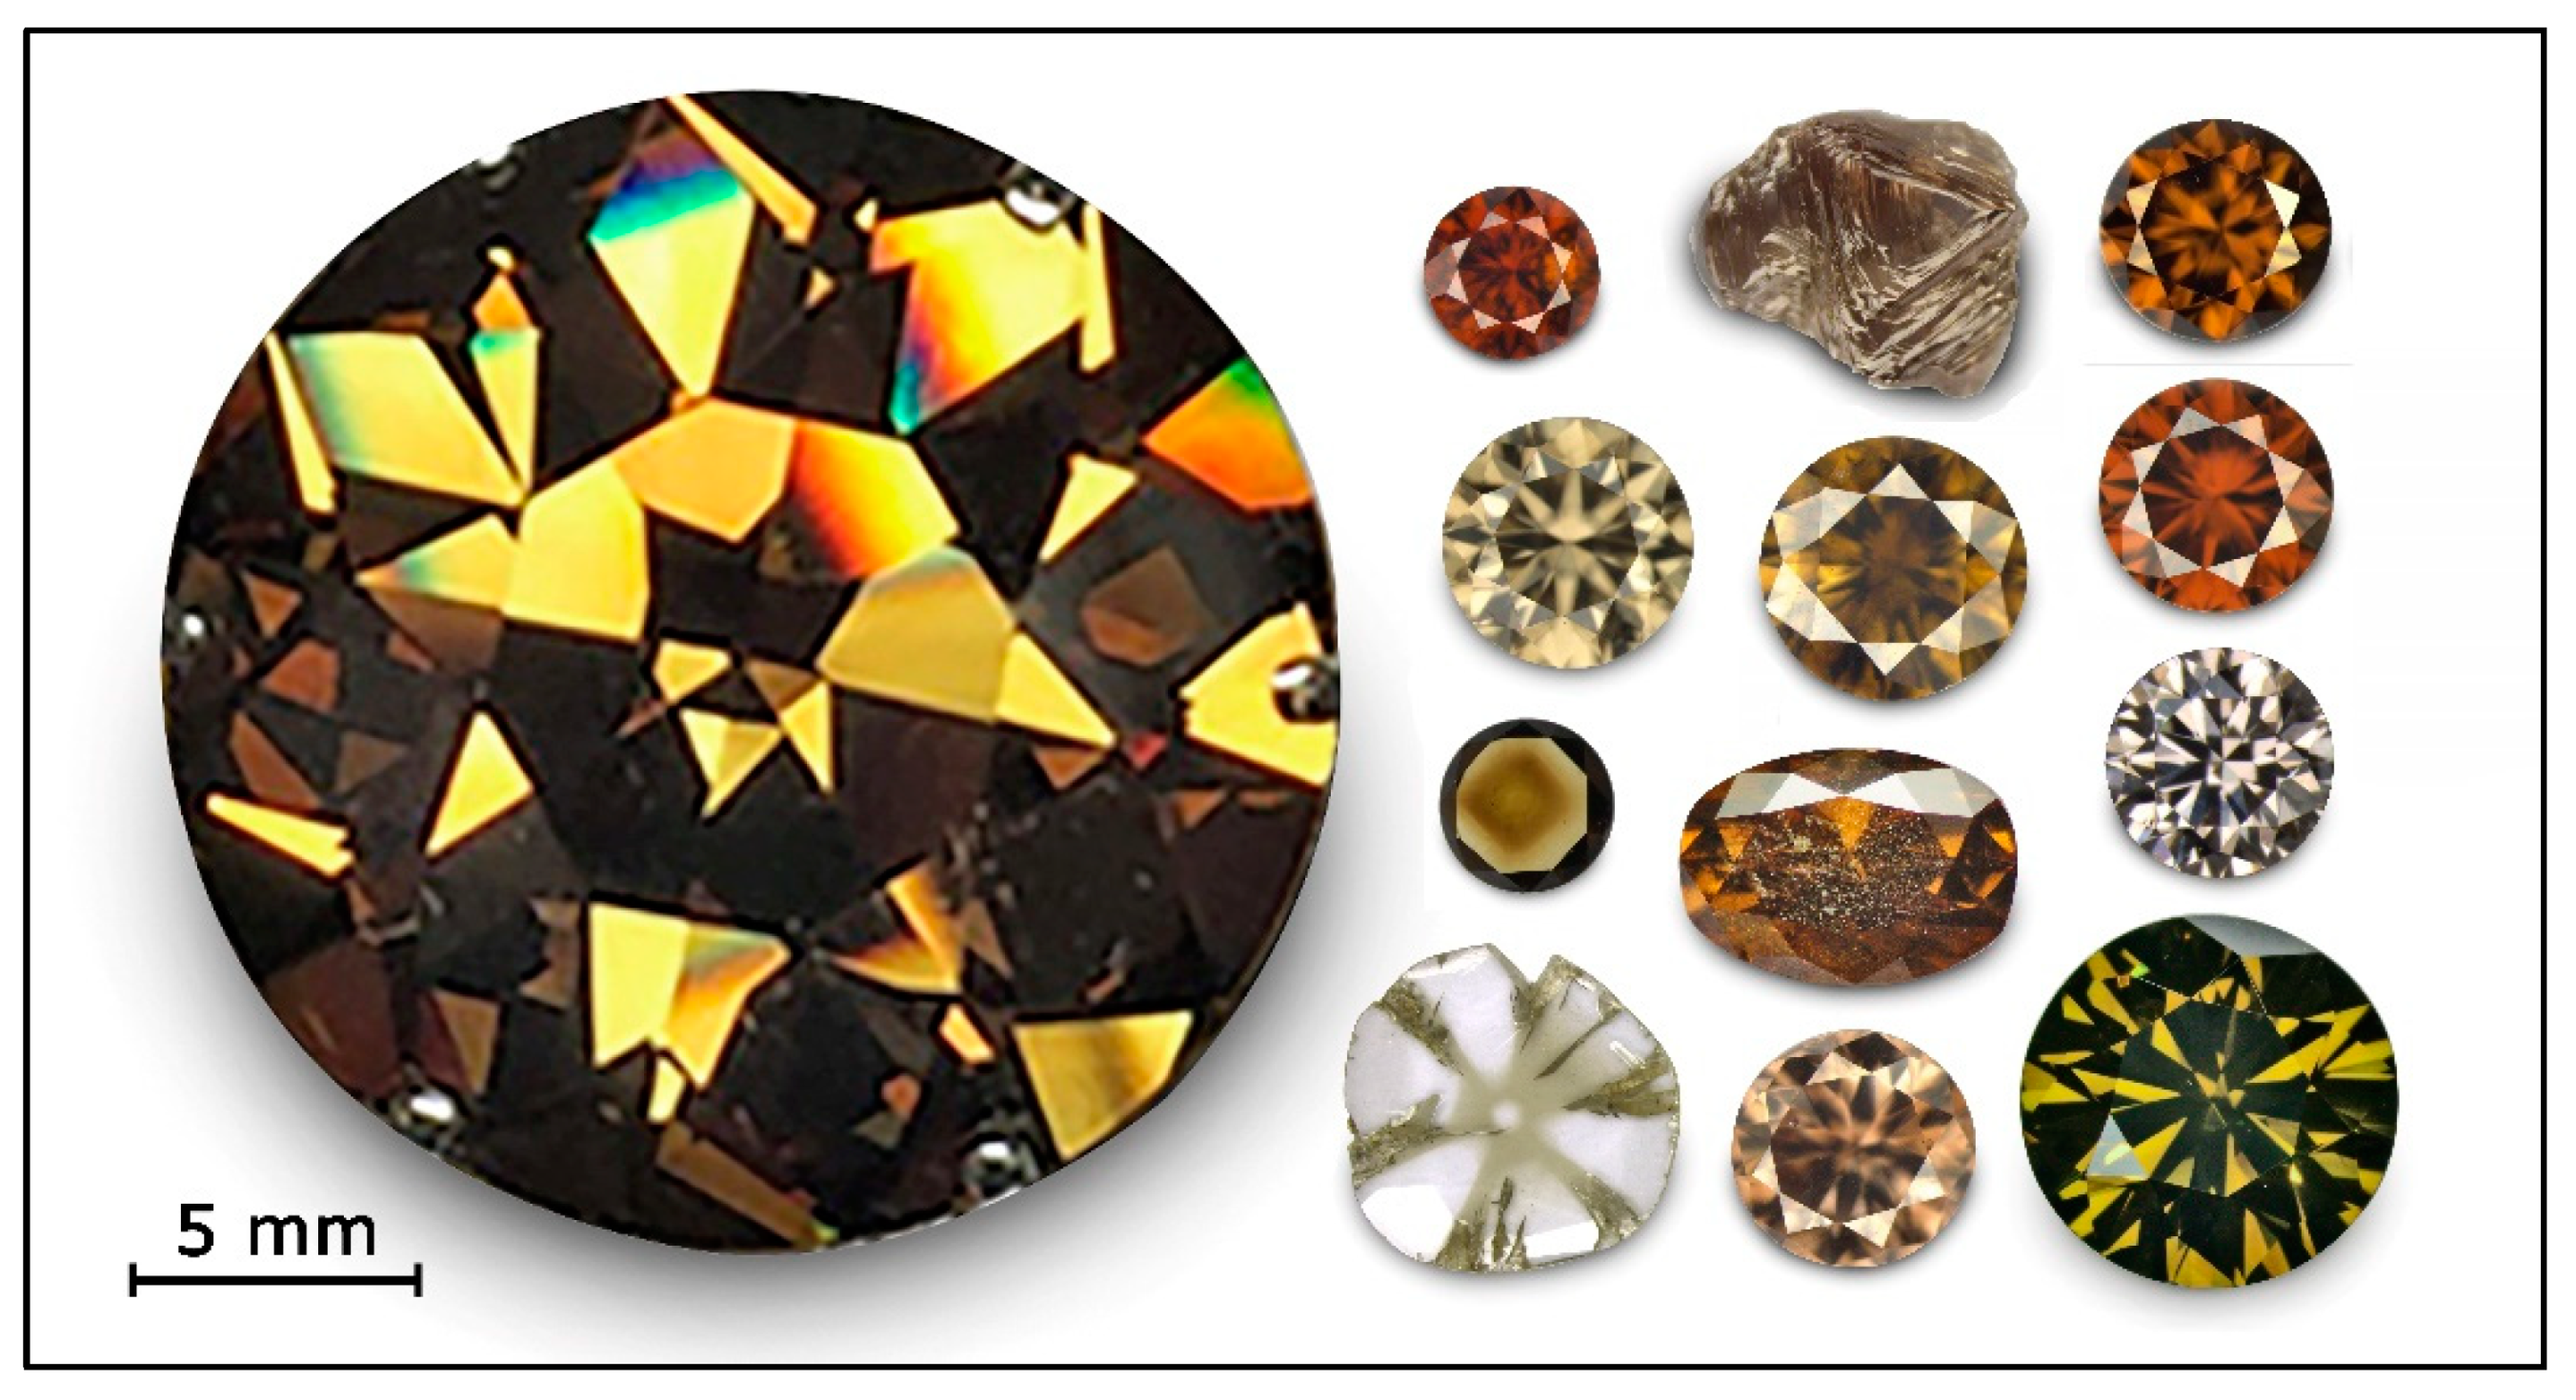
Figure 1.
Part of the non-deformation-related (NDR) brown diamonds tested for this study, from left to right: First stone plus second column—hydrogen rich diamonds; second column—CO2 and Pseudo—CO2 diamonds; third column top two stones—treated brown diamonds; third column bottom two stones—synthetic brown diamonds.
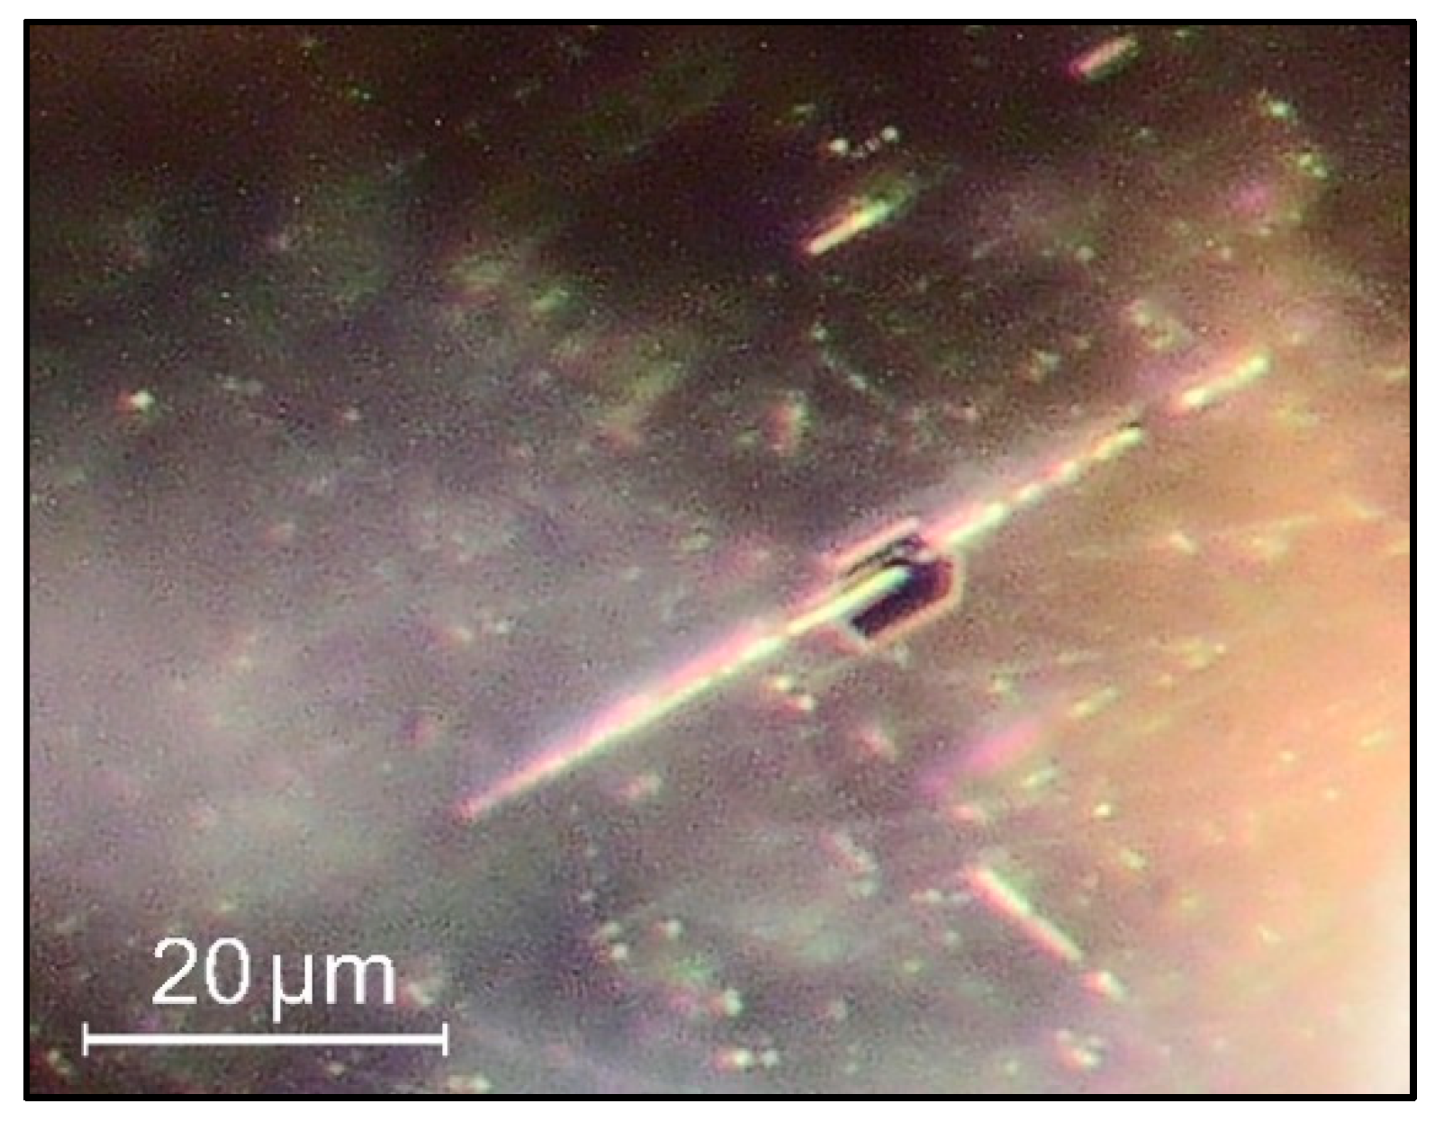
Figure 2.
The characteristic inclusions in a CO2 diamond—hexagonal platelets and needle-like inclusions. Photo: Dr. Thomas Hainschwang.
Figure 2.
The characteristic inclusions in a CO2 diamond—hexagonal platelets and needle-like inclusions. Photo: Dr. Thomas Hainschwang.
Figure 3.
A very typical CO2 diamond (TH 2.78) in immersion (left) and crossed polarizing filters (right). The brown color patch was shown to contain the CO2 while the colorless sectors are free of CO2. The strain in CO2 diamonds is not related to deformation, but most likely to micro-inclusions. Photos: Dr. Thomas Hainschwang.
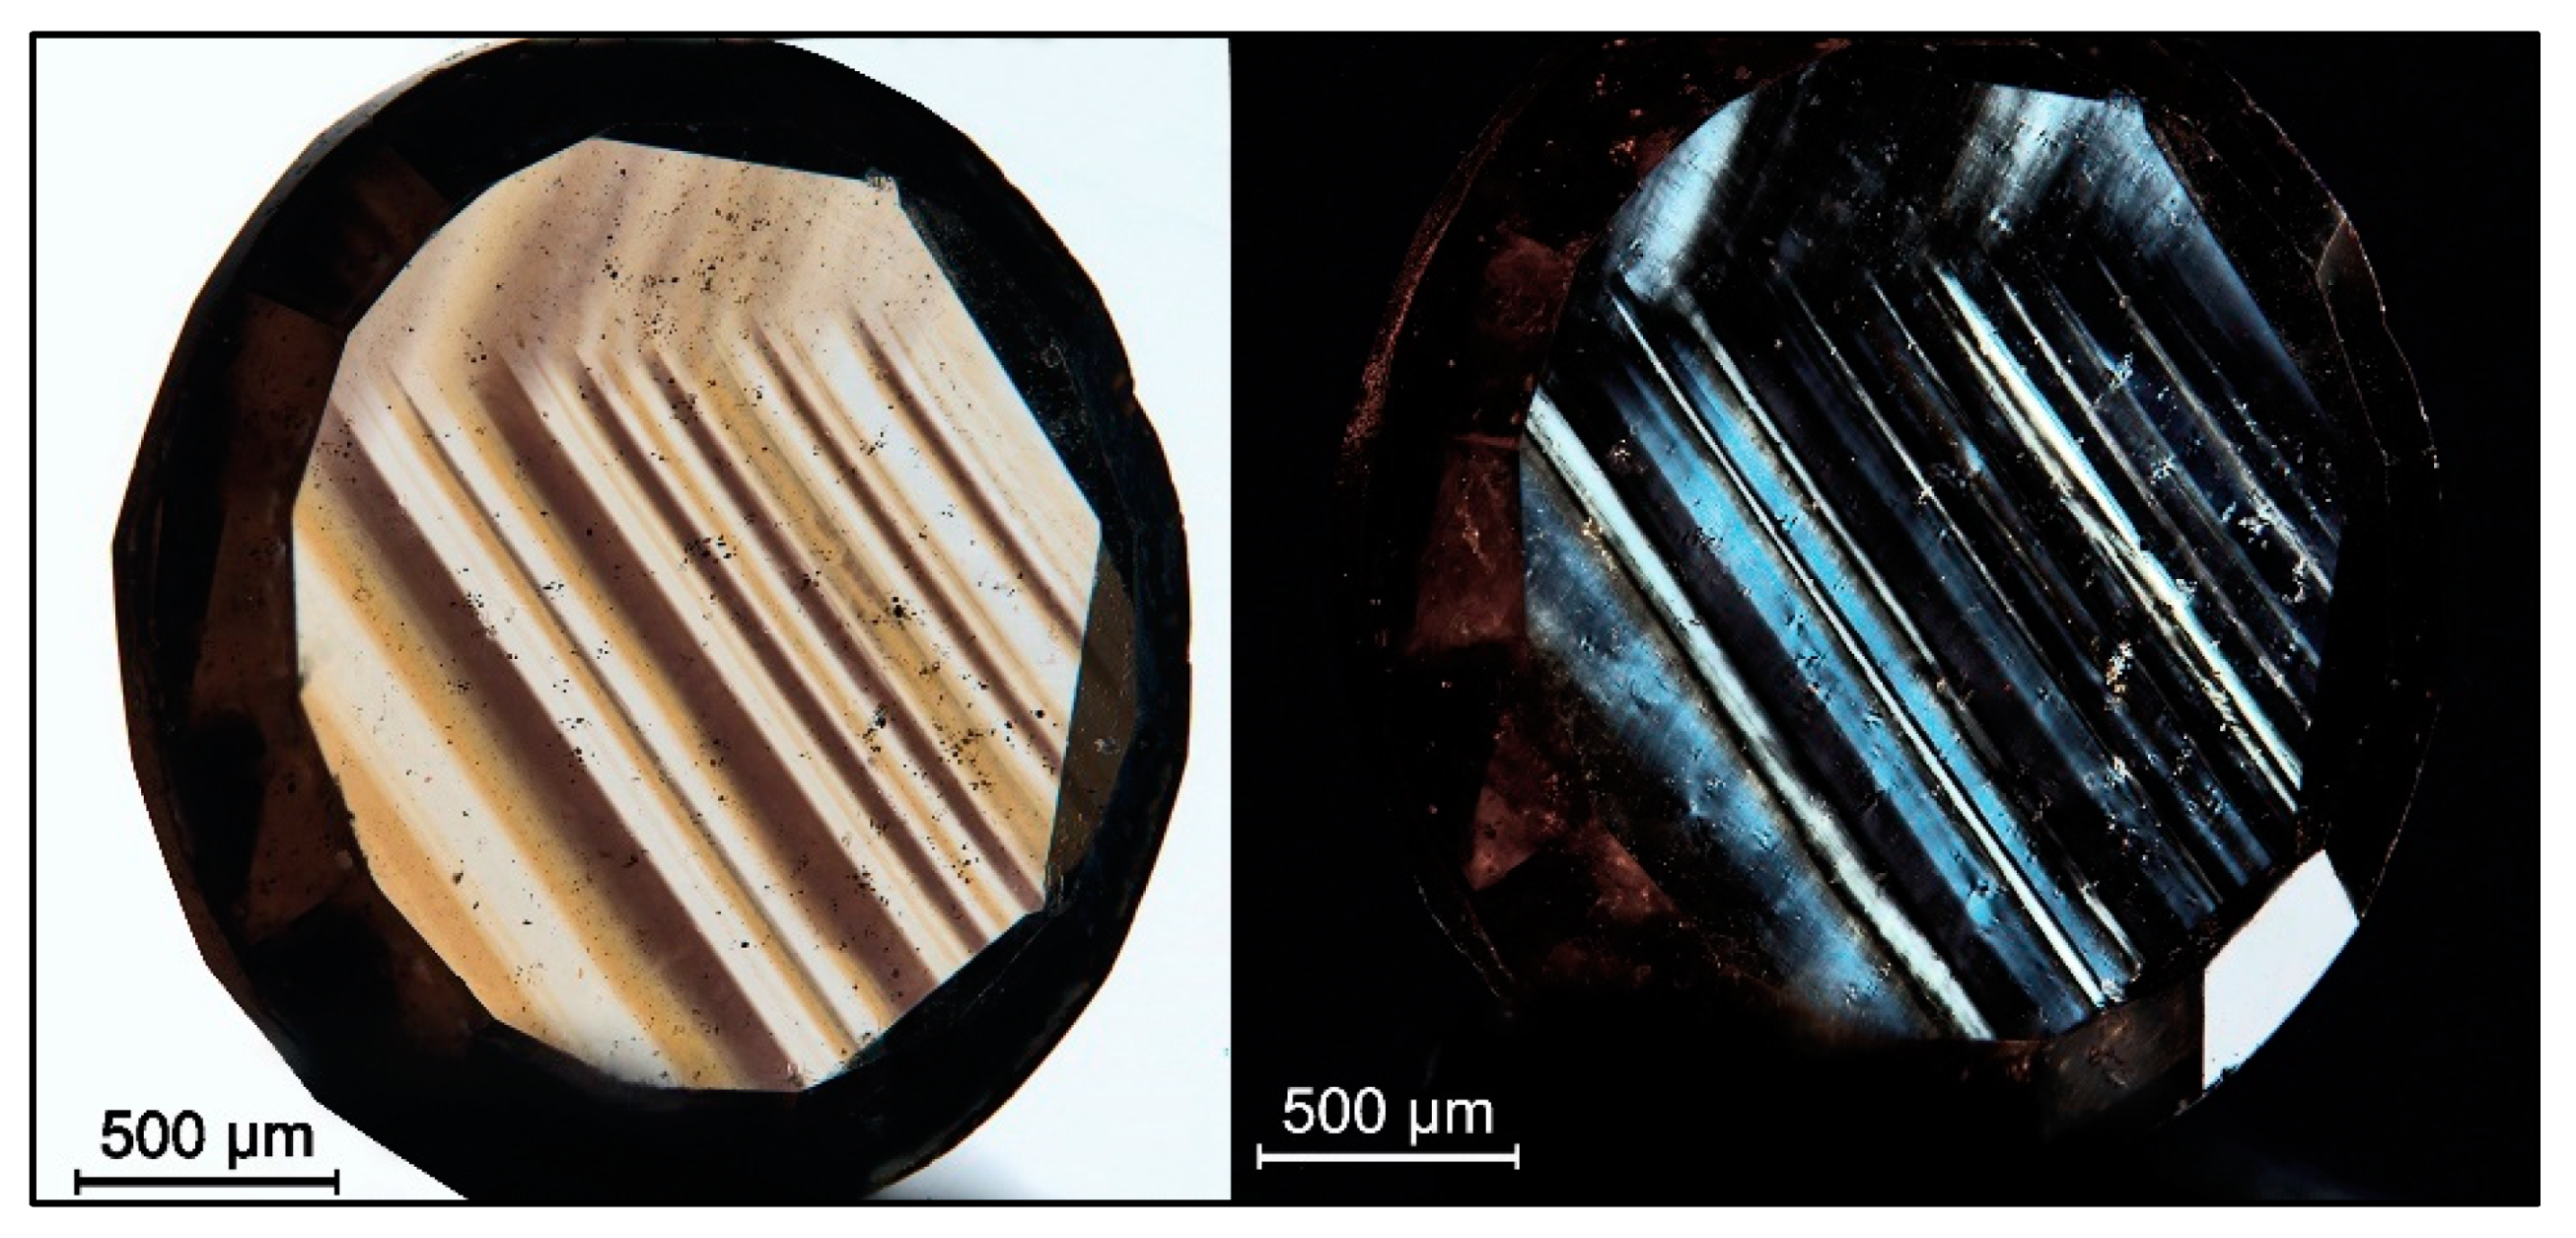
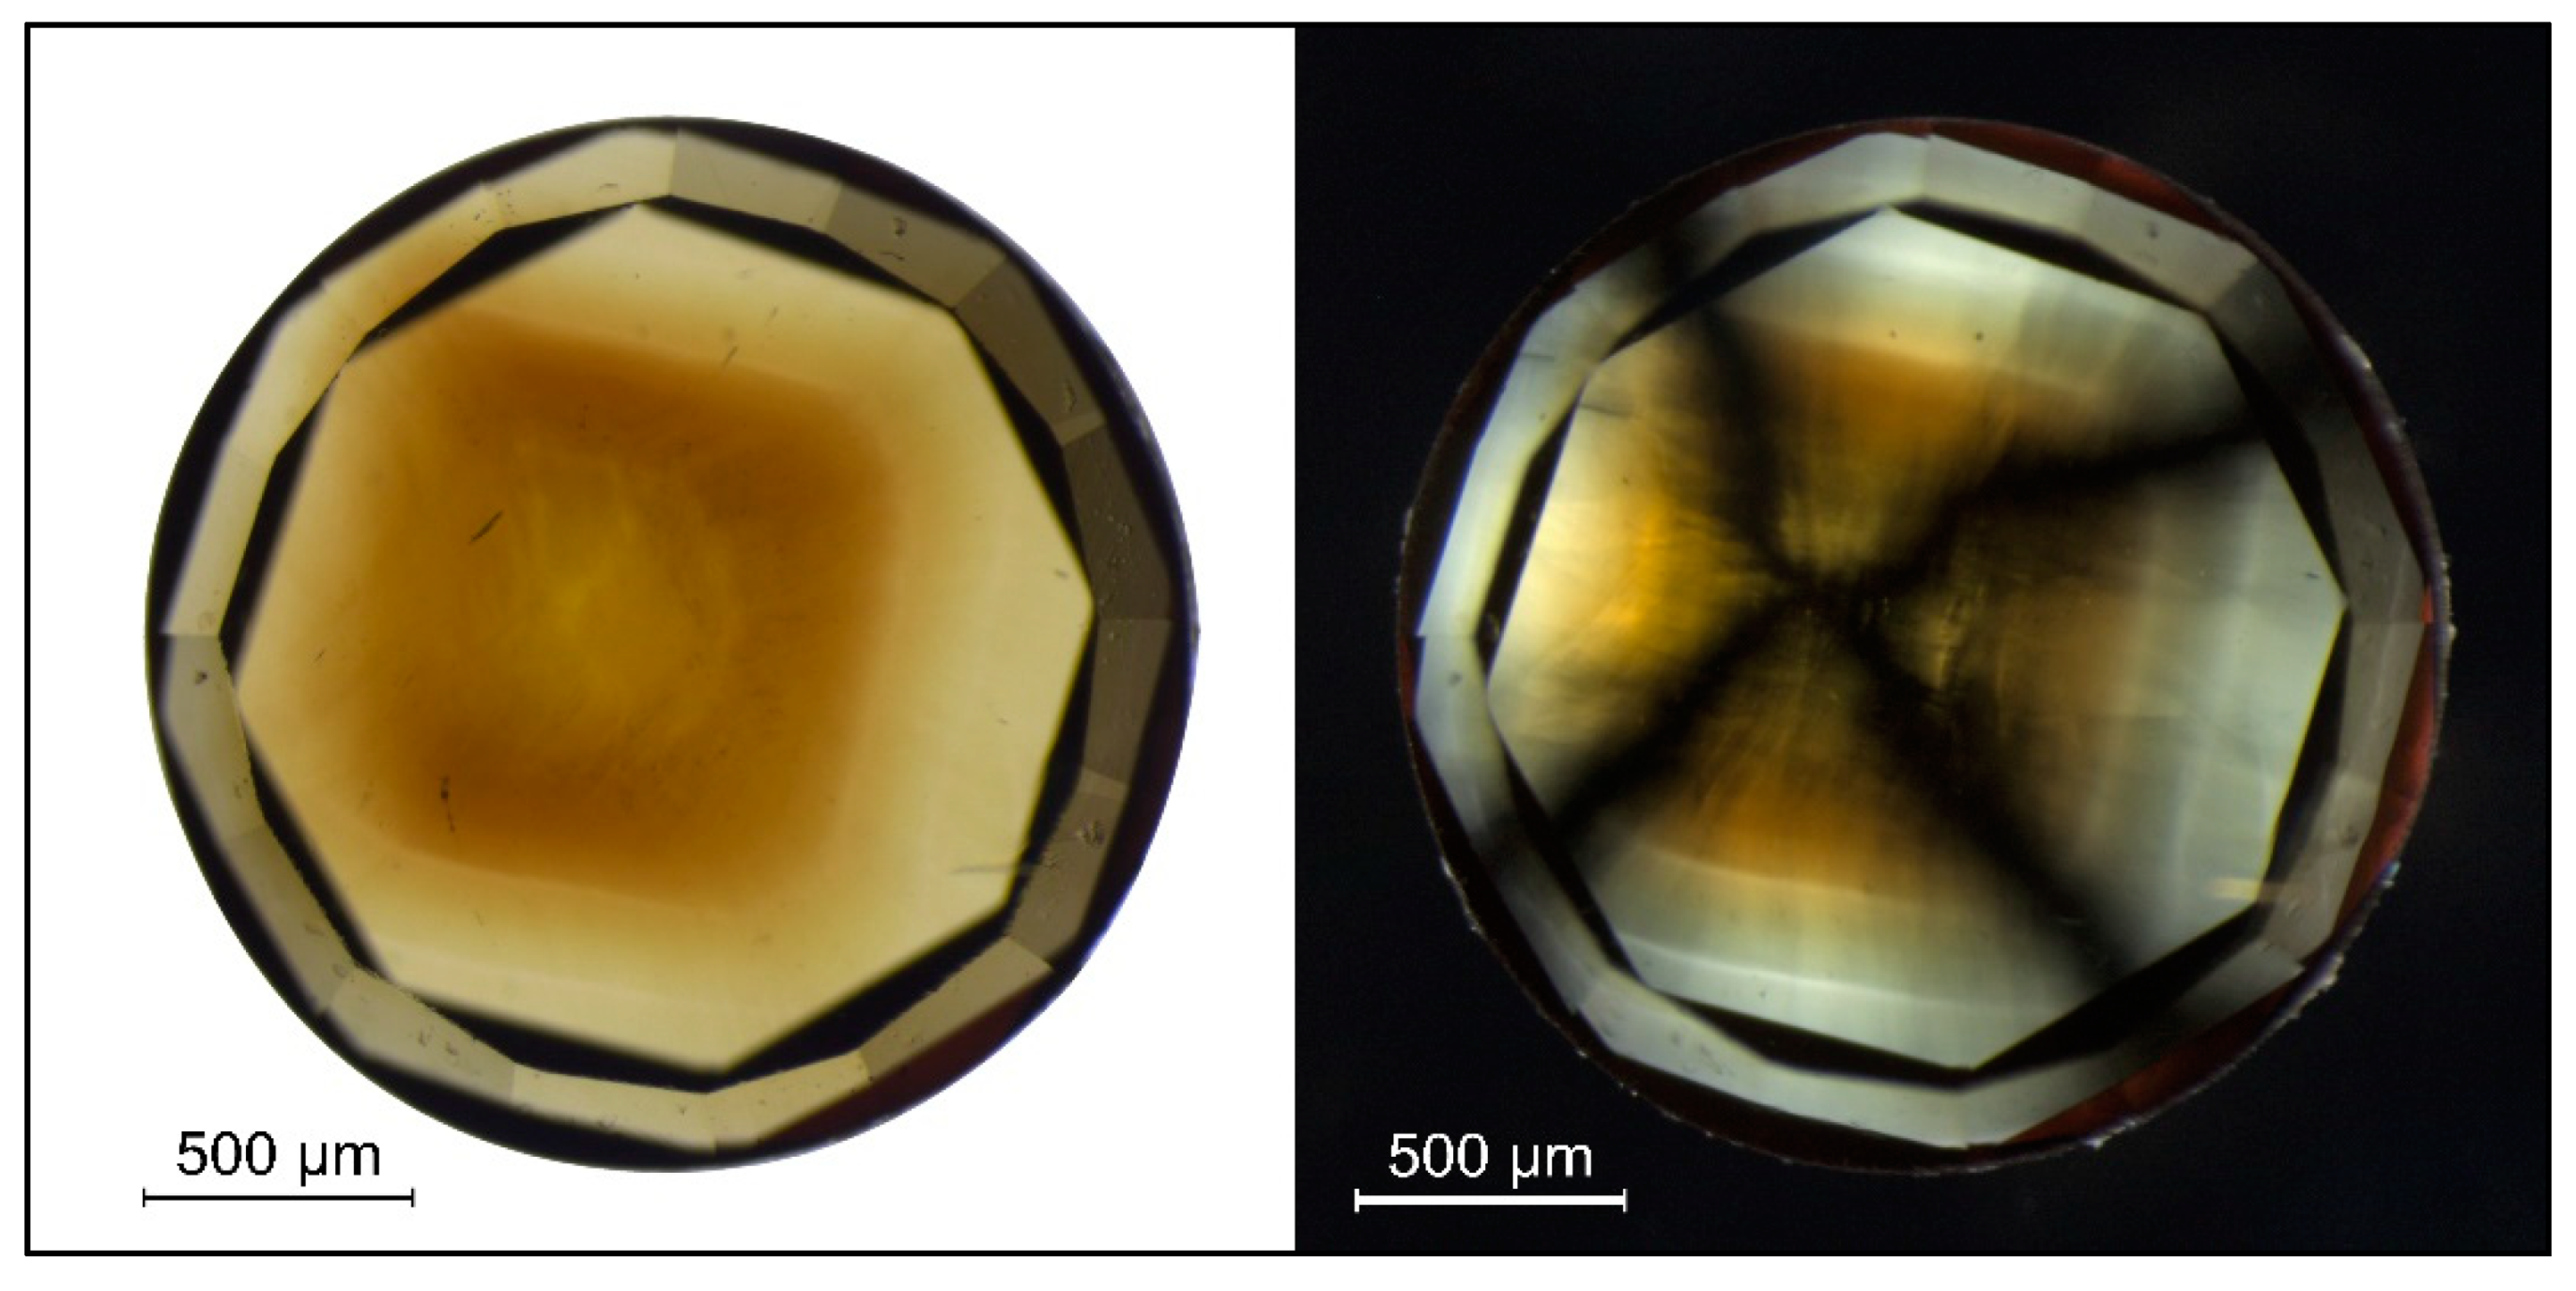
Figure 4.
A very low CO2 content diamond (sample SGDF 5846), representing the limit between CO2 and “Pseudo CO2”, in immersion (left) and under crossed polarizing filters (right). The amazing “zebra” layering of the diamond did not relate to plastic deformation. The lighter yellow brown and the darker brown zones were apparently isotropic—they stayed dark during rotation of the sample—while the colorless and olive-gray zones were clearly anisotropic—they lightened up and turn dark alternating every 45°; the olive-gray zones showed this effect most strongly and appear white in the image above on the right.
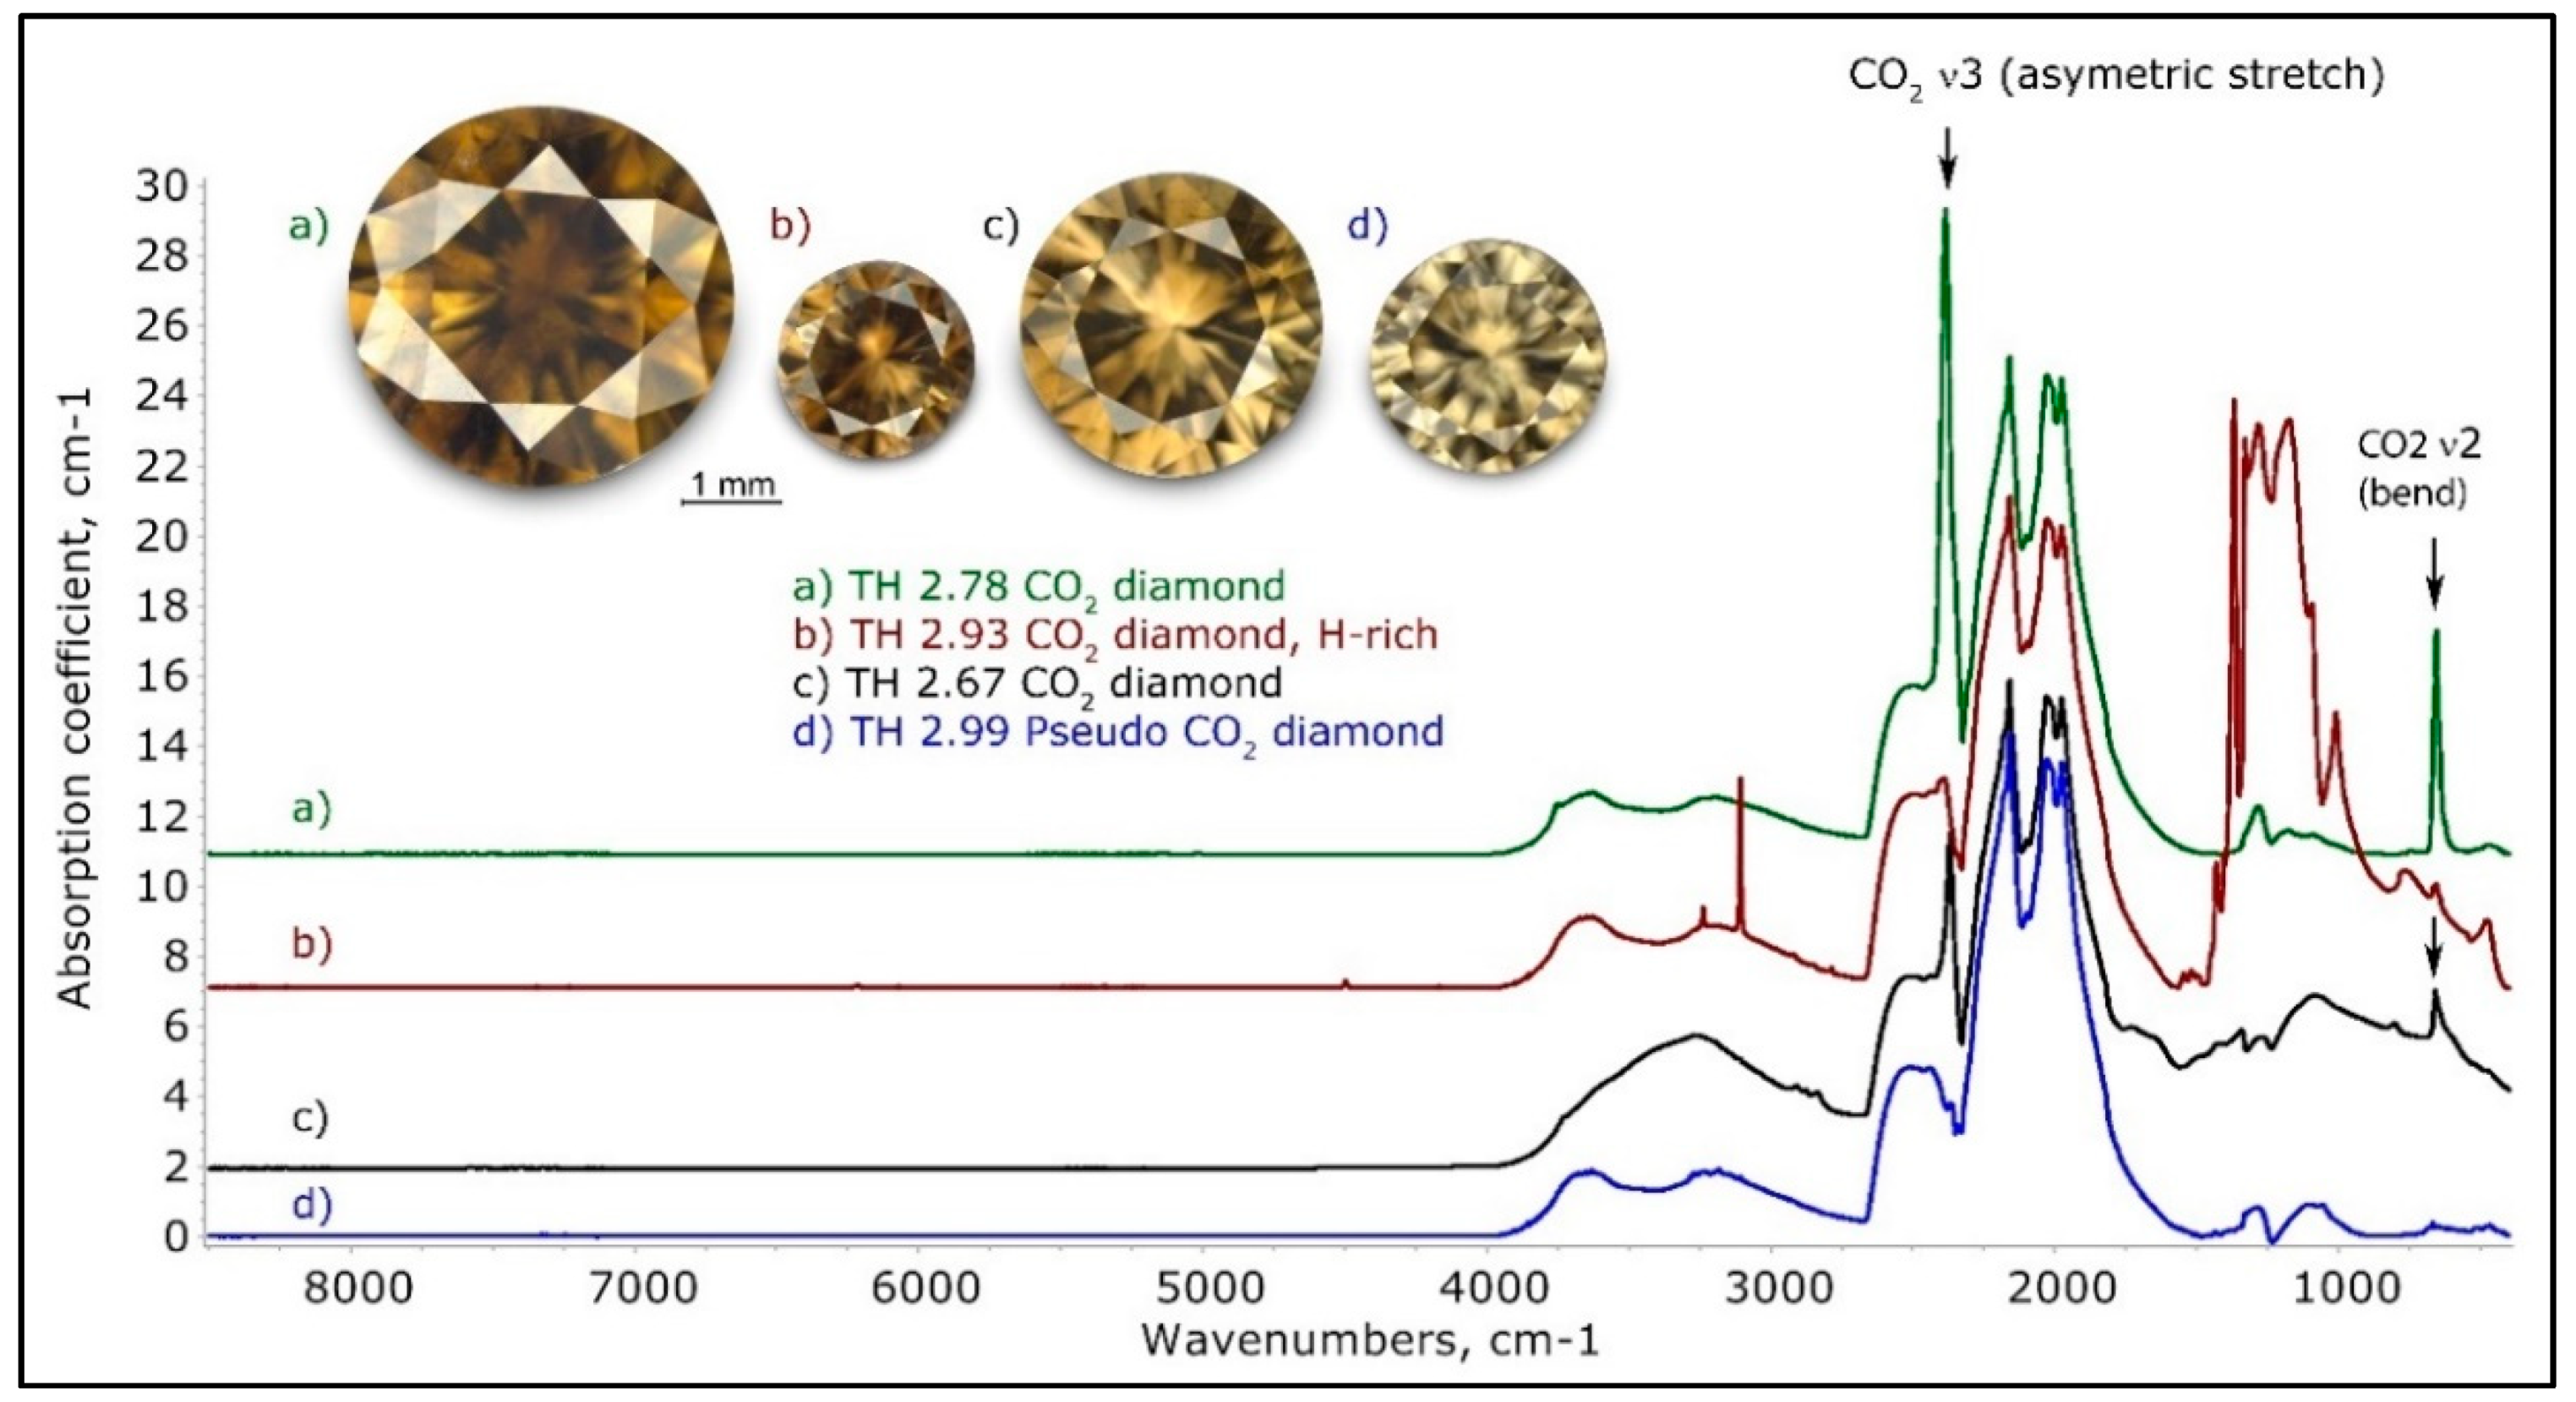
Figure 5.
A few representative normalized IR spectra of brown CO2 and Pseudo CO2 diamonds. Trace (a) is a typical CO2 diamond spectrum, spectrum (b) a very unusual hydrogen and nitrogen-rich CO2 diamond, and trace (c) an example of a CO2 diamond not exhibiting any trace of known nitrogen-related absorptions. Trace (d) is a typical Pseudo-CO2 diamond, but it must be mentioned that these spectra vary widely; they may exhibit some known nitrogen-related absorptions but generally a significant portion of the one-phonon absorption is of unknown cause. The spectra have been shifted vertically for clarity.
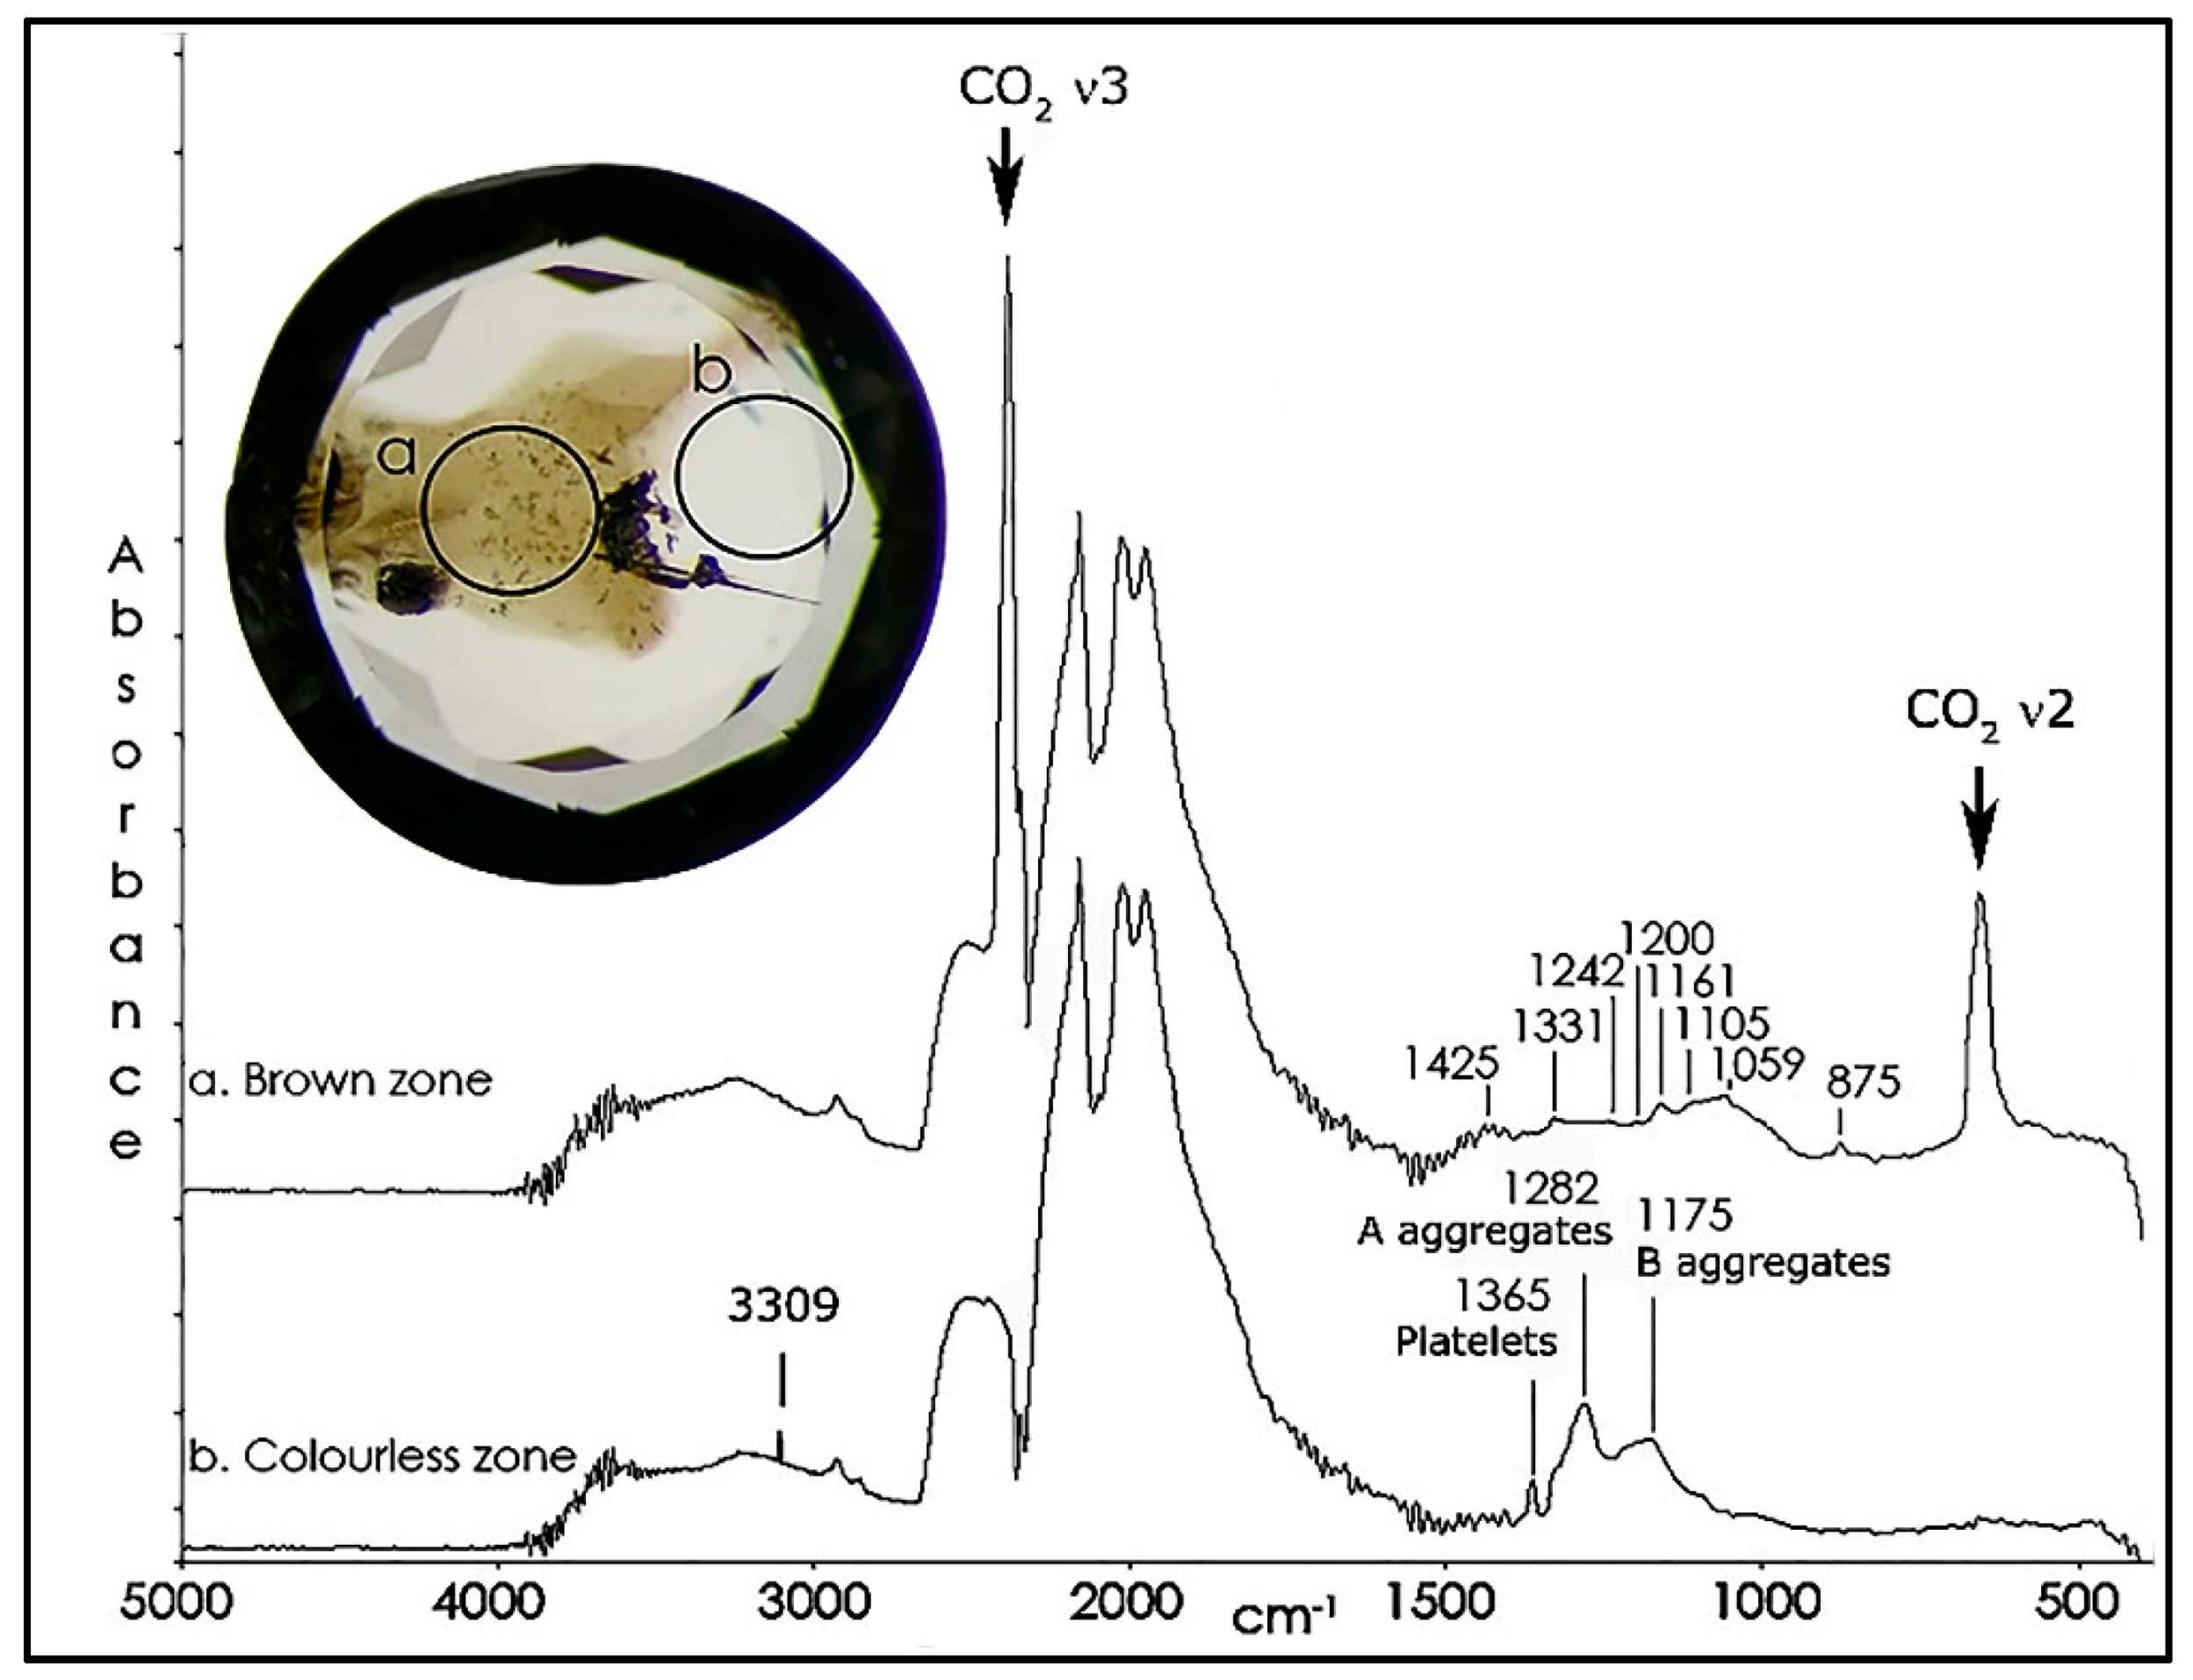
Figure 6.
The IR spectra of the brown (trace a) and the colorless (trace b) sector of a brown CO2 diamond (Sample TH 2.71) clearly show that the CO2 is confined to the brown sector, while the A and B aggregate nitrogen plus the hydrogen is only detected in the colorless sector. The one-phonon absorption in the brown color zone is of unknown cause. The spectra have been shifted vertically for clarity.
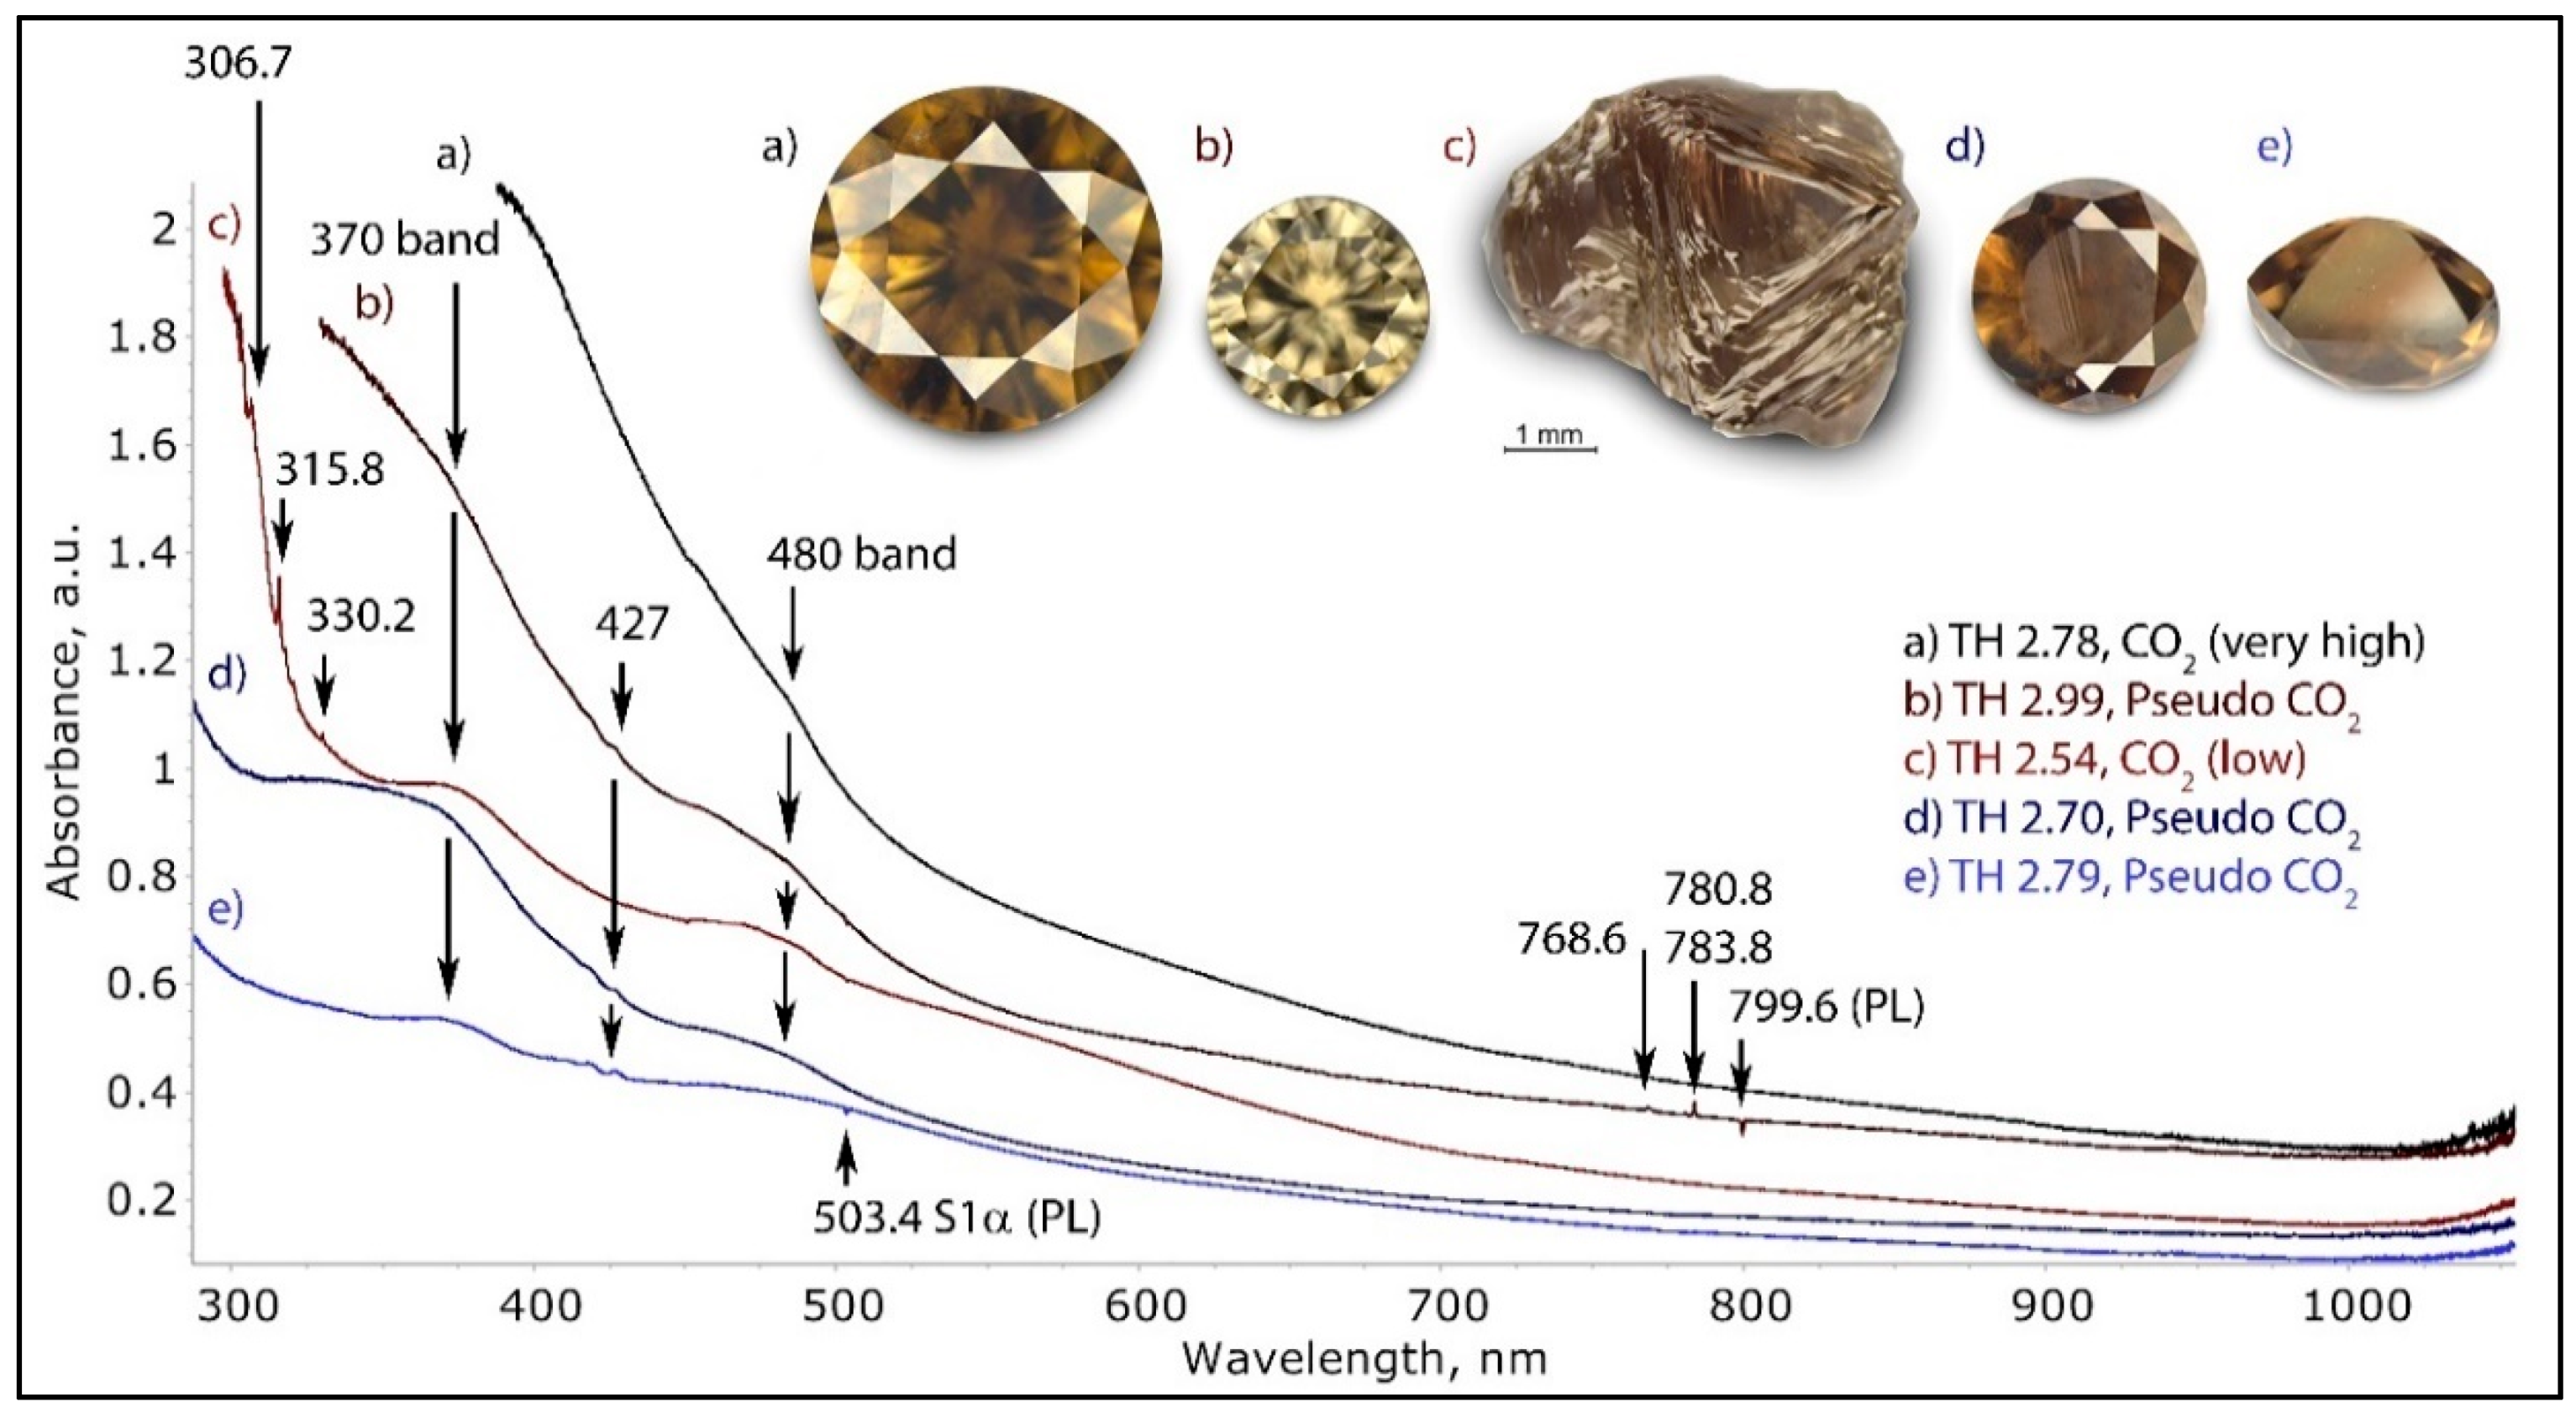
Figure 7.
The low temperature UV-Vis-NIR spectra of a series of different CO2 and Pseudo CO2 diamonds. As with other brown diamonds, the NDR CO2 and Pseudo CO2 diamonds exhibit spectra characterized by a rather featureless continuum. Each one of them exhibits weak broad bands at 480 nm and at 370 nm and often a narrower weak peak at 427 nm; these features indicate the presence of oxygen in these diamonds. The spectra have been shifted vertically for clarity.
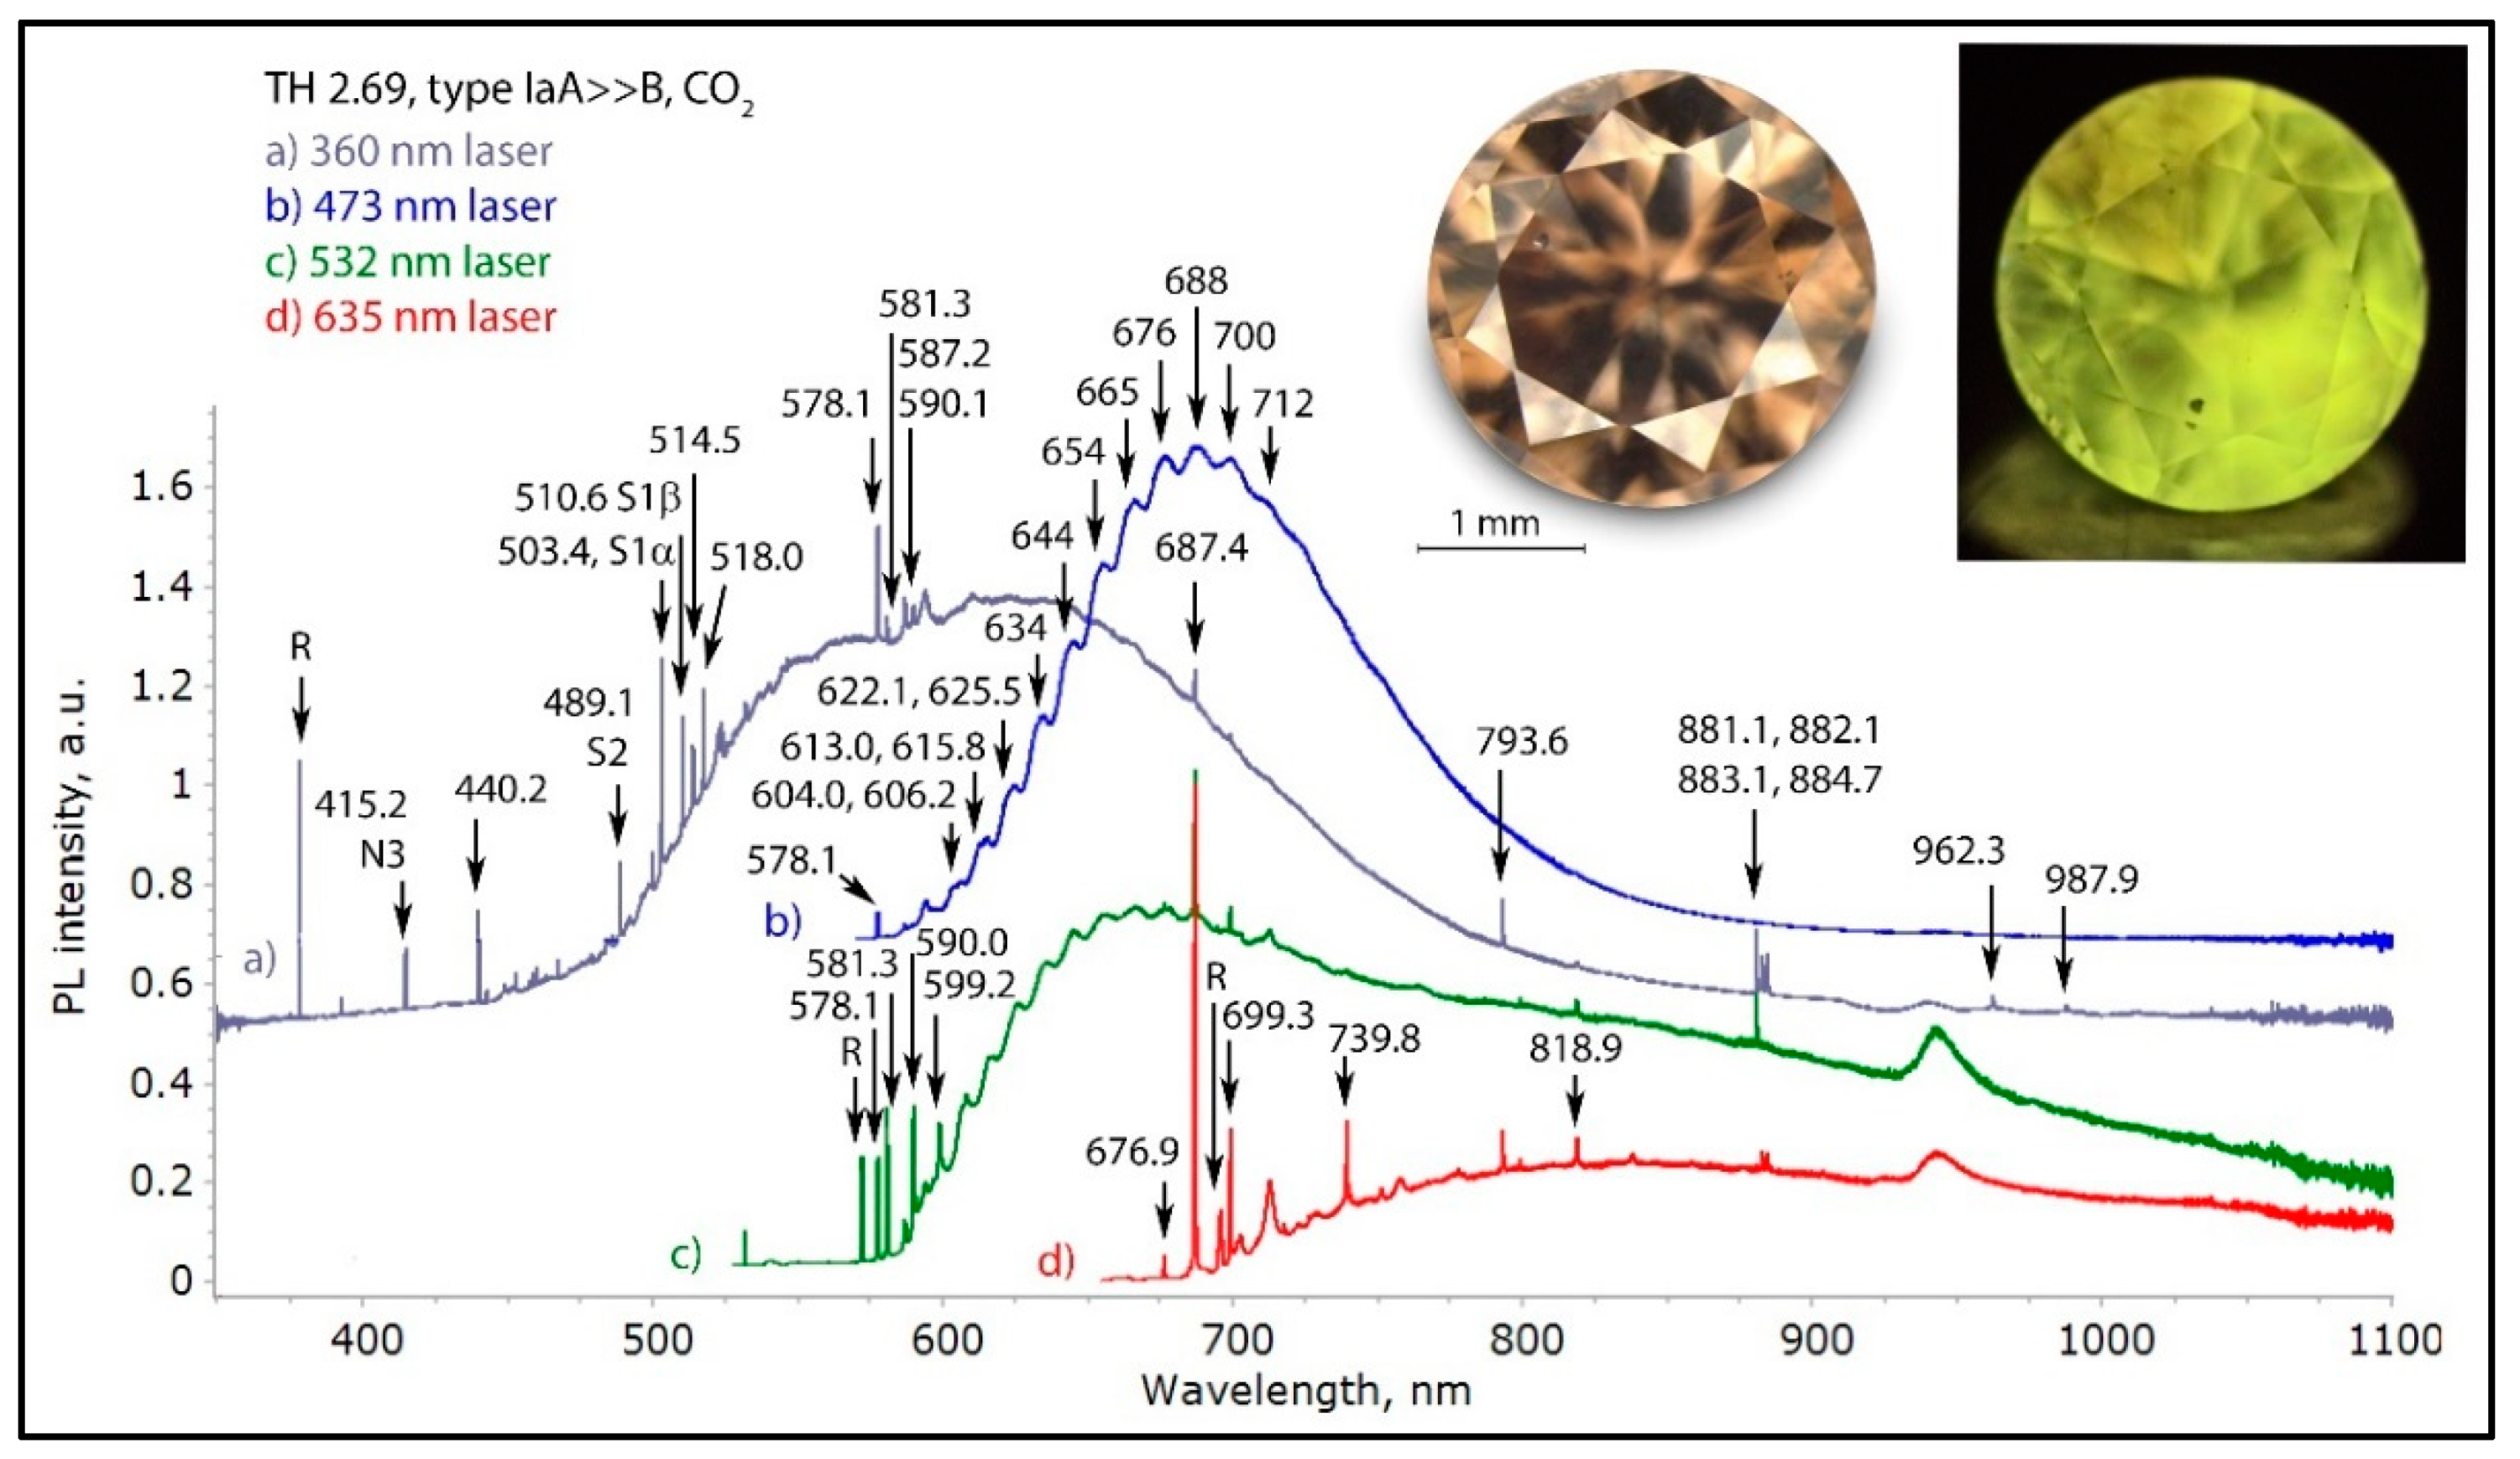
Figure 8.
The highly complex PL spectra of a CO2 diamond (TH 2.69) under four different laser excitations. The yellow PL seen in the photo is caused by the S1 and S2 defect. The complex band centered at about 690 nm with all its oscillating peaks separated by 10 to 12 nm each seen in trace (b) is very typical for diamonds rich in oxygen, and it relates directly to the 480 nm absorption band. Such diamonds always contain nickel as well, as can be seen by the presence of S1 and S2 as well as many of the sharp features seen in the spectra. The spectra have been shifted vertically for clarity.
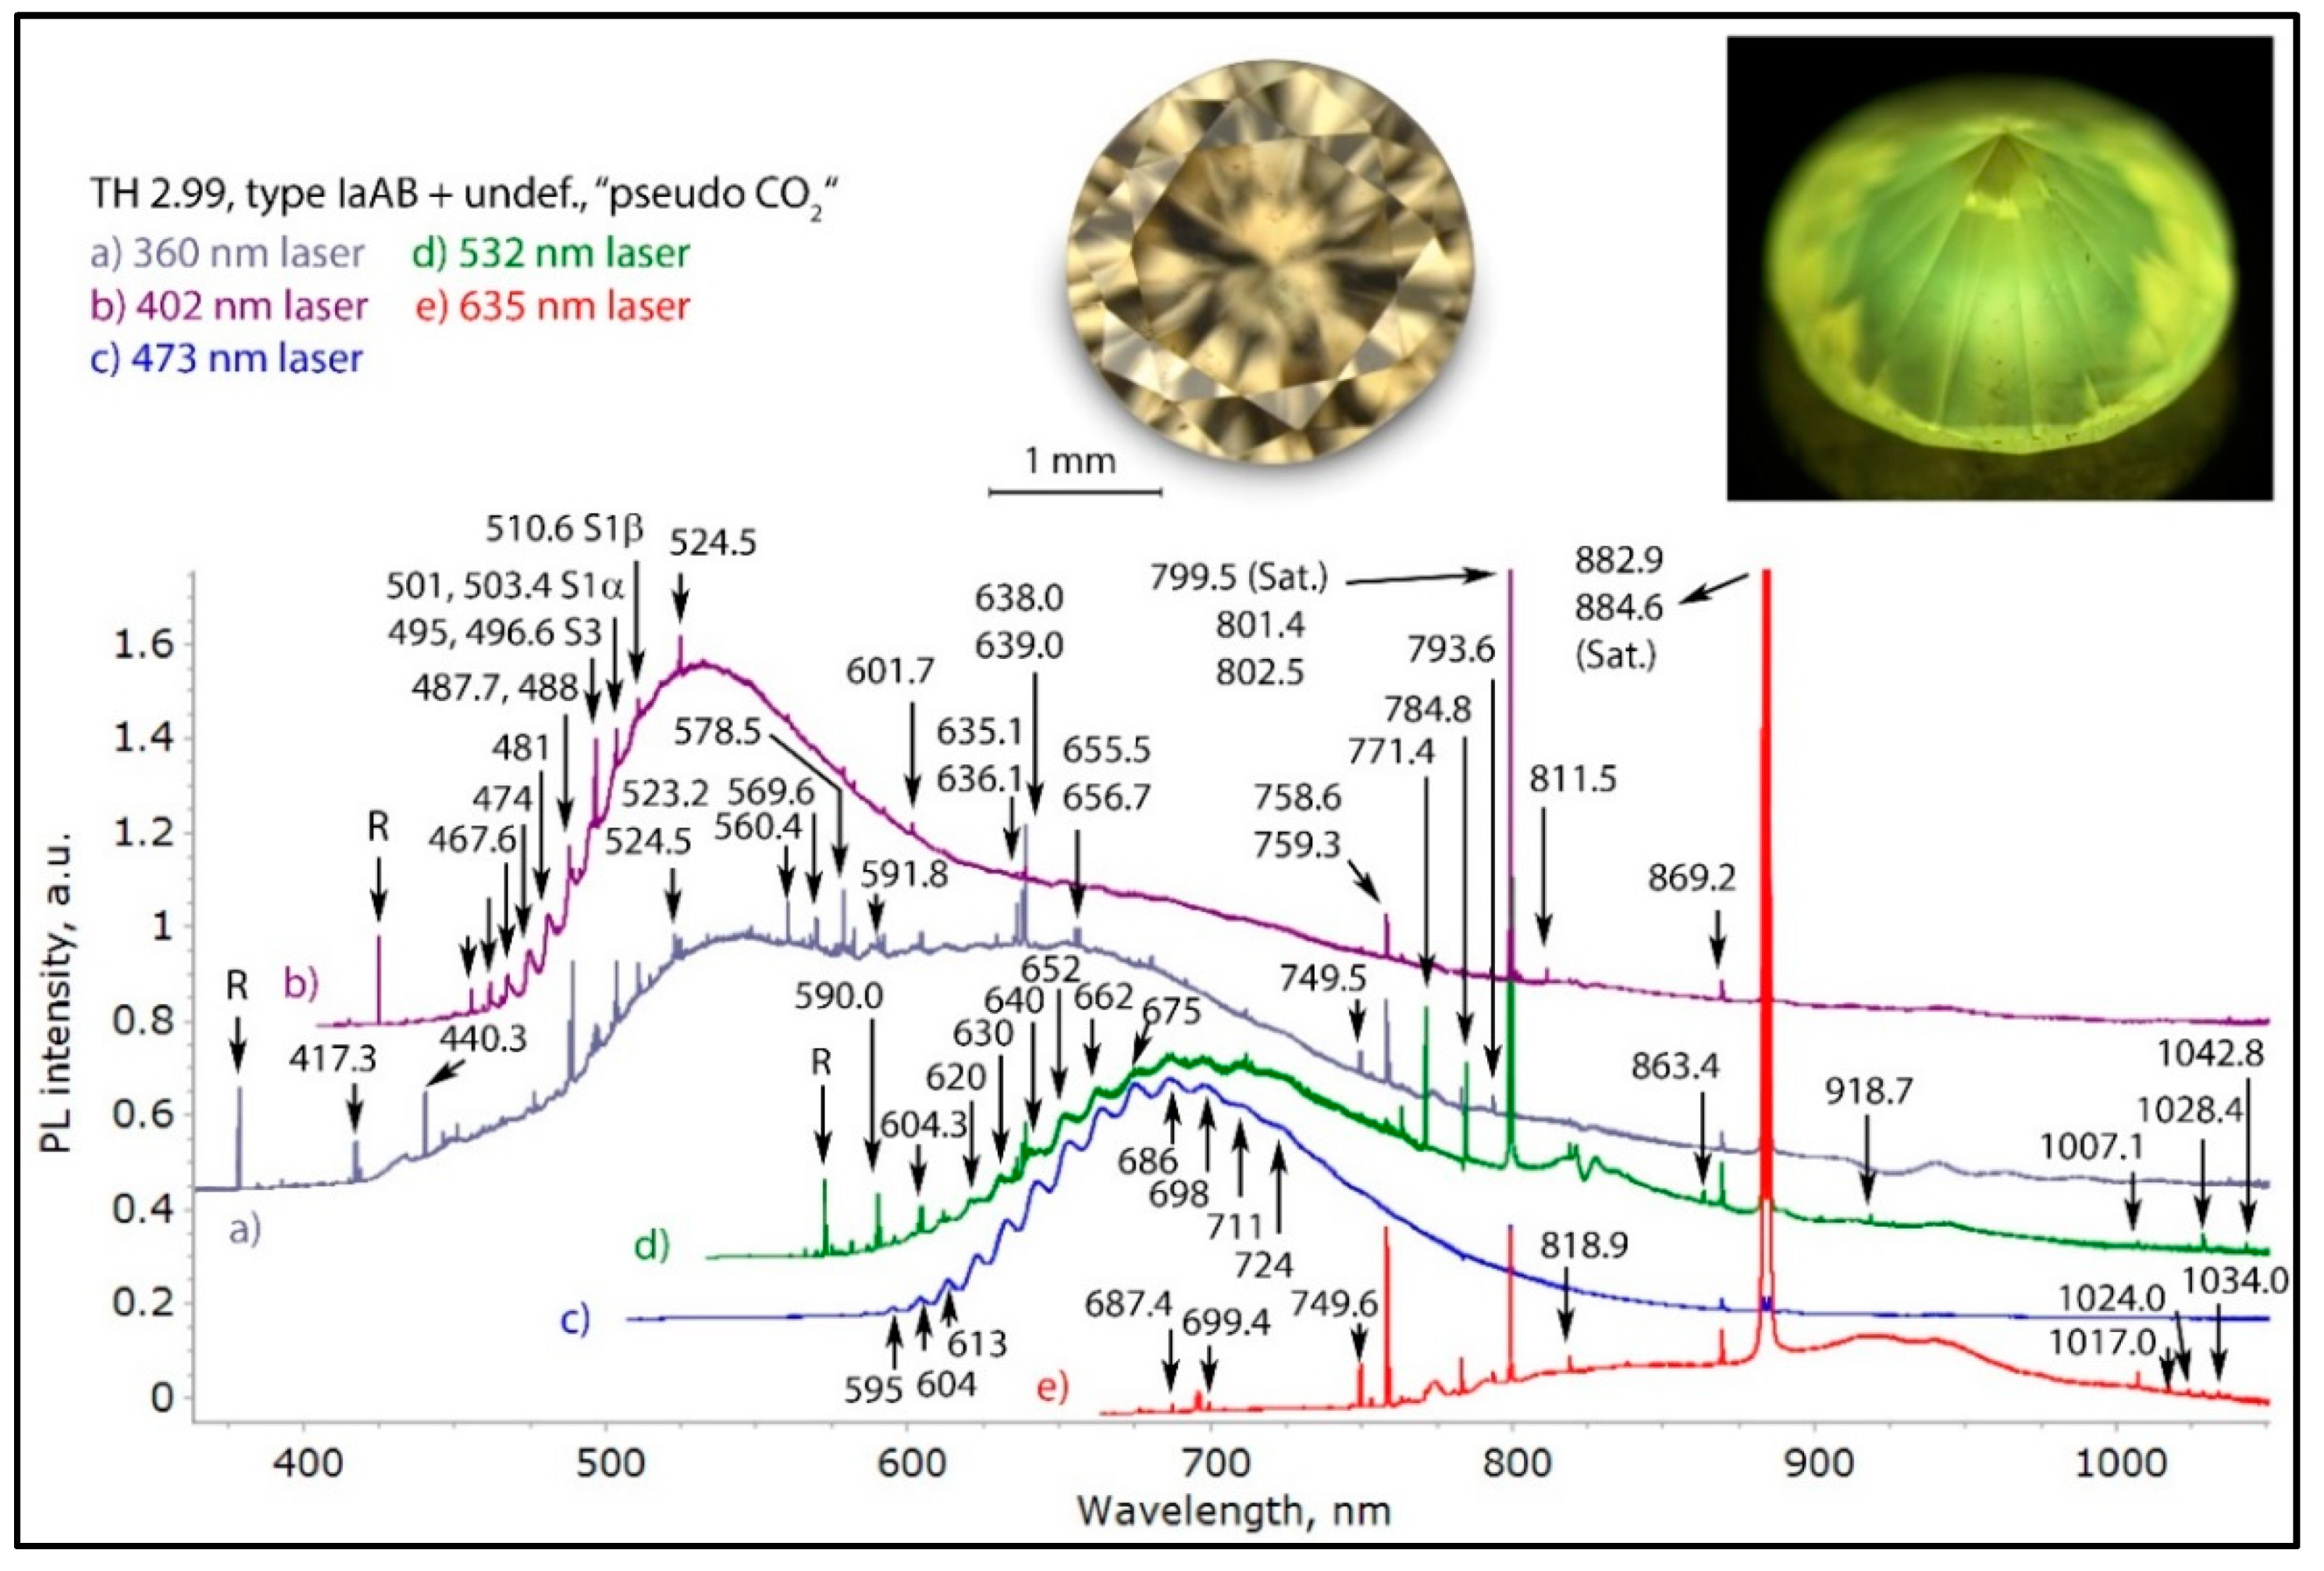
Figure 9.
The highly complex PL spectra of a Pseudo CO2 diamond (TH 2.99) under five different laser excitations. The yellow PL seen in the photo is caused mainly by the S1 and S3 defect. The complex band centered at about 690 nm with all its oscillating peaks separated by 10 to 12 nm each seen in trace (c) and (d) is very typical for diamonds rich in oxygen, and it relates directly to the 480 nm absorption band. Such diamonds always contain nickel as well, as can be seen by the presence of S1 and S3, the very strong 882.9/884.6 nm Nii+ doublet as well as many of the sharp features seen in the spectra. The PL spectra of CO2 and Pseudo CO2 diamonds are very similar and typical features present are identical. The spectra have been shifted vertically for clarity.
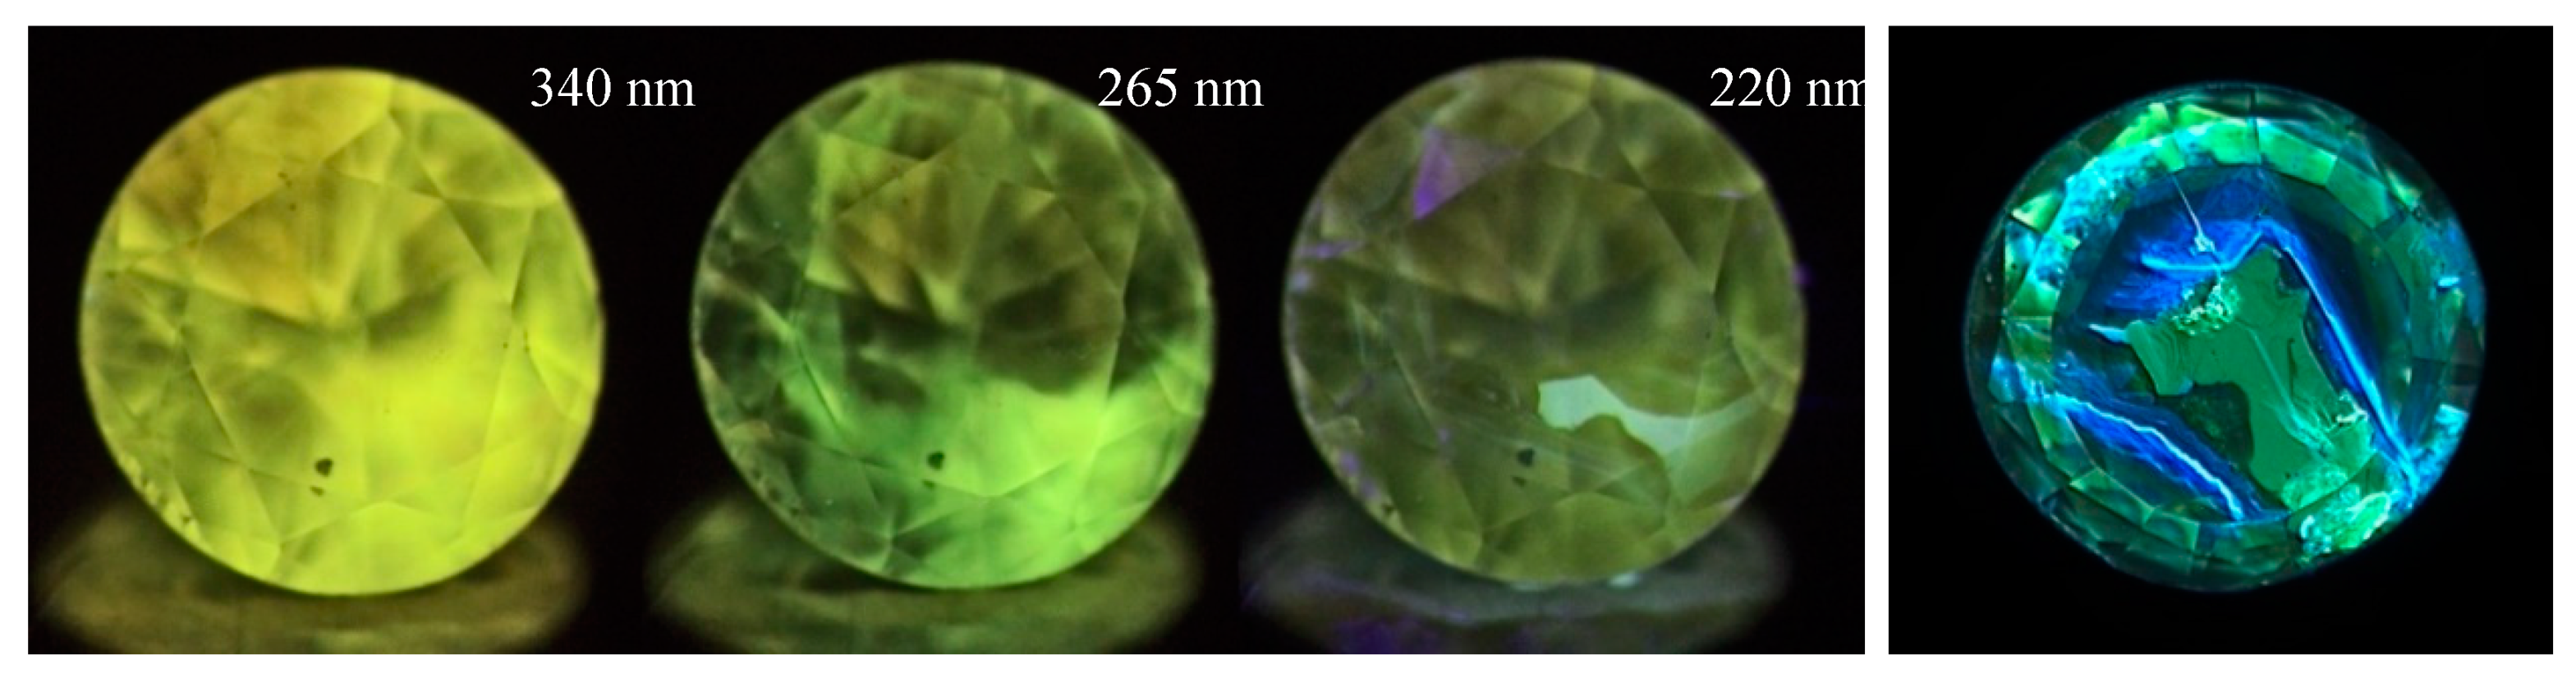
Figure 10.
A brown CO2 diamond (sample TH 2.69) under three different UV excitations of the DFI system. The yellow to yellow green PL is caused mainly by the S1 defect. The fluorescence is concentrated to the brown CO2 -rich zones. The image on the far right shows sample TH 2.71 that was cut into platelet, under the DiamondViewTM system.
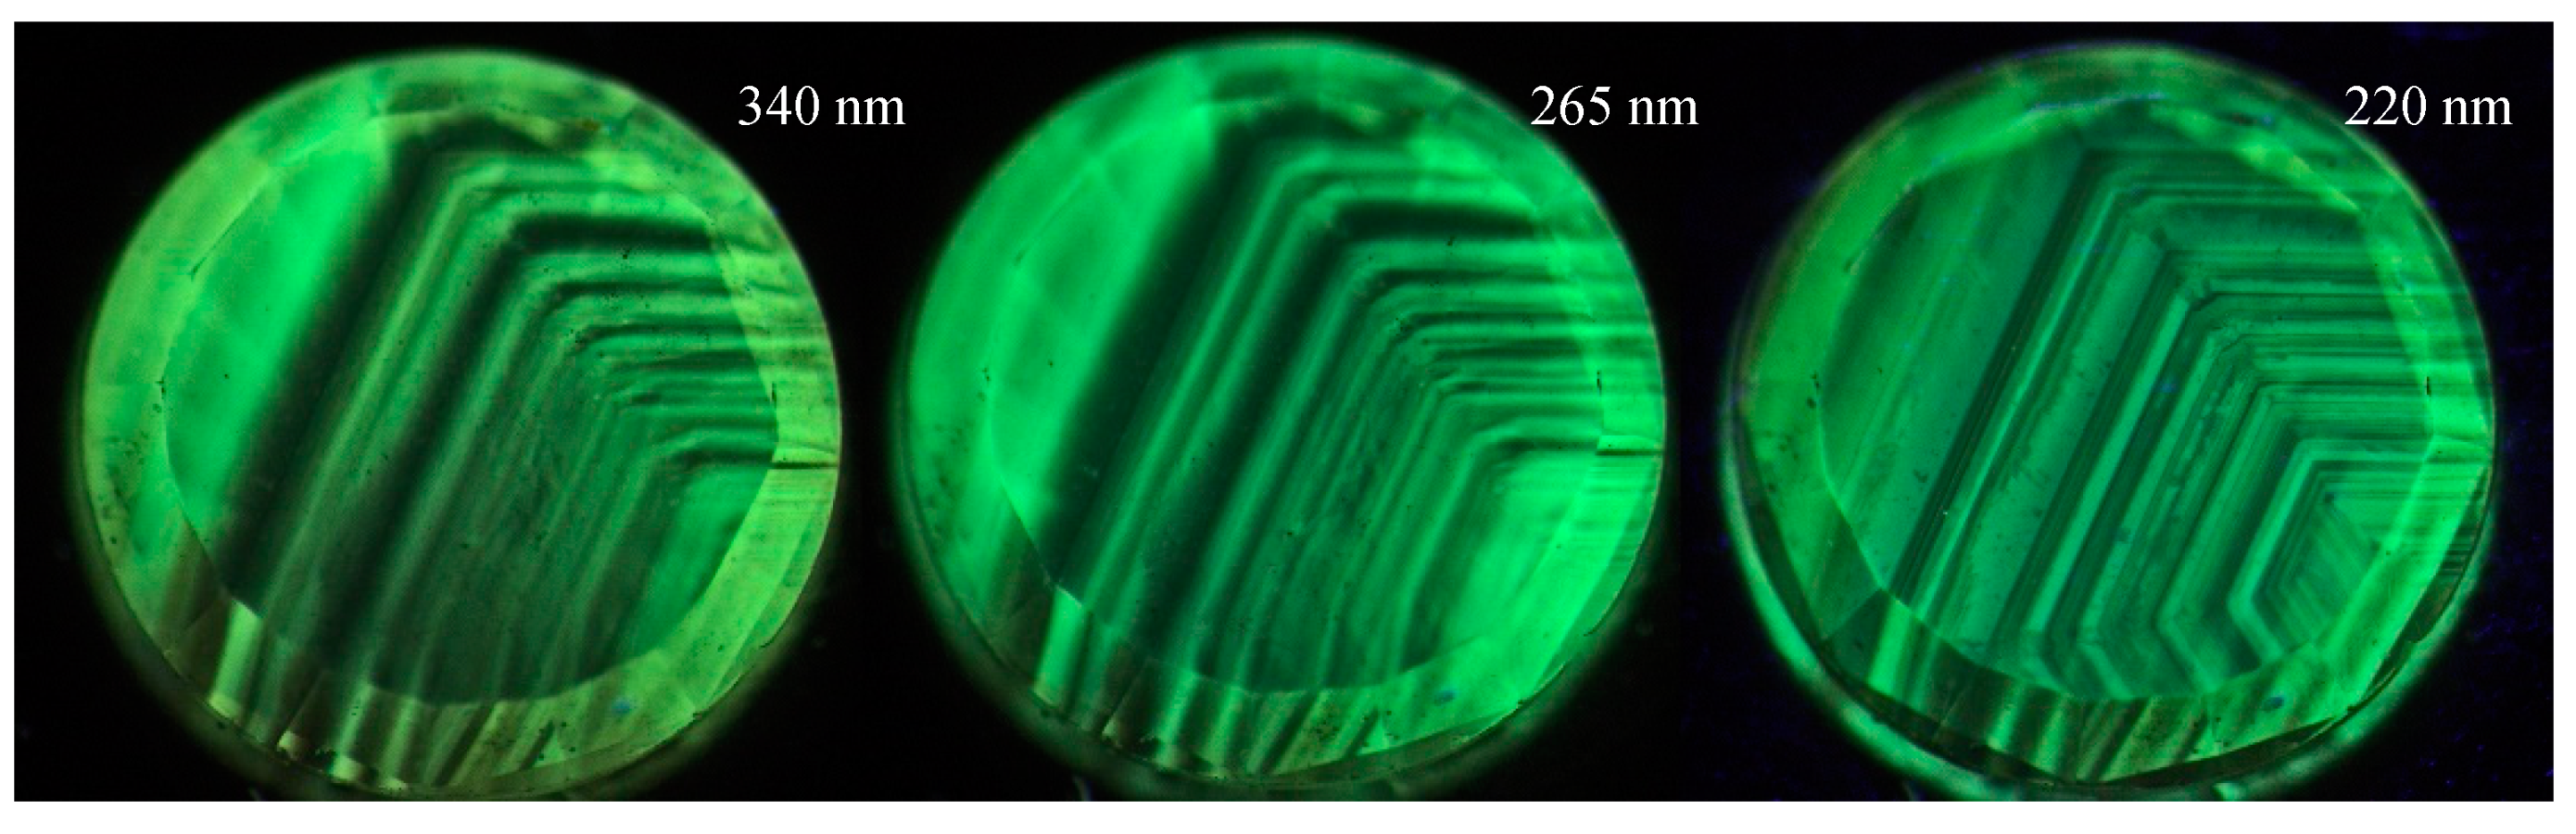
Figure 11.
A brown “Pseudo CO2” diamond (sample SGDF-5864) under three different UV excitations of the DFI system. The yellowish green to green PL is caused mainly by the S2 defect; the PL is much stronger in the colorless sectors than in the colored ones, the darkest brown sectors are practically inert.
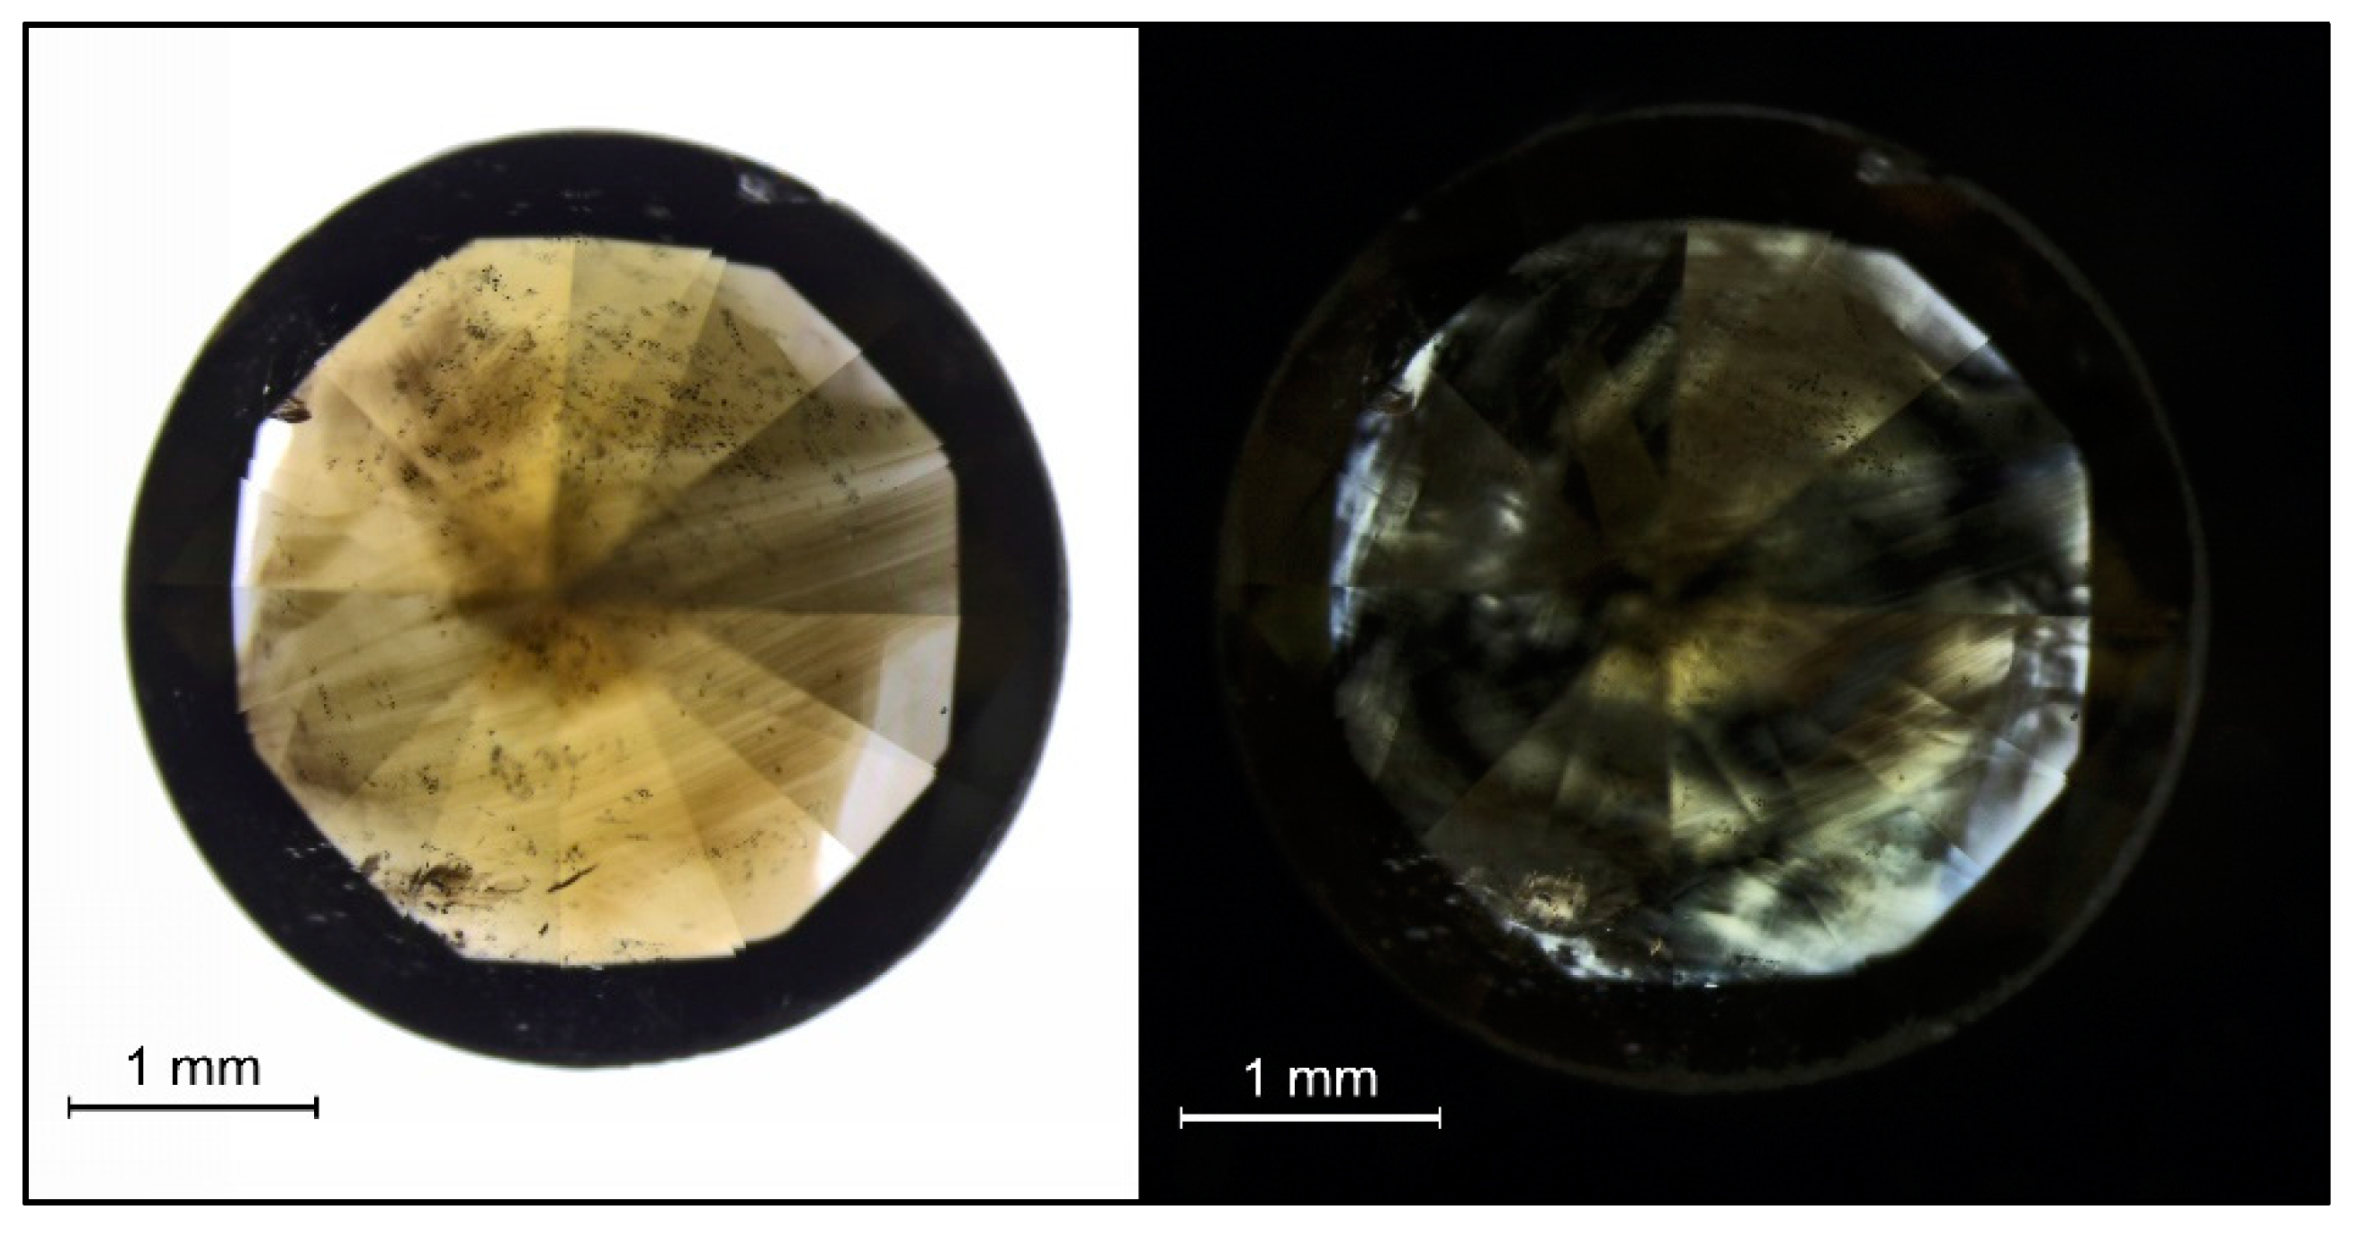
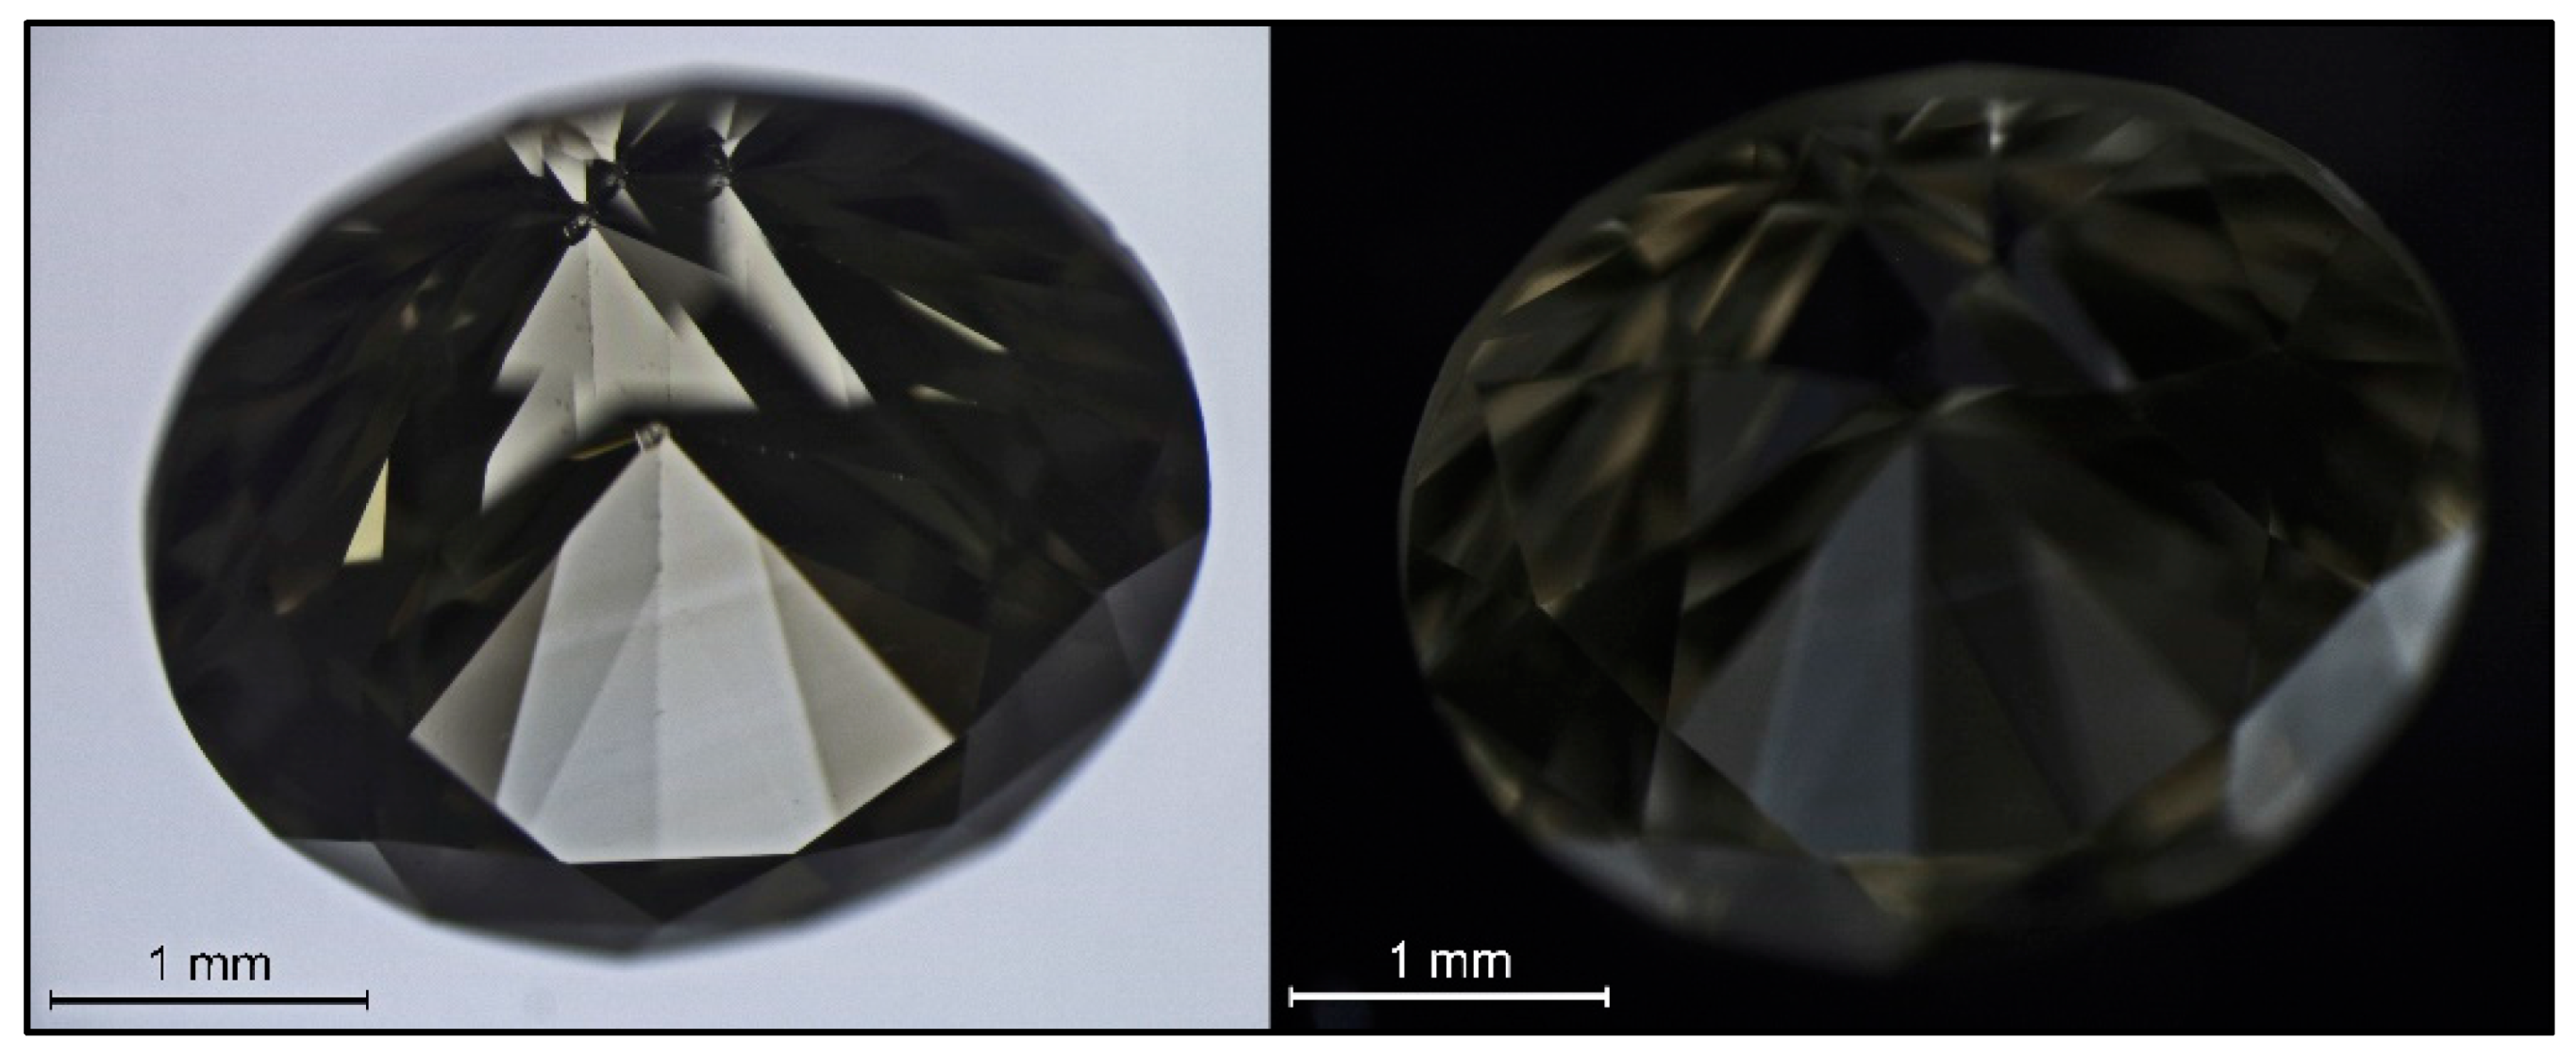
Figure 12.
A hydrogen-rich light yellow-brown diamond (TH 2.618), not colored by deformation-related defects, but by nickel-nitrogen-(hydrogen?)-related defects in immersion (left) and under crossed polarizing filters (right). Very faint parallel color zoning can be seen, the strain in the diamond is virtually undetectable using crossed polarizers.
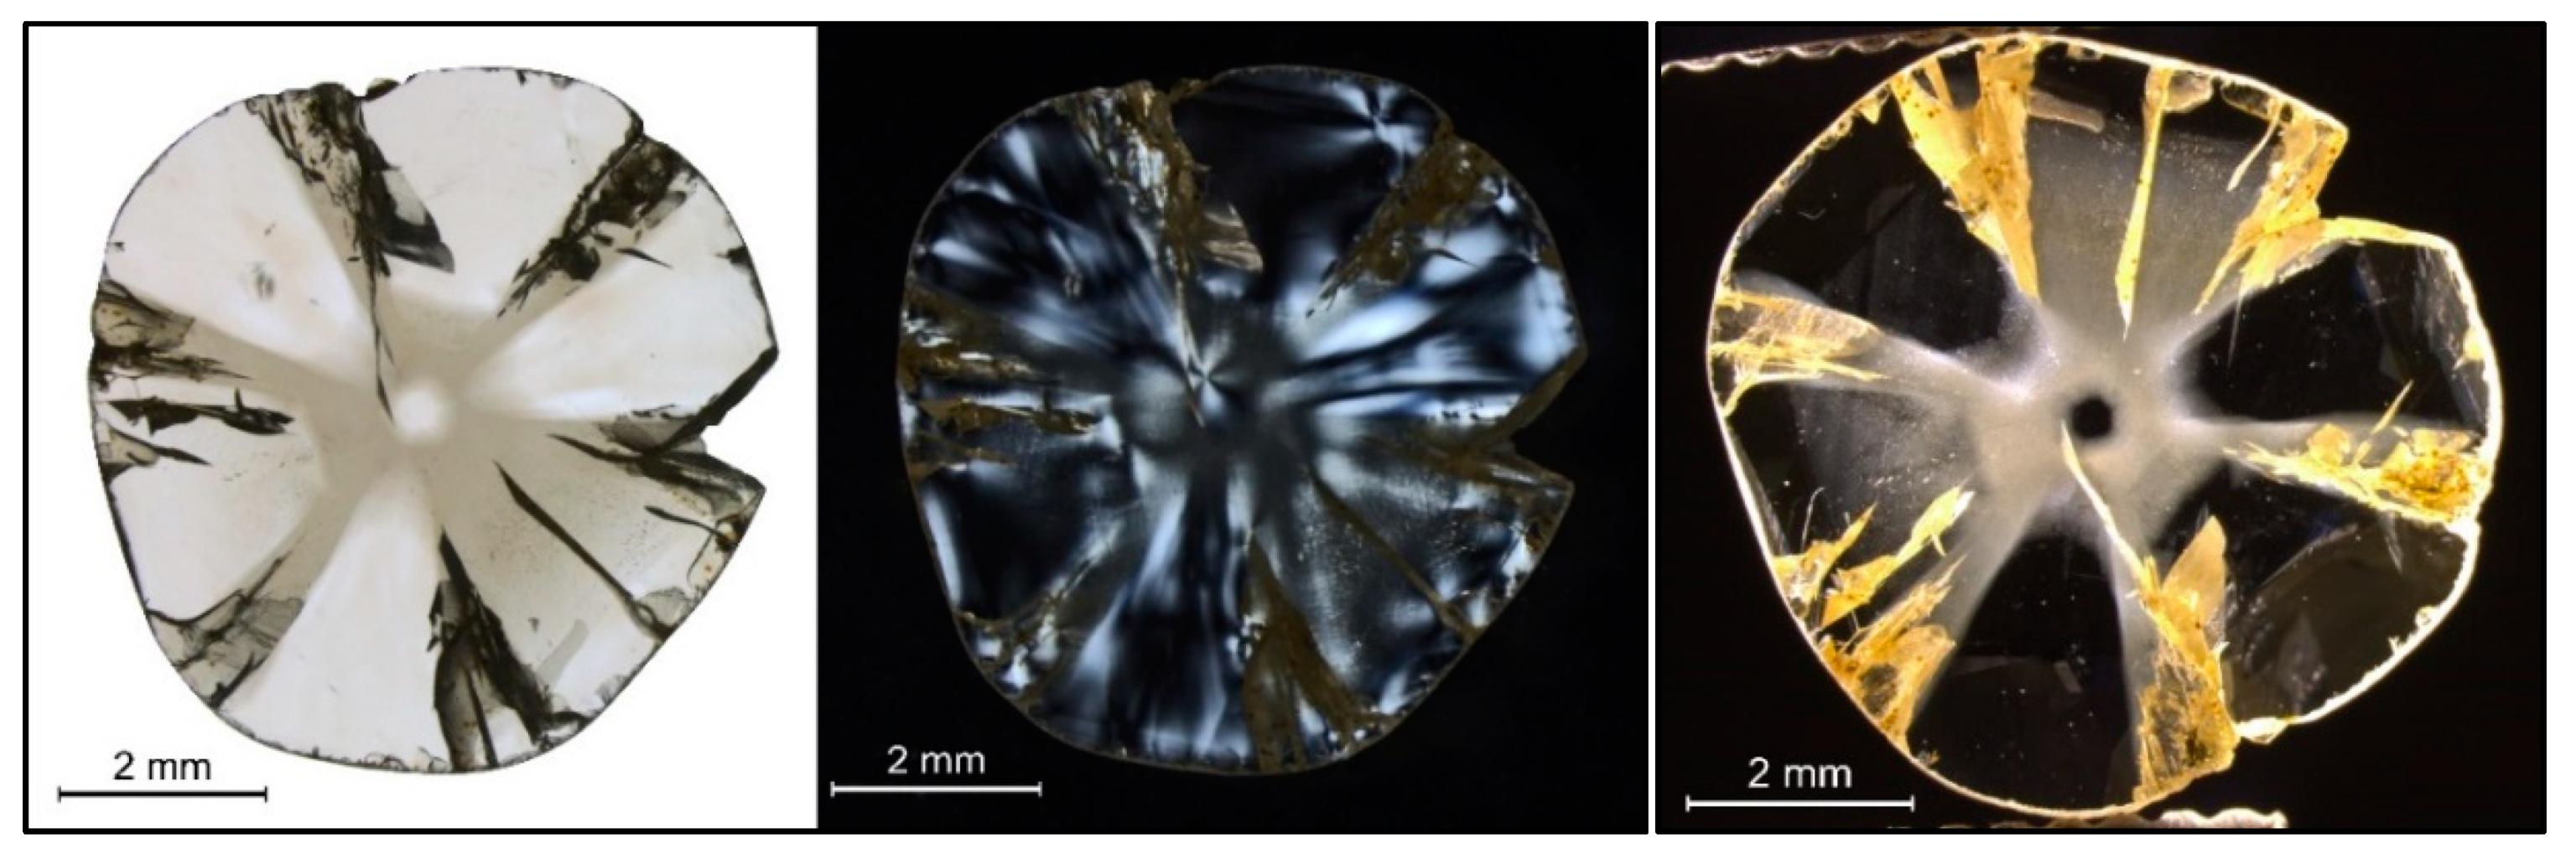
Figure 13.
A mixed cuboid-octahedral growth hydrogen-rich diamond (TH 2.626), not colored by plastic-deformation-related defects. The obvious color zoning of the sample (left) is linked to the growth sectors, with the octahedral sectors being colorless and the cuboid sectors being light brown. The strain of this diamond (center) is clearly caused by the sector growth, hence strain between the brown cuboid and the colorless octahedral sectors. The light brown cuboid sectors are filled with tiny dust-like inclusions (right).
Figure 14.
A mixed cuboid-octahedral growth hydrogen-rich type Ib > IbXY >> IaA diamond (TH 2.49), not colored by plastic-deformation-related defects. The obvious cuboid color zoning in the core of the sample (left) is apparent, and under crossed polarizing filters (right) cross-shaped extinction can be seen which is linked to strain induced caused by the mix of cuboid and octahedral growth.
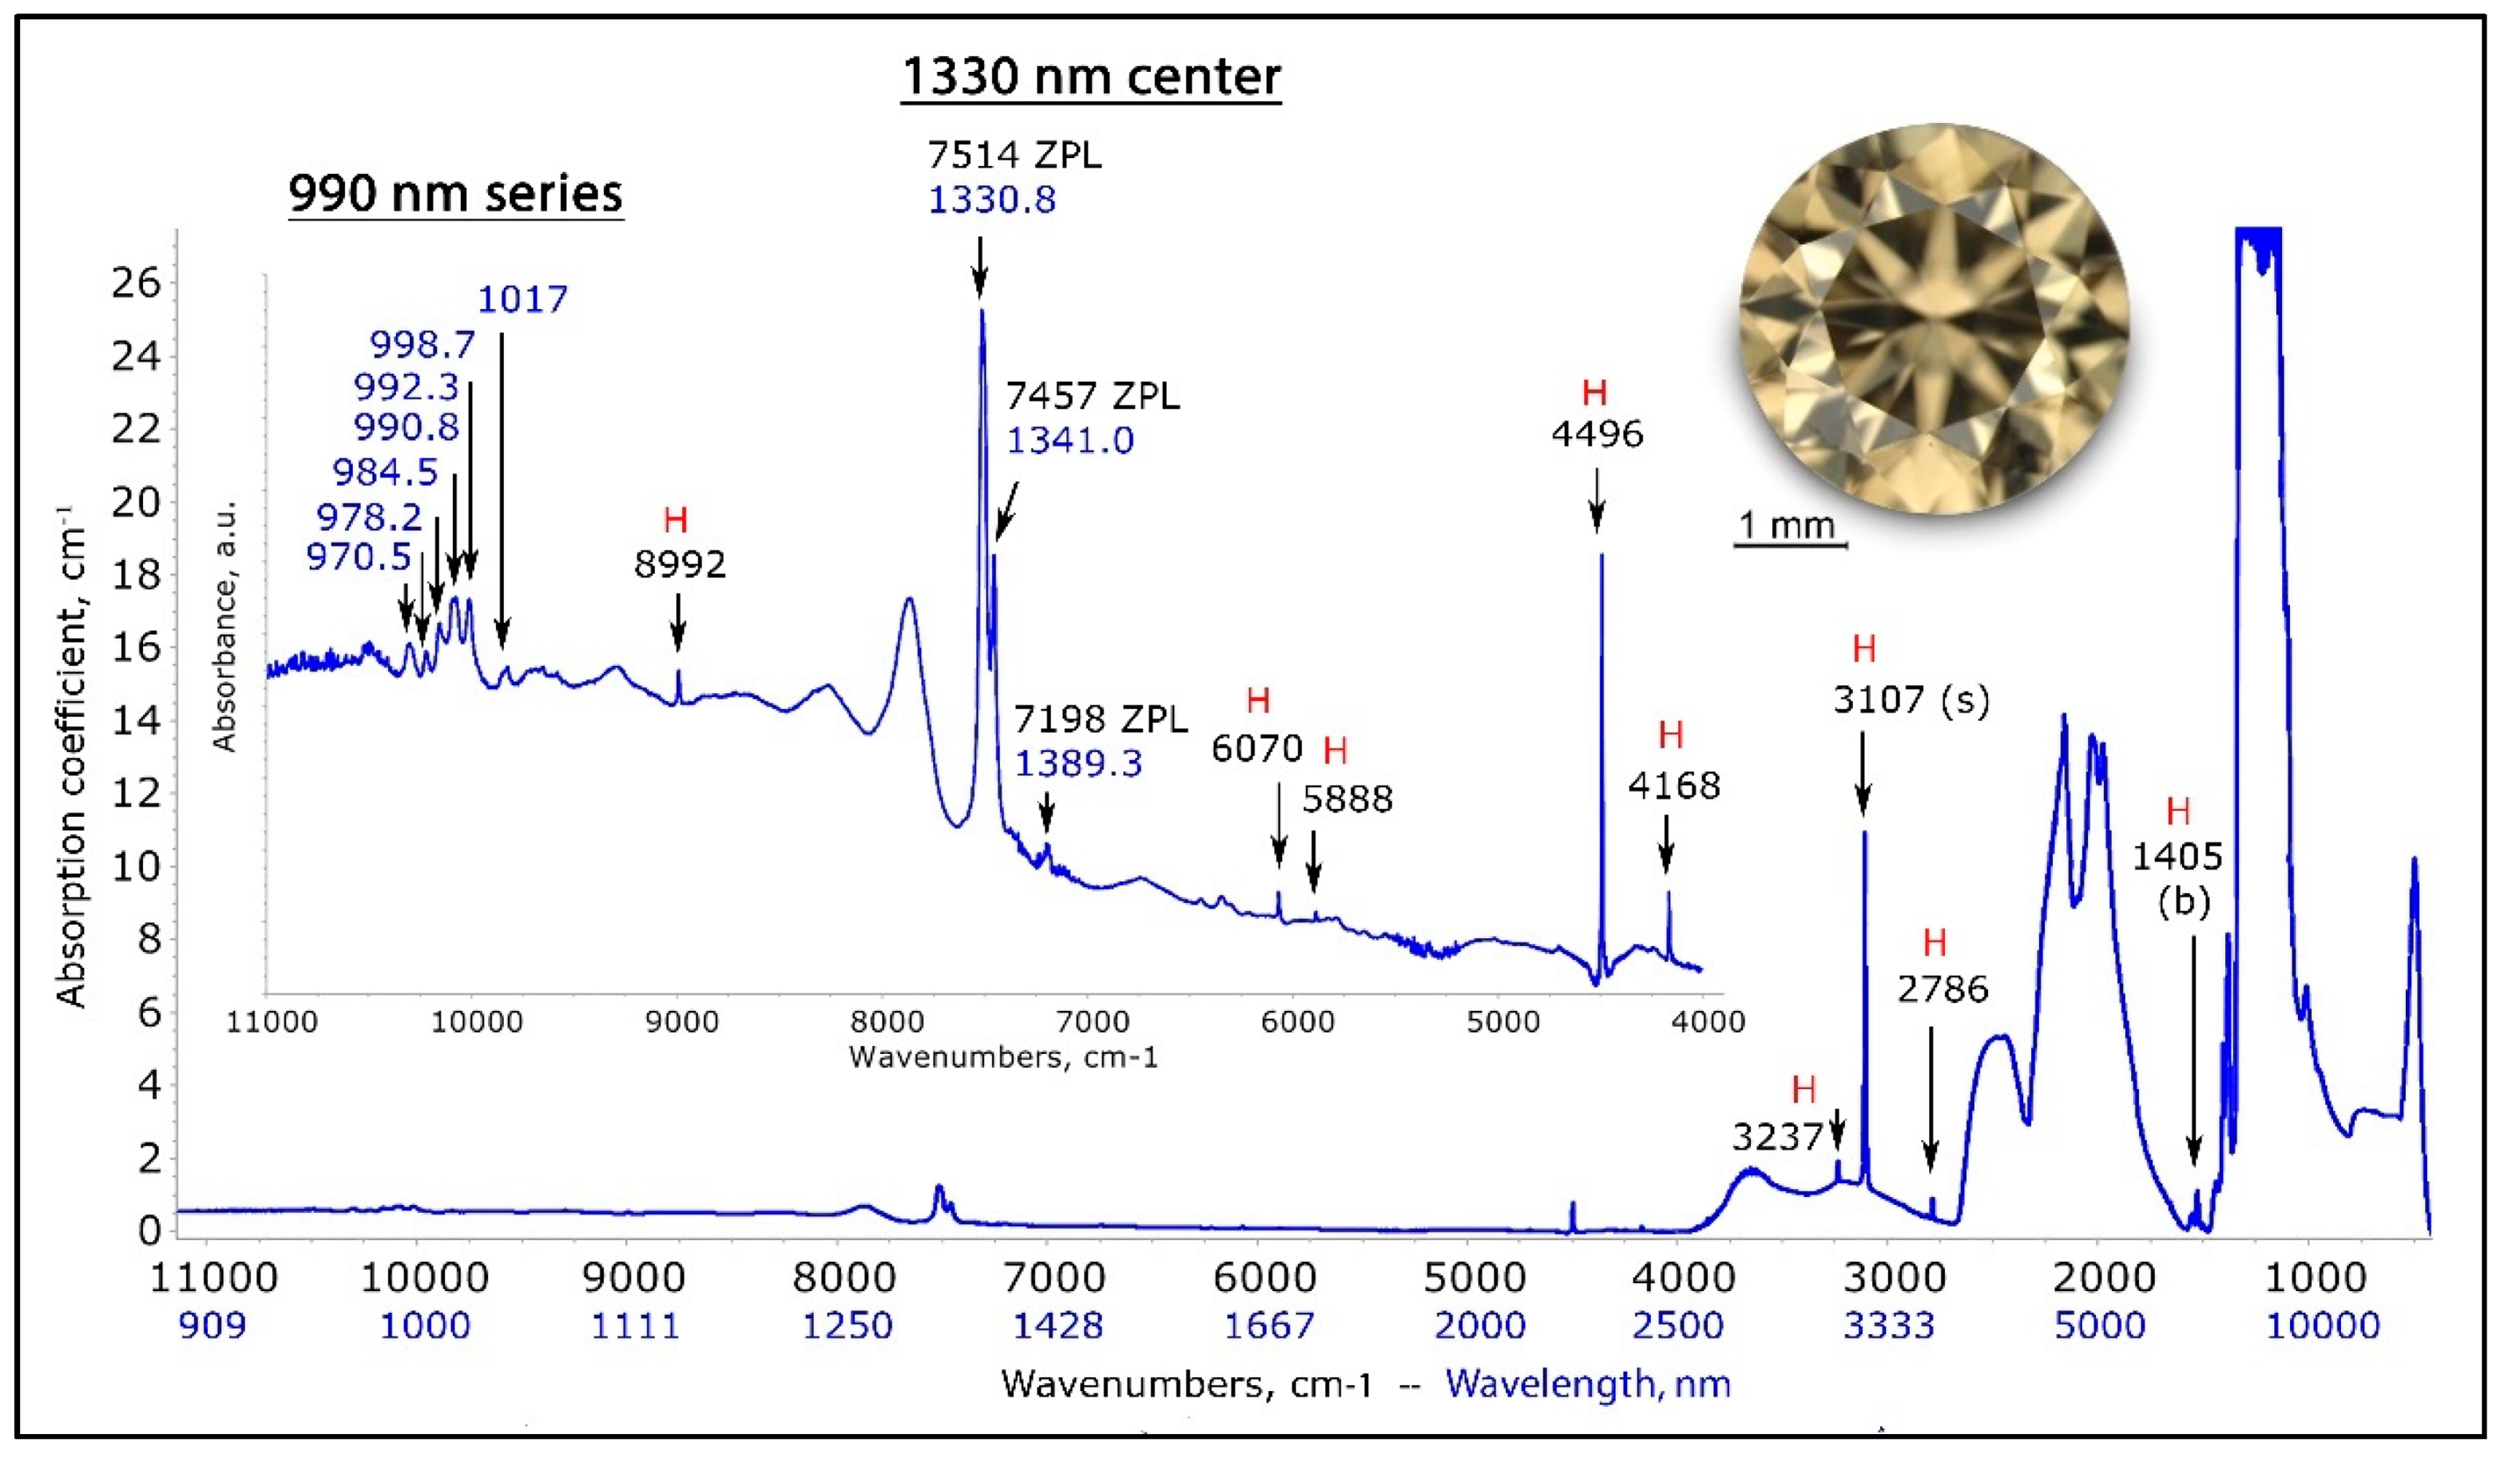
Figure 15.
The normalized near to mid-infrared spectrum (range 900 to 25,000 nm) of a NDR hydrogen- and nitrogen-rich type IaA >> B diamond (TH 2.618) exhibits the typical hydrogen-related sharp absorption (indicated with a red “H”), plus a very distinct 1330 nm center and the domain from 4000 to 11,200 cm−1 was recorded with the diamond at 77 K.
Figure 16.
The normalized IR spectra of the brown (trace a) and the colorless (trace b) sectors of a NDR mixed growth hydrogen- and nitrogen-rich type IaA>>B diamond (TH 2.626). While the spectrum of the colorless sector shows only comparatively weak H related peaks at the classical positions 3107/1405 cm−1 and 3238 cm−1, the H- related features in the brown sectors are significantly more complex and the 3107/1405 and 3238 cm−1 lines are distinctly stronger; the 3107 cm−1 line is 5 times stronger in the brown than in the colorless sector. The NIR peaks recorded for the other hydrogen-rich diamond were very weak in the spectrum of this sample and undetectable at RT. The spectra have been shifted vertically for clarity.
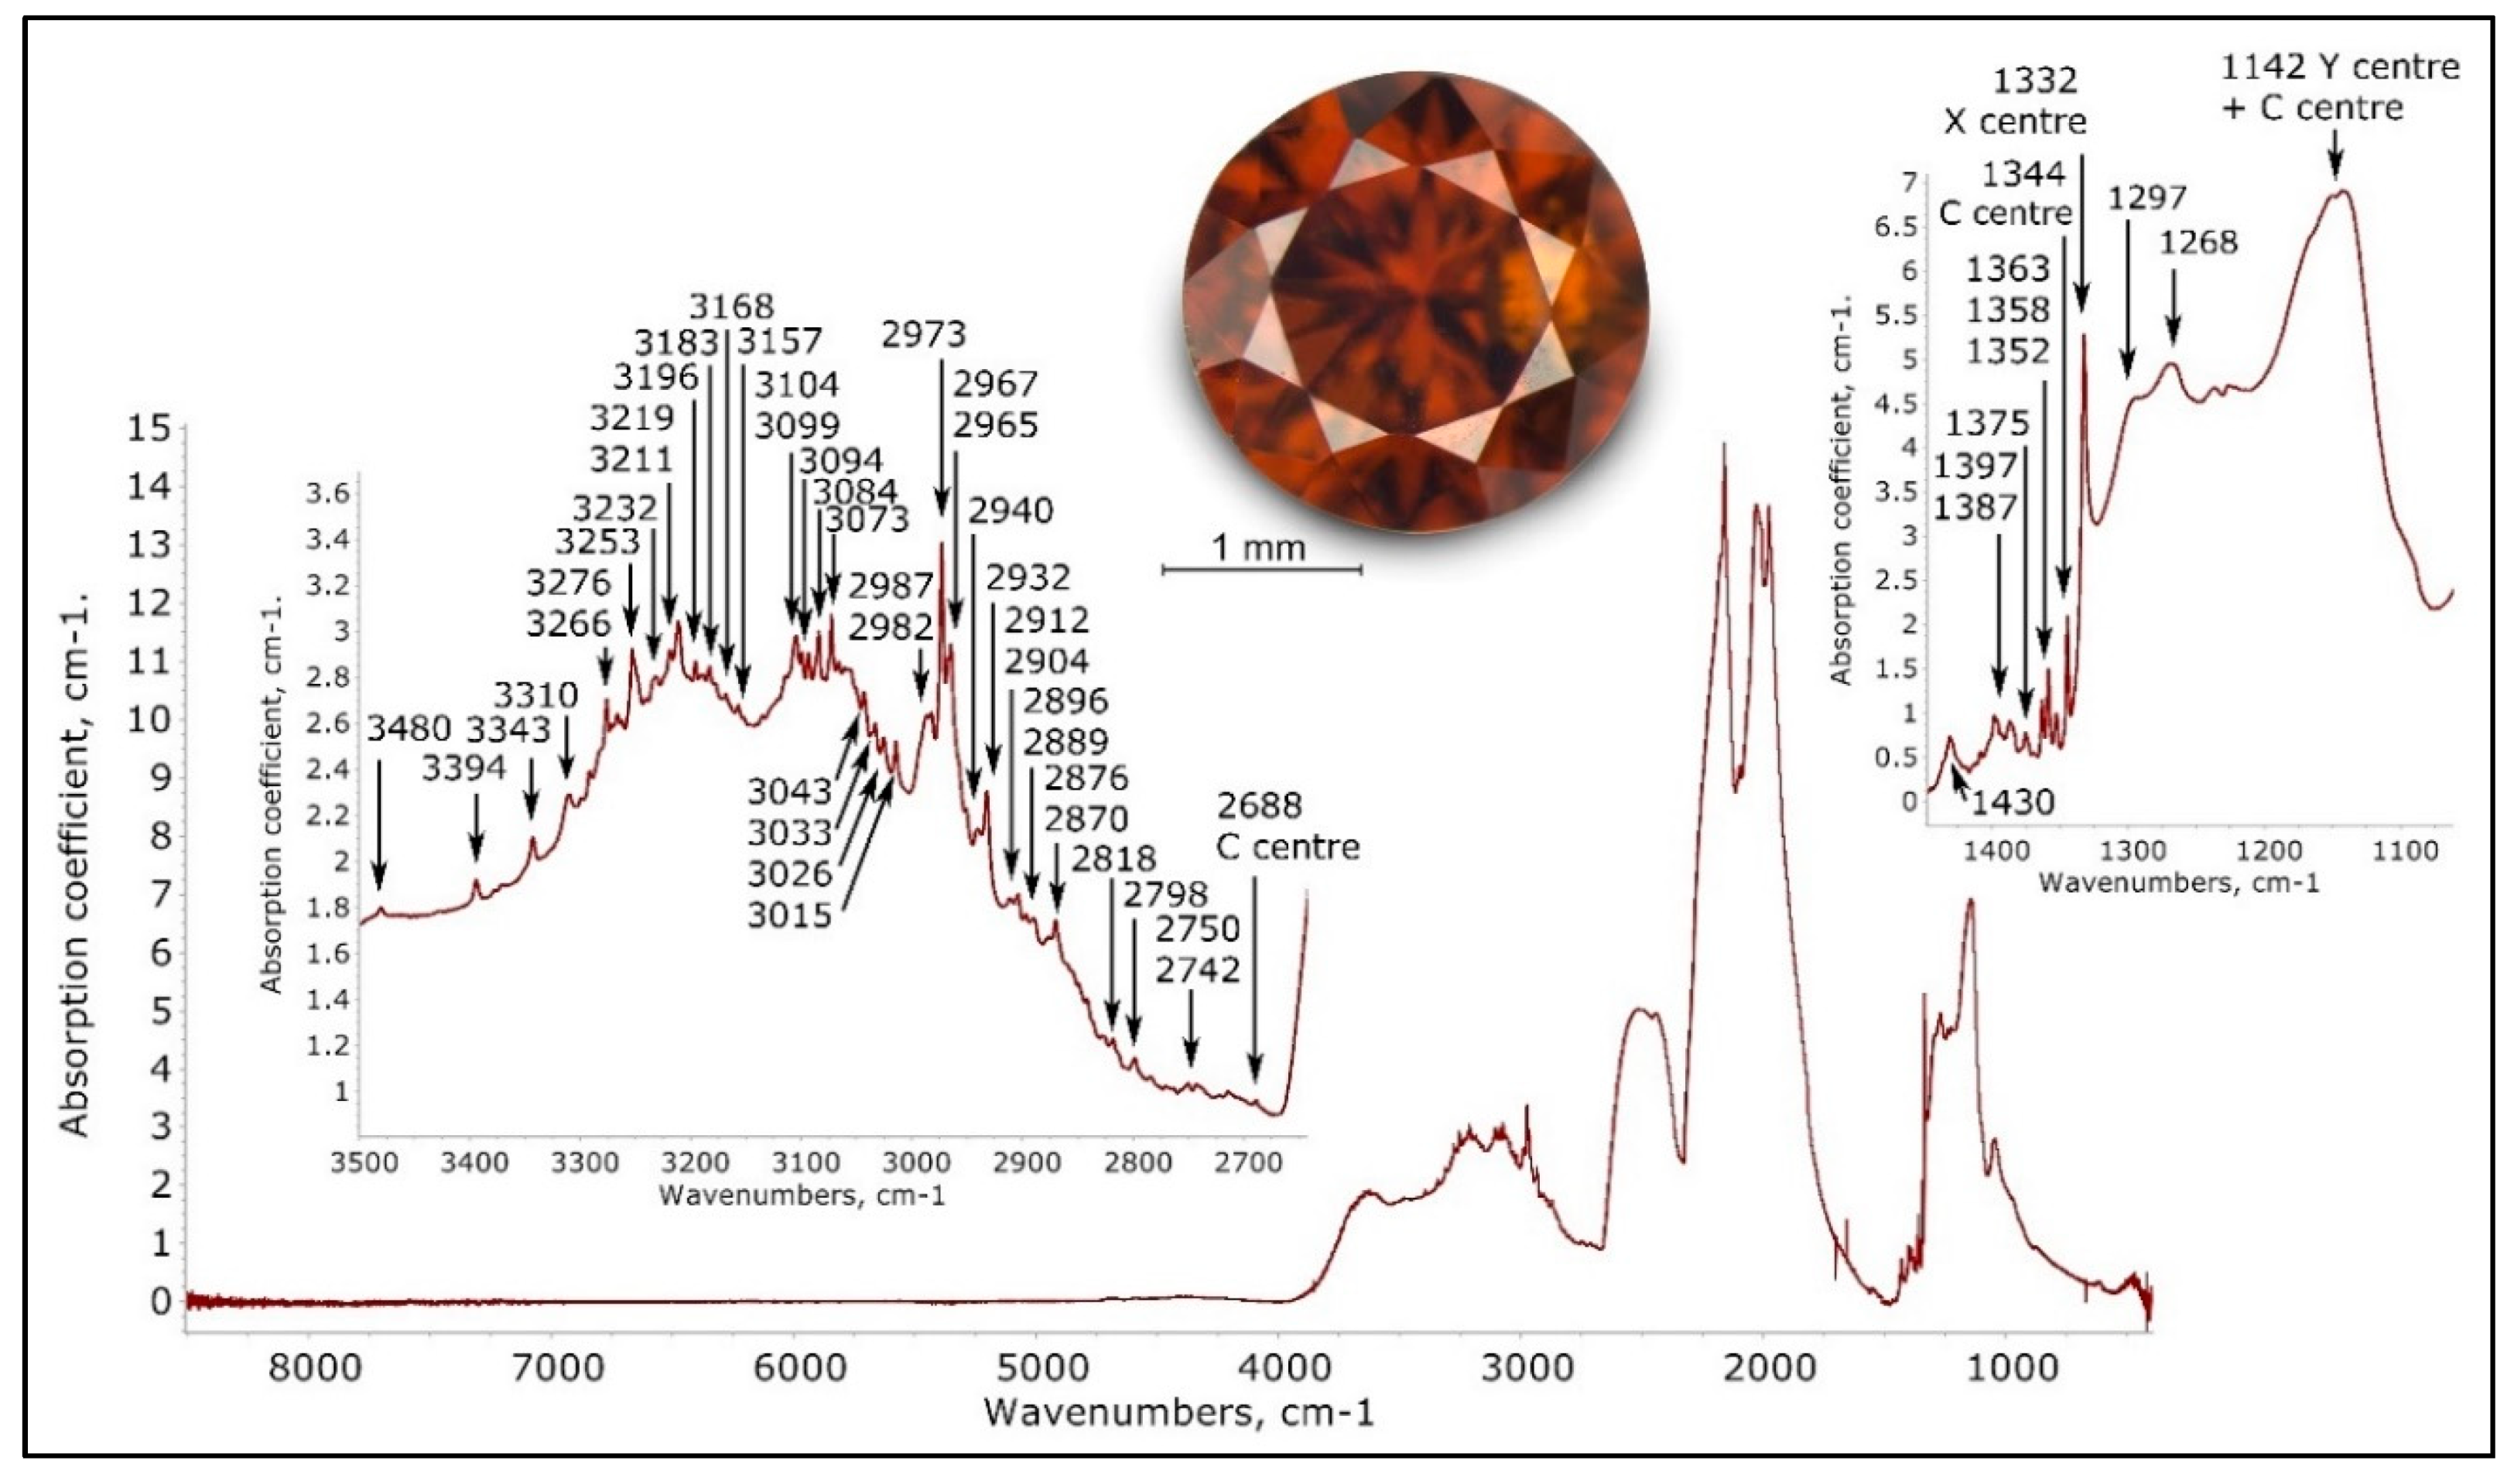
Figure 17.
The normalized infrared spectrum of a NDR hydrogen-rich orange brown type IbXY diamond (TH 2.327)—recorded at 1 cm−1—exhibited a complex band with numerous hydrogen-related sharp absorption only known in type Ib diamonds with dominant X and Y center absorption. The 1142 cm−1 absorption is the result of the overlaid 1130 cm−1 C center absorption and the 1145 cm−1 Y center absorption.
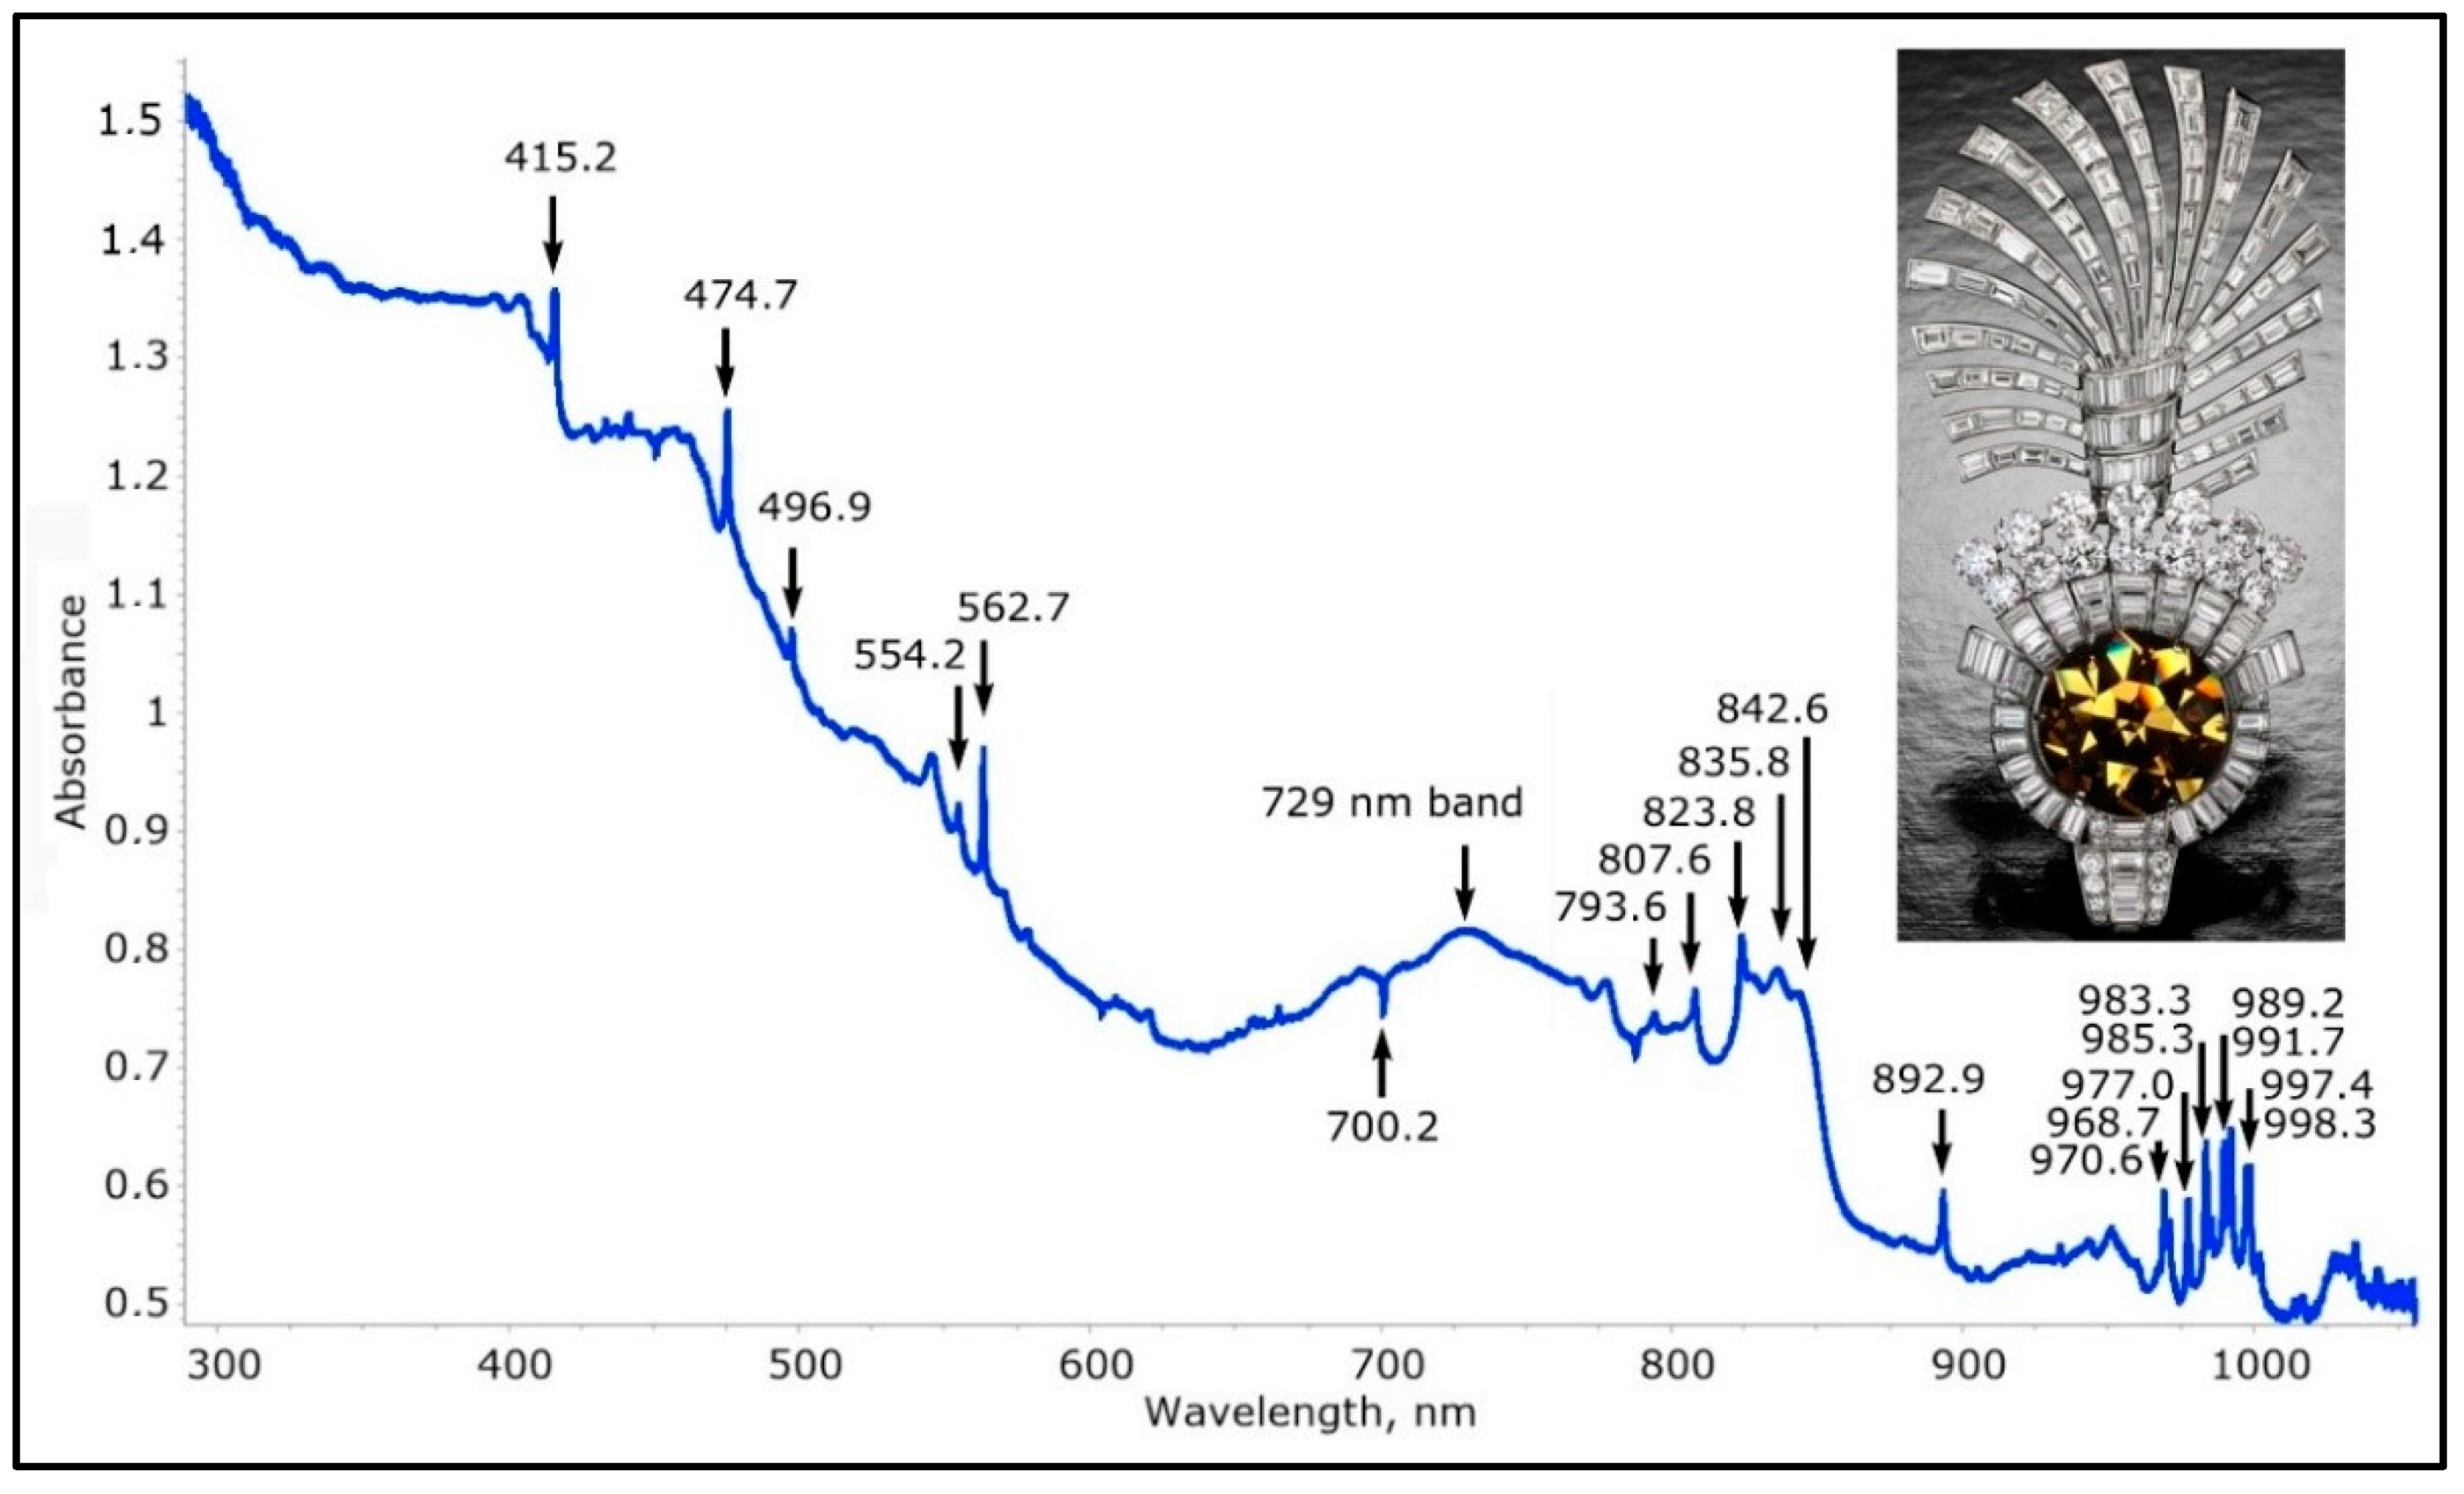
Figure 18.
The low temperature UV-Vis-NIR spectrum of the most famous and biggest hydrogen-rich brown yellow diamond that is colored by NDR defects—the Tiger’s Eye diamond, 61.56 cts. The highly complex spectrum is characteristic for these diamonds, and is always the continuation of the very distinct triplet ZPL at 1330.8/1332.0/1341.0 nm (7514/7507/7457 cm−1); this intense ZPL—which is the strongest vibronic absorption feature in the entire NIR, Vis and UV range, is also present in the NIR spectrum of the Tiger’s Eye diamond. The majority of the features of these spectra are likely related to nickel-nitrogen defects, possibly with the incorporation of hydrogen.
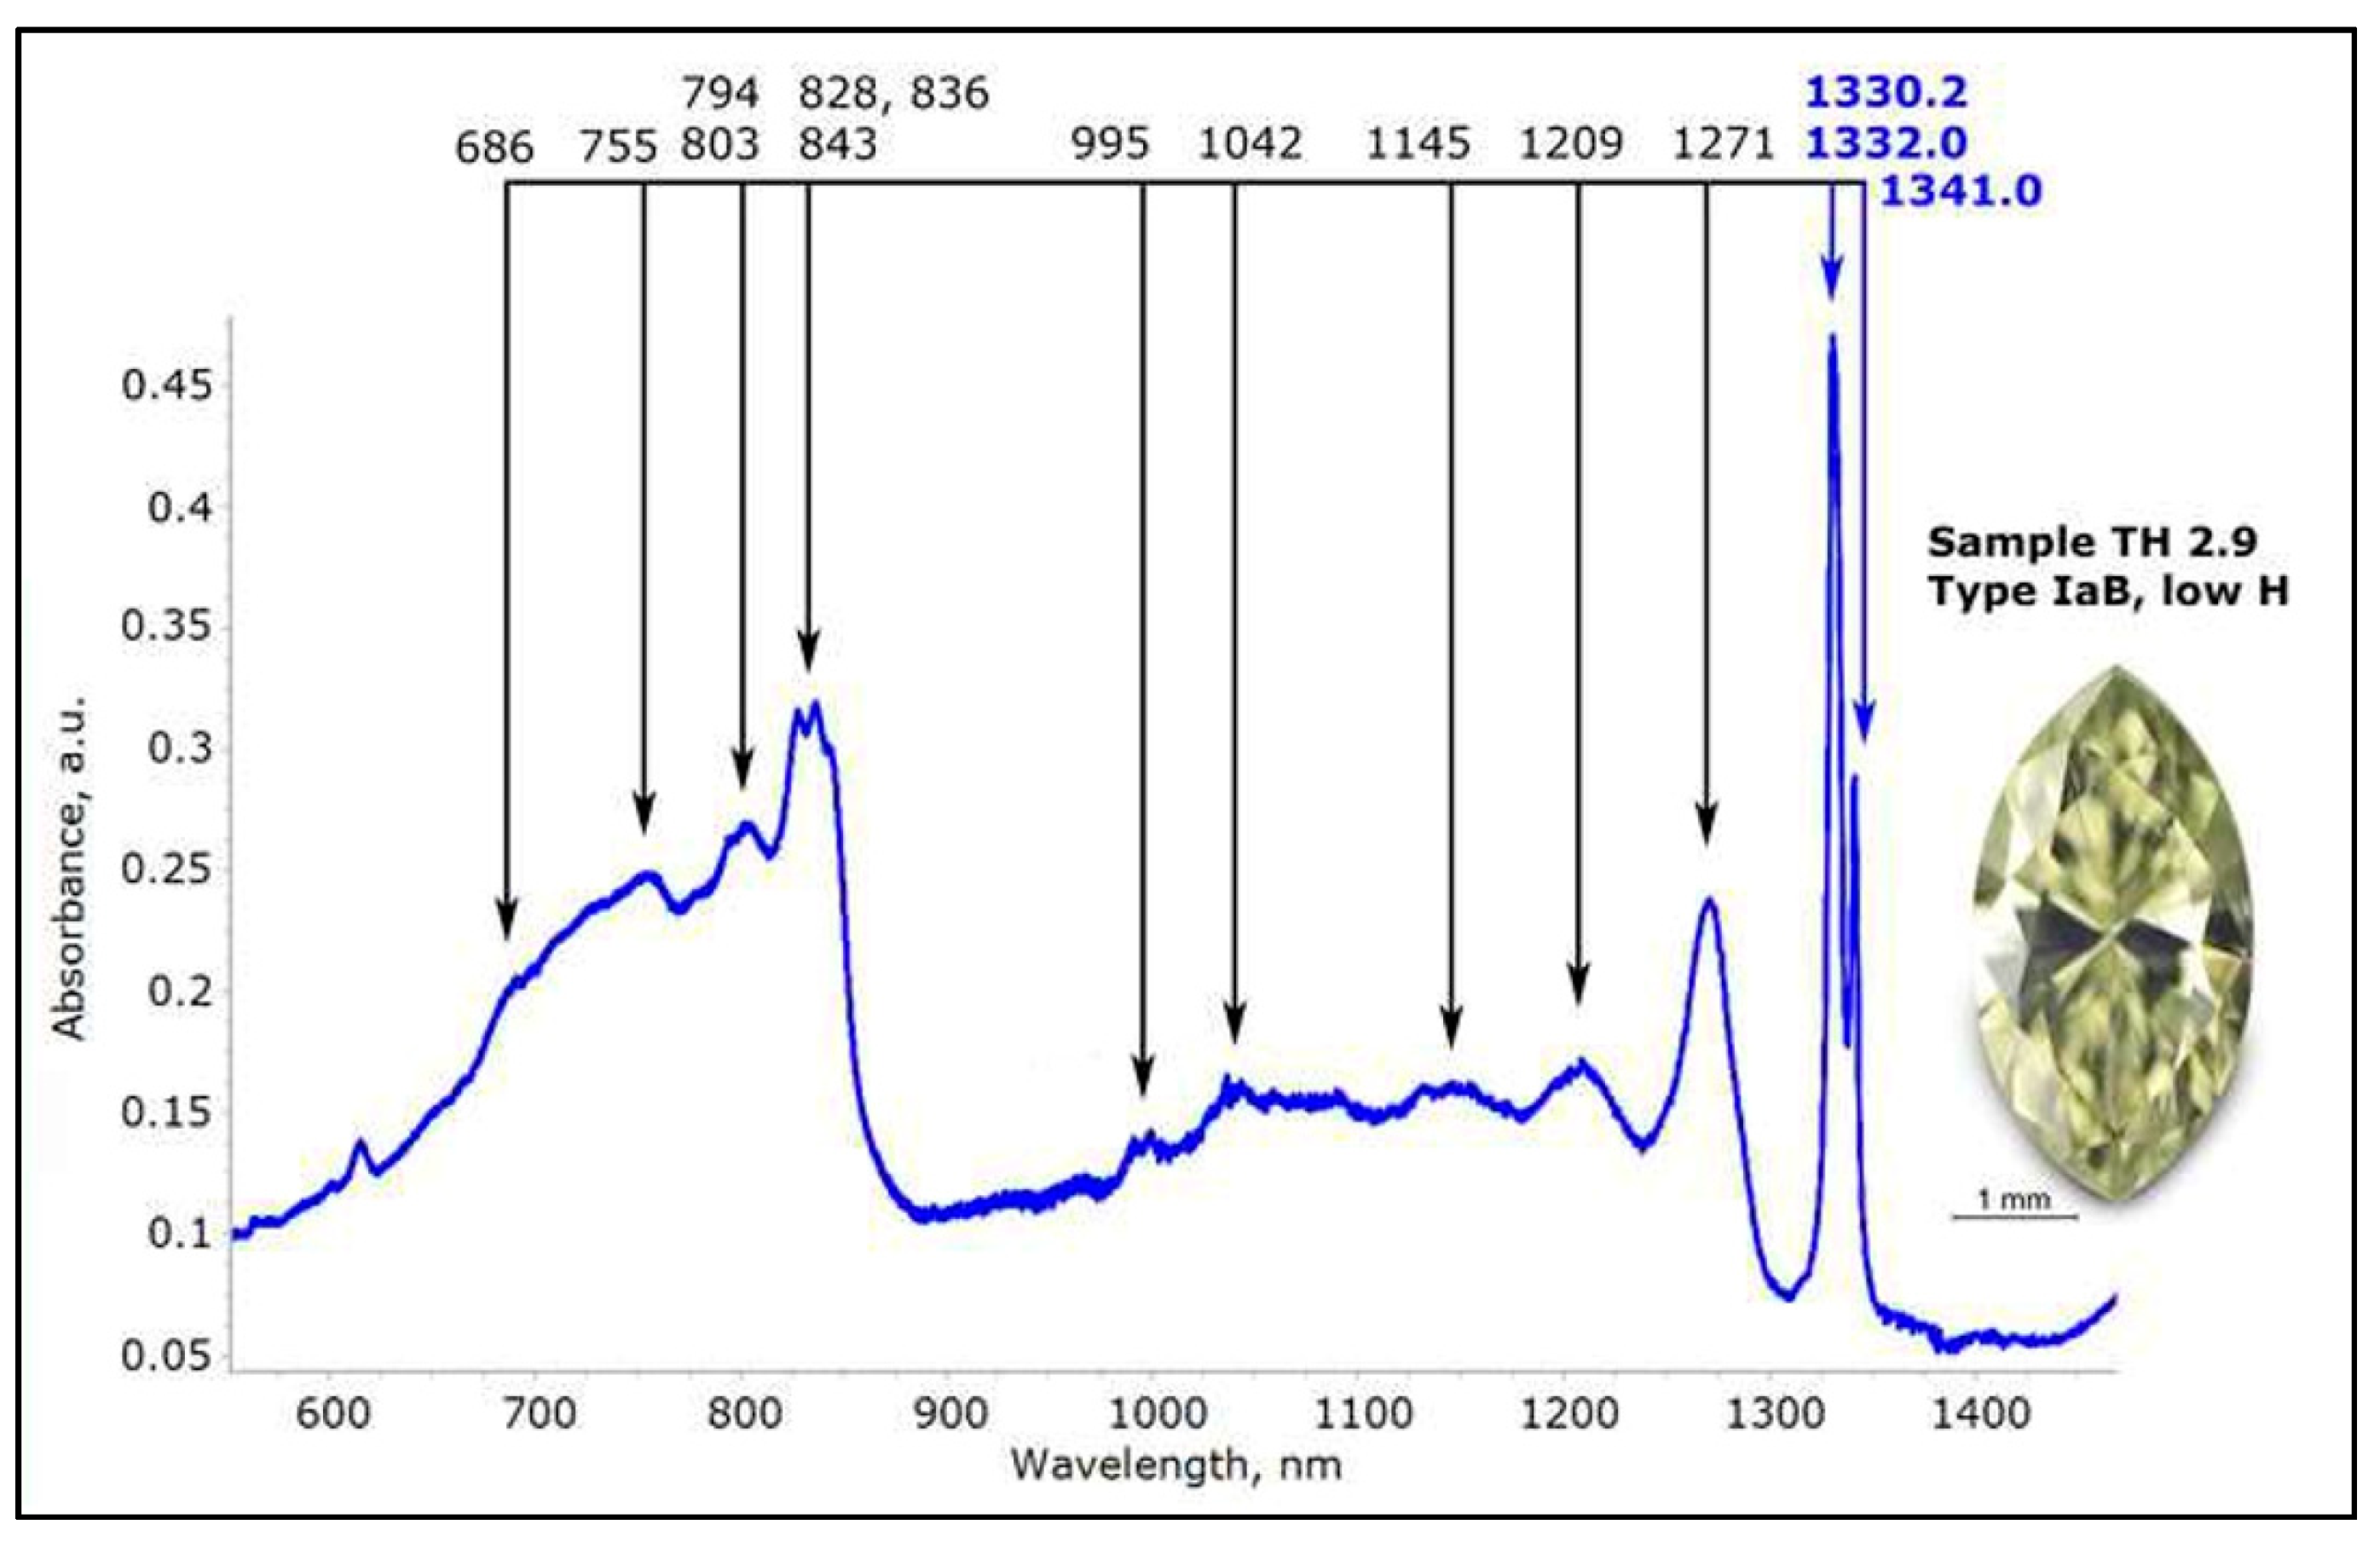
Figure 19.
The extended low temperature UV-Vis-NIR spectrum of sample TH 2.9, an almost hydrogen deficient 1330 nm center diamond; the practical absence of hydrogen in the spectra of this diamond demonstrate that the 1330 nm center has no link to hydrogen. The structure seen from 820 to 550 nm is proposed to be an electronic transition to a higher excited state of the defect.
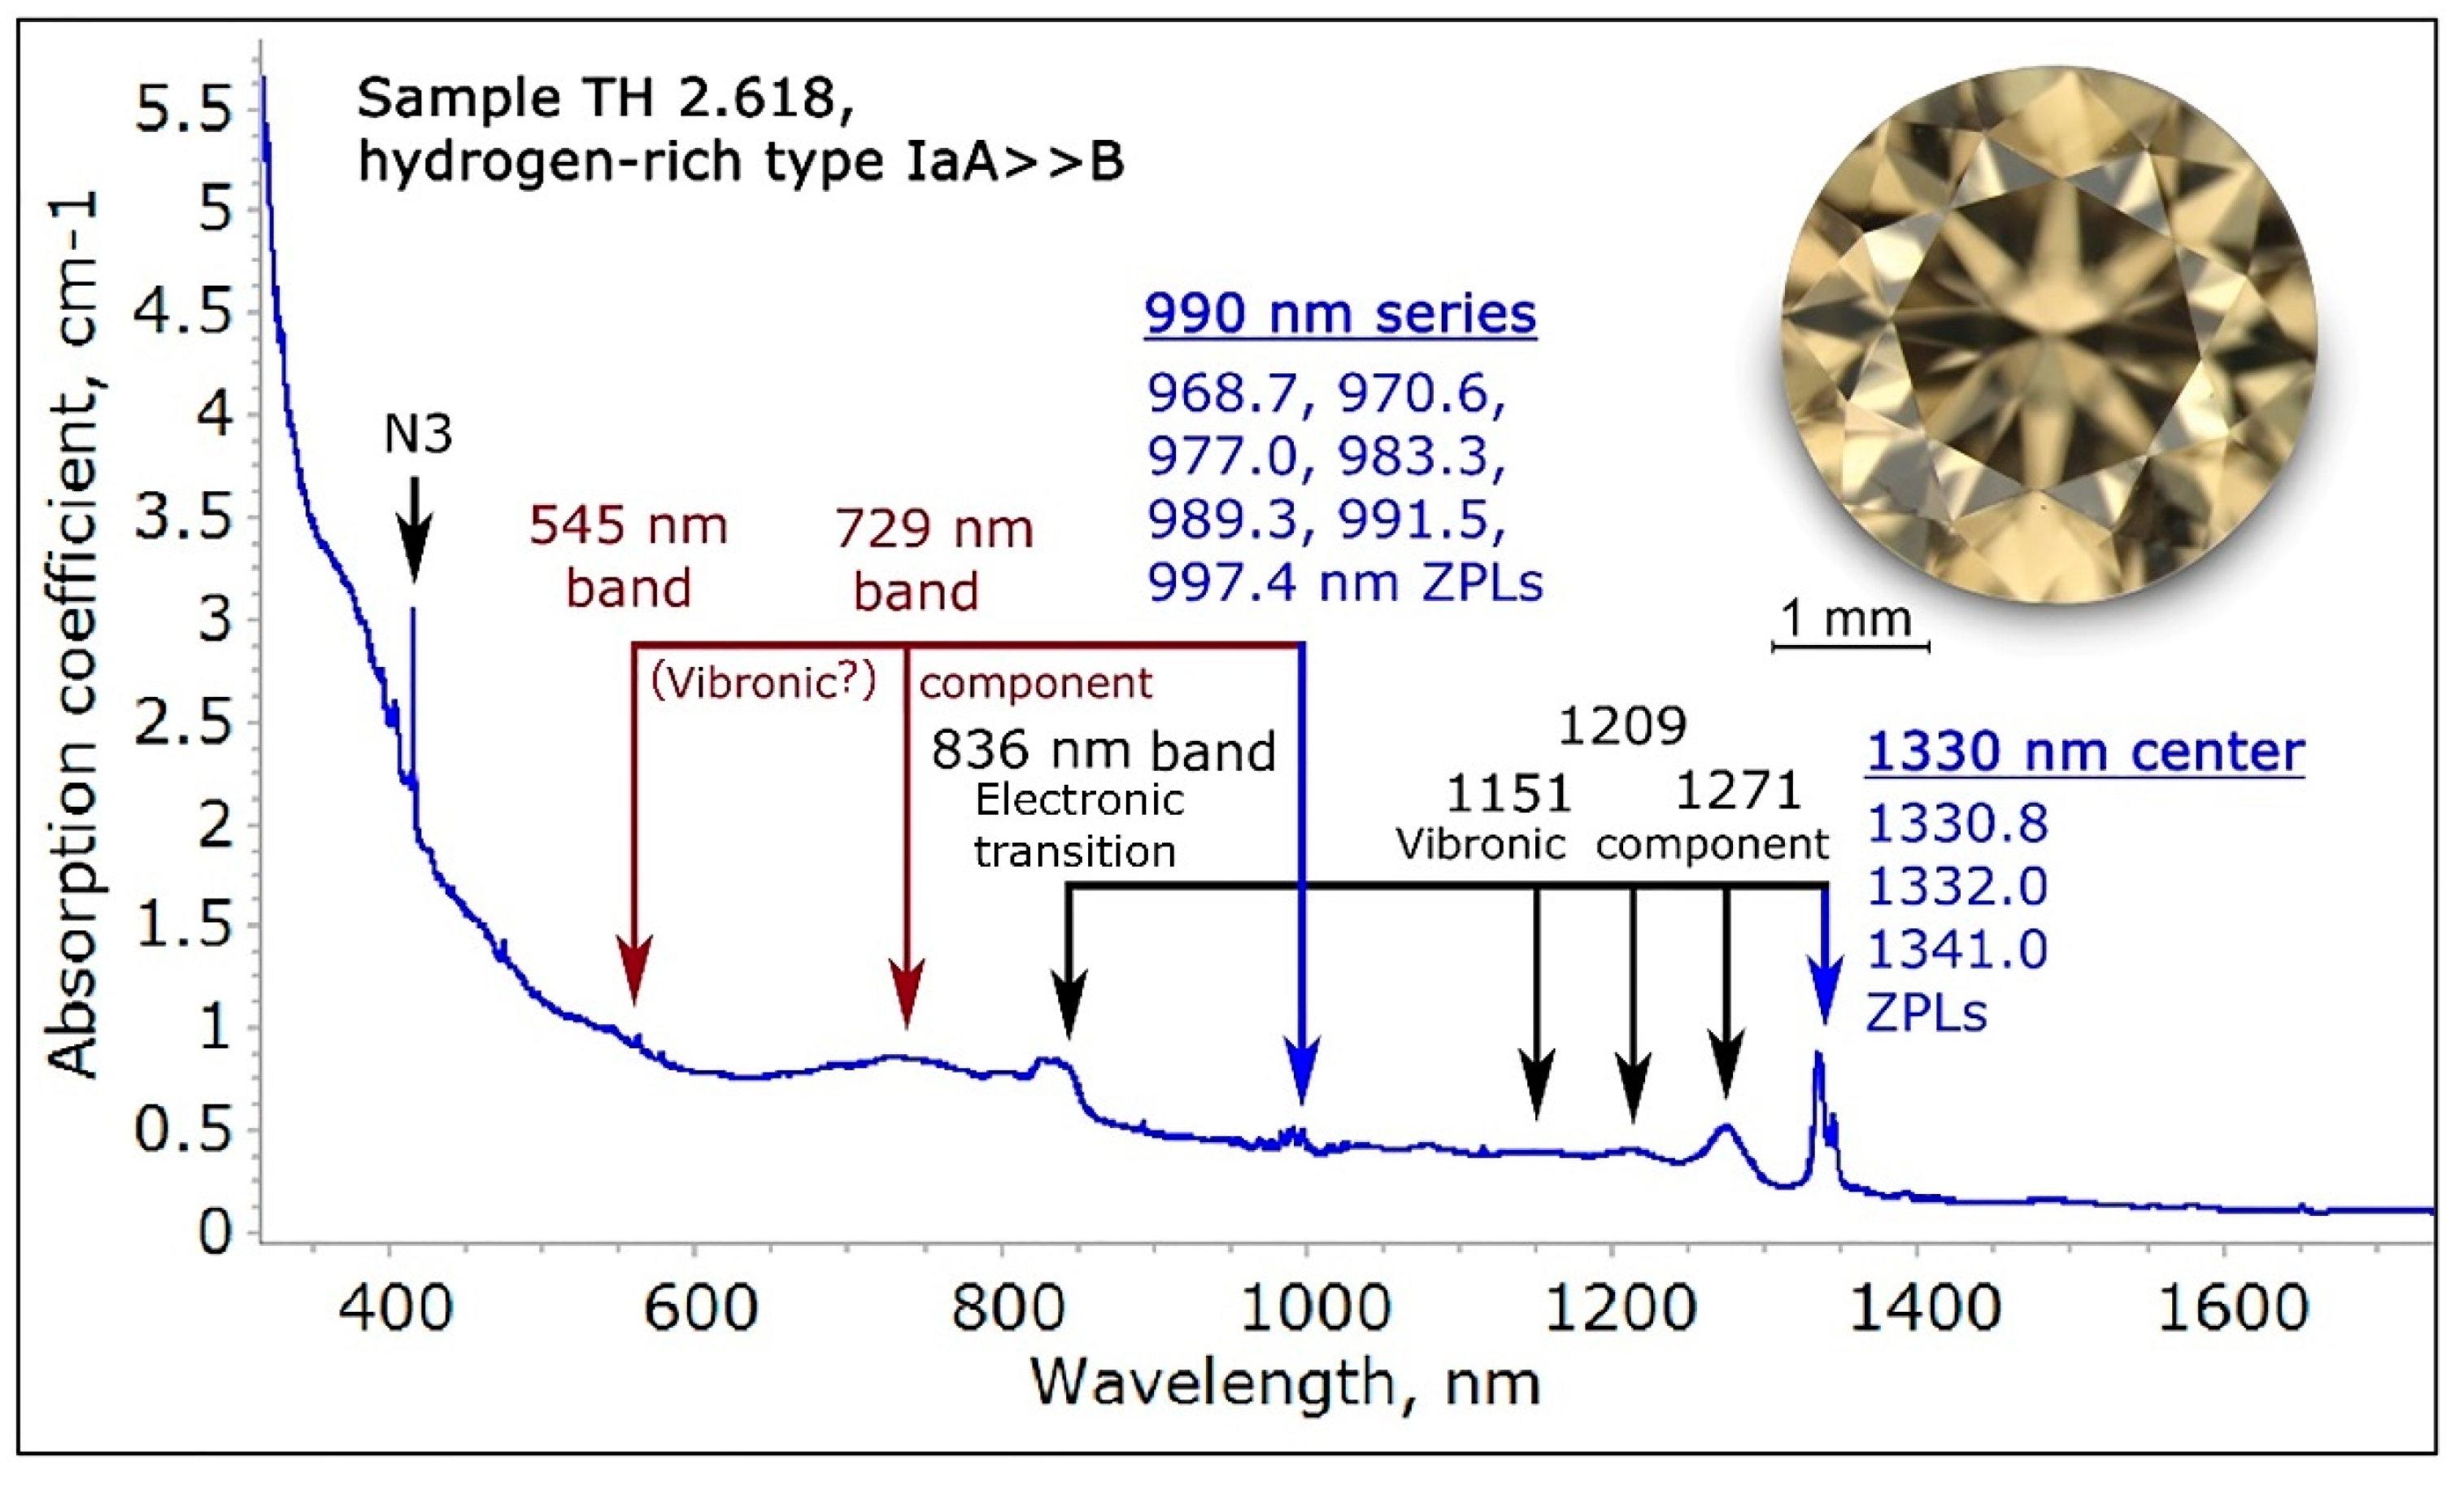
Figure 20.
The extended low temperature UV-Vis-NIR spectrum covering the range to 1700 nm of a type Ia hydrogen-rich yellowish brown diamond. The figure shows the correlation between the complex absorptions in the 500 to 850 nm range with the 1330 nm center and the 990 nm series. The complex broad bands are proposed to relate to these two spectral features, and some represent vibronic components of these centers.
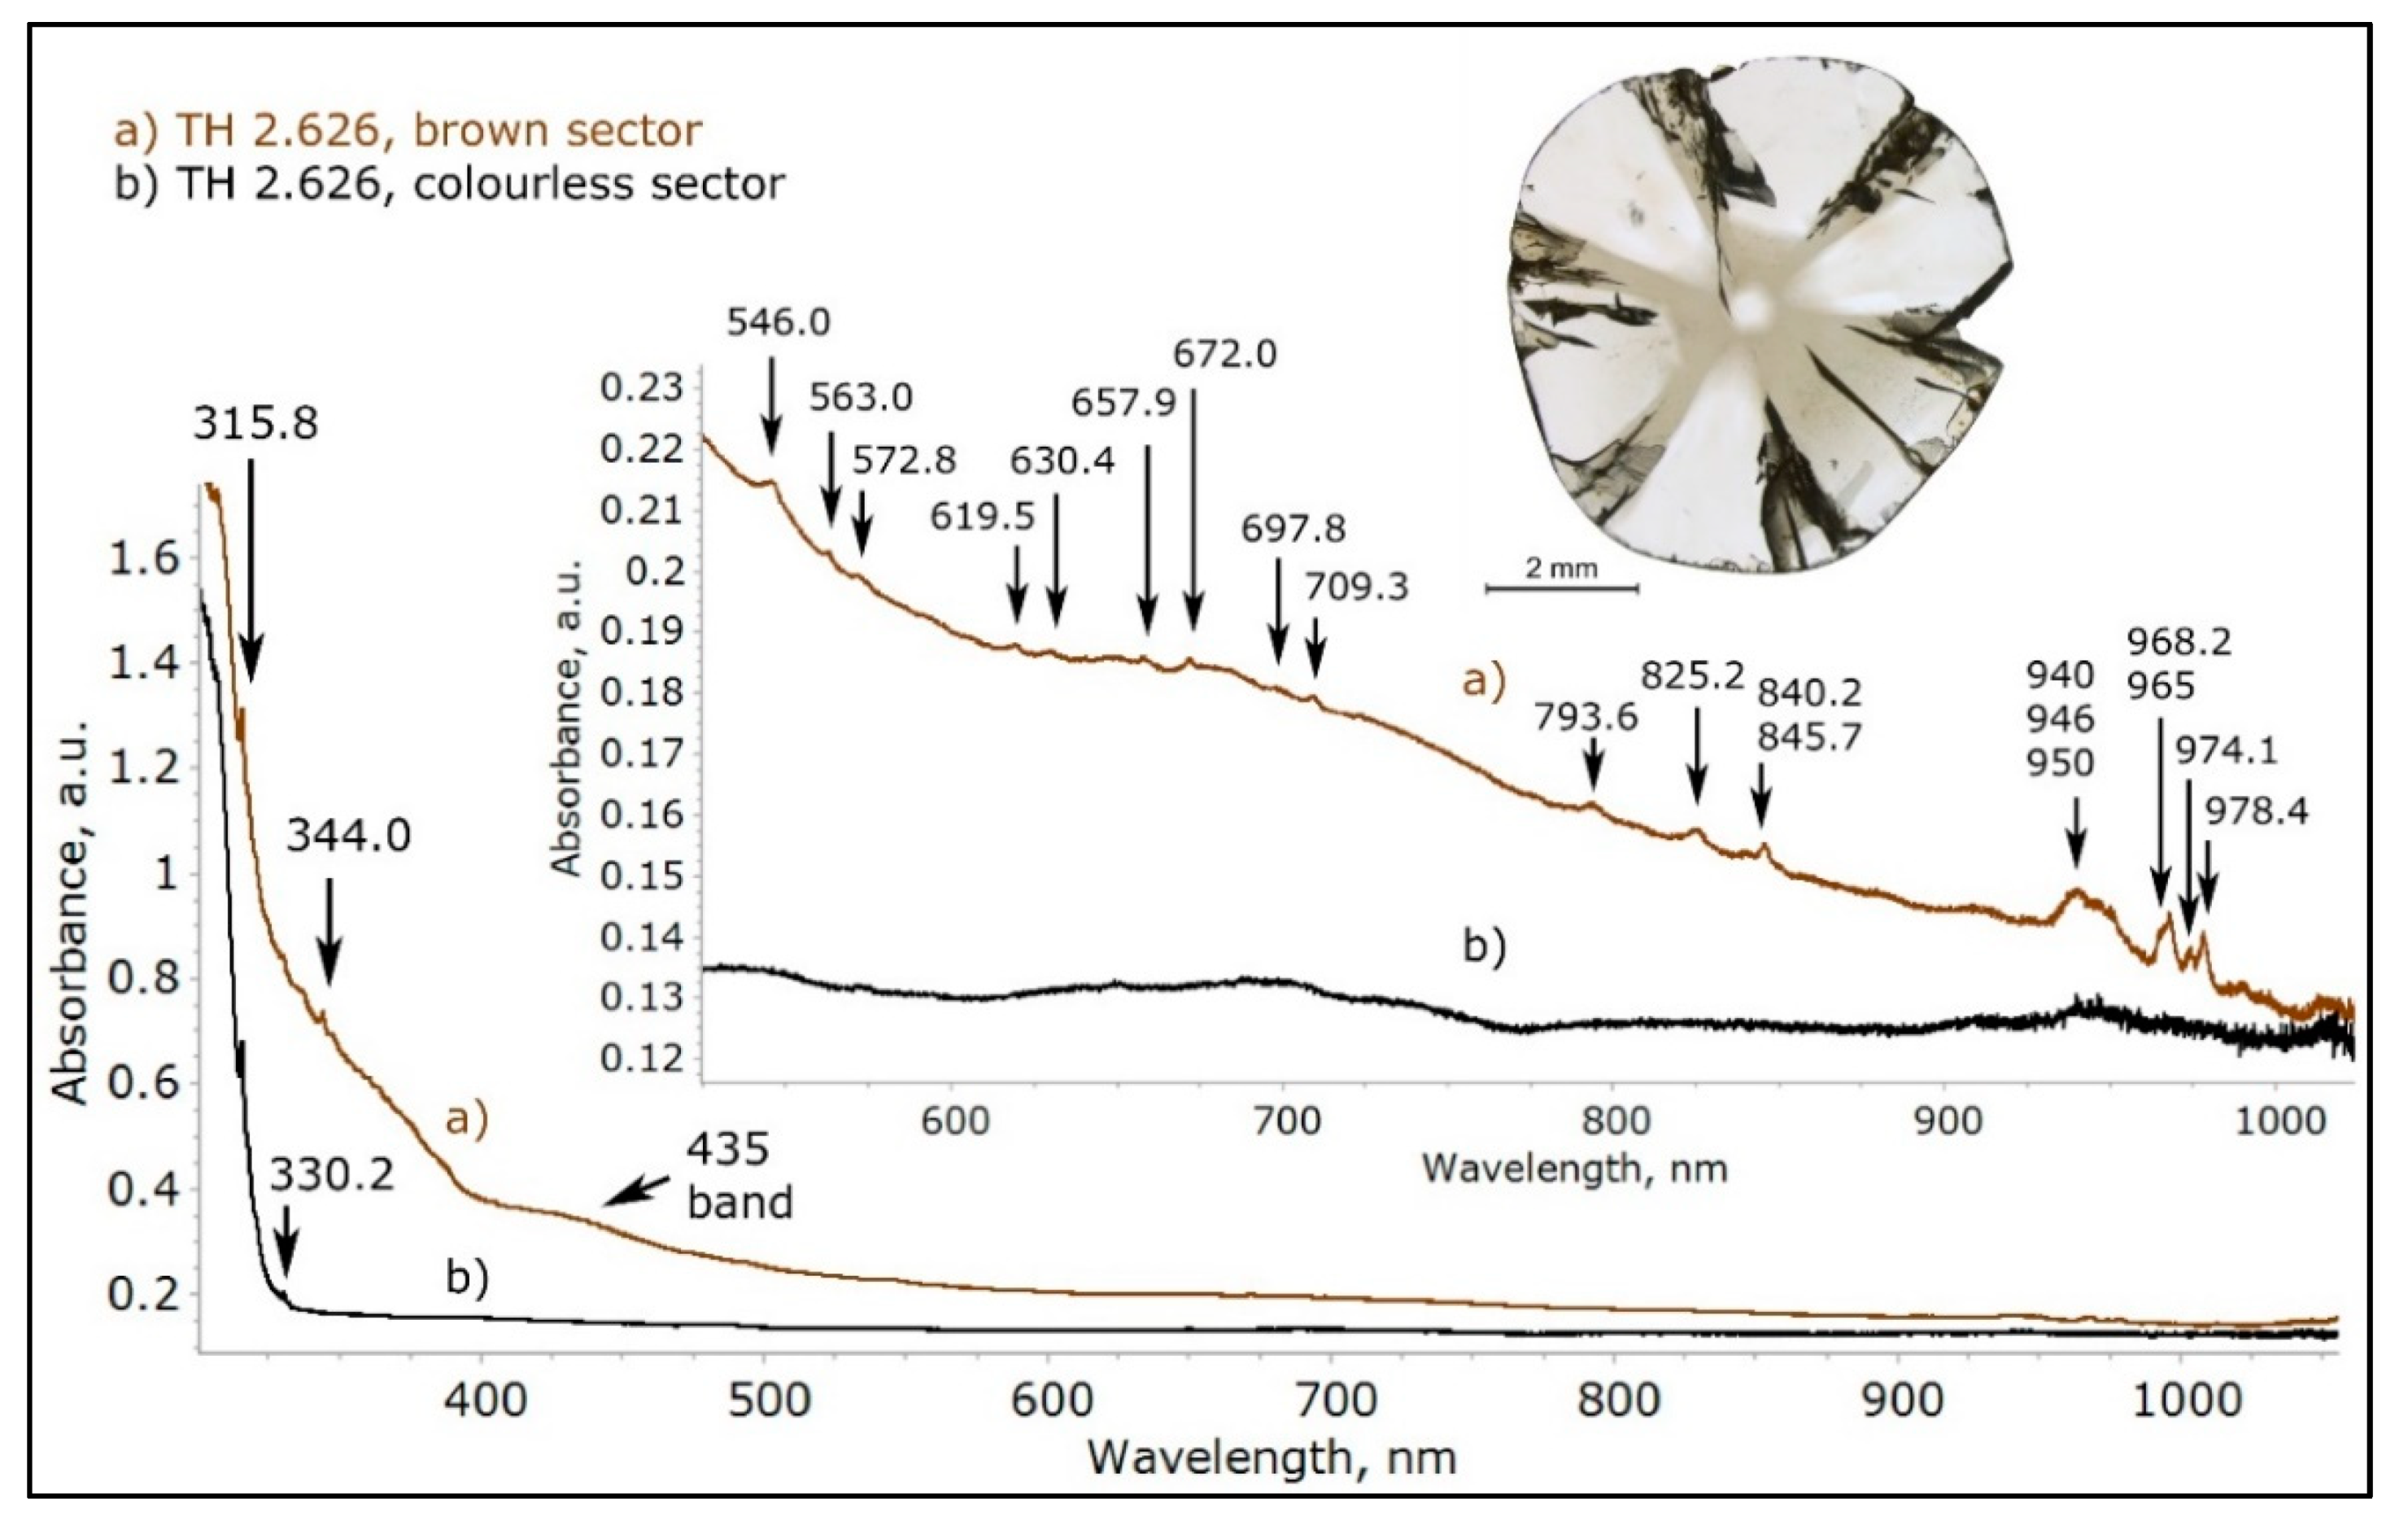
Figure 21.
The low temperature UV-Vis-NIR spectra of the colorless and brown sectors of a hydrogen-rich mixed growth cuboid-octahedral “asteriated” diamond (sample TH 2.626). Compared to the spectra of hydrogen-rich diamonds with the distinct 1330 nm center absorptions, the spectra of these diamonds are pretty featureless and for the brown sectors consist mainly of a continuum with an overlaying broad band at 435 nm, a large quantity of weak peaks in the UV domain—including the N4 center at 344.0 nm—and a series of very weak peaks between 546.0 and 978.4. The colorless sector is featureless with only an absorption peak at 315.8 (N6 center) and 330.2 nm (N5 center) detectable.
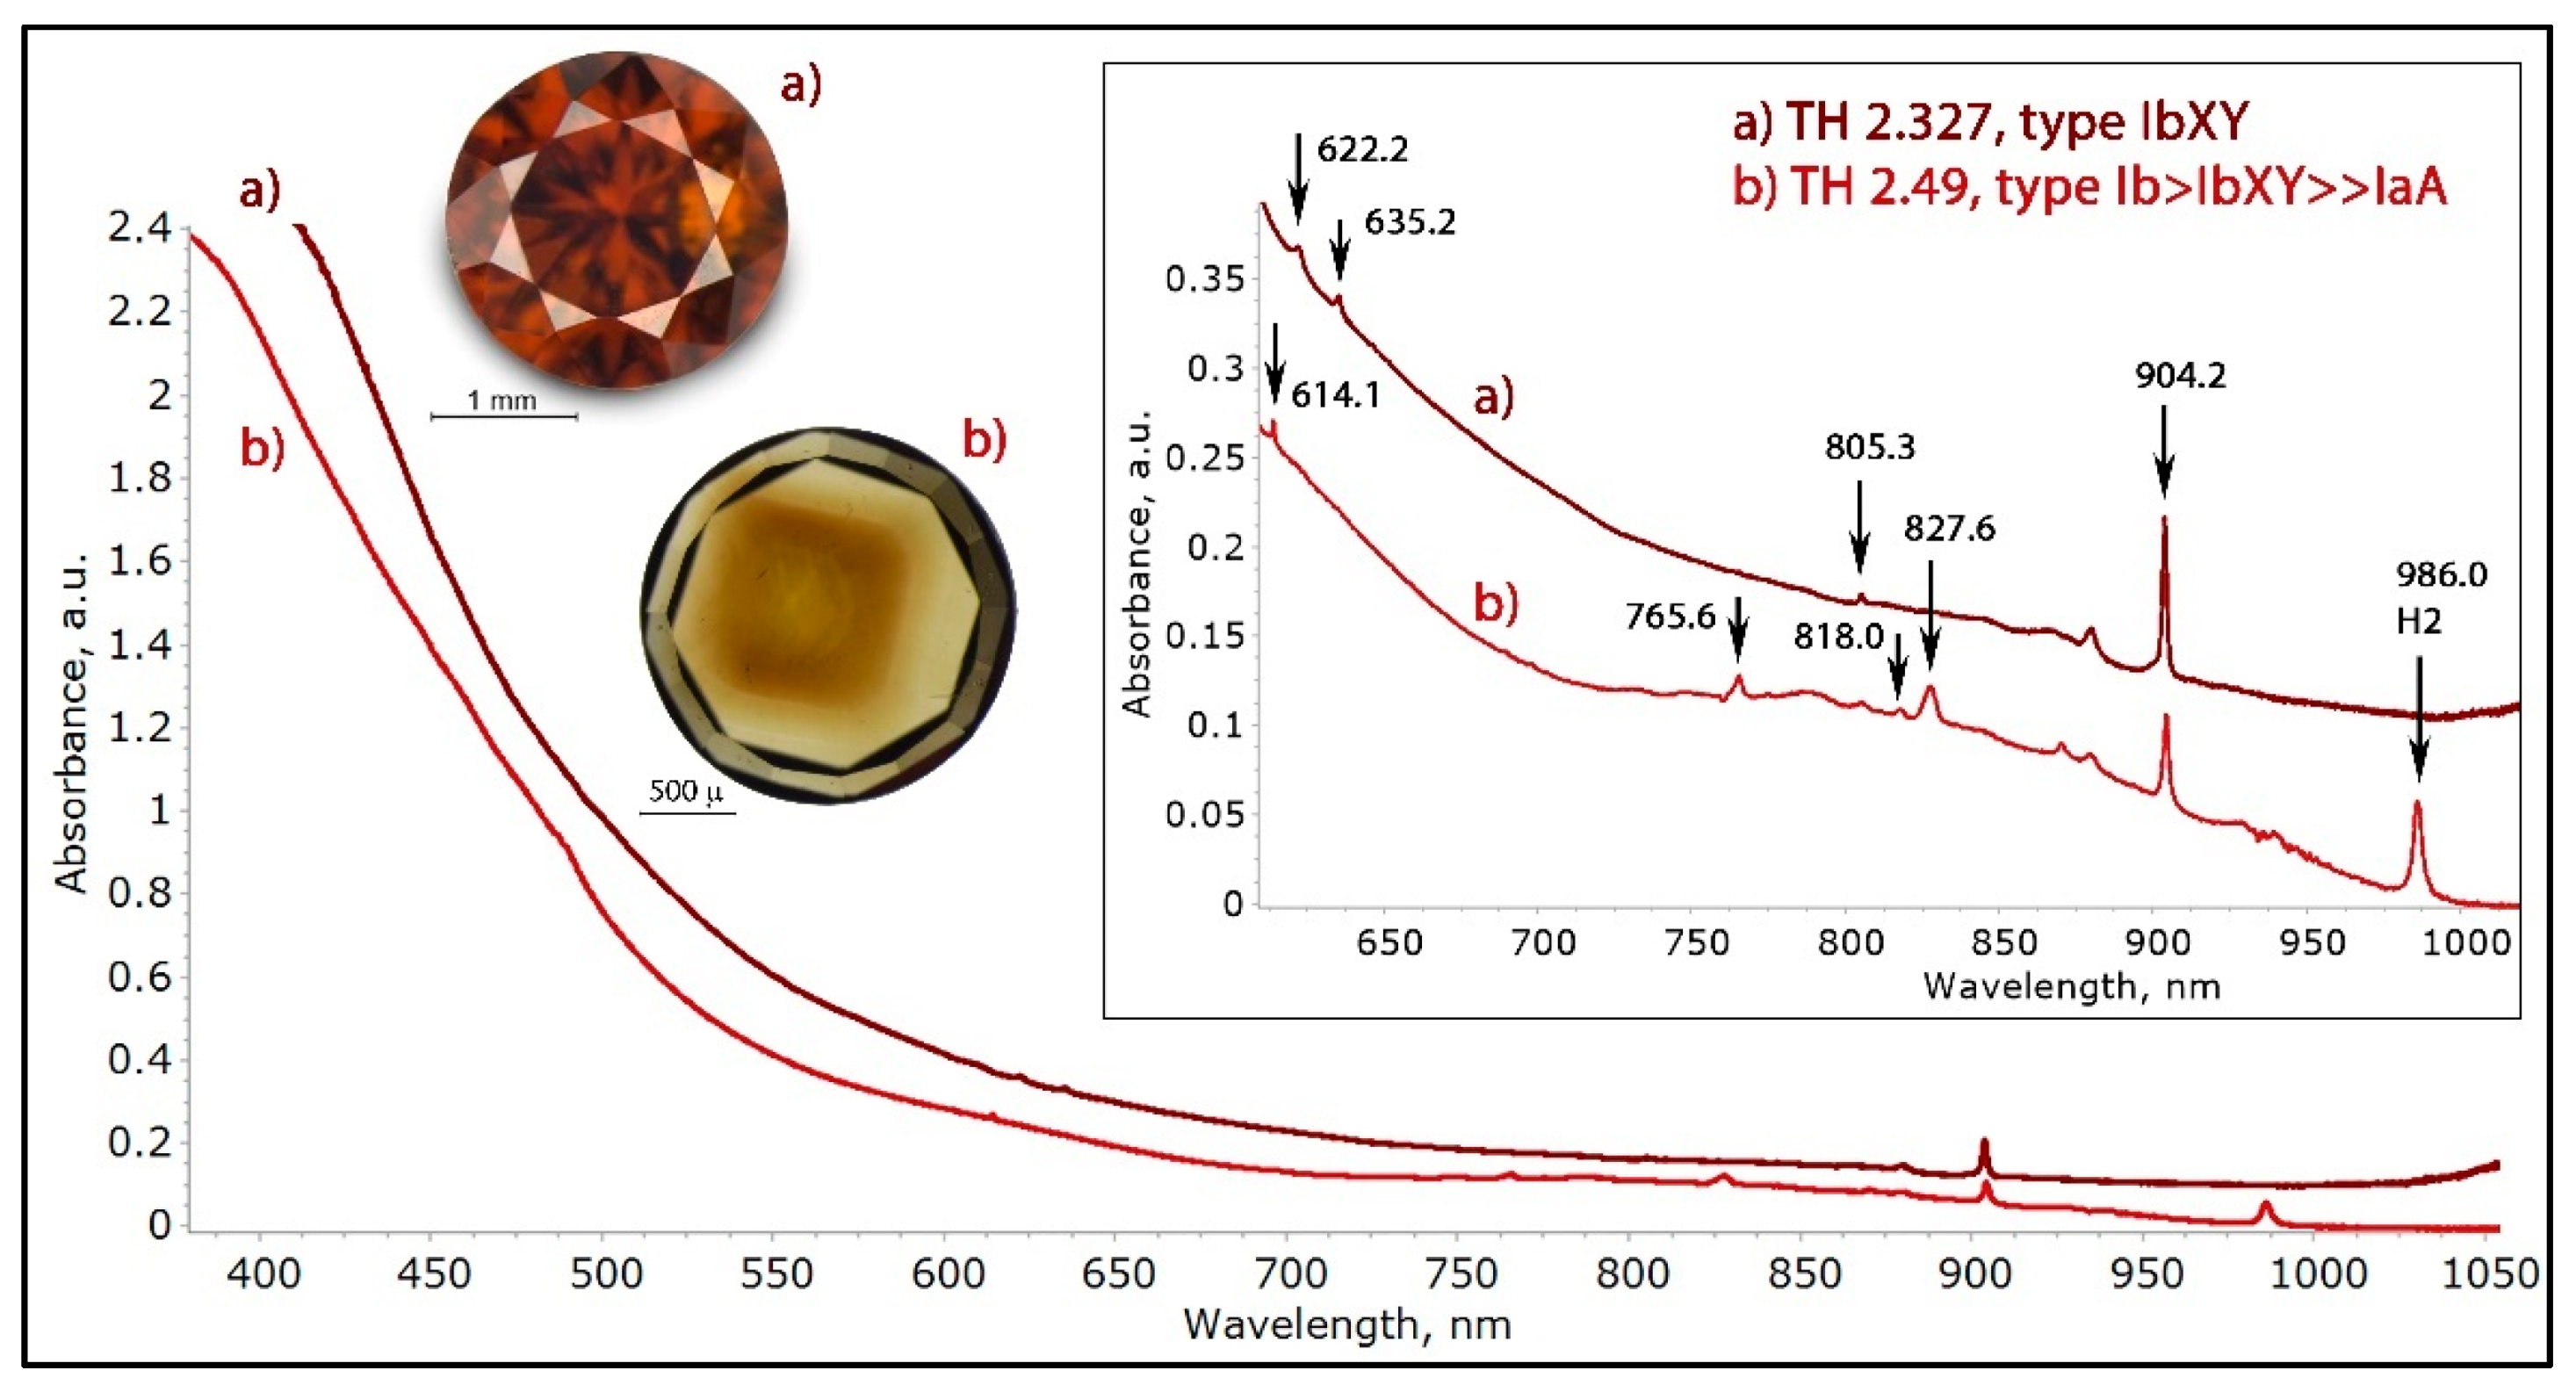
Figure 22.
The low temperature UV-Vis-NIR spectra of the two hydrogen-rich mixed growth cuboid-octahedral type IbXY diamonds (samples TH 2.327 and TH 2.49). Such spectra are very different to the ones of type Ia hydrogen-rich diamonds, and consist mainly of the C center-related absorption continuum with an overlaying unrelated absorption continuum from 560 nm towards the NIR domain, and a series of sharper absorptions from 600 nm to 1000 nm. Of these, the most characteristic absorption is the 904.2 nm center.
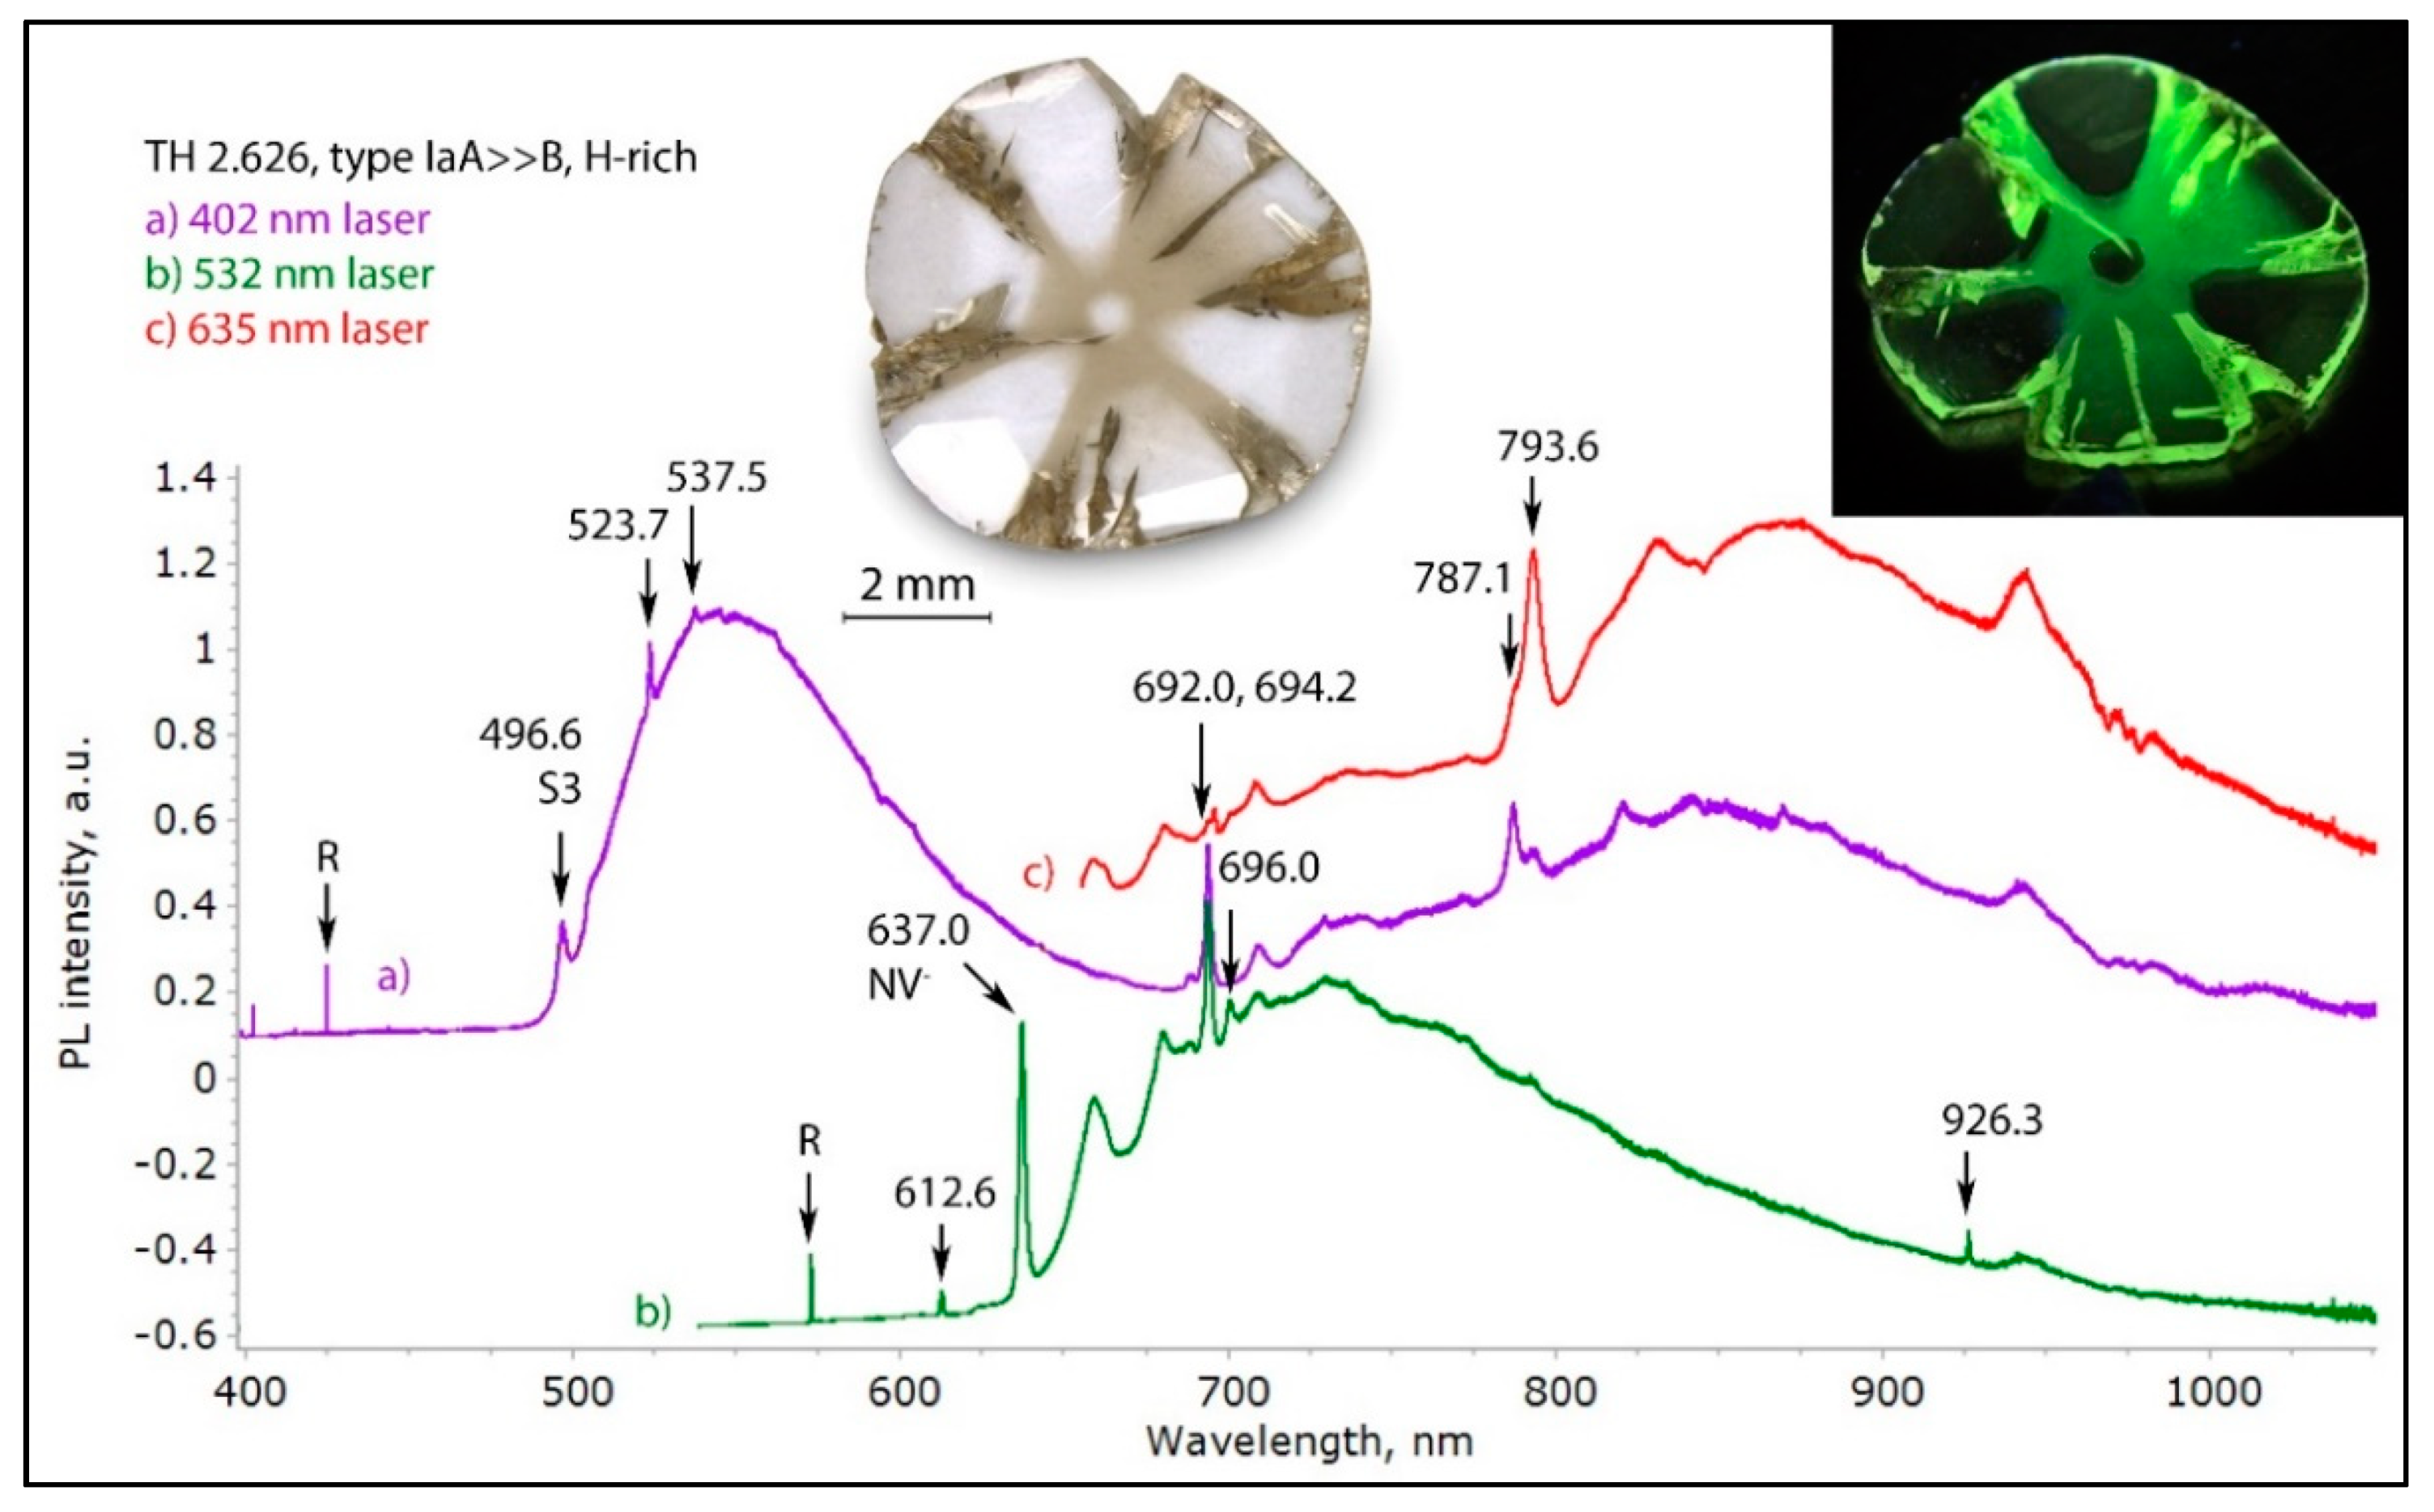
Figure 23.
The photoluminescence spectra of the brown sectors of an NDR hydrogen-rich “asteriated” colorless/brown type IaA >> B diamond (TH 2.626) recorded with three different lasers. The intense broad vibronic S3 band centered at about 545 nm is related to nickel defects and responsible for the green fluorescence of the brown sectors of the diamond. The 692.0/694.2 doublet, the 787.0 and the 793.6 nm centers are characteristic for such diamonds, and all of these are likely related to nickel containing defects. The spectra have been shifted vertically for clarity. Photos: Gianna Pamies and Dr. Thomas Hainschwang.
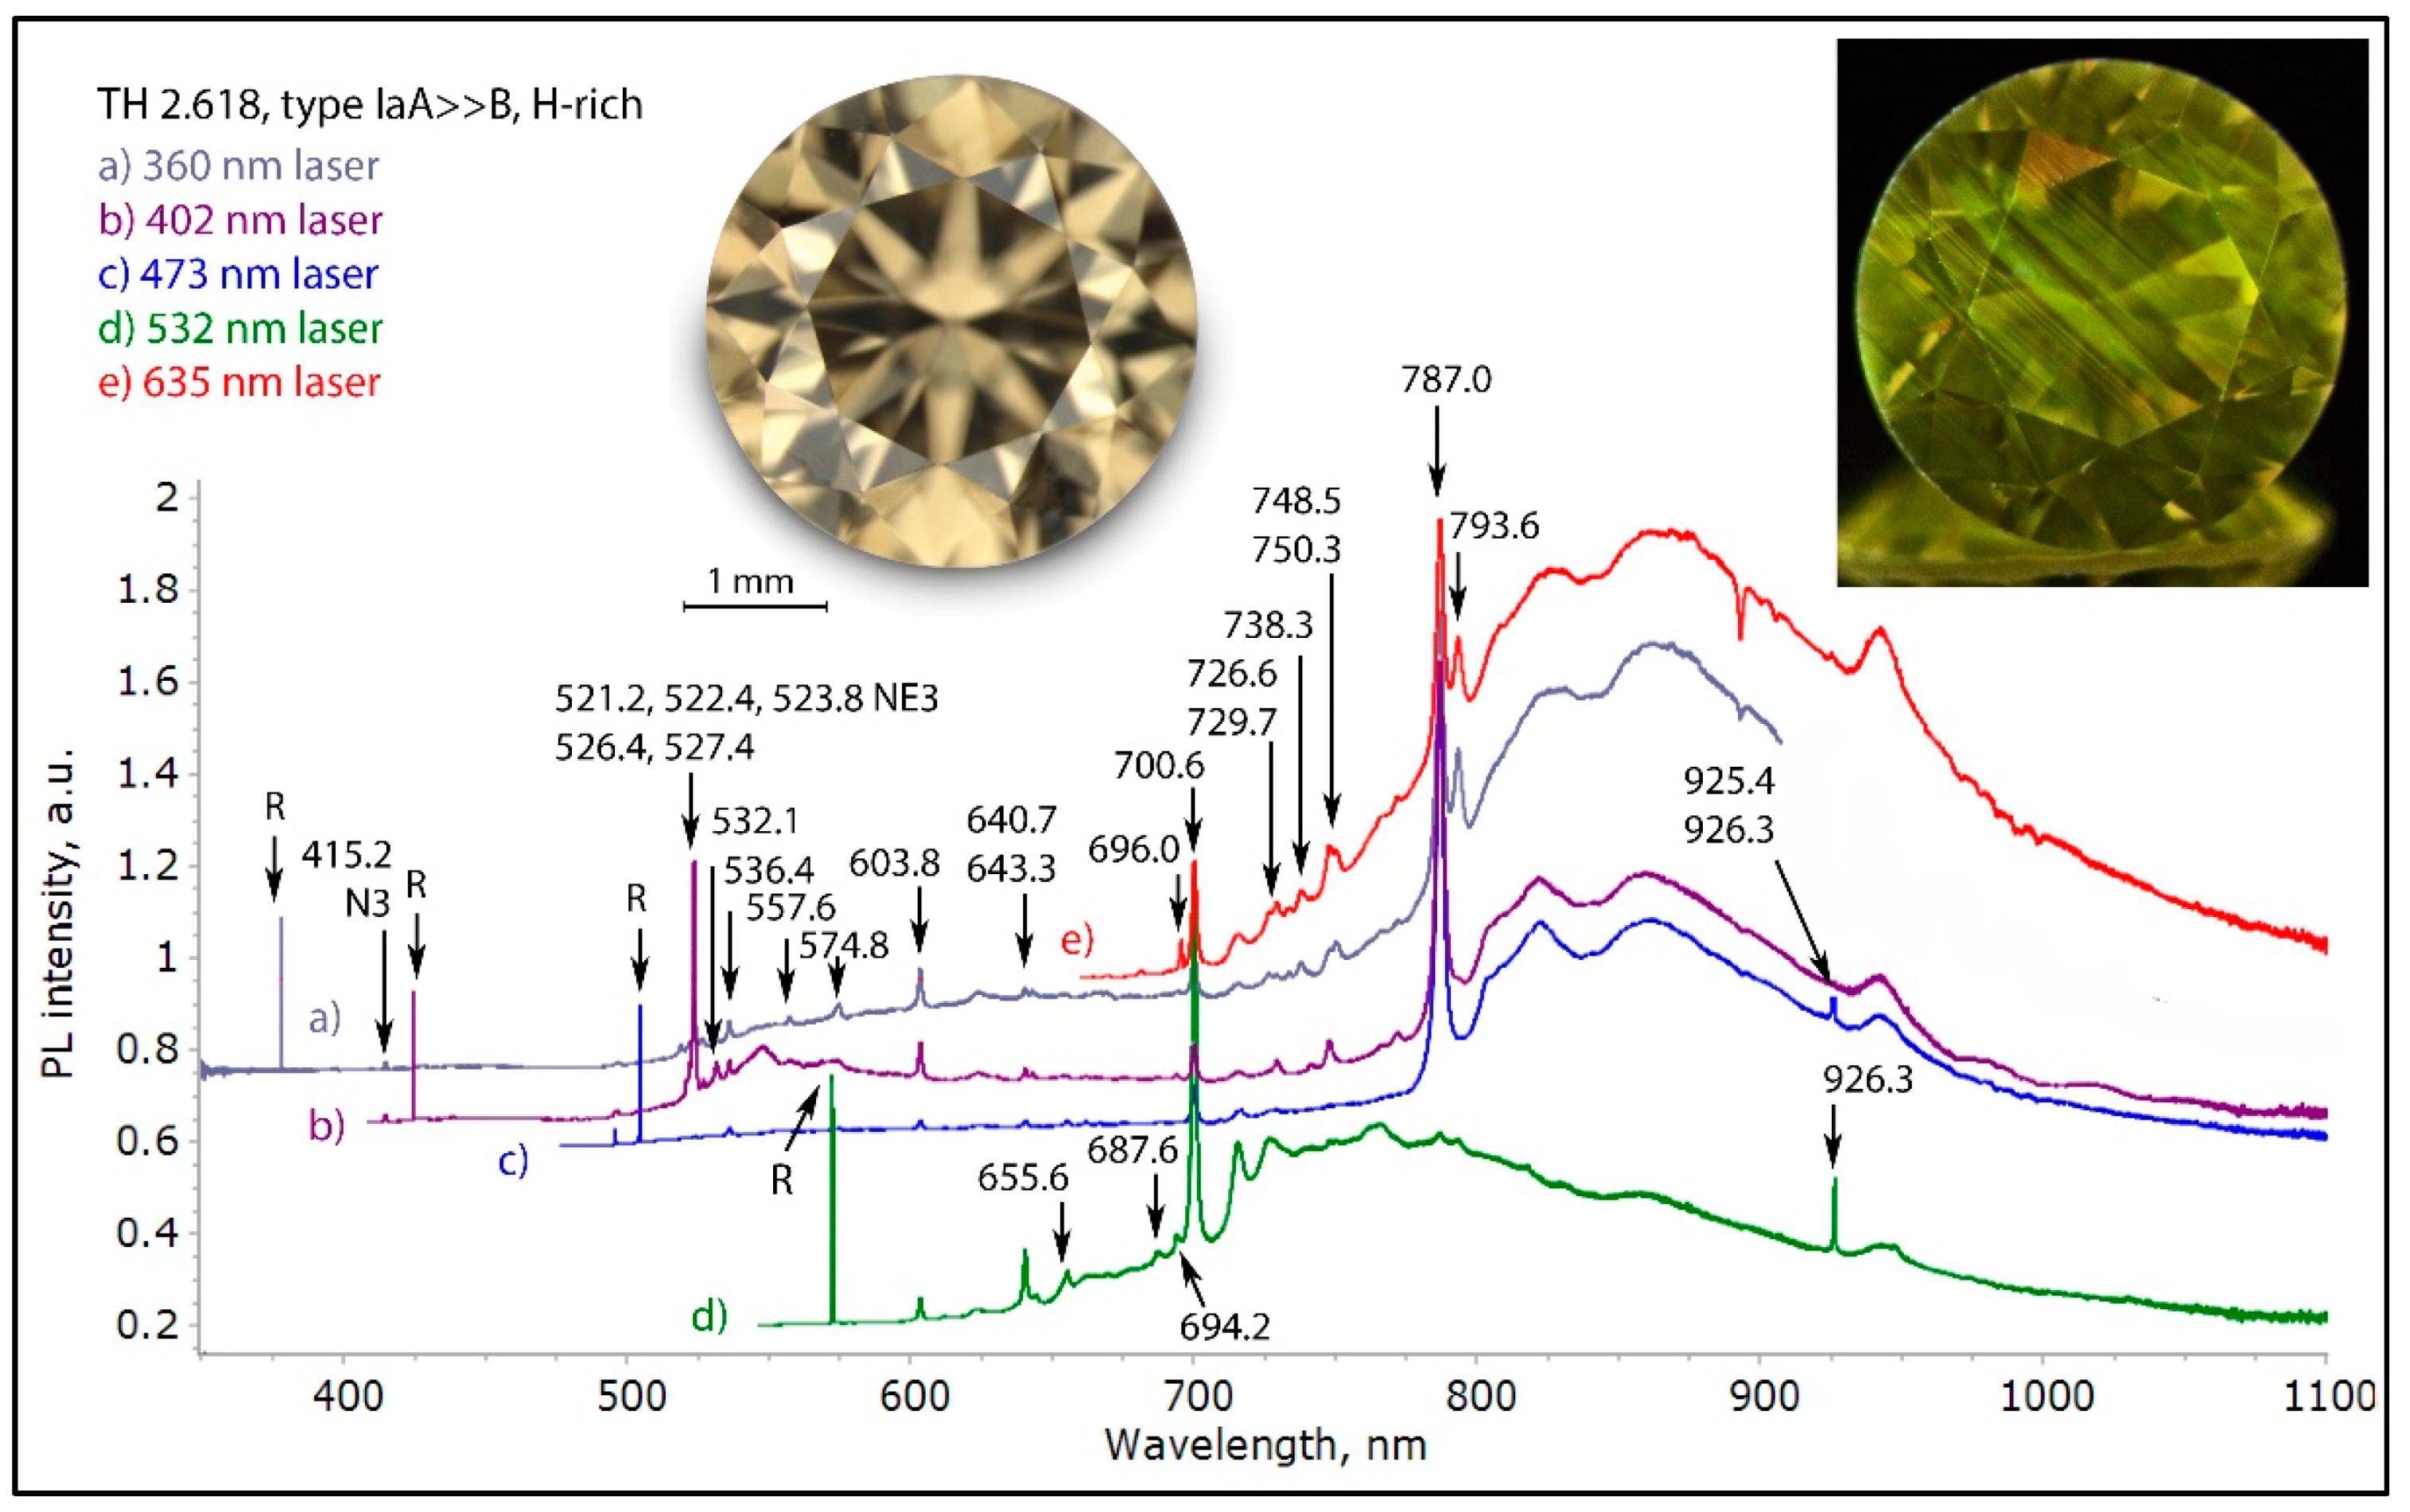
Figure 24.
The photoluminescence spectra of a NDR hydrogen-rich yellow brown type IaA >> B diamond (TH 2.618) recorded with five different lasers. The 521.2 to 527.4 nm features, the 700.6, the 787.0 and the 793.6 nm centers are characteristic for such diamonds; at least the 700.6 and 793.6 nm centers are linked to nickel-related defects. The spectra have been shifted vertically for clarity. Photos: Gianna Pamies and Dr. Thomas Hainschwang.
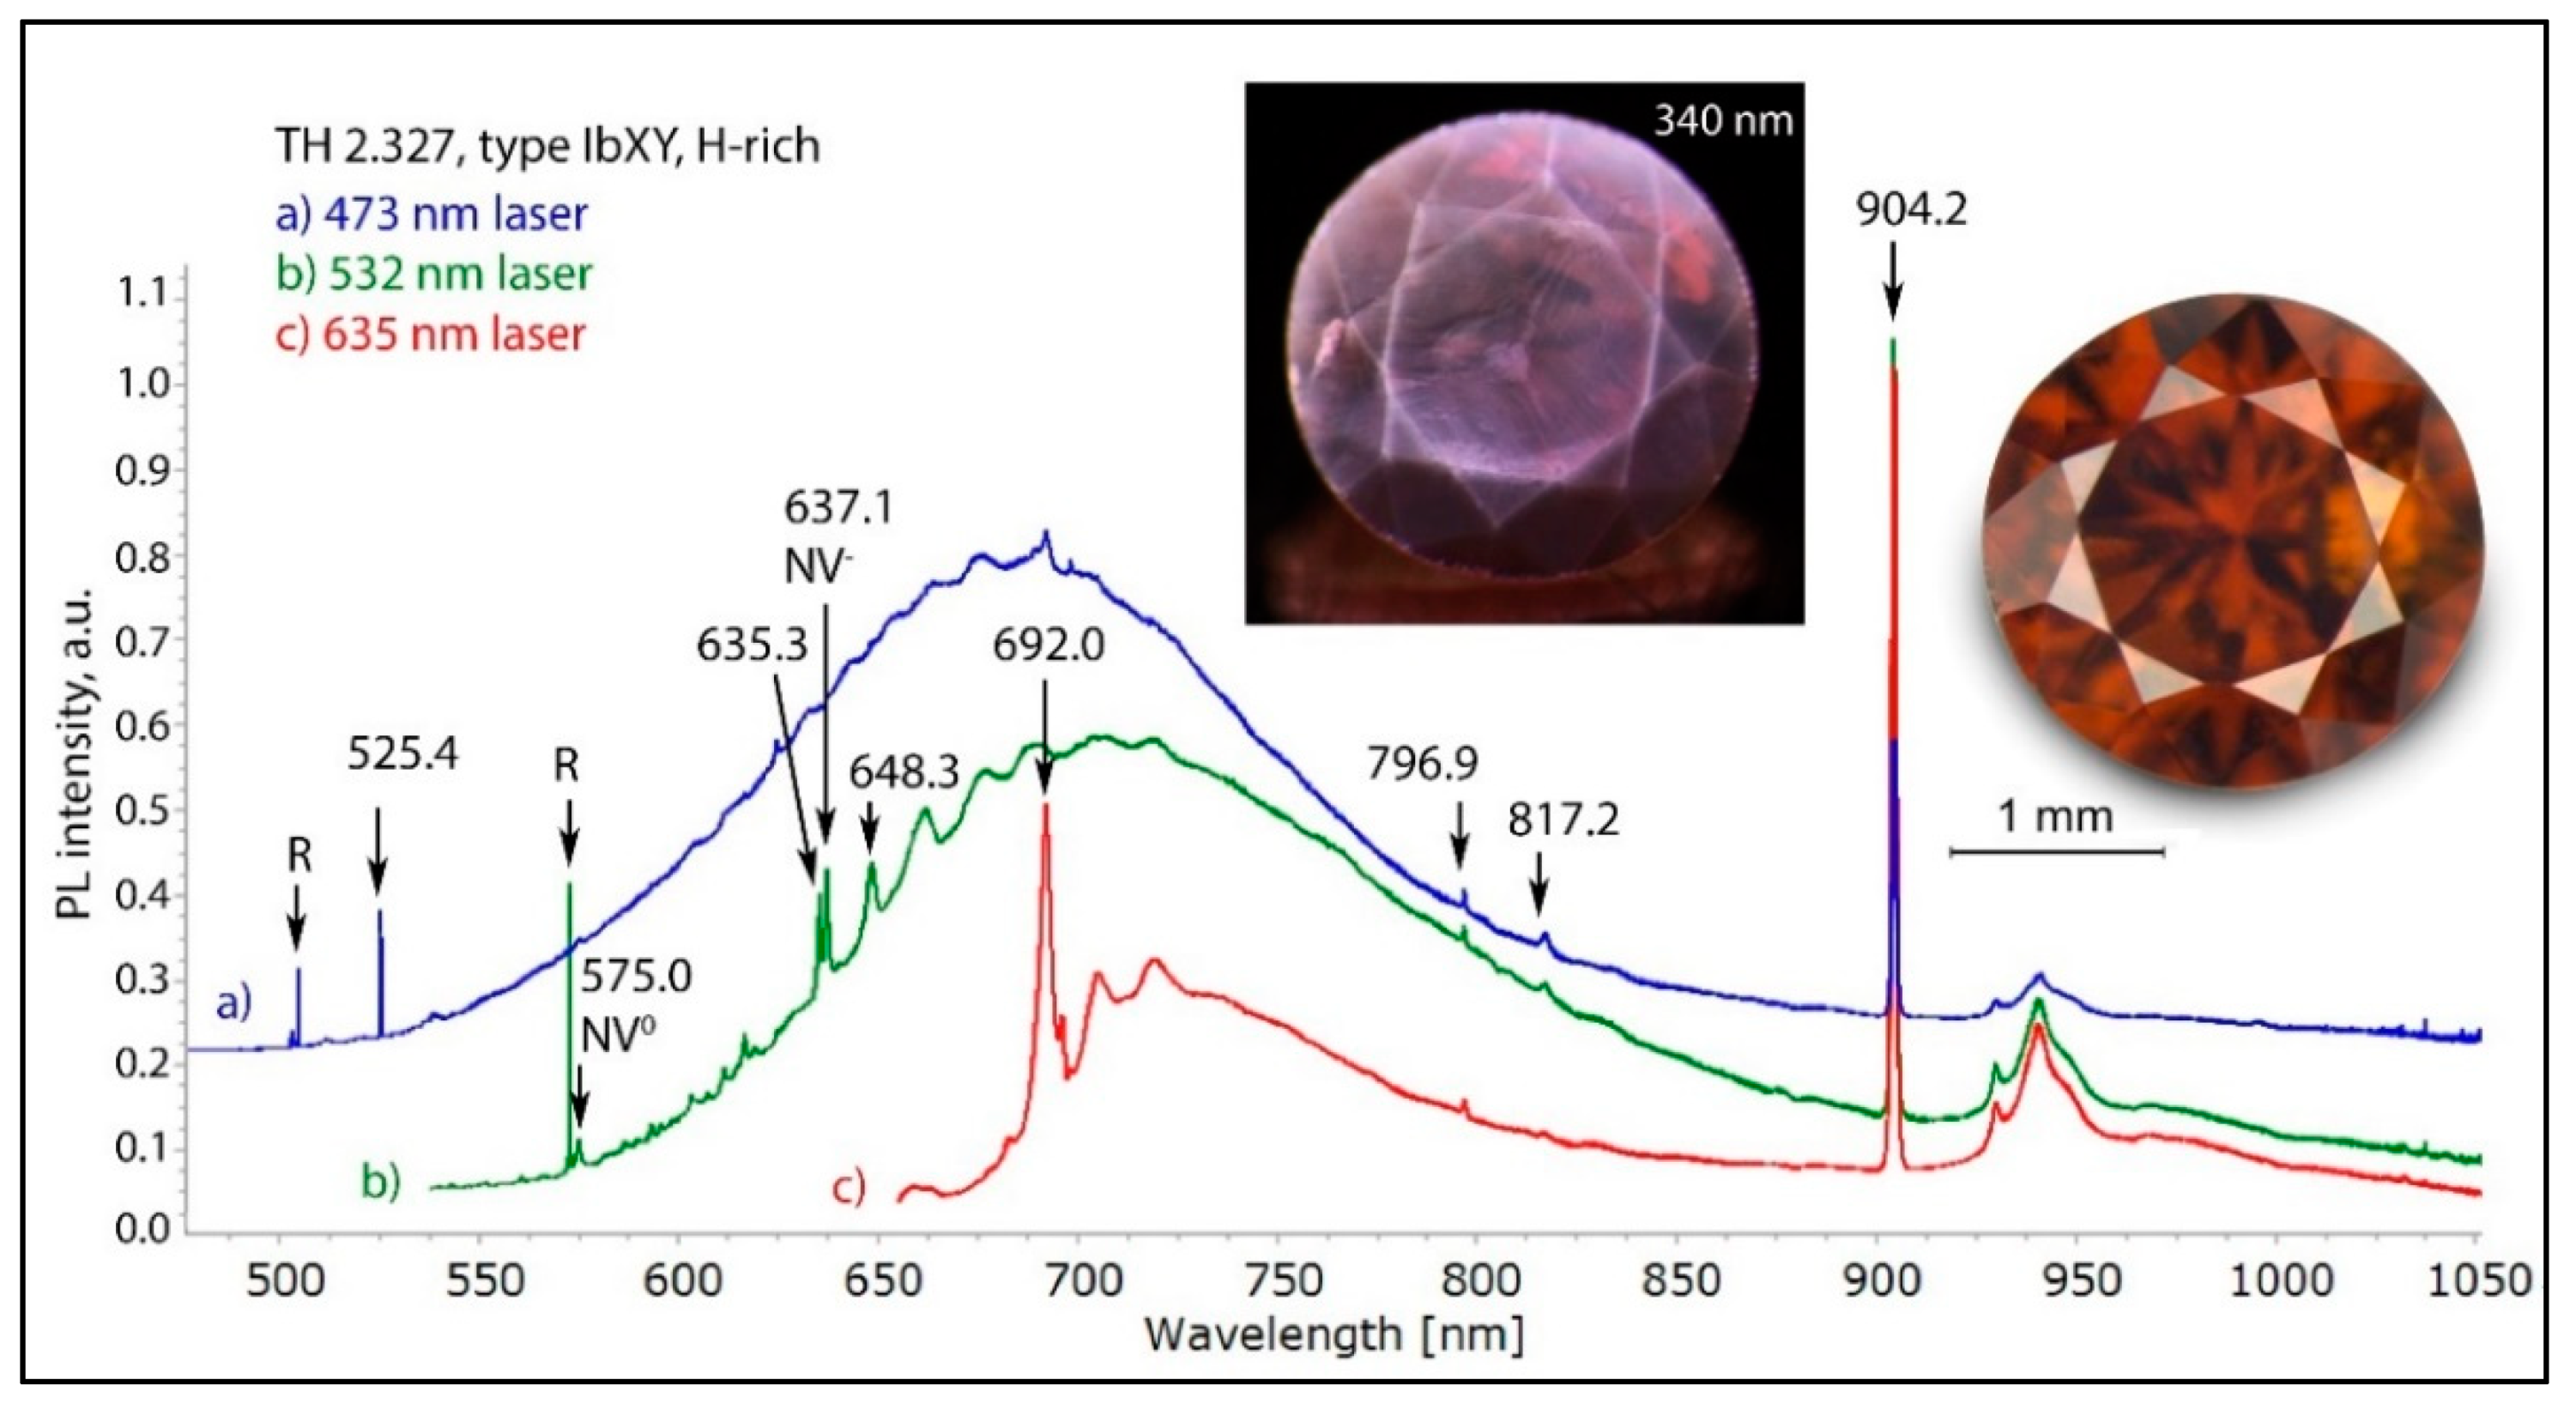
Figure 25.
The photoluminescence spectra of a NDR hydrogen-rich deep brown orange type IbXY diamond of mixed cuboid octahedral growth (TH 2.327) recorded with three different lasers. The 693 nm and particularly the 904.2 nm features are very characteristic for such diamonds. The spectra have been shifted vertically for clarity. Photos: Gianna Pamies and Dr. Thomas Hainschwang.
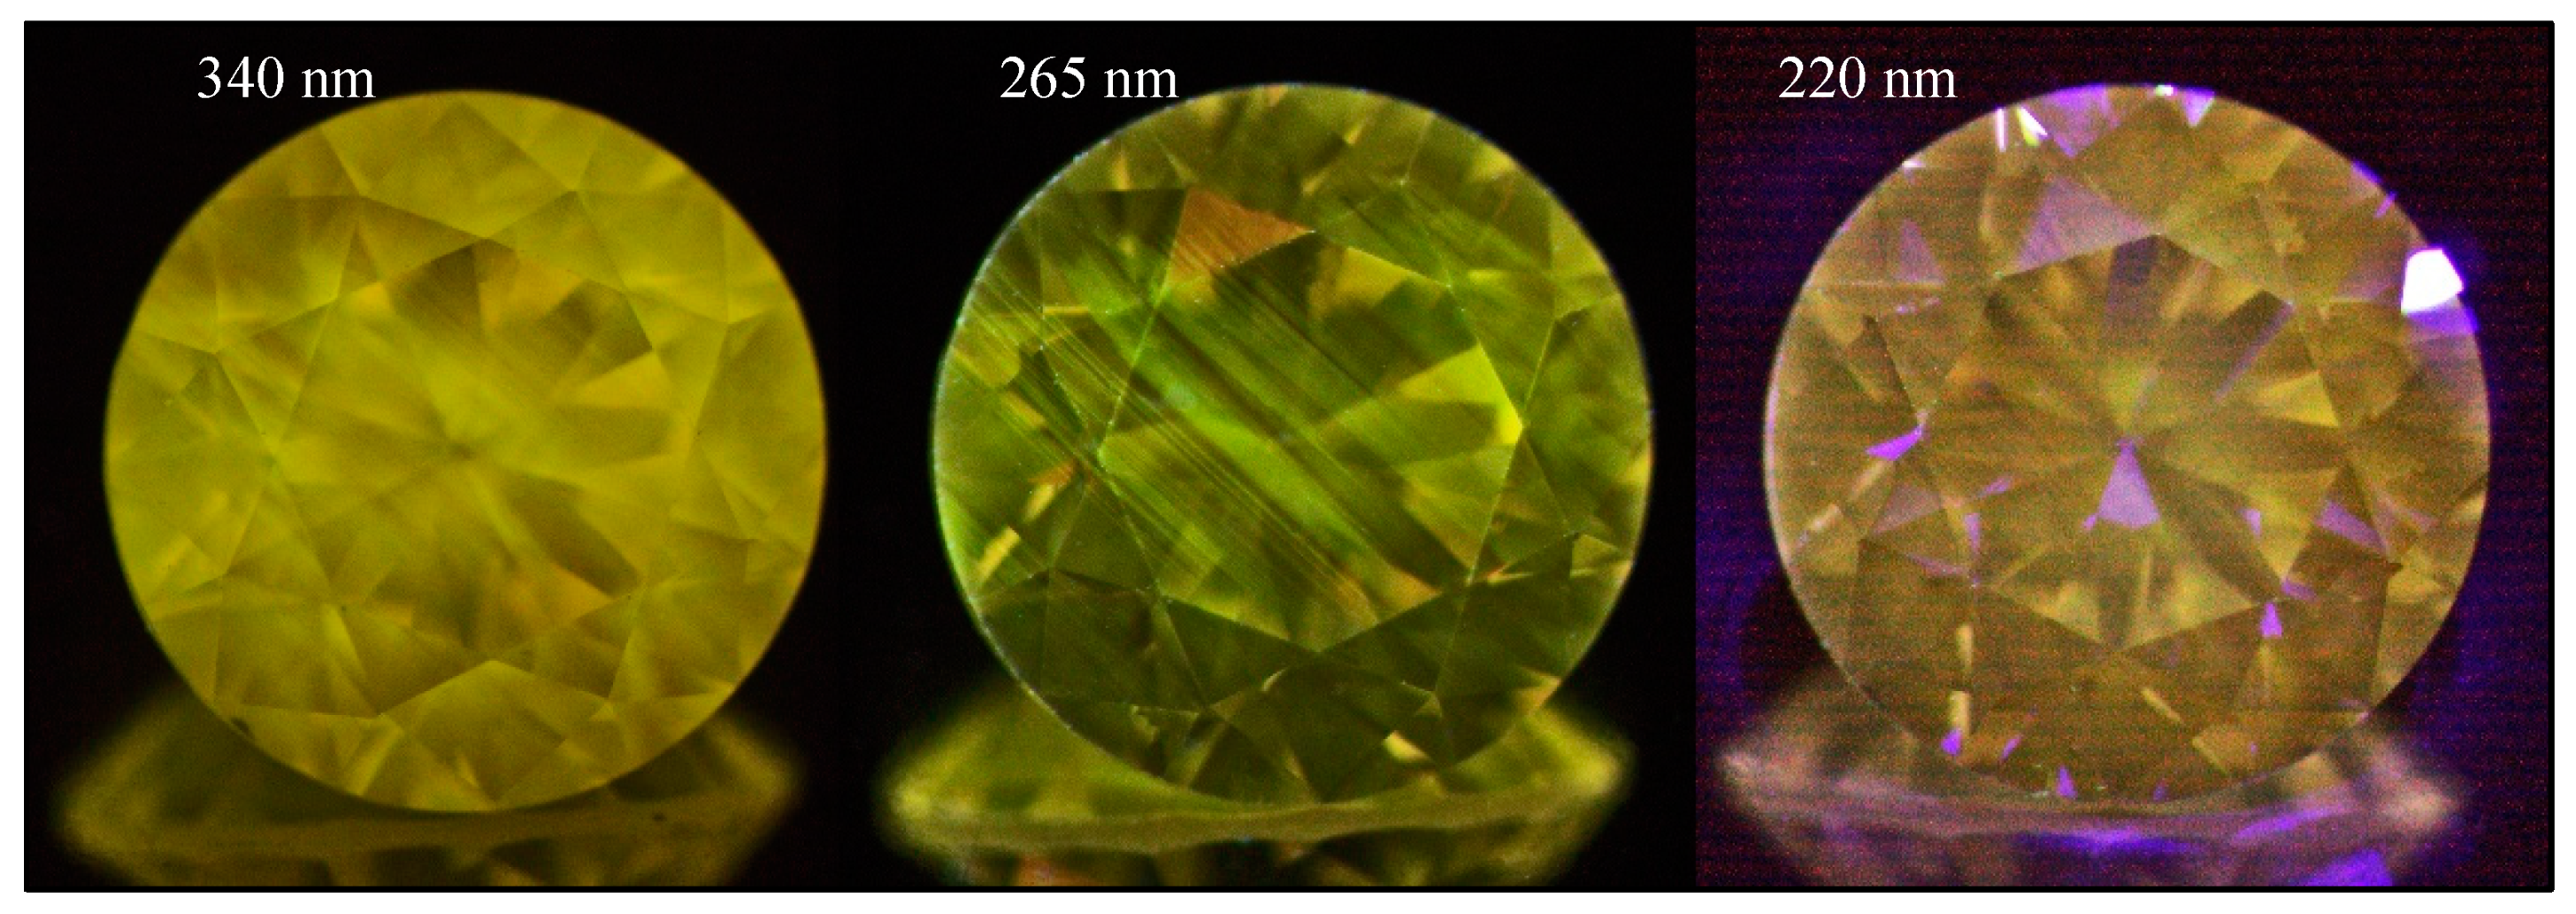
Figure 26.
A light yellow-brown hydrogen-rich type IaA >> B diamond (sample TH 2.618) under three different UV excitations of the DFI system. The yellow to yellow green PL is caused mainly by the 523.7 nm defect. Photos: Dr. Thomas Hainschwang.
Figure 26.
A light yellow-brown hydrogen-rich type IaA >> B diamond (sample TH 2.618) under three different UV excitations of the DFI system. The yellow to yellow green PL is caused mainly by the 523.7 nm defect. Photos: Dr. Thomas Hainschwang.
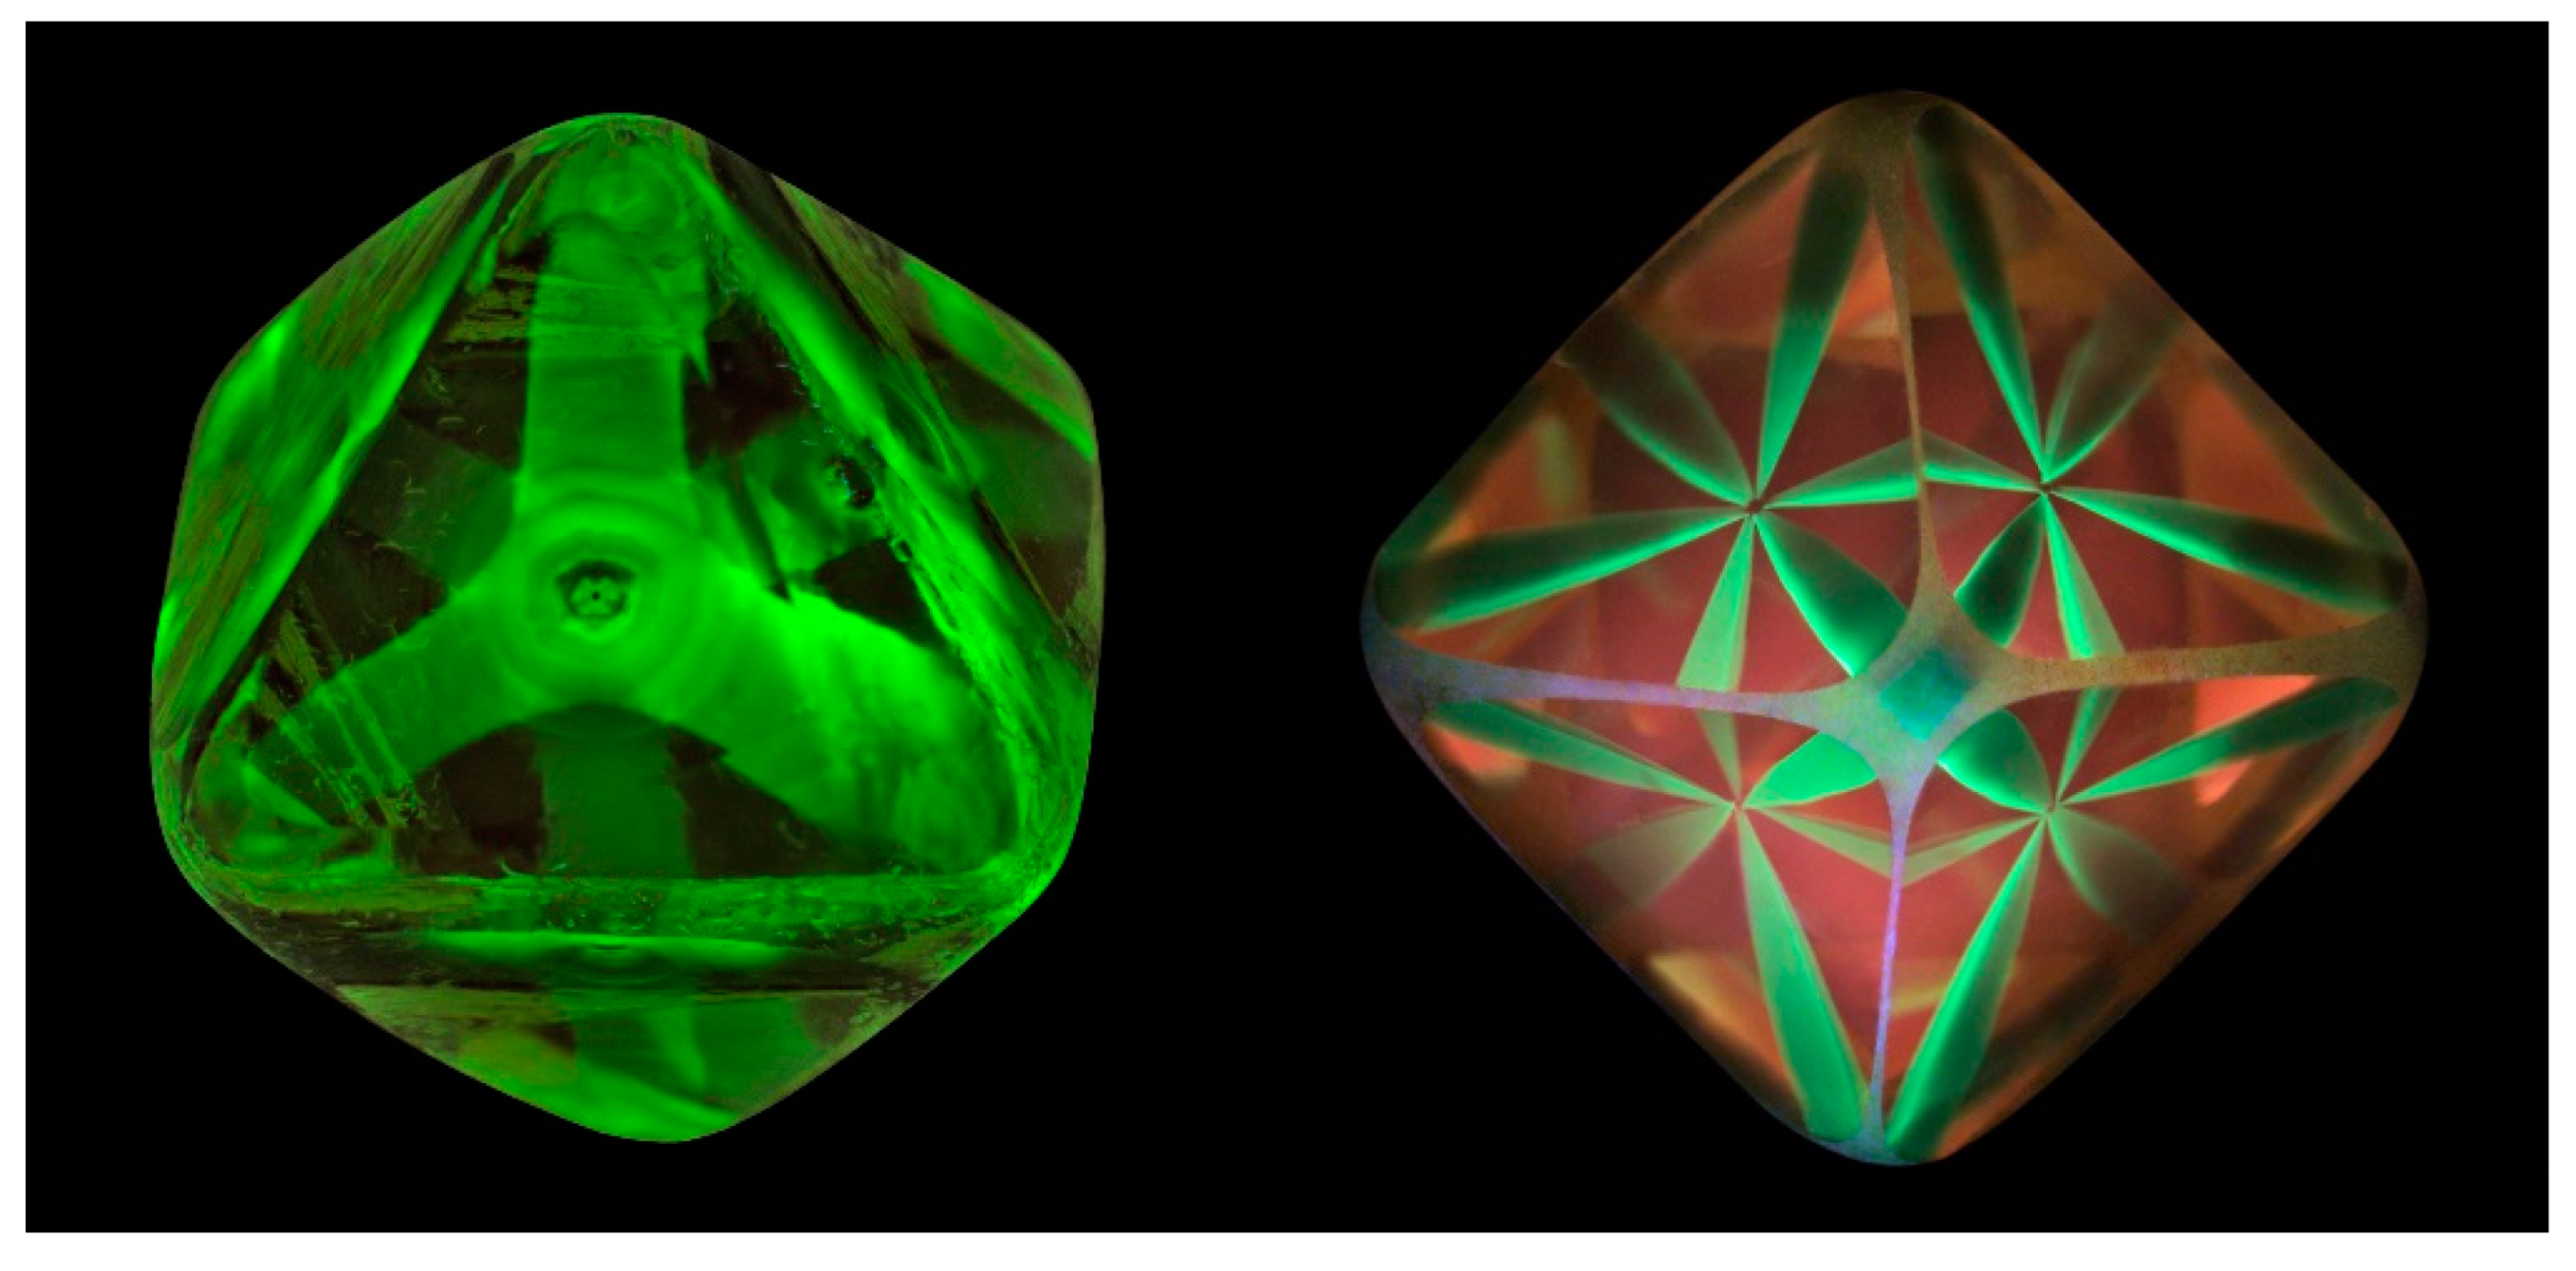
Figure 27.
The fluorescence under 340 nm of two asteriated diamonds, a 2.50 ct polished octahedron on the left and the 11.38 ct Rhodesian Star on the right. While the sample included in this study (TH 2.626) shows only the S3 center green PL of the cuboid sectors while the octahedral sectors were totally inert, these two samples show the same S3 center green PL while the octahedral sectors fluoresces faint pink in the smaller sample and distinctly orange red in the larger stone. The fluorescence seen in the near colorless octahedral sectors is caused by a combination of the N3 center with the 655 nm broad band PL. Photos: Dr. Thomas Hainschwang.
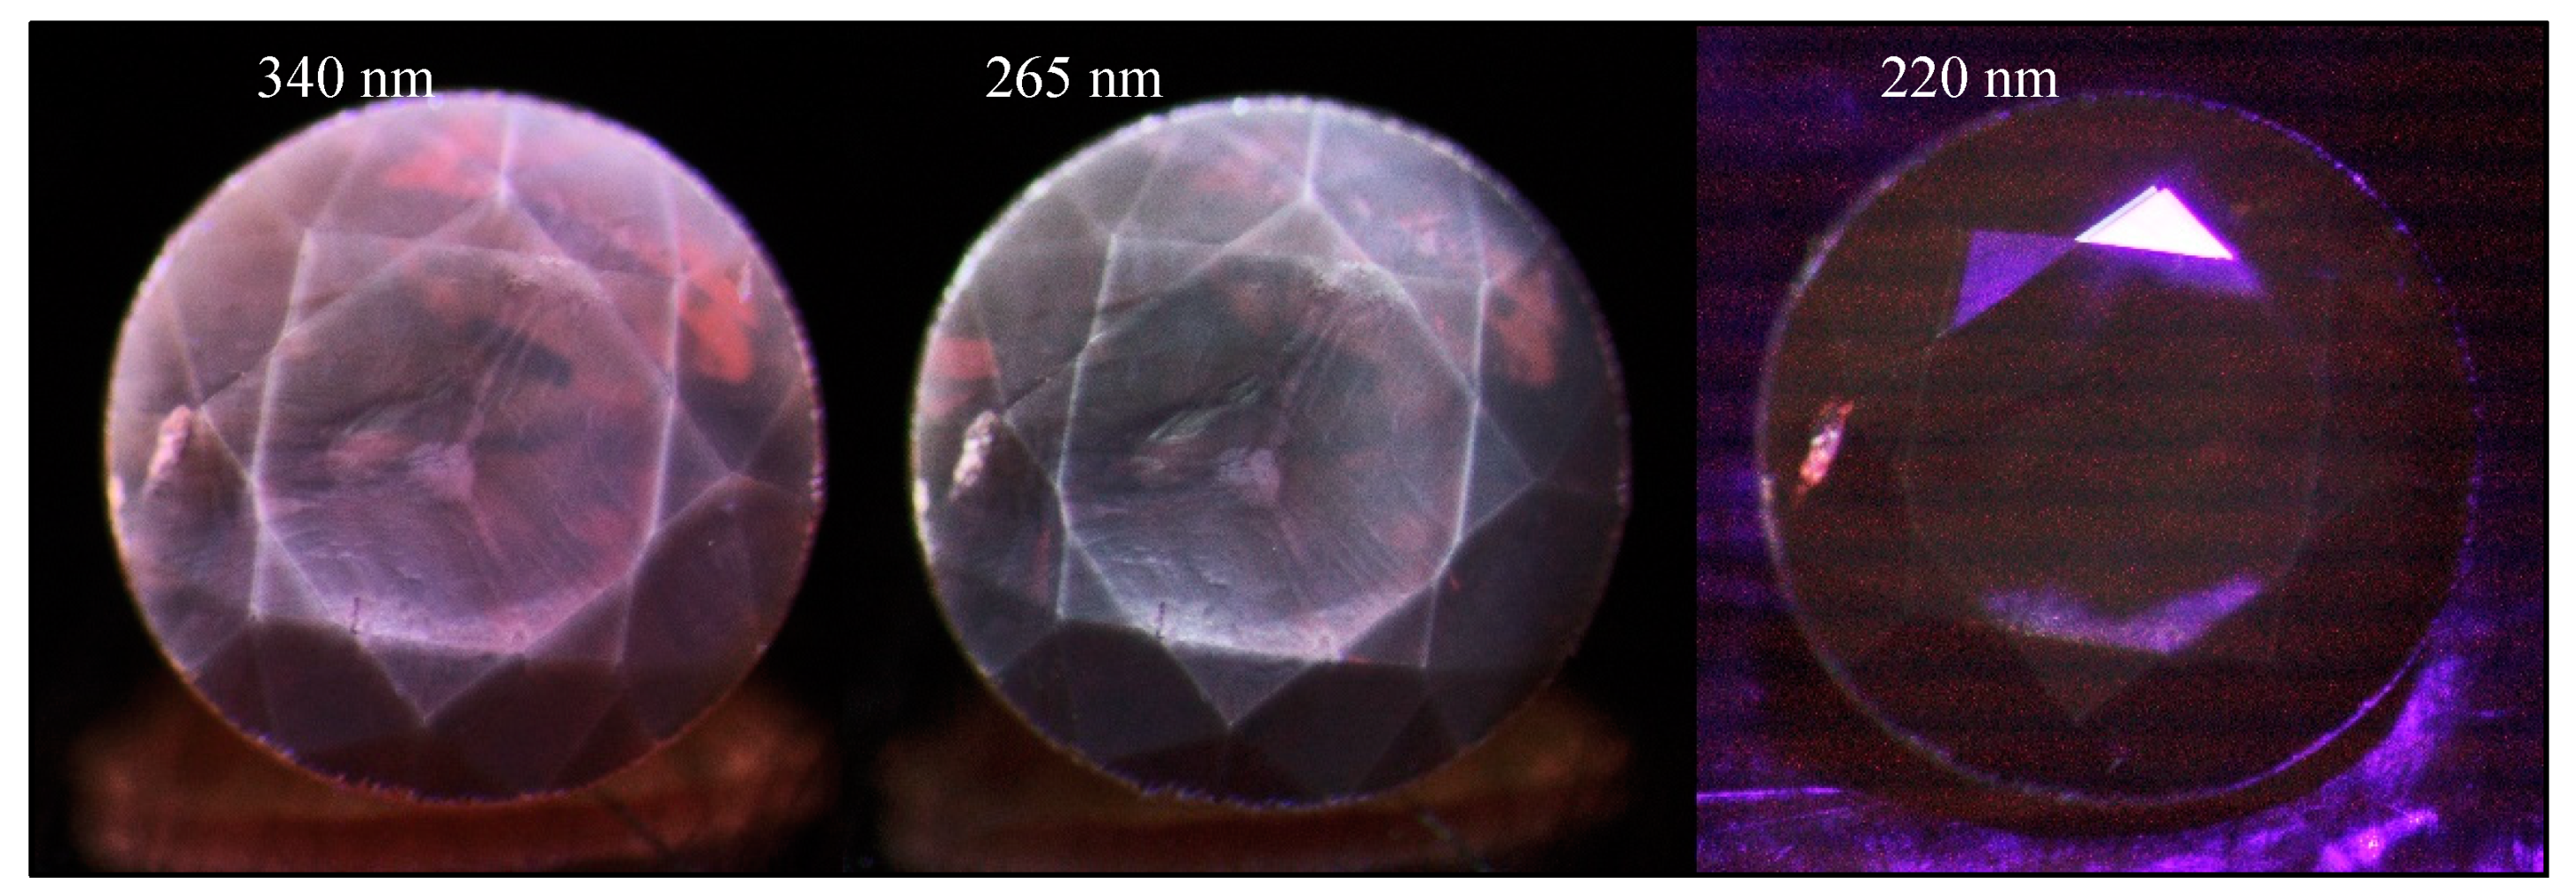
Figure 28.
A deep orange-brown hydrogen-rich type IbXY diamond (sample TH 2.327) under three different UV excitations of the DFI system. The fluorescence distribution with the “Mercedes star” in the core (three-fold symmetry) is indicative of the mixed cuboid octahedral growth of the diamond. The “Mercedes star” is representative of the octahedral growth sector. The PL at 340 nm is caused by a very broad PL band centered at about 640 nm and that ranges from 400 to 800 nm.
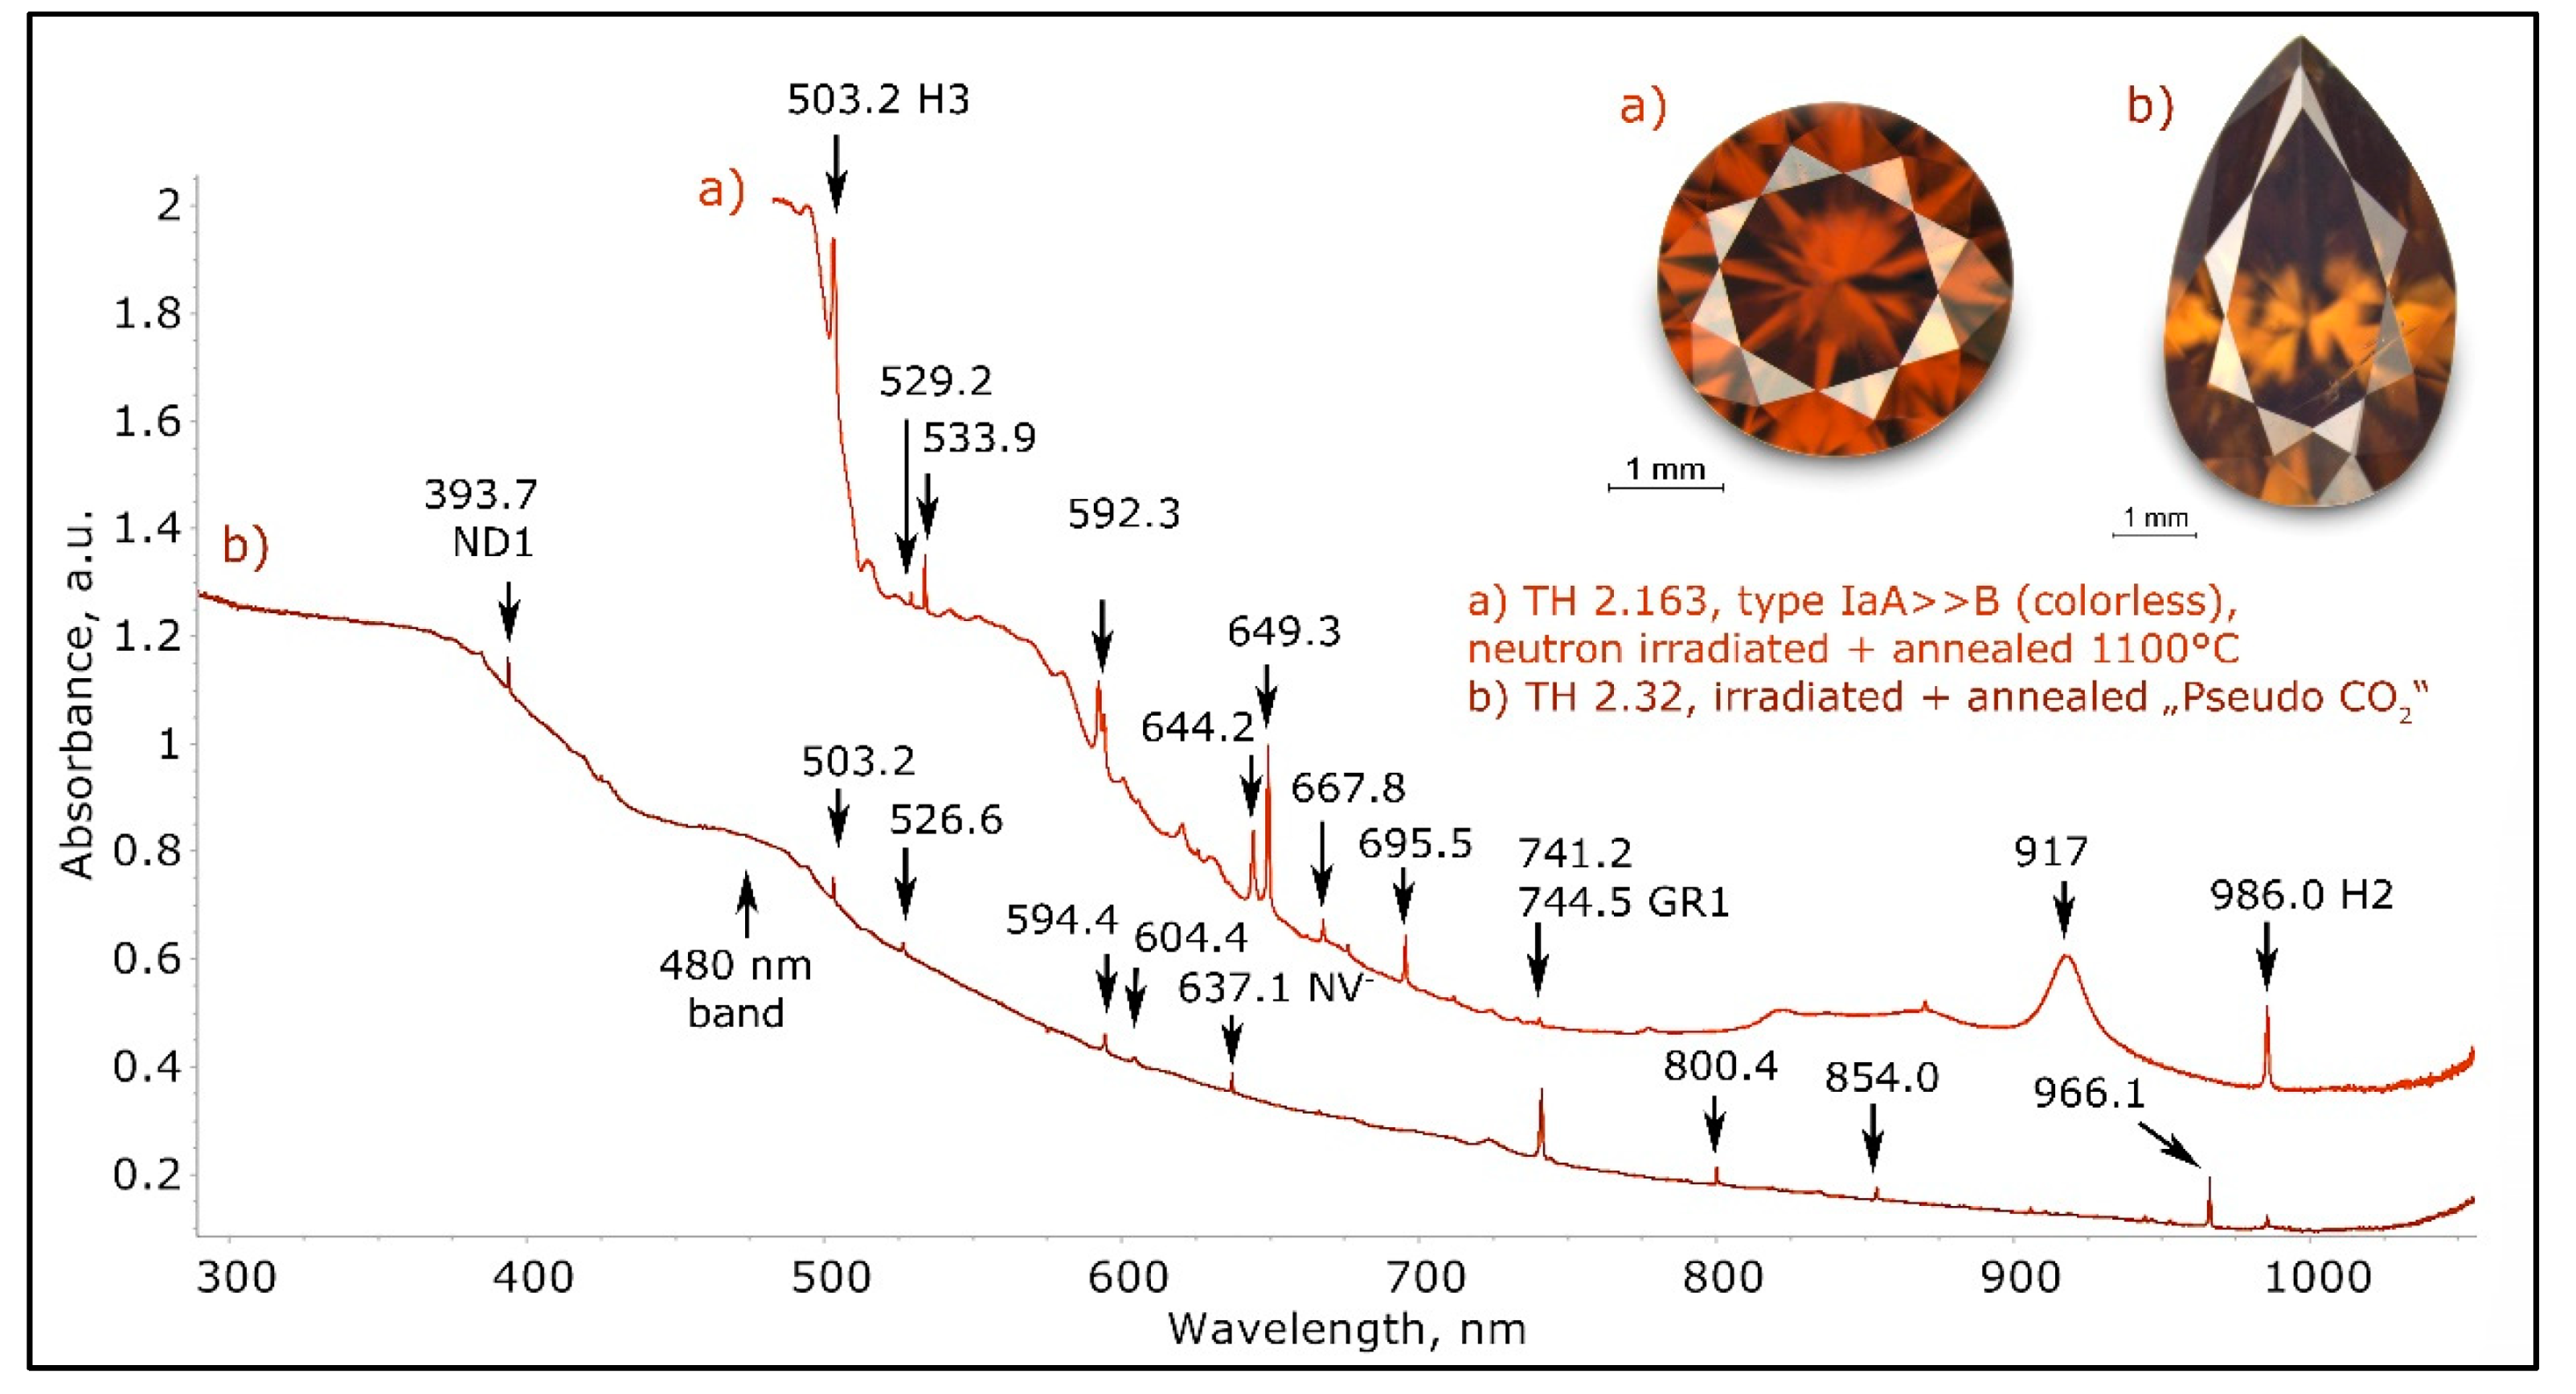
Figure 29.
The low temperature UV-Vis-NIR spectra of two type I brown diamonds with artificial irradiation-related color are shown in this graph. Trace (a) shows the spectrum of a colorless diamond that has been exposed to a large dose of mostly fast neutron irradiation, which turned the stone opaque black; the stone was then heated to 1100 °C for 3 h, which resulted in this deep orange brown color. The strong absorption continuum is the result of the large accumulation of vacancies-cluster-like defects induced by irradiation which—unlike the single vacancies that induce GR1 and ND1—are stable to rather high temperatures. Trace (b) shows what happens when a brown Pseudo-CO2 diamond is irradiated by electrons and heated to 700 °C—it will be mostly brown again after the treatment. Such diamonds are not suitable for any treatment, the results are never satisfactory, as basically such stones are unaffected color-wise. The spectra have been shifted vertically for clarity.
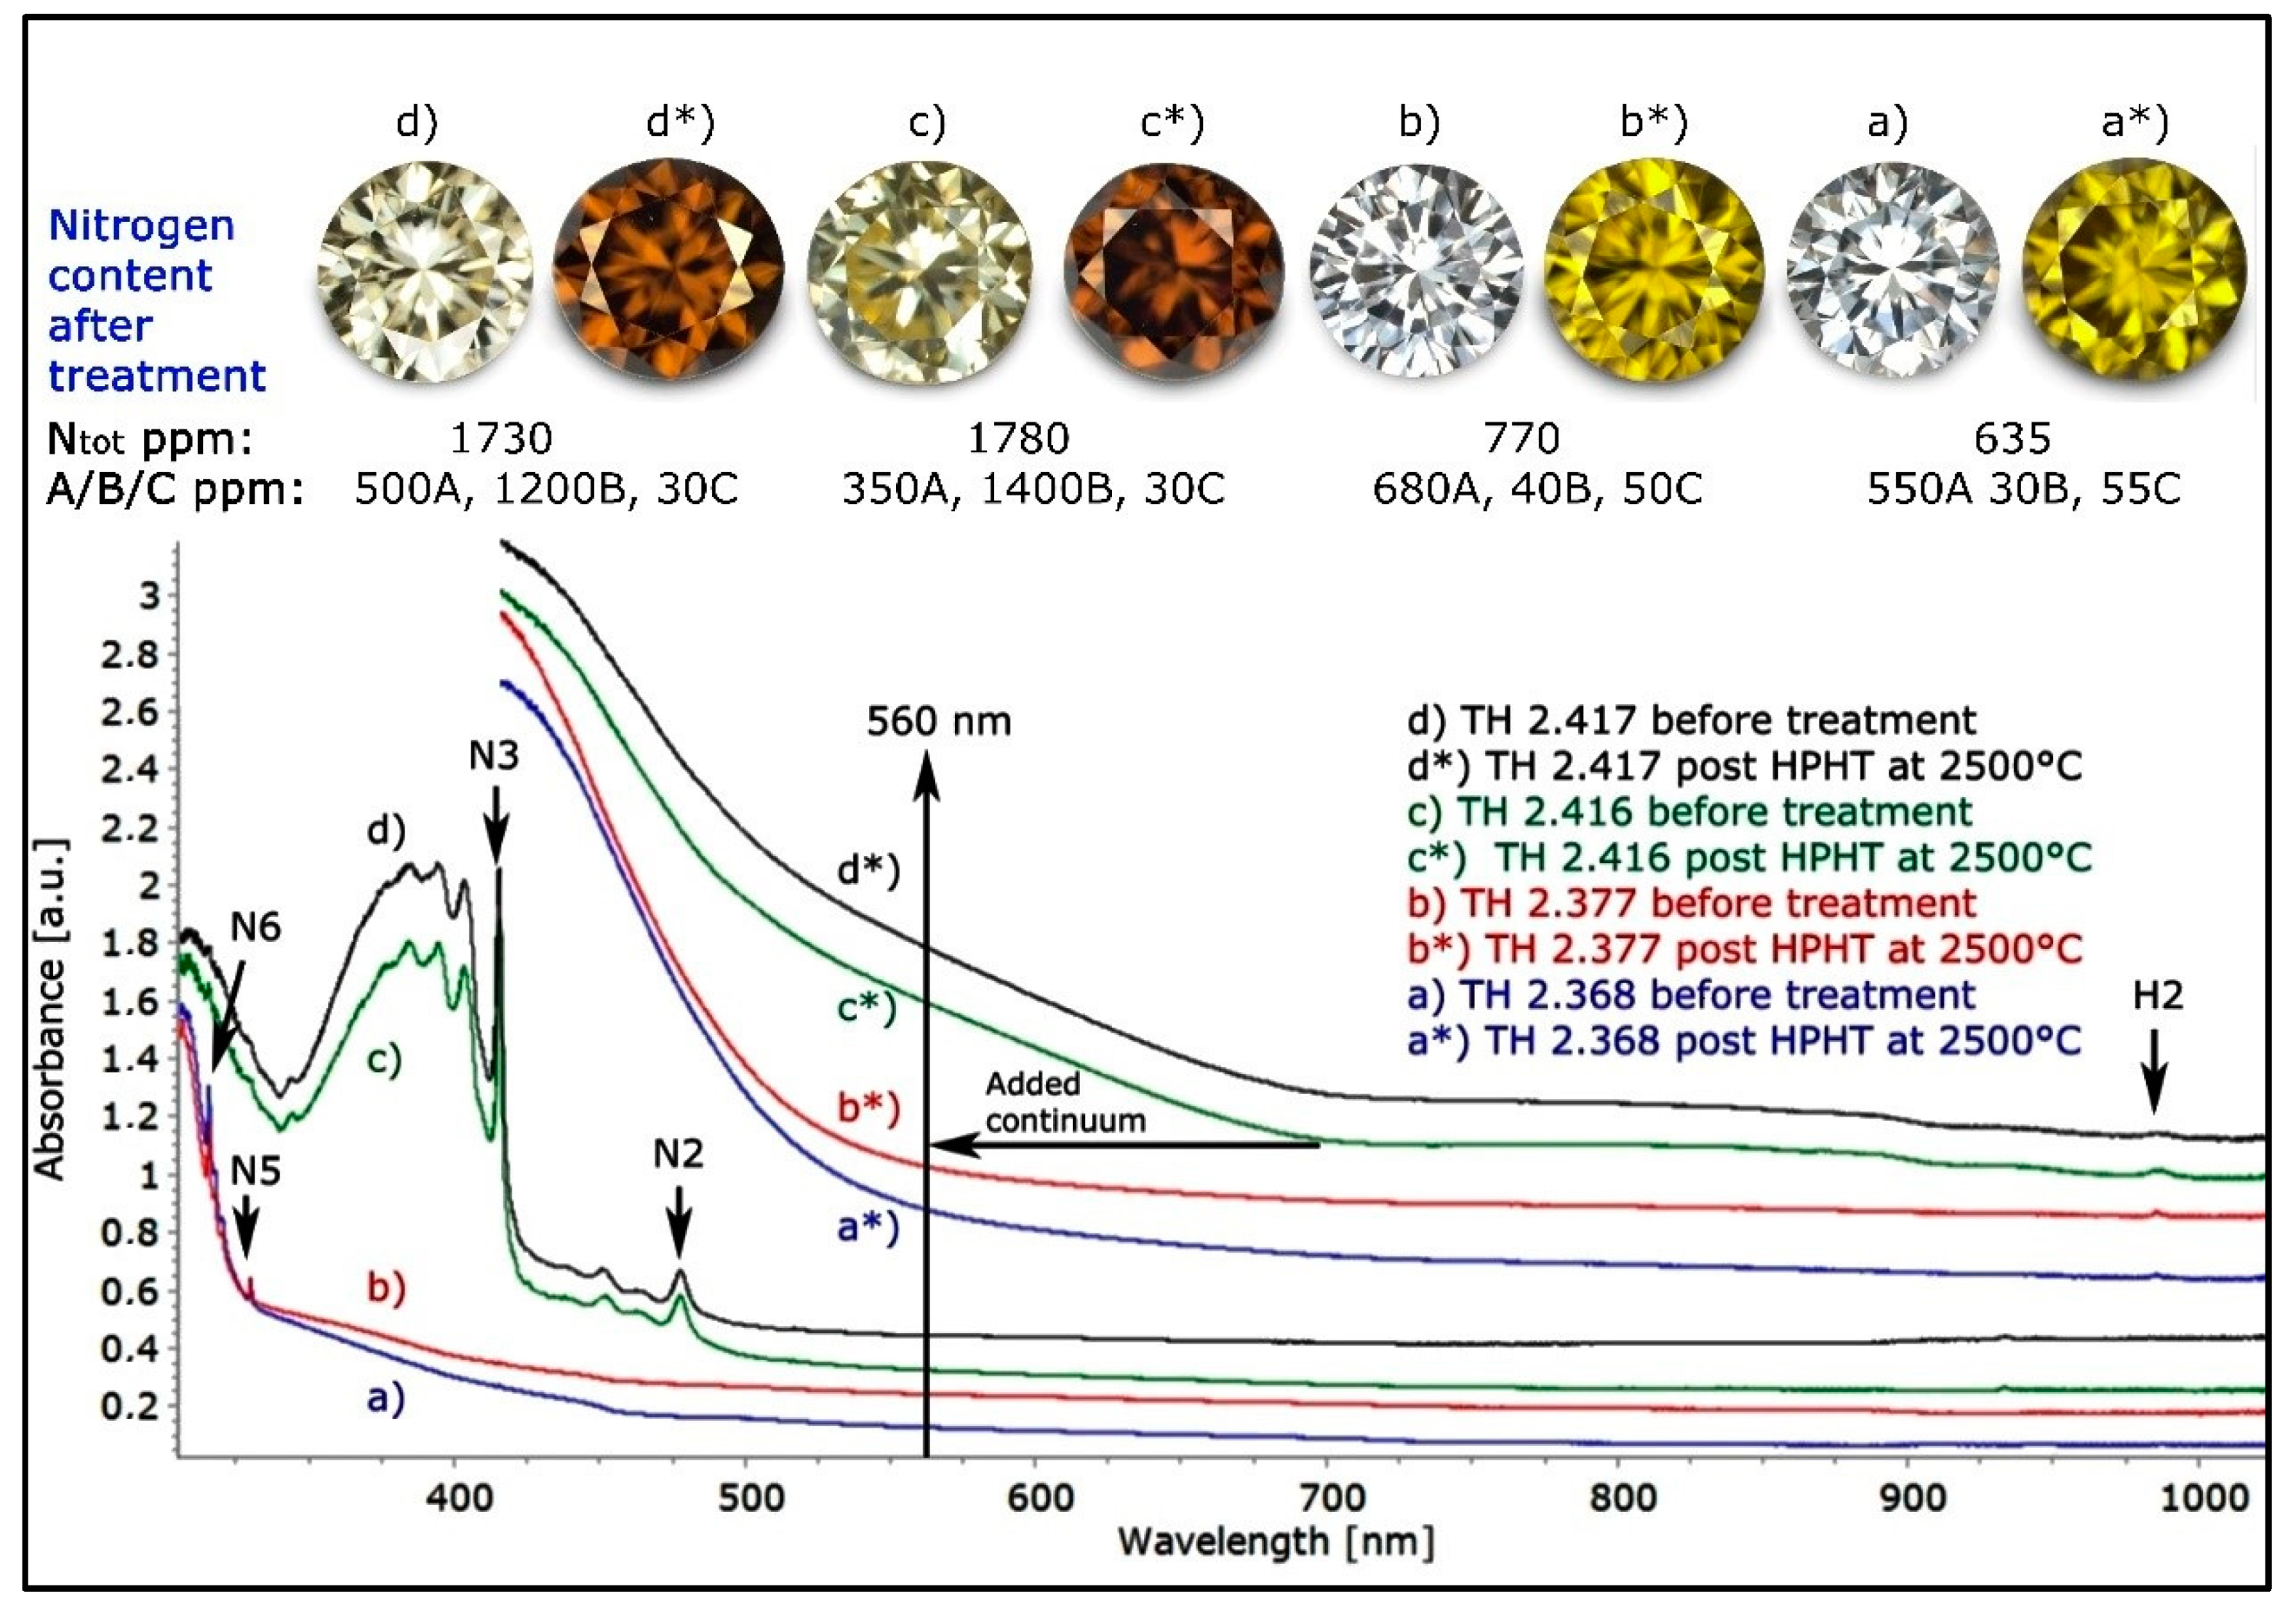
Figure 30.
The low temperature UV-Vis-NIR spectra of four cape type IaAB diamonds that were HPHT processed at 2500 °C. Samples TH 2.416 and TH 2.417 were light yellow before the treatment and turned orangey brown by HPHT while the other two diamonds were perfectly colorless before the treatment and turned vivid yellow by HPHT. The only analytical difference between the diamonds was the relative ratio of A to B aggregates and total nitrogen content, which leads in consequence to the much higher N3 concentration in the yellowish samples. After the treatment the diamonds rich in N3 centers developed the additional continuum absorption starting at 700 nm and neither N3 nor N2 is detectable. The spectra have been shifted vertically for clarity.
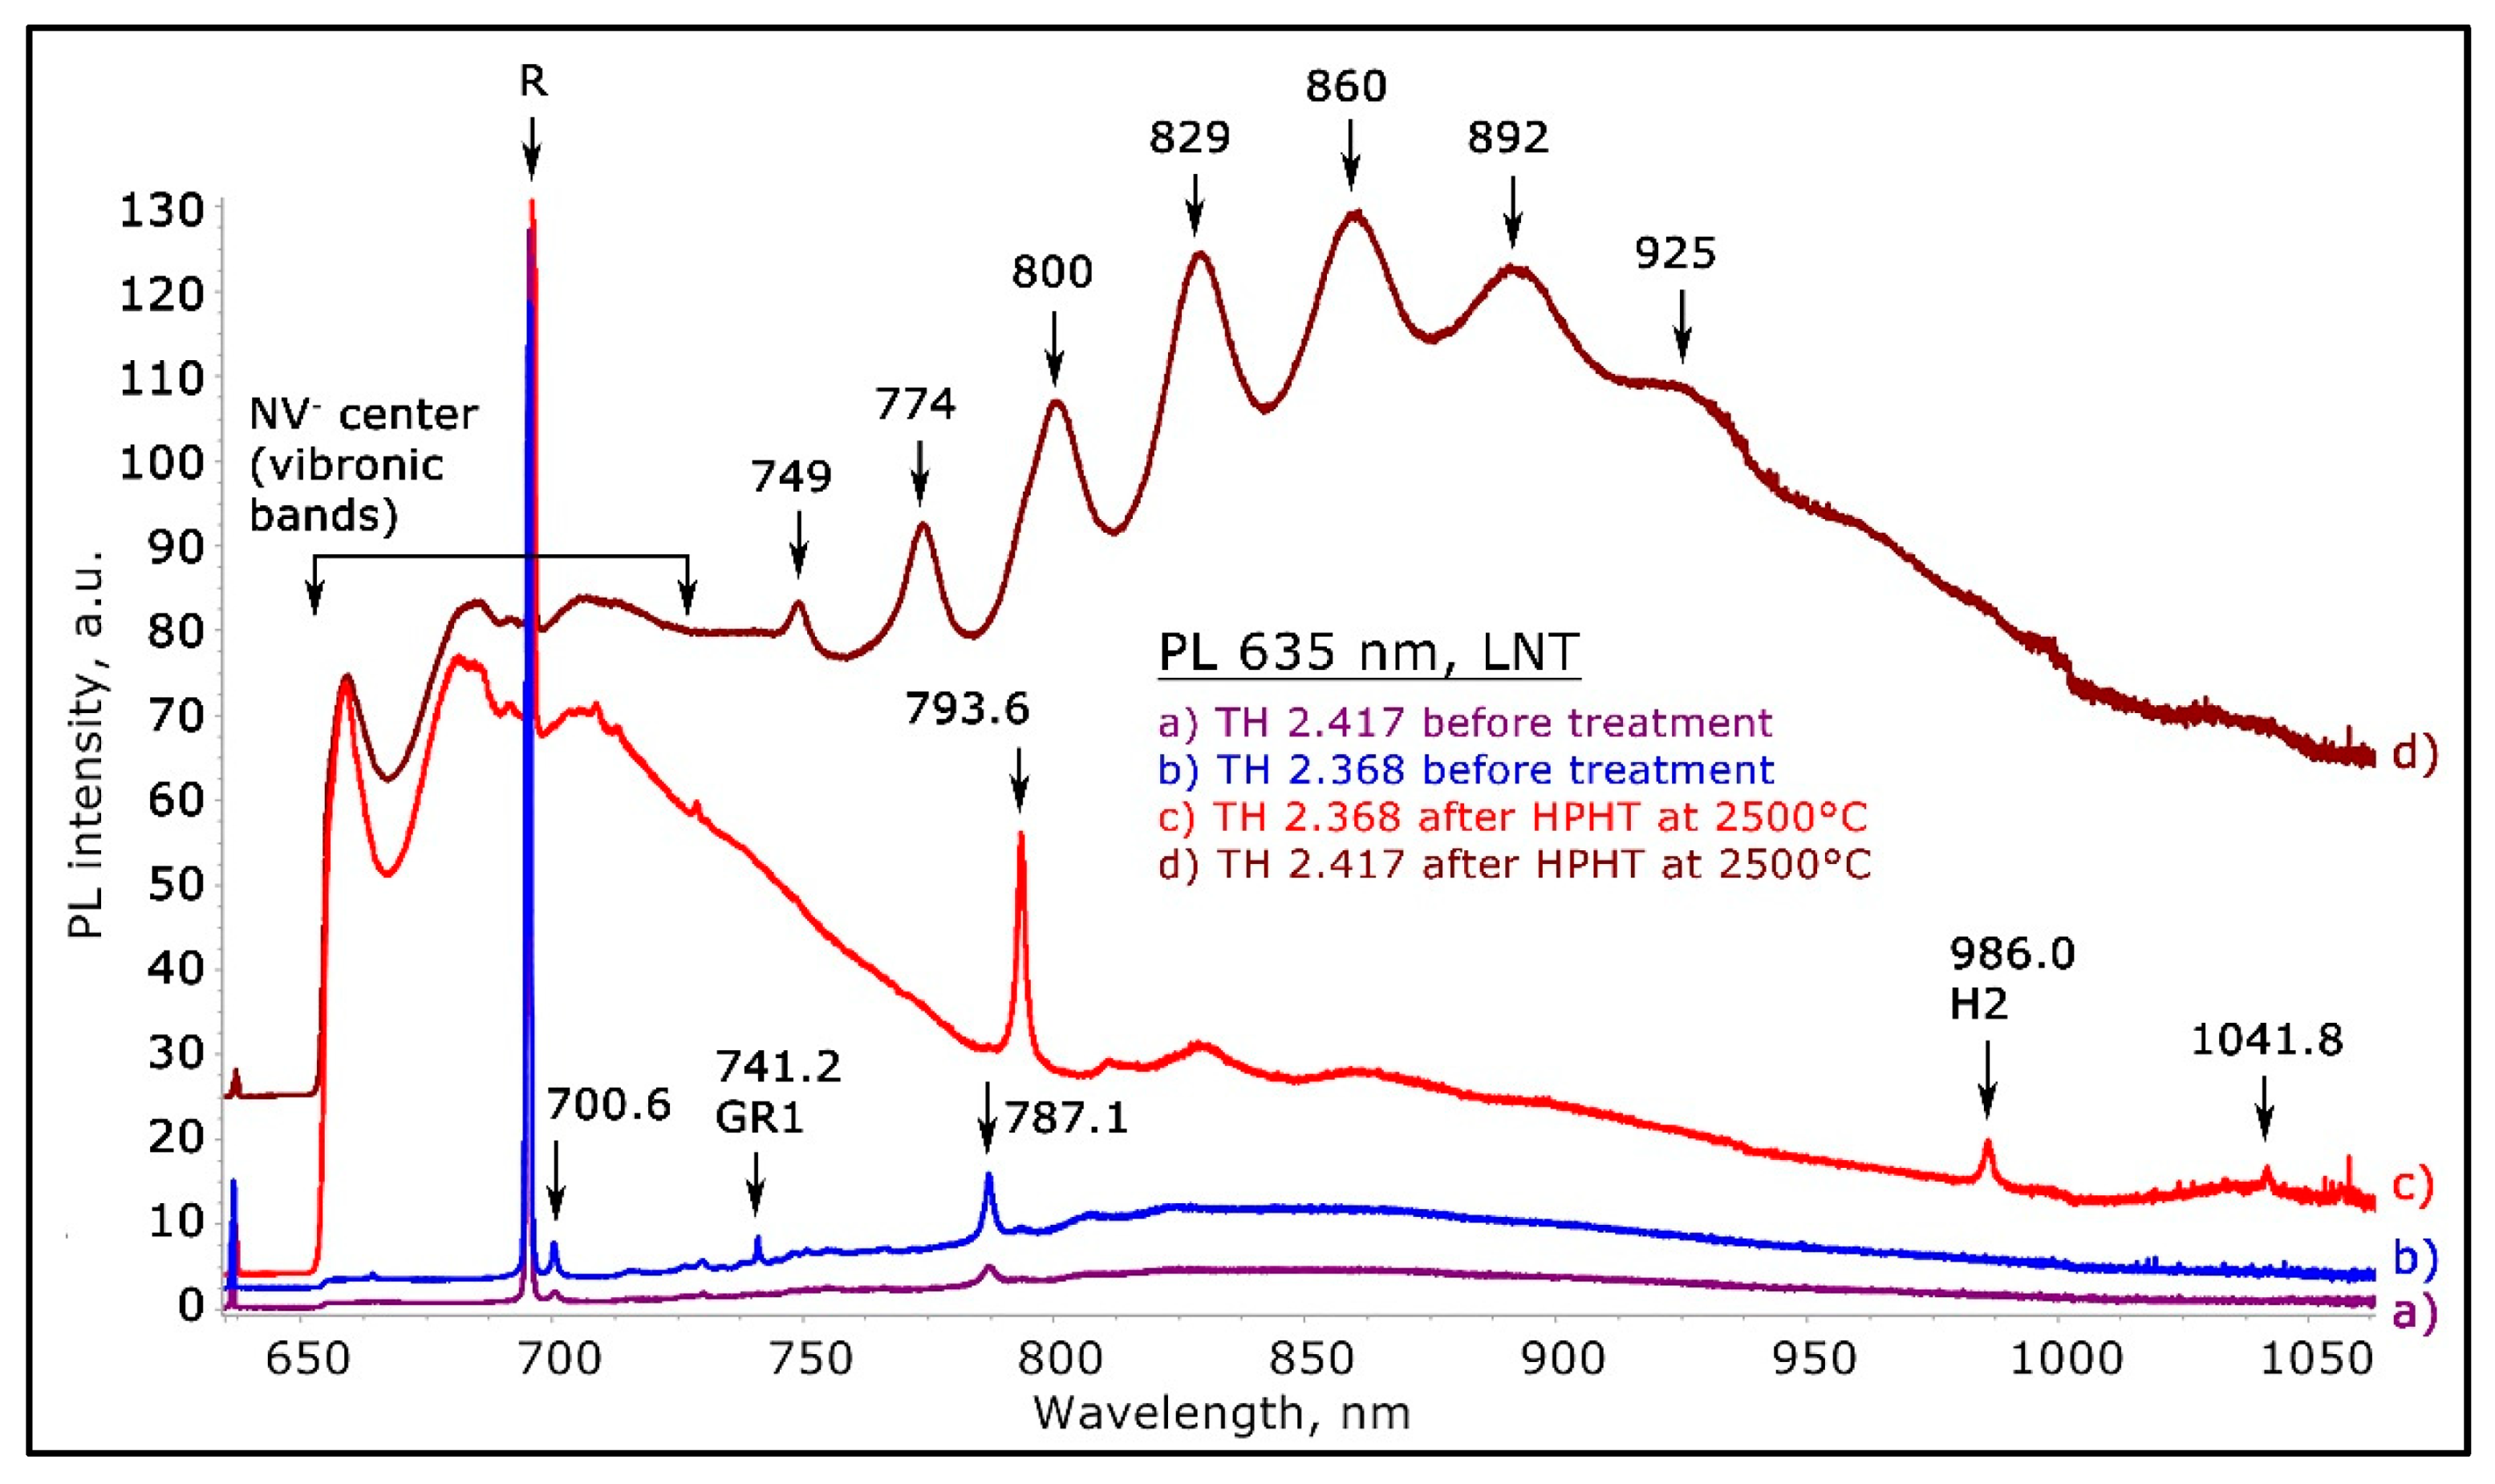
Figure 31.
The low temperature PL spectra of two cape type IaAB diamonds that were HPHT processed at 2500 °C, excited by 635 nm laser. Sample TH 2.417 was light yellow before the treatment and turned orangey brown by HPHT while sample TH 2.368 was perfectly colorless before the treatment and turned vivid yellow by HPHT. While both spectra show the formation of significant NV- center post HPHT annealing, the formation of significant PL with rather broad bands every 25 to 33 nm in the more yellow diamond TH 2.417 is significant. This PL feature is published here for the first time and seems related to the defect formed by annealing the N3 center. The spectra have been shifted vertically for clarity.
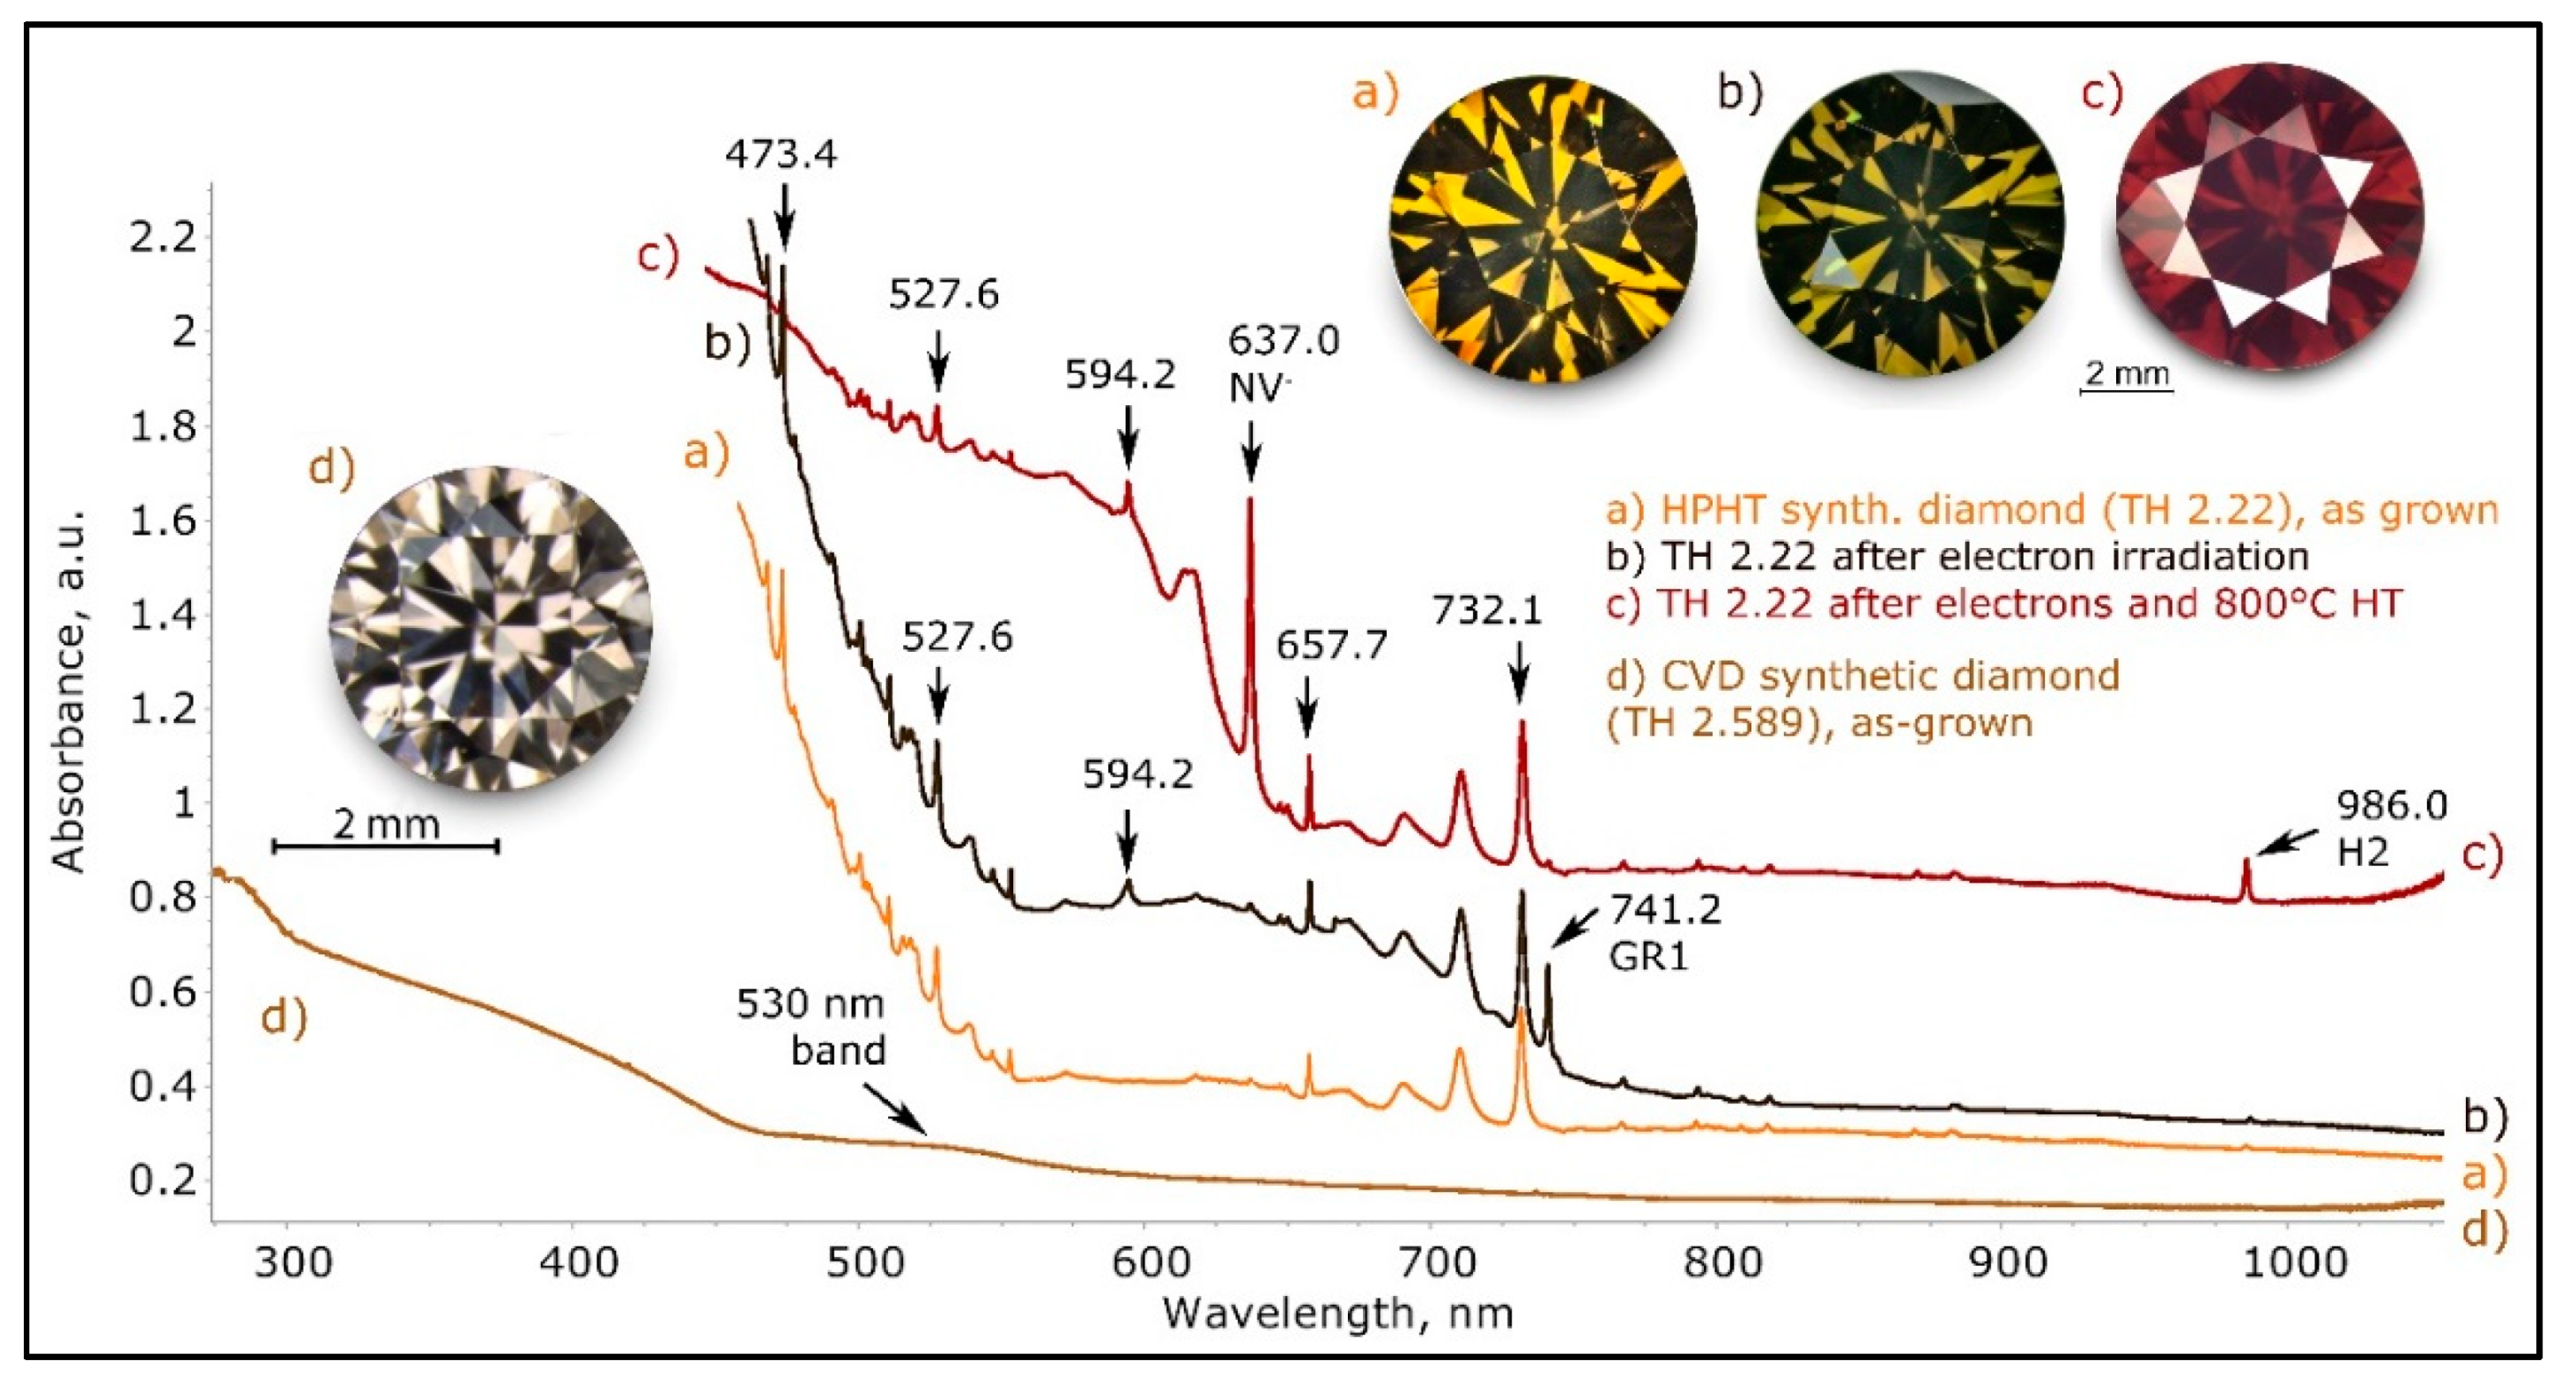
Figure 32.
The low temperature UV-Vis-NIR spectra of an olive brown/red brown type Ib > IaA HPHT (High Pressure High Temperature) synthetic diamond (TH 2.22) and a brown CVD (chemical vapor deposition) synthetic diamond (TH 2.589). The olive brown color in the HPHT synthetic diamond is the result from electron irradiation of the originally overly dark yellow stone. The GR1 absorption overlaying the complex spectrum rich in nickel-related absorptions results in the basically brown color (trace b). Heating this stone at 800 °C for 2 h resulted in the deep red brown color, from the newly formed intense NV- center absorption (trace c). Trace (d) shows the spectrum of an as-grown brown CVD synthetic diamond; the brown color is caused by a featureless continuum, just like many type IIa natural brown diamonds; the only overlaying absorptions visible are a weak broad band at 530 nm and a series of very weak sharp peaks (not indexed). While HPHT synthetic diamonds must be treated to appear brown, CVD synthetic diamonds are often grown brown and need HPHT treatment to decolorize them. The spectra have been shifted vertically for clarity.
![Minerals 10 00914 g032]()
Table 1.
An overview of the samples studied with some of their basic optical and infrared spectroscopic properties.
Table 1.
An overview of the samples studied with some of their basic optical and infrared spectroscopic properties.
| Key: | Sample | Description
Weight | Color | Type | Nitrogen/Boron
Content, ppm (+/−5%) | IR Characteristics | Treatments Performed |
|---|
| NDR CO2 diamond | TH 2.54 | RBC, 0.776 ct | F. pinkish brown | IaA | 240 tot.; 240 A | CO2 (low) | |
| TH 2.67 | RBC, 0.110 ct | F. brownish olive | Undefined | -- | CO2 (medium) | |
| TH 2.69 | RBC, 0.075 ct | F. brown | IaA >> B | 186 tot.; 161 A, 25 B | CO2 (low) | |
| TH 2.71 | Plate, 0.040 ct | F. light brown | IaA > B + undef. | 53 tot.; 38 A, 15 B | CO2 (very high) | |
| TH 2.72 | RBC, 0.053 ct | F.dk. olivish brown | IaAB + undef. | 8 tot.; 6 A, 2 B | CO2 (high) | |
| TH 2.78 | RBC, 0.224 ct | F.dk. olivish brown | IaA >> B + undef. | 15 tot.; 12 A, 3 B | CO2 (very high) | |
| TH 2.93 | RBC, 0.032 ct | F. yellowish brown | IaB > A | 565 tot.; 180 A, 385 B | CO2 (low), H-rich | |
| SGDF-5864 | Slice, 0.056 ct | Brown, “zebra striped” | Undefined | -- | Very low CO2, limit Pseudo CO2 and CO2 | |
| NDR Pseudo CO2 diamond | TH 2.70 | Slice, 0.050 ct | F. brown | Undefined | -- | Pseudo CO2 | |
| TH 2.79 | Slice, 0.045 ct | F. brown | IaA >> B + undef. | 22 tot.; 17 A, 5 B | Pseudo CO2 | |
| TH 2.99 | RBC, 0.049 ct | F.lt. brownish yellow | IaAB + undef. | 15 tot.; 8 A, 7 B | Pseudo CO2 | |
| NDR H-rich diamond | TH 2.49 | Slice, 0.022 ct | F.dk. yellowish brown | Ib > IbXY >> IaA | 197 tot.; 36 A, 144 C, 17 X | H rich | |
| TH 2.327 | RBC, 0.055 ct | F.dp. orange brown | IbXY | 65 tot.; 51 C, 14 X | H rich | |
| TH 2.618 | RBC, 0.161 ct | Light yellow brown (X-Y) | IaA >> B | 1622 tot; 1324 A, 298 B | H rich, NIR structure | |
| TH 2.626 | Slice, 0.279 ct | Brown/near colorless, sectored | IaA >> B | B: 2415 tot; 2115 A, 300 B
C: 2853 tot; 2623 A, 230 B | H rich | |
| Tigers Eye | RBC, 61.56 ct | F.dp. brown yellow | IaA > B | 885 tot.; 530 A, 355 B | H rich, NIR structure | |
| NDR diamond with treated brown color | TH 2.32 | Pear, 0.322 ct | F.dk. yellowish brown.
originally f.dk. brown | Undefined | -- | Pseudo CO2, H1b | Irrad. 2 MeV e-, HT 800 °C |
| TH 2.163 | RBC, 0.109 ct | F.dp. brown orange, originally colorless (F) | IaA >> B | 140 tot.; 132 A, 8 B | H1b, H1c | Irrad. 1.8x10¹⁷ neutrons/cm2, HT 1100 °C |
| TH 2.416 | RBC, 0.068 ct | F. dark orangey brown, originally light yellow | IaB > A | 1730 tot.; 500 A, 1200 B, 30 C | 1660 cm-1 peak | Irrad. 2 MeV e-, HPHT 2500 °C |
| TH 2.417 | RBC, 0.065 ct | F. dark orangey brown,
originally light yellow | IaB >> A | 1780 tot.; 350 A, 1400 B, 30 C | 1660 cm-1 peak | Irrad. 2 MeV e-, HPHT 2500 °C |
| Synthetic diamond | TH 2.22 | RBC, 1.053 ct | F. dp. red brown, originally deep yellow | Ib > IaA, synth. HPHT | 121 tot.; 40 A, 81 C | H1b | Irrad. 2 MeV e-, HT 800 °C |
| TH 2.589 | RBC, 0.164 ct | Light brown (S-T) | IIa, synth. CVD | -- | 7354, 6857, 6425, 5565 cm-1 peaks | -- |
Table 2.
The newly elaborated classification of natural untreated NDR brown diamonds.
Table 2.
The newly elaborated classification of natural untreated NDR brown diamonds.
| | Natural Non-Deformation-Related (NDR) Brown Diamonds |
|---|
| Main Type | Type I and/or Undefined Type | Type I |
|---|
| Sub type | CO2 | Pseudo-CO2 | Type IaAB,
hydrogen-rich | Type IaAB
hydrogen-rich | Type IbXY,
hydrogen-rich |
| AC (RT) | None | None | None | None | None |
| Other characteristic IR features | CO2 peaks, often very uncommon one-phonon absorption | Often very uncommon one-phonon absorption, no CO2 absorption | “Standard” H absorptions—3107, 3237 cm−1
1330 nm center (LNT) | Cuboid-growth related H absorptions in brown sectors: 3050, 3124, 3139, 3144, 3154, 3310, 3474 cm−1, 1330 nm center (LNT) very weak or undetectable | Very complex band with multiple H-related absorptions, 3309–2741 cm−1, linked to Y center. |
| Characteristic PL feature | Complex 690 nm band, 882.9/884.6 (Nii+) | 521.2 to 527.4, 700.6,
787.0, 793.6 nm | 496.6 (S3), 787.0, 793.6 nm | 904.2, 692.0, 689.3, 698.0 nm |
| Characteristic UV-Vis-NIR features | Absorption continuum from NIR to the UV, 480 nm band | Complex spectrum caused by 1330 nm center and 990 nm series | Absorption continuum from NIR to the UV | Absorption continuum from NIR to the UV, 904.2 nm defect |
| Class name | CO2 NDR brown diamond | Pseudo-CO2 NDR brown diamond | “1330 nm center“ hydrogen- rich NDR brown diamond | “3310 cm−1 defect” hydrogen- rich NDR brown diamond | Hydrogen-rich type IbXY NDR brown diamond |


