Article

Chemical Treatment of Highly Toxic Acid Mine Drainage at A Gold Mining Site in Southwestern Siberia, Russia

1
Trofimuk Institute of Petroleum Geology and Geophysics, Siberian Branch of the Russian Academy of Sciences, Koptug ave. 3, 630090 Novosibirsk, Russia
2
Sobolev Institute of Geology and Mineralogy, Siberian Branch of the Russian Academy of Sciences, Koptug ave. 3, 630090 Novosibirsk, Russia
3
Geological and Geophysical Faculty, Novosibirsk State University, Pirogova str. 2, 630090 Novosibirsk, Russia
*
Author to whom correspondence should be addressed.
Minerals 2020, 10(10), 867; https://doi.org/10.3390/min10100867
Submission received: 21 August 2020 / Revised: 23 September 2020 / Accepted: 29 September 2020 / Published: 30 September 2020

Abstract

:
The critical environmental situation in the region of southwestern Siberia (Komsomolsk settlement, Kemerovo region) is the result of the intentional displacement of mine tailings with high sulfide concentrations. During storage, ponds of acidic water with incredibly high arsenic (up to 4 g/L) and metals formed on the tailings. The application of chemical methods to treat these extremely toxic waters is implemented: milk of lime Ca(OH)2, sodium sulfide Na2S, and sodium hydroxide NaOH. Field experiments were carried out by sequential adding pre-weighed reagents to the solutions with control of the physicochemical parameters and element concentrations for each solution/reagent ratio. In the experiment with Ca(OH)2, the pH increased to neutral values most slowly, which is contrary to the results from the experiment with NaOH. When neutralizing solutions with NaOH, arsenic-containing phases are formed most actively, arsenate chalcophyllite Cu18Al2(AsO4)4(SO4)3(OH)24·36H2O, a hydrated iron arsenate scorodite, kaatialaite FeAs3O9·8H2O and Mg(H2AsO4)2. A common specificity of the neutralization processes is the rapid precipitation of Fe hydroxides and gypsum, then the reverse release of pollutants under alkaline conditions. The chemistry of the processes is described using thermodynamic modeling. The main species of arsenic in the solutions are iron-arsenate complexes; at the end of the experiments with Ca(OH)2, Na2S, and NaOH, the main species of arsenic is CaAsO4, the most toxic acid H3AsO3 and AsO43−, respectively. It is recommended that full-scale experiments should use NaOH in the first stages and then Ca(OH)2 for the subsequent neutralization.

1. Introduction

Minimizing the influence of toxic components in acid mine drainage (AMD) and acid rock drainage (ARD) has been a widely discussed topic in the scientific literature since the 1990s [1,2,3,4,5,6,7,8,9]. Along with the use of natural materials as sorbents, including zeolites [10,11], clay minerals [12,13], plant materials [14], charcoal ash [15] and iron and aluminum oxides [16], to extract various elements from solutions are offered. Other various modified and induced sorbents include aluminosilicates, ferrocyanide sorbents based on hydrated titanium dioxide, resins, organosilicon ion-exchange and complex-forming sorbents and cementitious materials [17,18,19,20]. Different approaches for the precipitation of metals and metalloids from AMD solutions have been applied, such as the use of zero-valent iron [21], a pulsed limestone bed treatment system minimizing armor formation [22], and alkaline industrial wastes [23]. Currently, the focus is on two directions of the tailings problem: (1) prevention methods; and (2) secondary mineral processing of mine waste [24].
Highly mineralized acid drainage solutions are extremely toxic for the environment; they have to be treated, making a neutral pH and the removal of metal and metalloids necessary to reduce potential hazards [
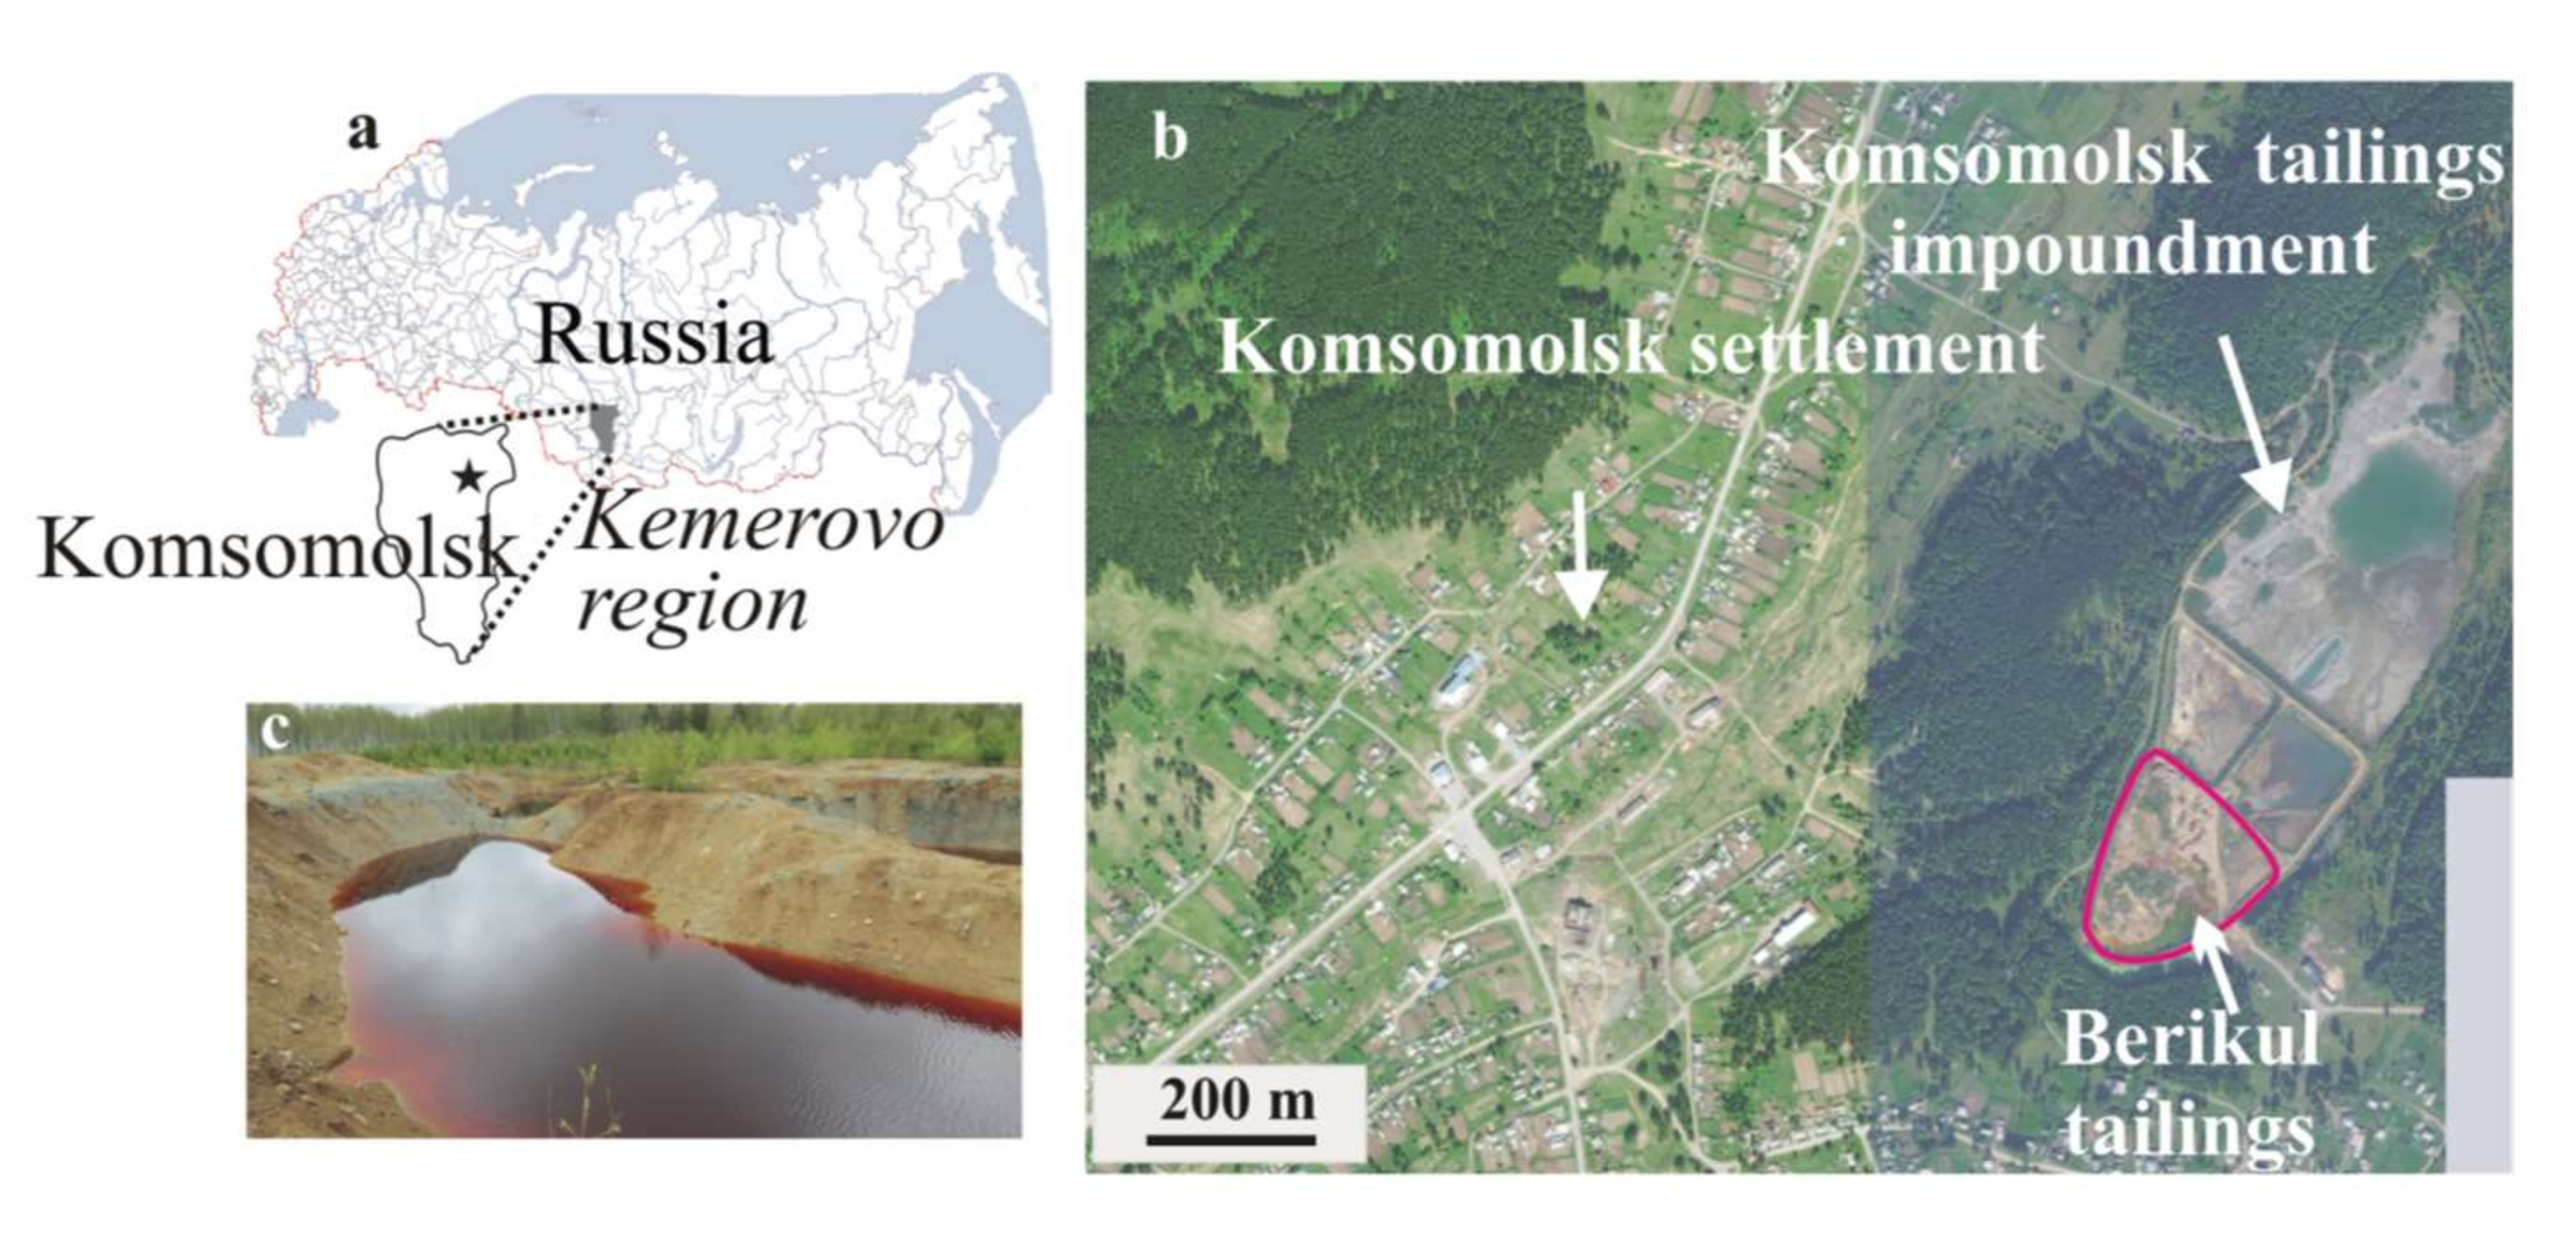
25]. Nevertheless, the critical environmental situation in the industrial region of southwestern Siberia (Kemerovo region) is the result of the intentional displacement (for reprocessing) and uncontrolled storage for 16 years (due to inexpediency) of the cyanide leaching tailings with high sulfide and arsenic concentrations. Ponds of acidic water with extremely high concentrations of arsenic (up to 4 g/L) and metals are formed on the surface of the solid tailings.
Limestone or portlandite has been used for the neutralization of drainage solutions of different composition and acidity [25]. These lime neutralizers in case of H2SO4 precipitate gypsum (CaSO4 2H2O) and passivate the surface. This indicates that alternatives could be needed.
Igarashi et al. [26] assert that AMD or ARD neutralization is effective but unsustainable in the long term. Estimation of the number of years required for metals in AMD from abandoned tailings dams to decrease below maximum permissible concentrations (MPC) has been done [27]. The authors of the reactive-transport model have estimated that the formation of AMD and release of Zn will persist for a thousand years. Igarashi et al. [27] introduced a technique for AMD management, where acid solution with high concentrations of Zn, Cu, and As was treated using a laboratory setup of ferrite flow.
An alternative AMD processing method is the alkaline barium calcium desalination. Both sulfate and metals were reduced below the MPC. The interesting thing about this technology is that low levels of sludge are disposed after useful chemicals are recovered from AMD [28,29].
The precipitation of metal sulfides, the solubility and stability of the sulfide ion, and its complexes with metals were reported by Lewis and Hille [30]. A great attention has been paid to the precipitation of metal sulfides from AMD and saturated leach solutions [31]. These authors conclude, “notwithstanding and irrespective of the source of sulfide, metallic sulfide precipitation has many challenges. Further research is needed to address these issues”.
A fractional precipitation process was conducted to precipitate metals from the AMD [32]. With the help of four-step precipitation, AMD was treated to World Health Organization (WHO) requirements. Detoxification of zinc plant leach residues from Kabwe, Zambia has been performed by removing Pb, using a coupled extraction-cementation method in chloride media [33].
Special attention is devoted to the removal of arsenic from acidic and alkaline drainage, due to its high toxicity and mobility [34,35,36,37,38]. The formation of ferric arsenate, or a Fe/Al arsenate phase, as well as strong adsorption of As to Fe-oxyhydroxides/oxides have limited its mobility at low pH conditions [3]. The initial step in the extraction of As from solution is the oxidation of trivalent arsenic to pentavalent arsenic to remove it in one stable form [39,40]. To do this, they use hydrochemical neutralization with lime, resulting in the formation of svabite Ca5(AsO4)3F [41,42], sulfide precipitation [43,44], coprecipitation with iron and formation of scorodite FeAsO₄·2H2O [45,46], bacterial deposition [47,48] and various sorbents [49,50,51]. As(V) in acidic solutions (pH 3–4) can be removed effectively by synthesized schwertmannite [52], biomineralization [53] and scorodite precipitation [54,55]. Besides, As mobility can be decrease via sorption reactions with carbonates and/or gypsum [56,57]. However, the arsenic problem is far from being resolved now.
For example, Yuan et al. [51] investigated the effect of pH on fast As removal from AMD containing high arsenic. The authors studied Fe/As molar ratio, oxygen flow rate, temperature, initial As concentration and the action of reagents (NaOH vs. Ca(OH)2). The mechanisms of solid precipitation, including As removal, were deeply discussed. This study provides further evidence on the speciation of As and its distribution in Fe(II/III)-As(III/VI)-S(II/VI) aqueous and solid systems, which affects the fate of arsenic. To date, there is no better summary of arsenic mineralogy than [58].
In this article, we presented a case study for both acidic solutions neutralization and metal precipitation from a highly mineralized tailings pond water, based on the addition of Ca(OH)2, Na2S, and NaOH in the field. From a geochemical point of view, according to the mechanism, the reagents act as precipitating Ca(OH)2, reducing Na2S, and neutralizing NaOH barriers. Actually, Ca(OH)2 is also a neutralizing reagent, and NaOH may trigger metal precipitation as well; therefore, this difference is conditional for convenience. The above references show the relevance of this case study for a broader international audience. This means that current techniques like chemical neutralization should be improved to facilitate the better and more sustainable management of AMD solutions. In our study, we focus on (1) the optimal S/R ratio for the precipitation of elements during a sequential decrease of its variable; (2) identification of the mineral species of elements formed during neutralization; and (3) description of the chemistry of the water-rock interactions by thermodynamic modeling. Our task was to develop a quick and cheap way to prevent in situ the influence of toxic solutions, within the limits of the population’s habitat.

2. Materials and Methods

2.1. Study Area

The object of the study was to find highly mineralized solutions from ponds on the surface of displaced tailings after the cyanide leaching of the sulfide flotation concentrate from the Berikul gold extracting plant (BGEP), Figure 1.
In 2004, the tailings were transported and stored in the southern part of the Komsomolsk tailings impoundment [59]. After 2004, ponds were formed by seasonal precipitation on top of the displaced Berikul tailings. The volume and configuration of the ponds changed seasonally. The pond water has a brownish-black to light red color. Interactions with highly oxidized tailings led to the formation of the current hydrochemical composition of the solutions. The solutions of the ponds are acidic, and ultra-acidic solutions with extremely high concentrations of many chemical elements, such as arsenic, are the main danger. The arsenic maximum concentration reached 4 g/L. A detailed description of the compositions of the ponds and solutions is provided in a previous article [59]. Based on the measured volume of the ponds and the mean concentration of arsenic in the solutions, the calculated amount of dissolved arsenic is 80–120 kg. The existence of open ponds with highly toxic solutions within the village boundaries raised concerns about their neutralization and precipitation of elements. Since there are no sorbents applicable for the extraction of elements with such high mineralization (Table 1), the precipitation of elements was carried out using chemical bonding technology, with three common reagents: Ca(OH)2, Na2S and NaOH.
Chemical treatment is used as a method for the deep purification of industrial wastewater. The processes of the binding of elements and their precipitation in the form of newly formed phases were studied by field experiments, which did not require the transportation and storage of the solutions.

2.2. Methods and Used Reagents

Field batch tests on the interaction of mine drainage with the three chemical barriers were carried out in the same regime under ambient conditions. To select a solution for the experiments, samples were taken from different ponds. The electrical conductivity and pH were measured in situ, and the most acidic saline solution, Ber-1 (pH 2.1), was chosen for the experiment. To allow the initial composition of the solution to be identical in all experiments, a larger aliquot for the experiments was taken with a polyethylene bucket, which was previously rinsed three times at the sampling site. Then, a sample for analysis (Ber-1/0) was taken from the bucket, and 1 L of the solution was poured into polyethylene bottles and covered with lids. Different amounts of reagents (Table 2) were added sequentially to 1 L of this solution to fix the alkaline conditions.
We used the following reagents: 1) industrial milk of lime (Ca(OH)2; JSC “Iskitimcement”, Iskitim, Novosibirsk region, Russia); 2) chemically pure dry sodium sulfide (Na2S; JSC “Lenreaktiv”, Sankt-Petersburg, Russia); and 3) chemically pure dry sodium hydroxide (NaOH; JSC “Ekos”, Moscow, Russia).
The total mass of the chemical reagents required to achieve an alkaline pH and the masses of the sequential portions of the reagents were previously calculated based on the stoichiometry of the main reactions, and on the concentration of the elements in the drainage solution. We thoroughly manually mixed the portion of the reagent with 1 L of Ber-1/0 solution in the polyethylene bottle. Then, the solutions were allowed to settle for 20 min, and the following parameters were determined in situ in the clarified solution: pH, Eh, and electrical conductivity (EC). The pH and Eh values were determined using the Expert 001 pH/ion-meter (JSC “Ekoniks-Expert”, Moscow, Russia). The EC values were measured using a Cond 315i/SET device (JSC “Wissenschaftlich Technische Werkstatten GmbH”, Weilheim, Germany), with automatic temperature compensation and a TetraCon 325 sensor.
An aliquot of 5 mL of the clarified solution was filtered through a membrane filter with a 0.45 µm pore diameter (CC “Vladipor”, Vladimir, Russia) in a plastic tube, and then it was acidified with 100 μL of chemically pure distilled concentrated HNO3 acid, to determine the elemental composition according to [60]. Concentrations of major, minor, and trace elements in the water samples were determined using inductively coupled plasma mass spectrometry (ELAN-9000 DRC-e, Perkin Elmer, Shelton, USA) in the certified Chemical Analytical Center “Plasma” (Tomsk, Russia). Accuracy and precision were estimated to be 7% or better at the mg/L concentration level and 10% or better at the µg/L concentration level. Reference standard material (RSM) used in the quality control of the ICP-MS analytical results of liquids is certified wastewater—Trace metals solution (CWW-TM-D, High Purity Standards, Charleston, USA). All measurements were conducted in three replicates (n = 3) for each element. After reaching neutral and alkaline pH values, the experiment was completed, the last portion of the solution was sampled, the rest of the solution was decanted, and the precipitates were dried at room temperature.
Next, the dried precipitates were homogenized, and the mineralogical composition was determined using X-ray spectral and X-ray diffraction analyses in the IGM SB RAS, Novosibirsk. Individual grains were selected to determine the mineralogical composition. A study of the morphology and composition of the grains was carried out with the scanning electron microscope MIRA3 LMU (TESCAN ORSAY HOLDING, Brno-Kohoutovice, Czech Republic), with an energy dispersive attachment Inca-Energy 450 XMax 80 (Oxford Instruments-NanoAnalysis, High Wycombe, UK).
The numerical experiment completely simulated the composition of the initial solution and the addition of the corresponding amount of reagents in grams. In the output file, the equilibrium pH values, Eh values and supersaturation of the solution and composition of solid phases were recorded. The equilibria in the heterophase 20-component system H-O-C-S-N-Ca-Mg-Na-K-Fe-Al-Mn-Sr-As-Sb-Cu-Zn-Pb-Ba-P were calculated at 25 °C, under a total pressure of 1 atm and a partial CO2(gas) pressure of 10−3.5 atm, using the HCh (HydroChemistry) software, based on the principle of minimization of the thermodynamic potential of the system (Gibbs free energy) and the UNITHERM thermodynamic database [61].
We compared the experimental solutions composition and the water chemistry obtained using HCh modeling of each-step solutions supersaturation after adding the reagents. The objective was to determine if the observed concentrations of major cations (Ca, Mg, K, Na), As and metals can be reached by the precipitation of the various minerals. The mineralogy of the precipitates was modeled with the suite of minerals from the extended UNITHERM database. The model is adequate, while small differences in details are due to the fact that (a) there are no thermodynamic data for a number of minerals, for example, chalcophyllite, (b) the experiment solid-solutions system does not always achieve complete thermodynamic equilibrium, (c) the mineral composition was determined only after the experiment, and not during the step-by-step addition of each reagent, as in calculations.

3. Results

3.1. Precipitation Experiment with Ca(OH)2

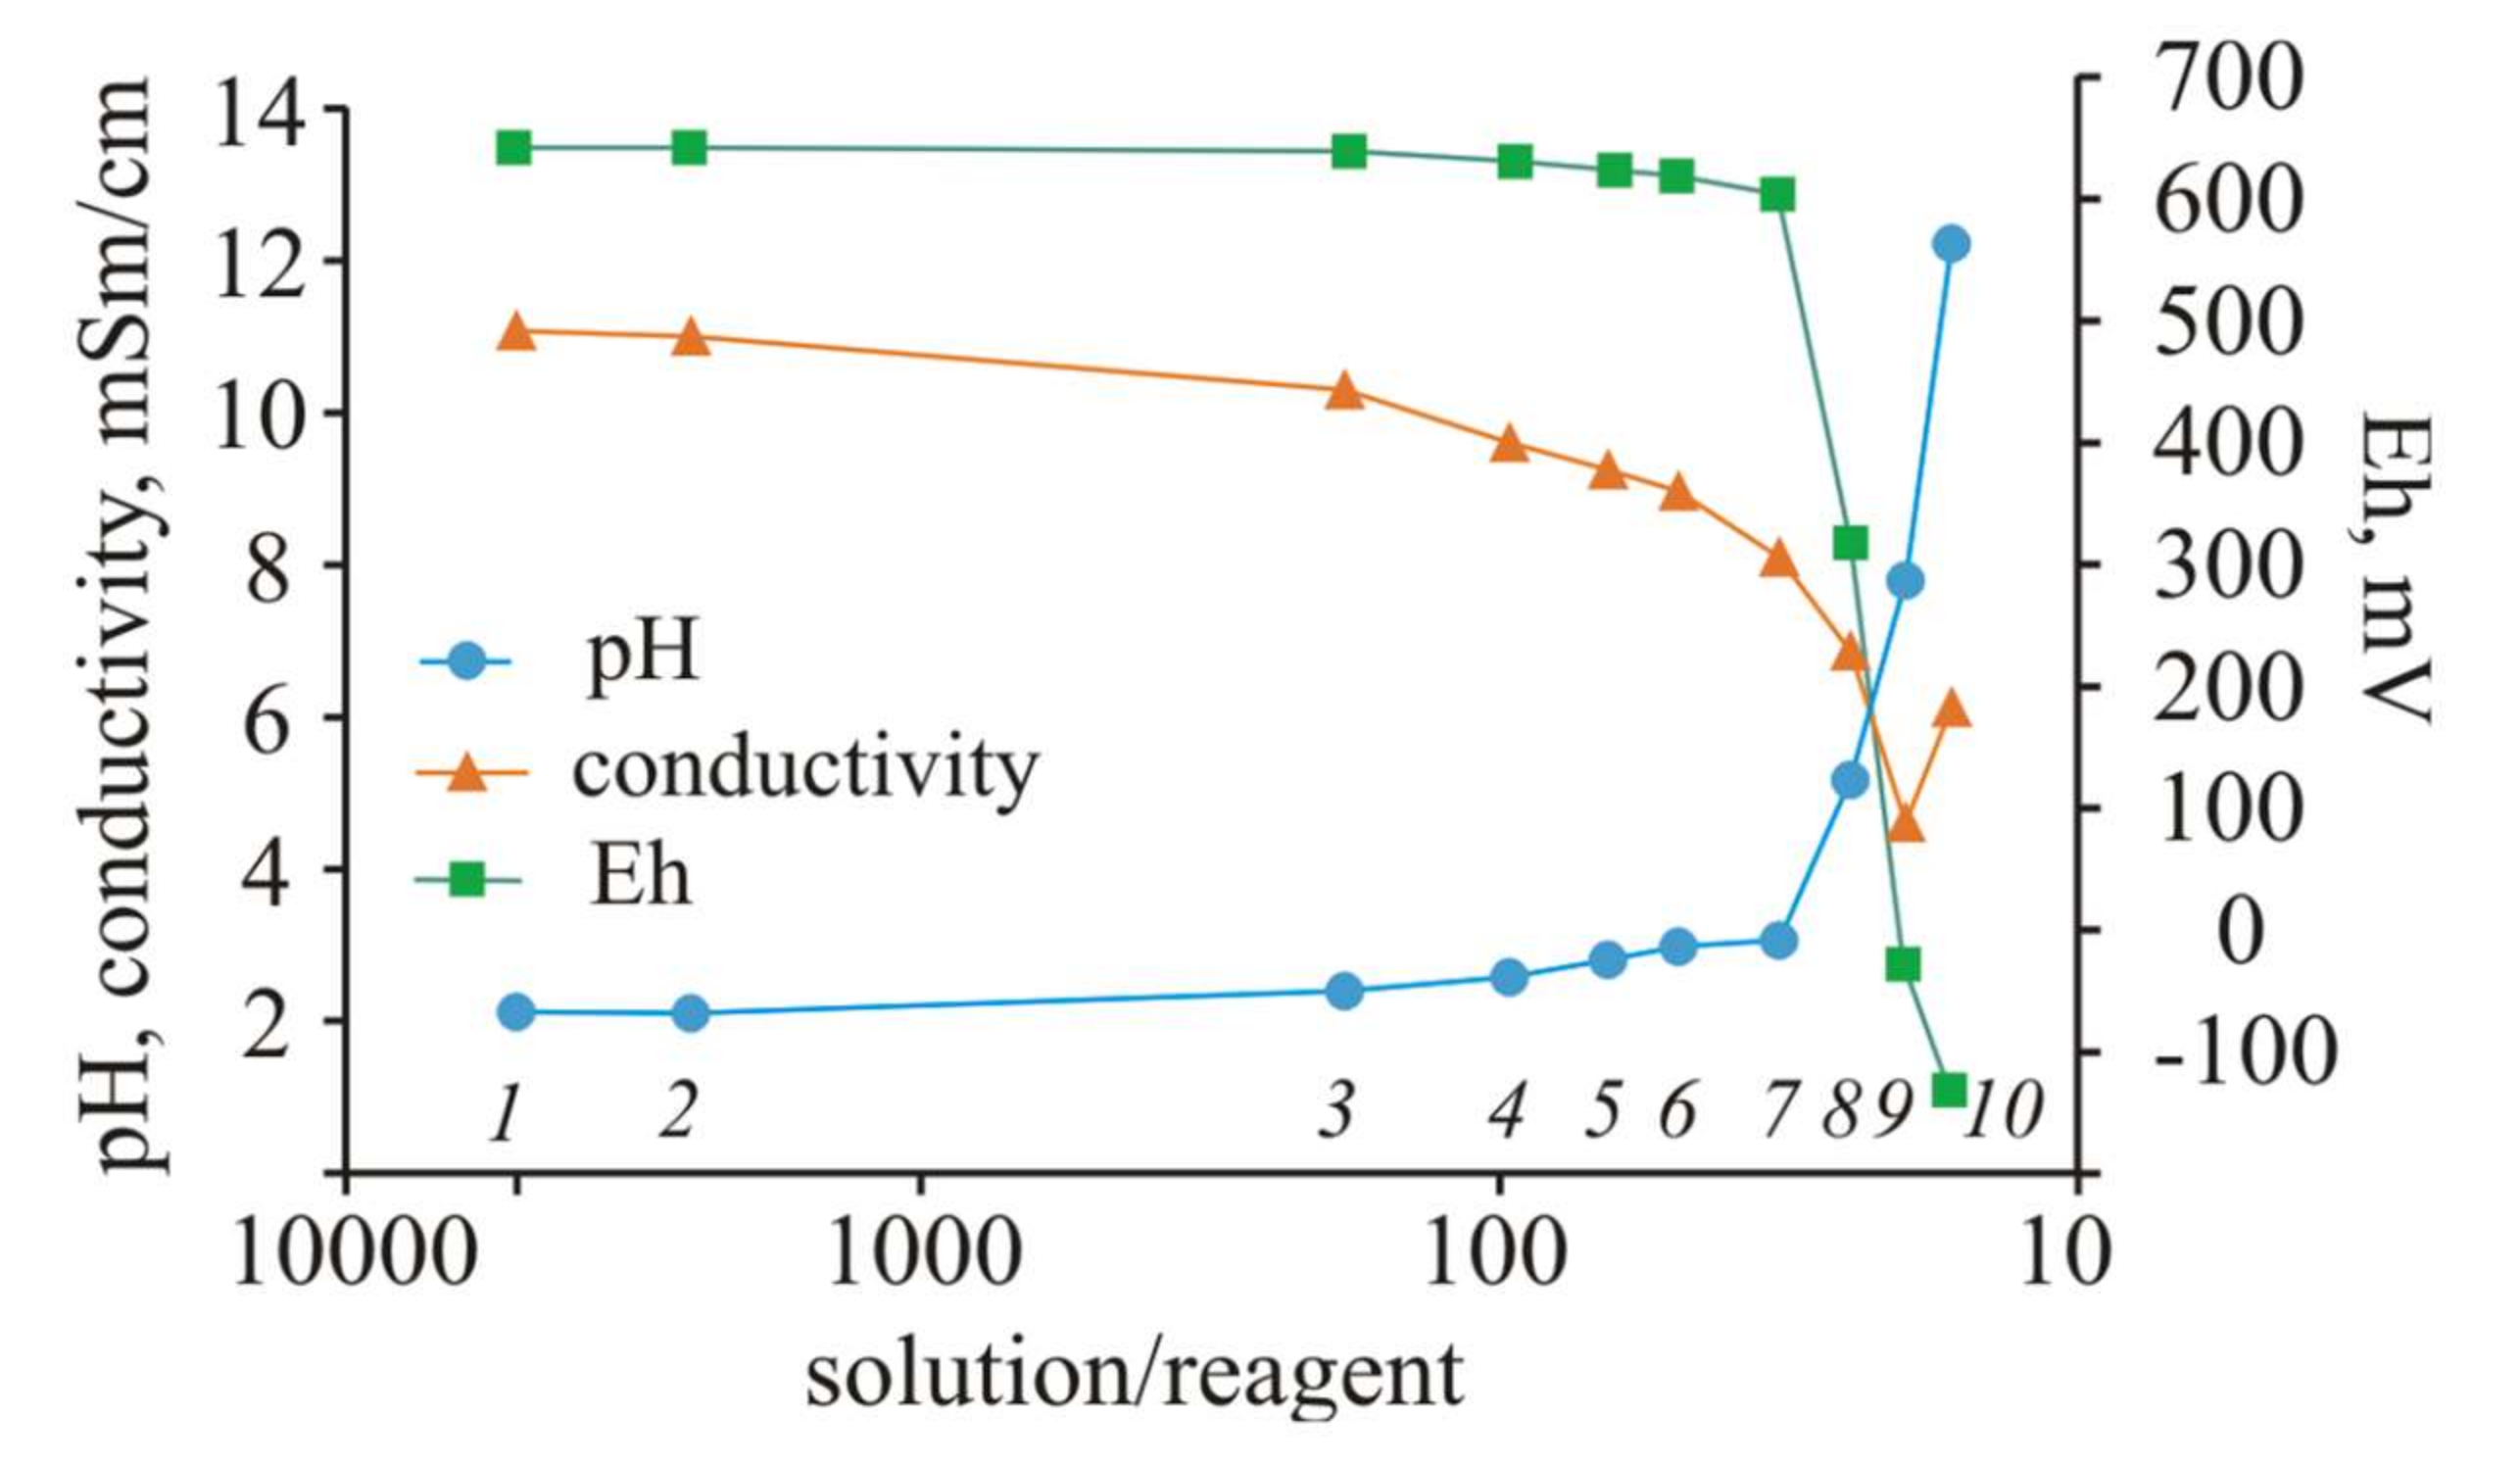
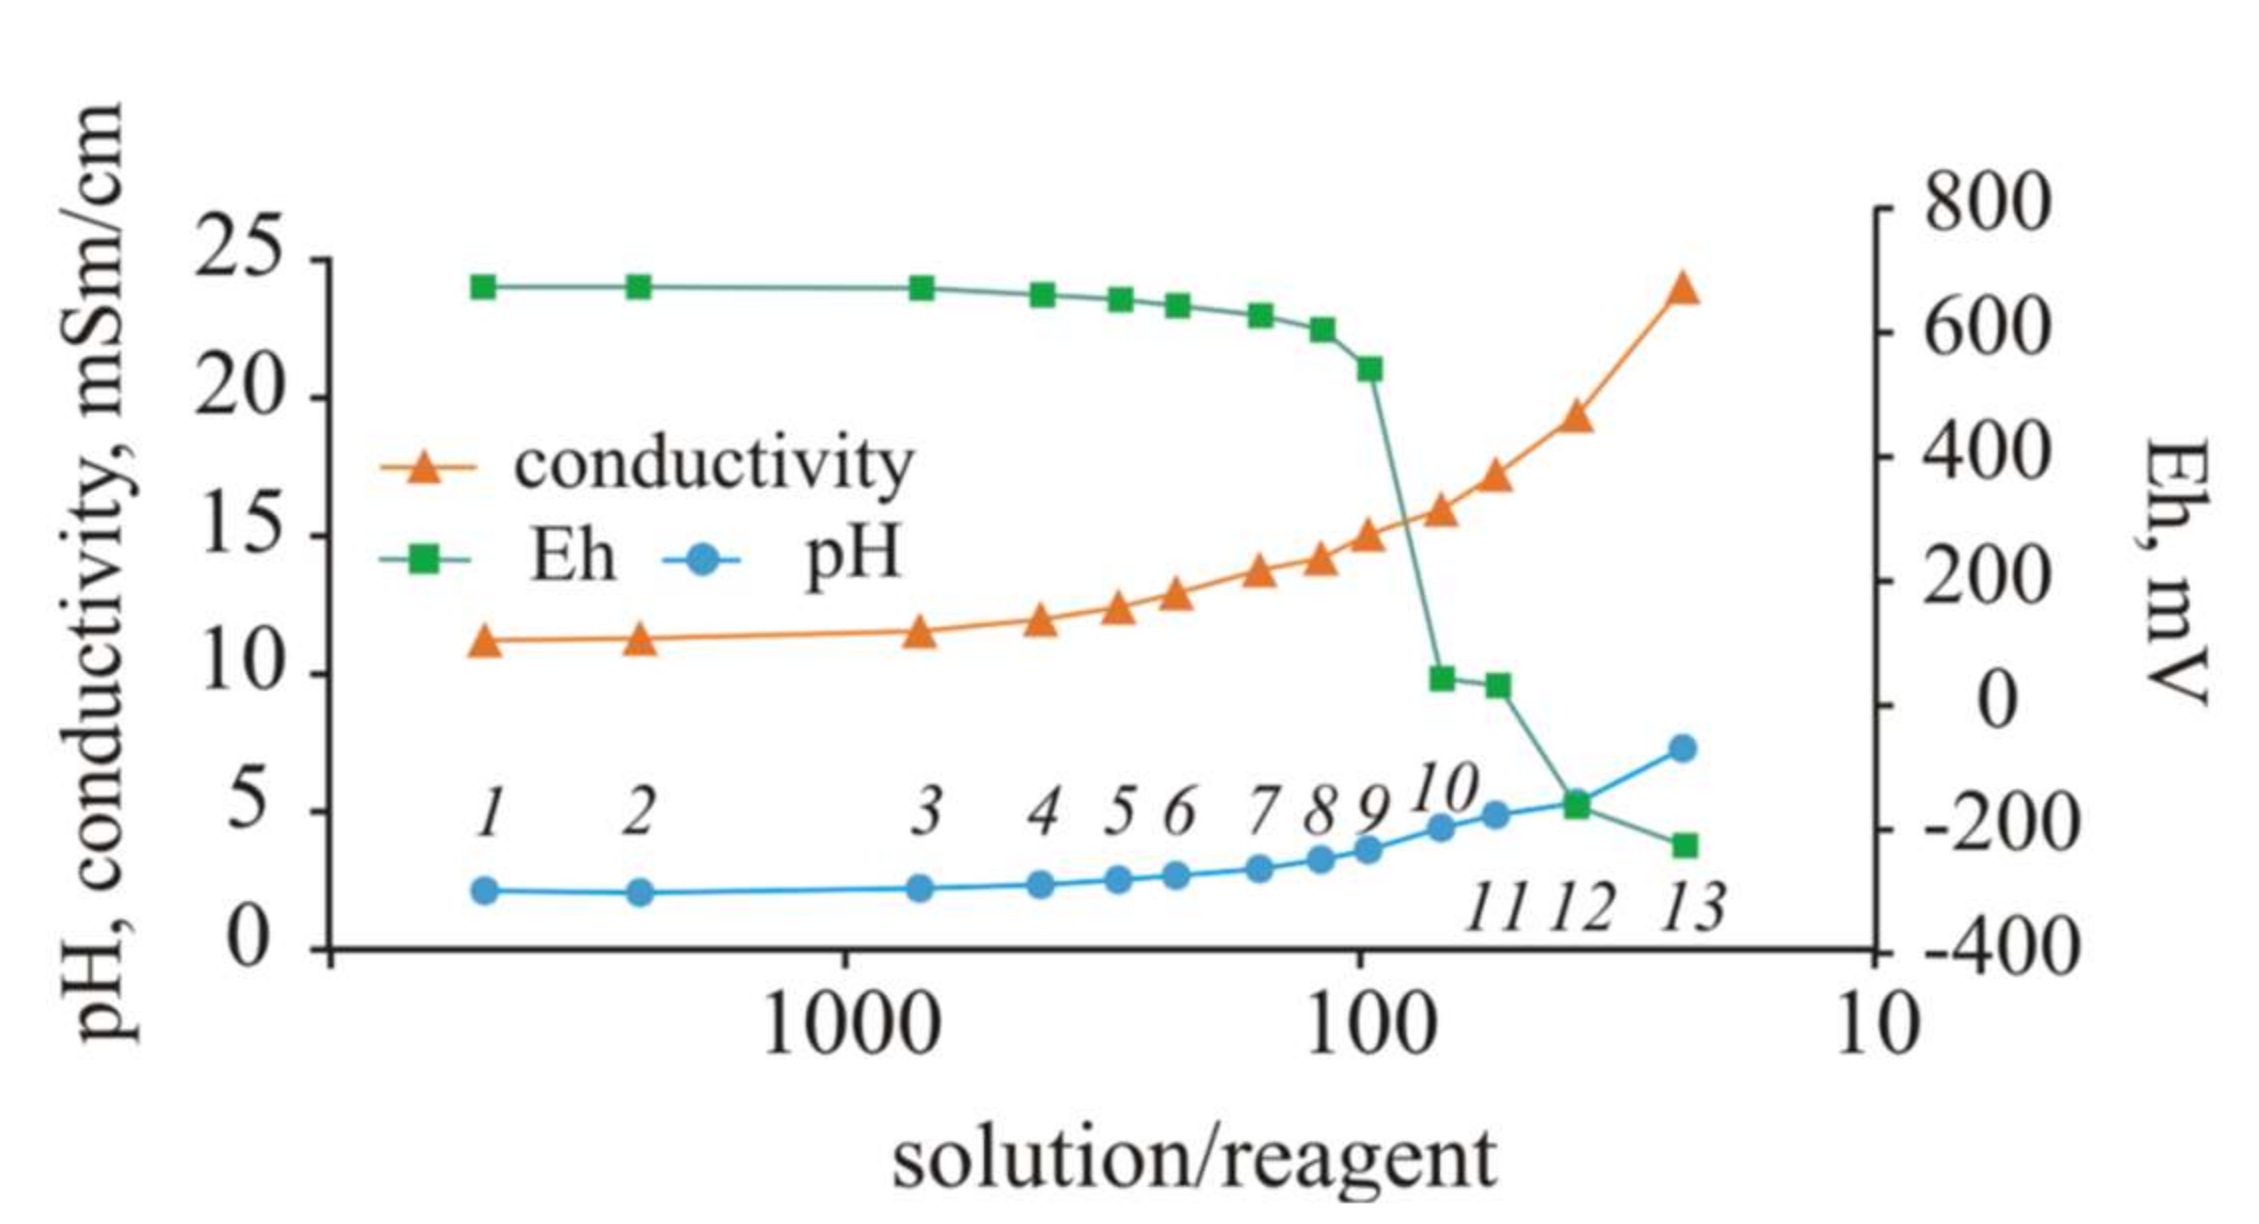
A change in the pH values during the experiment indicates a large buffer capacity of the solution with the initial pH = 2.1. The pH values increased by only 1 unit when S/R = 33 (30 g of Ca(OH)2 was added, Figure 2).
A noticeable increase in pH to 5.17 occurred when 40 g of reagent was added to the initial solution with a volume of 1 L (S/R = 25). In the next steps of the experiment, the acidity of the solution began to decrease sharply. At S/R = 20, the pH increased to 7.79, and at the end of the experiment, when 60 g of Ca(OH)2 was added to the solution (S/R = 17), the pH increased sharply to 12.22.
The pH value increased during the experiment, whereas the EC, reflecting the total mineralization of the solution, gradually decreased to the ratio S/R = 20 (pH = 7.79), due to the precipitation of the Ca-containing solid phases. This phenomenon is evidenced by the stable Ca concentrations in the solution throughout the experiment, despite the gradual addition of Ca(OH)2. However, at the last step of the experiment (pH = 12.22), the electrical conductivity sharply increased by 1.5 mSm/cm, which indicates the leaching of elements into the solution. This result is not unexpected, since alkaline solutions are very aggressive. The Eh in the first seven steps of the experiment changed from 657 to 619 mV; in step No. 8, the Eh decreased to 333 mV and became negative in the last two subsequent steps (−13 and −116 mV).
The pH value increased during the experiment, whereas the EC, reflecting the total mineralization of the solution, gradually decreased to the ratio S/R = 20 (Ph = 7.79), due to the precipitation of the Ca-containing solid phases. This phenomenon is evidenced by the stable Ca concentrations in the solution throughout the experiment, despite the gradual addition of Ca(OH)2. However, at the last step of the experiment (pH = 12.22), the electrical conductivity sharply increased by 1.5 mSm/cm, which indicates the leaching of elements into the solution. This result is not unexpected, since alkaline solutions are very aggressive. The Eh in the first seven steps of the experiment changed from 657 to 619 mV; in step No. 8, the Eh decreased to 333 mV and became negative in the last two subsequent steps (−13 and −116 mV).
According to the Nernst equation [62], the dependence of Eh-pH suggests such a coherent change. However, we note that, in ponds exposed to the atmosphere, the Eh value is only 657 mV, which indicates that the potential-determining system is most likely the pair Fe2+/Fe(OH)3(s), since the initial concentration of iron is 8600 mg/L (Table 1). Thus, the process can be divided into two main stages: S/R = 33 (a slight increase in pH) and S/R = 25-20-17 (a total of 60.4 g of Ca(OH)2 was added), Equations (1)–(3):
Fe2+ + 2H2O = Fe(OH)2 + 2H+
Fe3+ + 3H2O = Fe(OH)3(s)↓ + 3H+
2Fe(OH)2 + 0.5O2 + 2H2O = 2Fe(OH)3 + H2O
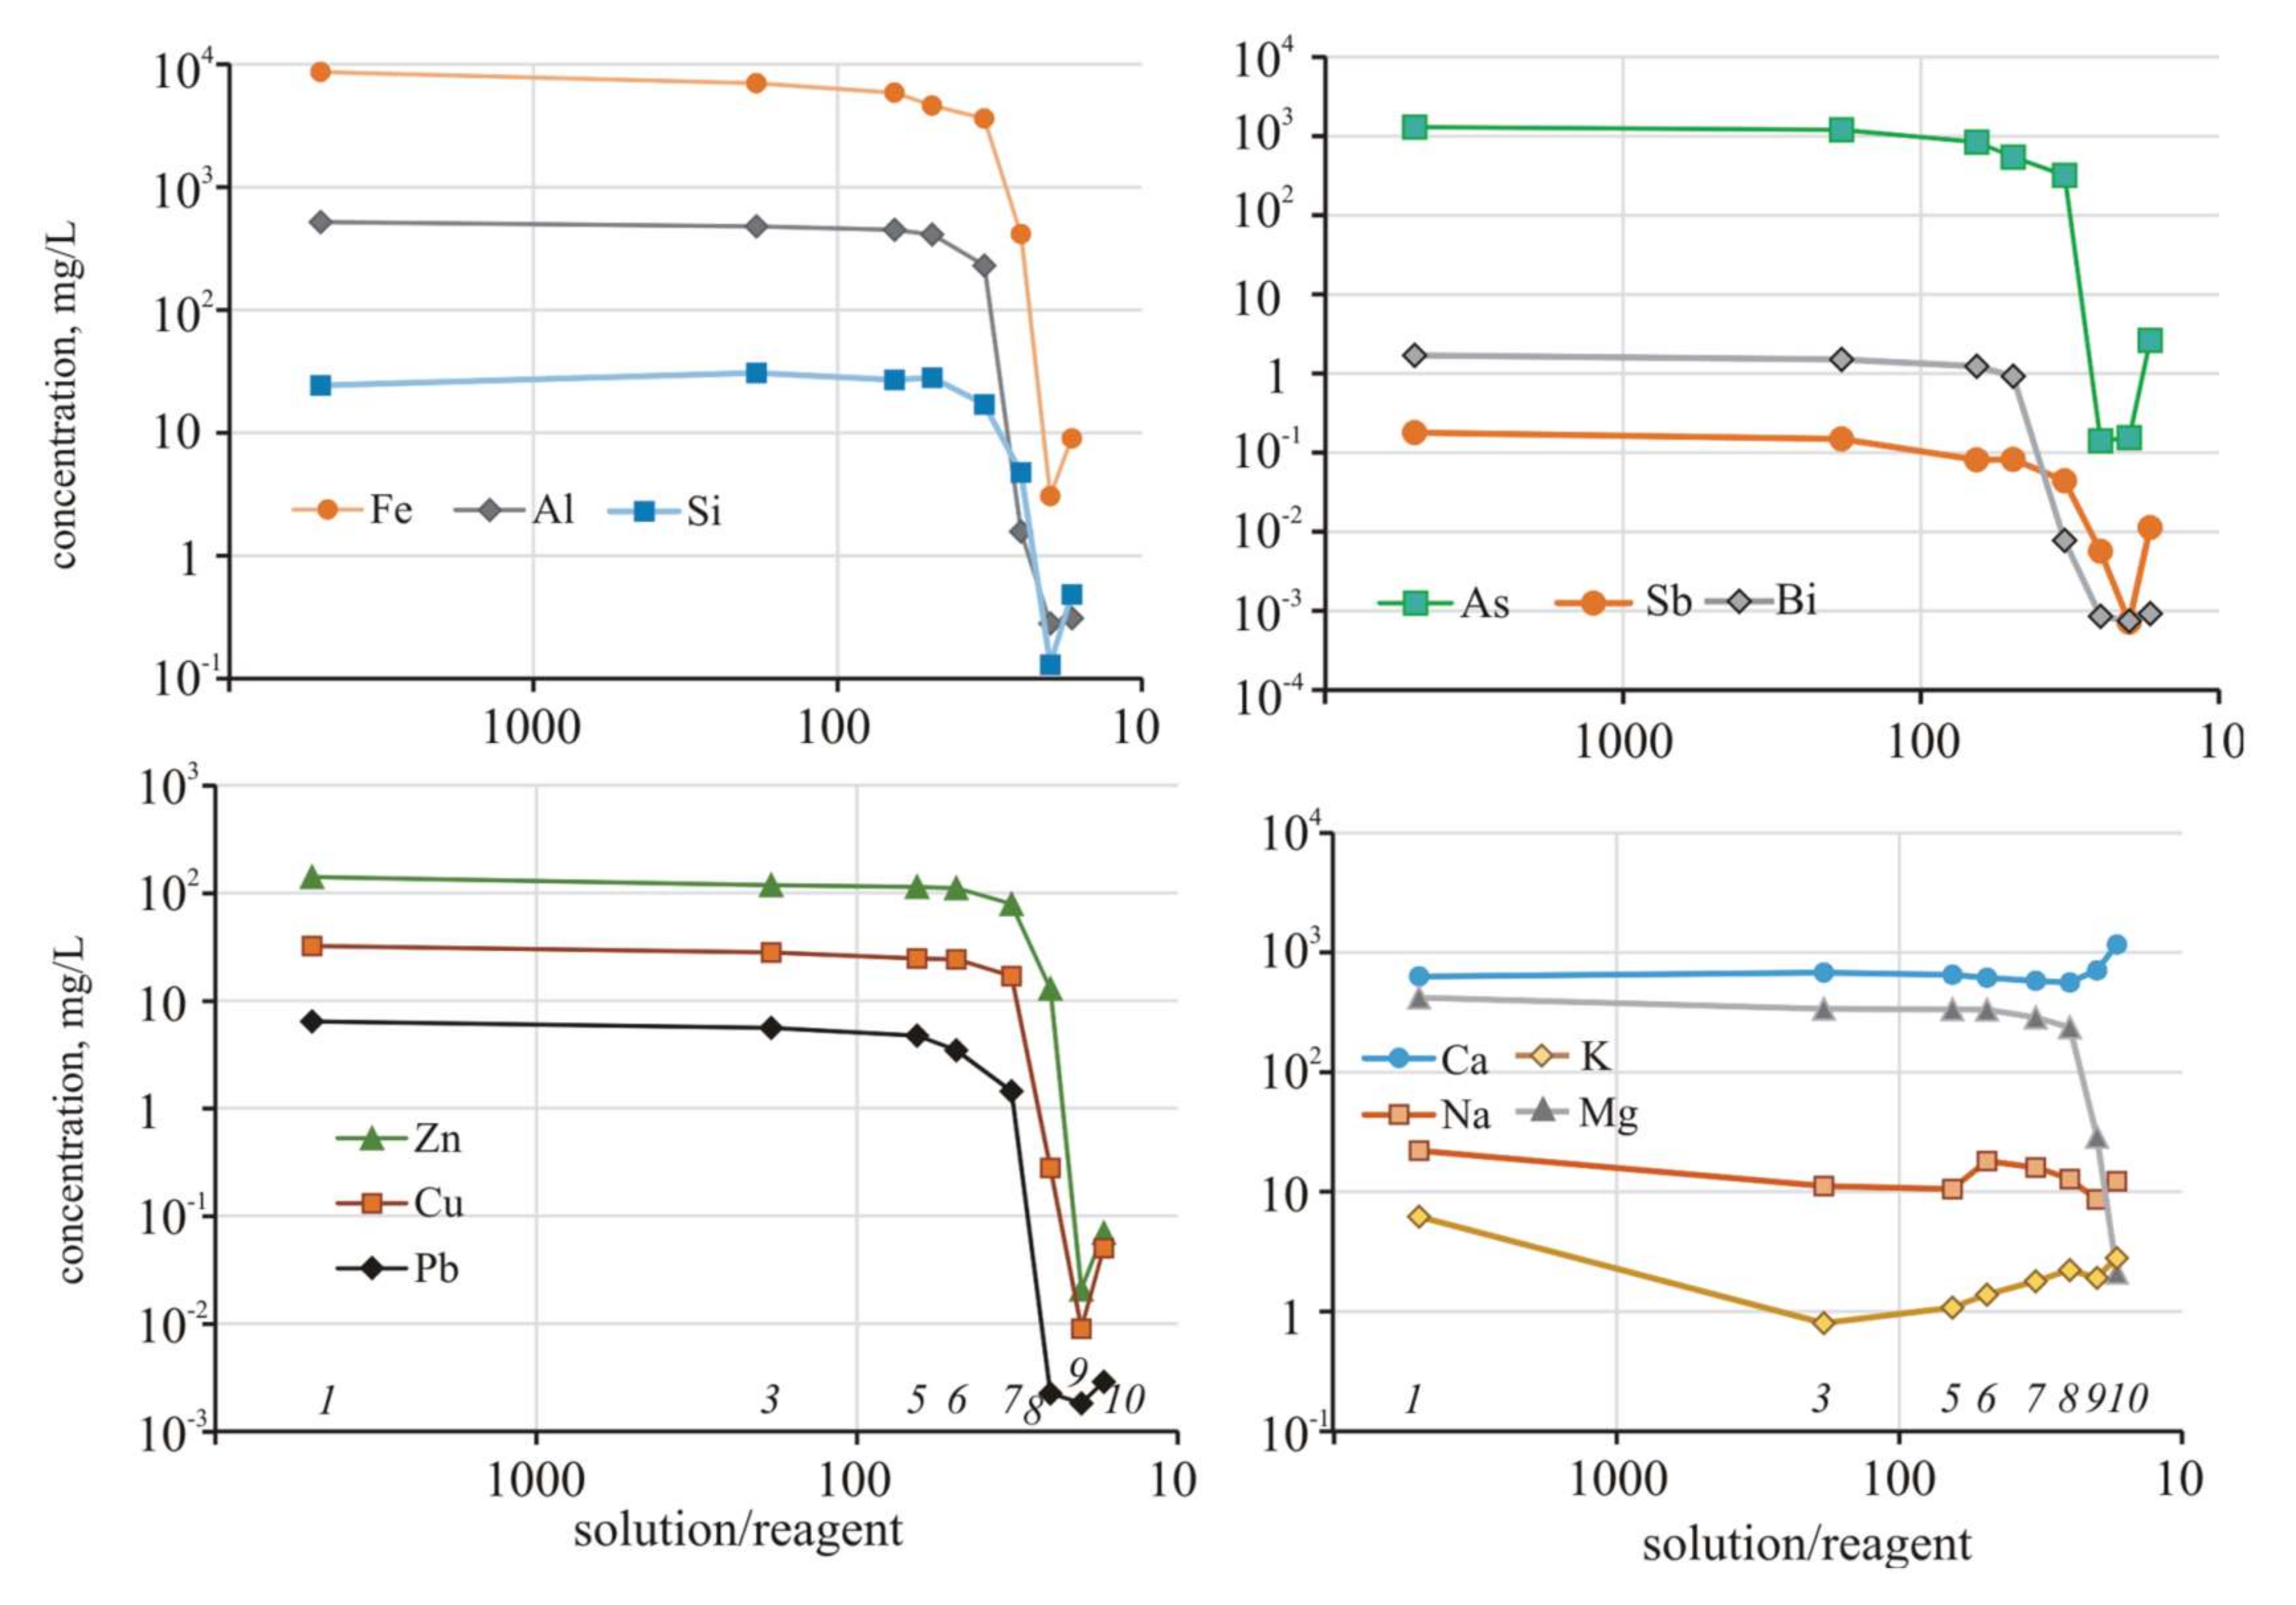
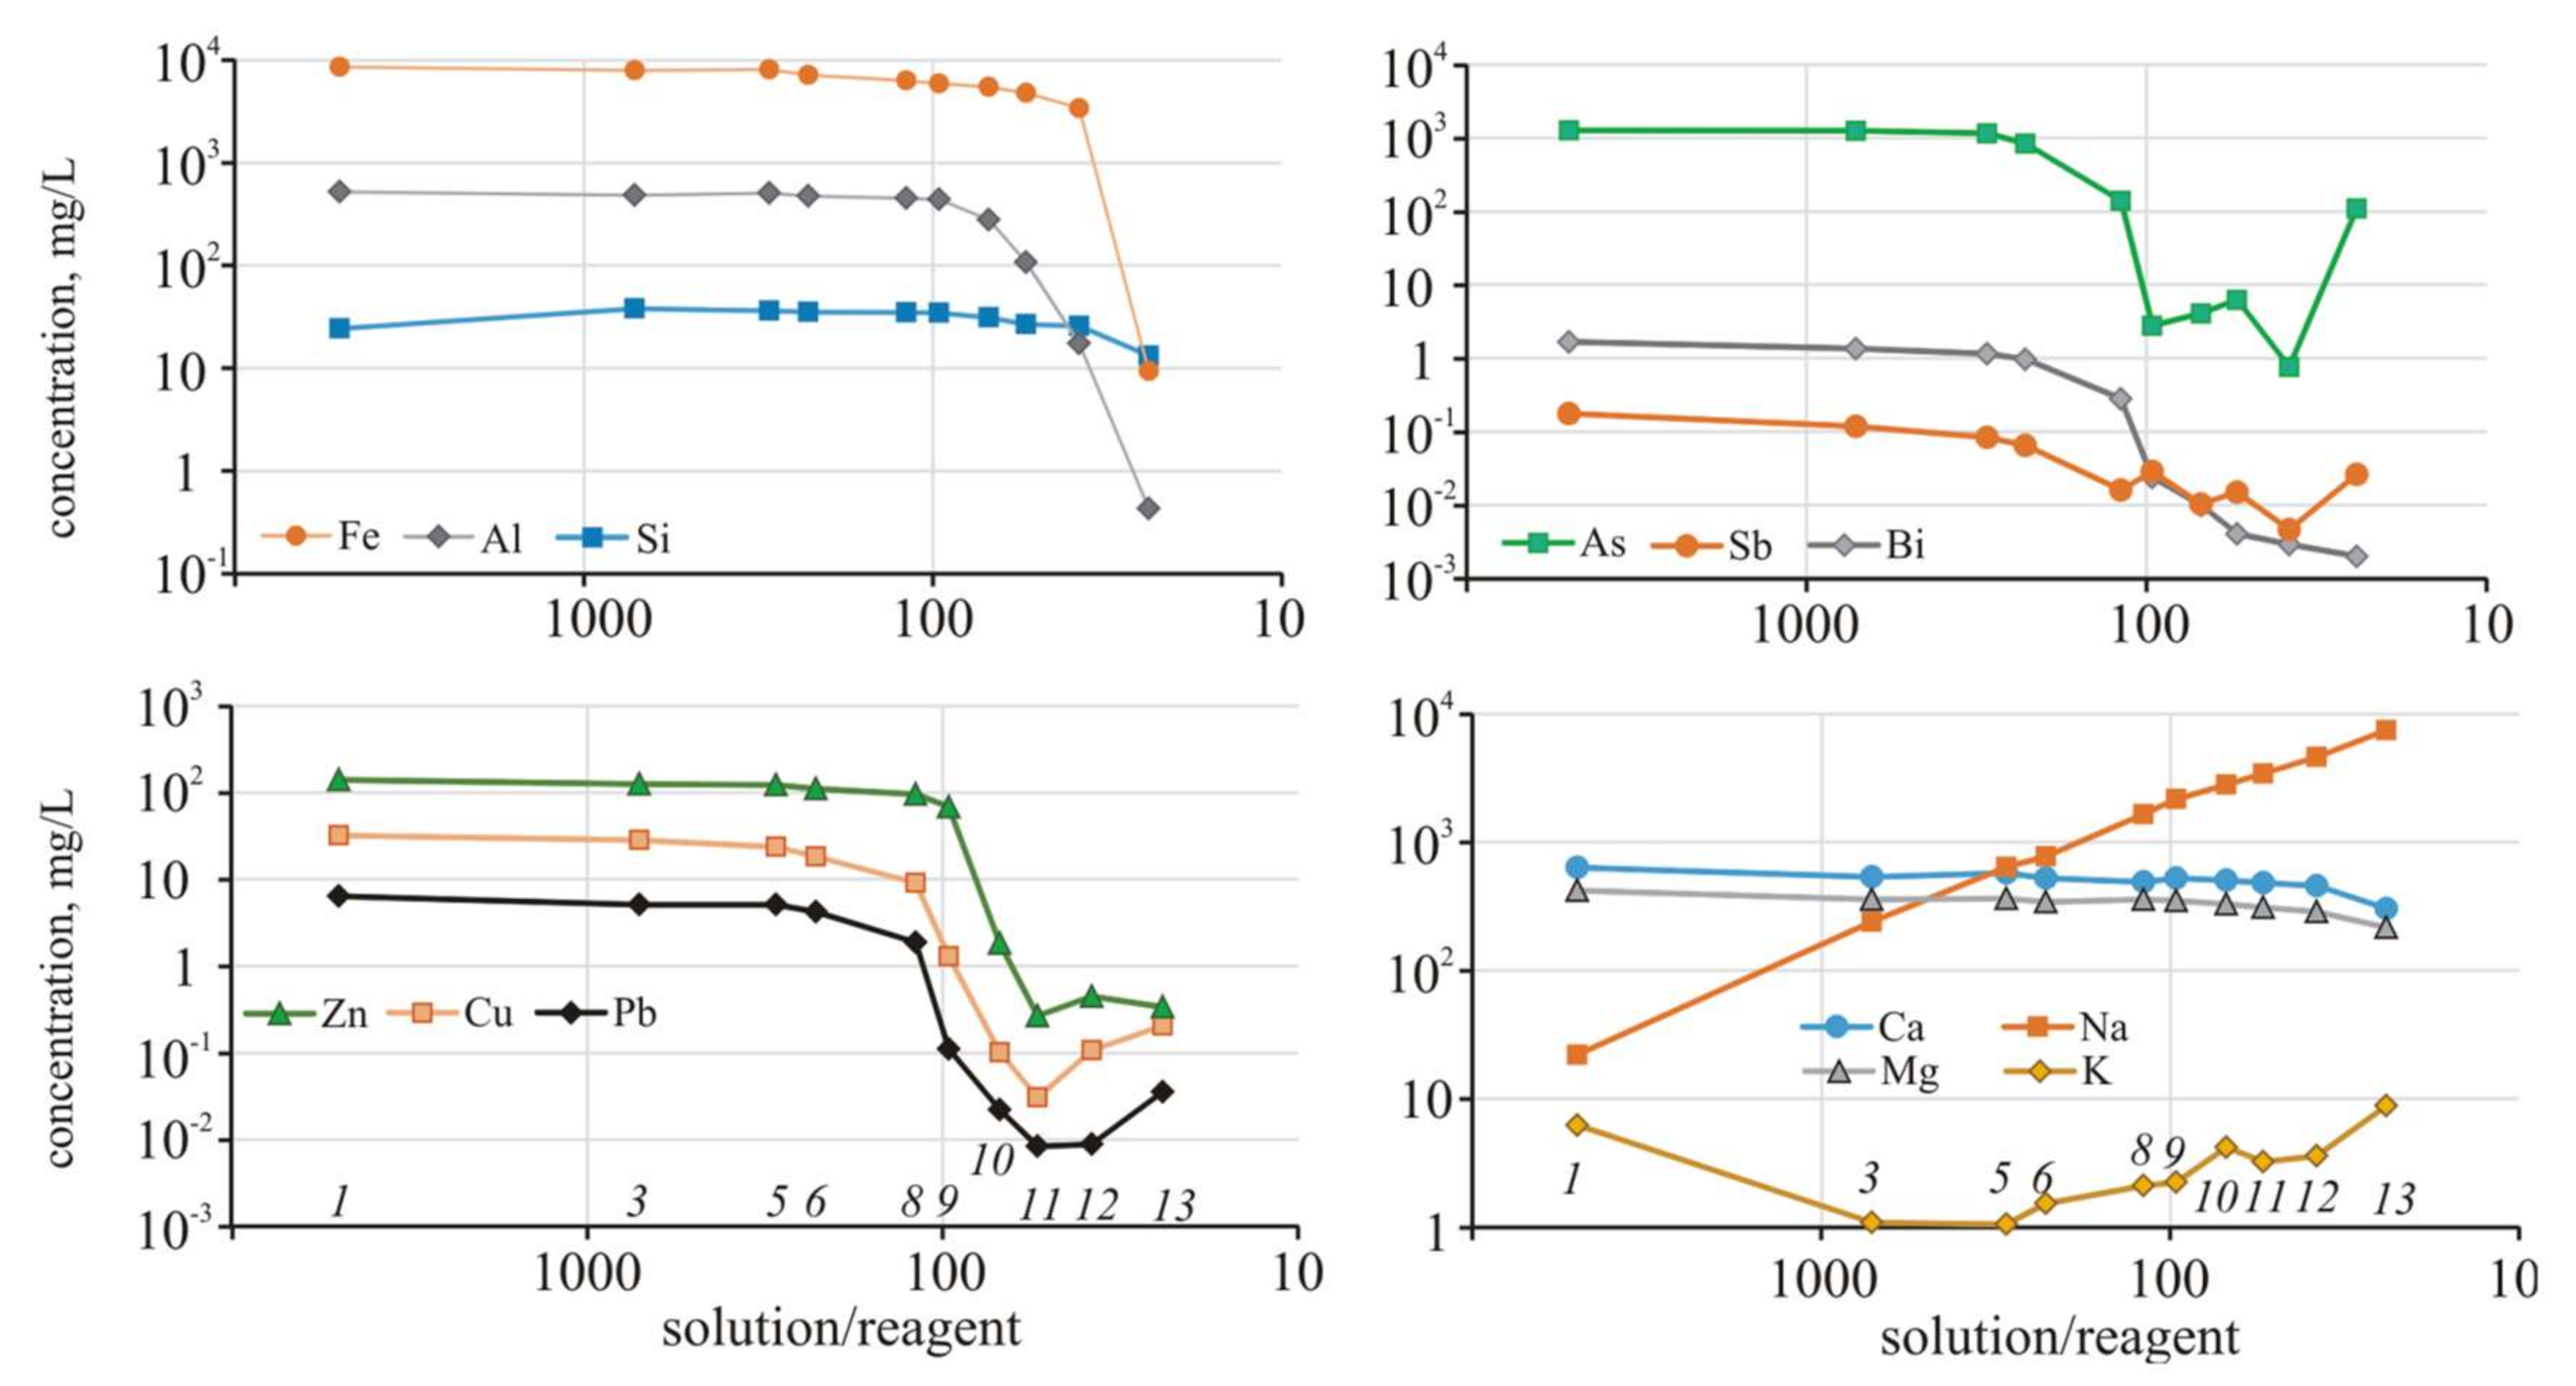
The buffer capacity of the solution was high, and allowed for the stability of pH values in a narrow range of one unit. After reaching S/R = 33, other reactions involving arsenic and metals take place in the system. The content of Fe, Cu, Zn, Pb, and other metals, as well as metalloids (As, Sb, Bi, Sn), slightly decreased while the solution was acidic (to pH < 3.06), which corresponded to S/R = 33 (Figure 3).
Then, with a noticeable increase in pH to 5.17 at S/R = 25, the concentrations of almost all the elements decreased sharply and continued to decrease in the next step when the pH reached slightly alkaline values (pH = 7.79, S/R = 20). Adsorption-coprecipitation with hydrous ferric oxides and sorption reactions with kaolinite and montmorillonite play a significant role in mobility of Zn and Pb [63]. However, with a further increase in alkalinity (pH = 12.2, S/R = 17), the concentrations of the elements began to increase. The contents of the alkali metals (Na, K) fluctuated insignificantly throughout the experiment.
The precipitate formed as a result of the interaction of Ca(OH)2 with the solution was a semiamorphous dark gray substance; after drying, it changed to a fine-grained, earthy mass. The XRD analysis data showed the presence of mainly gypsum and the amorphous phase of iron and aluminum hydroxides (plohmite) in the products from the final phase after the experiment. Ettringite, bassanite, alunite, and carbonates of Ca and Fe were formed in smaller amounts. In addition, traces of pickeringite (precipitated Mg) and arsenosiderite Ca3Fe4(AsO4)(OH)6·3H2O were found in the sample (Table 3). Thus, we have evidence of the formation of aqueous sulfates and complex compositions, hydroxides, and carbonates. The mineral phases of Cu and Zn were not identified.
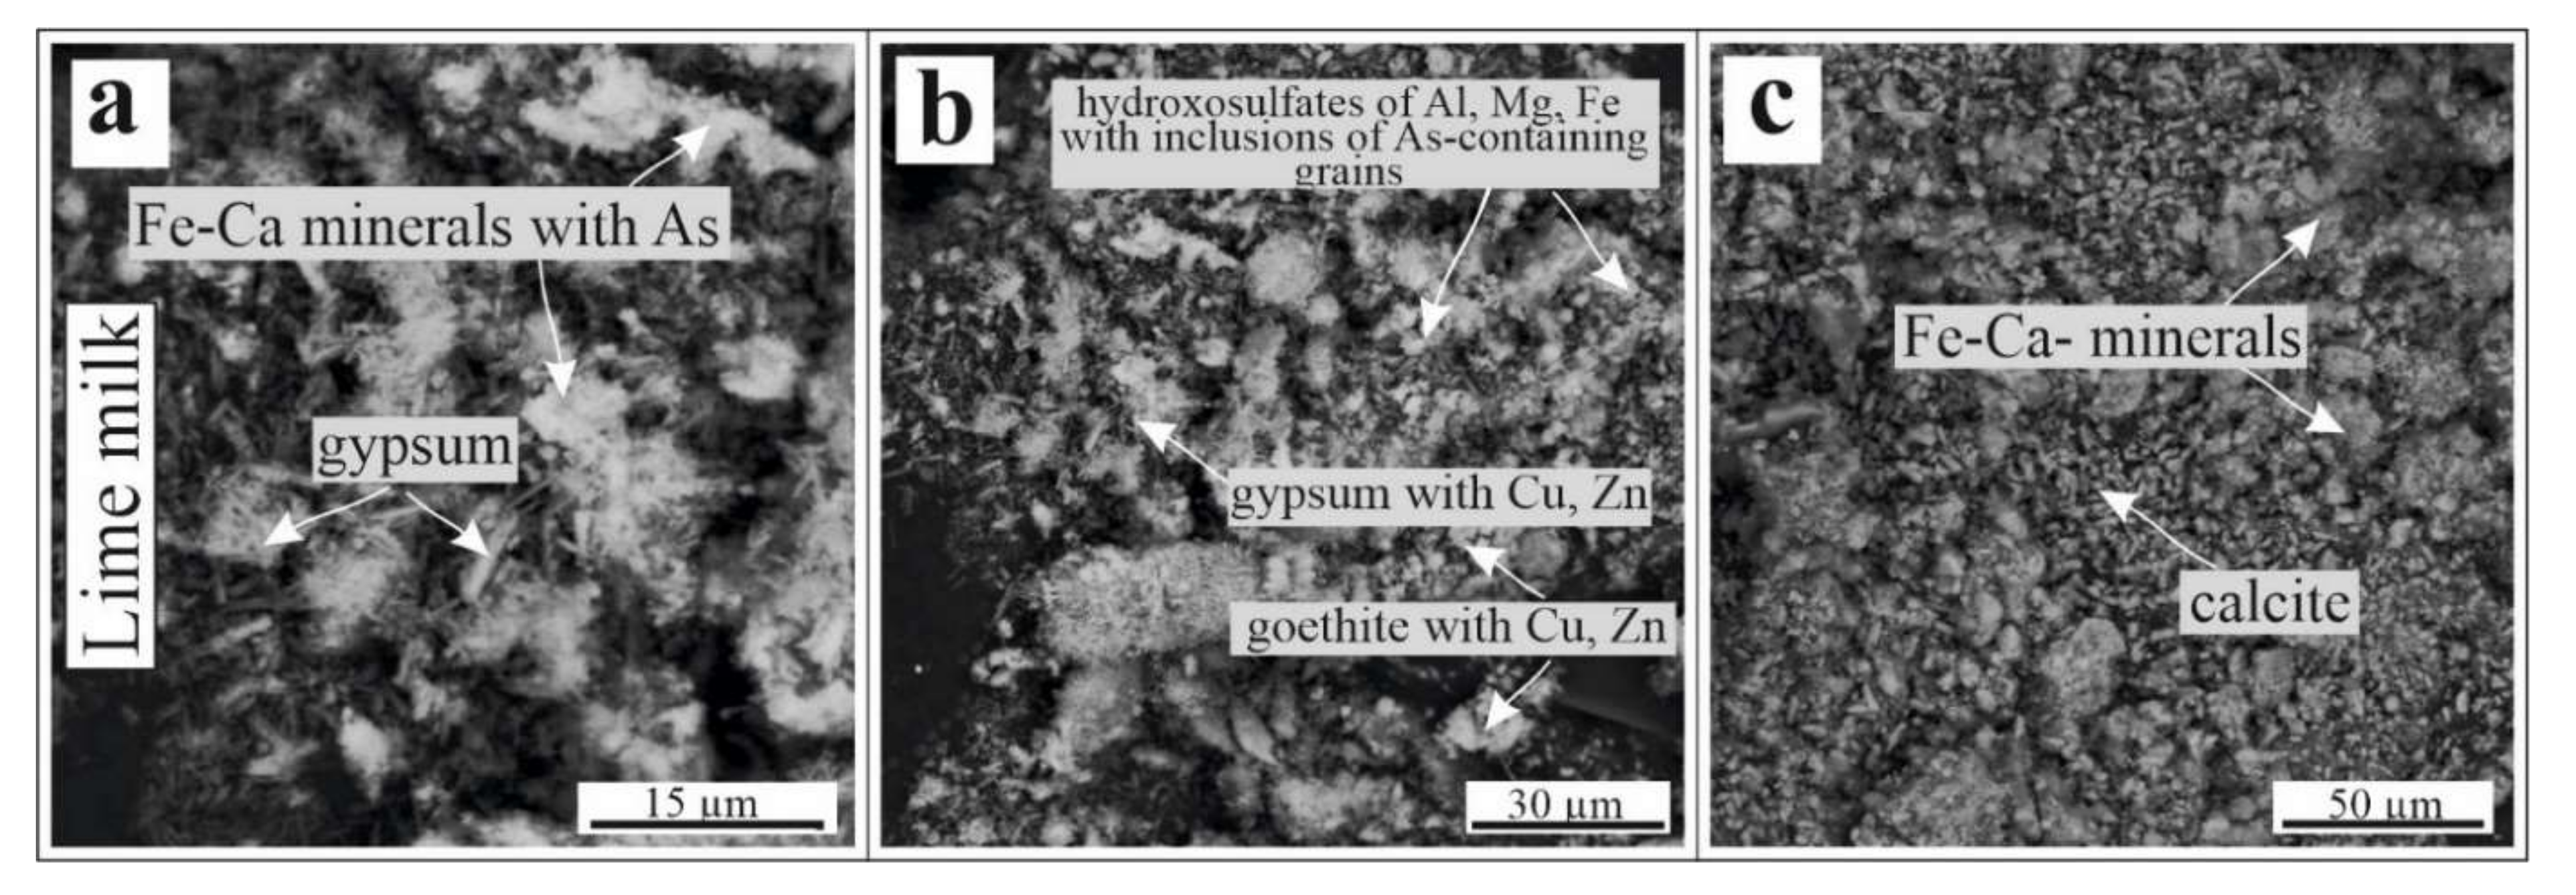
However, as a result of the electron microscopy studies of the precipitate, Cu and Zn impurities were detected in the Fe-Ca minerals. In addition, ultrafine inclusions of the As-containing phases, presumably arsenosiderite, which were identified by XRD analysis (Figure 4), were found in some grains of gypsum and Fe-Ca minerals.

Numerical Simulation of the Ca(OH)2 Experiment

A theoretical model with one liter of the Fe-As-sulfate solution (Table 1) by milk of lime has shown that, when 2.1 g of Ca(OH)2 is added, the solution becomes supersaturated with, Fe(OH)3(am), gypsum, and anglesite (Table 4).
Due to the formation of suspensions, 2800 mg of iron and 4.6 mg of lead can precipitate from the solution. The Ca content in the solution remains stable because it is controlled by the solubility of gypsum. The amounts of the formed suspension obtained in the numerical simulation are slightly higher than the decrease in the concentration of elements in the experimental solutions at the corresponding stages; however, taking the analysis error (10%) into account at such high concentrations of elements in the solution, the agreement is satisfactory. At pH ~3 (S/R = 49 and 33), the situation changes, such that gibbsite, alunite (aluminum minerals), apatite, and traces of shultenite and conichalcite (arsenates containing heavy metals) appear. Even though only 40 mg of arsenic precipitates from the solution, the precipitation process begins. With optimal S/R ratios of 25 and 20, the precipitation of arsenic occurs in the form of aqueous calcium arsenate, and carbonates may be present in the solid phase (Table 4). The formation of Ca3(AsO4)2∙4H2O; occurs by many technological schemes in mining plants, although it is a toxic compound for humans [64,65].
However, due to the precipitation of Ca3(AsO4)2∙4H2O, the arsenic concentration equals 0.14 g/L. At the last step of the experiment (pH 12.2, Eh −116 mV), ettringite (an indicator of alkaline solutions and a product of concrete corrosion) and (hydr)oxides (tenorite CuO, hausmannite Mn2+Mn3+2O4, zincite ZnO) appear. Indeed, the model solution becomes richer in Fe, Cu, and Ca, but does not become richer in arsenic. The increase in the arsenic concentrations at the end of the experiment is because the stability of iron hydroxocomplexes increases at pH 12.2; here, its solid phases dissolve, which releases trace elements into the solution. In the air, calcium arsenate is converted to carbonate, with the release of arsenic into the solution, according to the following reaction (Equation (4)):
Ca3(AsO4)2∙4H2O + CO32− = CaCO3 +2CaAsO4 +4H2O
Portlandite and Brusite were not detected by the microscopy. Not all phases can be taken into account in the model, due to the lack of thermodynamic data. That is why, instead of complex sulfate-arsenate phases, simple hydroxides such as Ca(OH)2 could appear under alkaline conditions. Some supersaturation of the solution in respect to portlandite cannot be ruled out upon its final addition.
Arsenic species in solutions change with increasing pH and mineralization (EC). In the first stages of the experiment, the majority of arsenic in the solution was in the form of positively charged complexes with iron FeH2AsO4+, FeHAsO4+ and FeH2AsO42+ and arsenic acid H3AsO4 (Figure S1). With a decrease in the S/R ratio to 49, due to the binding of iron in Fe(OH)3(am), H2AsO4 becomes a major species, with a meaningful proportion of arsenate complexes with the metals MgH2AsO4+, CaH2AsO4+ and AlHAsO4+. At the next steps of the numerical simulation, at subalkaline and alkaline pH values, arsenic is in the form of a neutral complex of CaHAsO4 and anionic CaAsO4, which remains the only compound of arsenic in solution, at a concentration ~0.1 mg/L. Iron also has a variety of species. In acidic solutions, Fe2+ (0.01 mole/L), sulfate and arsenite complexes (FeH2AsO4+) are the predominant species, with a meaningful proportion of arsenate complexes. At pH 7.79 and 12.22, hydroxocomplexes (Fe(OH)4) are the predominant species. The study of the elemental species is important from a scientific (cycle of elements in the biosphere) and practical (technology) perspective. This phenomenon can be traced back to the example of As in the S/R ratio, changing from 25 through 20 to 17. In the first case (S/R = 25), the proportion of the As complexes is low, solutions are supersaturated with respect to minerals and 3310 mg of precipitate are formed (supersaturation is calculated through the product of the uncomplexed ions activity). In the second case (S/R = 20), the proportion of As complexes is almost 50%, and only 150 mg of precipitate are formed; in addition, at S/R = 17, despite the fact that AsO43− < 1%, 620 mg of Ca3(AsO4)2∙4H2O is precipitated because it is no longer gypsum, and ettringite controls a higher concentration of Ca in the solution (Figure 3).

3.2. Redox Experiment with Na2S

It is known that sulfur, in the form of sulfide, forms low soluble compounds with heavy metals under reducing conditions [66]. Therefore, in nature, there are massive deposits of hypogenic sulfides and sulfides of the secondary enrichment zone. The highest activity, due to the significant content of sulfur in the form of sulfide, has sodium sulfide (Na2S), which yields strongly alkaline solutions. In the experiment with Na2S, the acidity of the solutions decreased, due to a slightly different scheme (Figure 5).
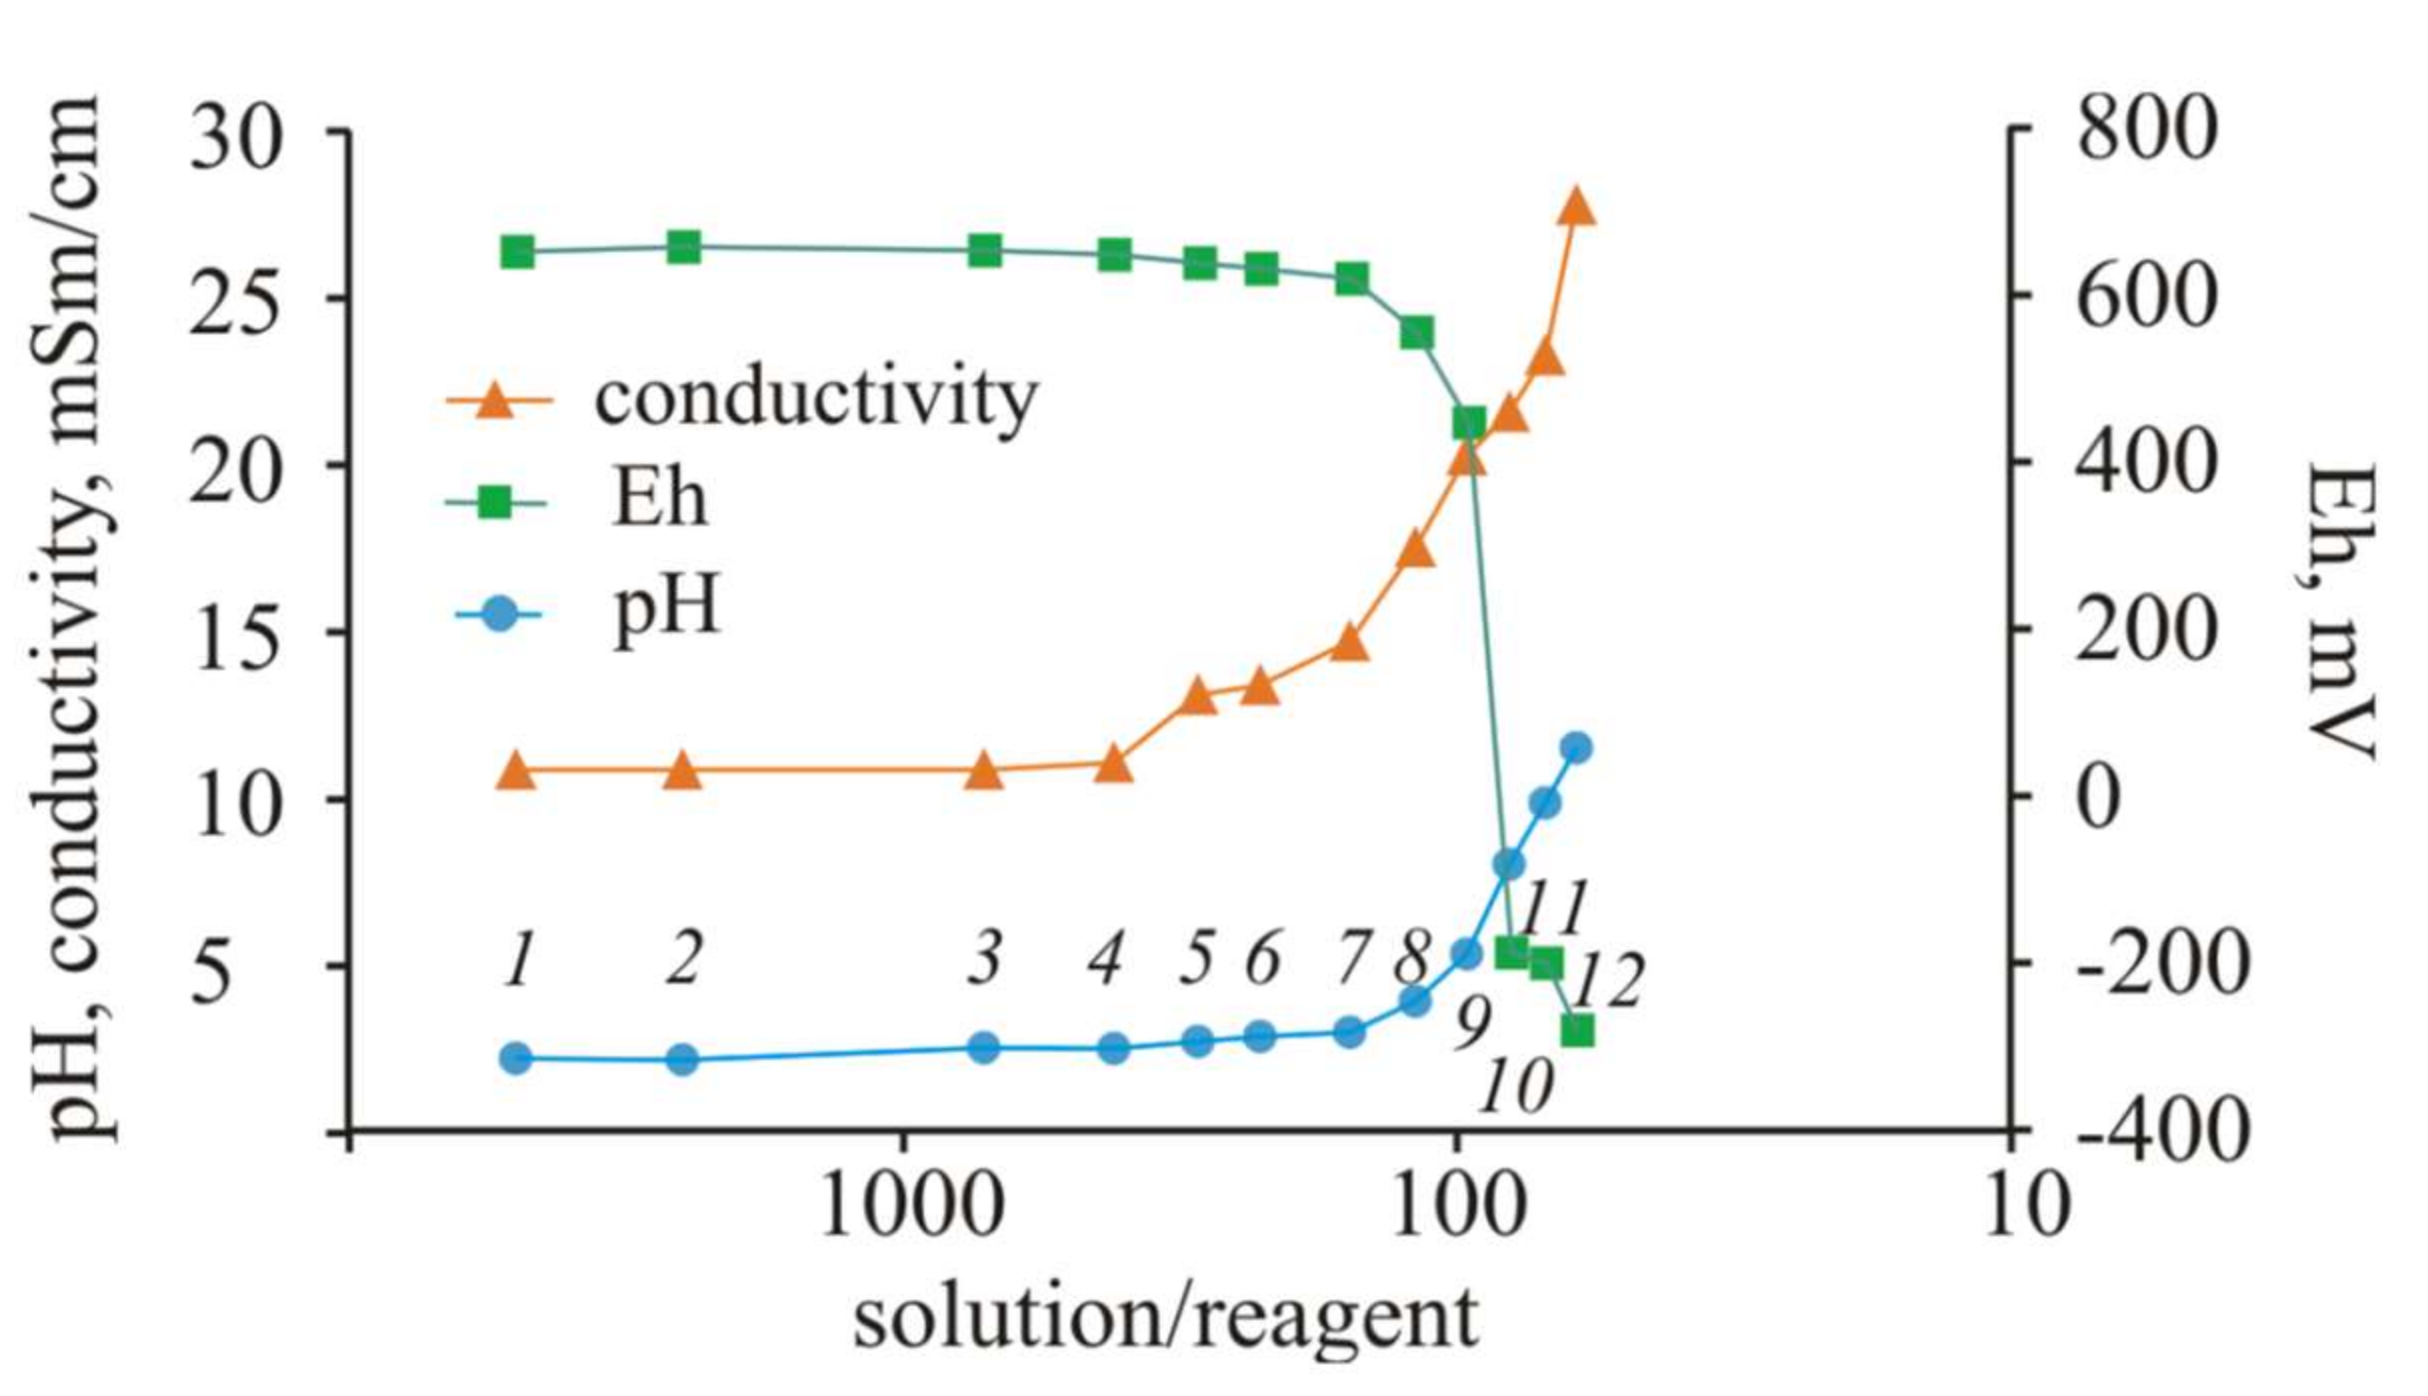
Initially, at high S/R ratios, the increase in pH was insignificant (0.5 units), which was similar in the experiment with Ca(OH)2. Moreover, for an identical decrease in acidity, three times less reagent was required than in the experiment with Ca(OH)2 (pH 2.9 requires 6.4 g of Na2S and 20.4 g of Ca(OH)2). With S/R = 24–25, the pH value in the experiment with Na2S was 7.29, and in the experiment with Ca(OH)2, it was only 5.17.
It is reasonable that the redox conditions of the solutions changed more significantly, and at the end of the experiment (S/R = 24), Eh was −244 mV, which corresponds to the reducing environment at pH 7.29. The fundamental difference from the experiment with Ca(OH)2 is a change in EC. Due to an increase in the Na concentrations (up to 7.4 g/L), the EC increased. Unlike calcium, Na was deposited in minimal amounts at the last steps of the experiment. The Na concentration, starting from S/R = 700, exceeds the MPC; additionally, at the end of the experiment, the excess concentration was 60 times higher, which is certainly an unfavorable result. The iron concentration during the experiment began to decrease under acidic conditions (S/R = 227, pH 2.69) and then gradually decreased as the conditions changed to S/R = 38 and pH 5.32 (Figure 5).
In the next step of the experiment (S/R = 24, pH 7.29), the Fe content decreased sharply (from 3410 to 9 mg/L), accompanied by a decrease in Eh to 244 mV. The behavior of Al(III), affected only by pH, was similar. A significant decrease in the Al concentrations (to 278 mg/L, almost two-fold) began with the ratio S/R = 69 and pH 4.41. It is noteworthy that arsenic precipitates from the solution, even at higher ratios (S/R = 119, pH 3.25) and under oxidizing conditions (Eh = 587 mV). Thus, the behavior of As is affected by the Eh value, pH value and sulfide sulfur concentration. In addition, at the subsequent steps of the experiment, As concentrations fluctuated and reached a minimum (0.78 mg/L) at S/R = 38 and pH 5.32. The experiment was terminated because it had already reached pH 7.22, and arsenic was released back to the solution at concentrations up to 113 mg/L. We assume that, due to reducing conditions, bound As(V) began to release into the solution in the form of HAsO32−, which is the highly toxic acid of As(III). Antimonous acid is its analog (green and red lines, Figure 6).
A decrease in the concentrations of Pb and Cu also began under acidic conditions S/R = 119 and pH 3.25, but the Zn concentration decreased in the next step of the experiment at pH 3.61. The minimum metal concentrations were achieved under slightly acidic conditions (pH 4.87), and then the concentrations began to increase.
The precipitate formed in the experiment was a dark gray, almost black substance; after drying, it was a fine-grained mass. According to XRD analysis, sulfides, sulfates and arsenates formed as a result of the solution reduction (Table 5).
Pyrite, gypsum, native sulfur, and amorphous Fe-phases are the main phases. The following phases were determined in minor amounts: thenardite, scorodite, tennantite, chalcophyllite; in addition, the following phases were determined in trace amounts: uzonite, basaluminite, mirabilite, As-phases, and Fe, Cu and Zn sulfate (solid solution). We do not exclude the possibility of the formation of soluble Na salts thenardite and mirabilite from residual solutions during the drying of the precipitates.
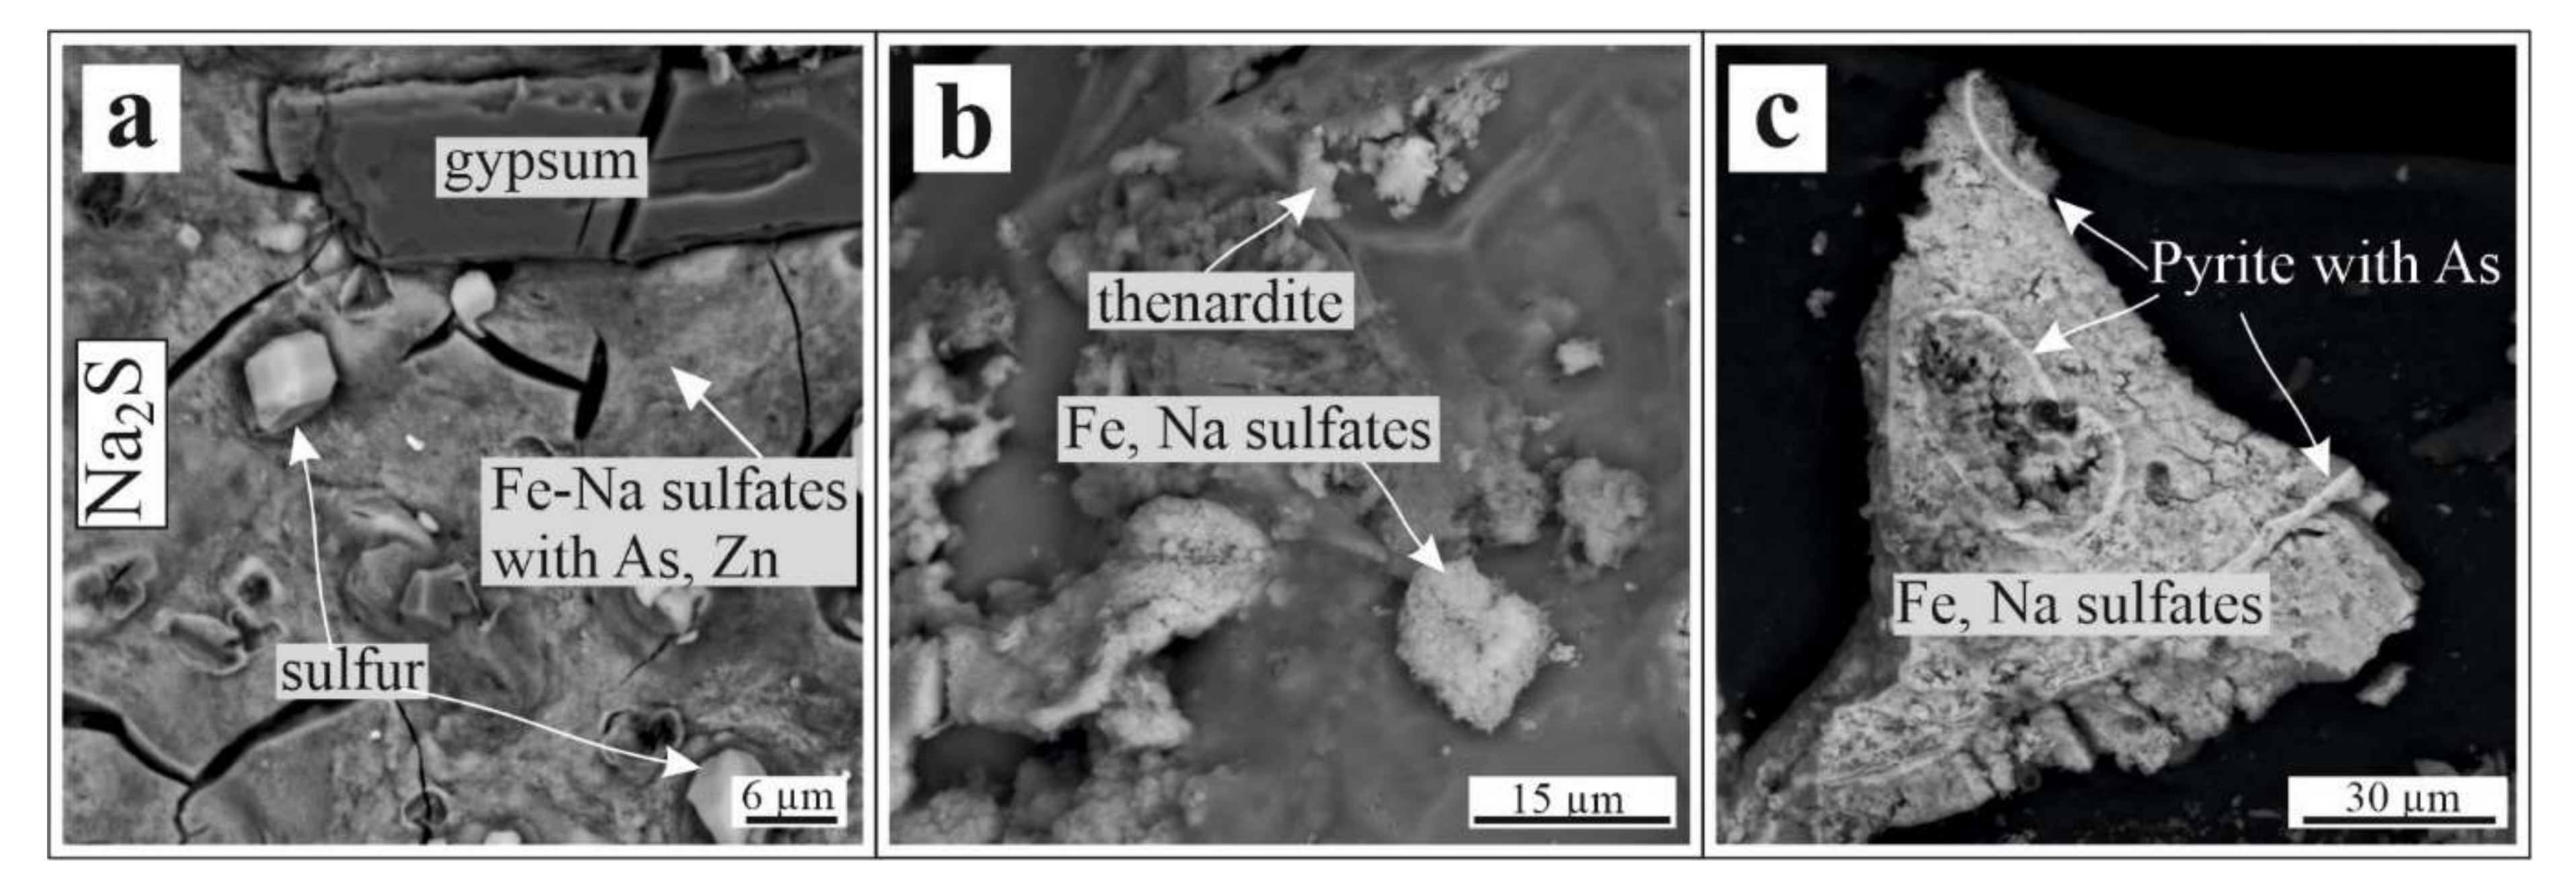
Using electron microscopy, crystals of native sulfur, gypsum (Figure 7a), Fe and Na sulfates with impurities of As and Zn (Figure 7a–c), thenardite (Figure 7b), pyrite veins and borders with an admixture of As were found.

Numerical Simulation for the Na2S Experiment

Thermodynamic modeling was carried out according to the same scheme as for the Ca(OH)2 experiment: titration of the sulfate Fe-As solution with Na2S. After adding 0.2 g of Na2S, the solution was supersaturated with respect to silica, Fe(OH)3(am), gypsum, and anglesite, and this condition determined the beginning of a decrease in the concentrations of elements, such as Si, Fe, Ca, and Pb. Here, at pH 2.3 (10.4 g Na2S, S/R = 96), symplesite Fe(II)3(AsO4)2·8H2O begins to precipitate (Table 6).
The binding of arsenic to symplesite explains the sharp decrease in the arsenic concentrations in the numerical simulation from 1300 to 35.8 mg/L, and the decrease in iron concentrations to 668 mg/L. The process can be described by the reaction as follows (Equation (5)):
Na2S + 3Fe(SO4)0 + 2AsO43− + 12H2O = Fe(II)3(AsO4)2·8H2O + 4SO42− + 2Na+ + 4H2(gas)
We did not see any symplesite Fe2+3(AsO4)2·8H2O in our experimental solids. Instead, a mixture of Fe(OH)3 + Scorodite FeAsO4∙2H2O + Chalcophyllite Cu18Al2(AsO4)4(SO4)3(OH)24∙36H2O was discovered (Table 5). Nevertheless, the precipitation of symplesite at S/R ~100, and then its gradual dissolution, correctly described the variation of As and Fe in according experimental solutions.
Because of the active binding and precipitation of a large amount of As, in the next steps of the modeling, the amount of formed simplesite sharply decreases due to the formation of pyrite, which can be seen in Table 6. The negative result is high sulfate ion concentrations in solution, which is clearly indicated by the calculations. To precipitate the sulfate ion at this stage, Ca(OH)2 should probably be added (using a combined scheme), which would lead to the formation of gypsum. Of the metal sulfides, chalcocite (Cu2S) first appeared, which in nature marks the zone of secondary sulfide enrichment, and this explains the decrease in the concentration of Cu from 32 to 1.3 mg/L (at 25 times). A subsequent decrease in the Cu concentrations is also determined by the formation of chalcocite to pH ~5.0. In parallel with Cu sulfide, sulfates, such as gypsum, alunite, gibbsite, and kaolinite, are formed. Then, during the transition from weakly oxidizing to reducing conditions, sulfides, such as pyrite, chalcopyrite, sphalerite, galena, and argentite, begin to form in neutral and subalkaline conditions. Arsenopyrite was not recorded in the calculations.
The change in the As species in an acidic solution is similar to the experiment with Ca(OH)2. At high S/R ratios, iron arsenate cationic complexes, FeH2AsO4+, FeHAsO4+, FeH2AsO42+, and arsenic acid H3AsO4, are the predominant species of As (Figure S2). Arsenate complexes with Al (AlHAsO4+) and Mg (MgH2AsO4+) were formed in a significantly smaller amount. Starting with the S/R = 69, the differences in the experiment with Ca(OH)2 are dramatic, since there is no Ca in the solution; i.e., Ca completely precipitated (gypsum and then apatite). Arsenic in solution is present in the form of highly toxic arsenic acid H3As(III)O3. In this case, in the model solutions, a clear increase in the As content is observed, which agrees with the experimental results.

3.3. Neutralization Experiment with NaOH

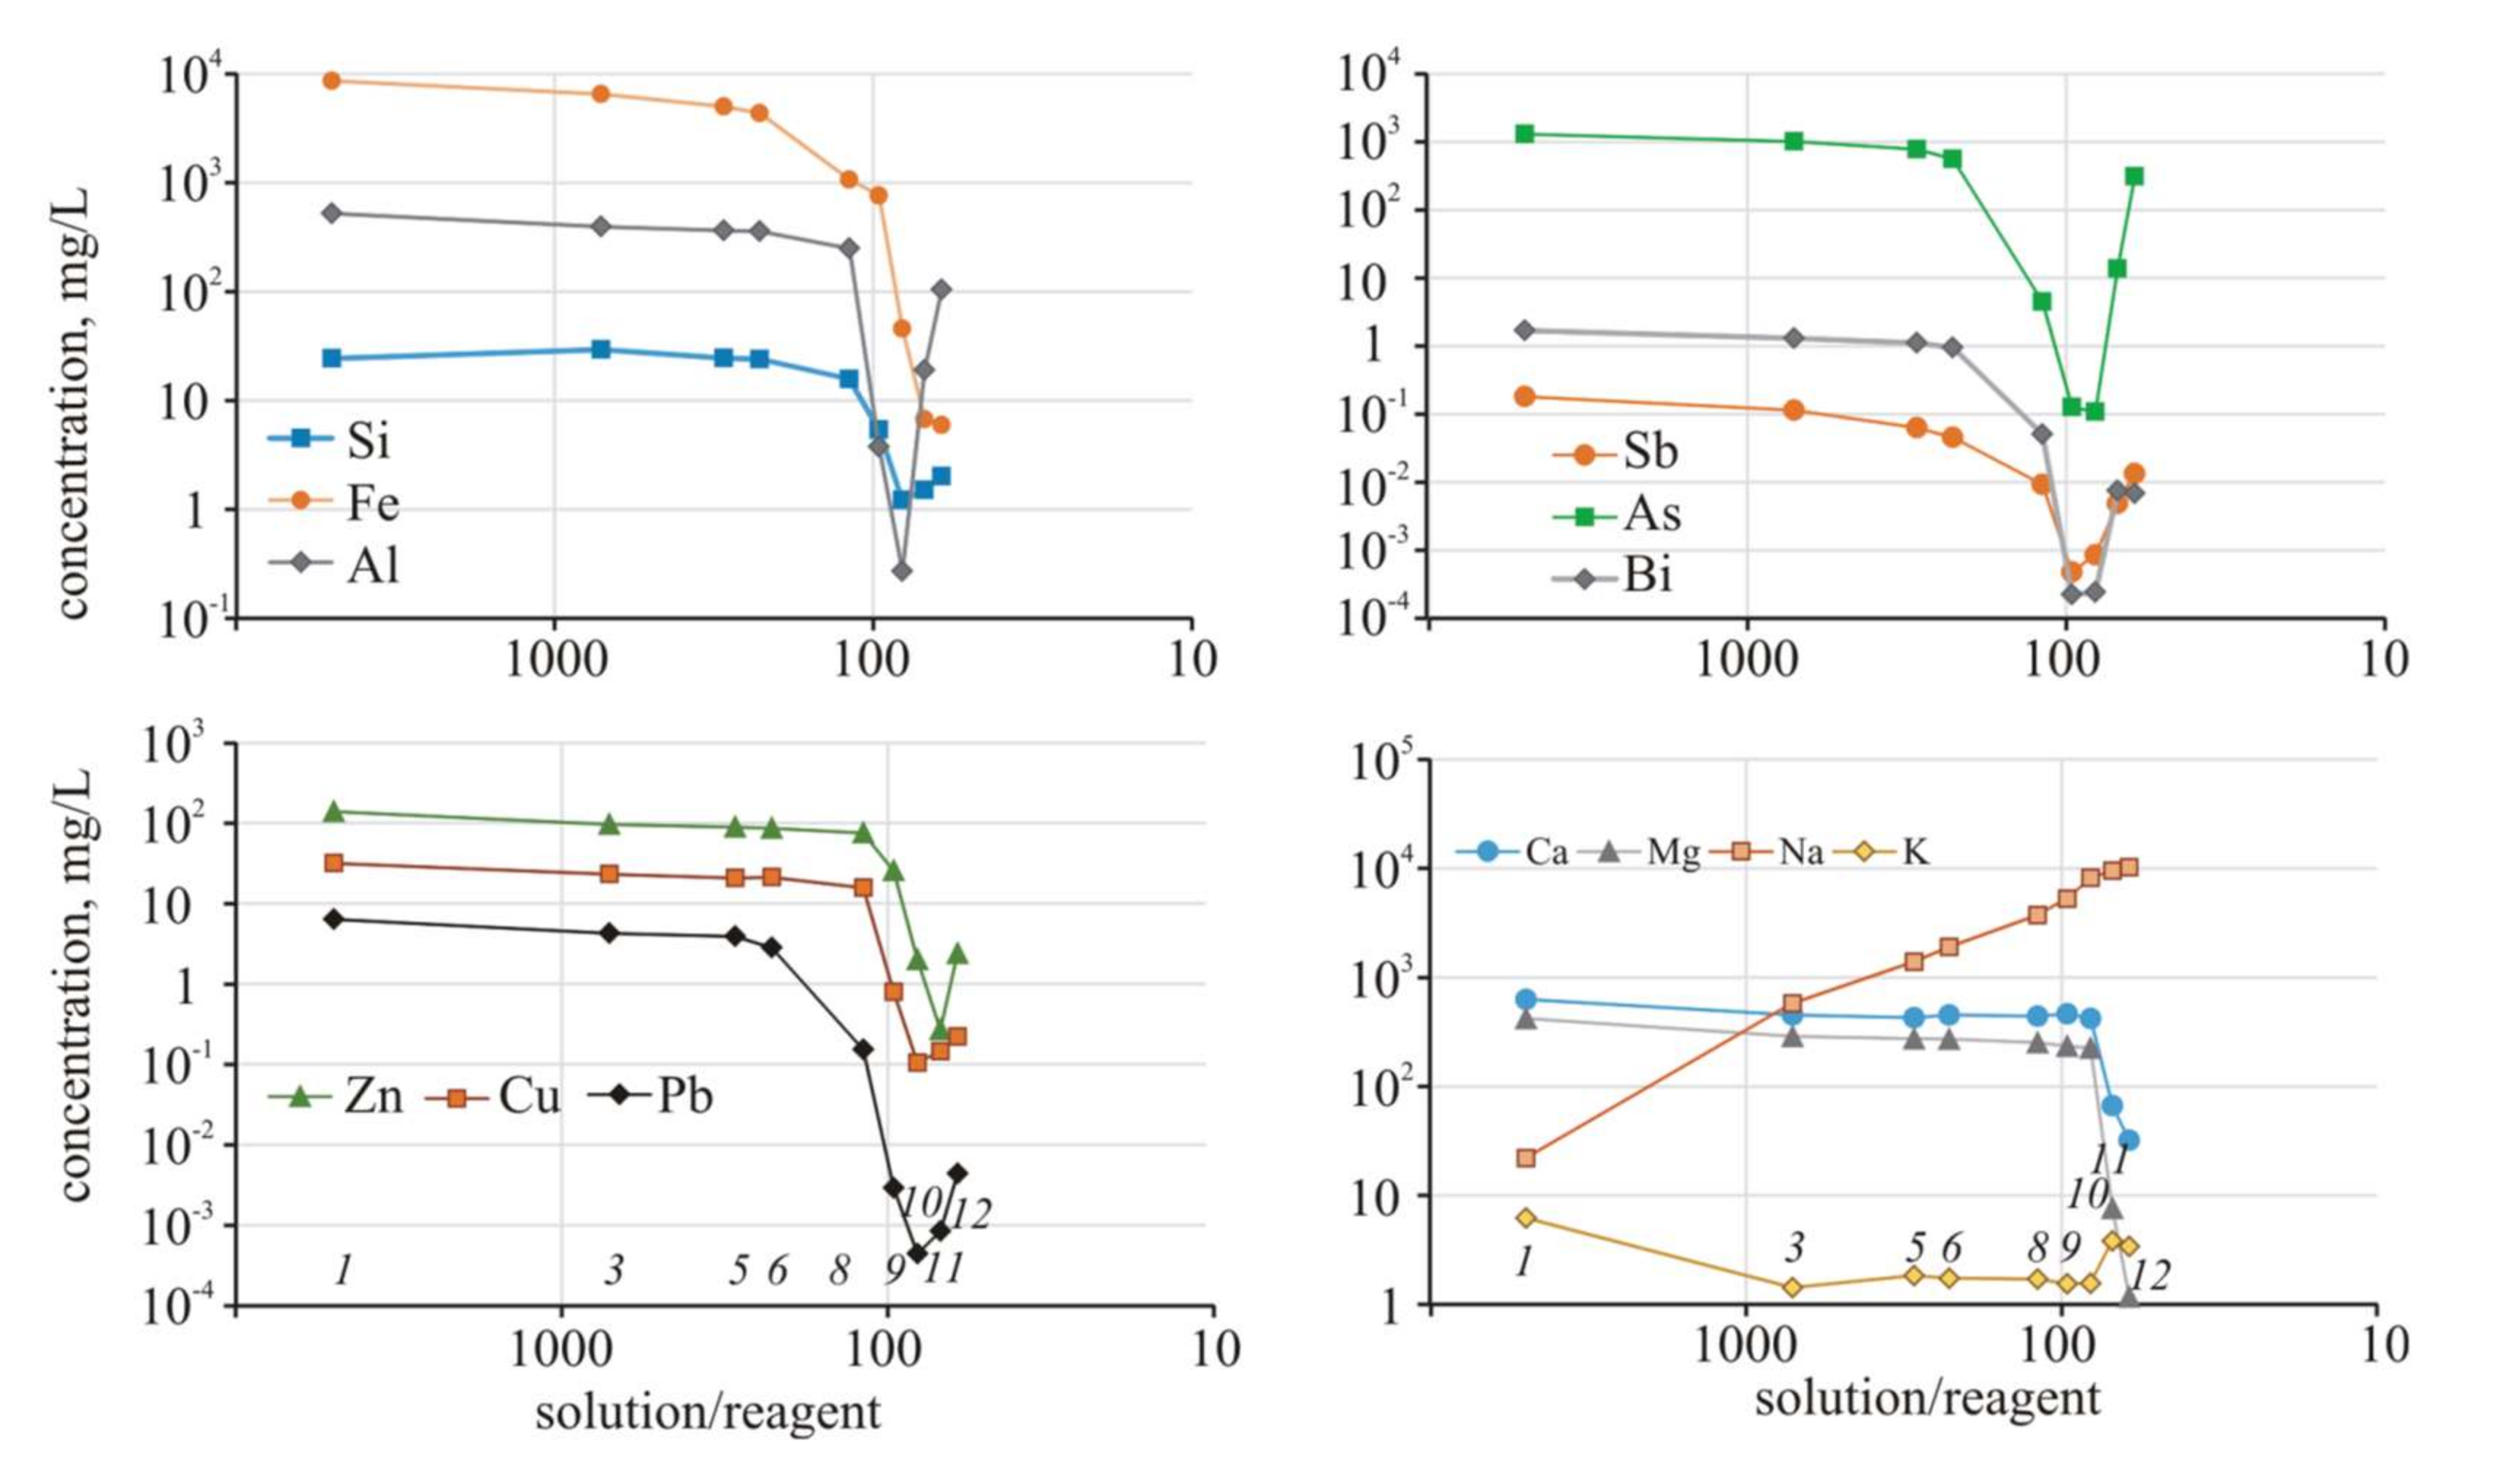
During the experiment with NaOH, the pH values gradually increased to pH = 2.94 (S/R = 156). Subsequently, at S/R = 119, the pH value increased by almost 1 unit (pH 3.86), and then the pH value further increased at each step by 1–1.5 units (Figure 8).
The EC due to the release of sodium into the solution remained stable only in the first four steps. When the S/R ratio was decreased, the EC sharply increased. The redox potential began to change markedly when the medium became near-neutral, and then, in the alkaline region, the conditions changed to reducing conditions.
The concentration of Fe decreased by four times with the increase in pH from 2.94 to 3.86, and then continued to decrease until alkaline conditions were established (Figure 9).
The Al concentration began to decrease one step later, with a change in pH from 3.86 to 5.29; however, the decrease was sharper than for the iron. In addition, the pH range of its minimum values was even narrower: in an alkaline environment, aluminum actively began releasing into the solution. The behavior of As, Sb and Bi was similar. The minimum As concentration (0.13–0.11 mg/L) was reached in the neutral-slightly alkaline conditions, and As increased sharply (up to 310 mg/L) at pH = 11.45.
Metals (Zn, Cu, and Pb) began to precipitate in neutral conditions; however, as expected under alkaline conditions, they were released into solution. Similar to the experiment with Na2S, the Na concentration increased linearly during the experiment, and at S/R = 700, the Na concentration was 4.5 times higher than that of the MPC. By the end of the experiment, Na was almost 2 orders of magnitude higher than that of the MPC. The precipitate mainly consists of thenardite, gypsum, and iron hydroxides (Table 7, 
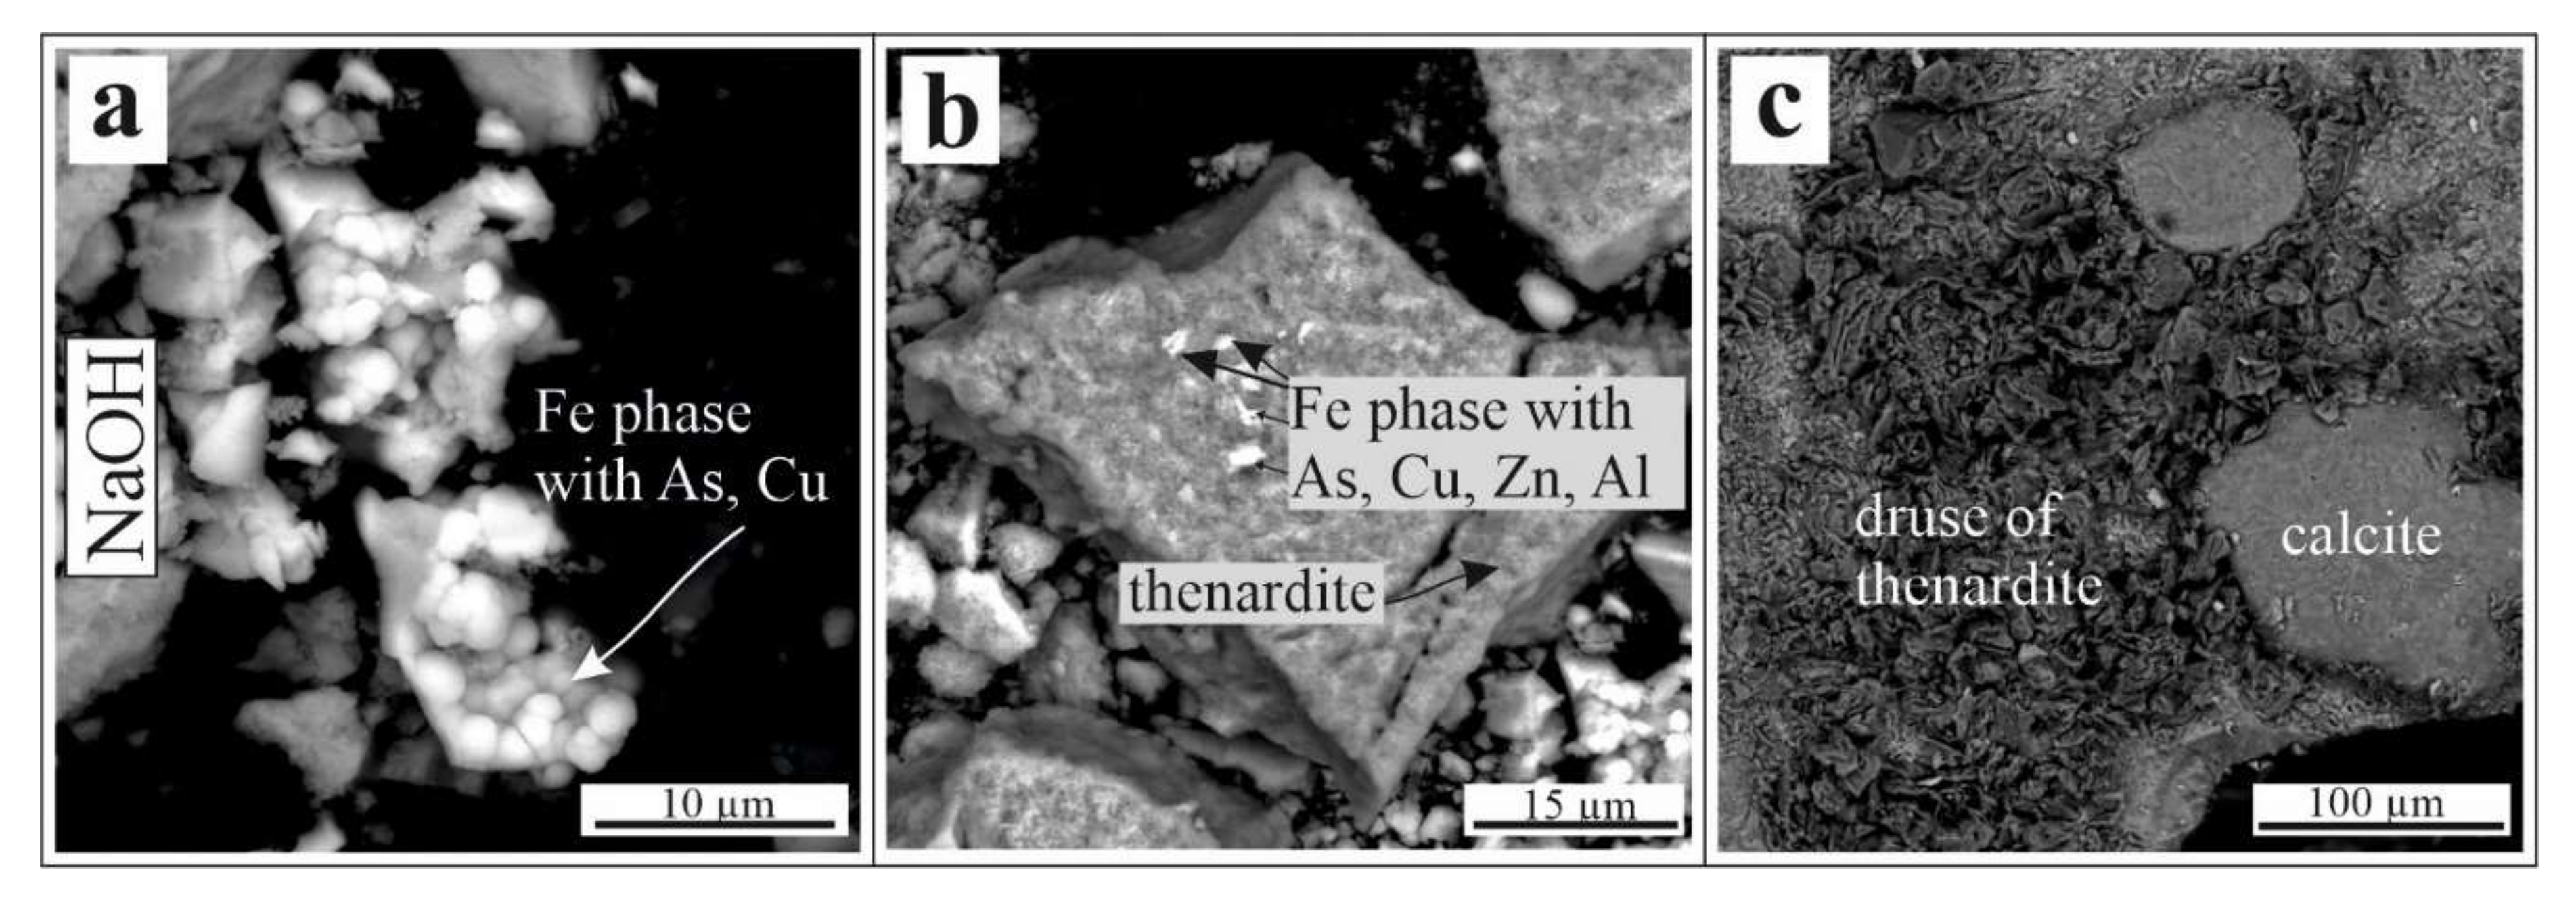
Figure 10a–c). Calcite, chalcophyllite, scorodite, kaatialaite, and untitled phases (Na and Al sulfate and Mg hydroxo arsenate) were identified as impure minerals.
In the electron microscopy study, As was revealed in the amorphous Fe-phase together with an admixture of Cu (Figure 10a). Impurities of Cu, Zn, Al, and As were revealed in small inclusions of Fe-sulfate in thenardite (Figure 10b). Perhaps these inclusions are the smallest grains of As minerals identified by XRD, and the impurities in them are due to matrix capture. The grains of calcite are surrounded by the druse of tenardite (Figure 10c).

Numerical Simulation for the NaOH Experiment

The acidic solutions are supersaturated with respect to silica, Fe(OH)3(am), gypsum, anglesite and simplesite Fe3(AsO4)2·8H2O (Table 8). The neutralization processes are faster than in the experiment with Ca(OH)2. It was possible to achieve a pH = 5.29 with the addition of only 10.4 g of NaOH. At this moment (Eh 0.44), gibbsite, alunite, and apatite were precipitated, and conichalcite CaCuAsO4(OH) (Table 8) were formed instead of symplesite and shultenite. At pH 9.8 and 11.6, the removal of As was associated with the formation of calcium arsenate, which was mixed with illite, apatite, and goethite. Therefore, the formation of native copper and austenite CaZnAsO4(OH) is possible.
At the beginning of the experiment, the As species in solution are the same, namely, iron arsenate complexes with a small proportion of magnesium and aluminum complexes, but arsenic acid predominates (H3AsO4 and H2AsO4, Figure S3). When the S/R = 96, the As concentration sharply decreases, and the proportion of arsenic complexes with metals also decreased. In general, for the experiment with NaOH, the As complexes with metals are not characteristic in the solution, due to the sharp decrease in the iron concentration in the solution at high S/R ratio, which will be discussed subsequently. HAsO42− and AsO43− are the predominant species, with a small proportion of calcium arsenate.
So, in experimental settings, abundant Cu, Al, Fe, Mg arsenates precipitation can occur compared to model mineral phases via pH increase Fe arsenate symplesite → Ca, Cu, Zn, Pb arsenates (Conichalcite, Shultenite Austinite) → Ca arsenate Ca3(AsO4)2∙4H2O. HCh modeling, together with experimental results, indicate that Ca in these solutions is very low due to the low solubility of its arsenates. Most likely, that native copper, quartz, as well as illite require higher reaction time in order to precipitate in the experiment.

4. Discussion

For a comparative assessment of the effectiveness of the reagents used, the changes in the different parameters are summarized in the corresponding diagrams (Figures S4 and S5). A decrease in the acidity of the solution (increasing pH values) most rapidly occurred in the experiment with NaOH, and the slightly acidic conditions (pH 5.29) were recorded at S/R = 96 (10.4 g of reagent was added). The same pH value (5.32) in the experiment with Na2S was reached at S/R = 38 (26.4 g was added); in addition, in the experiment with Ca(OH)2, a pH of 5.17 was reached only after adding 40.4 g (S/R = 25).
In experiments with NaOH and Na2S, the mineralization of the solution increased with the decrease in the S/R ratio, due to an increase in the Na concentration. Sodium precipitation in the form of thenardite and mirabilite did not have a significant effect on its concentration in the solution, due to the high solubility of thenardite and mirabilite. However, in the experiment with Ca(OH)2, the mineralization decreased with increasing pH, due to the formation of a large amount of gypsum in the first stages, and then due to the formation of calcite. The element deposition also occurred differently. The most effective deposition of Fe, As, and Zn occurred in the experiment with NaOH and began at earlier stages. However, in the experiment with NaOH, the release of arsenic to 310 mg/L into the solution was observed at earlier stages compared with the other experiments, and this release negated the effectiveness of this reagent. An increase in the As concentrations occurred in the other two experiments, up to 2.6 mg/L in the experiments with Ca(OH)2, and up to 113 mg/L in experiments with Na2S. Note that Cu began to precipitate earlier in the experiment with Na2S, which was facilitated by the formation of a chalcocite suspension.
These processes can be explained by the thermodynamic calculation of the amounts and mineral compositions of the suspension formed during the experiments at different S/R ratios. As a result of the interaction of the solution with Ca(OH)2, gypsum and Fe(OH)3(am) are already formed, even at high S/R ratios. Only at S/R = 49 do small amounts of schultenite and conichalcite begin to form, which leads to the removal of 40 mg of arsenic from the solution in the form of As phases. At the same stage (S/R = 49), gibbsite and alunite are formed. In a field experiment with S/R = 49, 760 mg of arsenic was removed from the solution, which we associated with sorption on the surface of amorphous Fe-hydroxides (Figure S6). The effective purification of As-containing solutions using iron sulfate (the formation of amorphous iron hydroxides) has been known for a long time and is widely used [67].
The most significant binding and As removal occurred when the solution was at saturation with respect to the Ca3(AsO4)2·4H2O. When the S/R ratio was 25, 990 mg of As precipitated according to the numerical simulation results. In the field experiment, it was at this stage (S/R = 25) that a sharp decrease in As concentrations from 320 to 0.14 mg/L was also recorded.
Unlike Ca(OH)2, the Na2S at much earlier stages caused the binding of arsenic in the form of symplesite, which began to form under acidic conditions at S/R = 96 (Figure S7). At this stage, the formation of its highest amount took place; in the subsequent steps of the experiment, symplesite remained the only As mineral. However, if the As-containing phases were formed up to the very end in the experiment with Ca(OH)2, then the formation of symplesite in the experiment with Na2S was reduced up to the end of the experiment. Perhaps this formation of As-containing phases, in addition to desorption from iron hydroxides, explains the sharp increase in the As concentrations at the end of the experiment with Na2S.
The formation of As-containing pyrite in the last stages of the experiment with Na2S under alkaline conditions led to a decrease in the Fe concentration (Figure 6).
From the first steps of the experiment with NaOH, due to the neutralization process, a large suspension quantity was formed, mainly Fe(OH)3(am) and symplesite, which immediately removed 240 mg of arsenic (Figure S8). In the subsequent stages, As minerals were formed in greater or lesser amounts. Moreover, if there was only symplesite at the first two steps of the experiments with NaOH, then in the future steps, conichalcite and schultenite were formed, and then again, the symplesite was in a mixture with austenite; at the final stages, the Ca3(AsO4)2·4H2O phase appeared, which led to a sharp decrease in the As concentration. However, although the As-containing minerals in this experiment could be formed until the end of the process, As leaching in the alkaline solutions was also observed, due to desorption and dissolution.
NaOH is the most effective compound for the deposition of As and Fe: the pH value increased to 11.45 at S/R = 60. To achieve the neutral pH value of the solution, it was necessary to add approximately 10 g of NaOH, 30 g of Na2S, and 50 g of Ca(OH)2. It is advisable to use NaOH in the first stage of the technological treatment. The removal of 99.9% arsenic and other elements from the solution was achieved in a narrow pH range for experiments with all three reagents. When using Ca(OH)2, the best result is obtained at S/R ~20; in the experiment with Na2S, this S/R ratio can be ~55–50; and with NaOH, the best result is obtained at S/R ~100–80. In the experiments with Ca(OH)2 and NaOH, the minimum As concentrations were 0.14–0.15 mg/L and 0.13–0.11 mg/L, respectively. This result required 40–50 g Ca(OH)2 and 10–12 g NaOH. In the experiment with Na2S, the minimum As concentration was 0.78 mg/L, which is a high value even for technological effluents. In this case, the presence of Fe has a negative effect. Since Fe is the first element to be reduced in the solution, a competing reaction of iron sulfide formation occurs. For the precipitation of Zn and Cu, Ca(OH)2 was the most effective reagent; the minimum concentrations of Zn and Cu were 0.021 mg/L and 0.009 mg/L, respectively. Lead was best removed in the experiment with NaOH. A serious drawback of the use of Na2S and NaOH is the high Na mobility. At the end of the experiment with Na2S, the excess concentration of Na was 60 times higher than the MPC for Na; additionally, in the experiment with NaOH, it was almost two orders of magnitude higher than the MPC for Na.
The correlation analysis of As bonds with other elements in the solution after the interaction with Ca(OH)2, Na2S, and NaOH and deposition of solid phases was performed (Table 9). High positive correlation coefficients were revealed between arsenic and metals (Cu, Zn, Pb, Cd, Cr, Ni, Ag, V, Mo, Sn, In) and metalloids (Sb, Bi, P) when interacting with all reagents. This means similar behavior of these components in all three experiments and deposition of solid phases of complex composition: 1) arsenates, sulfo- and hydroxo-arsenates, oxides of Ca, Mg, Fe, Zn, Cu, and Pb; 2) colloidal hydroxides of Fe, Mn, and Al with metals and As sorbed on their surface; 3) compounds of unknown composition that do not occur in nature.
Positive correlation between As and Ca, Mg, Al, Fe, Zn, Cu, and Pb in solutions after interaction with Ca(OH)2 is explained by the formation of arsenates, sulfo- and hydroxo-arsenates and other compounds confirmed by thermodynamic modeling and found in sediments using XRD analysis: Ca3(AsO4)2∙4aq, Fe-Ca minerals containing As, arsenosiderite Ca3Fe4(AsO4)(OH)6·3H2O austinite, conichalcite, shultenite (Table 3 and Table 4, Figure 8). The positive correlations of As with Fe, Zn, Cu in the experiment with Na2S are due to the formation of symplesite, scorodite, Fe-Na sulfates with As and Zn, pyrite with As, chalcophyllite, tennantite, and Zn2As2O7 (Table 5 and Table 6, Figure 9). Positive correlations of As and Ca, Mg, Pb, Zn, Cu, and Fe, in the experiment with NaOH, are associated with the formation of Ca3(AsO4)2∙4aq, Mg(H2AsO4)2, shultenite PbHAsO4, austinite CaZnAsO4(OH), conichalcite CaCuAsO4, symplesite Fe2+3(AsO4)2·8H2O, scorodite FeAsO4·2H2O, chalcophyllite Cu18Al2(AsO4)4(SO4)3(OH)24·36H2O, and kaatialaite FeAs3O9·8H2O (Table 7 and Table 8, Figure 10).
The deposition of arsenic due to sorption on colloidal hydroxide iron (III), manganese (IV) and aluminum (III) compounds when the pH shifts to the alkaline values in experiments with Ca(OH)2 and NaOH is indicated by positive significant correlations of the contents of As and Al, Fe, and Mn (r = 0.8/0.9). Above, we showed the formation of colloforms of Fe minerals containing As (up to 3.2%) and Cu (0.34%) after the interaction with NaOH (Figure 10) and colloform mixture of gypsum, goethite, and hydroxosulfates of Al, Mg, and Fe, with ultrafine inclusions of As-containing grains after the interaction with Ca(OH)2 using scanning electron microscopy (SEM analysis) (Figure 4). When forming a suspension, not only those phases that were found in precipitation and determined by the thermodynamic modelling, but also multicomponent compounds, which, possibly, have no analogues in nature, including Cr, Ni, Bi, In, V, Mo, Sn, and Ag. The co-precipitation of many elements must be taken into account when developing practical recommendations for the subsequent use of the precipitate.
On the whole, the use of NaOH is advisable in the first steps of the solution neutralization, and the further precipitation of metals and metalloids should be carried out using Ca(OH)2.

5. Conclusions

  • A case study for both acidic solutions neutralization and metal precipitation from highly mineralized solutions was conducted in situ experiments. This study was developed in order to evaluate feasibility and duration prior to the performance of full-scale research and applied projects to remove dissolved arsenic (approximately 80–120 kg) from the brown ponds, on the surface of long-stored tailings.
  • Neutralization of acidic multicomponent solutions of reservoirs on the Berikul tailings is most effective by NaOH (caustic soda) in comparison with Ca(OH)2 and Na2S. Due to its advantages, at a solution/reagent ratio of ~100, pH increased to 5.3, but using Na2S to 3.6, and with Ca(OH)2 only to 2.6. Arsenic compounds (symplesite) began to form and precipitate in the first steps of the NaOH experiment, which led to its efficient removal from solution. However, its disadvantage is a higher As concentration at pH 11.45 of 310 mg/L.
  • In terms of efficiency, Ca(OH)2 exhibits the smallest pH-buffer ability, but generates the greatest bulk sediments (100 g), which is due to gypsum and carbonate precipitation. In the grains of gypsum and other Fe-Ca minerals, ultrafine inclusions of the As-containing phases, hypothetically, arsenosiderite and Ca3(AsO4)2∙4H2O, were detected. Calcium hydroxide is the preferred method of most facilities due to its low cost. Sodium sulfide Na2S treatment seems more advantageous than lime, because it can precipitate arsenic faster than the other chemicals at pH = 3.6, due to the sedimentation of simplesite. However, minimum arsenic content in solution was 0.78 mg/L, which is significantly higher than that in the experiments with Ca(OH)2 and NaOH.
  • The obtained findings are quite important, since they allow us to recommend the use of NaOH in the first stages for full-scale experiments in combination with Na2S and then, starting with the S/R = 100, replace them with Ca(OH)2. None of the reagents alone work well for these acid multicomponent solutions.

Supplementary Materials

The following are available online at https://www.mdpi.com/2075-163X/10/10/867/s1, Figure S1. Changes in the As species in the solutions during the experiments with Ca(OH)2 at a decrease in the solution/reagent ratio. Figure S2. Changing As species in solution during the experiment with Na2S at a decrease in the water/rock ratio. Figure S3. The change in As species during the experiment with NaOH at a decrease in the solution/reagent ratio. Figure S4. Comparison of the changes in the physicochemical parameters of the solution in the experiments. Figure S5. Comparison of changes in elemental concentrations in experiments. Figure S6. The amount and phase composition of the resulting precipitate in the experiment with Ca(OH)2. Hereinafter: numbers above circles denote the amount of As removed from the solution; Figure S7. The amounts and phase compositions of the resulting suspensions in the experiment with Na2S. Figure S8. The amounts and phase compositions of the resulting suspensions in the experiment with NaOH.

Author Contributions

S.B.: Conceptualization, Methodology, Investigation, Writing–Original Draft, Visualization. O.G.: Formal analysis, Data Curation, Validation, Writing–Review and Editing, N.Y.: Methodology, Investigation, Resources, Writing–Review and Editing, O.S.: Formal analysis, Resources, Investigation, Validation. N.A.: Formal analysis, Data Curation, Writing–Review and Editing, Visualization. All authors have read and agreed to the published version of the manuscript.

Funding

This work was supported by the Russian Science Foundation [19–17–00134].

Acknowledgments

The authors gratefully thank Academic Editor Carlito Tabelin, and anonymous reviewers for helpful comments and recommendations on this manuscript.

Conflicts of Interest

The authors declare that they have no known competing financial interests or personal relationships that could have appeared to influence the work reported in this paper.

References

  1. Gazea, B.; Adam, K.; Kontopoulos, A. A review of passive systems for the treatment of acid mine drainage. Min. Eng. 1996, 9, 23–42. [Google Scholar] [CrossRef]
  2. Lee, G.; Bigham, J.M.; Faure, G. Removal of trace metals by coprecipitation with Fe, Al and Mn from natural waters contaminated with acid mine drainage in the Ducktown Mining District, Tennessee. Appl. Geochem. 2002, 17, 569–581. [Google Scholar] [CrossRef]
  3. Tabelin, C.B.; Hashimoto, A.; Igarashi, T.; Yoneda, T. Leaching of boron, arsenic and selenium from sedimentary rocks: II. pH dependence, speciation and mechanisms of release. Sci. Total Environ. 2014, 473–474, 244–253. [Google Scholar] [CrossRef] [PubMed]
  4. Tamoto, S.; Tabelin, C.B.; Igarashi, T.; Ito, M.; Hiroyoshi, N. Short and long term release mechanisms of arsenic, selenium and boron from a tunnel-excavated sedimentary rock under in situ conditions. J. Contam. Hydrol. 2015, 175–176, 60–71. [Google Scholar] [CrossRef] [PubMed]
  5. Pozo, G.; Pongy, S.; Keller, J.; Ledezma, P.; Freguia, S. A novel bioelectrochemical system for chemical-free permanent treatment of acid mine drainage. Water Res. 2017, 126, 411–420. [Google Scholar] [CrossRef]
  6. Tabelin, C.B.; Igarashi, T.; Villacorte-Tabelin, M.; Park, I.; Opiso, E.M.; Ito, M.; Hiroyoshi, N. Arsenic, selenium, boron, lead, cadmium, copper, and zinc in naturally contaminated rocks: A review of their sources, modes of enrichment, mechanisms of release, and mitigation strategies. Sci. Total Environ. 2018, 645, 1522–1553. [Google Scholar] [CrossRef]
  7. Rodriguez, M.; Manuel Baena-Moreno, F.; Arroyo, F.; Zhang, Z. Remediation of acid mine drainage. Springer 2019, 17, 1529–1538. [Google Scholar] [CrossRef]
  8. Tomiyama, S.; Igarashi, T.; Tabelin, C.B.; Tangviroon, P.; Ii, H. Acid mine drainage sources and hydrogeochemistry at the Yatani mine, Yamagata, Japan: A geochemical and isotopic study. J. Contam. Hydrol. 2019, 225, 103502. [Google Scholar] [CrossRef]
  9. dos Santos, K.B.; de Almeida, V.O.; Weiler, J.; Schneider, I.A.H. Removal of Pollutants from an AMD from a Coal Mine by Neutralization/Precipitation Followed by “In Vivo” Biosorption Step with the Microalgae Scenedesmus sp. Minerals 2020, 10, 711. [Google Scholar] [CrossRef]
  10. Ríos, C.A.; Williams, C.D.; Roberts, C.L. Removal of heavy metals from acid mine drainage (AMD) using coal fly ash, natural clinker and synthetic zeolites. J. Hazard. Mater. 2008, 156, 23–35. [Google Scholar] [CrossRef]
  11. Makarova, M.; Abrosimova, N.; Rybkina, E.; Fiaizullina, R.; Nikolaeva, I. Experimental investigation of sorption of microelements from mine drainage on zeolite and clay. SGEM 2017, 17, 447–455. [Google Scholar]
  12. Gaskova, O.L.; Bukaty, M.B. Sorption of different cations onto clay minerals: Modelling approach with ion exchange and surface complexation. Phys. Chem. Earth Part A/B/C 2008, 33, 1050–1055. [Google Scholar] [CrossRef]
  13. Saeva, O.P.; Yurkevich, N.V.; Kabannik, V.G.; Kolmogorov, Y.P. Determining the effectiveness of natural reactive barriers for acid drainage neutralization using SR-XRF method. Bull. Russ. Acad. Sci. Phys. 2013, 77. [Google Scholar] [CrossRef]
  14. Farooq, S.H.; Chandrasekharam, D.; Berner, Z.; Norra, S.; Stüben, D. Influence of traditional agricultural practices on mobilization of arsenic from sediments to groundwater in Bengal delta. Water Res. 2010, 44, 5575–5588. [Google Scholar] [CrossRef]
  15. Kefeni, K.K.; Mamba, B.B. Evaluation of charcoal ash nanoparticles pollutant removal capacity from acid mine drainage rich in iron and sulfate. J. Clean. Prod. 2020, 251, 119720. [Google Scholar] [CrossRef]
  16. Hua, M.; Zhang, S.; Pan, B.; Zhang, W.; Lv, L.; Zhang, Q. Heavy metal removal from water/wastewater by nanosized metal oxides: A review. J. Hazard. Mater. 2012, 211–212, 317–331. [Google Scholar] [CrossRef]
  17. Sepehrian, H.; Ahmadi, S.J.; Waqif-Husain, S.; Faghihian, H.; Alighanbari, H. Adsorption Studies of Heavy Metal Ions on Mesoporous Aluminosilicate, Novel Cation Exchanger. J. Hazard. Mater. 2010, 176, 252–256. [Google Scholar] [CrossRef]
  18. Fu, F.; Wang, Q. Removal of heavy metal ions from wastewaters: A review. J. Environ. Manag. 2011, 92, 407–418. [Google Scholar] [CrossRef]
  19. Abrosimova, N.; Saeva, O.; Bortnikova, S.B.; Edelev, A.V.; Korneeva, T.V.; Yurkevich, N.V. Metals and Metalloids Removal from Mine Water Using Natural and Modified Heulandite. Int. J. Environ. Sci. Dev. 2019, 9, 202–205. [Google Scholar] [CrossRef]
  20. Kiventerä, J.; Piekkari, K.; Isteri, V.; Ohenoja, K.; Tanskanen, P.; Illikainen, M. Solidification/stabilization of gold mine tailings using calcium sulfoaluminate-belite cement. J. Clean. Prod. 2019, 239, 118008. [Google Scholar] [CrossRef]
  21. Wilkin, R.T.; McNeil, M.S. Laboratory evaluation of zero-valent iron to treat water impacted by acid mine drainage. Chemosphere 2003, 53, 715–725. [Google Scholar] [CrossRef]
  22. Hammarstrom, J.M.; Sibrell, P.L.; Belkin, H.E. Characterization of limestone reacted with acid-mine drainage in a pulsed limestone bed treatment system at the Friendship Hill National Historical Site, Pennsylvania, USA. Appl. Geochem. 2003, 18, 1705–1721. [Google Scholar] [CrossRef]
  23. Doye, I.; Duchesne, J. Neutralisation of acid mine drainage with alkaline industrial residues: Laboratory investigation using batch-leaching tests. Appl. Geochem. 2003, 18, 1197–1213. [Google Scholar] [CrossRef]
  24. Park, I.; Tabelin, C.B.; Jeon, S.; Li, X.; Seno, K.; Ito, M.; Hiroyoshi, N. A review of recent strategies for acid mine drainage prevention and mine tailings recycling. Chemosphere 2019, 219, 588–606. [Google Scholar] [CrossRef] [PubMed]
  25. Jung, H.; Shin, T.; Cho, N.; Kim, T.; Kim, J.; Ryu, T.; Song, K.; Hwang, S.; Ryu, B.; Han, B. Thermochemical study for remediation of highly concentrated acid spill: Computational modeling and experimental validation. Chemosphere 2020, 247, 126098. [Google Scholar] [CrossRef]
  26. Igarashi, T.; Herrera, P.S.; Uchiyama, H.; Miyamae, H.; Iyatomi, N.; Hashimoto, K.; Tabelin, C.B. The two-step neutralization ferrite-formation process for sustainable acid mine drainage treatment: Removal of copper, zinc and arsenic, and the influence of coexisting ions on ferritization. Sci. Total Environ. 2020, 715, 136877. [Google Scholar] [CrossRef]
  27. Tabelin, C.B.; Corpuz, R.D.; Igarashi, T.; Villacorte-Tabelin, M.; Ito, M.; Hiroyoshi, N. Hematite-catalysed scorodite formation as a novel arsenic immobilisation strategy under ambient conditions. Chemosphere 2019, 233, 946–953. [Google Scholar] [CrossRef]
  28. Mulopo, J. Continuous pilot scale assessment of the alkaline barium calcium desalination process for acid mine drainage treatment. J. Environ. Chem. Eng. 2015, 3, 1295–1302. [Google Scholar] [CrossRef]
  29. Kefeni, K.K.; Msagati, T.A.M.; Mamba, B.B. Acid mine drainage: Prevention, treatment options, and resource recovery: A review. J. Clean. Prod. 2017, 151, 475–493. [Google Scholar] [CrossRef]
  30. Lewis, A.; Van Hille, R. An exploration into the sulphide precipitation method and its effect on metal sulphide removal. Hydrometallurgy 2006, 81, 197–204. [Google Scholar] [CrossRef]
  31. Reis, F.D.; Silva, A.M.; Cunha, E.C.; Leão, V.A. Application of sodium- and biogenic sulfide to the precipitation of nickel in a continuous reactor. Sep. Purif. Technol. 2013, 120, 346–353. [Google Scholar] [CrossRef] [Green Version]
  32. Chen, T.; Yan, B.; Lei, C.; Xiao, X. Pollution control and metal resource recovery for acid mine drainage. Hydrometallurgy 2014, 147–148, 112–119. [Google Scholar] [CrossRef]
  33. Silwamba, M.; Ito, M.; Hiroyoshi, N.; Tabelin, C.B.; Fukushima, T.; Park, I.; Jeon, S.; Igarashi, T.; Sato, T.; Nyambe, I.; et al. Detoxification of lead-bearing zinc plant leach residues from Kabwe, Zambia by coupled extraction-cementation method. J. Environ. Chem. Eng. 2020, 8, 104197. [Google Scholar] [CrossRef]
  34. Mondal, P.; Majumder, C.B.; Mohanty, B. Laboratory based approaches for arsenic remediation from contaminated water: Recent developments. J. Hazard. Mater. 2006, 137, 464–479. [Google Scholar] [CrossRef] [PubMed]
  35. Asta, M.P.; Cama, J.; Martínez, M.; Giménez, J. Arsenic removal by goethite and jarosite in acidic conditions and its environmental implications. J. Hazard. Mater. 2009, 171, 965–972. [Google Scholar] [CrossRef]
  36. Jelenová, H.; Majzlan, J.; Amoako, F.Y.; Drahota, P. Geochemical and mineralogical characterization of the arsenic-, iron-, and sulfur-rich mining waste dumps near Kaňk, Czech Republic. Appl. Geochem. 2018. [Google Scholar] [CrossRef]
  37. Nazari, A.M.; Radzinski, R.; Ghahreman, A. Review of arsenic metallurgy: Treatment of arsenical minerals and the immobilization of arsenic. Hydrometallurgy 2017, 174, 258–281. [Google Scholar] [CrossRef]
  38. Asere, T.G.; Stevens, C.V.; Du Laing, G. Use of (modified) natural adsorbents for arsenic remediation: A review. Sci. Total Environ. 2019, 676, 706–720. [Google Scholar] [CrossRef]
  39. Kim, M.J.; Nriagu, J. Oxidation of arsenite in groundwater using ozone and oxygen. Sci. Total Environ. 2000, 247, 71–79. [Google Scholar] [CrossRef]
  40. Lièvremont, D.; Bertin, P.N.; Lett, M.C. Arsenic in contaminated waters: Biogeochemical cycle, microbial metabolism and biotreatment processes. Biochimie 2009, 91, 1229–1237. [Google Scholar] [CrossRef]
  41. Twidwell, L.G.; McCloskey, J.; Lee, M.; Saran, J. Arsenic Removal from Mine and Process Waters by Lime/Phosphate Precipitation. Proceedings of Arsenic Metallurgy: Fundamentals and Applications, Plenary Lecture, TMS, Warrendale, PA, USA, 13–17 February 2005; pp. 71–86. [Google Scholar]
  42. Noël, M.-C.; Demopoulos, G.P. Precipitation of crystalline svabite (Ca5(AsO4)3F) and Svabite/Fluorapatite (Ca5(AsO4)X(PO4)3-XF) Compounds and Evaluation of Their Long-Term Arsenic Fixation Potential. In Proceedings of the Metallurgists Proceedings, Canadian Institute of Mining, Metallurgy and Petroleum, Vancouver, BC, Canada, 11–14 May 2014. [Google Scholar]
  43. Valenzuela, A. Arsenic Management in the Metallurgical industry. Ph.D. Thesis, Université Laval, Québec, QC, Canada, 2000. [Google Scholar]
  44. Filippou, D.; St-Germain, P.; Grammatikopoulos, T. Recovery of metal values from copper—Arsenic minerals and other related resources. Miner. Process. Extr. Metall. Rev. 2007, 28, 247–298. [Google Scholar] [CrossRef]
  45. De Klerk, R.J.; Jia, Y.; Daenzer, R.; Gomez, M.A.; Demopoulos, G.P. Continuous circuit coprecipitation of arsenic(V) with ferric iron by lime neutralization: Process parameter effects on arsenic removal and precipitate quality. Hydrometallurgy 2012, 111–112, 65–72. [Google Scholar] [CrossRef]
  46. Demopous, G. Arsenic Immobilization Research Advances: Past, Present and Future. Proceedings of Conference of Metallurgists (COM), Canadian Institute of Mining, Metallurgy and Petroleum, Vancouver, BC, Canada, 28 September–1 October 2014. [Google Scholar]
  47. Duquesne, K.; Lebrun, S.; Casiot, C.; Bruneel, O.; Personné, J.C.; Leblanc, M.; Elbaz-Poulichet, F.; Morin, G.; Bonnefoy, V. Immobilization of Arsenite and Ferric Iron by Acidithiobacillus ferrooxidans and Its Relevance to Acid Mine Drainage. Appl. Environ. Microbiol. 2003, 69, 6165–6173. [Google Scholar] [CrossRef] [PubMed] [Green Version]
  48. Alam, R.; McPhedran, K. Applications of biological sulfate reduction for remediation of arsenic—A review. Chemosphere 2019, 222, 932–944. [Google Scholar] [CrossRef]
  49. Yun, H.; Jang, M.; Shin, W.; Choi, J. Remediation of arsenic-contaminated soils via waste-reclaimed treatment agents: Batch and field studies. Miner. Eng. 2018, 127, 90–97. [Google Scholar] [CrossRef]
  50. Gugushe, A.S.; Nqombolo, A.; Nomngongo, P.N. Application of Response Surface Methodology and Desirability Function in the Optimization of Adsorptive Remediation of Arsenic from Acid Mine Drainage Using Magnetic Nanocomposite: Equilibrium Studies and Application to Real Samples. Molecules 2019, 24, 1792. [Google Scholar] [CrossRef] [Green Version]
  51. Yuan, Z.; Zhang, G.; Ma, X.; Yu, L.; Wang, X.; Wang, S.; Jia, Y. Rapid abiotic As removal from As-rich acid mine drainage: Effect of pH, Fe/As molar ratio, oxygen, temperature, initial As concentration and neutralization reagent. Chem. Eng. J. 2019, 378, 122156. [Google Scholar] [CrossRef]
  52. Houngaloune, S.; Kawaai, T.; Hiroyoshi, N.; Ito, M. Study on schwertmannite production from copper heap leach solutions and its efficiency in arsenic removal from acidic sulfate solutions. Hydrometallurgy 2014, 147–148, 30–40. [Google Scholar] [CrossRef]
  53. Okibe, N.; Koga, M.; Morishita, S.; Tanaka, M.; Heguri, S.; Asano, S.; Sasaki, K.; Hirajima, T. Microbial formation of crystalline scorodite for treatment of As(III)-bearing copper refinery process solution using Acidianus brierleyi. Hydrometallurgy 2014, 143, 34–41. [Google Scholar] [CrossRef]
  54. Jahromi, F.G.; Ghahreman, A. In-situ oxidative arsenic precipitation as scorodite during carbon catalyzed enargite leaching process. J. Hazard. Mater. 2018, 360, 631–638. [Google Scholar] [CrossRef]
  55. Tabelin, C.; Sasaki, A.; Igarashi, T.; Tomiyama, S.; Villacorte-Tabelin, M.; Ito, M.; Hiroyoshi, N. Prediction of acid mine drainage formation and zinc migration in the tailings dam of a closed mine, and possible countermeasures. MATEC Web Conf. 2019, 268, 06003. [Google Scholar] [CrossRef]
  56. Tabelin, C.B.; Silwamba, M.; Paglinawan, F.C.; Mondejar, A.J.S.; Duc, H.G.; Resabal, V.J.; Opiso, E.M.; Igarashi, T.; Tomiyama, S.; Ito, M.; et al. Solid-phase partitioning and release-retention mechanisms of copper, lead, zinc and arsenic in soils impacted by artisanal and small-scale gold mining (ASGM) activities. Chemosphere 2020, 260, 127574. [Google Scholar] [CrossRef] [PubMed]
  57. Zhang, D.; Yuan, Z.; Wang, S.; Jia, Y.; Demopoulos, G.P. Incorporation of arsenic into gypsum: Relevant to arsenic removal and immobilization process in hydrometallurgical industry. J. Hazard. Mater. 2015, 300, 272–280. [Google Scholar] [CrossRef] [PubMed]
  58. Majzlan, J.; Drahota, P.; Filippi, M. Parageneses and crystal chemistry of arsenic minerals. Rev. Mineral. Geochemistry 2014, 79, 17–184. [Google Scholar] [CrossRef]
  59. Bortnikova, S.; Olenchenko, V.; Gaskova, O.; Yurkevich, N.; Abrosimova, N.; Shevko, E.; Edelev, A.; Korneeva, T.; Provornaya, I.; Eder, L. Characterization of a gold extraction plant environment in assessing the hazardous nature of accumulated wastes (Kemerovo region, Russia). Appl. Geochem. 2018, 93, 145–157. [Google Scholar] [CrossRef]
  60. Horowitz, A.; Demas, C.; Fitzgerald, K.; Miller, T. US Geological Survey Protocol for the Collection and Processing of Surface-Water Samples for the Subsequent Determination of Inorganic Constituents in Filtered Water (No. 94-539); US Geological Survey; USGS Earth Science and Information Center, Open-File Reports Section: Reston, VA, USA, 1994. [Google Scholar]
  61. Shvarov, Y.V. HCh: New potentialities for the thermodynamic simulation of geochemical systems offered by Windows. Geochem. Inter. 2008, 46, 834–839. [Google Scholar] [CrossRef]
  62. Garrels, R.; Christ, C. Solutions, Minerals, and Equilibria; Harper and Row: New York, NY, USA, 1965. [Google Scholar]
  63. Tabelin, C.B.; Corpuz, R.D.; Igarashi, T.; Villacorte-Tabelin, M.; Alorro, R.D.; Yoo, K.; Raval, S.; Ito, M.; Hiroyoshi, N. Acid mine drainage formation and arsenic mobility under strongly acidic conditions: Importance of soluble phases, iron oxyhydroxides/oxides and nature of oxidation layer on pyrite. J. Hazard. Mater. 2020, 399, 122844. [Google Scholar] [CrossRef]
  64. Bortnikova, S.; Bessonova, E.; Gaskova, O. Geochemistry of arsenic and metals in stored tailings of a Co-Ni arsenide-ore, Khovu-Aksy area, Russia. Appl. Geochem. 2012, 27, 2238–2250. [Google Scholar] [CrossRef]
  65. Gaskova, O.L.; Bessonova, E.P.; Bortnikova, S.B. Leaching Experiments on Trace Element Release from the Arsenic-Bearing Tailings of Khovu-Aksy (Tuva Republic, Russia). Appl. Geochem. 2003, 18, 1361–1371. [Google Scholar] [CrossRef]
  66. Andreev, S.Y.; Kochergin, A.C.; Malutina, T.V.; Alekseeva, T.V. The Use of Precipitating Agents in the Wastewater Treatment of Galvanic Plants; PH PEGAS: Pensa, Russia, 2016; Volume 116. (In Russian) [Google Scholar]
  67. Gas’kova, O.L.; Bortnikova, S.B.; Airiyants, A.A.; Kolmogorov, Y.P.; Pashkov, M.V. Geochemical features of an anthropogenic impoundment with cyanidation wastes of gold-arsenopyrite-quartz ores. Geochem. Int. 2000, 38, 281–291. [Google Scholar]
Figure 1. (a) Geographic position; (b) sample site at the Berikul tailings; and (c) photograph of acid ponds.
Minerals 10 00867 g001
Figure 2. Changes in the physicochemical conditions and EC during the experiment with Ca(OH)2. Hereinafter, the italic numbers above the abscissa axis indicate the steps of the experiment. At the experiment with Ca(OH)2, physico-chemical parameters and element concentrations were measured at solution/reagent ratios (S/R): 1—5000; 2—2500; 3—185; 4—96; 5—65; 6—49; 7—33; 8—25; 9—20; 10—17.
Minerals 10 00867 g002
Figure 3. Changes in the elemental concentrations during the experiment with Ca(OH)2.
Minerals 10 00867 g003
Figure 4. Scanning electron microscopy images of the precipitates after the experiments with Ca(OH)2: (a) fine-grained crystals of gypsum in the groundmass of Fe-Ca minerals containing As (possibly arsenosiderite); (b) colloform mixture of gypsum, goethite, and hydroxosulfates of Al, Mg, and Fe, with ultrafine inclusions of As-containing grains. Cu and Zn were found as impurities in gypsum and goethite; (c) a mixture of Fe-Ca- minerals with calcite.
Minerals 10 00867 g004
Figure 5. Changes in the physicochemical conditions and EC during the experiment with Na2S. S/R ratio decreased as follows: 1—5000; 2—2500; 3—714; 4—417; 5—294; 6—227; 7—156; 8—119; 9—96; 10—69; 11—54; 12—38; 13—24.
Minerals 10 00867 g005
Figure 6. Changes in the elemental concentrations during the experiment with Na2S.
Minerals 10 00867 g006
Figure 7. Scanning electron microscopy images of the precipitates after the experiments with Na2S: (a) crystals of native sulfur in the mass of sulfates; (b) fine-grained intergrowths of sulfates; (c) veins and borders of pyrite in the mass of sulfates.
Minerals 10 00867 g007
Figure 8. Changes in the physicochemical conditions and EC during the experiment with NaOH. S/R ratio decreased as follows: 1—5000; 2—2500; 3—714; 4—417; 5—294; 6—227; 7—156; 8—119; 9—96; 10—81; 11—69; 12—61.
Minerals 10 00867 g008
Figure 9. Changes in the element concentrations during the experiment with NaOH.
Minerals 10 00867 g009
Figure 10. Scanning electron microscopy images of the precipitates after the experiments with NaOH: (a) colloforms of Fe minerals containing As (up to 3.2%) and Cu (0.34%); (b) fine-grained inclusions of Fe-minerals (presumably scorodite) in thenardite, with impurities of Cu (up to 0.4%), Zn (up to 0.53%), and Al (up to 1.6%); (c) calcite grains in a druse of thenardite.
Minerals 10 00867 g010
Table 1. Chemical composition of the Berikul pond water formed on the top of mine wastes, Eh in mV, electrical conductivity (EC) in mSm/cm, element concentration in mg/L.
Ber-1/0 Ber-1/0
pH2.10Zn140
Eh657Pb6.4
EC11Cd3.4
SO42−27,000Ba0.32
Ca630Rb0.0072
Mg420Sr1.9
Na22As1300
K6.20Sb0.18
Al520Bi1.7
Fe8600P34
Mn18Mo0.052
Cr3.2Sn0.028
Co4.2In0.054
Ni4.8Ag0.0064
Cu32
Table 2. The weight of the portion (PW, g), the total weight of the reagent (TW, g) and the ratios of the solution and the reagent (S/R) during the experiments.
SampleCa(OH)2SampleNa2SSampleNaOH
PW, gTW, gS/RPW, gTW, gS/RPW, gTW, gS/R
B-1/1/10.200.205000B-1/2/10.200.205000B-1/3/10.200.205000
B-1/1/20.200.402500B-1/2/20.200.402500B-1/3/20.200.402500
B-1/1/35.05.4185B-1/2/31.01.4714B-1/3/31.01.4714
B-1/1/45.01096B-1/2/41.02.4417B-1/3/41.02.4417
B-1/1/55.01565B-1/2/51.03.4294B-1/3/51.03.4294
B-1/1/65.02049B-1/2/61.04.4227B-1/3/61.04.4227
B-1/1/7103033B-1/2/72.06.4156B-1/3/72.06.4156
B-1/1/8104025B-1/2/82.08.4119B-1/3/82.08.4119
B-1/1/9105020B-1/2/92.01096B-1/3/92.01096
B-1/1/10106017B-1/2/104.01469B-1/3/102.01281
B-1/2/114.01854B-1/3/112.01469
B-1/2/128.02638B-1/3/122.01661
B-1/2/13164224
Table 3. Mineral composition of the precipitates after the experiment with Ca(OH)2 (XRD analysis).
MajorMinorTrace
GypsumCaSO4∙2H2OEttringiteCa6Al2(OH)12(SO4)3∙26H2OPickeringiteMgAl2(SO4)4·22H2O
Amorphous phaseFe(OH)3BassaniteCaSO4·0.5H2OPlohmiteAlO(OH)
AluniteKAl3(SO4)2(OH)6ArsenosideriteCa3Fe4(AsO4) (OH)6·3H2O
CalciteCaCO3ButleriteFe(OH)SO4·2H2O
SideriteFeCO3
Table 4. Model quantity of precipitated minerals, mg (numerical simulation for Ca(OH)2 experiments).
PrecipitantFormulaMass of Minerals
Mass of Ca(OH)2(s), g2.110.420.440.450.460.4
S/R ratio4809649252017
TenoriteCuO 40
HausmanniteMn2+Mn3+2O4 19
ZinciteZnO 170
GibbsiteAl(OH)3 140096
PortlanditeCa(OH)2 35,000
BruciteMg(OH)2 1007
Fe(OH)3(am) 450065002300
CalciteCaCO3 21,0001790
DolomiteCaMg(CO3)2 300093
CerussitePbCO3 7.9
RhodochrositeMnCO3 237
AluniteKAl3(SO4)2(OH)6 60
GypsumCaSO4∙2H2O603020,20014,4001780
AnglesitePbSO46.66.7
Apatite-OHCa5(PO4)3(OH) 17010
Ca3(AsO4)2∙4aq 3310150620
ShultenitePbHAsO4 11
AustiniteCaZnAsO4(OH) 50063
ConichalciteCaCuAsO4 120
EttringiteCa6Al2(SO4)3(OH)12∙26H2O 12,100
Table 5. Mineral composition of the precipitates after the experiment with Na2S (XRD analysis).
MajorMinorTrace
PyriteFeS2ThenarditeNa2SO4UzoniteAs4S5
Amorphous phaseFe(OH)3ScoroditeFeAsO4∙2H2OBasaluminiteAl4[(OH)10SO4]∙3.3–5H2O
TennantiteCu12As4S13MirabiliteNa2SO4∙10H2O
ChalcophylliteCu18Al2
(AsO4)4(SO4)3 (OH)24∙36H2O
-Zn2As2O7
-As2S5
GypsumCaSO4·2H2O-(Fe,Zn,Cu)SO4∙H2O
SulfurS
Table 6. Model quantity of precipitated minerals, mg (numerical simulation for Na2S experiments).
MineralFormulaMass of Mineral
Mass of Na2S(s), g0.2 10.414.418.426.442.4
S/R ratio50009669543824
SilicaSiO251
PyriteFeS2 64219029
GalenitePbS 7.4
SphaleriteZnS 2044.9
ChalcociteCu2S 40
ChalcopyriteCuFeS2 92
ArgentiteAg2S 0.01
GibbsiteAl(OH)3 46693437
Fe(OH)3(am) 25707508
AluniteKAl3(SO4)2(OH)6 66
GypsumCaSO4∙2H2O16253026
AnglesitePbSO47
Apatite-OHCa5(PO4)3(OH) 114672.8
KaoliniteAl2(Si2O5)(OH)4 81
SymplesiteFe2+3(AsO4)2·8H2O 4610362140120100
Table 7. Mineral composition of the precipitates after the experiment with NaOH (XRD analysis).
MajorMinorTrace
ThenarditeNa2SO4CalciteCaCO3KaatialaiteFeAs3O9·8H2O
GypsumCaSO4∙2H2OChalcophylliteCu18Al2(AsO4)4(SO4)3(OH)24 36H2OScoroditeFeAsO4·2H2O
Amorphous phaseFe(OH)3 Na3Al(SO4)3
Mg(H2AsO4)2
Table 8. Model quantity of the precipitated minerals, mg (numerical simulation for NaOH experiments).
MineralsFormulaMass of Mineral
Mass of NaOHs, g0.43.410.412.414.416.4
S/R Ratio250029496816961
CopperCu 32
SilicaSiO251
ChalcociteCu2S 40
GibbsiteAl(OH)3 145049
BruciteMg(OH)2 187816
Fe(OH)3(am) 11,00013041055 27
DolomiteCaMg(CO3)2 870
RhodochrositeMnCO3 11252
AluniteKAl3(SO4)2(OH)6 61
GypsumCaSO4∙2H2O2130323
AnglesitePbSO47
Apatite-OHCa5(PO4)3(OH) 16321
IlliteK0.65Al2.0[Al0.65Si3.35O10](OH)2 94
Ca3(AsO4)2∙4aq 1450250
ShultenitePbHAsO4 11
AustiniteCaZnAsO4(OH) 420140
ConichalciteCaCuAsO4 122
SymplesiteFe2+3(AsO4)2·8H2O19001100 1200
Pb(OH)2 7
Table 9. Values of correlation coefficients between As and elements in solution during the experiments with Ca(OH)2, Na2S and NaOH. Bold indicates values above which the correlation is statistically significant, with a probability of 99%.
CaMgNaKAlFeMnCrCoNiCuZn
Ca(OH)2−0.290.810.430.260.940.980.860.980.900.890.940.92
Na2S0.640.62−0.72−0.170.690.720.450.870.650.830.980.86
NaOH0.490.62−0.760.430.900.960.720.960.780.510.860.84
PbCdBaRbSrSbBiPVSnInAg
Ca(OH)20.990.950.830.000.320.980.970.980.980.970.960.97
Na2S0.980.93−0.020.390.540.920.951.000.870.990.910.82
NaOH0.980.810.630.590.720.960.970.990.970.980.950.99

