Article

Raman Spectroscopy and Single-Crystal High-Temperature Investigations of Bentorite, Ca6Cr2(SO4)3(OH)12·26H2O

1
Institute of Earth Sciences, Faculty of Natural Sciences, University of Silesia, Będzińska 60, 41-205 Sosnowiec, Poland
2
Institute of Mineralogy and Petrography, University of Innsbruck, Innrain 52, 6020 Innsbruck, Austria
*
Author to whom correspondence should be addressed.
Minerals 2020, 10(1), 38; https://doi.org/10.3390/min10010038
Submission received: 28 November 2019 / Revised: 25 December 2019 / Accepted: 27 December 2019 / Published: 30 December 2019

Abstract

:
The crystal structure of bentorite, ideally Ca6Cr2(SO4)3(OH)12·26H2O, a Cr3+ analogue of ettringite, is for the first time investigated using X-ray single crystal diffraction. Bentorite crystals of suitable quality were found in the Arad Stone Quarry within the pyrometamorphic rock of the Hatrurim Complex (Mottled Zone). The preliminary semi-quantitative data on the bentorite composition obtained by SEM-EDS show that the average Cr/(Cr + Al) ratio of this sample is >0.8. Bentorite crystallizes in space group P31c, with a = b = 11.1927(5) Å, c =21.7121(10) Å, V = 2355.60(18) Å3, and Z = 2. The crystal structure is refined, including the hydrogen atom positions, to an agreement index R1 = 3.88%. The bentorite crystal chemical formula is Ca6(Cr1.613Al0.387)Σ2[(SO4)2.750(CO3)0.499]Σ3.249(OH)11.502·~25.75H2O. The Raman spectra of bentorite from two different localities exhibit the presence of the main stretching and bending vibrations related to the sulfate group at 983 cm−11), 1109 cm−13), 442 cm−12), and 601 cm−14). Moreover, the presence of bands assigned to the symmetric Cr(OH)63− stretching mode and hydroxyl deformation vibrations of Cr–OH units at ~540 cm−1 and ~757 cm−1, respectively, may be used to distinguish between ettringite and bentorite. In situ high temperature single crystal XRD experiments show that the decomposition of bentorite starts at ca. 45 °C and that a dehydroxylation product similar to metaettringite is formed.

1. Introduction

Bentorite, with the ideal formula Ca6Cr2(SO4)3(OH)12·26H2O, was approved as a new mineral species by the Commission on New Minerals, Nomenclature and Classification (CNMNC) of the International Mineralogical Association (IMA) in 1979. The first report on this mineral stated that the powder diffraction pattern of bentorite was satisfactorily indexed by the analogy with ettringite Ca6Al2(SO4)3(OH)12·26H2O [1].
Bentorite occurs only under specific conditions, and it is very sensitive to temperature and humidity changes, e.g., for the synthesis of Cr substituted ettringite in the laboratory, it is essential to use the appropriate alkalinity (pH = 9.5–12.2) and reagent concentration in the solution (between 0.003 and 0.037 mol/dm3 of Cr3+) as reported by Wieczorek-Ciurowa et al. [2]. This explains an extremely rare occurrence of bentorite in nature and difficulties in finding crystals with good quality and size for the structural (single crystal) study. Hitherto, this phase was found only in pyrometamorphic rocks of the Hatrurim Complex [1,3,4,5].
There are a few works concerning the ettringite-bentorite series. At the Ma’ale Adummim locality, hexagonal prismatic crystals (up to 300 µm) were found, which exhibited a gradual color variation from transparent to violet. This color variation corresponds to the ettringite-bentorite solid solution series up to a Cr end-member content of 60% [3]. Furthermore, structure refinements of the Al end-member (ettringite) and two Cr3+ bearing ettringite crystals (with maximum Cr occupation at the octahedral site = 27.5%) were reported by Seryotkin et al. [4] for the same locality. Recently, the same group of authors performed a structural investigation of polycrystalline bentorite using synchrotron powder diffraction data, collected at room temperature (295 K) [5]. Their work confirmed that ettringite and bentorite were isostructural and that Al3+↔Cr3+ substitution took place without significant structural modifications.
Until now, the only temperature dependent investigation of bentorite was performed by Gross [1], where bentorite was concentrated for analysis by handpicking. The sample was proven to be 80% bentorite with some calcite and truscottite (Ca,Mn)14Si24O58(OH)8∙2H2O impurities. Differential thermal analysis (DTA) revealed an endothermic peak with a maximum at 155 °C. Furthermore, thermogravimetric analysis (TGA) exhibited a continuous weight decrease between 60 and 255 °C [1]. Thermogravimetric measurements of pure Cr3+ bentorite were done earlier by Drebushchak et al. [6]. They observed a total mass loss of 38.83 wt % for bentorite in the temperature range 20–800 °C.
In this paper, we present the results of the first single crystal structure refinement of bentorite with 80% Cr3+ occupation at the octahedral site. Moreover, an in situ high temperature single crystal XRD study reveals the onset of the decomposition of bentorite at 45 °C and the formation of a dehydroxylation product similar to “metaettringite” [7].

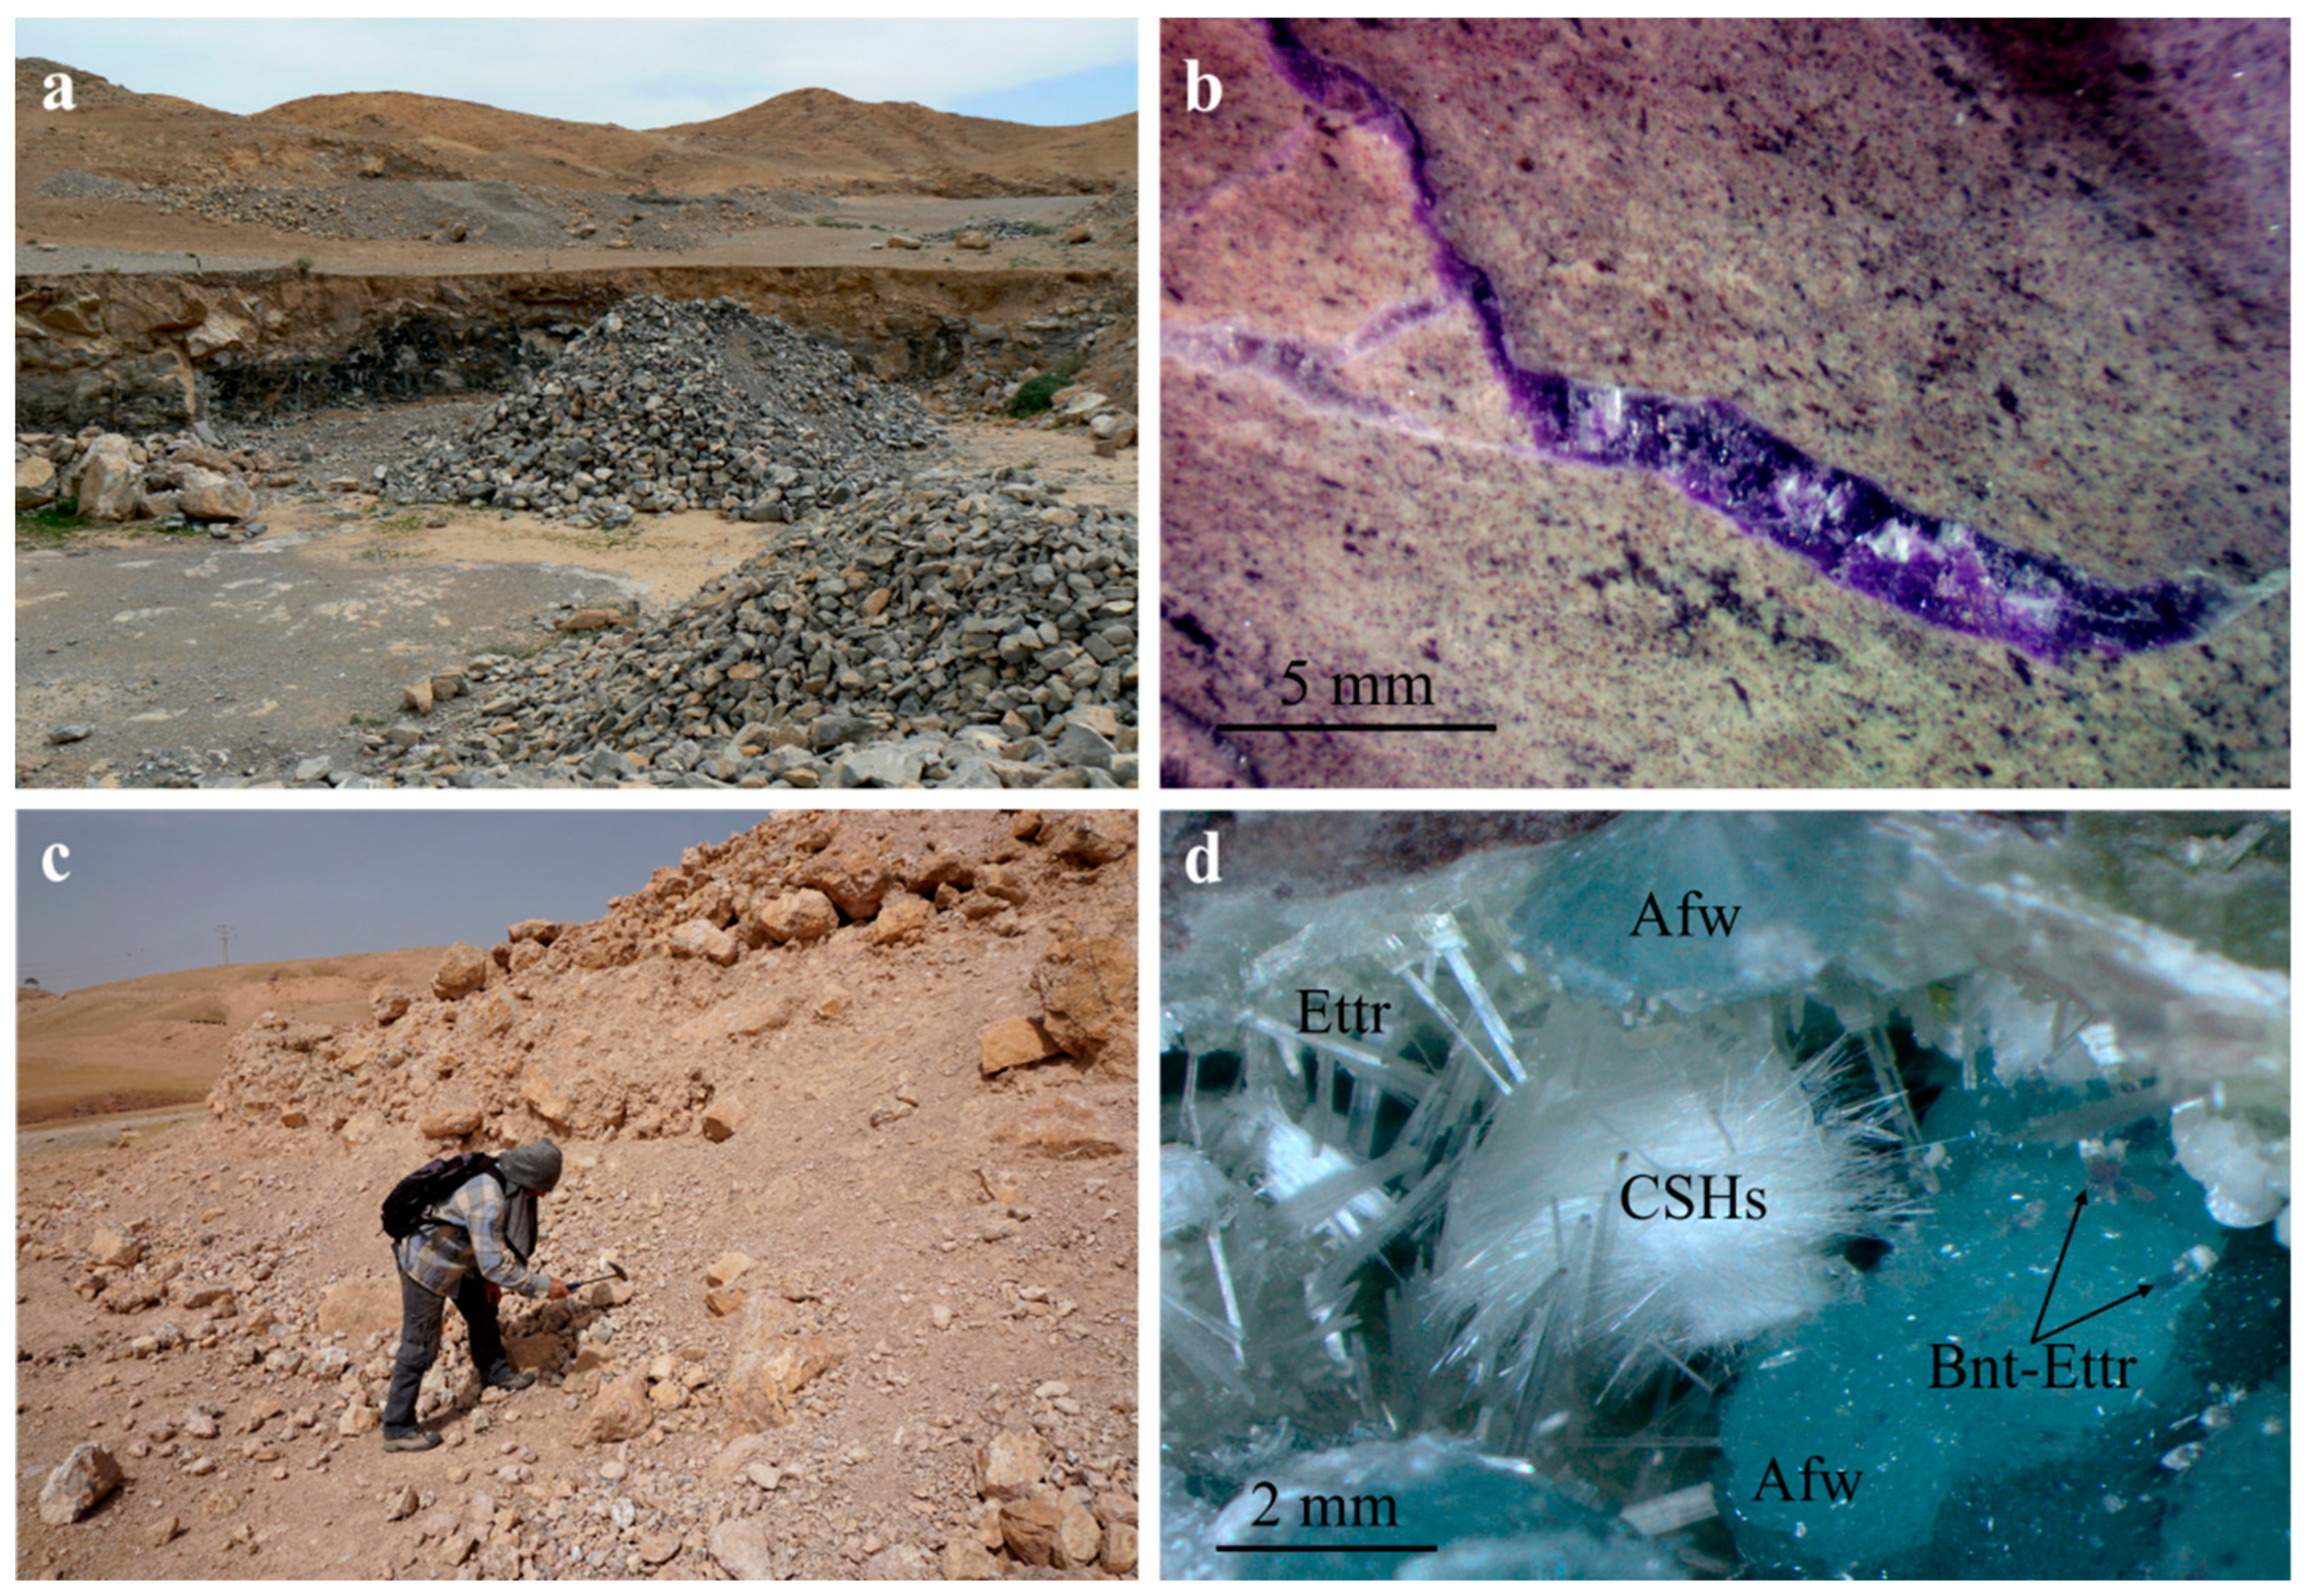
2. The Occurrence and Paragenesis of Bentorite

Dark-violet, prismatic bentorite crystals up to 150 µm in size, associated with calcite and ettringite, were found in low temperature veins within spurrite marble in the Arad Stone Quarry in the Negev Desert, Israel (Figure 1a,b). The studied rocks belonged to the pyrometamorphic Hatrurim Complex (Mottled Zone), which is distributed on both sides of the Dead Sea Transform Fault [5,8,9,10,11,12,13,14]. Besides the main rock forming minerals, spurrite and calcite, the minor concentrations of ye’elimite, shulamitite-sharyginite, brownmillerite, and fluorapatite-fluorellestadite were identified in the analyzed samples. Accessory minerals were represented by baryte, gibbsite, hydrocalumite, sphalerite, and pyrite. These spurrite marbles, commercially known as “Arad marble”, were mined as raw material for building stones and floor tiles. The age of the sedimentary protolith was estimated based on fossils, which were typical of the Middle to Upper Maastrichtian [10,13]. The temperature of spurrite formation at ambient pressure was estimated between 650 °C and 800 °C [15,16,17]. Most of these rocks were intensively altered due to low temperature hydrothermal and weathering processes. They were mainly replaced by Ca silicate hydrates, zeolites, aragonite, gypsum, hydrogarnets, and ettringite [18].
Minerals of the ettringite-bentorite series were also identified at Ma’ale Adummim locality in the territory of Palestine. This location composed of high temperature rock, which occurred within medium height hills, is a part of the Hatrurim Complex as well (Figure 1c). Those crystals together with blue afwillite, thaumasite, ettringite, calcite, Ca silicate hydrates, and minerals of the baryte-hashemite series form the low temperature hydrothermal assemblages in the hosted gehlenite-flamite rocks (Figure 1d). The uniqueness of these crystals is that the difference in color related to the variable Al/Cr ratio allowed us to recognize the members of this mineral series within one crystal. In contrast to the bentorite samples from Arad Stone, crystals from Ma’ale Adummim were larger (~300 µm) and well-shaped. This seems related to the crystallization conditions, as these crystals occurred in small cracks and cavities, mostly at the surface of blue spherical afwillite aggregates (Figure 1d), and did not form intergrowths like the bentorite crystals in thin veins from Arad Stone samples (Figure 1b).

3. Materials and Methods

The preliminary chemical composition, mineral association, and crystal morphology of bentorite from the Arad Stone Quarry and ettringite-bentorite mineral series from Ma’ale Adummim (for comparison) were examined using a scanning electron microscope Phenom XL (PhenomWorld, ThermoFisher Scientific, Eindhoven, The Netherlands) equipped with an EDS (energy dispersive X-ray spectroscopy) detector (Institute of Earth Sciences, Faculty of Natural Sciences, University of Silesia, Sosnowiec, Poland). Bentorite single crystals were mounted on carbon tape and sputtered with carbon. The chemical composition measurements were performed at high vacuum (1 Pa), with a beam voltage of 15 kV and working distance 6 mm. Point beam mode with the accumulation time of spectra of 10 s was chosen.
The Raman spectra of bentorite and ettringite from the Arad Stone Quarry and minerals of bentorite-ettringite series from Ma’ale Adummim were recorded on a WITec alpha 300R Confocal Raman Microscope (WITec, Ulm, Germany) (Institute of Earth Sciences, Faculty of Natural Sciences, University of Silesia, Sosnowiec, Poland) equipped with an air cooled solid laser of 488 nm and a CCD camera operating at −61 °C. The laser radiation was coupled to a microscope through a single mode optical fiber with a diameter of 3.5 μm. An air Zeiss (LD EC Epiplan-Neofluan DIC-100/0.75NA) objective was used. Raman scattered light was focused by an effective pinhole size of about 30 μm and a monochromator with a 600 mm−1 grating. The power of the laser at the sample position was 8–10 mW. Integration times of 5 s with the accumulation of 20 scans and a resolution of 3 cm−1 were chosen. The monochromator was calibrated using the Raman scattering line of a silicon plate (520.7 cm−1). Spectra processing such as baseline correction and smoothing was performed using the Spectracalc software package GRAMS (Galactic Industries Corporation, NH, USA). The Raman bands were fitted using a Gauss–Lorentz cross-product function with the minimum number of component bands used for the fitting process.
The single crystal X-ray diffraction study was carried out on a dark-violet crystal of bentorite (0.19 × 0.16 × 0.12 mm from the Arad Stone Quarry), using a Rigaku Oxford Diffraction Gemini R Ultra diffractometer (MoKα, λ = 0.71073 Å), equipped with a Ruby CCD detector and a graphite monochromator (Institute of Mineralogy and Petrography, University of Innsbruck, Austria). Data reduction and face based absorption correction after Clark and Reid [19] were processed using CrysAlisPro (Rigaku Oxford Diffraction, Yarnton, Oxforshire, UK) [20]. Experimental data and refinement details are summarized in Table 1.
The structure refinement was carried out using Jana2006 [21]. The crystal was subjected to racemic twinning, which was accounted for in the structure refinement. All atoms, except hydrogen, and the T3 (C3) site (low occupation) were modeled using anisotropic displacement parameters. Further, all H-atoms of the OH-groups and H2O were located in a difference Fourier map. The coordinates of the H-atoms were refined with restrained O–H distances, and their displacement parameters (Uiso) were set to 1.2 × Ueq of the corresponding oxygen atoms. The final atom coordinates (x,y,z), equivalent isotropic displacement parameters (Ueq, Å2), and occupancies were summarized in Supplemental Table S1. Anisotropic displacement parameters (Å2) are given in Supplemental Table S2.
For the in situ high temperature investigations, a violet prismatic crystal (from the Arad Stone Quarry) with good optical quality was selected. The crystal was fixed in a 0.1 mm (outer diameter) fused quartz capillary. The X-ray diffraction data collection was performed with a Stoe IPDS-II imaging plate diffractometer using graphite monochromatized Mo radiation and a crystal to detector distance of 100 mm (Institute of Mineralogy and Petrography, University of Innsbruck, Austria). The diffractometer was equipped with a Heatstream high temperature attachment (Stoe & Cie GmbH, Darmstadt, Germany), which used an open flow of nitrogen to subject the crystal to elevated temperatures. A detailed description of the experimental setup and temperature calibration procedure was reported by Krüger and Breil [22]. A hemisphere of the reciprocal space was collected every 5 °C, between 30 and 95 °C, using ω-scans with a step size of 1° and 5 min of exposure per frame. The total time of the data collection at one temperature was ca. 20 h (including the image plate read-out and erase phase). Integration of the data and reconstruction of precession like sections of the reciprocal space were done with X-Area [23].
The scanning electron microscopy investigation of the bentorite crystal after the HT XRD experiment was performed using a Jeol JSM-6010LV (Institute of Mineralogy and Petrography, University of Innsbruck, Innsbruck, Austria). The sample was Au sputtered, and the measurements were performed at high vacuum, with an acceleration voltage of 10 kV and a working distance of 43 mm.

4. Results

4.1. Chemical Composition

The normalized composition data of bentorite obtained using low intensity SEM-EDS are given in Table 2. The EDS spectra of bentorite from the Arad Stone Quarry for 10 analyses showed the ratio Cr/(Cr + Al) in the range 0.8–0.9. The average Cr/(Cr + Al) proportion was equal to 0.85. The calculated formula was Ca6.00(Cr1.71Al0.23Si0.06)(SO4)3(OH)12·26H2O.

4.2. Raman Spectroscopy

The Raman spectra of ettringite and bentorite from Arad Stone in the 100–1800 cm−1 and 3000–3800 cm−1 ranges are shown in Figure 2a,b, respectively. The bands at 983 cm−1 in bentorite and 993 cm−1 in ettringite, assigned to the ν1 symmetric stretching vibrations of (SO4)2−, were dominant in both of the Raman spectra. The position of this band in the ettringite spectrum corresponded to the previously published data for the synthetic and natural samples [24,25,26,27]. In the bentorite spectrum, this band was shifted to lower wavenumbers. Asymmetric stretching vibrations ν3 of (SO4)2− group were exhibited as bands at 1109 cm−1 in bentorite and at 1128 cm−1 in ettringite. The full width of bands related to the stretching vibrations of the sulfate group was broader in ettringite than in bentorite. The Raman bands at 442 cm−1 in bentorite and at 446 cm−1 in ettringite were ascribed to the ν2 (SO4)2− symmetric bending modes. In the ettringite spectrum, the band at 622 cm−1 corresponded to the asymmetric bending vibration ν3 of the (SO4)2− group, whereas in bentorite, the band related to this vibration was at 601 cm−1. We assigned the 547 cm−1 and 857 cm−1 bands, observed in the ettringite spectrum, to the Al–OH stretching and bending vibration of the Al(OH)63− unit, respectively, similar to previous reports [24,25,27]. Thus, the bands at 537 and 757 cm−1 in bentorite were most likely related to the vibration modes of Cr-OH in Cr(OH)63− [5,28]. Frost et al. [26], analyzing the spectra of natural ettringite, assigned the band at ~760 cm−1 to the hydroxyl deformation mode of Al–OH units. Moreover, in Zn/Cr hydrotalcite, bands in the 754–769 cm−1 range were attributed to the hydroxyl deformation modes associated with Cr-OH units [29]. Therefore, in the case of different types of elements occupying the octahedral site in ettringite and bentorite structures, we suggested assigning the band at 757 cm−1 in bentorite to the hydroxyl deformation vibration of Cr–OH units. The additional bands observed at 344 cm−1 and below 300 cm−1 were related to the Ca–O and lattice vibrations, respectively.
In the Raman spectrum of bentorite in the 3000–3800 cm−1 range, there was a broad band centered at 3469 cm−1 with two shoulders at 3400 and 3314 cm−1 and an intense band at 3618 cm−1 (Figure 2b). The first three bands were related to the H2O stretching modes, while the last one was attributed to OH stretching vibrations. In the Raman spectrum of ettringite, two broad bands without the characteristic bending between H2O and OH stretching vibration were observed. Bands at 3328, 3474, and 3575 cm−1 were recognized based on the second derivative and curve fitting of ettringite vibrational spectra. The band assigned to hydroxyl vibration was at 3638 cm−1 (Figure 2a). There were no bands in the 1800–3000 cm−1 range of the Raman spectra of the investigated phases. OH bending vibrations, presented as very weak bands, were noted at 1677 cm−1 and 1682 cm−1 for ettringite and bentorite, respectively (Figure 2a,b).
The hexagonal prismatic crystals of the minerals corresponded to the bentorite-ettringite series from Ma’ale Adummim locality were characterized by the gradual substitution of Al by Cr3+, which was reflected in the color change from colorless (ettringite) to dark-violet (bentorite) (Figure 2e). The Raman spectrum of dark-violet bentorite (the base part of the crystal showed Cr > Al) (Figure 2c) was almost identical to the bentorite spectrum from Arad Stone locality (Figure 2b). Small differences were observed in the spectral range associated with asymmetric bending vibrations ν4 of the (SO4)2− group, which were weakened in bentorite from Ma’ale Adummim, and instead of the one band, we observed two at 598 and 641 cm−1 (Figure 2c). Moreover, the low intensity band connected with Al-OH bending vibrations at 853 cm−1 was revealed in this spectrum. It is highly probable that the presence of this band was connected with the crystal orientation during the measurements because it was also observed in the spectrum of the transparent part of the crystal (Figure 2d). The colorless part of the crystal (Al > Cr) was identified as ettringite (Figure 2d). Its Raman spectrum was very similar to the spectrum presented in Figure 2a. Differences were noted in the intensity of bands and the presence of a band at 1065 cm−1, which was attributed to the symmetric stretching vibrations ν1 of the (CO3)2− group.

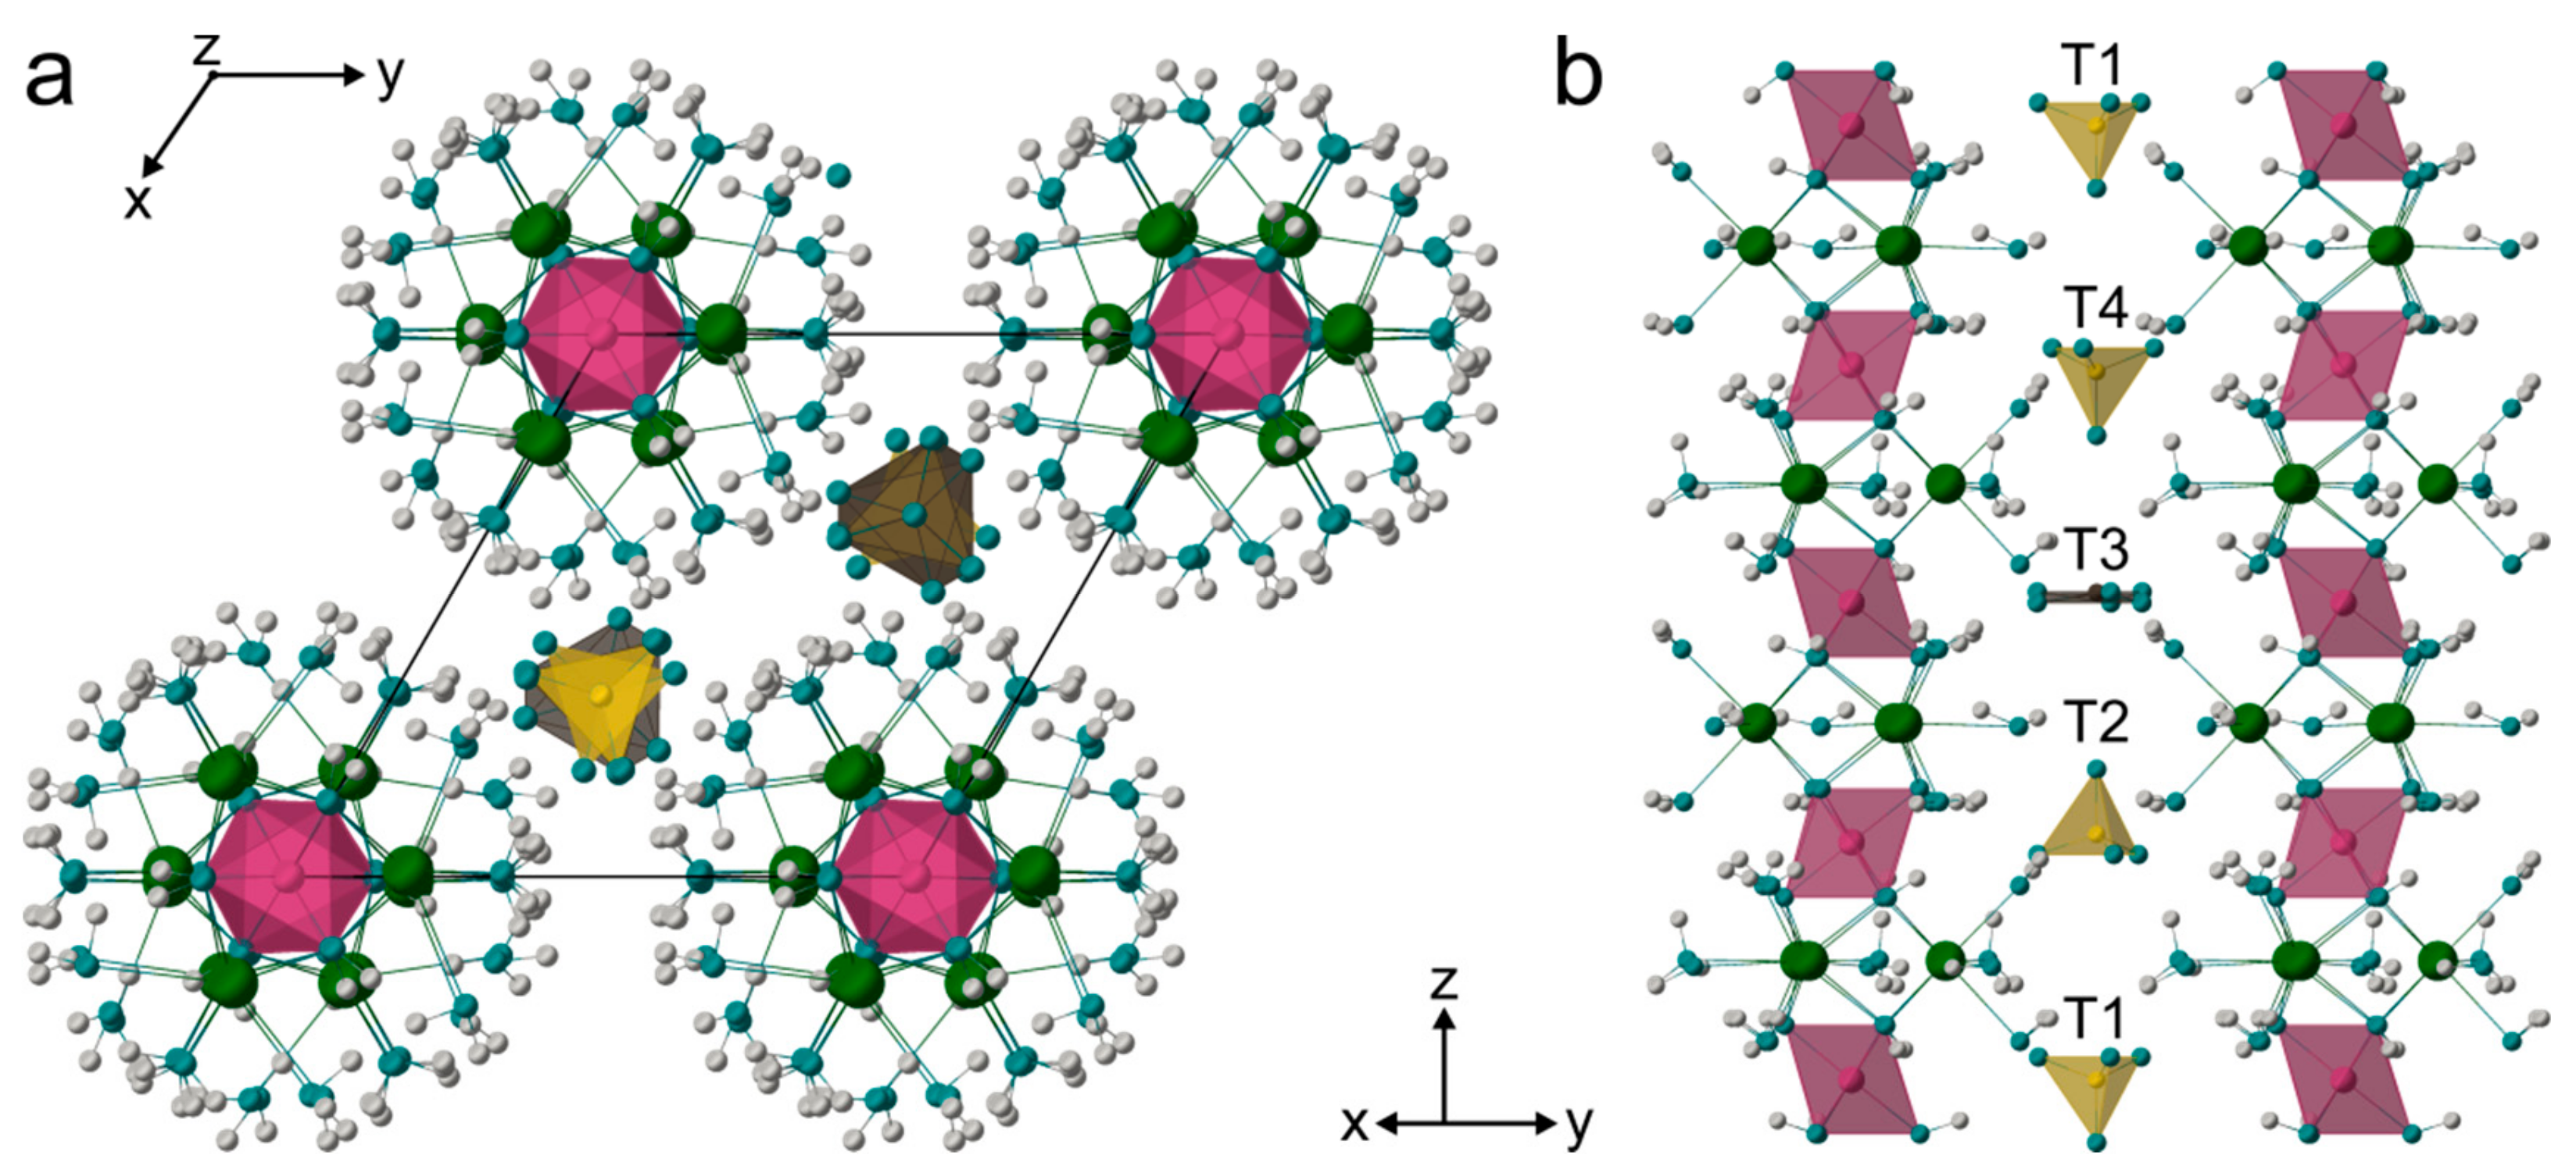
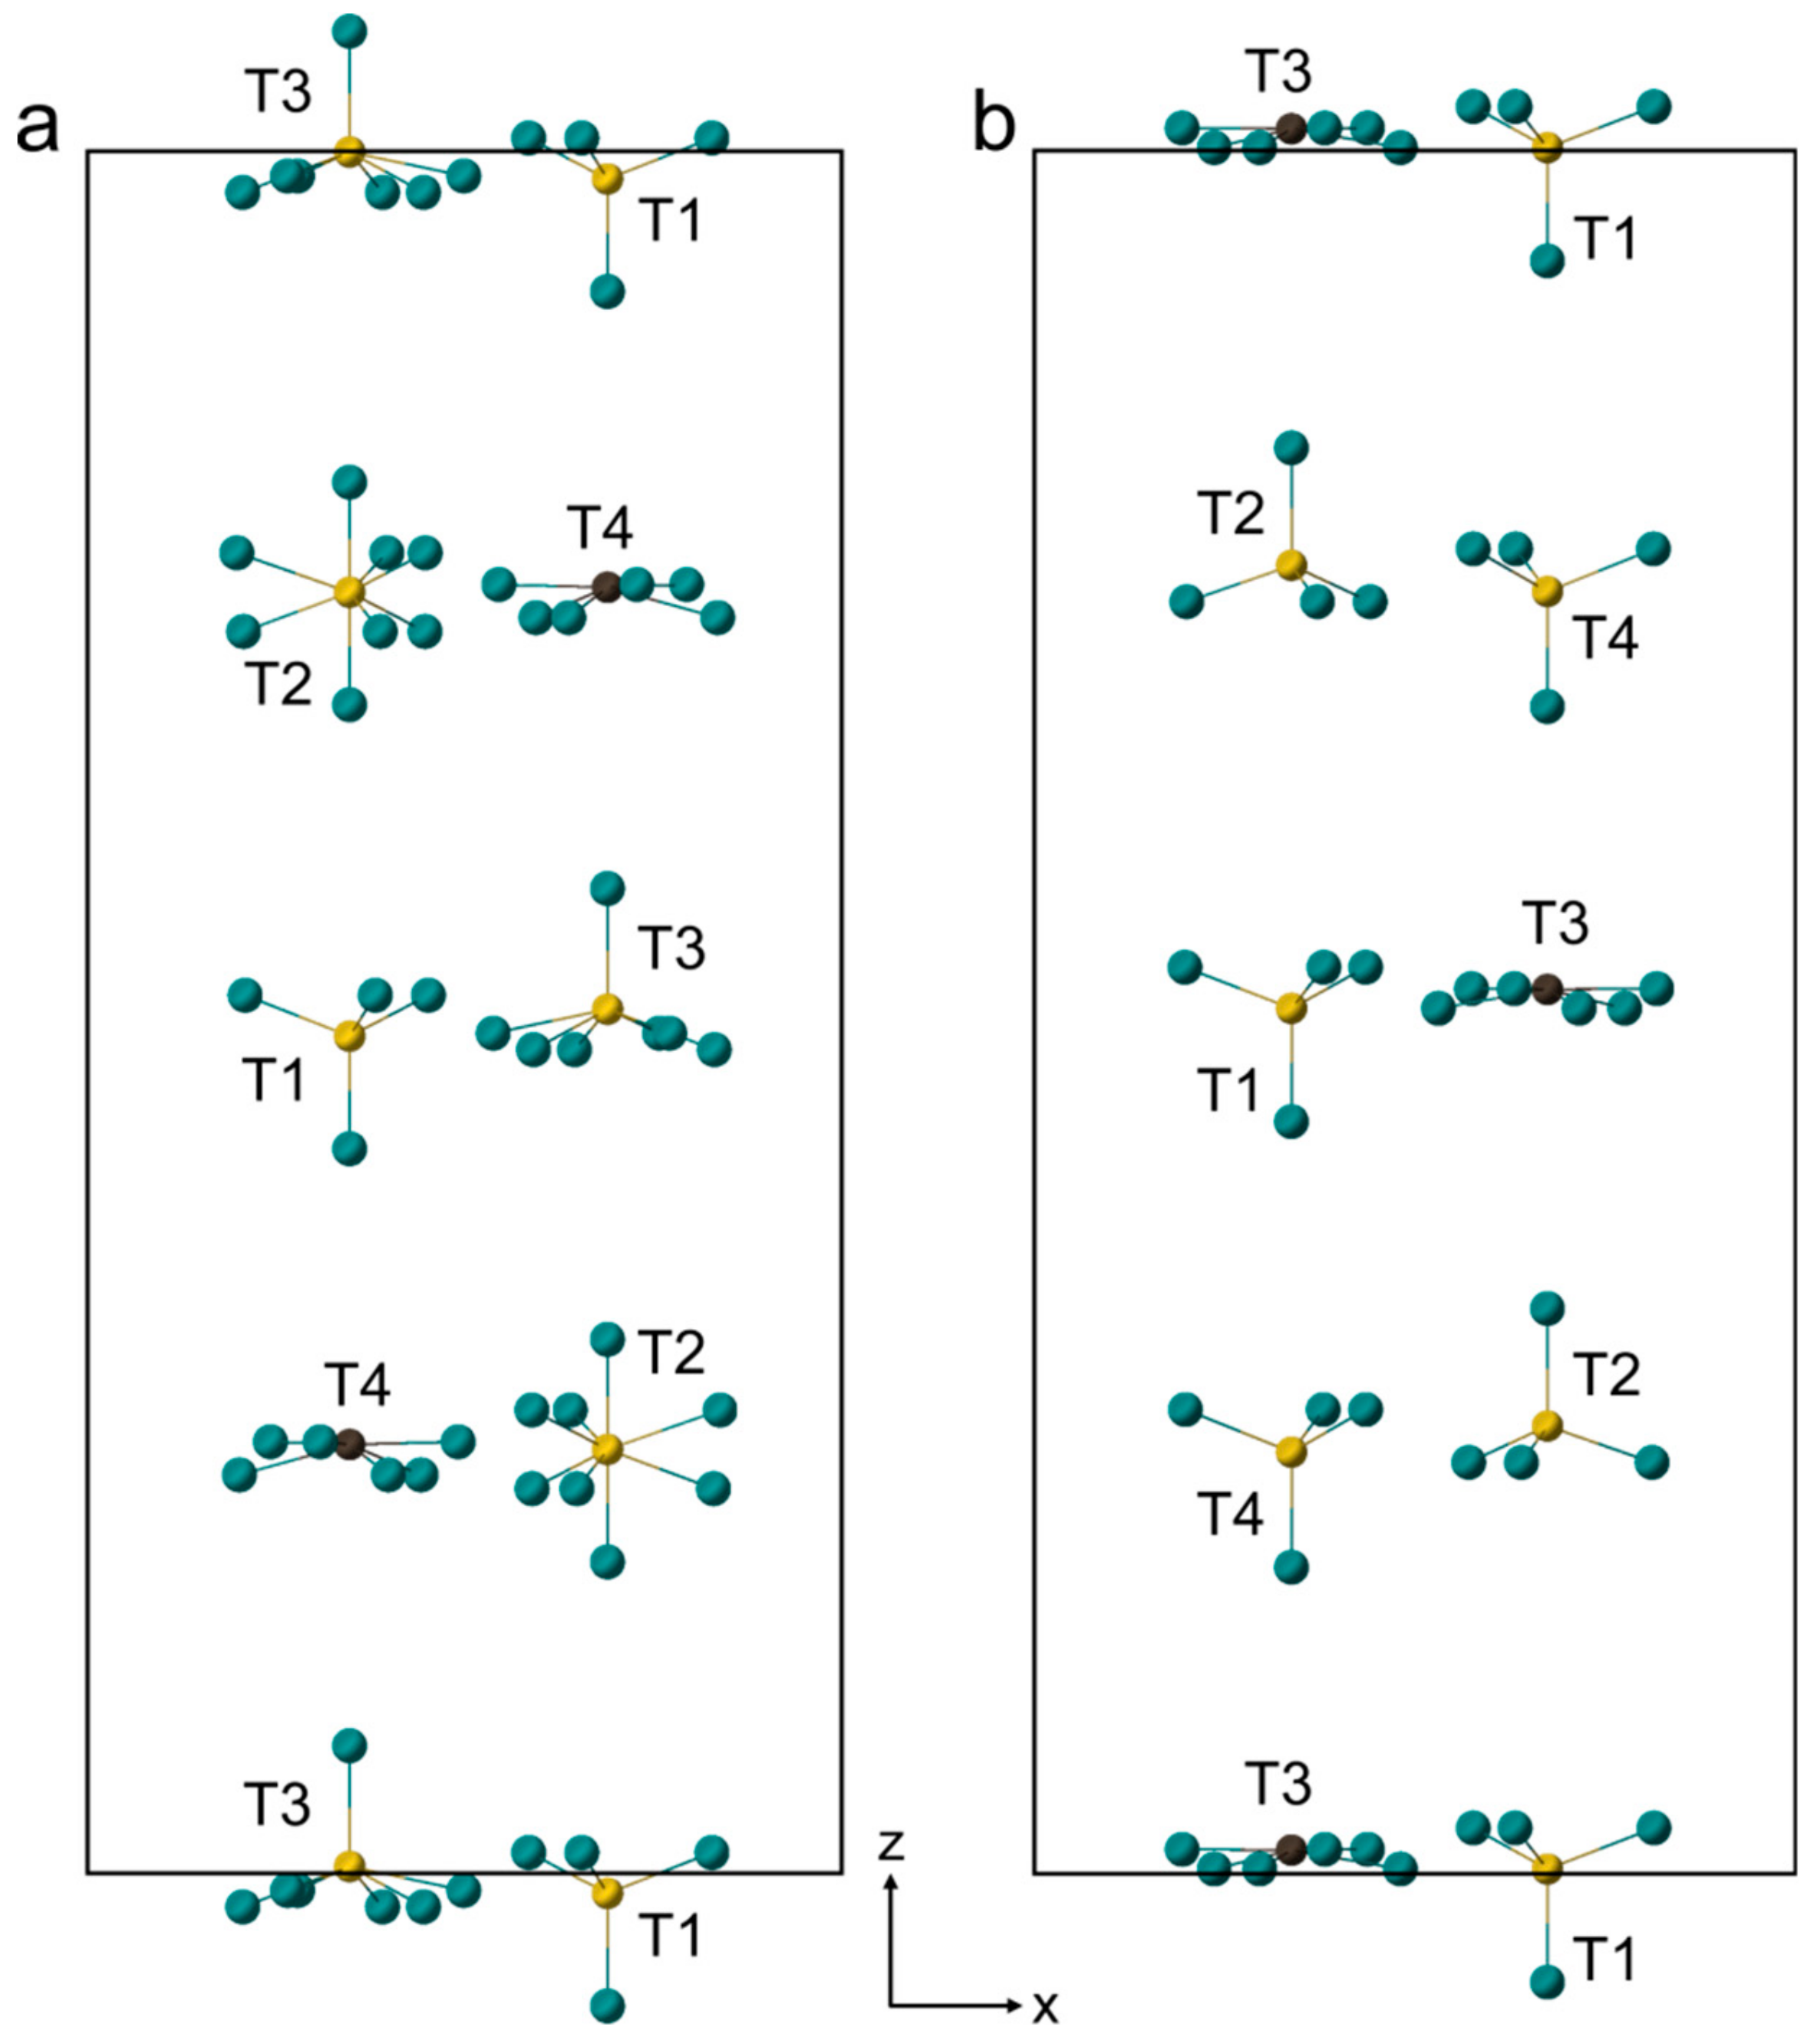
4.3. Crystal Structure

The recently reported structure of Cr3+ rich ettringite [4] was used as a starting model for a crystal structure refinement. In bentorite, as well as in ettringite, two fully occupied Ca sites within the crystal structure were coordinated by four water molecules and four hydroxyl groups, which belonged to the two neighbor M sites. Two octahedral M sites, coordinated by six OH groups, were occupied by Cr, Al, and Si. Due to the similarity of the scattering factors of Al and Si, their actual occupancies could not be satisfactorily determined. The population refinement was performed only for Cr and Al, converging for both sites at ~80% and ~20%, respectively (Supplemental Table S1). Columns of Cr/Al-octahedra and Ca-polyhedra were oriented along the c-axis, and they were interconnected by hydrogen bonds to the anion groups within the channels (Figure 3).
The anion groups in the bentorite structure were distributed over four possible positions along (1/3, 2/3, z) and (2/3, 1/3, z). Just as in Cr3+ rich ettringite [4], these positions were occupied by (SO4)2−, (CO3)2−, and H2O molecules. However, in bentorite, the distribution of the groups along the channels was different. With a subsequent analysis of bond lengths, site occupancies, and difference Fourier maps we came to the following conclusions:
A lower electron density at the T1 site indicated that a part of the (SO4)2− tetrahedra could be replaced by a (CO3)2− group. The refinement converged at 94% S and 6% C (Supplemental Table S1). O13, the apical oxygen of the S1O4 tetrahedra, did not show any significant deviation from full occupancy. However, the oxygen in the basal plane (O16), with three equivalent positions around the three-fold axis, exhibited reduced occupancy of ca. 94%, which was equivalent to the occupancy of the S1 atom at the T1 site (Supplemental Table S1). One oxygen atom of the (CO3)2− group was located at the O13 site, as implied by full occupancy of this position. The other oxygen atoms belonging to the carbonate group could not be located, and therefore, the orientation of this planar group could not be determined.
A second anion position T2 was fully occupied by sulfur (S2), which with the four closest oxygen atoms built the S2O4 tetrahedra with average bond lengths of 1.460 Å (Table 3).
A part of T3, the third anion position in the channel, was occupied by carbon (C3). The nearest oxygen sites (split into O18a and O18b) displayed two different orientations of (CO3)2− groups tilted by ~35° along the c plane. Bond lengths to O18a were slightly longer (1.43(3) Å) than the bonds to O18b with 1.41(3) Å. Modeling this site with C resulted in a refined occupancy of 25%. The occupancies of surrounding oxygen atoms were equal to 0.286(11) and 0.411(13) for O18a and O18b, respectively (Supplemental Table S1, CIF file). The excess O atoms may belong to water molecules.
The fourth anion site T4 was again occupied by 0.809(8) sulfur (S4) and 0.191(8) carbon (C4). Consequently, a partial substitution of (SO4)2− tetrahedra with (CO3)2− groups was evident. The occupancy of the coordinating oxygen atoms revealed the position of the (CO3)2− groups. A fully occupied site of the apical oxygen O15 in S4O4 tetrahedra and 0.936(8) occupancy of oxygen atom O19 in the basal plane (Supplemental Table S1) revealed that the (CO3)2− group was placed parallel to the three faces of the tetrahedra. The C4O3 group had a shorter bond O15 (1.453(1) Å) and two longer bonds to O19 (1.474(4) Å) (Table 3). The charge unbalanced structural formula of the studied bentorite was Ca6(Cr1.613Al0.387)∑2[(SO4)2.75(CO3)0.499]∑3.249(OH)12·24H2O without unsolved water at the T3 sites.

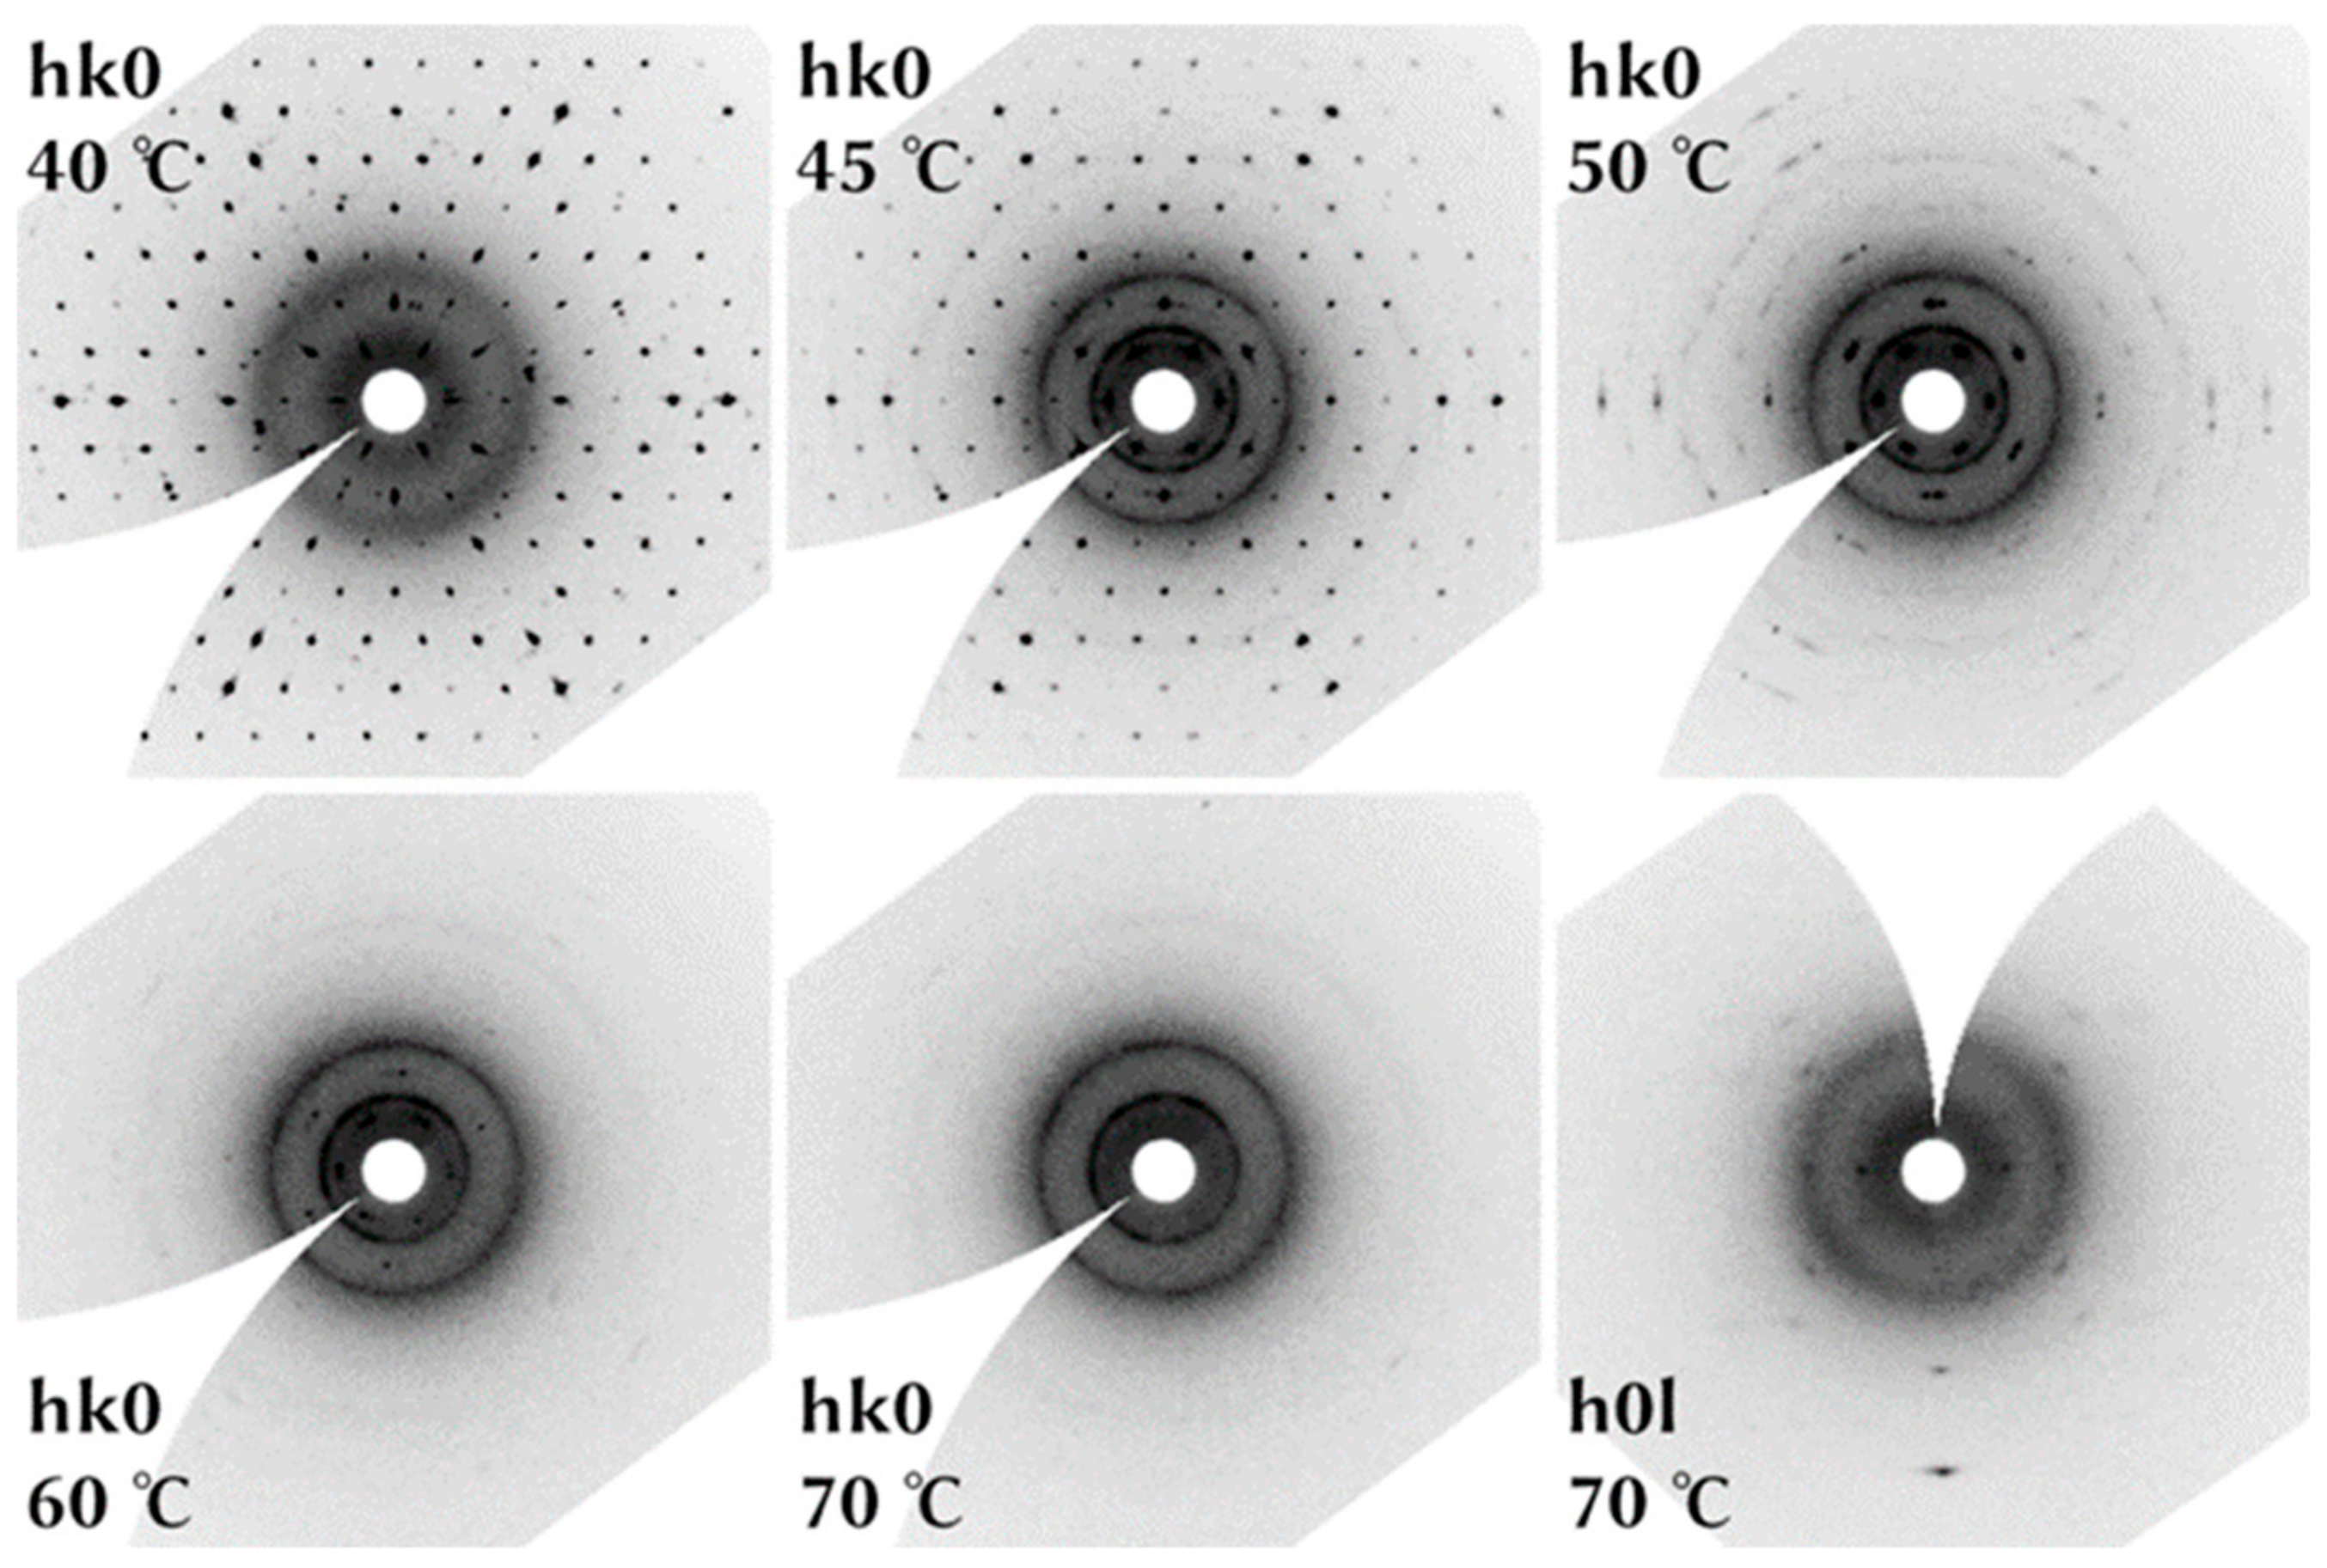
4.4. In Situ HT Single Crystal Study

The evaluation of the high temperature data showed that the crystal was virtually unchanged up to 40 °C. The datasets collected at 35 and 40 °C exhibited the same lattice parameters (within e.s.d’s) and similar average I/σ(I) values of the integrated reflections: 26.1 and 25.8, respectively. However, the average I/σ(I) at 45 °C was 9.7, only, which indicated that the crystal had started to decompose. Comparing the maximum frame intensities of the 40 and 45 °C measurements revealed that these intensities were decreasing during the 45 °C data collection. The average I/σ(I) value of all reflections at 50 °C was 1.5. The remaining bentorite Bragg peaks could be detected up to 65 °C. With the onset of the decomposition at 45 °C, weak powder rings occurred. Powder rings originating from randomly oriented crystallites should form spheres in the three dimensional reciprocal space. However, the powder rings of the decomposition product were two-dimensional and oriented perpendicular to c* of the decomposing bentorite crystal. Consequently, one axis of all of the crystallites was still parallel to c*. Further, we conclude that this (reciprocal) axis was doubled with respect to bentorite, as only every second layer (hkl, l = 2n) exhibited powder rings. The strongest of the powder rings were observed at d-values of ca. 7.39, 6.02, 4.28, 3.32, and 2.56 Å (Figure 4).
Zhou et al. [7] reported on metaettringite as a decomposition product of ettringite. They suggested that the structure of metaettringite was similar to that of despujolsite, Ca3Mn4+(SO4)2(OH)6·3H2O [30]. A comparison of the d-values of the first strong lines of despujolsite showed a very good match with the d-values of the bentorite decomposition product. Therefore, we suggested the existence of “metabentorite” with a unit cell of ca. a = b = 8.5, c = 10.8 Å, and a despujolsite-like structure with a likely composition of Ca6Cr2(SO4)3(OH)12·6H2O.
A SEM investigation of the decomposition product revealed a system of cracks, oriented parallel to one direction (Figure 5), which may be created by two-dimensional shrinkage, as discussed by Zhou et al. [7].

5. Discussion

Spectroscopic data for bentorite from the Arad Stone Quarry and Ma’ale Adummim are compared in Table 4. The published spectrum of bentorite [5] could not be used for comparison as the authors incorrectly specified the conditions of the Raman experiment and gave the spectrum of the “burned” phase after bentorite. Supplementary Figure S1 exhibits spectra for the bentorite grain at low and high laser power, and the spectrum of the heated, transformed bentorite (Figure S1b) was the same as presented by Seryotkin et al. [5].
Figure 2 shows the differences in the number and band positions in the Raman spectra of bentorite and ettringite from the two localities. In ettringite, the stronger band was usually observed at 988–993 cm−1, whereas in bentorite, it was shifted to the lower frequencies ~983 cm−1. A similar effect was observed for OH stretching vibration when the band at 3635–3638 cm−1 in ettringite spectra was shifted towards lower frequencies 3616–3618 cm−1 in bentorite spectra (Figure 2).
Low temperature synchrotron powder diffraction experiments on natural bentorite samples were performed by Serotkin et al. [5] at 100, 250, and 295 K. As a starting model for the structure refinement of bentorite at 100 K, Seryotkin et al. [5] used the structure of Cr3+ bearing ettringite [4]. In their refinement, both octahedral M sites were fully occupied by Cr, which confirmed the existence of a continuous solid solution between bentorite, Ca6Cr2(SO4)3(OH)12·26H2O, and ettringite, Ca6Al2(SO4)3(OH)12·26H2O. Moreover, the arrangement of all anion groups was ordered as in the ettringite structure.
Our single crystal structure refinement was also based on the Cr3+ bearing ettringite structure [4] as a starting model. The octahedral M sites in our refinement were occupied by Cr, Al, and Si (80% of Cr3+), whereas in previous work, this occupation was 100% of Cr3+. Moreover, we observed the disorder of anionic groups, which were distributed over four T sites in the channels of the crystal structure.
In general, bentorite exhibited the same structure as Cr3+ bearing ettringite [4]; however, the distribution of three (SO4)2− tetrahedra and one (CO3)2− in the channels was different (Figure 6). In both structures, partial substitution of (SO4)2− for (CO3)2− groups in the channels was observed. In the studied bentorite, T1 and T4 sites had an S/C ratio equal to 0.940/0.060 and 0.809/0.191, respectively, while in the structure reported by Seryotkin et al. [4], a similar substitution was noted at the T3 site with the S/C ratio of 0.91/0.09. In addition, in Cr3+ bearing ettringite, the T3 tetrahedron was rotated around the three-fold axis, while the almost fully occupied by sulfur T2 site was rotated through 180°, one relative to the other, according to the occupation of O18 and O19 atoms with the ratio 0.80/0.20, respectively (Figure 6a). In turn, in the bentorite structure, the rotation of sites occupied simultaneously by (SO4)2− and (CO3)2− groups was not affirmed (Figure 6b). Some similarities were also noted between these two structures, e.g., the T1 site in the structure performed by Seryotkin et al. [4] and the T2 site in the structure presented in this paper were fully occupied by (SO4)2− groups and did not show any type of disorder (Figure 6). Moreover, one of the four sites in both structures was partially occupied by (CO3)2− groups, and in Cr3+ bearing ettringite, the occupancy of this site (T4) was equal to 0.119 [4], whereas in bentorite (T3) to 0.25.
In the obtained structure data for bentorite from the Arad Stone Quarry, an interesting situation was observed in the context of the (CO3)2− group’s location. For sites in the channels where this group partially occupied positions together with sulfate groups, the planar (CO3)2− group was not placed parallel to the base plane of the tetrahedra. Probably these groups were statistically distributed over the three equivalent positions, parallel to three faces of the tetrahedra. The C atom at the T4 site was coordinated by the two O19 (C–O = 1. 474 Å) and the one O15 (apical oxygen, C–O = 1.452 Å). These C–O distances were much longer than the usual distances in the (CO3)2− group [31]. Such an effect was observed in stracherite, BaCa6(SiO4)2[(PO4)(CO3)]F, at the substitution of the (PO4)3− group by the (CO3)2− group [32].
The difference in arrangement and disordering of the anionic groups in channels in the crystal structure of bentorite and Cr3+-bearing ettringite may be related to the occupancies at the M sites and commonly took place in intermediate members of the ettringite-bentorite solid solution. The presented structure determination showed that the studied bentorite single crystals preserved the unit cell symmetry and structure topology typical of ettringite and confirmed a last missing link in the chain of evidence for ettringite-bentorite solid solution series.
The difference between the ideal formula of bentorite, Ca6Cr2(SO4)3(OH)12·26H2O, the crystal chemical formula of Arad Stone bentorite calculated on the base of SEM/EDS, Ca6.00(Cr1.71Al0.23Si0.06)(SO4)3(OH)12·26H2O (Table 2), and charge unbalanced structural formula, Ca6(Cr1.613Al0.387)∑2[(SO4)2.75(CO3)0.499]∑3.249(OH)12·24H2O (Table 1 and Table S1), were needed for the discussion. Chemical data obtained from SEM/EDS were calculated on ideal stoichiometry without taking into consideration carbon (Table 2). The formula received from structural data was not considered unsolved water at the T3 sites (maximum content 2-T3(CO3)2−, Supplemental Table S1). It is possible that additional (CO3)2− groups at the T3 were balanced by the incorporation of an insignificant amount of Si4+ instead of Cr3+ as SEM/EDS data (Table 2) and also decreasing of the (OH) group’s content. As mentioned above, it was not possible to refine Si at the M site, so we proposed the following crystal chemical formula of the studied bentorite: Ca6(Cr1.613Al0.387)∑2[(SO4)2.75(CO3)0.499]∑3.249(OH)11.502·~25.75H2O.

Supplementary Materials

The following are available online at https://www.mdpi.com/2075-163X/10/1/38/s1. The bentorite_cif. file; Table S1: Atom coordinates’ (x,y,z), occupancies and equivalent isotropic displacement parameters (Ueq, Å2) for bentorite from the Arad Stone Quarry; Table S2: Anisotropic displacement parameters (Å2) for bentorite from the Arad Stone Quarry. Figure S1: Roman spectra of bentorite received at low (a) and high laser power (b).

Author Contributions

R.J., B.K., and I.G. wrote the paper. R.J. performed the petrological investigation, measurements of chemical composition (EDS), and Raman studies. H.K. and C.K. performed SC-XRD and HT single crystal investigation of the bentorite structure. M.T. performed the SEM analysis after the HT experiment. All authors have read and agreed to the published version of the manuscript.

Funding

The investigations were supported by the National Science Centre (NCN) of Poland, Grant No. 2016/23/N/ST10/00142 (R.J.).

Acknowledgments

The authors would like to thank Yevgeny Vapnik for collecting the bentorite samples. The authors also thank the anonymous reviewers for their useful and constructive comments, which allowed improving a previous version of the manuscript.

Conflicts of Interest

The authors declare no conflict of interest.

References

  1. Gross, S. Bentorite-a new mineral from the Hatrurim area, west of the Dead Sea, Israel. Isr. J. Earth Sci. 1980, 29, 81–84. [Google Scholar]
  2. Wieczorek-Ciurowa, K.; Fela, K.; Kozak, A.J. Chromium(III)-Ettringite Formation and its Thermal Stability. J. Therm. Anal. Calorim. 2001, 65, 655–660. [Google Scholar] [CrossRef]
  3. Juroszek, R.; Krüger, B.; Galuskina, I.O. Structural reinvestigation of bentorite. In Mitteilungen der Österreichischen Mineralogischen Gesellschaft; Universität Innsbruck: Innsbruck, Austria, 2017; Volume 163, p. 49. [Google Scholar]
  4. Seryotkin, Y.V.; Sokol, E.V.; Kokh, S.N.; Murashko, M.N. Natural Cr3+-rich ettringite: Occurrence, properties, and crystal structure. Phys. Chem. Miner. 2018, 45, 279–292. [Google Scholar] [CrossRef]
  5. Seryotkin, Y.V.; Sokol, E.V.; Kokh, S.N.; Sharygin, V.V. Natural bentorite—Cr3+ derivate of ettringite: Determination of crystal structure. Phys. Chem. Miner. 2019, 46, 553–570. [Google Scholar] [CrossRef]
  6. Drebushchak, V.A.; Seryotkin, Y.V.; Kokh, S.N.; Sokol, E.V. Natural specimen of triple solid solution ettringite–thaumasite–chromate-ettringite. J. Therm. Anal. Calorim. 2013, 114, 777–783. [Google Scholar] [CrossRef]
  7. Zhou, Q.; Lachowski, E.E.; Glasser, F.P. Metaettringite, a decomposition product of ettringite. Cem. Concr. Res. 2004, 34, 703–710. [Google Scholar] [CrossRef]
  8. Bentor, Y.K.; Gross, S.; Heller, L. Some unusual minerals from the “Mottled Zone” complex, Israel. Am. Mineral. 1963, 48, 924–930. [Google Scholar]
  9. Gross, S. The Mineralogy of the Hatrurim Formation, Israel; Geological Survey of Israel: Jerusalem, Israel, 1977. [Google Scholar]
  10. Burg, A.; Starinsky, A.; Bartov, Y.; Kolodny, Y. Geology of the Hatrurim Formation (“Mottled Zone”) in the Hatrurim basin. Isr. J. Earth Sci. 1991, 40, 107–124. [Google Scholar]
  11. Techer, I.; Khoury, H.N.; Salameh, E.; Rassineux, F.; Claude, C.; Clauer, N.; Pagel, M.; Lancelot, J.; Hamelin, B.; Jacquot, E. Propagation of high-alkaline fluids in an argillaceous formation: Case study of the Khushaym Matruk natural analogue (Central Jordan). J. Geochem. Explor. 2006, 90, 53–67. [Google Scholar] [CrossRef]
  12. Sokol, E.; Novikov, I.; Zateeva, S.; Vapnik, Y.; Shagam, R.; Kozmenko, O. Combustion metamorphism in the Nabi Musa dome: New implications for a mud volcanic origin of the Mottled Zone, Dead Sea area. Basin Res. 2010, 22, 414–438. [Google Scholar] [CrossRef]
  13. Geller, Y.I.; Burg, A.; Halicz, L.; Kolodny, Y. System closure during the combustion metamorphic “Mottled Zone” event, Israel. Chem. Geol. 2012, 334, 25–36. [Google Scholar] [CrossRef]
  14. Novikov, I.; Vapnik, Y.; Safonova, I. Mud volcano origin of the Mottled Zone, South Levant. Geosci. Front. 2013, 4, 597–619. [Google Scholar] [CrossRef]
  15. Matthews, A.; Gross, S. Petrological Evolution of the “Mottled Zone” (Hatrurim) Metamorphic Complex of Israel. Isr. J. Earth Sci. 1980, 29, 93–106. [Google Scholar]
  16. Grapes, R. Pyrometamorphism, 2nd ed.; Springer: Heidelberg/Berlin, Germany, 2010; ISBN 978-3-642-15587-1. [Google Scholar]
  17. Khoury, H.N.; Sokol, E.V.; Clark, I.D. Calcium uranium oxide minerals from Central Jordan: Assemblages, chemistry, and alteration products. Can. Mineral. 2015, 53, 61–82. [Google Scholar] [CrossRef]
  18. Kolodny, Y.; Burg, A.; Geller, Y.I.; Halicz, L.; Zakon, Y. Veins in the combusted metamorphic rocks, Israel; Weathering or a retrograde event? Chem. Geol. 2014, 385, 140–155. [Google Scholar] [CrossRef]
  19. Clark, R.C.; Reid, J.S. The analytical calculation of absorption in multifaceted crystals. Acta Crystallogr. Sect. A 1995, 51, 887–897. [Google Scholar] [CrossRef]
  20. Rigaku Oxford Diffraction. CrysAlisPro Software System, Version 1.171.38.43; Rigaku Corporation: Oxford, UK, 2015. [Google Scholar]
  21. Petříček, V.; Dušek, M.; Palatinus, L. Crystallographic Computing System JANA2006: General features. Z. Krist. Cryst. Mater. 2014, 229, 345–352. [Google Scholar] [CrossRef]
  22. Krüger, H.; Breil, L. Computer-controlled high-temperature single-crystal X-ray diffraction experiments and temperature calibration. J. Appl. Cryst. 2009, 42, 140–142. [Google Scholar] [CrossRef]
  23. Stoe. Cie X-AREA 1.84; Stoe & Cie GmbH: Darmstadt, Germany, 2018. [Google Scholar]
  24. Myneni, S.C.B.; Traina, S.J.; Waychunas, G.A.; Logan, T.J. Vibrational spectroscopy of functional group chemistry and arsenate coordination in ettringite. Geochim. Cosmochim. Acta 1998, 62, 3499–3514. [Google Scholar] [CrossRef]
  25. Renaudin, G.; Segni, R.; Mentel, D.; Nedelec, J.-M.; Leroux, F.; Taviot-Gueho, C. A Raman Study of the Sulfated Cement Hydrates: Ettringite and Monosulfoaluminate. ACT 2007, 5, 299–312. [Google Scholar] [CrossRef] [Green Version]
  26. Frost, R.L.; López, A.; Xi, Y.; Scholz, R.; da Costa, G.M.; Lima, R.M.F.; Granja, A. The spectroscopic characterization of the sulphate mineral ettringite from Kuruman manganese deposits, South Africa. Vib. Spectrosc. 2013, 68, 266–271. [Google Scholar] [CrossRef] [Green Version]
  27. Scholtzová, E.; Kucková, L.; Kožíšek, J.; Tunega, D. Structural and spectroscopic characterization of ettringite mineral–combined DFT and experimental study. J. Mol. Struct. 2015, 1100, 215–224. [Google Scholar] [CrossRef]
  28. You, K.S.; Ahn, J.W.; Cho, H.C.; Han, G.C.; Han, D.Y.; Cho, K.H. Competing Ion Effect of Stabilization by Cr(III) & Cr(VI) in Ettringite Crystal Structure. Solid State Phenom. 2007, 124–126, 1629–1632. [Google Scholar]
  29. Kloprogge, J.T.; Hickey, L.; Frost, R.L. The effect of varying synthesis conditions on zinc chromium hydrotalcite: A spectroscopic study. Mater. Chem. Phys. 2005, 89, 99–109. [Google Scholar] [CrossRef] [Green Version]
  30. Barkley, M.C.; Yang, H.; Evans, S.H.; Downs, R.T.; Origlieri, M.J. Redetermination of despujolsite, Ca3Mn4+(SO4)2(OH)6·3H2O. Acta Crystallogr. Sect. E 2011, 67, i47–i48. [Google Scholar] [CrossRef] [PubMed]
  31. Antao, S.M.; Hassan, I. Temperature dependence of the structural parameters in the transformation of aragonite to calcite, as determined from in situ synchrotron powder X-ray-diffraction data. Can. Mineral. 2010, 48, 1225–1236. [Google Scholar] [CrossRef] [Green Version]
  32. Galuskin, E.V.; Krüger, B.; Galuskina, I.O.; Krüger, H.; Vapnik, Y.; Pauluhn, A.; Olieric, V. Stracherite, BaCa6(SiO4)2[(PO4)(CO3)]F, the first CO3-bearing intercalated hexagonal antiperovskite from Negev Desert, Israel. Am. Mineral. 2018, 103, 1699–1706. [Google Scholar] [CrossRef]
Figure 1. View of Arad Stone Quarry in the Negev Desert, Israel (a), and dark-violet bentorite vein in calcite-spurrite marble (b). View of Ma’ale Adummim locality, Palestine (c), and low temperature hydrothermal mineral assemblages within the small cavity in the hosted gehlenite-flamite rock (d). Afw, afwillite; Bnt-Ettr, minerals of bentorite-ettringite series; Ettr, ettringite; CSHs, Ca silicate hydrates.
Minerals 10 00038 g001
Figure 2. Raman spectra of ettringite (a) and bentorite (b) from the Arad Stone Quarry and bentorite (dark-violet part) (c) and ettringite (transparent part) (d) from Ma’ale Adummim locality (the crystal is shown at the top of (e) blue and yellow stars represent the spots, where Spectra c and d were recorded.
Minerals 10 00038 g002
Figure 3. Crystal structure of bentorite: projection along [001] (a) and [110] (b). Ca atoms are green, Cr(OH)6 octahedra in violet, (SO4)2− tetrahedra in yellow, and (CO3)2− triangles in dark grey. Oxygen and hydrogen atoms are shown as marine and grey spheres, respectively.
Minerals 10 00038 g003
Figure 4. The first five images show the reciprocal space layer hk0 with increasing temperature. Whereas at 40 °C, there are Bragg reflections only, powder rings emerge at 45 °C. At 70 °C, powder rings have completely replaced the Bragg spots. The powder rings do not form spheres in the reciprocal space; instead, they are planar rings. This can be seen in a cross-section (h0l layer, 70 °C, c* vertical, last image). The bentorite crystal decomposed into crystallites with parallel c* axes.
Minerals 10 00038 g004
Figure 5. SE images of a bentorite crystal not treated with high temperature (HT) (a), and another crystal after the HT experiments (b,c). The image (c) shows an enlargement of the region marked in the image (b). After the HT treatment, the material exhibited a significant amount of cracks and fractures, mostly oriented parallel to one axis.
Minerals 10 00038 g005
Figure 6. Configuration of the anion (SO4)2− and (CO3)2− groups in the channels within the structures of Cr3+ bearing ettringite (a) (modified after [4]) and bentorite (b) (present work).
Minerals 10 00038 g006
Table 1. Parameters for X-ray data collection and crystal structure refinement for bentorite from the Arad Stone Quarry, Israel.
Crystal Data
Refined chemical compositionC0.499H60Al0.387Ca6Cr1.613O49.725S2.75
Crystal systemtrigonal
Space groupP31c
Unit cell dimensionsa = 11.1927 (5) Å
b = 11.1927 (5) Å
c = 21.7121 (10) Å
Unit cell volume2355.60 (18) Å3
Formula weight1285
Density (calculated)1.8115 g/cm3
Z
Crystal size
2
0.19 × 0.16 × 0.12 mm
Data Collection
Diffractometerfour-circle diffractometer, Rigaku Oxford Diffraction Gemini R Ultra
Radiation wavelength0.71073 Å
min. and max. theta (°)3.53, 29.6
Time of exposure130 s
Reflection ranges −14 ≤ h ≤ 15;
−13 ≤ k ≤ 13;
−29 ≤ l ≤ 26
Refinement of Structure
Reflection measured38,295
No. of unique reflections3998
No. of observed unique reflections [I > 3σ(I)]2714
Refined parameters248
Rint0.046
R10.0388
Goof1.91
Δρmin (e Å−3)−0.81
Δρmax (e Å−3)1.34
Table 2. The normalized composition of bentorite.
wt %Arad Stone Quarry
MeanS.D.Range
n = 10
SO318.480.3217.79–18.93
SiO20.290.120.13–0.50
Al2O30.900.320.42–1.42
Cr2O310.000.569.31–11.20
CaO25.890.8324.59–27.02
H2O a44.44
Total100.00
Calculated on 8 framework cations
S6+3.00
Si4+0.06
Al3+0.23
Cr3+1.71
Ca2+6.00
H2O52.00
OH12.00
a H2O content is calculated on the ideal composition Ca6M2(SO4)3(OH)12·26H2O, and the total is normalized to 100%; n = number of analyses; S.D. = standard deviation.
Table 3. Selected interatomic distances (Å) in the bentorite structure.
Ca1Ca2
Ca1-O12.421(7)Ca2-O22.443(7)
Ca1-O12.462(5)Ca2-O22.373(5)
Ca1-O32.416(5)Ca2-O42.413(7)
Ca1-O32.447(7)Ca2-O42.390(5)
Ca1-O62.400(8)Ca2-O52.493(8)
Ca1-O82.448(8)Ca2-O72.403(8)
Ca1-O102.743(9)Ca2-O92.597(7)
Ca1-O122.675(5)Ca2-O112.626(4)
average2.502average2.467
M1 = 0.799 Cr + 0.201 AlM2 = 0.814 Cr + 0.186 Al
M1-O11.985(6)M2-O31.971(6)
M1-O11.985(5)M2-O31.971(5)
M1-O11.985(7)M2-O31.971(8)
M1-O21.951(6)M2-O41.977(6)
M1-O21.951(5)M2-O41.977(5)
M1-O21.951(7)M2-O41.977(7)
average1.968average1.974
T1 = 0.940 S + 0.060 C
T1-O131.428(8)
T1-O161.473(4)
T1-O161.473(6)
T1-O161.473(4)
average1.462
T2 = S
T2-O141.482(10)
T2-O171.452(7)
T2-O171.452(11)
T2-O171.452(6)
average1.460
T3 = 0.25 C
T3-O18a1.43(3)T3-O18b1.413(15)
T3-O18a1.43(3)T3-O18b1.41(2)
T3-O18a1.43(2)T3-O18b1.413(12)
average1.43average1.412
T4 = 0.809 S + 0.191 C
T4-O151.453(10)
T4-O191.474(5)
T4-O191.474(4)
T4-O191.474(8)
average1.469
Table 4. Raman band assignments for bentorite from different localities.
Bentorite from the Arad Stone QuarryBentorite from Ma’ale AdummimBand Assignment
157, 193160, 197lattice vibrations
442442ν2 (SO4)2−
537538Al/Cr–OH stretching vibrations of Al/Cr(OH)63− unit
601598, 641ν4 (SO4)2
757756hydroxyl deformation vibration of Cr–OH units
-853Al–OH bending vibrations
983983ν1 (SO4)2−
11091111ν3 (SO4)2−
16821685(OH) bending
vibration of H2O molecules
3314, 3400, 34693295, 3384, 3475(OH) stretching
vibration of H2O molecules
36183616(OH) stretching vibration of the OH units

