Article

Contrasting Fluids in the Svetlinsk Gold-Telluride Hydrothermal System, South Urals

1
Institute of Geology of Ore Deposits, Petrography, Mineralogy, and Geochemistry, RAS, 119017 Moscow, Russia
2
Sobolev Institute of Geology and Mineralogy, SB RAS, 630090 Novosibirsk, Russia
3
Central Research Institute of Geological Prospecting for Base and Precious Metals, 117545 Moscow, Russia
4
Institute of Experimental Mineralogy, RAS, Chernogolovka, 142432 Moscow Region, Russia
5
Zavaritsky Institute of Geology and Geochemistry, UrB RAS, 620016 Ekaterinburg, Russia
6
Department of Geology, Mining and Oil&Gas Engineering, Academy of Engineering, Peoples’ Friendship University of Russia (RUDN University), 117198 Moscow, Russia
*
Author to whom correspondence should be addressed.
Minerals 2020, 10(1), 37; https://doi.org/10.3390/min10010037
Submission received: 18 November 2019 / Revised: 22 December 2019 / Accepted: 26 December 2019 / Published: 30 December 2019

Abstract

:
The large gold-telluride Svetlinsk deposit (~135 t Au) is considered to be a nontraditional one in the Urals and its origin is debated. A specific feature of the deposit is the abundance of various tellurides, such as tellurides of Fe, Ni, Pb, Sb, Bi, Ag, and Au. The new data of microthermometry, Raman spectroscopy, LA-ICP-MS, and crush-leach analysis (gas and ion chromatography, ICP-MS) for fluid inclusions as well as O-isotope data for quartz were obtained for the construction of PTX parameters of ore-formation and fluid sources in the deposit. Mineralisation was formed at a wide range of temperature and pressure (200–400 °C, 1–4 kbar) and from contrasting fluids with multiple sources. At the early stages, the magmatic fluid evolved during its ascent and phase separation and the fluid derived from the host rock decarbonation and dehydration were involved in the hydrothermal system. In addition, mantle-derived fluid might be involved in the ore-forming process during gold-telluride precipitation as well as heated meteoric waters during the late stages. Early fluids were rich in H2S, S0, and CH4, while the Au-Te mineralisation was formed from N2-rich fluid.

1. Introduction

Gold-telluride deposits are commonly not distinguished as a separate deposit type but are included in epithermal, porphyry, orogenic, or intrusion-related types of gold deposits. Golden Mile, Australia [1], Cripple Creek and Golden Sunlight, USA [2,3], Emperor, Fiji [4,5], Acupan, Philippines [6], and Sacarimb, Romania [7] deposits are well-known examples of large Au-Te deposits. In Au-Te deposits, a significant part of gold occurs as Au(Ag)-tellurides, which can be precipitated simultaneously with or separately from native gold. In addition, there are telluride-rich deposits, where some part of gold occurs as Au(Ag)-tellurides and could contribute to its bulk balance [8]. There are also Au-deposits, where Au(Ag)-tellurides are rare or absent, but with variable amounts of other tellurides (of Bi, Pb, Hg, etc.), associated with native gold (e.g., [8]).
The origin of gold-telluride deposits is debated since several genetic models of these deposits have been proposed. Multiple sources of the hydrothermal fluids, including magmatic-derived, mantle-derived, metamorphic-derived, and meteoric waters as well as different processes favourable for gold deposition were proposed for gold-telluride deposits [1,2,3,4,5,6,7,8,9,10,11,12,13,14]. In particular, phase separation by boiling and effervescing of CO2-rich magma-derived fluids played the key role in gold precipitation in the Cripple Creek deposit [3]. The abundance of tellurides in the epithermal systems is attributed to volatile-rich fluids associated with alkaline (particularly shoshonitic) magmatism [9]. For the deposits formed in deeper (>5 km) settings, e.g., orogenic gold deposits, fluid phase separation was associated with a catastrophic drop in pressure [10]. Periodic release of gas due to throttling was put forward as a formation mechanism in the Golden Mile deposit [1]. The position of the deposit at the intersection of different fault systems was optimal for the development of sustained fluid throttling producing effervescence, and it was likely the main mechanism of gold deposition at the Sacarimb [7]. CO2 effervescence and concomitant H2S volatilisation were dominant ore-deposition mechanisms in the intrusion-related Yuryang Au-Te deposit, Korea, and the gold deposition by the fluids apparently derived from the S-type granitoid magma [11]. Fluid inclusion and isotope data for the Chinese Au-Te deposits show that pressure release and fluid boiling as well as fluid-rock interaction (Lifanggou and Mofanggou) and mixing of magma-derived fluids with meteoritic waters (Guilaizhuang) played an important role in the ore formation [12]. The large Dashuigou Te-(Au) deposit, Sichuan Province, is a spectacularly telluride-rich (10 wt % Te) deposit interpreted as a product of the Permian Large Igneous Province-related mantle plume [13]. Fluid sources enriched in Te during mantle underplating and/or metasomatism were responsible for the telluride enrichment observed in the deposits ranging from HS-epithermal and LS-epithermal to metamorphogenic gold systems in the Hellenides [14].
The Svetlinsk Au-Te deposit (54°17’ N, 60°25’ E) is located in the Plast district of the Chelyabinsk region, 30 km west of Plast, which is a centre of gold mining and processing industry in the Southern Urals. The deposit was discovered in 1974. The annual gold production is 4–4.5 tons of Au. The remaining reserves of gold to the depth of 800 m are estimated at 80 tons [15,16], and its total reserves, taking into account the output for 25 years (since 1992), is about 135 tons of Au. A specific feature of the Svetlinsk deposit is the abundance of various tellurides, namely tellurides of Fe, Ni, Pb, Sb, Bi, Ag, and Au. The deposit was classified as a quartz-carbonate shear-zone-related Au-Ag deposit [17], which corresponds to “greenstone-hosted quartz-carbonate vein” in [18] or “orogenic gold” in [19]. Our early studies considered the Svetlinsk deposit as a mesothermal low-grade disseminated and vein-gold one [20]. Previous studies showed the polygenetic and polychronous ore formation by fluids derived from different sources [20,21,22]. Mineralisation was related to granitic magmatism [21]. Generation of the ore-forming fluids resulted from direct magmatic input and from metamorphic devolatilisation reactions in rocks adjacent to the pluton [20]. Gold-telluride ores were formed at decreasing temperatures and at progressively declining tellurium fugacity alternating with some periods of relative stability of fTe2, and under slight variations of sulphur fugacity. The abundance of tellurides is a mineralogical indicator of direct magmatic contributions to the Svetlinsk ore-forming system [23], cf. [24]. In the present paper, detailed study of fluid inclusions using microthermometry, Raman spectroscopy, LA-ICP-MS, and crush-leach analysis (including gas and ion chromatography, and ICP-MS) was performed to evaluate mineral formation conditions and possible mechanisms of ore deposition.

2. Geological Setting

The large Svetlinsk (also spelled as Svetlinskoe) gold-telluride deposit is located within the East Uralian megazone at the junction of the granite-gneissic (with minor greenstones) Neoproterozoic Kochkar anticlinorium with the Middle Paleozoic Aramil-Sukhtel synclinorium (mainly arc-related complexes); see Figure 1 and Figure 2. The deposit is associated with a NS-trending regional fault. This fault gently dips to the west, evolves to a steeply dipping reverse fault with depth, and is related to the submeridional Kumlyak-Linevka lineament zone [25,26,27].
The deposit is located in the sequence of west-dipping Upper Fransian-Famennian sandstone and shale alternating with horizons of mafic volcaniclastic rocks and small bodies of gabbro and serpentinite locally altered to talcite and listvenite. The Upper Devonian metavolcanics, mainly andesibasalt, composing the western flank of the Svetlinsk deposit, were thrusted over the terrigenous-carbonate meta-sediments that are the main ore-hosting rocks. The meta-volcaniclastic sequence is underlain by the Visean marbles (Figure 3). All host rocks underwent strong, up to epidote-amphibolite facies metamorphism caused by emplacement of the hidden granitic pluton and by influence of the major west-dipping thrust-fault [21]. In the western part of the deposit, the host rocks dip steeply westward, whereas, in the eastern part, a gentle (up to horizontal) dip is observed (Figure 3). Rocks in the thrust-shear zone were largely brecciated, subjected to cataclasis and schistosity.
The position of the deposit corresponds to the western slope of the Svetlinsk granite-related dome [28,29], which was related to the main collisional stage in the Late Paleozoic [30]. In 2–3 km to the east of the Svetlinsk gold deposit, the Svetlinsk pegmatite-related piesoguartz deposit with miarolic and vein pegmatite bodies is located above the apical part of the hidden granite pluton [31].
The gold-sulphide-telluride mineralisation of the Svetlinsk deposit can be subdivided into two types (Figure 4). The first type is represented by disseminated pyrite and pyrrhotite in the hydrothermal-altered (strongly silicified, up to quartzite-like) host rocks forming large stratified lenses. Sulphide content is usually about 3–5 vol %, locally up to 20 vol %. Gold grade in these ores is low (≤1 g/t Au). The bulk of gold in the deposit is associated with the second type of mineralisation (average 0.8–2.5 g/t Au) represented by a system of sulphide-quartz veins and veinlets (3–5 g/t Au) that cross-cut and overprint the stratified zones with disseminated sulphides [21,34]. Sulphide-quartz veins occur mainly in the metasedimentary rocks but they are almost absent in talcite and marble. Three types of veins accompanied by gold-bearing beresite-listvenite, pyrite-quartz-biotite, and pyrite-sericite-quartz alteration were found: (1) the largest NS-trending, steep-dipping veins of quartzite-like quartz, (2) the most numerous smaller steep-dipping, east-west-striking veins, and (3) rare, small, gently west-dipping sub-meridional veins and veinlets.
The ore-bearing vein-disseminated zones were traced for 500–700 m along strike and downdip to a depth of 900 m (Figure 3). The vertical extent of the mineralisation exceeds 1500 m. However, gold grades markedly decrease down the depth of 350–400 m.
Ore mineralogy consists of pyrrhotite, pyrite, chalcopyrite, minor sphalerite, tetrahedrite, scheelite, galena, various tellurides, and native gold. Native gold (fineness 873–948) in the ore veins is commonly associated with tellurides of gold and silver (Figure 4). Thin horizons of disseminated mineralisation occur in the footwall marble (Figure 4c). The marble-hosted mineralisation consists of pyrite, sphalerite, pyrrhotite, magnetite, rutile, rare native gold, bournonite, galena, and frohbergite (Figure 4j,k). Unusual mineralisation was found in the marble of the eastern part of the Svetlinsk open pit: small cavities in marble contain fluorite, muscovite, rhinestone, and pink topaz, together with later calcite and native sulphur. Topaz, muscovite, quartz, and fluorite could be formed in marble due to greisenisation in the apical part of the above-mentioned hidden granite massif.
Three mineralisation stages were recognised [20,21,23]: (1) disseminated quartz-pyrite-pyrrhotite stage, with rare chalcopyrite, fahlore, galena, and native gold; quartz forms crystals in marble (Q1a) and grey massive quartzite-like, locally sugar-like aggregates in metaterrigenic rocks (Q1b); (2) quartz-pyrite vein stage, with scheelite, quartz is translucent, locally milky (Q2); (3) gold-telluride veinlet stage (main productive), with several mineral assemblages separated by local tectonic events; quartz is mainly milky (Q3). Late water-translucent quartz (Q4) post-dates the mineralisation.
Structural analysis [28,35] and our unpublished data reveals the following sequence of brittle deformations and mineralising events. At the early stage, the sub-concordant, east–west-trending silicification (disseminated pyrite, pyrrhotite) zones formed in schists, large quartzite-like veins composed in the core of these zones. Later, reverse fault (rarely normal fault) displacements occurred, mainly along the east-west-trending and WNW-trending fracture systems. Subsequently, they were filled with quartz and quartz-carbonate veins and veinlets. At the third stage, intense shear and strike-slip deformations occurred, with the renewal of the old fractures and the formation of the new ones. These deformations were widely manifested as fracturing of the veined quartz. The fractures in quartz were then filled with gold-telluride-sulphide mineralisation, including vein selvages.

3. Materials and Methods

Samples for the study (~200) were taken from both the boreholes (depth from 145 to 600 m) and the open pit (levels from 160 to 320 m). Representative samples (n = 28) were selected for the microthermometric study (3—for Q1a, 8—for Q1b, 8—for Q2, 7—for Q3, and 2—for Q4).
Petrographic examination and microthermometric analysis of fluid inclusions (FIs) were carried out at the Institute of Geology of Ore Deposits, Petrography, Mineralogy, and Geochemistry (IGEM RAS, Moscow, Russia). Individual inclusions were studied on a total of 28 double-polished, 100–300-μm thick sections, using a microthermometric system consisting of LINKAM THMSG 600 chamber with 50× longfocus objective lens, installed on BX-53 Olympus microscope, video camera, and control computer. Samples were rapidly cooled to about −180 °C to detect a possible occurrence of clathrate, ice, salt hydrates, and carbonic solid phases. Upon progressive heating, up to seven phase transitions were observed in the inclusions, namely eutectic melting (Te), melting of the carbonic phase (Tm(CO2)), melting of the ice (Tm(ice)), clathrate melting (Tm(clathrate)), homogenisation of the carbonic phase (Th(CO2)), melting of the solid phases (Tm(solid)), mainly halite, and total homogenisation (Th) temperatures. The accuracy of temperature measurements is ±0.2 °C within the temperature interval from −60 to +60 °C, decreasing at higher and lower temperatures. The bulk salinity of the fluid was calculated from Tm(ice) for two-phase inclusions or Tm(solid) for multi-phase inclusions [36], or from Tm(clathrate) for aqueous-carbonic inclusions [37]. Salinity of dense CH4-N2 fluid with Tm(clathrate) > 10 °C was estimated based on ice melting temperature that was corrected for H2O content in clathrate. The predominant salt composition in aqueous solutions was identified from the melting temperature of eutectic (Te) [38]. The CO2 and CH4 concentrations in the solution (CCO2, CCH4) were calculated based on volume and mass ratios of fluid components [39]. To calculate the proportions of phase volumes in the inclusions of the regular shape, the linear dimensions of fluid inclusion and the phase of liquid CO2 were measured (in three axes, using Fedorov’s table). The volumes of fluid inclusion and the phase of liquid CO2 were calculated, according to the formulas for the volume of an ellipsoid or a sphere. Pressure was determined on the basis of the intersection of isochore and isotherm [40] for syngenetic fluid inclusions. The gas mixtures (CO2-CH4-N2) were interpreted according to [41,42]. Salinity, density, and pressure were estimated using the FLINCOR program [43,44]. The measurements were carried out for fluid inclusion assemblages with similar phase proportions to exclude possible errors due to the necking down of the vacuoles after fluid entrapment [45].
The crush-leach analysis of FIs was carried out for the selected samples (n = 5) with only one dominant type of fluid inclusions at the Central Research Institute for Geological Prospecting on Base and Precious Metals (TsNIGRI). The standard technique [46] includes cleaning of a sample, opening of fluid inclusions, and determination of the element composition. The ~0.5 to 1.0 g samples were crushed to 0.25–0.5 mm and were cleaned by HNO3 (50 vol %) solution and by electrolytic and ultrasonic cleaners. Before analysis, samples were dried and then placed into a single-shot reactor, filled with helium, and preheated at 110 °C. Subsequent heating to 400 °C and milling with corundum beads (at ~120 °C) allows complete opening of the inclusions. The extracted gas phase was analysed using an Agilent 6890 gas chromatograph to determine the concentration of water, CO2, CH4, and other gases. The residual liquid phase was analysed by ion chromatography (Tsvet-3006, for determination of Cl, F, SO42, and NO3, detection limit 0.01 mg/L) and ICP-MS (Elan-6100, for determination of Br, B, Li, Rb, Cs, Sr, Ba, As, Sb, Ge, Cu, Zn, Cd, Pb, Au, Ag, Bi, Mo, W, Sn, Tl, Hg, Co, Ni, Cr, V, U, Mn, Fe, Th, Si, Te, and Se) after the addition of 7 mL of ultrapure deionised water and centrifugation. Calculation of fluid composition includes: (1) subtraction of the element contents in the used water from the extract analysis, (2) subtraction of the element contents in the blank extract from the working extract analysis, (3) calculation of the element mass in the quartz sample, (4) calculation of element concentrations in solutions of inclusions (normalisation on H2O), and (5) calculation of HCO3 content based on the balance of cations and anions. Measurement accuracy is within about 5% for ion chromatography and 0.5–2% for ICP-MS.
Compositions of the gas and solid phases in individual fluid inclusions (n = 18) were studied by Raman spectroscopy using a Jobin Yvon LabRAM HR800 spectrometer (Sobolev Institute of Geology and Mineralogy Siberian Branch Russian Academy of Science (IGM SB RAS), Novosibirsk, Russia) and LabRAM-HR (Horiba Jobin-Yvon) spectrometer UV-VIS-NIR version (Geological Institute, Slovak Academy of Sciences, Bratislava, Slovakia). The daughter phases in multi-phase fluid inclusions were identified with the RRUFF database of Raman spectra (http://rruff.info/).
Laser ablation inductively coupled plasma mass spectrometry (LA-ICP-MS) was carried out at the Institute of Geochemistry, Irkutsk, Russia on a NexION 300D quadruple mass spectrometer with inductively coupled plasma combined with a New Wave UP 213 laser ablation system. Contents of B, Na, Mg, Al, S, K, Ca, Mn, Fe, Ni, Co, Cu, Zn, As, Rb, Sr, Mo, Ag, Cd, Sn, Sb, Cs, Ba, Au, Pb, and Bi in the inclusions (n = 11) were determined using the NIST 612 glass as an external standard ([47], http://georem.mpch-mainz.gwdg.de/sample_query_pref.asp, Table A1), and Na content as an internal standard. The Na concentration (the internal standard) in the inclusions was estimated based on cryometric determination of the total salt concentration in FI solutions. Then, the Na concentration in solutions of two-phase inclusions was calculated and corrected considering the content ratios of predominant (Na, K, Cs) cations in the solution, calculated from the LA-ICP-MS data. Te and Hg are absent in NIST 612 and Te and Hg contents are presented as Sb and Au ppm equivalent, respectively. Concentration of elements was calculated, according to the Longerich formulae [48].
Oxygen isotope composition of quartz (n = 15) was studied at the Analitic Centre of the Far East Geological Institute RAS (Stable Isotopes Laboratory, Vladivostok, Russia, analyst T.A.Velivetskaya) by standard techniques. The results of O isotope measurements (δ18OVSMOW) for quartz, combined with fractionation factors and fluid inclusion homogenisation data, were used to calculate the O isotopic composition of hydrothermal fluid, according to the equations of fractionation in hydrothermal systems [49].

4. Fluid Inclusion Study

4.1. Fluid Inclusion Petrography

The study of fluid inclusions (FIs) using the standard techniques was carried out for the various generations of vein quartz and carbonate. The fluid inclusions range from 1 to 25 μm in size and have irregular, ellipsoidal, or negative crystal shapes. The primary, pseudo-secondary, and secondary fluid inclusions were identified, according to the criteria of [45]. The widespread primary fluid inclusions are distributed along the growth zones or as random clusters within the quartz grains. The pseudo-secondary inclusions occur as trails in healed fractures, which do not cut grain boundaries. The secondary fluid inclusions are less abundant and fill cracks or form the chain-like clusters intersecting the grain boundaries. Four major types of inclusions were revealed based on phase assemblages at room (21 °C) temperature (Figure 5):
-
type I (LH2O + VCO2 ± LCO2) is two-phase or three-phase aqueous-carbonic FIs containing liquid water as well as liquid and gaseous CO2;
-
type II (VCO2 ± CH4,N2) is vapour-rich CO2 one-phase or two-phase FIs, with minor CH4 and N2, sometimes with a thin liquid rim;
-
type III (LH2O + VH2O) is two-phase liquid–vapour aqueous inclusions;
-
type IV (LH2O + VH2O + S) is three-phase or multi-phase FIs, consisting of H2O liquid, gas bubble, and one or more daughter minerals. The cubic crystals in such inclusions are usually halite, based on a refractive index. Rarely the solid phase is represented by calcite and solid phases of complex composition (chalcoalumite group) based on Raman spectroscopy data. Additionally, a spherical native sulphur phase was detected in some FIs of I, II, and IV types (subtypes Ia, IIa, and IVa, respectively).
Contemporaneous entrapment of liquid-rich and vapour-rich inclusions suggests that the mineralising fluid underwent phase separation.
Additionally, pseudo-secondary and secondary fluid inclusions of type I, II, and III were recognised in studied quartz.

4.2. Microthermometry

The microthermometry data for about 1300 fluid inclusions, from 28 thick section, in the various generations of quartz from the Svetlinsk deposit are shown in Table 1 and plotted in Figure 6.

4.2.1. Q1a (in the Footwall Marble)

Primary fluid inclusions of I, II, III, and IV types were revealed in quartz crystals in marble of this stage while only FIs of type II were identified in carbonate. Aqueous-carbonic FIs of type I show Tm(CO2) between −58.6 °C and −57.4 °C. CO2 homogenises at 33.1 °C in the vapour phase, which indicates the presence of additional gas species. Native sulphur melts at 85 °C (subtype Ia of FIs). Salinity is 15.6 wt % NaCl equiv. Homogenisation temperatures range between 315 and 286 °C. Te is about −53 °C, which corresponds to the CaCl2-NaCl-H2O system. Mean fluid density is 1.11 g/cm3. CO2 in FIs of type II melts at −60.5 ± 0.3 °C (FIs in quartz) and at −61.7 °C (FIs in carbonate). Homogenisation of CO2 in liquid phase occurs at 9.4 °C (FIs in carbonate) and between 16.6 and 32.8 °C (FIs in quartz). Fluid in FIs in carbonate is denser (0.9 g/cm3) compared to FIs in quartz (0.5–0.8 g/cm3). Type III of fluid inclusions is rare and trapped the Ca2+ dominated medium-salinity (Te = −54 °C, 10.5 wt % NaCl equiv.) solution homogenised at 354 °C. Native sulphur melts at 75 °C (subtype IIIa of FIs). Most inclusions of type IV exhibit uniform eutectic temperatures (Te = −52 °C), indicating the dominance of Ca2+ cations in the fluids. The halite dissolution temperature in these inclusions is 181 °C, which corresponds to salinity 31 wt % NaCl equiv. Total homogenisation of the type IV FIs occurs at 269 °C. The density of the fluid is 1.05 g/cm3. The FIs of type I contain 1.4 mol of CO2 per kg of solution and 0.1 mol of CH4 per kg of solution.
In addition, pseudo-secondary fluid inclusions of I and II types were revealed in quartz. FIs of type I contain CaCl2-NaCl solutions (Te = −56 to −50 °C) with higher salinity (15.8 to 28.8 wt % NaCl equiv.). The values of Tm(CO2) for the majority of FIs vary from -62.2 to −58.4 °C and indicate the variable concentrations of N2 and/or CH4 within this inclusion type. The homogenisation temperature ranges from 300 to 246 °C. The density of the fluid is 0.91–1.03 g/cm3. Type II of FIs contains CO2 with admixture of other gases that melts at −63.8 to −59.7 °C and homogenises at 14.5 to 31 °C. The FIs of type I contain 2.1–2.4 mol of CO2 per kg of solution and 0.1–0.4 mol of CH4 per kg of solution.

4.2.2. Q1b (in Metaterrigenic Rocks)

Primary FIs of I and II types are abundant in quartz of this stage, and inclusions of type II prevail. The homogenisation temperature for type I FIs ranges between 240 to 365 °C. Type I of FIs contains Na-, Mg-Na-, and Fe-Na-chloride solutions (Te from −28 to −37 °C). The values of Tm(CO2) range from −60.6 to −56.8 °C. This indicates the variable concentrations of other gas species (i.e., N2 and CH4) within this inclusion type that corresponds to the wide variations of the temperature of CO2 homogenisation into liquid (from −31.0 to +31.0 °C). Melting temperatures of clathrate (Tm(clathrate)) vary from 1.2 to 12.2 °C, corresponding to the narrow salinity range of 10.7–16.9 wt % NaCl equiv. The density mainly ranges from 1.03 to 1.10 g/cm3. Type II of FIs contains high-density CO2 with Tm(CO2) between −56.6 and −61.0 °C and homogenises at −35.7 to 23.8 °C, which implies the presence of additional gases apart from CO2. The FIs of type I contain 2.7–7.6 mol of CO2 per kg of solution and 0.2–0.7 mol of CH4 per kg of solution.
Secondary inclusions of types III and II are rare. FIs of type III contain Mg-Na-chloride solutions (Te = −31 °C). The final ice melting temperatures Tm(ice) are between −5.8 and −9.1 °C, corresponding to salinities of 8.9–13 wt % NaCl equiv. The homogenisation temperature ranges from 300 to 275 °C. The density of the fluid is 0.82–0.85 g/cm3. FIs of type II contain low-density N2 (0.16 g/cm3) homogenised at −131 °C in the vapour phase.

4.2.3. Q2

Primary FIs of three types (I, II, and III) were identified in quartz of this stage. Type III of FIs was revealed in a few samples. Type I of FIs contains Na- and Mg-Na chloride solutions (Te from −30 to −39 °C). The melting temperature of CO2 (Tm(CO2)) varies from −59.6 to −56.9 °C. This fact indicates the variable concentrations of N2 and/or CH4 within this inclusion type. Melting temperatures of clathrate (Tm(clathrate)) vary from 2.8 to 8.3 °C, corresponding to the salinity range from 3.4 to 11.3 wt % NaCl equiv. The homogenisation of CO2 (Th(CO2)) into liquid occurs at −21.2 to 27.9 °C. Inclusions homogenise at the temperature between 345 and 195 °C. The density of the fluid was 1.02–1.09 g/cm3. Type II of FI contains dense CO2 with Tm(CO2) between –59.9 and –56.9 °C, which implies the presence of additional gases apart from CO2. The majority of type II inclusions homogenises into the liquid phase (Th(CO2)) from −29.2 and 25.4 °C. FIs of type III contain Mg-Na-chloride solutions (Te = −30 °C) with Tm(ice) from −5.9 to −4.2 °C, corresponding to salinities of 6.7–9.1 wt % NaCl equiv. The homogenisation temperature ranges from 315 to 285 °C. The density of the fluid is 0.8 g/cm3. The FIs of type I contain 4.0–6.6 mol of CO2 per kg of solution and 0.4–0.5 mol of CH4 per kg of solution.
Secondary inclusions are of types III and II. FIs of type III contain Mg-Na-chloride solutions (Te = −32 °C) with 7.7 wt % NaCl equiv. and homogenise at 159 °C. The density of the fluid is 0.97 g/cm3. FIs of type II contain low-density N2 (0.13–0.17 g/cm3) homogenising at −153 to −149 °C in the vapour phase.

4.2.4. Q3

Primary fluid inclusions of I, II, and III types were recognised in quartz of this stage. Aqueous-carbonic inclusions of type I show Tm(CO2) between −74.4 and −56.6 °C, which indicates the presence of additional gas species. Th(CO2) is mainly from −30.8 to 26.5 °C. N2 homogenises at −147.5 to −146.9 °C in the vapour phase. Positive Tm(clathrate) values between 4.8 and 12.6 °C correspond to salinities from 3.3 to 10.9 wt % NaCl equiv. Homogenisation temperatures range between 405 and 295 °C. This inclusion type exhibits Te from −36 to −32 °C, which indicates the dominance of Mg2+ and Fe2+ cations in the chloride solution. Densities range from 0.83 to 1.12 g/cm3. In FIs of type II, the melting temperature of CO2 (Tm(CO2)) varies from −60.8 to −56.8 °C. This indicates variable concentrations of N2 and/or CH4 within this inclusion type. Type III of fluid inclusions is rare and trapped the low-salinity (0.8 wt % NaCl equiv.) solution homogenised at 308 °C. The FIs of type I contain 0.8–8.3 mol of CO2 per kg of solution and 0.6–0.9 mol of CH4 per kg of solution.
In addition, pseudo-secondary fluid inclusions of I, II, and III types were revealed in this quartz. FIs of type I contain FeCl3 solutions (Te = −37 °C) with a lower concentration of salts (4.2 wt % NaCl equiv.). The values of Tm(CO2) for the majority of FIs are close to −57.2 °C. Small quantities of other gas species (i.e., N2, CH4) decrease the melting point (−56.6 °C) of pure CO2. The homogenisation temperature is 280 °C. The density of the fluid is 1.06 g/cm3. Type II of FIs contains high-density CO2 with melting temperatures (Tm(CO2)) of −57.4 °C and homogenises at −3.1 to 9.1 °C.
FIs of type III trapped the dilute Mg-Na-solutions (Te = −35 to −30 °C) with 0.5–1.3 wt % NaCl equiv. Homogenisation temperature ranges from 347 to 262 °C. The FIs of type I contain 4.6 mol of CO2 per kg of solution and 0.4 mol of CH4 per kg of solution.
Secondary inclusions are of types III and II. FIs of type III trapped the contrasting fluids. Some of them are Mg-Na-chloride solutions (Te from −33 to −30 °C) with moderate salinity (7.4–9.5 wt % NaCl equiv.) homogenised between 305 and 190 °C while others are NaCl low-concentrated solutions (Te = −22 °C, Csalt = 0.5 wt % NaCl equiv.) homogenised at 203 °C. The density of both fluids is similar (0.81–0.94 g/cm3). FIs of type II contain low-density N2 (0.14–0.17 g/cm3) homogenised from −152 to −149 °C in the vapour phase.

4.2.5. Q4

Primary fluid inclusions of type III were recognised in the late vein quartz. These FIs trapped the low-salinity (1.7 to 7.3 wt % NaCl equiv.). NaCl solution (Te = −21 to −24 °C) homogenised from 250 to 130 °C.

4.3. Crush-Leach Analysis

The reconstructed fluid composition based on the crush-leach analysis of quartz is shown in Table 2.
Gas chromatography revealed that CO2 was the major volatile component trapped in fluid inclusions. Content of CH4 in the fluids varies from 0.03 to 2.6 g/kg of H2O. Na dominates in fluids for Q2 and Q3, while Ca is significant in addition to Na for Q1a. Solutions trapped in Q1a are Li-rich. Chlorine-ion is abundant in the early fluids (Q1a), while the mole fraction of HCO3 in fluid increases in Q2 and HCO3-rich fluids are predominant in Q3. Fluorine-ion was not determined, and the content of SO42 is insignificant. Iodine-ion was determined in the early fluids. Common components (in ppm) in the early fluid (Q1a) are Br (2825), Li (10.7), Sr (1166), Ba (3951), Co (20.1), Ni (175), and Mn (511). Fluids trapped in Q3 are rich in B (408–2016), As (42–73), Sb (27–53), Cu (236–264), Zn (54–1700), Pb (13–36), Fe (3–126), and Au (9.9). Fluid in Q2 is more water-saturated and contents of most elements are comparable to the fluid of Q3 but As and Sb contents are lower.

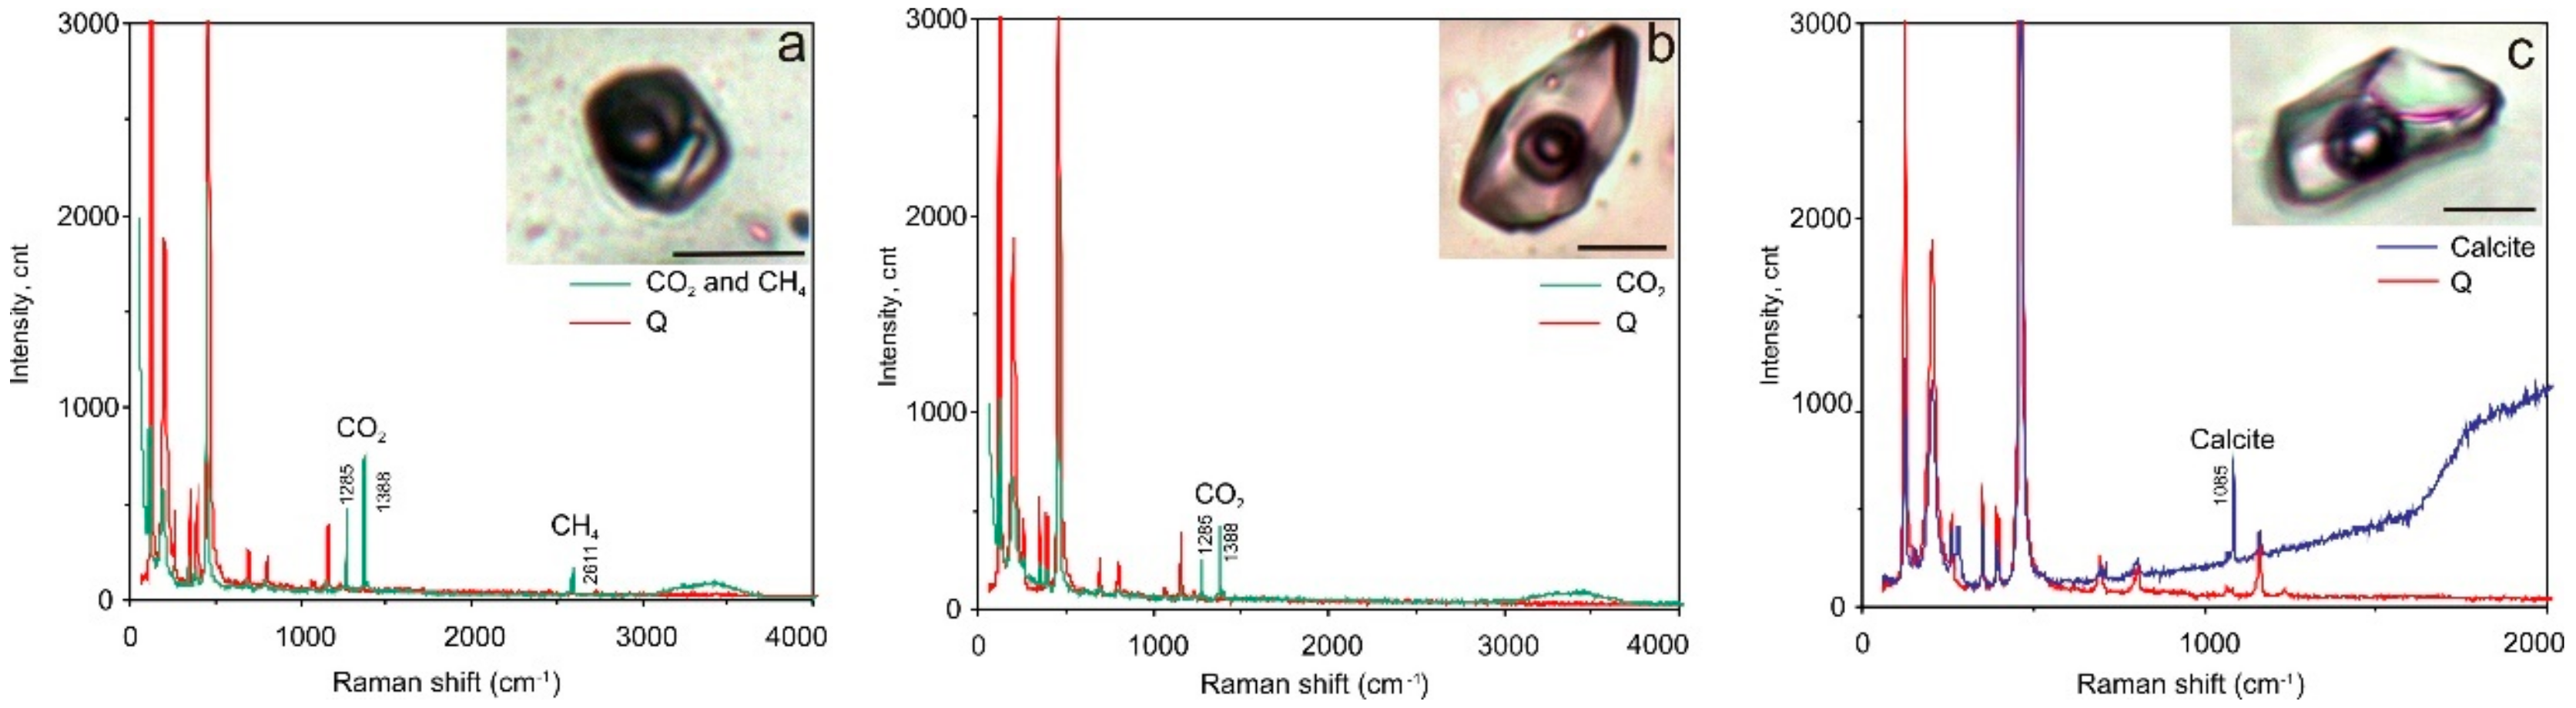
4.4. Raman Spectroscopy

The gaseous phase of FIs in all studied generations of quartz was examined using laser Raman to investigate the possible presence of condensed gases. FIs in Q1a (in marble) in addition to CO2 (94.2 to 98.8 mol %) contain H2S (0.53 to 4.12 mol %) and often N2 (0.65 to 1.64 mol %). Both vapour-rich and multi-phase FIs have a similar gaseous composition. The anisotropic solid phase in multi-phase inclusions has a complex composition (chalcoalumite group). Additionally, a spherical native sulphur phase (471.8 cm–1 spectral line) was detected in almost all FI types (Figure 7). All FIs in Q1b (in metaterrigenic rocks) mainly contain variable CO2 (50 to 100 mol %). In three FIs, the significant admixture of CH4 (20 to 50 mol %) and (in two inclusions) of H2S (2 to 4 mol %) was detected in addition to CO2 (Figure 8). Solid phases in two FIs are calcite, which was defined based on the 1085 cm−1 spectral line. The vapour-rich FIs in Q2 contain only CO2 (100 mol %, 9 FIs) whereas other gases (N2, CH4, H2S) were not detected. The gaseous phase of FIs in Q3 contains CO2 and N2. Aqueous-carbonic FIs are N2-rich (26.7 mol %) when compared to vapour-rich inclusions (1.6 to 10.4 mol %). The content of CO2 varies from 89.6 to 98.4 mol % and is equal to 73.3 mol % for these FI types (Table 3). No condensed gases were detected in the gaseous phase in FIs (n = 4) in the late quartz (Q4).

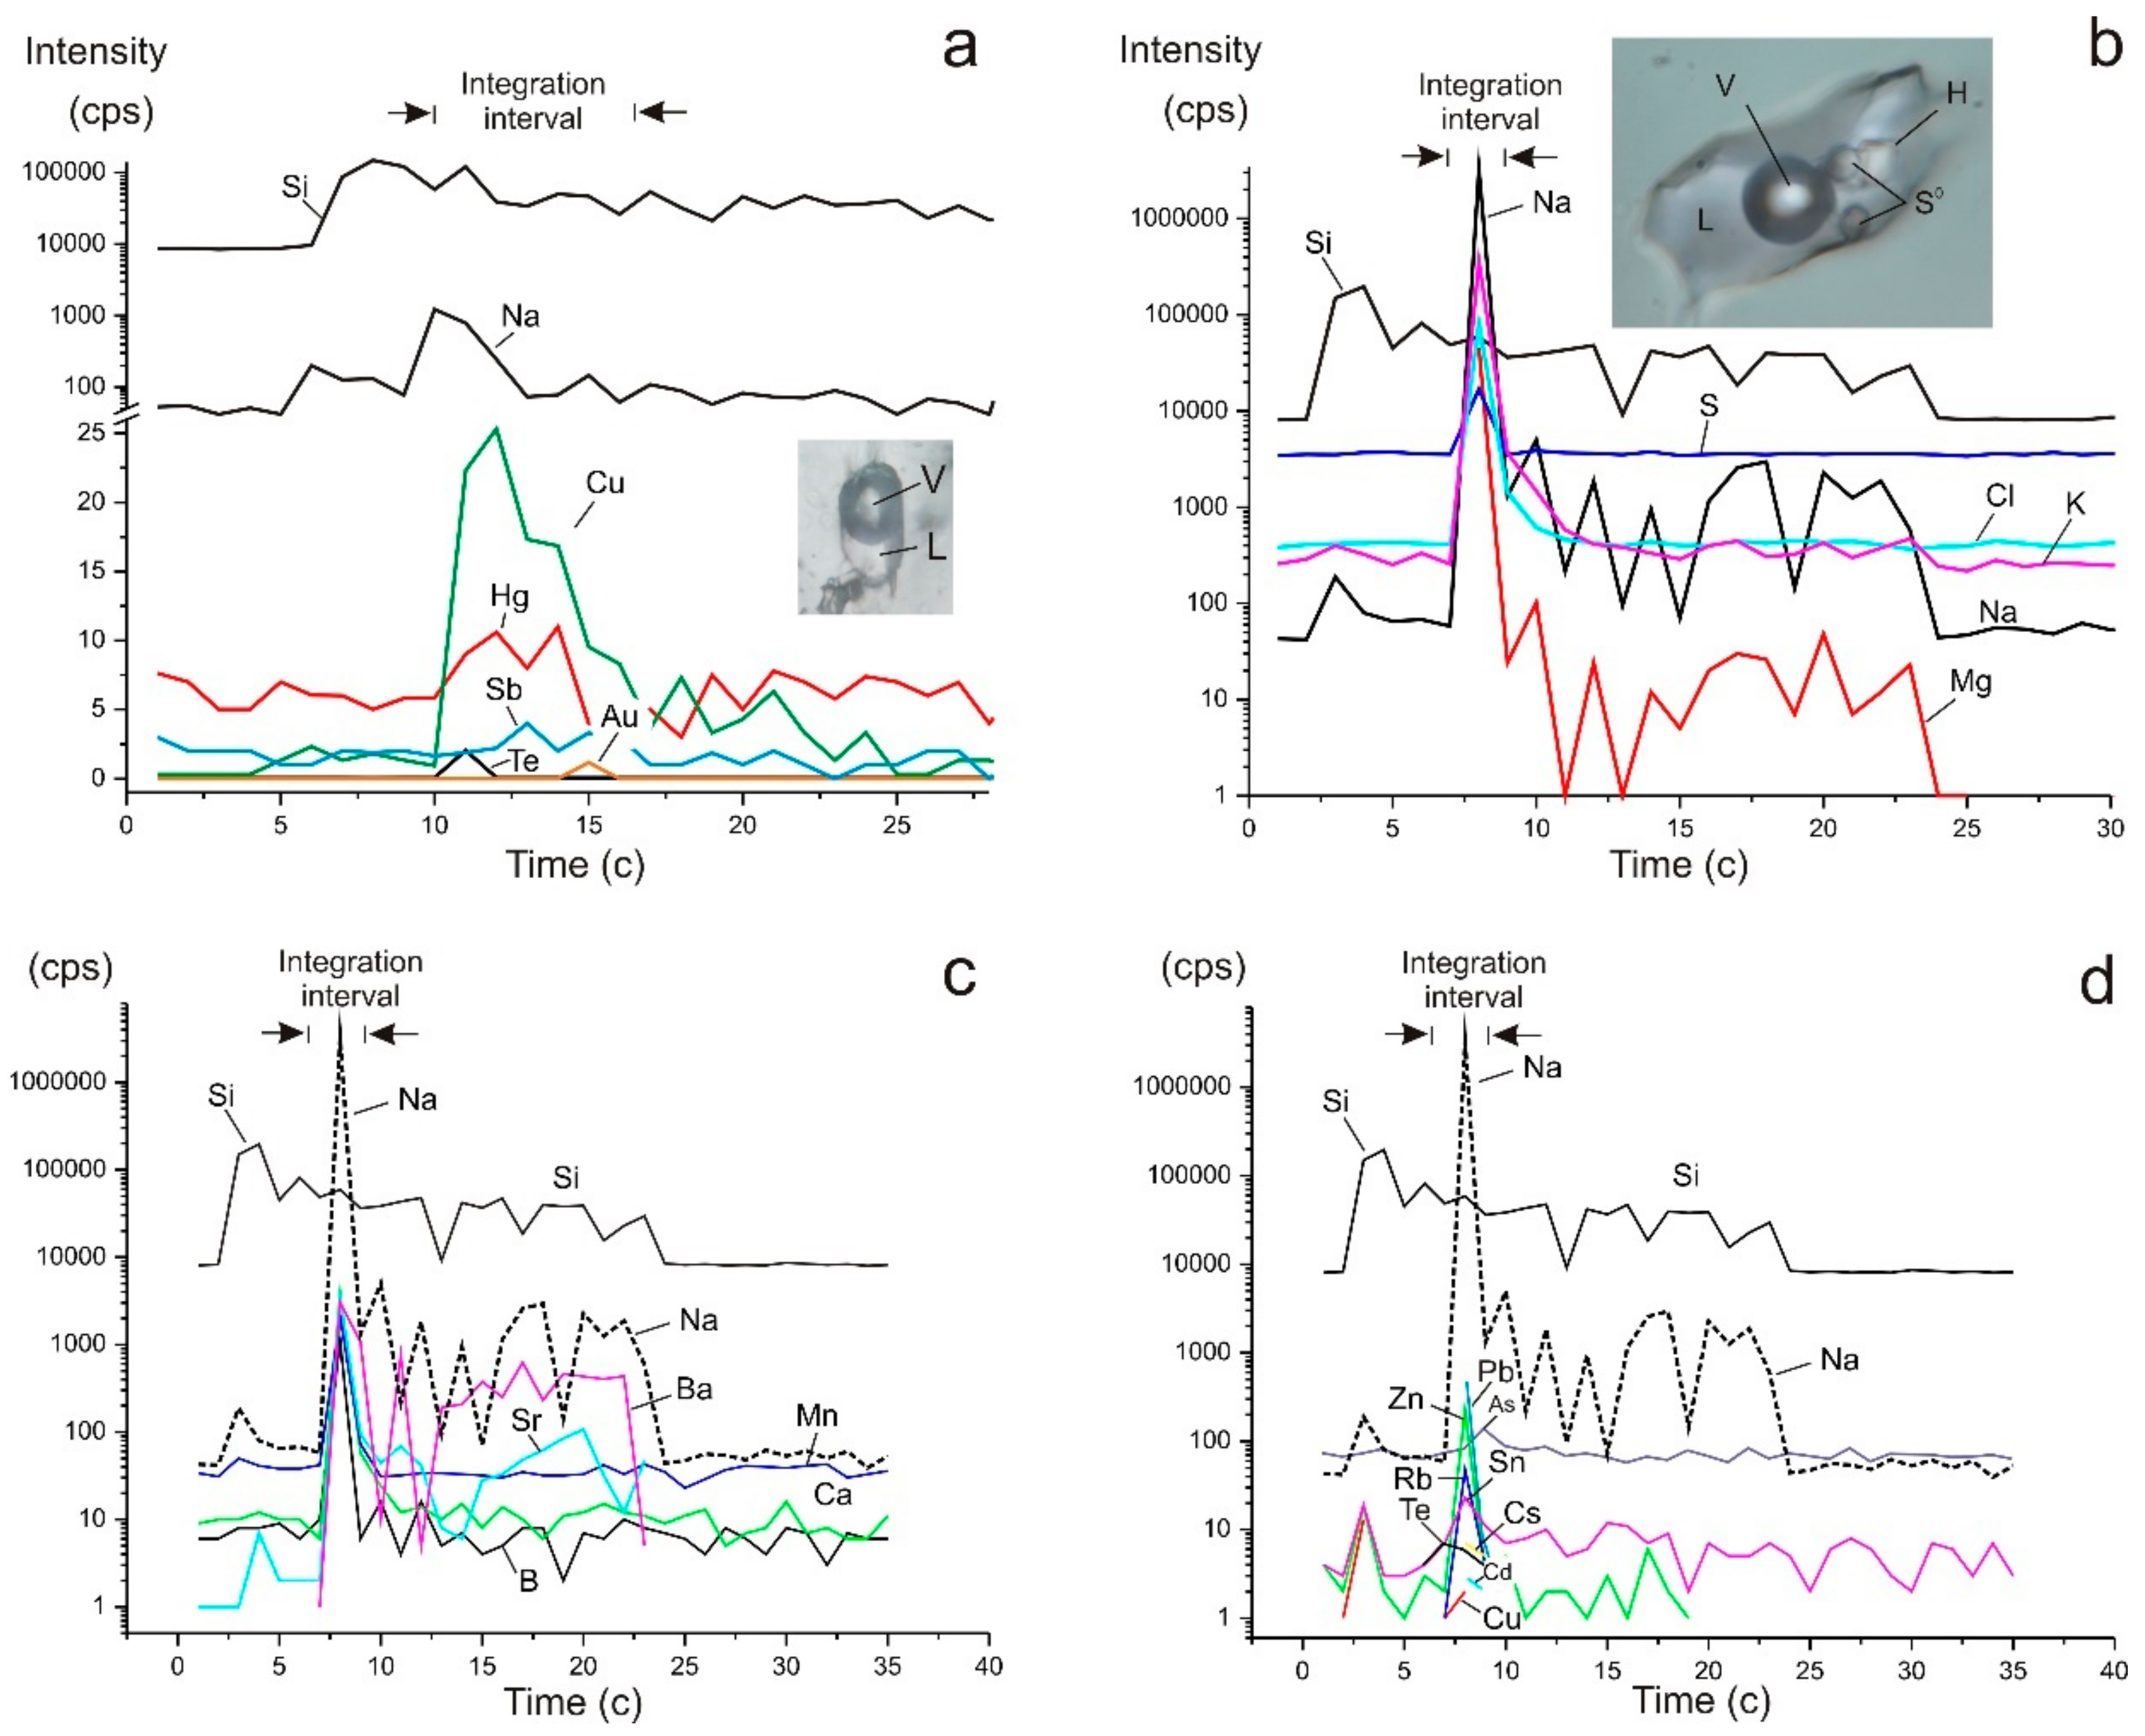
4.5. LA-ICP-MS of Fluid Inclusions

Fluid composition in individual fluid inclusions in the early quartz (Q1a, n = 6) and in quartz of the main productive stage (Q3, n = 5) was also determined (Table 4). The early fluid is rich in Na, S, Ca, Mn, Sr, Cd, Sn, and Ba, while, in Q3, contents of B, K, Cu, Zn, Ag, Te, Pb, and Bi are relatively high (Figure 9). Bi is absent (below the detection limit) in Q1a and Ca, Fe, and Cd were not detected in Q3. Co and Mo are sporadic in Q1a, and Mn, Mo, and Cs are sporadic in Q3. Fluid in vapour-rich inclusions in Q1a is rich in As, Cd, Sn, Te, Sb, and Hg in comparison with multi-phase FIs. Fluid in vapour-rich inclusions in Q3 is rich in S, Zn, Sr, Ba, Pb, and Bi, and sometimes in Sn and Cs in comparison with aqueous-carbonic FIs. Au and Ag are detected sporadically in both quartz generations, but their contents are typically one to two orders of magnitude higher in Q3 when compared to Q1a.

5. Oxygen Isotopes

The δ18O values in quartz of all studied generations vary from +12 to +26‰ and fall into a narrow interval for each stage (Figure 10). The δ18O values of the early quartz are of +23 to +26‰ and +12.1 to +16.5‰ for Q1a and Q1b, respectively. Quartz from the marble (Q1a) is 18O-rich. The δ18O values of Q2 fall into a narrow interval from +12 to +12.9‰. The δ18O values of Q3 range from +12.8 to +14.1‰. Our previous data revealed the 16O-rich (+7.2 ± 0.3‰) values for the late quartz [20]. The calculated δ18O values of the ore-forming fluid in equilibrium with quartz at 270–385 °C (according to Th data) fall into two intervals: between +5.2 and +8.5‰; between +16 and +19‰ (Figure 10). Temperature ranges for each of the studied samples are up to 50 °C (more often not exceeding 20 °C), which corresponds to the variation of 0.1 to 0.6‰ (rarely 1.3 to 1.5‰) between the estimations at minimum and maximum temperatures. The δ18O values of fluid were calculated using average Th and the dependence between the temperature and δ18OH2O is shown in Figure 10b. The δ18OH2O value in equilibrium with the metasomatic quartz at 300 °C is +8.5‰ and with the vein quartz ranges from +4.5 to +11‰ and close to 0 (±0.5‰) [20].

6. Discussion

6.1. Fluid Immiscibility or Fluid Mixing

The contrasting fluids were revealed in the studied hydrothermal system. At the early stage (Q1a), four major temporally-related inclusion types were present: (1) CO2 ± H2S + N2 ± S0, (2) hypersaline (31 wt % NaCl equiv.), multi-phase, H2O − CO2 − NaCl − CaCl2 ± S0, (3) moderate salinity (15.6 wt % NaCl equiv.) H2O − CO2 − NaCl − CaCl2 ± S0 with variable CO2 contents and (4) low salinity (10.5 wt % NaCl equiv.) H2O-NaCl-CaCl2 inclusions. The first two fluids are interpreted to be end-member fluids of the third fluid, formed during immiscibility. This hypothesis is confirmed by lower Th of H2O-rich inclusions, similar CO2 homogenisation temperature ranges, and higher salinities in more-H2O-rich inclusions due to the salt preferentially fractionated into the aqueous phase [51]. At the early stage (Q1b), two fluids were revealed: (1) CO2-rich and (2) moderate salinity (10.7–16.9 wt % NaCl equiv.) H2O − CO2 ± CH4 − NaCl − MgCl2 − FeCl2. The appearance of the parent fluid in the same assemblages as two immiscible phases at the early stage implies that these fluid inclusions were trapped along or close to the solvus. The dominance of CO2-rich inclusions can be explained by the contrasting wetting properties of H2O compared to CO2 with respect to quartz. At stage 2 (Q2), three fluids were revealed: (1) low to moderate salinity (3.4–11.3 wt % NaCl equiv.) CO2 − H2O − NaCl − MgCl2 − FeCl2, (2) CO2-rich, and (3) low-salinity (6.7–9.1 wt % NaCl equiv.) H2O − NaCl. These FI types show contrasting fluid compositions and homogenisation temperatures that are not in accordance with the criteria for fluid immiscibility [51]. Likely, these fluids are the end product of partial fluid mixing and heterogeneous trapping. The positive correlation between Th and salinity for the majority of values is compelling evidence of fluid mixing (Figure 6). At stage 3 (Q3), three fluids were revealed: (1) low to moderate salinity (3.3–10.9 wt % NaCl equiv.) CO2 (±N2) − H2O − NaCl − MgCl2 − FeCl2, (2) CO2-rich, and (3) dilute (0.5–1.3 wt % NaCl equiv.) H2O − NaCl − MgCl2 solution. Contrasting fluid compositions as well as positive correlation between Th and salinity (Figure 6) are evidence for fluid mixing. Late quartz (Q4) was precipitated from low-salinity (1.7 to 7.3 wt % NaCl equiv.) NaCl solution.

6.2. PTX Parameters of Ore Formation

6.2.1. Temperature

The homogenisation temperatures measured for the FI associations of types I and II with similar phase ratios correspond to the two-phase liquid-vapour equilibrium curve in the H2O − CO2 − NaCl system [52]. The Th values obtained for such heterogenic aqueous-carbonic fluid may be considered the real temperatures of mineral deposition because pressure correction is not required in this case [34]. The fluid inclusion study indicates that the mineralisation was formed from 365 to 240 °C, from 345 to 195 °C, and from 405 to 295 °C during stages 1 (Q1a and Q1b), 2 (Q2), and 3 (Q3), respectively. Mineral formation temperature did not decrease from the early stage to the late one, but temperature decrease within each stage was recorded.
In addition to the microthermometry data, the mineral-forming temperature was calculated using cation (Na/K, Na-K-Ca and Fe/Mn) and mineral geothermometers [53,54,55,56]. The obtained values (details are not shown here) are up to 50 °C lower for Na/K and Na-K-Ca geothermometers, but are comparable with microthermometry data for the Fe/Mn geothermometer (304 and 395 °C).
Native gold crystallisation temperature (stage 2) estimated by electrum-fahlore and sphalerite-fahlore geothermometers varies from 216 to 211 °C (Vikent’eva, unpublished data). Temperature calculated based on the composition of telluride parageneses and intergrowths native gold with Au-Ag tellurides from stage 3 varies from 350 to 240 °C [23] and does not contradict the microthermometric data.

6.2.2. Pressure

For the samples where CO2-bearing FIs were found, the pressure was estimated by crossing isochors and isotherms (Figure 11). For the construction of CO2 isochors, carbon dioxide inclusions with a minimum impurity of other gases (TmCO2 from ‒56.6 to ‒58.0 °C) were used, so that their influence on the density estimation could be ignored (less than 5 mol % in bulk fluid composition). Estimated fluid pressure varies from 1970 to 4070 bar at 260 to 365 °C, from 1620 to 2880 bar at 255 to 302 °C and from 1100 to 3220 at 295 to 363 °C for the stages 1 (Q1b), 2 (Q2), and 3 (Q3), respectively (Figure 11). Significant fluid pressure fluctuations as well as intense deformations and fracturing during ore formation suggest the overpressure formation conditions [57,58,59]. The fluid pressure is relatively low during fluid flow through open fractures at the early periods, and it could increase later as a result of sealing of fractures by precipitation of hydrothermal minerals. This process can repeat itself many times. The fault-valve model helps to explain wide ranges of pressure determinations for FIs from a single sample [60].

6.2.3. Fluid Composition

The complex study of FIs and crush-leach data revealed the various fluid compositions for each stage. Ore-forming fluids in the Svetlinsk hydrothermal system were CO2-rich. It is pointed out that the presence of CO2 can induce immiscibility both within the magmatic volatile phase and in the hydrothermal systems [61]. In addition to CO2, early fluid was H2S-bearing. N2 and CH4 are occasionally present in the fluid coexisting with Q1a and Q1b, respectively (Table 3). Quartz of the quartz-pyrite stage (Q2) was formed from CO2-rich fluid. The fluid responsible for the formation of quartz (Q3) with telluride assemblages was a mixture of CO2 and nitrogen. Late fluid (Q4) was a dilution aqueous solution. Some researchers attribute the presence of N2 and CH4 in fluid to the interaction with fluids derived from the metasedimentary host rocks [62,63,64]. The nitrogen-rich fluid could be produced in-situ, by oxidation-dehydration reactions destabilising ammonium-bearing silicate minerals (biotite, phlogopite, and amphibole). It should be noted that N2-CH4-(H2O) fluids form in equilibrium with biotite at high values of aK+ aH+ characteristic, whereas N2-CO2-(H2O) fluids would be produced in metapelitic rocks with lower aK+ aH+ [65]. In addition, the oxidising environment at this temperature range was favourable for the N2 release from the NH4+-bearing host rocks and stabilisation in the fluid [66]. Mantle-derived fluid could be an alternative source of N2-enrichment. The existence of N2-rich fluid phase in at least some mantle lithologies at certain conditions is demonstrated in [67]. The presence of N2-CO2-(H2O) fluids in equilibrium with biotite and reduced nature of hydrothermal fluid (abundance of pyrrhotite in ores and H2S in FIs) for Q1a and abundance of telluride mineralisation for Q3 suggest the possible participation of mantle fluid in the ore formation. N2-rich inclusions were also found in the intrusion-related gold deposits [68,69,70,71] as well as in quartz from I-type granite [72]. The latter suggests the magmatic fluid enrichment by N2.
Halogen ratios (Br/Cl and I/Cl) can be estimated only for the early fluid in equilibrium with quartz in marble (Q1a). Br content is below the detection limit in other samples. Br/Cl and I/Cl mol ratios are 0.021 and 532.8 × 10⁻⁶, respectively. Such high values correspond to a metamorphic interval, according to [73]. However, magmatic fluid could also be Br-enriched as a result of magma degassing with preferential removal of Cl (as HCl) from interacting NaCl solutions and silica, or at the precipitation of halite from the hydrothermal fluid, where a significant amount of Cl is incorporated into halite and residual fluid is enriched by Br [74,75]. Br-rich fluids within the magmatic systems could also be generated as a result of crystallisation of the Cl-bearing phases (e.g., biotite, amphibole, or apatite) prior to volatile exsolution, which causes the formation of Br-enriched juvenile magmatic brines (e.g., [74]).
Early quartz (stage 1) was formed from the bicarbonate-chloride fluid. Na+ ≥ Ca2+ >> K+, Mg2+ and Cl > HCO3 in the fluid (Q1a) and it was relatively rich in Ba, Br, I, Sr, Ba, Mo, Co, Ni, Sn, and Cd. Quartz of stage 2 also was formed from the CO2-rich bicarbonate-chloride fluid, but this fluid was Na-rich (Na+ >> K+, Ca2+ > Mg2+) and Cl < HCO3. Ore-forming bicarbonate-rich fluid of stage 3 was enriched in B, As, Sb, Cu, Zn, Pb, Bi, Au, Ag, Te, and Si.
It should be noted that Au and Te were detected both in the early fluid and the fluid responsible for the main productive stage. This fact suggests that these mineralisations were derived from a single hydrothermal system.

6.2.4. Sulphur in Fluid Inclusions

A specific feature of the early fluid of the Svetlinsk deposit is the presence of native sulphur in fluid inclusions.
Native sulphur was observed in FIs from the Nordvik salt dome (Taimyr Peninsula, Russia, [76]), and from the stratabound Sierra de Lujar deposit (Granada, Spain, [77]). A mix of different redox states of sulphur species was also found in FIs from various environments. H2S, COS, and S together with anhydrite crystals were observed in FIs from the meta-evaporite in the Siberian platform [78] and in the metamorphic ruby deposits in Northern Vietnam [79]. H2S, SO2, SO42−, and elemental sulphur are often observed in FIs from porphyry-epithermal deposits [80,81]. Native sulphur-bearing FIs were more recently identified in greisen veins of the Sn-W Alyaskitovoe deposit (Yakutia, Russia) linked with the Li-F granite, in quartz of both the granite porphyry and the veins from the Kalgutinskoe Mo-W(Be) greisen deposit (Gorny Altai, Russia), and in the Samolazovskoe deposit (Central Aldan), which formation was related to alkaline magmatism [82].
Based on experimental studies, the mix of sulphate-sulphide and/or elemental sulphur could produce new sulphur species at an elevated temperature (>200 °C), like the trisulphur S3. The latter could favour the mobility of sulphur itself and associated metals (Au, Cu, and Mo) in hydrothermal fluids [83].

6.2.5. Oxidation State of Ore Forming Fluid

The abundance of pyrrhotite in the early ores as well as the presence of H2S (Q1a) and CH4 (Q1b) in FIs suggests the reduced nature of the hydrothermal fluid. The presence of native sulphur in FIs could be an indicator of the initial oxidation state of parent fluid and of low pH of solution at the moment of trapping [84]. High CH4 values could be attributed either to the interaction of the hydrothermal fluids with carbonaceous host rock or to the initially lower oxidation state of the fluid (close to the CO2-CH4 buffer). Precipitation of scheelite and late telluride assemblages as well as the presence of N2 in FIs corresponds to a relatively oxidised state of ore-forming fluid. This fact coincides with the slight increase of the CO2/CH4 ratio from the early to the late stage. It was previously established that gold-telluride ores were formed at the temperature decrease and at the progressive decline of tellurium fugacity with some periods of relative stability of fTe2 and at the slight fS2 variations [19]. According to [85], the constant level of fTe2 requires a change in the hydrothermal fluid, such as an increase of XH2Te, total Te concentration, or oxidation of fluid. Composition of Bi tellurides, namely the Bi/Te + Se + S (RBi/Te) ratio, reflects the redox conditions of fluid [86]. Tsumoite (RBi/Te = 1) coexisting with Au-Ag tellurides indicates the relatively oxidised environment.

6.3. Sources of Hydrothermal Fluids

Oxygen isotope composition of fluid (δ18OH2O) equilibrated with various studied quartz is clustered into two groups, with one from +5.2 to +8.5‰ (Q1b, Q2, and Q3) and the other from +16.1 to +19.1‰ (Q1a) (Figure 10). According to the previous study, δ18OH2O values are: in equilibrium with the metasomatic quartz at 300 °C – +8.5‰; with the vein quartz − 0 ± 0.5‰ and +4.5 to +11.0‰ [20]. The majority of values corresponds to the typical magmatic water interval (+5 to +9‰, [87]), is close to the mantle value (+5.7‰) and falls into a narrow interval for each stage (+6.1 to +8.4‰ for Q1b, +5.2 to +6.0‰ for Q2 and +6.3 to +8.5‰ for Q3). Since the intervals of igneous and metamorphic water overlap, the contribution of metamorphic fluids to ore formation cannot be excluded. Oxygen isotope composition of fluid equilibrated with the quartz from marble (Q1a) is 18O-rich and these values are typical for metamorphic fluids. However, the oxygen isotope exchange between the fluid and the host rock could also cause 18O-enrichment of the magmatic fluid derived from the hidden granitic pluton. The deposition of quartz from 16O-rich fluid can be a result of the 18O depleted heated meteoric water input. The δ34SH2S values (+1.5 to +8.7‰ [20]) are typical of sulphur exsolved from the granite magma.

6.4. Model of the Svetlinsk Hydrothermal System

Formation of quartz veins was related to the development of the Svetlinsk granite-related dome located to the east of the deposit [28,29]. Granitisation seems to trigger silica and gold mobilisation and their accumulation in the metamorphic halo of the dome. The escape of magmatic fluids from the crystallising synorogenic granitic melt caused the formation of miarolic and vein pegmatite bodies above the apical part of the granite pluton [31]. The migration of fluids further from the granite pluton caused the formation of quartz veins and accompanying quartz-sericite and quartz-biotite alterations at the flanks of the pluton-related system [30]. In the areas of gentle layering, the ore mineralisation was additionally controlled by the zone of the thrust, hosting the plate-shaped massive bodies of serpentinite and gabbro. These bodies acted as a geochemical reducing and hydrodynamic (decreasing permeability) barrier. The following hydrothermal processes led to partial gold redistribution. Some late gold together with tellurium could come from the lower crust and the upper mantle through the thrust permeable zone leading to the formation of the deposit of the unusual for the Urals Au-telluride mesothermal type.
The deposit formation was polygenetic and mainly related to the orogenic activity [21,31,88], cf. [26]. Metamorphic mineral assemblages of the host mainly metasedimentary rocks indicate the amphibolitic facies of the metamorphic peak that was assumed to be associated with the Early-Permian regional metamorphism, accompanying the hyper-collision [89,90]. Five stages of ore formation can be distinguished (cf., [21]): (I) deposition of terrigenous and volcaniclastic rock (slightly enriched in Au), Late Fransian–Early Visean, (II) low-grade greenstone metamorphic stage with disseminated sulphide redistribution, Tournaisian, (III) main collision metamorphism (amphibolitic facies) and formation of the synorogenic tonalite-granodiorite pluton and pegmatite and quartz veins in its apical part and, further from the pluton, in the distal peripheral zone, series of gold-scheelite-sulphide-quartz veins accompanied by beresite-listvenite alteration, Visean–Serpukhovian, (IV) formation of veinlet-disseminated gold-telluride mantle-related mineralisation, Moscovian–Early Permian, and (V) supergenic stage with the formation of weathering crust and large gold placers (Mesozoic‒Cenozoic).

7. Conclusions

Our detailed fluid inclusions study revealed the contrasting fluid compositions, and stable O isotope data proved the multiple sources of the ore-forming fluids involved in the Svetlinsk hydrothermal system. At the early stages, the magmatic fluid evolved during its ascent and phase separation, and fluid derived from the host rock decarbonation and dehydration were involved in the hydrothermal system. In addition, mantle-derived hydrothermal fluid might be involved in the ore-forming process during the gold-telluride precipitation, as well as heated meteoric waters at the late stages. Early fluids were H2S-, S0- and CH4-rich, while the Au-Te mineralisation was formed from N2-rich fluid. Mineralisation in the Svetlinsk deposit was formed at a wide range of temperature and pressure (200–400 °C and 1–4 kbar). Mineral formation temperature did not decrease from the early to the late stages, but a temperature decrease within each stage was recorded. Significant fluid pressure fluctuations as well as intense deformation events with post-peak fracturing suggest the possibility of periodic overpressure conditions during vein formation.

Author Contributions

Methodology and investigation, O.V., V.P., S.K., A.B., and E.G. Field work, I.V., O.V., and M.P. Writing–original draft preparation, O.V. and I.V. Reviewed and edited the draft, O.V., I.V., and N.B. Discussion, O.V., I.V., and N.B. Project leadership and administration, N.B. All authors have read and agreed to the published version of the manuscript.

Funding

The Ministry of Science and Higher Education of the Russial Federation (field work, fluid inclusion, and stable isotope study) and the Russian Scientific Foundation (genetic interpretation) funded this research.

Acknowledgments

We thank Yu.V. Vasyuta (crush-leach analysis), N.V. Bryanskiy (LA-ICP-MS), Mgr. J.Luptakova, Mgr. S. Milovska (Raman), and T.A. Velivetskaya (O isotope) for carrying out the analytical procedures. Additionally, we thank S.E. Borisovskiy and L.O. Magazina for the BSE images, Serguei Soloviev for some helpful remarks, and Anna Vikenteva for translation issues. We thank the managers and geological team of JSC Uzhuralzoloto Group of Companies (UGC) and A.Yu. Kisin for their assistance during fieldwork. The manuscript was improved through constructive and helpful reviews from Academic Editor Panagiotis Voudouris and two anonymous reviewers. Work was done on the state assignment of IGEM RAS and IGM SB RAS.

Conflicts of Interest

The authors declare no conflict of interest.

Appendix A

Table A1. Composition of the NIST 612 standard [47], Analytic Center of IGM SB RAS.
ComponentContent±σComponentContent±σComponentContent±σ
Na2O, %13.70.3Ni38.80.2Pr37.91
Al2O32.030.04Cu37.81.5Nd35.50.7
SiO272.10.6Zn39.11.7Sm37.70.8
CaO11.90.1Ga36.91.5Eu35.60.8
Li, ppm40.21.3Ge36.13.8Gd37.30.9
Be37.51.5As35.75.5Tb37.61.1
B34.31.7Se16.31.9Dy35.50.7
F8089Rb31.40.4Ho38.30.8
Na101,6452226Sr78.40.2Er380.9
Mg685.1Y38.31.4Tm36.80.6
Al10,747212Zr37.91.2Yb39.20.9
Si336,4672800Nb38.92.1Lu370.9
P46.66.9Mo37.41.5Hf36.71.2
S37770Rh0.910.02Ta37.61.9
Cl14258Pd1.050.1W381.1
K62.32.4Ag220.3Re6.630.61
Ca85,000714Cd28.11.1Ir0.0045
Sc39.92.5In38.92.1Pt2.510.1
Ti442.3Sn38.61.3Au4.770.31
V38.81.2Sb34.71.8Tl14.90.5
Cr36.41.5Cs42.71.8Pb38.60.2
Mn38.70.9Ba39.30.9Bi30.22.3
Fe512La360.7Th37.790.08
Co35.51Ce38.40.7U37.380.08

References

  1. Shackleton, J.M.; Spry, P.G.; Bateman, R. Telluride mineralogy of the Golden Mile deposit, Kalgoorlie, Western Australia. Can. Mineral. 2003, 41, 1503–1524. [Google Scholar] [CrossRef] [Green Version]
  2. Spry, P.; Foster, F.; Truckle, J.; Chadwick, T. The mineralogy of the Golden Sunlight gold–silver telluride deposit, Whitehall, Montana, USA. Mineral. Petrol. 1997, 59, 143–164. [Google Scholar] [CrossRef]
  3. Kelley, K.D.; Romberger, S.B.; Beaty, D.W.; Pontius, J.A.; Snee, L.W.; Stein, H.J.; Thompson, T.B. Geochemical and geochronological constraints on the genesis of Au-Te Deposits at Cripple Creek, Colorado. Econ. Geol. 1998, 93, 981–1012. [Google Scholar] [CrossRef]
  4. Ahmad, H.; Solomon, M.; Walshe, J.L. Mineralogical and geochemical studies of the Emperor gold telluride deposit, Fiji. Econ. Geol. 1987, 82, 345–370. [Google Scholar] [CrossRef]
  5. Pals, D.; Spry, P. Telluride mineralogy of the low-sulfidation epithermal Emperor gold deposit, Vatukoula, Fiji. Mineral. Petrol. 2003, 79, 285–307. [Google Scholar] [CrossRef]
  6. Cooke, D.R.; McPhail, D. Epithermal Au–Ag–Te mineralization, Acupan, Baguio district, Philippines: Numerical simulations of mineral deposition. Econ. Geol. 2001, 96, 109–131. [Google Scholar]
  7. Ciobanu, C.L.; Cook, N.J.; Capraru, N.; Damian, G.; Cristea, P. Mineral assemblages from the vein salband at Sacarimb, Golden Quadrilateral, Romania: I. Sulphides and sulphosalts. Geokh. Mineral. Petrol. 2005, 43, 47–55. [Google Scholar]
  8. Cook, N.J.; Ciobanu, C.L.; Spry, P.G.; Voudouris, P. Understanding gold-(silver)-telluride-(selenide) mineral deposits. Episodes 2009, 32, 249–263. [Google Scholar] [CrossRef] [Green Version]
  9. Jensen, E.P.; Barton, M.D. Geology of the Cripple Creek district Part I.; General summary of geologic features and regional setting, and Part II. Time-space synthesis of magmatic and hydrothermal activity. In Geology of the Cripple Creek Gold-Telluride Deposit, Colorado: Guidebook Prepared for the SEG and IGCP-486 Pre-Meeting Field Trip #411; Jensen, E.P., Spry, P.G., Eds.; GSA Annual Meeting and Exposition: Phoenix, AZ, USA, 2007. [Google Scholar]
  10. Mikucki, E.J. Hydrothermal transport and depositional processes in Archean lode-gold systems: A review. Ore Geol. Rev. 1998, 13, 307–321. [Google Scholar] [CrossRef]
  11. Pak, S.J.; Choi, S.-G.; Oh, C.-W.; Heo, C.-H.; Choi, S.-H.; Kim, S.-W. Genetic environment of the intrusion-related Yuryang Au-Te Deposit in the Cheonan Metallogenic Province, Korea. Resour. Geol. 2006, 56, 117–132. [Google Scholar] [CrossRef]
  12. Hu, H.B.; Mao, J.W.; Niu, S.Y.; Li, Y.F.; Li, M.W. Geology and geochemistry of telluride–Au deposits in the Pingyi area, western Shandong, China. Mineral. Petrol. 2006, 87, 209–240. [Google Scholar] [CrossRef]
  13. Mao, J.W.; Li, Y.Q.; Goldfarb, R.J.; He, Y. Fluid Inclusion of the Dongping telluride gold deposit, Hebei province: Implication of the contribution of mantle-derived fluids to metallogenesis. Econ. Geol. 2003, 98, 517–534. [Google Scholar]
  14. Voudouris, P.; Spry, P.G.; Melfos, V.; Alfieris, D. Tellurides and bismuth sulfosalts in gold occurrences of Greece: Mineralogy and genetic considerations. In Proceedings of the Field Workshop of IGCP-486, Espoo, Finland, 26–31August 2007; Volume 53, pp. 85–94, Geological Survey of Finland Opas. [Google Scholar]
  15. Fedoseev, V.V. Mineral resources of JSC “Yuzhuralzoloto” in the Chelyabinsk region. Mineral resources of Russia. Econ. Manag. 2007, 20–27. [Google Scholar]
  16. Berger, R.V.; Fedoseev, V.V.; Saraskin, A.V. State-of-the-art and prospects of mineral and raw materials supply base expansion at UGC Gold Mining Company in the South Ural. Gorn. Zhurnal 2017, 9, 6–11. [Google Scholar] [CrossRef] [Green Version]
  17. Gosselin, P.; Dubé, B. Gold Deposits of Canada: Distribution, Geological Parameters and Gold Content; Open File (Geological Survey of Canada), 4896; Geological Survey of Canada: Quebec, QC, Canada, 2005. [Google Scholar]
  18. Poulsen, K.H.; Robert, F.; Dubé, B. Geological Classification of Canadian Gold Deposits; Geological Survey of Canada Bulletin: Ottawa, ON, Canada, 2000. [Google Scholar]
  19. Groves, D.I.; Goldfarb, R.J.; Robert, F.; Hart, C.J.R. Gold deposits in metamorphic belts: Overview of current understanding, outstanding problems, future research, and exploration significance. Econ. Geol. 2003, 98, 1–29. [Google Scholar]
  20. Bortnikov, N.S.; Murzin, V.V.; Sazonov, V.N.; Prokof’ev, V.Y.; Stolyarov, M.I. The Svetlinsk gold-telluride deposit, Urals, Russia: Mineral paragenesis, fluid inclusions and stable isotope studies. In Mineral Deposits: Processes to Proceessing, Proceedings of the Fifth Biennial SGA Meeting and the Tenth Quadrennial JAGOD Symposium, London, UK, 22–25 August 1999; A.A.Balkema Publishers: Rotterdam, The Netherlands, 1999; Volume 1, pp. 21–24. [Google Scholar]
  21. Sazonov, V.N.; Popov, V.A.; Grigoryev, N.A.; Murzin, V.V.; Metsner, E.I. Crust-Mantle Mineralisation in the Salic Blocks of Eugeosyncline; UrO USSR AN: Sverdlovsk, Russia, 1989. (In Russian) [Google Scholar]
  22. Bortnikov, N.S. Geochemistry and origin of the ore-forming fluids in hydrothermal-magmatic systems in tectonically active zones. Geol. Ore Dep. 2006, 48, 1–22. [Google Scholar] [CrossRef]
  23. Vikent’eva, O.V.; Bortnikov, N.S. The large Svetlinsk Au-Te deposit, South Urals: Telluride mineralization for genetic reconstructions. In Proceedings of the 13th Biennial SGA Meeting, Nancy, France, 24–27 August 2015; pp. 851–854. [Google Scholar]
  24. Vikent’ev, I.V.; Sidorova, N.V.; Vikent’eva, O.V.; Bortnikov, N.S.; Su, S.G.; Luo, Z.H. Tellurides in the Laowan gold deposit (East China): New evidence for a magmatic source of hydrothermal fluids. Dokl. Earth Sci. 2015, 462, 581–585. [Google Scholar] [CrossRef]
  25. Fedoseev, V.V.; Legotkin, V.N.; Savinov, A.I. Svetlinsk gold deposit in the Southern Urals (Report on the detailed exploration conducted by Kochkar geological-prospecting team in 1985–1988 with the calculation of reserves as of 01.10.1988). Plast 1988. [Google Scholar]
  26. Kisters, A.F.M.; Meyer, F.M.; Seravkin, I.B.; Znamensky, S.E.; Kosarev, A.M.; Ertl, R.G.W. The geological setting of lode-gold deposits in the central Southern Urals: A review. Geol. Rundsch. 1999, 87, 603–616. [Google Scholar] [CrossRef]
  27. Tevelev, A.V.; Kosheleva, I.A. Geological Structure and History of the Southern Urals (East Ural Uplift and Trans-Urals); MSU Publishing House: Moscow, Russia, 2002. (In Russian) [Google Scholar]
  28. Kissin, A.Y.; Pritchin, M.E. Fault tectonics of the Svetlinskoye gold deposit (South Urals) and its role in ore control. Bull. Perm Univ. Geol. 2015, 3, 34–42. (In Russian) [Google Scholar] [CrossRef] [Green Version]
  29. Kisin, A.Y.; Koroteev, V.A. Block Folding and Ore Genesis; IGG UB RAS: Yekaterinburg, Russia, 2017. (In Russian) [Google Scholar]
  30. Sazonov, V.N.; van Herk, A.H.; de Boorder, H. Spatial and temporal distribution of gold deposits in the Urals. Econ. Geol. 2001, 96, 685–703. [Google Scholar] [CrossRef]
  31. Ogorodnikov, V.N.; Sazonov, V.N.; Polenov, Y.A. Minerageny of the Suture Zones of the Urals. Part 1. Kochkarskiy Ore District (South Urals); UGGA Publ.: Ekaterinburg, Russia, 2004. (In Russian) [Google Scholar]
  32. Belogub, E.V.; Melekestseva, I.Y.; Novoselov, K.A.; Zabotina, M.V.; Tret’yakov, G.A.; Zaykov, V.V.; Yuminov, A.M. Listvenite-related gold deposits of the South Urals (Russia): A review. Ore Geol. Rev. 2017, 85, 247–270. [Google Scholar] [CrossRef]
  33. Puzhakov, B.A.; Shokh, V.D.; Schulkina, N.E.; Shulkin, E.P.; Tarelkina, E.A.; Dolgova, O.Y. State Geological Map of Russian Federation; Scale 1: 200 000. South Ural Series. Sheet N-41-XIII (Plast). Explanatory Note; Moscow Branch of VSEGEI: Moscow, Russia, 2018. [Google Scholar]
  34. Bortnikov, N.S.; Vikentyev, I.V. Endogenous metallogeny of the Urals. In Proceedings of the 12th Biennial SGA Meeting, Uppsala, Sweden, 12–15 August 2013; pp. 1508–1511. [Google Scholar]
  35. Burmistrov, A.A. Structural conditions of localization of gold-quartz-sulphide mineralization of the Svetlinsk deposit (Yu. Ural). In Lomonosov Reading–2012; MSU; 2012; Available online: http://geo.web.ru/pubd//2012/06/01/0001186421/pdf/burmistrov_2012.pdf (accessed on 30 December 2019). (In Russian)
  36. Bodnar, R.J.; Vityk, M.O. Interpretation of microthermometric data for H2O–NaCl fluid inclusions. In Fluid Inclusions in Minerals: Methods and Applications; De Vivo, B., Frezzotti, M.L., Eds.; Fluids Research Laboratory, Department of Geological Sciences, Virginia Tech: Blacksburg, VA, USA, 1994. [Google Scholar]
  37. Collins, P.L.P. Gas hydrates in CO2 bearing fluid inclusions and the use of freezing data for estimation of salinity. Econ. Geol. 1979, 74, 1435–1444. [Google Scholar] [CrossRef]
  38. Borisenko, A.S. Cryometric study of salt composition of solutions in gas–liquid inclusions in minerals. Geol. Geofiz. 1977, 8, 16–28. (In Russian) [Google Scholar]
  39. Prokofyev, V.Y.; Naumov, V.B. Geochemical features of the mineralizing solutions at the Zyryanov sulfide-polymetallic deposit, Rudny Altay. Geochem. Int. 1987, 24, 50–74. [Google Scholar]
  40. Kalyuzhny, V.A. Principles of the Theory on Mineral-Forming Fluids; Naukova Dumka: Kiev, USSR, 1982. (In Russian) [Google Scholar]
  41. Kerkhof, A.M. The System CO2-CH4-N2 in Fluid Inclusions: Theoretical Modeling and Geological Applications; Free University Press: Amsterdam, The Netherlands, 1988. [Google Scholar]
  42. Thiery, R.; Kerkhof, A.M.; Dubessy, J. PTX properties of CH4-CO2 and CO2-N2 fluid inclusions: Modeling for T < 31 °C and P < 400 bars. Eur. J. Mineral. 1994, 6, 753–771. [Google Scholar]
  43. Brown, P.E. Flincor: A microcomputer program for the reduction and investigation of fluid inclusion data. Am. Min. 1989, 74, 1390–1393. [Google Scholar]
  44. Bakker, R.J. Package FLUIDS 1. Computer programs for analysis of fluid inclusions data and for modeling bulk fluid properties. Chem. Geol. 2003, 194, 3–23. [Google Scholar] [CrossRef]
  45. Roedder, E. Fluid inclusions. In Review in Mineralogy; Ribbe, P.H., Ed.; Mineralogical Society of America: Washington, DC, USA, 1984; Volume 12. [Google Scholar]
  46. Kryazhev, S.G.; Prokof’ev, V.Y.; Vasyuta, Y.V. Use of method ICP MS at the analysis of composition of ore-forming fluids. Vestn. MSU Geol. 2006, 4, 30–36. (In Russian) [Google Scholar]
  47. Jochum, K.; Weis, U.; Stoll, B.; Kuzmin, D.; Yang, Q.; Raczek, I.; Jacob, D.E.; Stracke, A.; Birbaum, K.; Frick, D.A.; et al. Determination of reference values for NIST SRM 610–617 glasses following ISO guidelines. Geostand. Geoanalytical Res. A 2011 Int. Assoc. Geoanal. 2011, 35, 397–429. [Google Scholar] [CrossRef]
  48. Longerich, H.P.; Jackson, S.E.; Günther, D. Laser ablation inductively coupled plasma mass spectrometric transient signal data acquisition and analyte concentration calculation. J. Anal. At. Spectrom. 1996, 11, 899–904. [Google Scholar] [CrossRef]
  49. Zhang, L.-G.; Liu, J.-X.; Zhou, H.B.; Chen, Z.-S. Oxygen isotope fractionation in the quartz-water-salt system. Econ. Geol. 1989, 89, 1643–1650. [Google Scholar] [CrossRef]
  50. Sheppard, S.M.F. Characterisation and isotopic variations in natural water. Rev. Mineral. 1986, 16, 165–183. [Google Scholar]
  51. Ramboz, C.; Pichavant, M.; Weisbrod, A. Fluid immiscibility in natural processes: Use and misuse of fluid inclusion data: II. Interpretation of fluid inclusion data in terms of immiscibility. Chem. Geol. 1982, 37, 29–48. [Google Scholar] [CrossRef]
  52. Bowers, T.S.; Helgeson, H.C. Calculation of the thermodynamic and geochemical consequences of nonideal mixing in the system H2O-CO2-NaCl on phase relations in geologic systems: Equation of state for H2O-CO2-NaCl fluids at high pressures and temperatures. Geochim. Cosmochim. Acta 1983, 47, 1247–1276. [Google Scholar] [CrossRef]
  53. Díaz-Gonzáles, L.; Santoyo, E. A new precise calibration of the Na/K geothermometer using a world database of geothermal fluids and improved geochemometric techniques. Geochim. Cosmochim. Acta 2008, 72, A215. [Google Scholar]
  54. Pester, N.J.; Rough, M.; Ding, K.; Seyfried, J.W.E. A new Fe/Mn geothermometer for hydrothermal systems: Implications for high-salinity fluids at 13°N on the East Pacific Rise. Geochim. Cosmochim. Acta 2011, 75, 7881–7892. [Google Scholar] [CrossRef]
  55. Sack, R.O.; Loucks, R.R. Thermodynamic properties of tetrahedrite-tennantites: Constraints on the interdependence of the Ag–Cu, Fe–Zn, Cu–Fe, and As–Sb exchange reactions. Am. Mineral. 1985, 70, 1270–1289. [Google Scholar]
  56. Sack, R.O.; Brackebusch, F.W. Fahlore as an indicator of mineralisation temperature and gold fineness. Can. Min. Metall. Bull. 2004, 97, 78–83. [Google Scholar]
  57. Sibson, R.H.; Robert, F.; Poulson, K.H. High-angle reverse faults, fluid pressure cycling and mesothermal gold-quartz deposits. Geology 1988, 16, 551–555. [Google Scholar] [CrossRef]
  58. Yardley, B.; Gleeson, S.; Bruce, S.; Banks, D. Origin of retrograde fluids in metamorphic rocks. J. Geoch. Explor. 2000, 69–70, 281–285. [Google Scholar] [CrossRef]
  59. Cox, S. Injection-driven swarm seismicity and permeability enhancement: Implications for the dynamics of hydrothermal ore systems in high fluid-flux, overpressured faulting regimes. Econ. Geol. 2016, 111, 559–587. [Google Scholar] [CrossRef]
  60. Bodnar, R.J.; Lecumberri-Sanchez, P.; Moncada, D.; Steele-MacInnis, M. Fluid inclusions in hydrothermal or deposits. In Treatise on Geochemistry, 2nd ed.; Holland, H.D., Turekian, K.K., Eds.; Elsevier: Oxford, UK, 2014; Volume 13, pp. 119–142. [Google Scholar]
  61. Lowenstern, J.B. Carbon dioxide in magmas and implications for hydrothermal systems. Mineral. Dep. 2001, 36, 490–502. [Google Scholar] [CrossRef]
  62. Bottrell, S.H.; Carr, L.P.; Dubessy, J. A nitrogen-rich metamorphic fluid and coexisting minerals in slates from North Wales. Mineral. Mag. 1988, 52, 451–457. [Google Scholar] [CrossRef]
  63. Baker, T.; Lang, R.J. Fluid inclusion characteristics of intrusion-related gold mineralisation, Tombstone-Tungsten magmatic belt, Yukon Territory, Canada. Miner. Dep. 2001, 36, 563–582. [Google Scholar] [CrossRef]
  64. Chicharro, E.; Boiron, M.-C.; López-García, J.Á.; Barfod, D.N.; Villaseca, C. Origin, ore forming fluid evolution and timing of the Logrosán Sn–(W) ore deposits (Central Iberian Zone, Spain). Ore Geol. Rev. 2016, 72, 896–913. [Google Scholar] [CrossRef]
  65. Moin, B.; Guillot, C.; Gibert, F. Controls of the composition of nitrogen-rich fluids originating from reaction with graphite and ammonium-bearing biotite. Geochim. Cosmochim. Acta 1994, 58, 5503–5523. [Google Scholar] [CrossRef]
  66. Wang, Y.; Wang, K.; Konare, Y. N2-rich fluid in the vein-type Yangjingou scheelite deposit, Yanbian, NE China. Sci. Rep. 2018, 8, 5662. [Google Scholar] [CrossRef]
  67. Andersen, T.; Burke, E.A.J.; Neumann, E.R. Nitrogen-rich fluid in the upper mantle: Fluid inclusions in spinel dunite from Lanzarote, Canary Islands. Contr. Mineral. Petrol. 1995, 120, 20. [Google Scholar] [CrossRef]
  68. Lang, J.R.; Baker, T.; Hart, C.J.R.; Mortensen, J.K. An exploration model for intrusion-related gold systems. Soc. Econ. Geol. Newsl. 2000, 40, 1–15. [Google Scholar]
  69. McCoy, D.; Newberry, R.J.; Layer, P.; DiMarchi, J.J.; Bakke, A.; Masterman, S.; Minehane, D.L. Plutonic-Related Gold Deposits of Interior Alaska, Mineral Deposits of Alaska, In Mineral Deposits of Alaska; Goldfarb, R.J., Miller, L.D., Eds.; Society of Economic Geologists: Littleton, CO, USA, 1997; Volume 9, pp. 191–241. [Google Scholar]
  70. Vikent’eva, O.V.; Bortnikov, N.S.; Vikentyev, I.V.; Groznova, E.O.; Lyubimtseva, N.G.; Murzin, V.V. The Berezovsk giant intrusion-related gold-quartz deposit, Urals, Russia: Evidence for multiple magmatic and metamorphic fluid reservoirs. Ore Geol. Rev. 2017, 91, 837–863. [Google Scholar] [CrossRef]
  71. Vikent’eva, O.V.; Prokofiev, V.Y.; Gamyanin, G.N.; Goryachev, N.A.; Bortnikov, N.S. Intrusion-related gold-bismuth deposits of North-East Russia: PTX parameters and sources of hydrothermal fluids. Ore Geol. Rev. 2018, 102, 240–259. [Google Scholar] [CrossRef]
  72. Goryachev, N.A.; Berdnikov, N.V. Types of ore-bearing granites of south-eastern part of Mesozoids of North-East Russia and their fluid specialisation. J. Geol. Pac. Ocean 2006, 25, 40–52. [Google Scholar]
  73. Böhlke, J.K.; Irwin, J.J. Laser microprobe analyses of Cl, Br, I, and K in fluid inclusions: Implications for sources of salinity in some ancient hydrothermal fluids. Geochim. Cosmochim. Acta 1992, 56, 203–225. [Google Scholar] [CrossRef]
  74. Irwin, J.J.; Roedder, E. Diverse origins of fluid in magmatic inclusions at Bingham (Utah, USA), Butte (Montana, USA), St Austell (Cornwall, UK) and Ascension Island (mid-Atlantic, UK) indicated by laser microprobe analysis of Cl, K, Br, I, Ba+Te, U, Ar, Kr and Xe. Geochim. Cosmochim. Acta 1995, 59, 295–312. [Google Scholar] [CrossRef]
  75. Campbell, A.R.; Lundberg, S.A.W.; Dunbar, N.W. Solid inclusions of halite in quartz: Evidence for the halite trend. Chem. Geol. 2001, 173, 179–191. [Google Scholar] [CrossRef] [Green Version]
  76. Prokof’ev, V.Y.; Baksheev, I.A.; Korytov, F.Y.; Touret, J. Immiscible fluids (CO2-brines) in optical fluorite, Nordvik-Taimyr, Russia. Comptes Rendus Geosci. 2006, 338, 617–623. [Google Scholar] [CrossRef]
  77. Bény, C.; Guilhaumou, N.; Touray, J.C. Native-sulphur-bearing fluid inclusions in the CO2-H2S-H2O-S system-microthermometry and Raman microprobe (mole) analysis—Thermochemical interpretations. Chem. Geol. 1982, 37, 113–127. [Google Scholar] [CrossRef]
  78. Grishina, S.; Dubessy, J.; Kontorovich, A.; Pironon, J. Inclusions in salt beds resulting from thermal metamorphism by dolerite sills (Eastern Siberia, Russia). Eur. J. Mineral. 1992, 4, 1187–1202. [Google Scholar] [CrossRef]
  79. Giuliani, G.; Dubessy, J.; Banks, D.; Vinh, H.Q.; Lhomme, T.; Pironon, J.; Garnier, V.; Trinh, P.T.; Long, P.V.; Ohnenstetter, D.; et al. CO2-H2S-COS-S8-Al(OH)-bearing fluid inclusions in ruby from marble-hosted deposits in Luc Yen area, North Vietnam. Chem. Geol. 2003, 194, 167–185. [Google Scholar] [CrossRef]
  80. Bray, C.J.; Spooner, E.T.C. Fluid inclusion volatile analysis by gas chromatography with photoionization/micro-thermal conductivity detectors: Applications to magmatic MoS2 and other H2O-CO2 and H2O-CH4 fluids. Geochim. Cosmochim. Acta 1992, 56, 261–272. [Google Scholar] [CrossRef]
  81. Binder, B.; Keppler, H. The oxidation state of sulfur in magmatic fluids. Earth Planet Sci. Lett. 2011, 301, 190–198. [Google Scholar] [CrossRef]
  82. Borisenko, A.S.; Borovikov, A.A.; Borisenko, I.D.; Bortnikov, N.S.; Prokofiev, V.Y.; Vikent’eva, O.V.; Gamyanin, G.N.; Gaskov, I.V. Sulfur forms in the hydrothermal fluids and their role in ore formation. In European Current Research on Fluid Inclusions (ECROFI-XXIII); Extended Abstracts’ Volume; University of Leeds: Leeds, UK, 2015; pp. 44–46. [Google Scholar]
  83. Pokrovski, G.; Dubessy, J. Stability and abundance of the trisulfur radical ion S3 in hydrothermal fluids. Earth Planet Sci. Lett. 2015, 411, 298–309. [Google Scholar] [CrossRef]
  84. Borovikov, A.A.; Guzhina, L.V.; Goverdovski, V.A.; Gimon, V.O. Inversion of redox potential of oxidized ore-forming fluids as a factor of ore formation of Kalgutinsky Deposit (Gorny Altai). In The Main Problems in the Doctrine of Endogenous Ore Deposits: New Horizons; IGEM RAS: Moscow, Russia, 2017; Extended Abstracts’ Volume. [Google Scholar]
  85. Afifi, A.M.; Kelly, W.C.; Essene, E.J. Phase relations among tellurides, sulphides and oxides: I. Thermochemical data and calculated equilibria. Econ. Geol. 1988, 83, 377–404. [Google Scholar] [CrossRef]
  86. Ciobanu, C.L.; Cook, N.J. Tellurides, selenides (and Bisulphosalts) in gold deposits. In Proceedings of the 11th IAGOD Symp-Geocongress, Windhoek, Namibia, 22–26 July 2002; Geol Surv: Windhoek, Namibia, 2004. [Google Scholar]
  87. Ohmoto, H. Stable isotope geochemistry of ore deposits. Rev. Mineral. 1986, 16, 491–560. [Google Scholar]
  88. Koroteev, V.A.; De Boorder, H.; Necheukhin, V.M.; Sazonov, V.N. Geodynamic setting of the mineral deposits of the Urals. Tectonophysics 1997, 276, 291–300. [Google Scholar] [CrossRef]
  89. Puchkov, V.N. General features relating to the occurrence of mineral deposits in the Urals: What, where, when and why. Ore Geol. Rev. 2017, 85, 4–29. [Google Scholar] [CrossRef]
  90. Vikentyev, I.V.; Belogub, E.V.; Novoselov, K.A.; Moloshag, V.P. Metamorphism of volcanogenic massive sulphide deposits in the Urals. Ore geology. Ore Geol. Rev. 2017, 85, 30–63. [Google Scholar] [CrossRef]
Figure 1. Geological setting of gold deposits in the South Urals, modified after [32]. The red square corresponds to Figure 2.
Minerals 10 00037 g001
Figure 2. Geological setting of the mineralising district comprising the Svetlinsk gold deposit, modified after [33]. The red square corresponds to the Svetlinsk gold deposit (Figure 3). K—Kochkar anticlinorium zone. AS—Aramil-Sukhtel synclinorium zone.
Minerals 10 00037 g002
Figure 3. Schematic geological map of the Svetlinsk gold deposit, based on the Kochkar geological team data [25], and cross-section I-I, modified after [21,25].
Minerals 10 00037 g003
Figure 4. Mineralisation of the Svetlinsk gold deposit. (a,b)—systems of gold-bearing sulphide-quartz veinlets and veins with thickness from the first centimetres to 0.2 m, superimposed on the stratiform bodies of disseminated sulphide mineralisation. (c)—thin horizons of disseminated sulphide mineralisation in marble. (d)—0.2 m thick gold-bearing sulphide-scheelite-quartz veins, intersected the disseminated pyrite mineralisation. (e)—quartz vein with chlorite and sulphide mineralisation. (fi)—telluride mineralisation in quartz veins. (j,k)—mineralisation in marble (j—native gold, k—intergrowth bournonite with galena and frohbergite). Width of image is 3 m (a) and 50 cm (c,d). Td—tetrahedrite, Cp—chalcopyrite.
Minerals 10 00037 g004
Figure 5. Photomicrographs of fluid inclusions trapped in quartz of the Svetlinsk deposit. (a,b)—aqueous-carbonic inclusion, type I (a—at 20 °C, b—at −10 °C). (c)—multi-phase inclusion of chloride brine, type IV. (d,e)—vapour-rich (CO2 ± CH4 ± N2) inclusion, type II (d—at +20 °C, e—at −5 °C). (f)—two-phase liquid-vapour aqueous inclusion, type III.
Minerals 10 00037 g005
Figure 6. Homogenisation temperature (Th) vs. salinity (Csalt) (a) and homogenisation (Th) vs. eutectic temperatures (Teut) (b) plots for FIs in the quartz of the Svetlinsk deposit.
Minerals 10 00037 g006
Figure 7. Fluid inclusions (FIs) with native sulphur in quartz from marble: (a)—multi-phase FIs, (b)—four-phase FIs with CO2, (c,d)—gaseous FIs with dense CO2, (e)—Raman spectra of FI showing the presence of sulphur. L—aqueous solution. Sample SV.
Minerals 10 00037 g007
Figure 8. Selected laser Raman spectra of fluid inclusions showing the presence of CO2 and CH4 (a) and CO2 (b) in gaseous phase of FIs as well as the presence of calcite as a solid phase (c). Sample 38-3a. Scale bar is 10 μm. Q—quartz.
Minerals 10 00037 g008
Figure 9. Sketches of the dependence of the signal intensity on time during ablation of a single fluid inclusions S1/10(2) (a) and SV (1) (bd) (in Table 4). The photographs (a,b) show individual phases of fluid inclusions: V—gas, L—solution, H—halite, S0—native sulphur.
Minerals 10 00037 g009
Figure 10. Oxygen isotopic composition of quartz (a) and ore-forming fluid (b,c) in comparison with the range of magmatic waters (after [50]) in the Svetlinsk deposit.
Minerals 10 00037 g010
Figure 11. Estimated fluid pressure in the Svetlinsk deposit.
Minerals 10 00037 g011
Table 1. Microthermometric study of individual fluid inclusions (FIs) in quartz from the Svetlinsk deposit.
SampleFIs Type1n2Th, °CTe, °CTm ice (NaCl) [S0], °C3Tm(CO2), °CTh(CO2)(N2), °CH.m.4Tm (clatrate), °CCsalt, wt% NaCl Equiv.CCO2, mol/kg SolutionCCH4, mol/kg Solutiond, g/cm3
Q1a
SVI P17286–315−53−20.5 (85)3−57.4…−58.633.1V0.015.61.40.11.11
II P15---−60.2…−60.816.6…32.8L----0.47–0.81
III P5354−54−7.0 (75)3----10.5--0.75
IV P18269−52(181)3----31.0--1.05
I PS2246−50−11.8−58.433.6V−0.115.82.20.21.03
II PS2---−60.114.5…24.0L----0.73–0.83
SV62/18I PS32296–300−51…−56−24.1…−28.6 (148)3−59.4…−62.233.5…34.1L−2.3–3.223.0–28.82.1–2.40.1–0.40.91–0.95
II PS54---−59.7…−63.818.8…31.0L---0.51–0.79
S64/18II P9---−61.79.4L----0.87
Q1b
216/148.5I P3265–310−35−8.3−56.8−8.8L4.112.05.4-1.09
II P32---−56.6…−56.8−29.8…0.6L----0.92–1.08
216/409.6I P37275–320−31…−33−7.6…−11.1−57.1…−57.2−6.5…15.6L1.3–7.911.2–15.04.2–7.6-1.06–1.10
II P51---−57.4…−57.5−13.6…7.0L----0.88–0.97
202/289.2I P8315–365−31…−32−4.1…−4.7−57.4…−57.8−12.4L4.112.56.4–7.2-1.06
II P47---−58.1…−58.7−21.1…−1.7L---0.94–1.04
202/318.8I P8260–315−34−7.7−57.521.0…26.3L3.2–3.910.7–11.72.9–3.60.31.05–1.06
II P25---−57.2…−57.8−25.6…23.8L---0.73–1.06
III S13275–300−31−5.8---8.9--0.82–0.85
202/601.2I P7240–270−32−8.3−60.6−31.0L12.212.12.70.71.03
II P32---−59.3…-−61.0−37.6…−12.5L----1.00–1.11
III S6310−31−9.1--13.0--0.85
II S4----−131V---0.16
S12/96I P9295–340−37−12.8−57.52.1…18.0L1.214.24.9–6.21.07–1.08
II P66---−57.5…−60.2−35.7…13.1L----0.84–1.10
470/293.5I P3325–350−37−11.1−58.6−9.7L1.315.34.4–4.90.2–0.31.09
II P40---−57.7…−59.4−22.7…4.4L---0.95–1.05
38-3aI PS10250–280−28…−33−8.0…−13.0−58.4…−60.017.0…32.0L7.0–12.011.4…17--
II PS3---−58.5…−59.119.1…24.0L----0.73–0.78
Q2
202/593.0III P15285–315−30−4.2…−5.9----6.7… 9.1--0.80–0.81
II P45---−57.9…−58.7−26.8…0.9L---0.92–1.06
S1p/95I P9300–345−32−5.5…−6.7−56.9−9.1L4.711.35.3–5.4-1.08
II P31---−56.9…−59.9−29.2…10.2L0.86–1.07
II S14----−153V0.13
S3/95aI P3305–320−33−8.2−59.2−21.2L6.211.26.6-1.09
II P16−58.6…−59.4−28.5…−7.5L----0.97–1.07
II S2----−149V----0.17
618/162I P6255–275−32−7.4−57.7−6.8…5.3L6.66.84.0–5.00.4–0.51.08
II P53---−57.4…−57.7−15.8…1.8L----0.92–1.01
S2/10I P5302−33−5.0−57.817.5…25.1L4.69.64.60.41.02
II P13---−57.8−1.3…8.0L----0.88–0.94
III S3159−32−4.9--7.70.97
S14/10I P7278–289−35…−36−4.1…−6.4−57.2…−59.63.5…20.4L6.7–7.84.3–6.85.2–5.30.51.02–1.04
II P13---−59.2…−59.6−7.8…12.6L----0.97–0.84
SV66I PS13230–260−27…−32−4.0−57.0…−57.811.0…23.0L5.8–8.33.5–7.5--
II PS2−57.5…−57.819.5…22.0L0.74–0.78
SV51I PS9195–220−37…−39−6.9…−8.0−58.1…−58.81.6…27.9L2.8–4.610–12.0--
II PS2---−58.522.0…25.2L----0.71–0.75
Q3
202/592.7I P17295–320−34…−36−7.8…−10.1−56.6…−57.6−30.8…−24.1L9.4–12.67.25.9–6.00.6–0.91.11–1.12
II P69---−56.8…−57.6−24.3…22.1L----0.75–1.05
III S23190–230−30−4.9----7.7--0.90–0.94
S5/ 95bI P17370–405−32−5.2…−5.7−74.4−146.9…−147.5V9.3–10.58.1–8.80,8-0.83
II P76---−57.8…−60.8−38.8…6.3L----0.89–1.11
III S29265–305−32…−33−4.7…−6.2---7.4–9.5--0.81–0.84
II S40---−82.9−149…−152V----0.14–0.17
470/ 170I P7330–350−32−8.1…−9.2−56.716.3…26.5L7.15.65.0–6.30.6–0.71.01–1.04
II P26---−56.8…−57.92.5…25.0L----0.71–0.91
S1/10I P5358−35−5.9−57.3−7.0L4.810,96.30.71.07
II P22---−57.2…−57.4−1.0…13.4L----0.84–0.93
I PS3280−37−5.4−57.22.9L8.34.24.60.41.06
II PS10---−57.4−3.1…9.1L----0.87–0.95
III S2262−30−0.8--1.3--0.78
S9/10I PS6363−33−5.0−58.22.7L7.26.17.10.71.04
II PS11---−58.0−13.6…−0.2L----0.93–1.00
III S3347−35−0.3---0.5--0.58
S35/10III P6308−33−0.5----0.8--0.68
S41/18I P6312–331−33…−34−1.9…−2.7−58.6…−59.92.1…11.4L8.1–8.93.3–3.86.7–8.30.7–0.91.01–1.02
II P43---−58.3…−60.5−9.8…1.9L----0.92–0.98
III S8203−22−0.3----0.5--0.87
Q4
63-1III P2220–250−21…−22−1.0…−4.6----1.7–7.3--0.85–0.87
S10/95III P28130–230−23…−24−2.9----4.8--0.85–0.95
1 inclusion type: I—liquid H2O + liquid CO2 ± vapour CO2, II—vapour CO2-rich (±CH4, ±N2), III—liquid H2O + vapour H2O, IV—liquid H2O + vapour H2O + solid NaCl. P—primary, PS—pseudo-secondary, and S—secondary inclusions. S0—native sulphur. 2 number of studied inclusions. 3 the values in round brackets denote the Tm NaCl, and the values in square brackets denote the TmS0. 4 homogeneous mode (H. m.) of CO2: L—Liquid, V—Vapour.
Table 2. Reconstructed fluid compositions according to crush-leach analysis.
QuartzQ3Q3Q3Q2Q1aQuartzQ3Q3Q3Q2Q1a
SampleS-1/10S-9/10S-35/10S-14/10SVSampleS-1/10S-9/10S-35/10S-14/10SV
CO2,×103 ppm49.05293.291231.85406.23471.05Ge, ppm0.520.310.270.110.91
CH40.6830.6522.5661.9550.026Cd1.960.530.300.18
Cl14.42<0.6<16.1359.96Pb35.5413.10
SO42−<0.8<0.8<1.5<0.5<1Au9.89
HCO365.2511.7435.3023.4593.48Ag0.050.14
Na25.312.998.3111.4331.27Bi0.070.09
K2.250.420.780.723.07Mo0.190.020.050.13
Ca3.920.702.380.6531.83W1.67
Mg1.530.200.940.142.59Sn0.30
Br, ppm2824.5Hg0.02
B2015.8408.43661.34592.13596.48Tl0.121.470.020.17
Li1.040.300.480.1110.68Co0.100.060.070.0420.06
Rb3.281.102.782.067.00Ni5.380.6412.751.80174.94
Cs0.280.231.171.132.23Cr0.820.38
Sr30.297.206.7927.551166.0V0.210.55
Ba12.190.929.443951.1U
Cu263.86236.348.92Mn34.294.7413.5432.37511.06
Zn163054.051699.965.48164.87Fe126.152.69
As72.5142.1368.6719.7621.26I116.22
Sb27.3752.9951.532.9619.22Si40,12735,62331,309
Dash—below the detection limit.
Table 3. Gas species in the vapour phase of inclusions according to Raman spectroscopy (mol %).
Sample 1Q GenerationFIs Type 2CO2N2H2SCH4
SVQ1aII96.91.231.82
SVQ1aIV98.231.81
SVQ1aIV94.21.644.12
SVQ1aIV98.80.650.53
S1/10Q3II98.41.62
S1/10Q3II982.01
S1/10Q3II89.610.41
S1/10Q3II954.98
S1/10Q3I73.326.70
38-3aQ1bI5050
38-3aQ1bI8020
38-3aQ1bI7030
38-3aQ1bI964
38-3aQ1bI982
38-3aQ1bI100
SV-51Q2I100
SV-66Q2I100
63-1Q4III
1 SV and S1/10 samples was studied in IGM SB RAS, other samples—in Geological Institute, Slovak Academy of Sciences. 2 inclusion type. 3 not detected.
Table 4. Fluid composition according to LA-ICP-MS of individual fluid inclusions in quartz of the Svetlinsk deposit.
QuartzQ1aQ3 (Main Ore Stage)
SampleSV (1)SV (2)SV (3)SV (4)SV (5)SV (6)S1/10 (1)S1/10 (2)S1/10 (3)S1/10 (4)S1/10 (5)
FI type 1IVIVIVIVIVIIIIIIIII
Minerals 10 00037 i001 Minerals 10 00037 i002 Minerals 10 00037 i003 Minerals 10 00037 i004 Minerals 10 00037 i005 Minerals 10 00037 i006 Minerals 10 00037 i007 Minerals 10 00037 i008 Minerals 10 00037 i009 Minerals 10 00037 i010 Minerals 10 00037 i011
B, ppm140100501439013504603502580560
Na58,90058,90058,90058,90058,90013,00047,20019,70019,70019,70019,700
Mg117037703160175016802043600058,50045
Al02390520560363830900368011701390
S2602370960530890000001290
K18701250477013207409705550548093058208320
Ca79,80045,400124,00032,70023,500000000
Mn16026140543080000110
Fe0083809000000
Ni0842519012001900148002000
Co0000.10.200088018
Cu2140.10.30.512510589001500
Zn21003911301844400273108301220
As507235051500039700270
Rb15322901001400040
Sr220032022049,00010001500510100
Mo070.20100250000
Ag10020.40300130600
Cd82125048000000
Sn2002435560000028
Te24171101105065560230080330
Sb0.41.101.20.025045024000140
Cs55110.240.50000025
Ba14,00017,000160390029000003000110
Au0001.5000110000
Hg 27251021800041089062050
Pb1801220120.24400210610340
Bi00000012220800
1 inclusion type: I—liquid H2O + liquid CO2 ± vapour CO2 + N2, II—vapour CO2 + N2, IV—liquid H2O + vapour H2O + NaCl + S0. 2 Te and Hg are absent in the external standard (NIST 612). For this reason, their contents are conventionally estimated in ppm Sb and Au equivalent, respectively. These data reflect only the qualitative result of their determination in the sample.

