Article

Chlorine Isotope Composition of Apatite from the >3.7 Ga Isua Supracrustal Belt, SW Greenland

1
Institute of Geological Sciences, Polish Academy of Sciences, Research Centre in Warsaw, Twarda 51/55, 00-818 Warsaw, Poland
2
GFZ German Research Centre for Geosciences, Telegrafenberg, 14473 Potsdam, Germany
3
TU Bergakademie Freiberg, Institute of Mineralogy, Brennhausgasse 14, 09596 Freiberg, Germany
4
Geological Survey of Norway, Leiv Eirikssons vei 39, 7491 Trondheim, Norway
5
Department of Geology, University of Tartu, 50411 Tartu, Estonia
6
Institute of Geology, Tallinn University of Technology, 19086 Tallinn, Estonia
7
Institute of Geological Sciences, Polish Academy of Sciences, Research Centre in Cracow, Senacka 1, 31-002 Cracow, Poland
*
Author to whom correspondence should be addressed.
Minerals 2020, 10(1), 27; https://doi.org/10.3390/min10010027
Submission received: 20 November 2019 / Revised: 20 December 2019 / Accepted: 23 December 2019 / Published: 28 December 2019
(This article belongs to the Special Issue Feature Papers in Mineral Geochemistry and Geochronology 2019)

Abstract

:
The study of the oldest surviving rock suites is crucial for understanding the processes that shaped the early Earth and formed an environment suitable for life. The metasedimentary and metavolcanic rocks of the early Archean Isua supracrustal belt contain abundant apatite, the geochemical signatures of which may help decipher ancient environmental conditions. However, previous research has shown that secondary processes, including amphibolite-facies metamorphism, have reset the original hydrogen isotope composition (δD) of apatite from the Isua belt; therefore, δD values are not indicative of primary conditions in the Archean. Here, we report the first in situ chlorine isotope (δ37Cl) analyses by Secondary Ion Mass Spectrometry (SIMS) from Isua apatite, which we combine with information from transmission electron microscopy, cathodoluminescence imaging, and spectroscopy, documenting the micron-scale internal features of apatite crystals. The determined δ37ClSMOC values (chlorine isotope ratios vs. standard mean ocean chloride) fall within a range from −0.8‰ to 1.6‰, with the most extreme values recorded by two banded iron formation samples. Our results show that δ37Cl values cannot uniquely document primary signatures of apatite crystals, but the results are nonetheless helpful for assessing the extent of secondary overprint.

1. Introduction

The Isua supracrustal belt, located in SW Greenland, is among the oldest surviving rock suites (>3.7 Ga [1,2,3]) formed at or near the Earth’s surface. Exposed metasedimentary rocks, including banded iron formations (BIFs), allow us to explore the environmental conditions of the early Archean. There is an ongoing debate on whether carbonaceous matter found in the Isua rocks might represent some of the earliest traces of life. This debate was initiated by Schidlowski et al. [4] and followed by Mojzsis et al. [5], who described graphite inclusions within apatite crystals from the Isua belt and from the Akilia island that were interpreted as evidence for life prior to 3.8 Ga. Subsequent research has shown inconsistencies with apatite-graphite biogenicity interpretation while also providing other lines of evidence, such as putative microbial fabrics and carbon isotope signatures, arguing for traces of biological activity in the Isua rocks [6,7,8,9,10,11,12,13,14,15,16]. The recent study by Dodd et al. [17], in which variably 13C-depleted graphitic carbon was identified in world-wide occurring banded iron formations, suggests that fluid-deposited carbon was partially derived from syngenetic organic matter, the origin of which could be either abiogenic or biogenic. However, Whitehouse et al. [18] pointed out that despite carbon isotopic indications, other information such as field relationships and geochronological data may not support claims about biogenic graphite, which was the case in the Saglek Block of Labrador [19].
Furthermore, detailed analyses of minerals and rocks have been used to decipher primary sedimentary geochemical signatures and make a distinction from the secondary signatures, which were formed during complex alteration processes that overprinted the Isua area [8,20,21,22,23,24,25,26,27,28]. Minerals from the apatite supergroup (solid solutions represented by the chemical formula Ca10(PO4)6(F,Cl,OH)2; hereafter referred to as “apatite”) have been found to be particularly useful in reconstructing Isua’s geological history [22,29]. Apatite crystals are abundant in Isua’s banded iron formations, metacarbonates, and mafic intrusions; therefore, they allow for the investigation of both sedimentary and magmatic environments.
In a recent study of apatite from the Isua supracrustal belt, Wudarska et al. [27] investigated the potential of hydrogen isotopes as indicators of the Archean hydrosphere and the origin of volatiles. These authors concluded that hydrogen isotope ratios were reset during the multi-phase geologic history, although apatite crystals having differing origins (sedimentary, metasomatic, and magmatic) could be distinguished. Experimental work by Higashi et al. [30] showed that hydrogen diffusion in apatite is much faster than OH diffusion, which in turn is similar to F and Cl diffusion [31]. This suggests that chlorine should be more resistant to exchange processes than hydrogen, leading us to this current study in which we investigated whether the chlorine isotope ratio in apatite reflects the degree of alteration processes and whether the Cl isotope ratio can be used for assessing the origin of the host apatite crystals. Here, we report the first in situ measurements of chlorine isotope ratios of Isua apatite.
The ratio of two stable isotopes 37Cl and 35Cl in an unknown sample is usually compared to standard mean ocean chloride (SMOC) using Equation (1)
δ 37 Cl = ( 37 Cl / 35 Cl sample 37 Cl / 35 Cl SMOC 1 ) × 1000
and is reported in the standard per mil notation (‰). Chlorine isotopes have recently gained attention in studies of lunar [32,33,34,35,36,37] and Martian apatite samples [38,39]. In lunar materials, relatively large natural variations in δ37Cl have been detected (from −1‰ up to 40‰ [32,36] or even from 3.8‰ to 81.1‰ [37]), while the range of δ37Cl in terrestrial geological samples is much smaller with the vast majority of values falling between −2‰ and 2‰ [40,41]. The range of chlorine isotope compositions of Martian apatite (from −5.5‰ to 8.6‰ [38,39]) is similar to the δ37Cl values of terrestrial samples rather than to the composition of lunar apatite.
Despite apatite forming in a wide spectrum of geological environments, chlorine isotope data from terrestrial samples are scarce. In our research, we employ for the first time the signature δ37Cl for assessing apatite origin. To our knowledge, the only published studies of δ37Cl in terrestrial apatite are an early work of Morton and Catanzaro [42] and a recent investigation by Kusebauch et al. [43], which both focused on Proterozoic chlorapatite from Norway. The latter study, in which a relatively wide range of δ37Cl values (−1.2‰ to 3.7‰) were detected, was a first attempt to investigate the influence of secondary processes on δ37Cl signatures; it showed that the examination of the chlorine isotope compositions of apatite can help in tracing metasomatic processes, since apatite incorporates halogens into the structure as a function of fluid chemistry during fluid-rock interactions. Therefore, the application of chlorine isotope ratios for assessing the origin and secondary alteration of terrestrial apatite is still not well recognized, and any new data would be valuable.
Terrestrial materials that have δ37Cl values significantly different from that of seawater are rare [41]. The small diversity in global Cl isotope ratios results from the existence of only a single oxidation state for chlorine in most naturally occurring materials and the relatively small mass difference between two stable isotopes [44]. The formation of perchlorate fractionates Cl isotopes [39,45], but only a few examples of extreme δ37Cl values have been found on Earth, e.g., 12‰ in volcanic fumaroles [46]. This behavior is in contrast to lunar samples, where δ37Cl values as high as 81.1‰ have been reported [36,37], which is possibly due to the large kinetic isotope effects during the rapid diffusion of chlorine species to the vapor phase during degassing [41]. Kusebauch et al. [47] suggested that fluid-rock interactions may not only cause elemental mobilization but in some cases also the fractionation of their isotopes. In their [43] Secondary Ion Mass Spectrometry (SIMS)-based study of OH-replaced primary chlorapatite, it was shown that heterogeneous crystals were affected by various competing fractionation and mixing processes, making interpretation of the Cl isotope data challenging.
John et al. [40] noted that the Cl content and δ37Cl values determined for rocks may provide information about the interaction between the oceanic lithosphere and seawater-derived hydrothermal fluids. The results of both theoretical [45] and empirical [48,49] works suggest that the isotopic fractionation between Cl-bearing phases is more significant for low-temperature processes than for those occurring at high temperatures [40]. Previous studies of extraterrestrial apatite have shown that chlorine isotopes are also good indicators of volatile sources [33,39,50]. Moreover, a comparison of the chlorine isotope compositions of chondrites (−0.3‰) and terrestrial mantle-derived materials (−0.3‰ to 0.1‰) indicates that no fractionation by evaporative processes occurred during the formation of the Earth [51].
Eggenkamp [44] indicated that the primordial Earth probably experienced relatively early and rapid outgassing, which led to the accumulation of chlorine in the oceans. The chloride concentration subsequently decreased to the modern level [52]. An earlier study of Ironstone Pods (South Africa) suggested that the concentration of Cl in Archean seawater was higher by a factor of ~1.65 than that in modern seawater [53,54]. These events may have also had a significant impact on halogen abundances in sedimentary apatite crystallizing on the seafloor in association with banded iron formations.

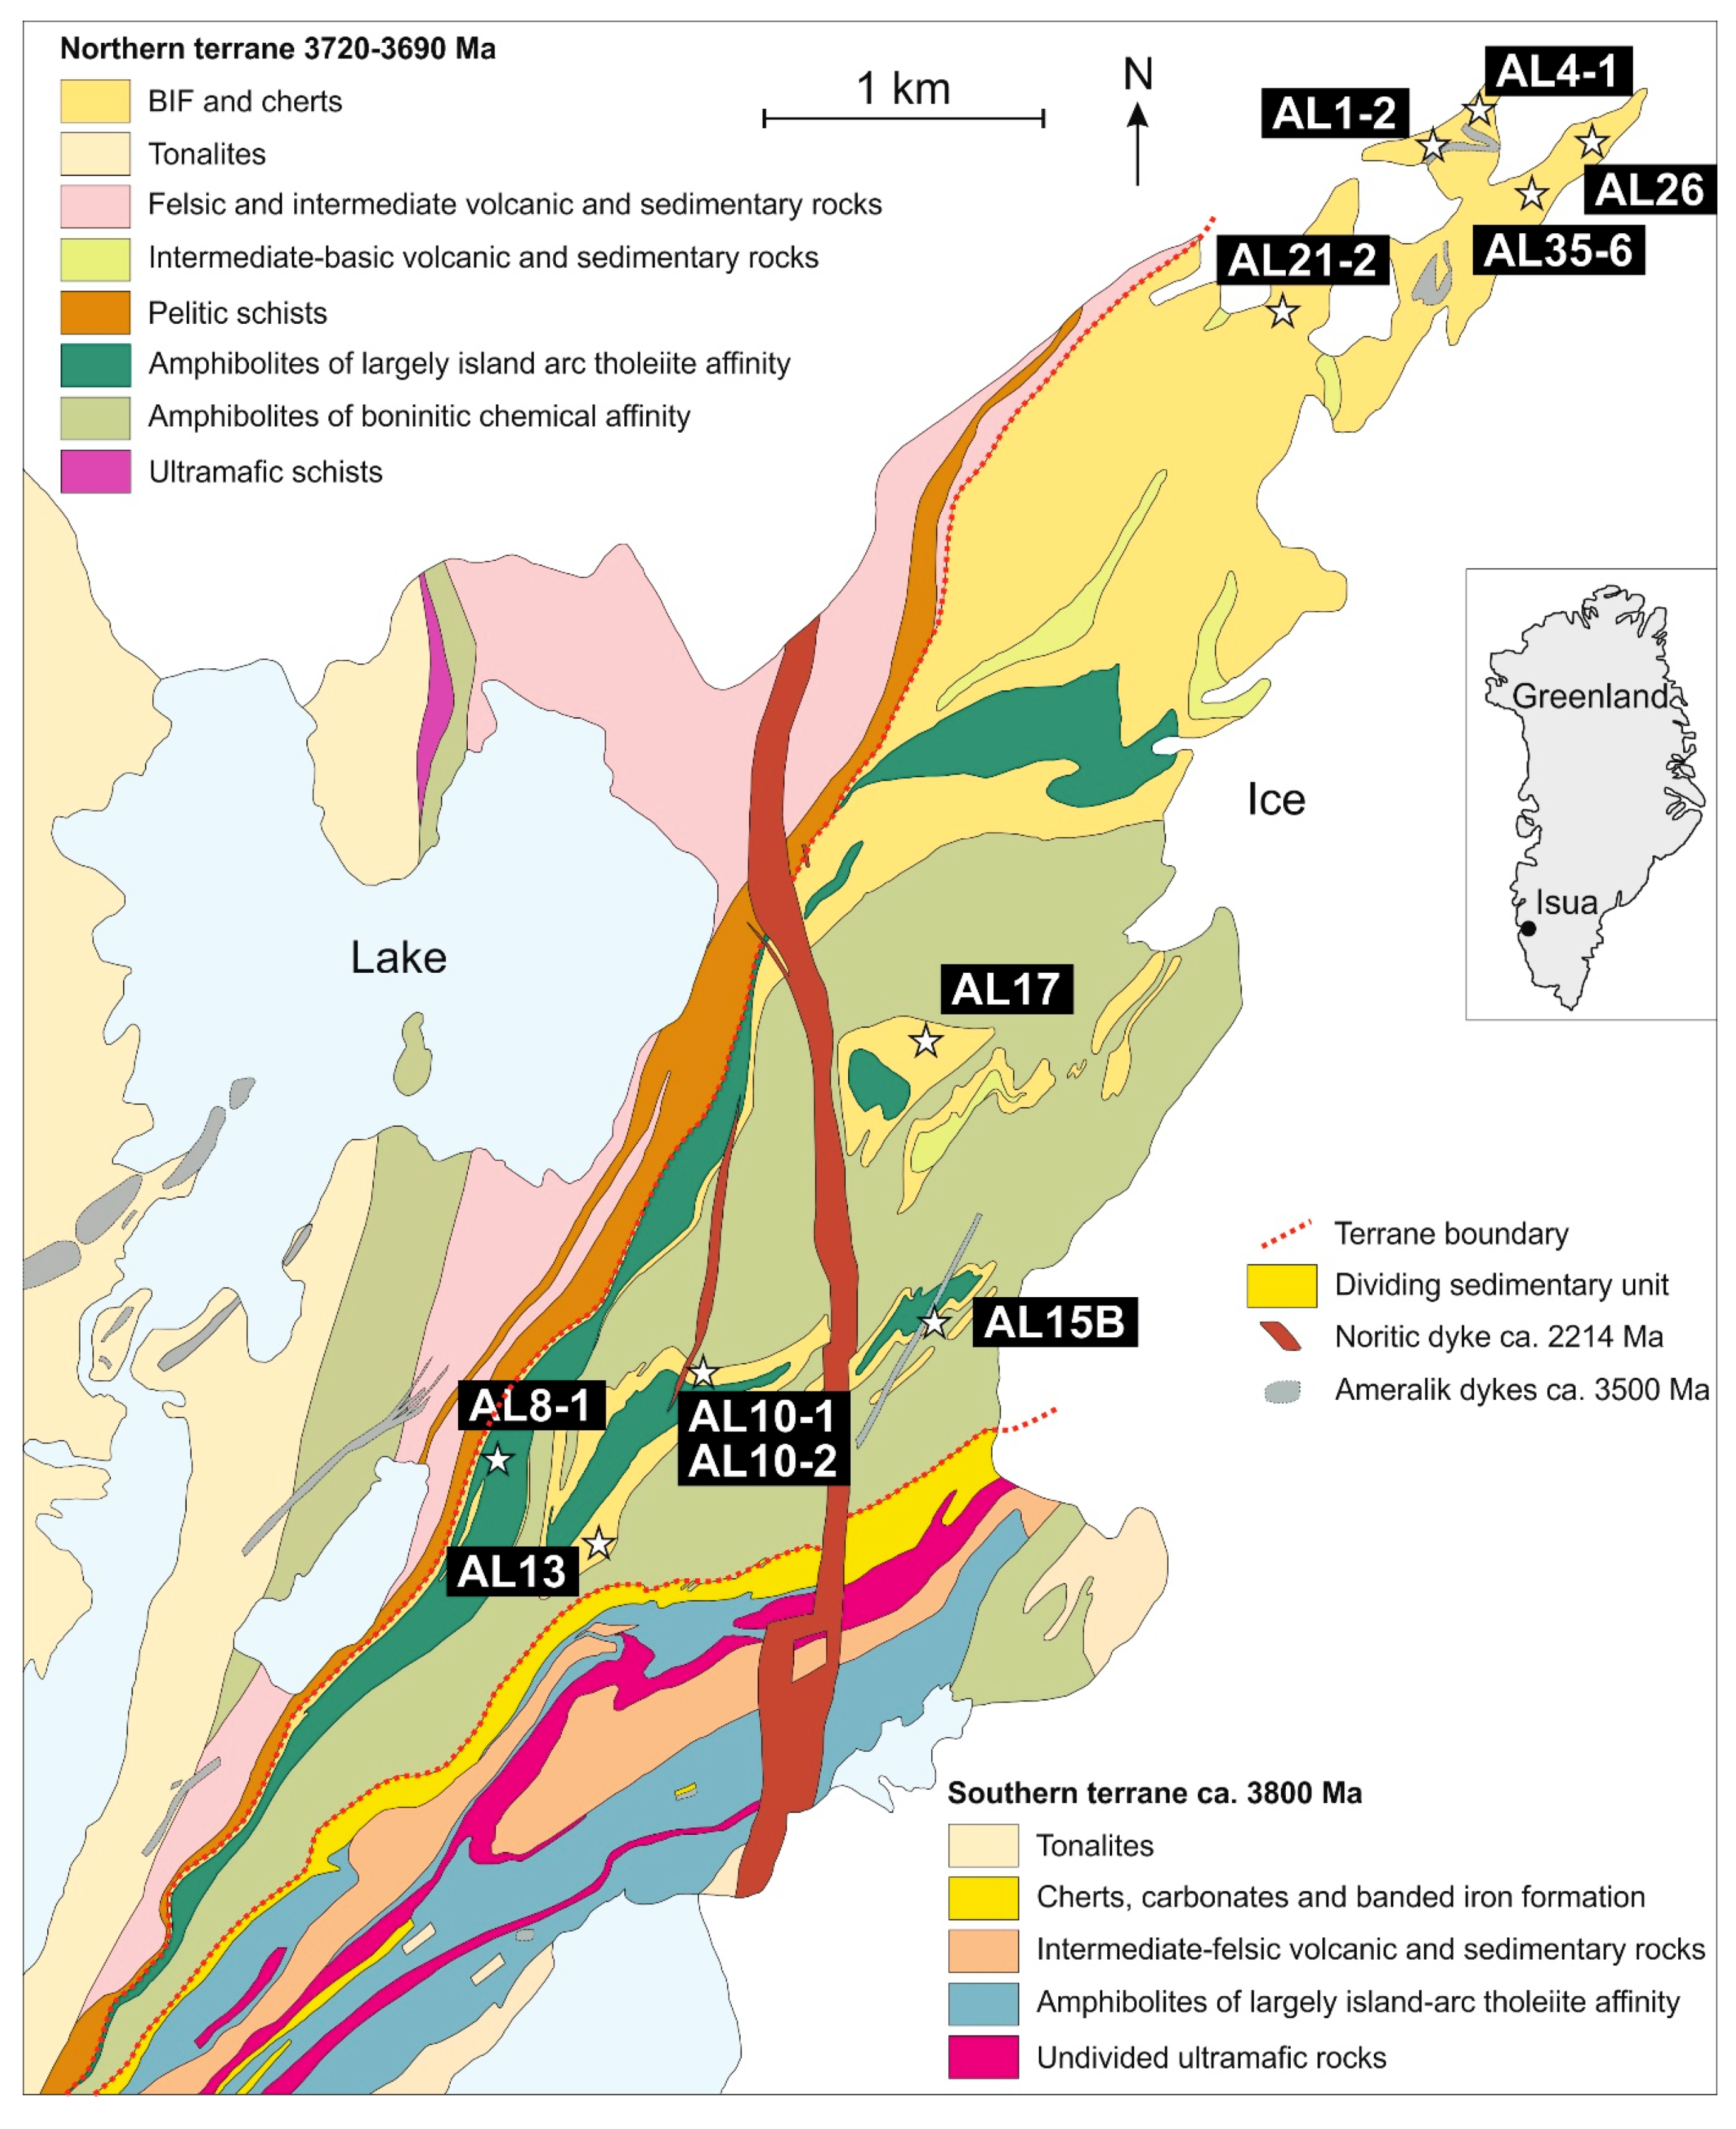
2. Geological Context and Research Material

The Isua supracrustal belt is comprised of at least five separate structural domains [55,56,57,58]; these were overprinted by one, two, or three metamorphic events in the Archean [59,60]. Other studies suggest polyphase metamorphism from greenschist to amphibolite facies, which divides the eastern part of the Isua belt into four zones having differing pressure and temperature conditions [61,62,63]. Furthermore, the Isua belt contains well-preserved cross-cutting intrusions, which formed during different episodes in the Archean and the Proterozoic [64,65]. Within one low-strain domain, primary volcanic and sedimentary features can still be found [20,56,66]. This area was probably influenced by only a single amphibolite facies metamorphism (450–475 °C and 360–400 MPa, at 3.69 Ga [59,60]) or by relatively low-grade greenschist metamorphism (360–400 °C and 150–400 MPa [63]). Therefore, samples collected from this area should provide the best available material for the study of Archean environmental conditions.
Our research is based on a suite of 11 rock samples representing banded iron formations, metacherts, metacarbonate rocks, and mafic dykes collected from the least deformed, low-strain domain of the Isua belt (Figure 1). Detailed analyses of this diverse suite of rock types allow for an investigation of both sedimentary and magmatic environments. All 11 specimens contained apatite crystals, which were previously investigated for their major and/or trace element compositions, allowing them to be assigned to either sedimentary, metasomatic, or magmatic origin [22,27]. A summary of the previous findings on the origin of apatite crystals and their hydrogen isotope compositions (δD) and F–Cl–OH systematics is presented in Table 1 along with information on the mineral assemblages of the host rocks. The main criterion for the crystal origin assessment is the shape of rare earth elements (REE) patterns. Briefly, flat REE profiles indicate sedimentary origin, the profiles enriched in middle rare earth elements (MREE) suggest a metasomatic origin, while those depleted in light rare earth elements (LREE) imply that apatite crystals formed from fluids injected in connection with mafic intrusions [22,27]. The term “mafic” is used to describe the generation of crystals related to mafic intrusions but hosted by metachert or BIF, while the term “magmatic” refers to the crystals contained in the sampled mafic dykes.
Apatite crystals from six BIF specimens represent various F–Cl–OH compositions. The Cl concentrations vary from 0.06 wt % (AL35-6) to 1.79 wt % (AL10-2). Two chlorine-poor specimens have different F and OH contents: AL15B has the highest concentration of F among all the studied samples (2.82 wt %), while AL35-6 is relatively OH-enriched (an H2O component of 0.95 wt % was calculated based on ideal stoichiometry). The mineral compositions of four BIF samples (AL4-1, AL10-1, AL13, and AL10-2) are rather similar. Their major phases are quartz, magnetite, and cummingtonite (AL4-1, AL10-1, and AL13) or actinolite (AL10-2), while AL15B contains mostly grunerite and magnetite, and the main components of AL35-6 are quartz and magnetite (minerals from the amphibole group were not detected in AL35-6). In contrast, metachert AL26 consists mostly of quartz, while magnetite and cummingtonite are only minor phases. Halogen abundances were not determined in AL26, but preliminary EDX (energy-dispersive X-ray spectroscopy) analyses indicated that this apatite is rather Cl-poor.
Fluorapatite crystals from two metacarbonate specimens have similar concentrations of F, Cl, and OH, while they differ significantly in characteristics of the host lithology. AL8-1 represents a carbonate-rich layer in mafic rock and consists mostly of chlorite, magnetite, Mg–Mn-rich siderite, Fe-rich dolomite, and cummingtonite. In contrast, AL17 represents a carbonate-rich layer in metachert and contains quartz, Fe-rich dolomite, calcite, and cummingtonite. Both apatite samples are associated with graphite, which has previously been described as a product of thermal decomposition of Fe-rich carbonate minerals [8,22].
Apatite crystals from two mafic dykes have different halogen concentrations: hydroxylapatite AL21-2 is rich in Cl (1.49 wt %), while apatite AL1-2 is rather poor in Cl (which was determined by preliminary EDX analyses). These mafic dykes differ significantly in mineral composition: AL21-2 contains mostly chlorite and minerals of the actinolite-hornblende series, while the main components of AL1-2 are chlorite, quartz, and stilpnomelane. Due to the advanced alteration process, the primary character of the mafic melt leading to the crystallization of these mafic dykes is hard to recognize.

3. Laboratory Methods

Secondary processes may affect either whole crystals or only some of their domains [43,67,68]. Within this context, it was necessary for our isotopic study to determine the textural and structural heterogeneities of crystals, which may be indicators of alteration processes and which may possibly correlate with chlorine isotope compositions [43]. We combined our Cl isotope data collected on multiple apatite crystals with information from two complementary analytical methods: transmission electron microscopy (TEM) and cathodoluminescence (CL) imaging, which we used to investigate microdomain textures and other internal features that may provide evidence for the preservation of primordial structures or their transformation at the micro- and nano-scales. Both methods have previously been shown to be useful in tracing products of the fluid-apatite reactions [69] and the hydrothermal alteration of apatite [70,71].
All 11 specimens listed in Table 1 were investigated using transmission electron microscopy and cathodoluminescence imaging. Seven specimens representing various rock types—four BIFs (AL10-2, AL13, AL15B, AL35-6), two metacarbonates (AL8-1, AL17), and one mafic dyke (AL21-2)—were selected for chlorine isotope ratio determination. The apatite crystals from the BIF AL10-1 were no longer available for δ37Cl analyses due to sample charging issues, which had occurred during the earlier hydrogen study.

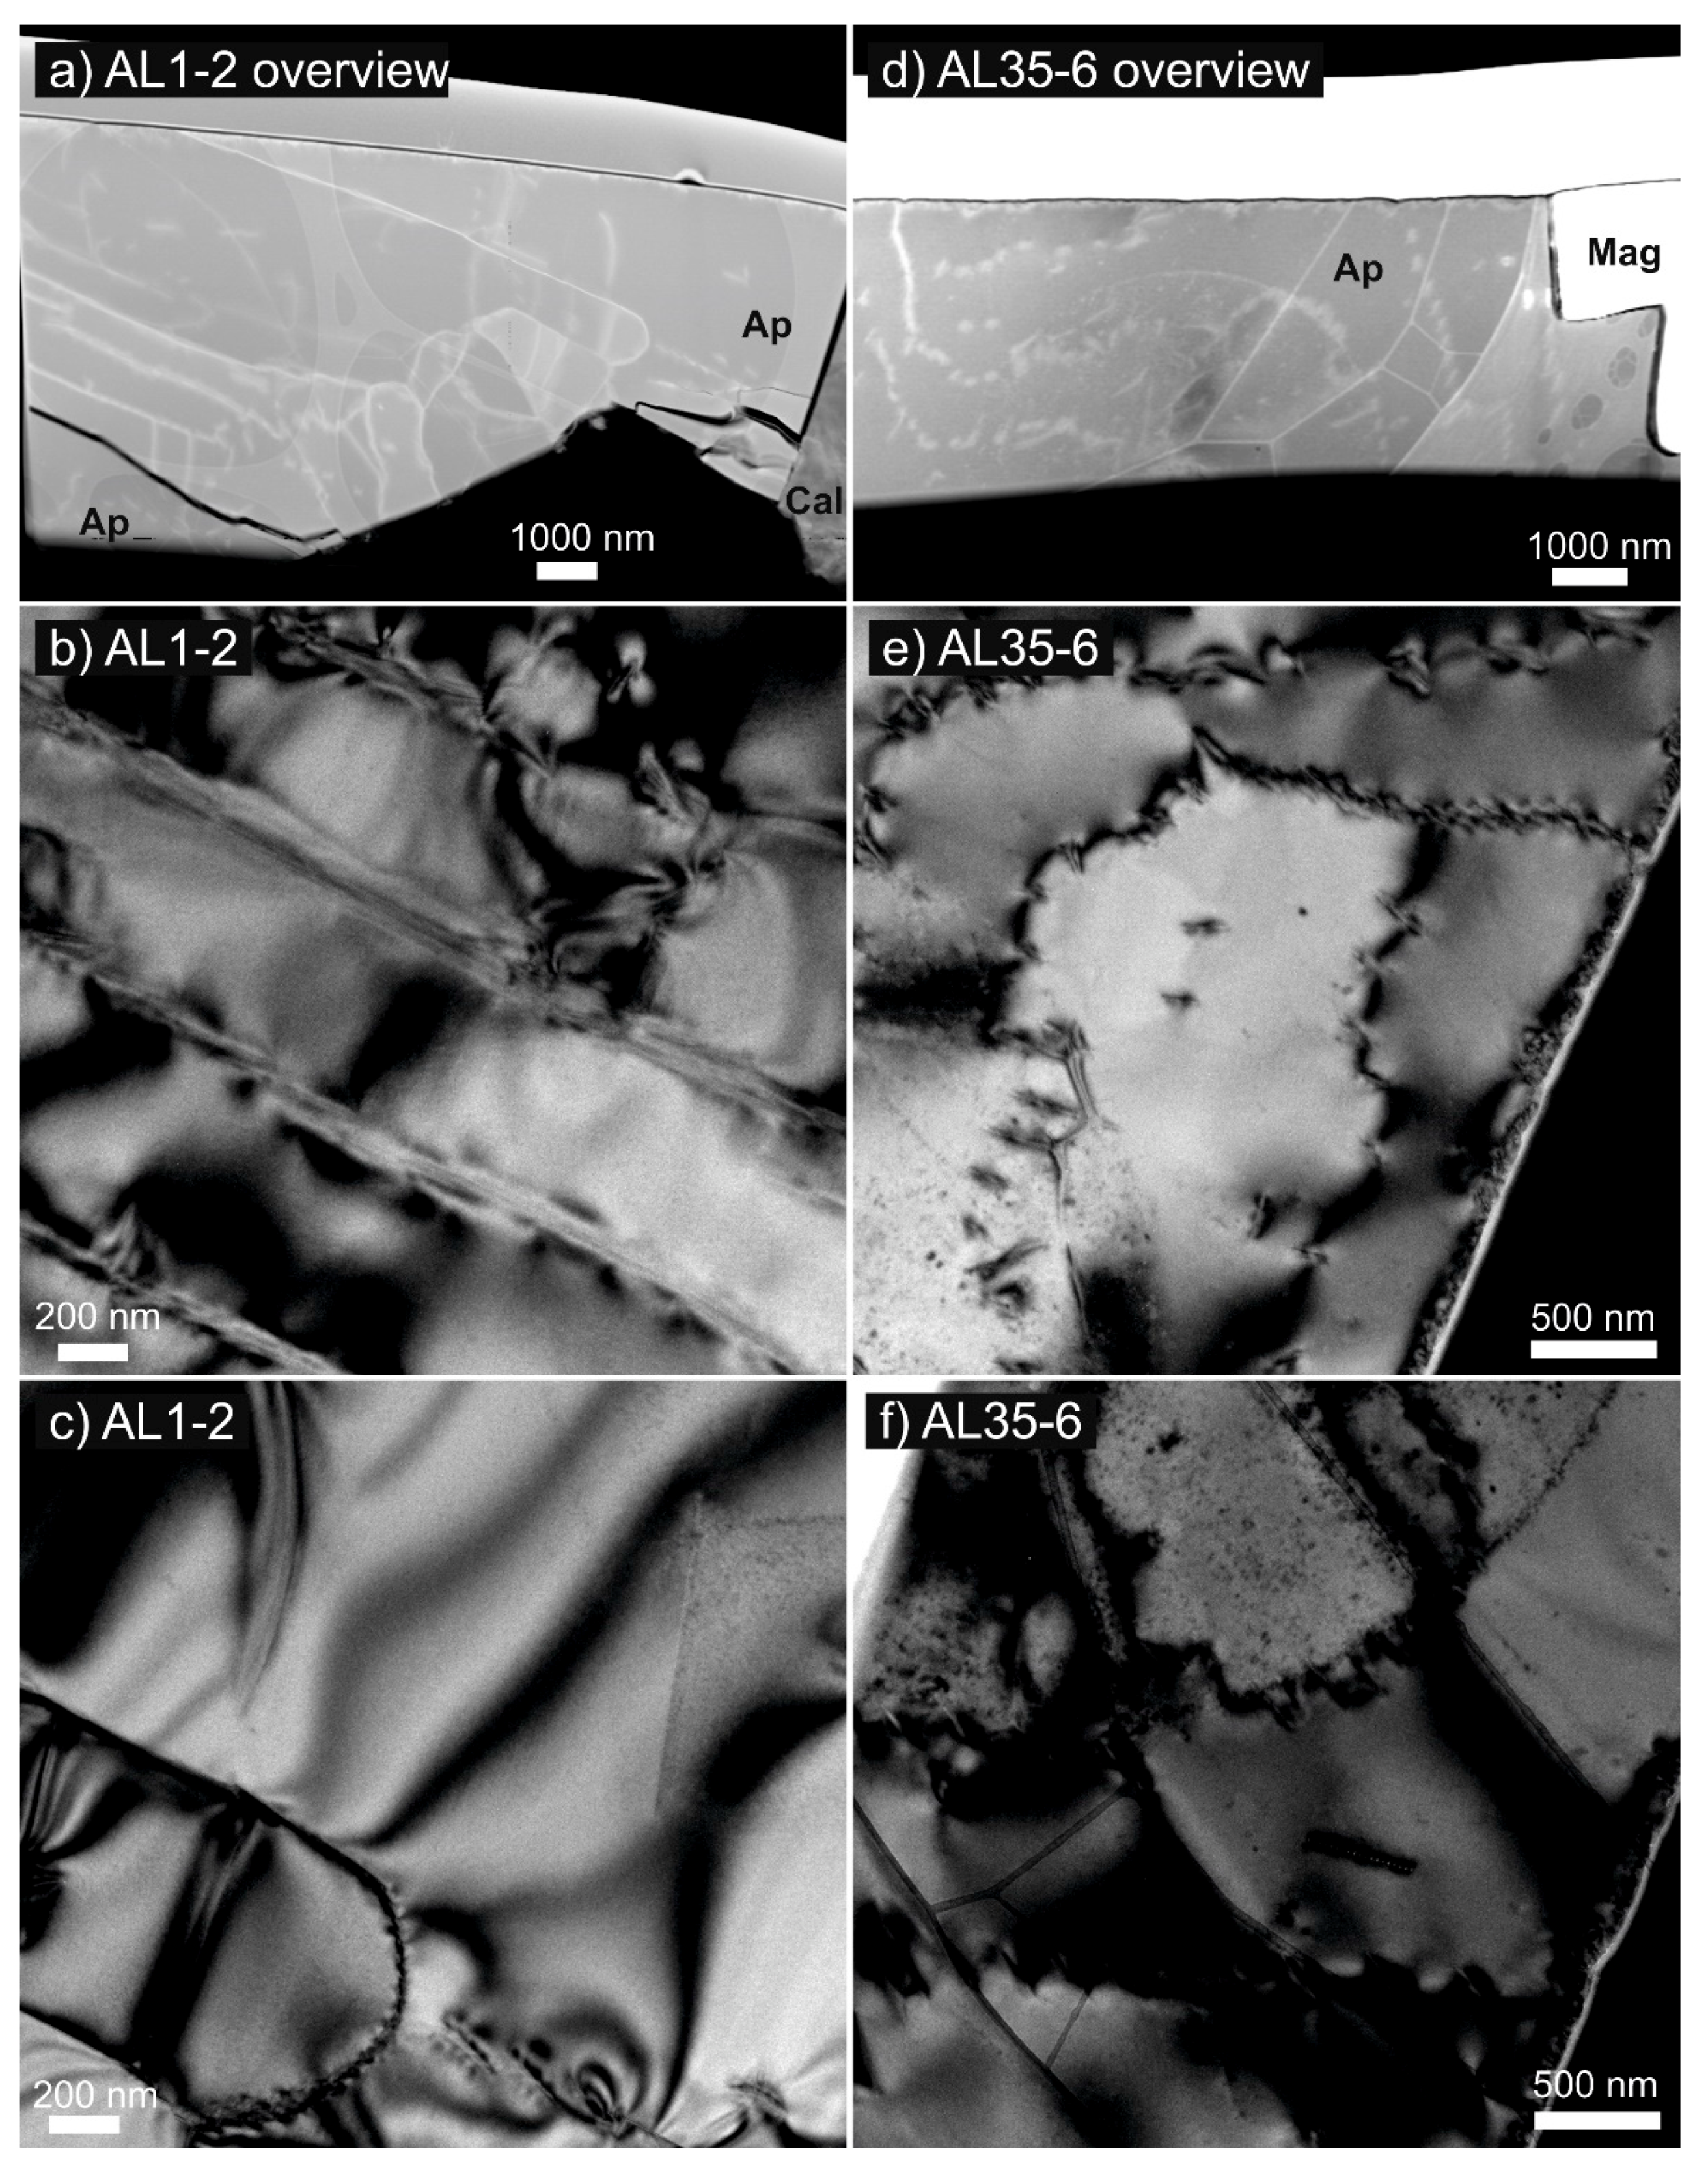
3.1. Transmission Electron Microscopy (TEM)

For transmission electron microscopy, foils were cut from thin sections using focused ion beam (FIB) milling (FEI FIB200 and Helios G4 UC) followed by analyses with a FEI Tecnai G2 F20 X-Twin TEM at the Helmholtz Centre Potsdam. Selected areas of 20 µm × 2 µm on carbon-coated thin sections were covered with a 1.5 µm thick protective layer of Pt to prevent sample damage caused by FIB sputtering and Ga-ion implantation. Then, the samples were sputtered from the frontal and lateral sides, using a 30 kV accelerating voltage and a Ga beam current of 30 nA. Both surfaces were further “polished” with a 3 nA (FIB200) or a 41 pA at 5 kV (Helios G4 UC) focused ion beam, resulting in a final foil thickness of ~150 nm (FIB200) or ~100 nm (Helios G4 UC). For further details concerning TEM sample preparation, see Wirth [72] and Wirth [73]. Then, the 20 µm × 10 µm foils were placed on a perforated carbon film on a copper grid and examined using a transmission electron microscope equipped with a Schottky field emitter electron source, a Fishione high-angle annular dark-field detector (HAADF), an EDAX X-ray analyzer, and a Gatan electron energy-loss spectrometer (EELS). High-resolution lattice fringe images were used to calculate the diffraction patterns using a fast Fourier transform.

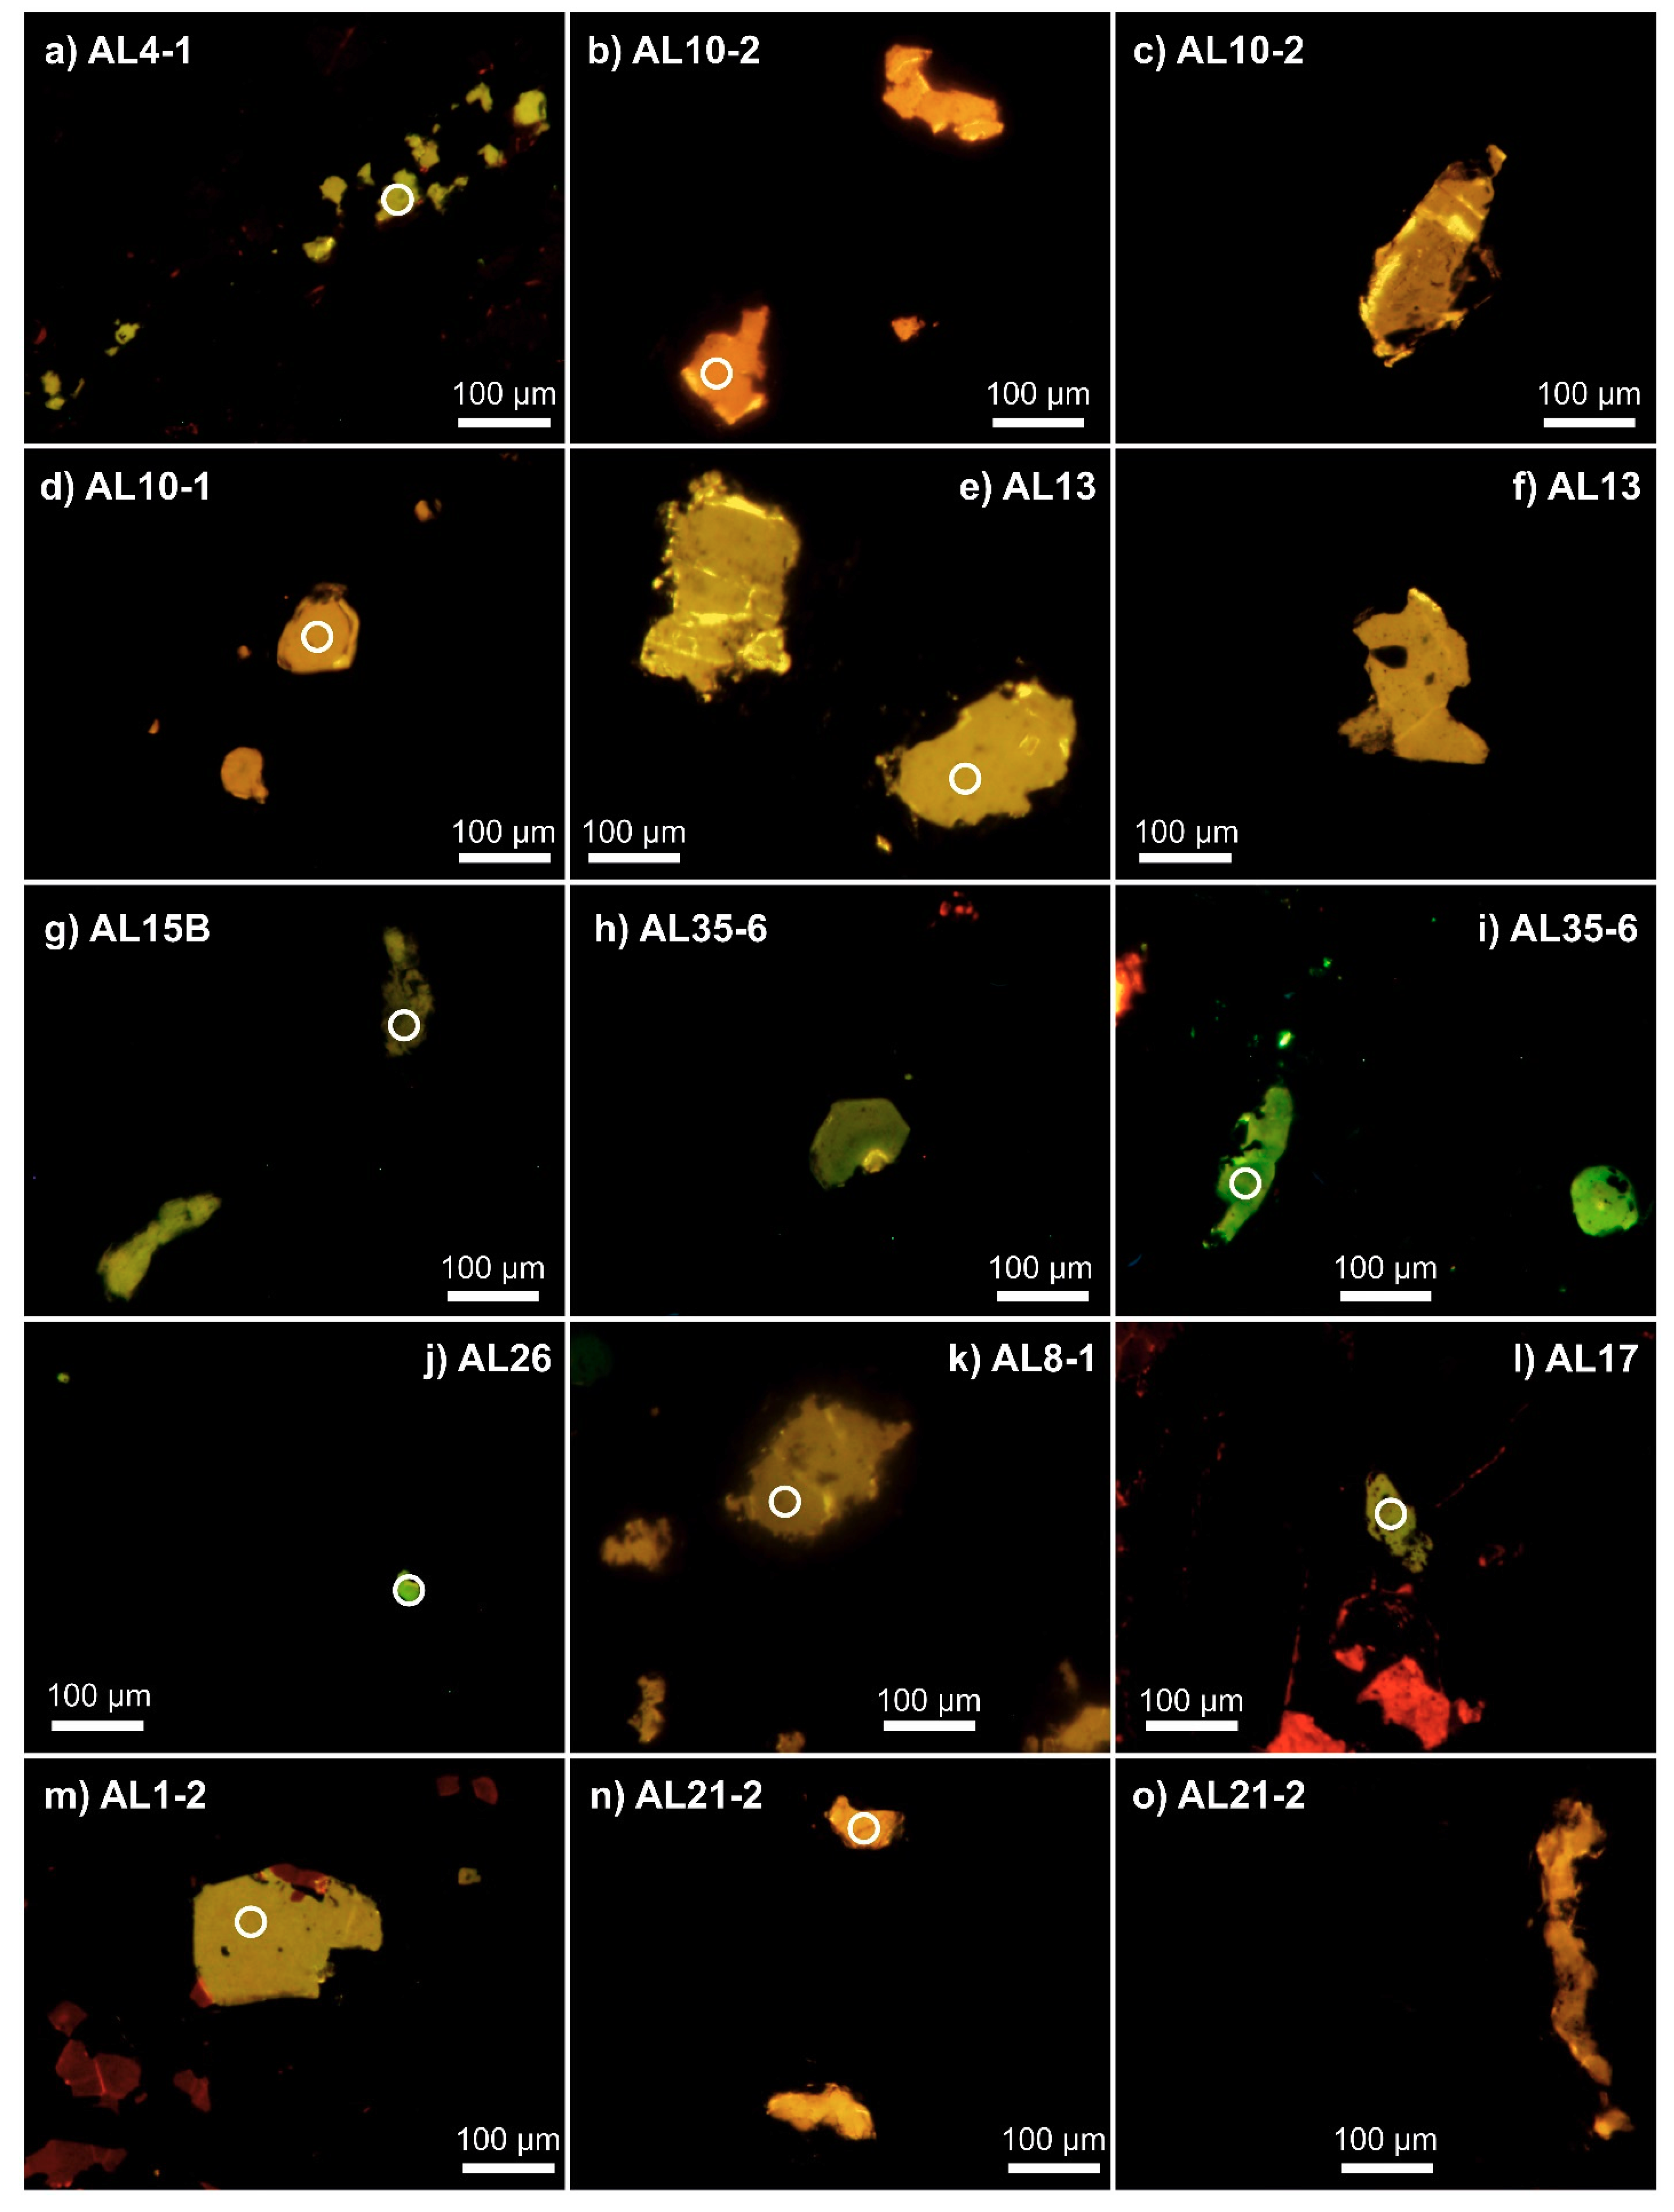
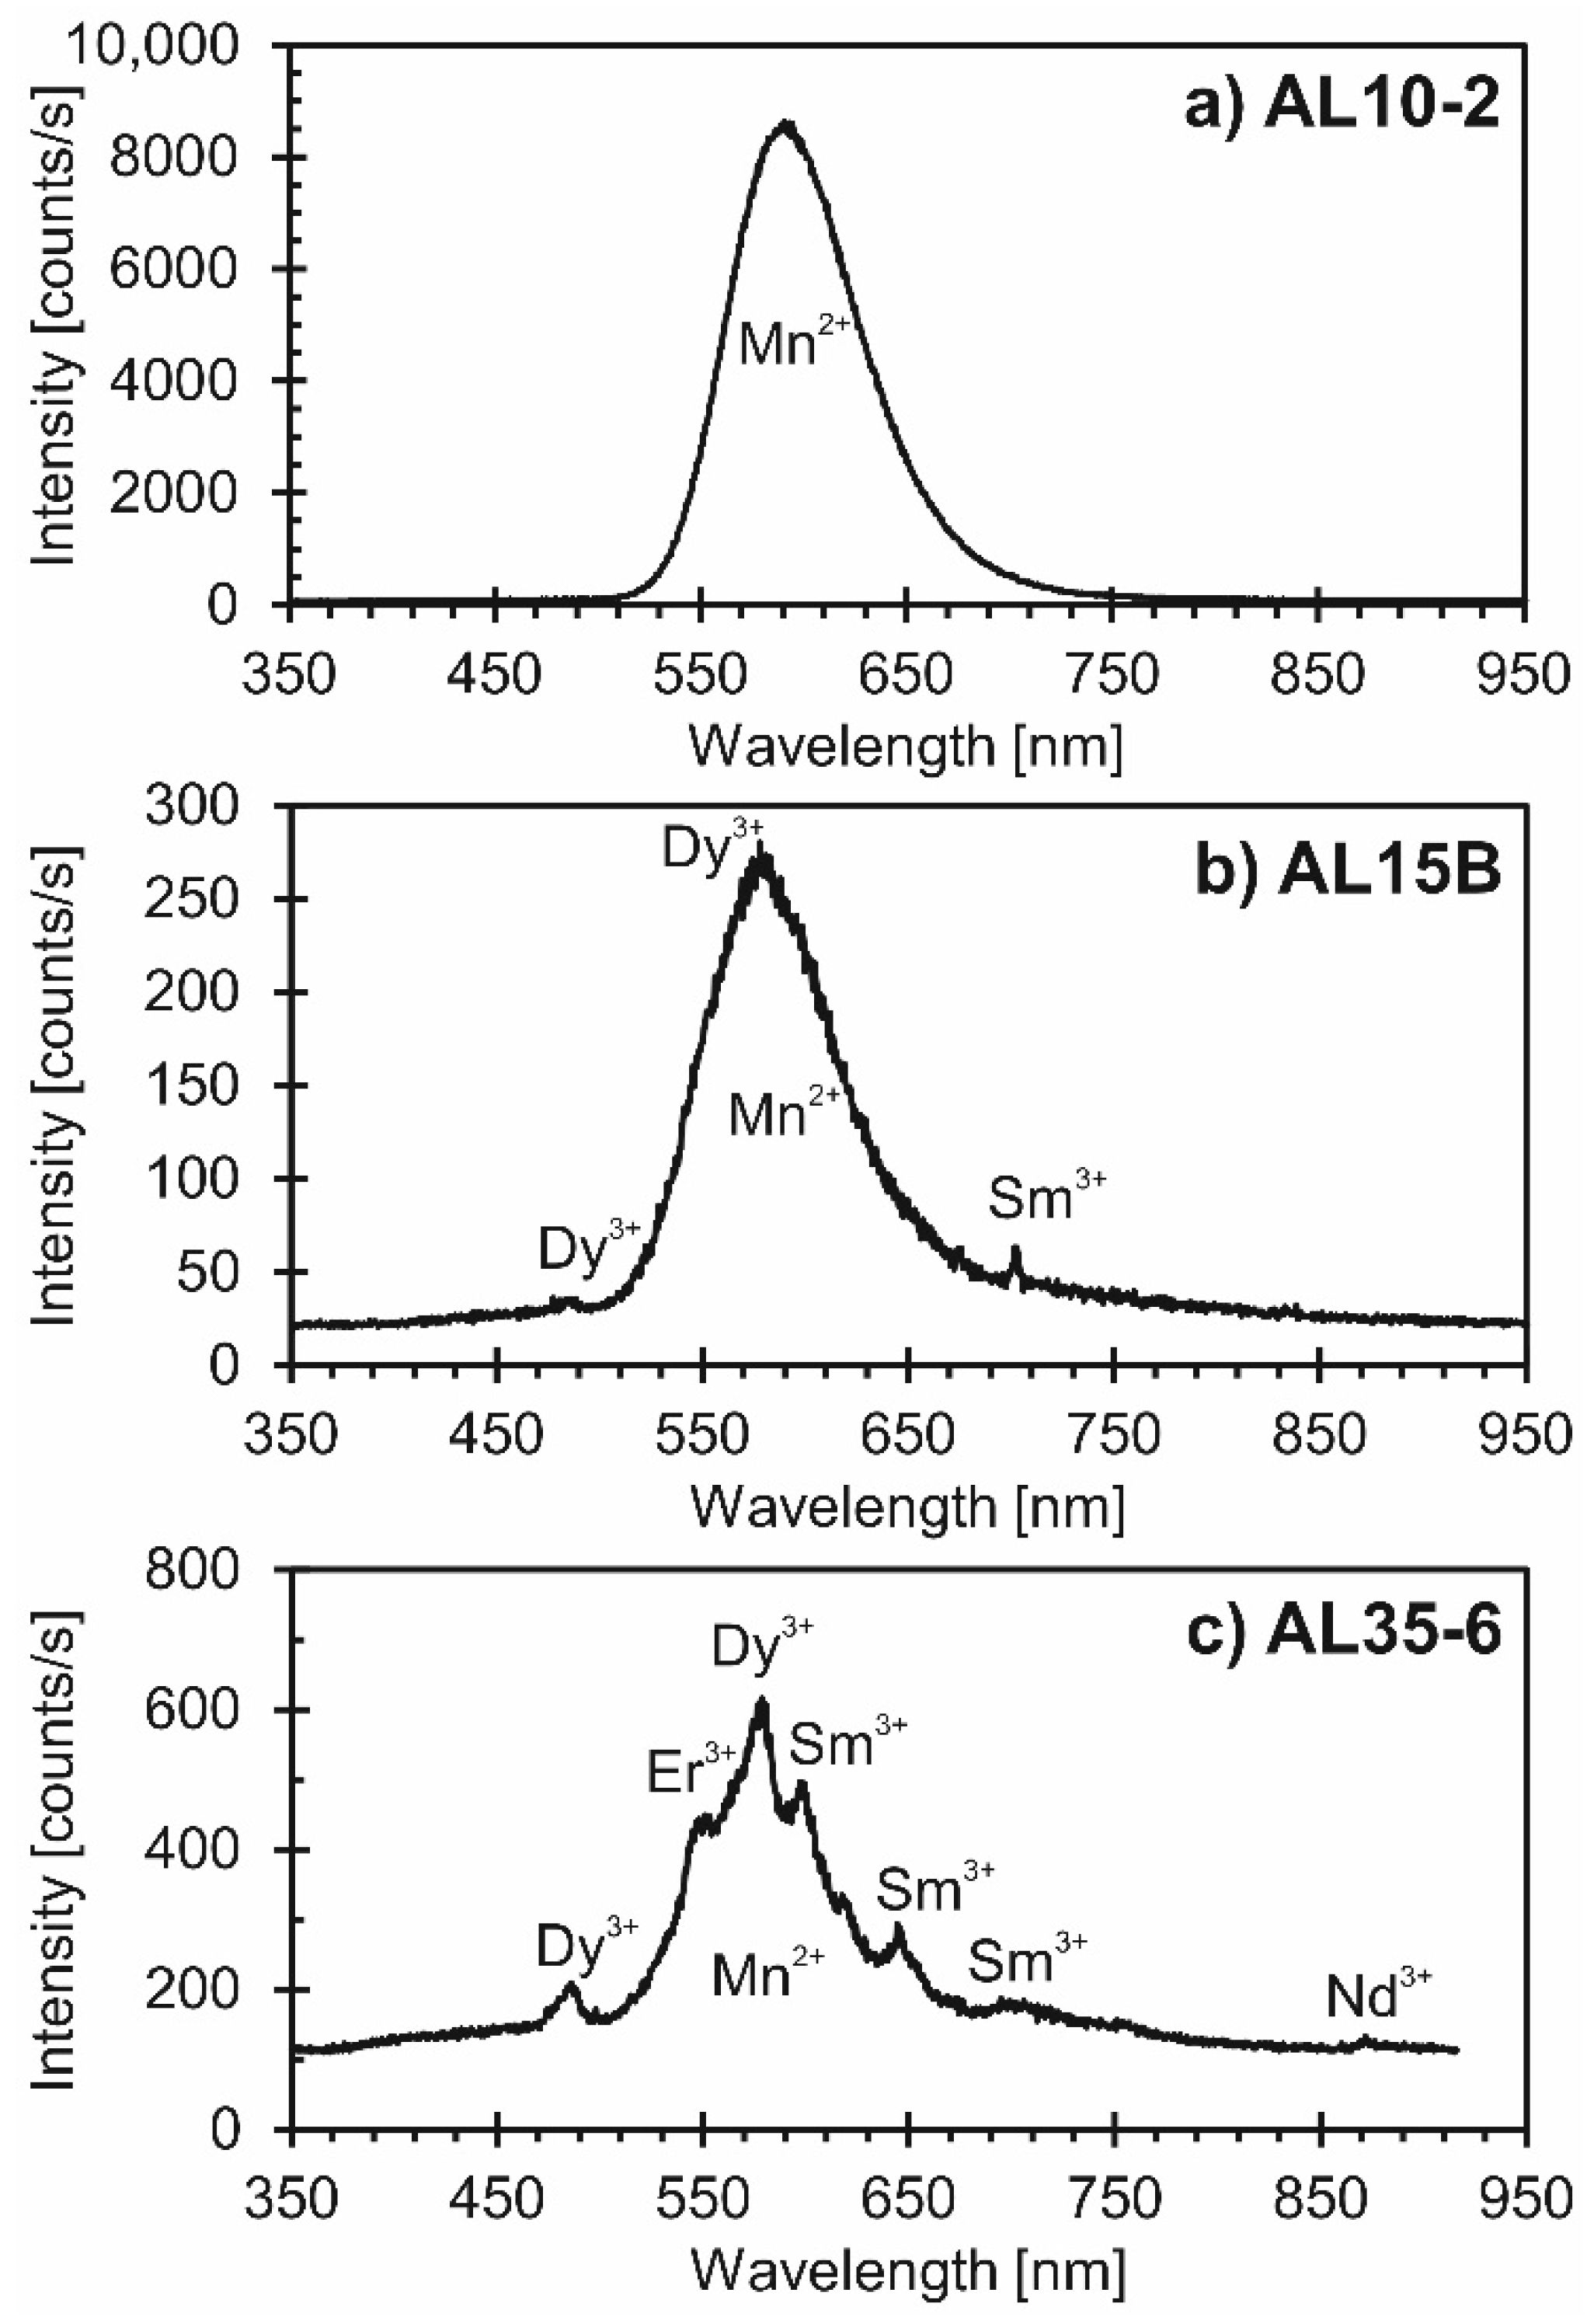
3.2. Optical-Microscope Cathodoluminescence (CL) Imaging and Spectroscopy

Cathodoluminescence images and spectra were collected on carbon-coated, polished thin sections using a “hot cathode” CL microscope HC1-LM at the TU Bergakademie Freiberg following the protocol of Neuser et al. [74]. The system was operated at 14 kV accelerating voltage and a current of 0.2 mA (the current density was approximately 10 µA/mm2). Luminescence images were captured “on-line” with a Peltier cooled digital video camera (OLYMPUS DP72). CL spectra were recorded in the wavelength range from ~350 to ~920 nm using an Acton Research SP-2356 digital triple-grating spectrograph with a Princeton Spec-10 CCD detector attached to the CL microscope by a silica-glass fiber guide. The CL spectra were collected under standardized conditions with a spot width of 30 µm and measuring time of 2 s; wavelength calibration was performed using an Hg-halogen lamp.

3.3. Secondary Ion Mass Spectrometry (SIMS)

Multiple apatite crystals extracted from rock samples were mounted in the center of 25-mm diameter acrylic discs using epoxy resin; these were subsequently polished to a <5 µm surface quality (for details, see Wudarska et al. [27]). δ37Cl values were determined using the Cameca 1280-HR large geometry SIMS instrument at the Helmholtz Centre Potsdam. Prior to each measurement session, the sample mounts were cleaned in high-purity ethanol and were then coated with a 35-nm thick high-purity gold film to assure electrical conductivity; δ37Cl analyses were performed in two analytical sessions in June and November 2017. A 2 nA, 10 keV 133Cs+ primary ion beam focused to a ~5 µm diameter spot was used to produce 35Cl and 37Cl ions following a modified protocol based on that of Kusebauch et al. [43]. Using a rastered beam, a 25 µm × 25 μm area of the sample surface was sputtered for 60 s to remove the gold coat and to suppress surface contaminants. Then, the raster was reduced to a 15 µm × 15 μm analysis area. 35Cl and 37Cl secondary ions were collected simultaneously on Faraday cups over 20 cycles, with each cycle lasting for 4 s. The mass resolving power was set at M/ΔM ≈ 2000 (at 10%). A normal incidence, low-energy electron flood gun was used for charge compensation of the sputtered region. The measured 37Cl/35Cl ratios were corrected for instrumental mass fractionation (IMF) based on four reference materials of known chemical and isotopic composition (Table 2). The samples AL13, AL17 (first part), and AL35-6, were embedded in epoxy along with all four reference materials, while the samples AL8-1, AL10-2, AL15B, AL17 (second part), and AL21-2 were mounted together with the Eagle County crystal only. Therefore, the calibration based on multiple reference materials in case of the second set of samples required the sample swap. In order to monitor the stability of analyses and to assess the potential influence of the sample change on measured ratios, the Eagle County crystal was analyzed prior to and after each mount swap. The repeatability of the measurements conducted on this reference sample was better than 0.09‰ (one standard deviation, 1 s) in all cases, confirming the high precision of the analyses and the limited effect of the sample swap on the collected isotopic data. A few images of the SIMS analytical points are shown in Figure S1 in the Supplementary Materials.
Chlorine concentrations in six samples were sufficient (>0.13 wt %) to perform SIMS analyses using Faraday cups. In contrast, the δ37Cl values for the sample containing from 0.03–0.09 wt % of Cl (AL35-6) had to be determined using a modified protocol. The primary ion beam current high enough to provide good quality data could not be applied to AL35-6 due to its small crystal size (<150 µm) and possible sample charging effect. Therefore, secondary 35Cl and 37Cl ions from AL35-6 were produced using a rastered (10 µm × 10 μm) 20 pA 133Cs+ primary ion beam, and these were collected in parallel using two electron multipliers in conjunction with 80 cycles of data collection, each lasting 4 seconds. Prior to such low Cl abundance analyses, 90 s of pre-sputtering on a 15 µm × 15 μm area was applied using a 1 nA ion beam. Unfortunately, the session devoted to low Cl abundance apatite crystals using the electron multipliers witnessed a significant drift in the instrumental mass fractionation factor, and this drift influenced the measurements of AL35-6 to a higher extent than was the case for the interspersed analyses of three reference materials (Eagle County, TUBAF#37, and TUBAF#50). As a result, we are reluctant to use the data collected on the low chlorine sample for further geological interpretation.

4. Results

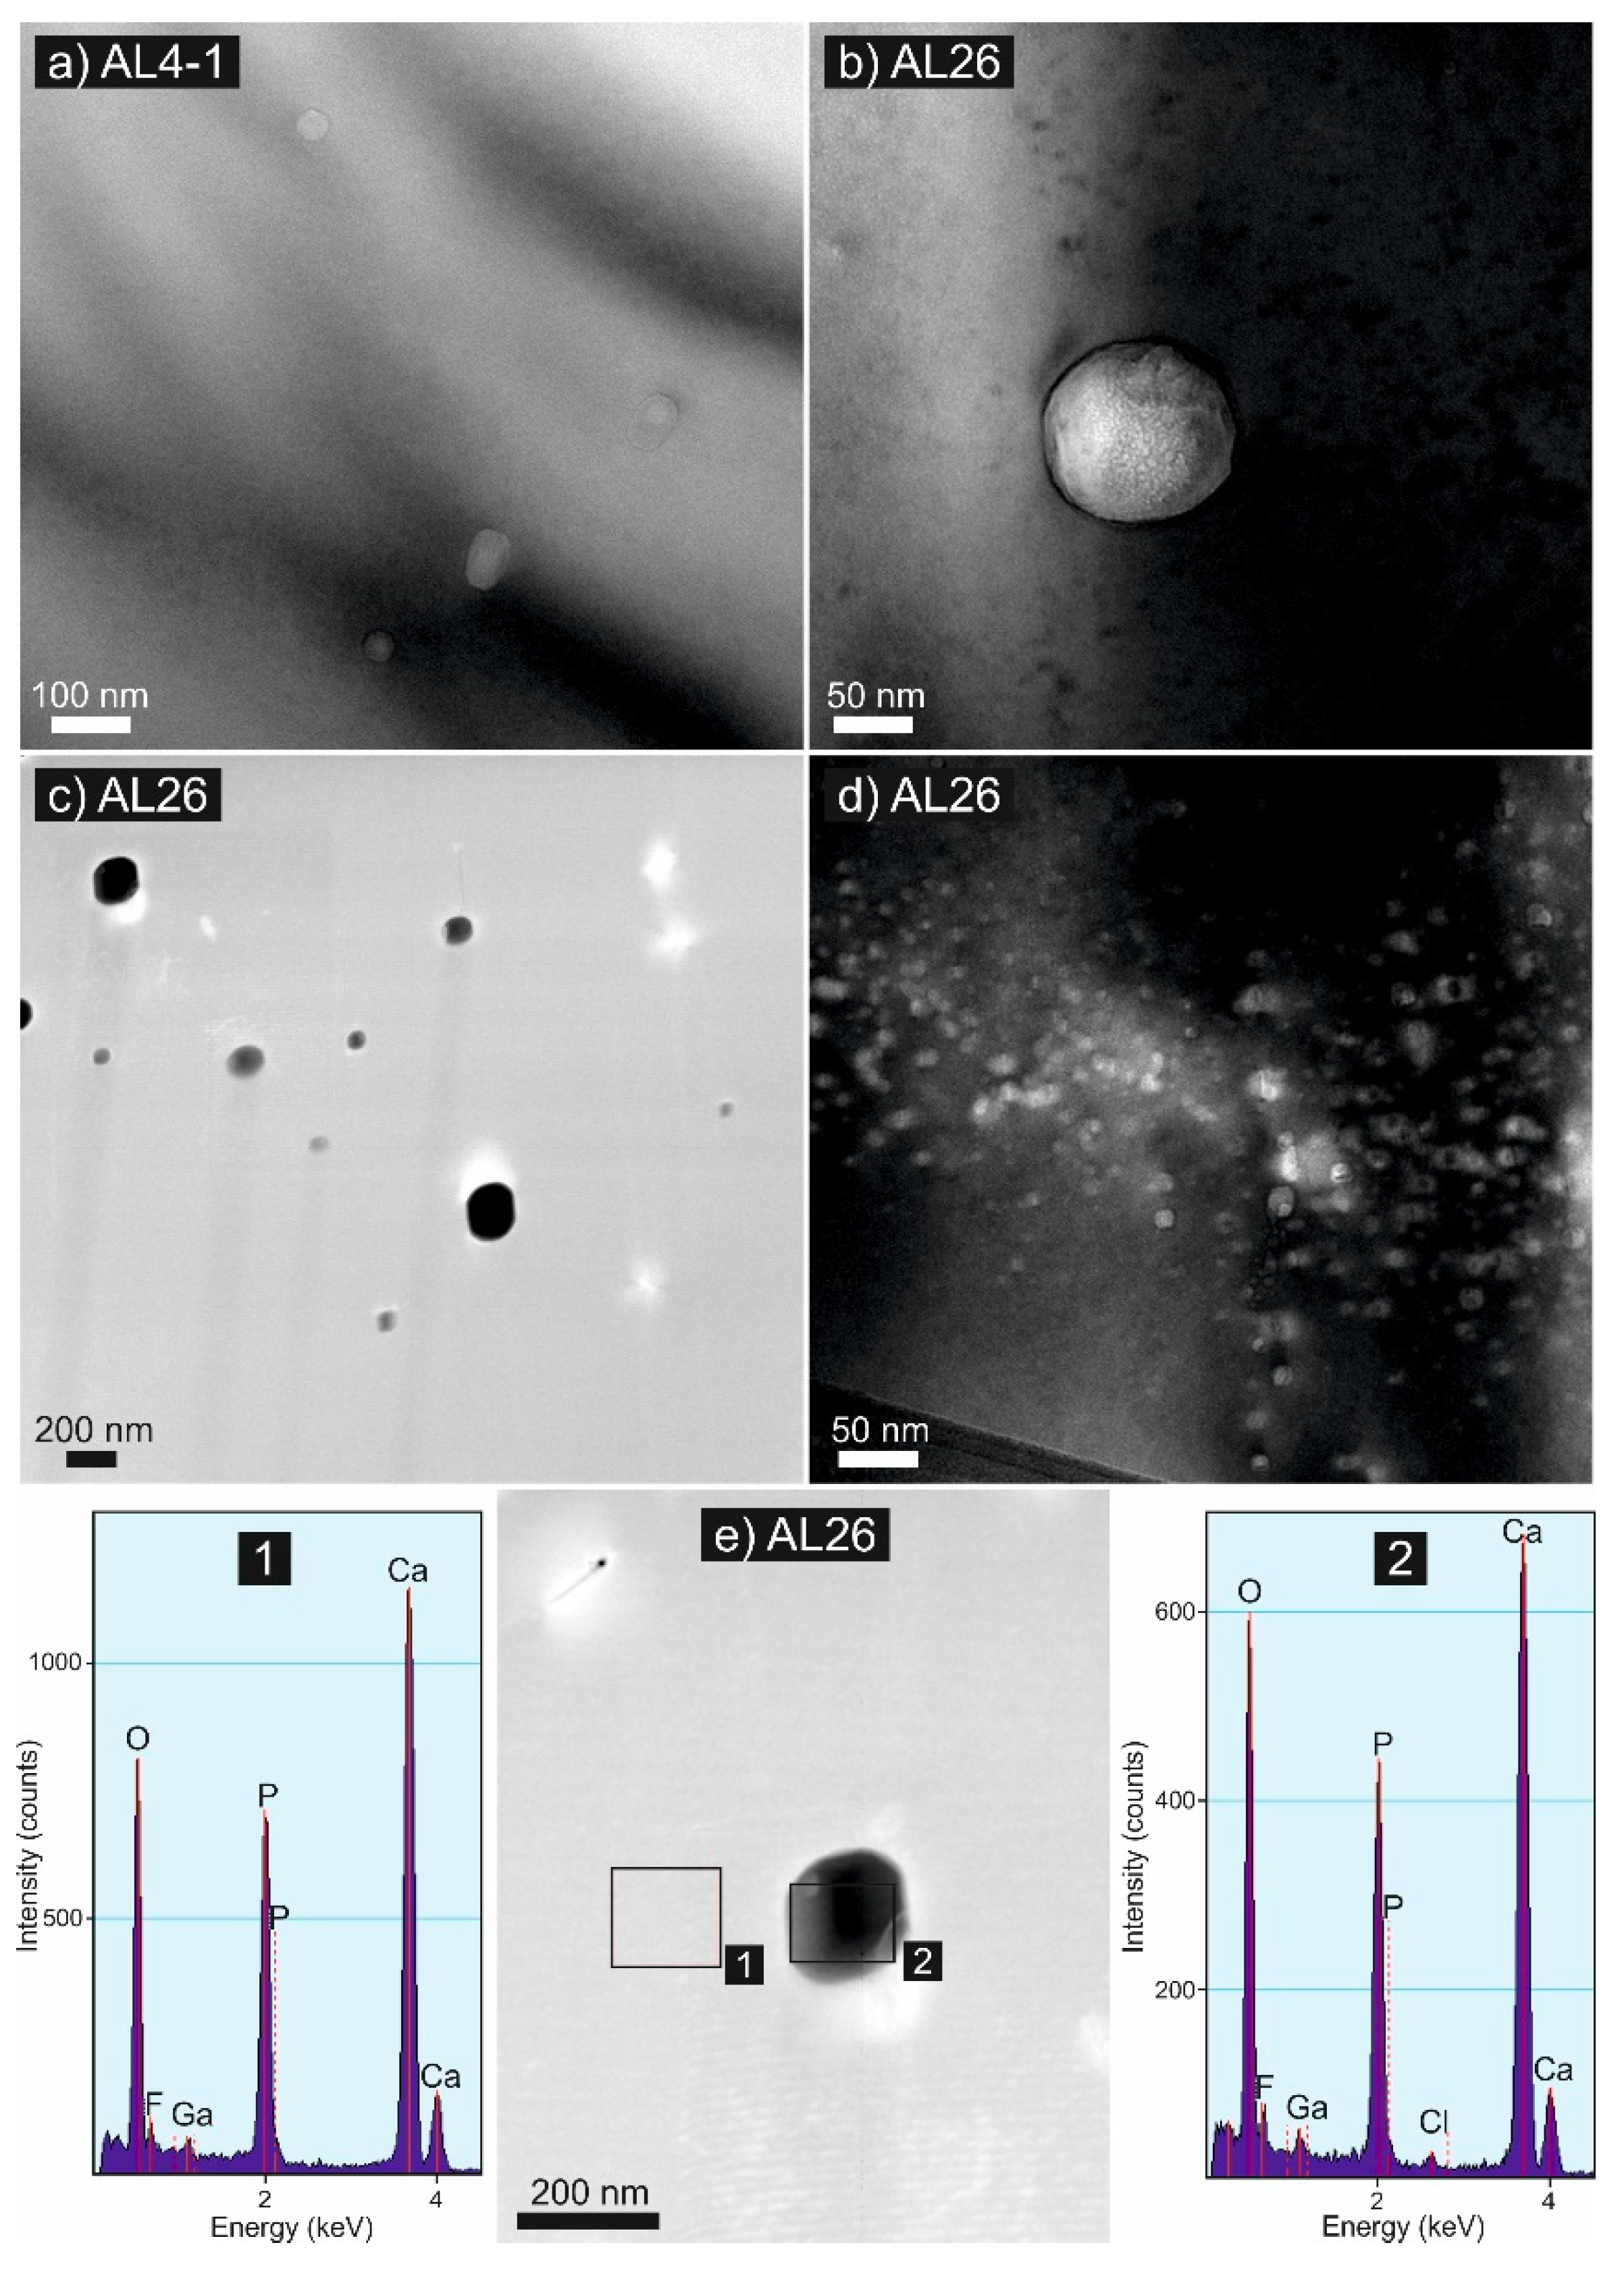
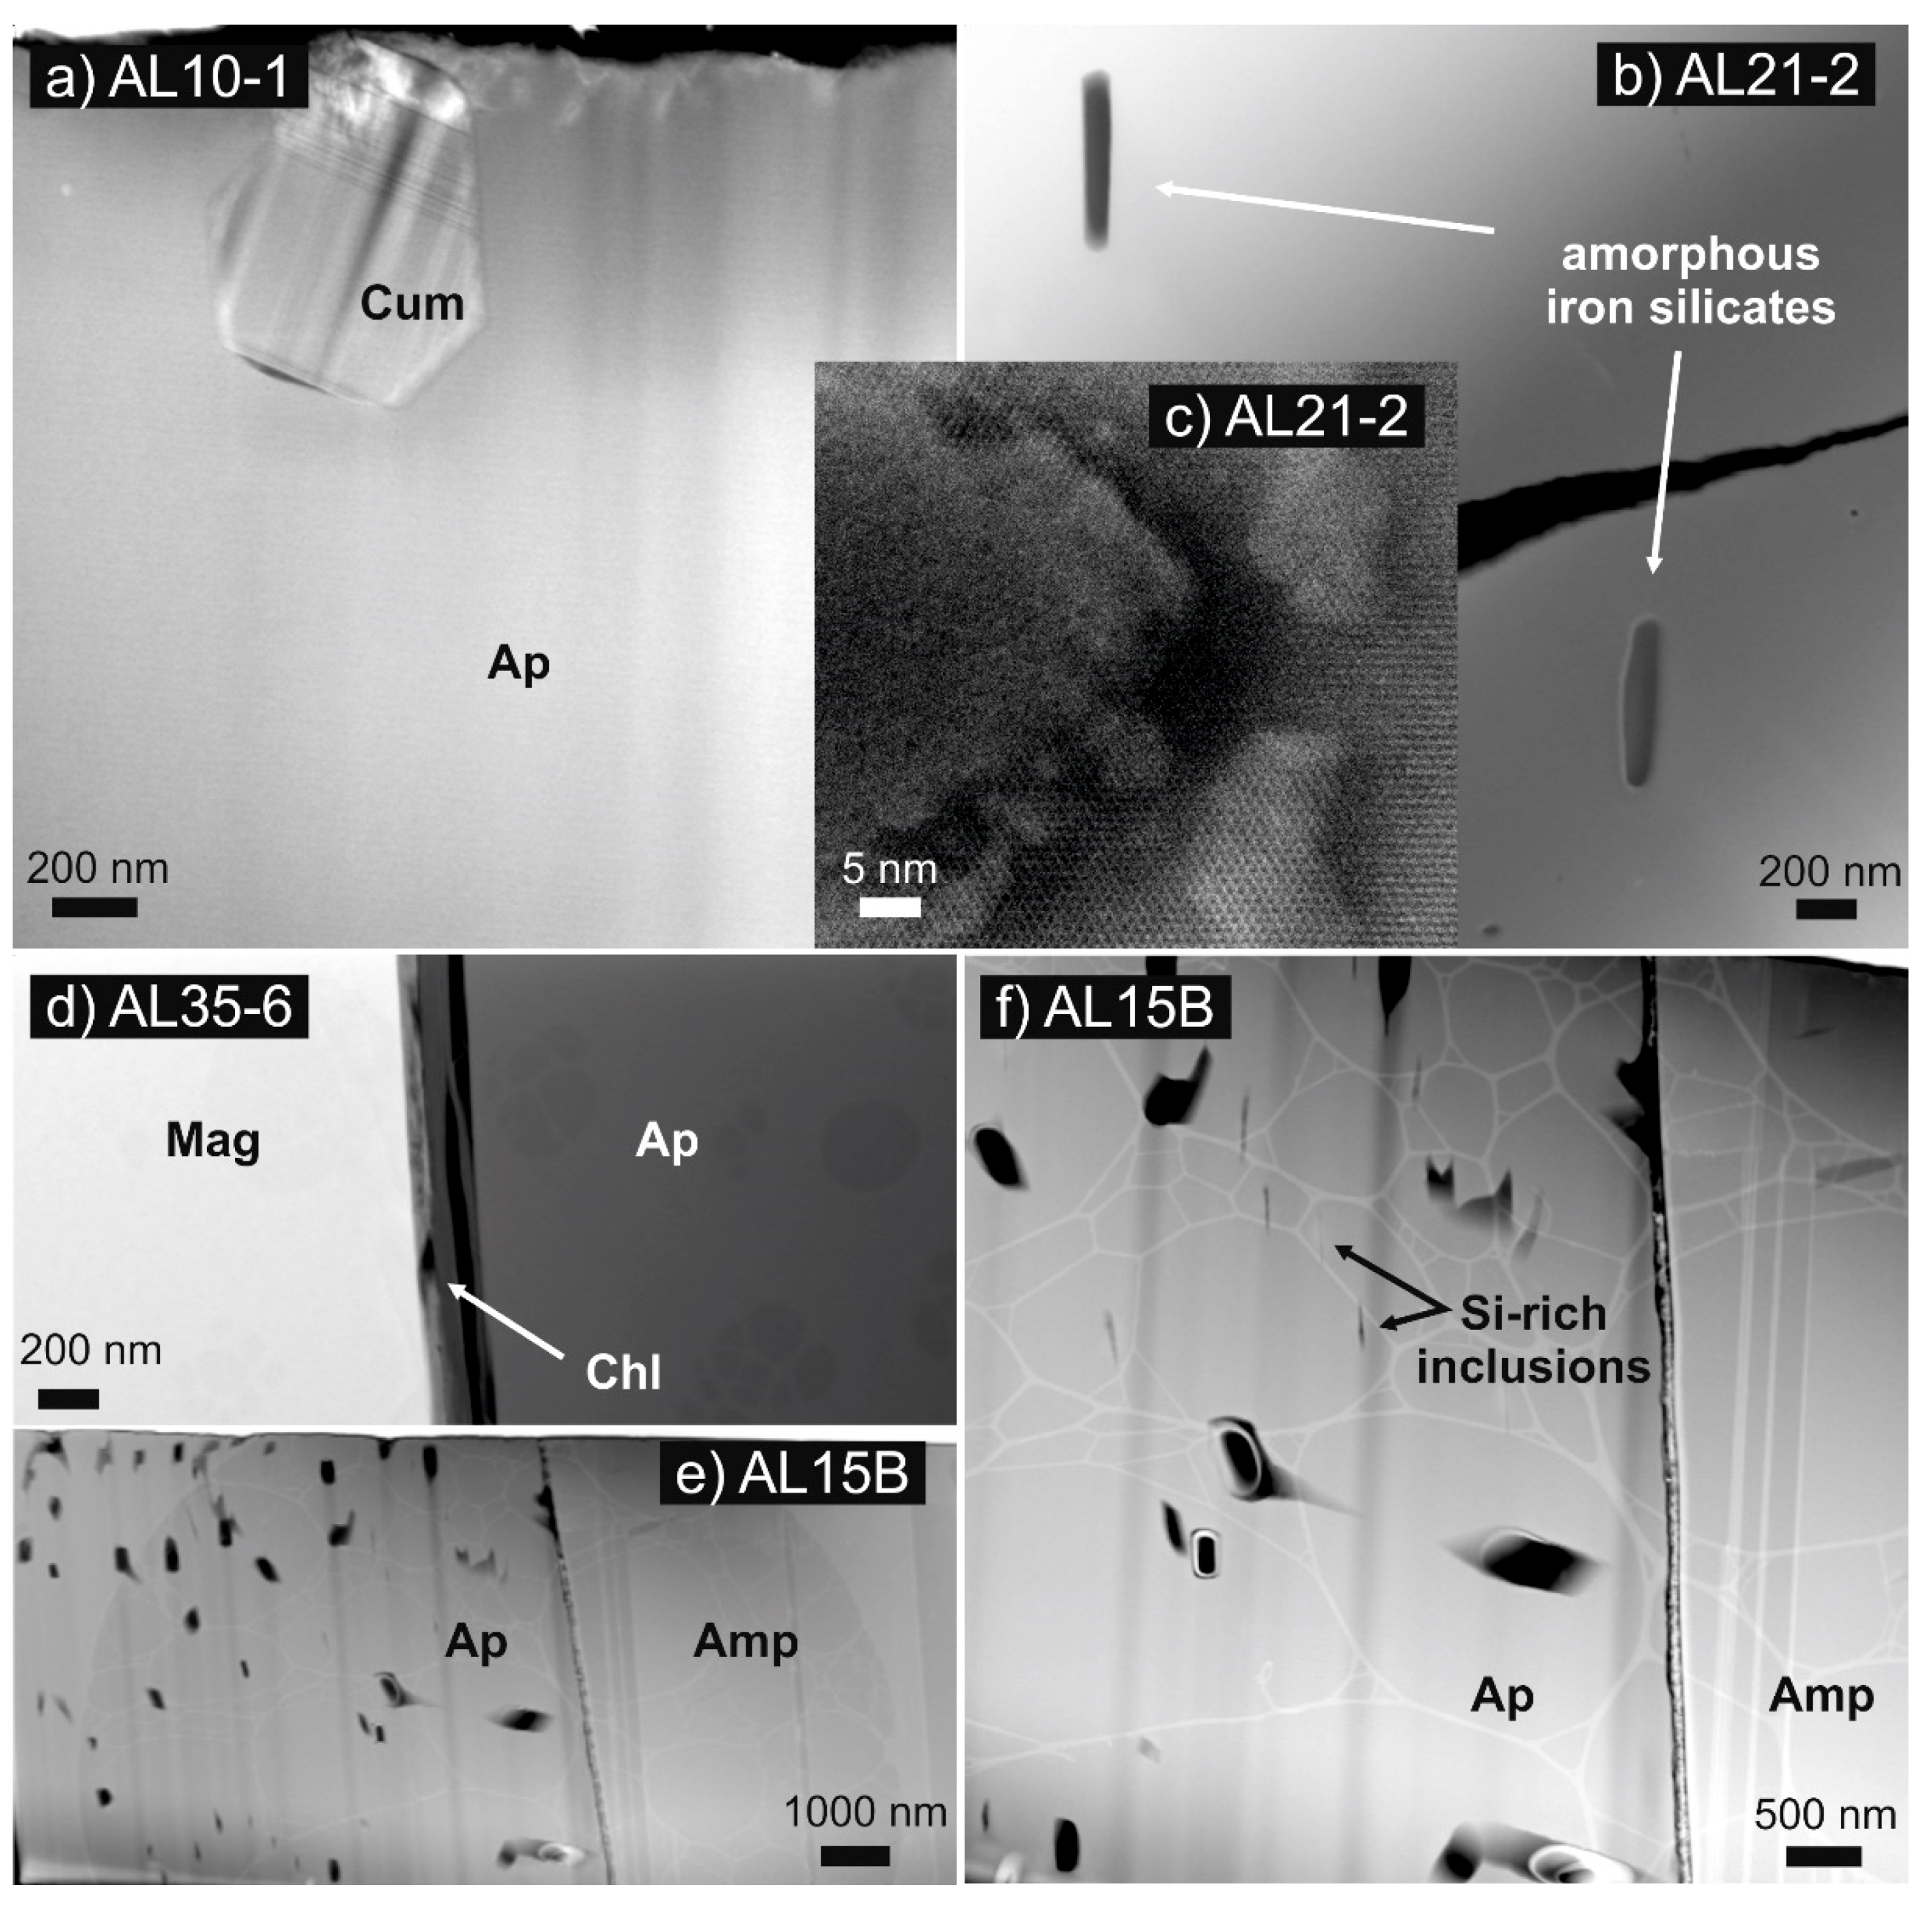
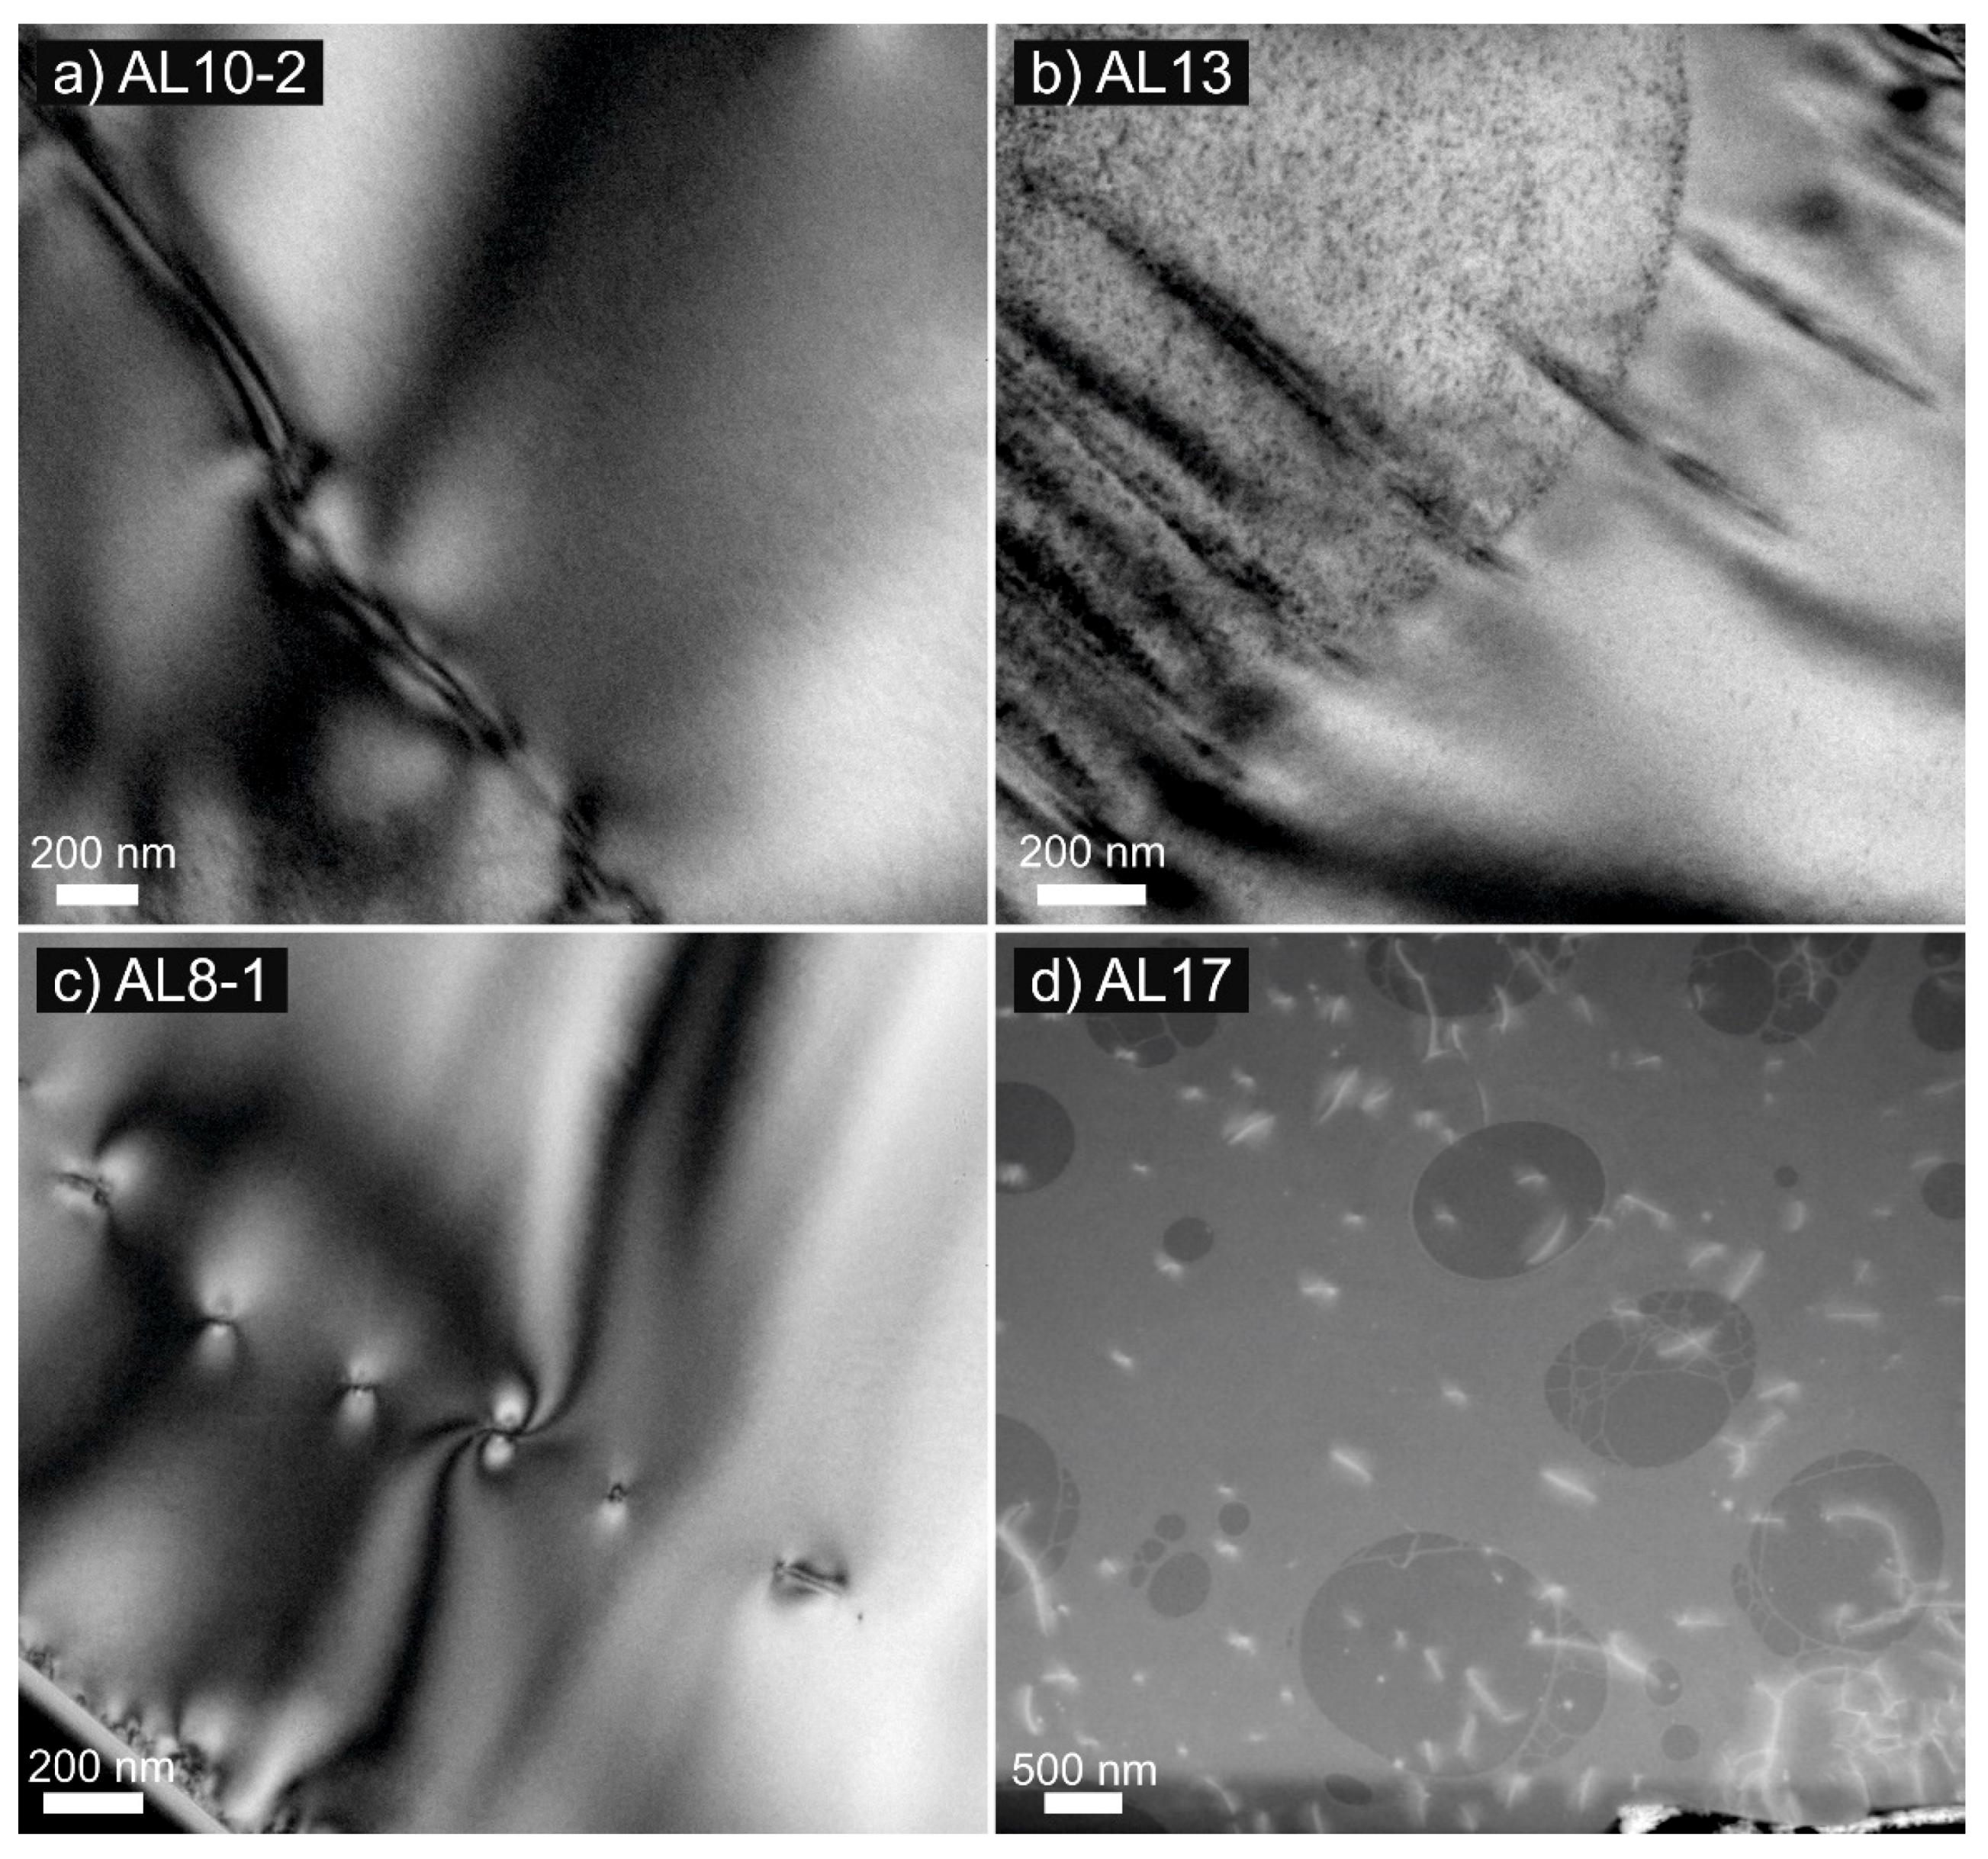
4.1. Transmission Electron Microscopy

Apatite crystals from the Isua rocks are relatively poor in both microinclusions and pores as compared to those from the Archean Barberton (South Africa) and Pilbara (Australia) terrains [67,68]. Apatite crystals from BIF AL4-1 and metachert AL26 contain spherical fluid inclusions with diameters <200 nm (Figure 2a–d). EDX analyses indicated the chlorine enrichment of such inclusions in relatively Cl-poor apatite AL26 (Figure 2e). These nanoinclusions tend to concentrate on small areas.
In other apatite specimens, a few types of Si-rich phases were identified (Figure 3). A single 1-µm solid inclusion of cummingtonite was detected in the foil from the BIF sample AL10-1 (Figure 3a). Hydroxylapatite from the mafic dyke AL21-2 contains rod-like (with lengths of up to 600 nm and widths of approximately 100 nm) amorphous iron silicate inclusions (Figure 3b,c). Furthermore, a contact zone between hydroxylapatite and magnetite in AL35-6 (BIF; Figure 3d) is filled with chlorite, while the contact zone between fluorapatite and amphibole in AL15B (BIF; Figure 3e) is rather rough and porous with no secondary filling. Moreover, fluorapatite in the BIF sample AL15B contains many nanopores, which are easily visible in the overview HAADF image (Figure 3e,f) as triangular dissolution zones, but no cracks could be identified connecting the pores to each other. Among them, there are also a few elongated (200–300 nm) silica-rich inclusions.
The most common features in the other samples are dislocations, which are visible in the bright-field and HAADF images in Figure 4. These dislocations show locally a preferred orientation, as for example in the case of BIF AL13, but are otherwise randomly distributed in space.
Apatite crystals from the BIF sample AL35-6 and the mafic dyke AL1-2 (Figure 5) consist of subgrains, separated by arrays of dislocations, forming low-angle grain boundaries similar to those found in the silicified tuff from the Barberton greenstone belt [67]. These subgrain domains show individual diffraction contrast patterns when tilted in the TEM. In the mafic dyke AL1-2 (Figure 5a–c), the subgrains are separated by straight parallel, simply curved, as well as strongly curved low-angle grain boundaries. In the BIF sample AL35-6 (Figure 5d–f), strongly curved boundaries were not detected. Moreover, the microstructures in AL35-6 are characterized by numerous very short individual dislocations (<300 nm), while the arrays of dislocations in AL1-2 are up to 8 µm long. EDX analysis showed that apatite AL1-2 is chlorine-poor, which distinguishes it from the chlorine-rich apatite from the mafic intrusion AL21-2. Furthermore, in some cases, the electron beam caused visible radiation damage, which can be clearly distinguished in the bright field images of the samples AL13 (Figure 4b), AL1-2 (Figure 5c), and AL35-6 (Figure 5e,f).
Different BIF samples contain apatite crystals with various microdomains such as single dislocations (AL10-2, AL13), low-angle grain boundaries (AL35-6), fluid inclusions (AL4-1), pores (AL15B), or Si-rich inclusions (AL10-1, AL15B). Equally, some of the apatite crystals have microdomains free from such features. Two TEM foils lifted out from metachert AL26 have distinctive characteristics: one of them contains abundant fluid inclusions, while the other one has only a few dislocations. Two foils were also cut from the BIF sample AL35-6, for which the TEM results show that the first one contains low-angle grain boundaries, while the second one is free from any dislocations. However, both apatite crystals from which these two TEM foils were lifted out are chlorine-poor, and the contact zones between them and magnetite crystals are filled with sheet silicates.

4.2. Cathodoluminescence Imaging and Spectroscopy

Unlike the TEM, which provides insight into small crystal fragments (20 µm × 10 µm), cathodoluminescence imaging provides overview information on the whole crystals and their microdomain textures. Most of the apatite crystals from Isua show heterogeneous luminescence properties (Figure 6). Patchy crystals display yellow-green-brownish luminescence colors of various shades and intensities. The green CL of hydroxylapatite AL35-6 (BIF) is distinctly different from the rather yellowish CL colors of our other apatite specimens. Some of the crystal areas are relatively homogeneous (e.g., AL10-1, AL1-2), but most have irregular zones of brighter or dull CL emission. The cracks traversing the crystals of hydroxylapatite AL10-2 and AL13 (BIFs) as well as fluorapatite AL8-1 (metacarbonate) display light yellow CL. Such an effect is also visible on the crystal edges of AL10-2.
A broad emission band located in the yellow-green part of the CL spectrum with a peak maximum at 584–593 nm indicates that Mn2+ is the main luminescence activator in Isua apatite (Figure 7 and Figure S2). In CL dark crystal areas (Figure 6), the Mn2+ content might be lower, or this effect might be partially quenched by a heterogeneous distribution of Fe2+ (zones with higher Mn/Fe ratios exhibit brighter CL emission, while low Mn/Fe ratios result in dull or no visible CL [80]). Darker spots in apatite crystals correspond to microinclusions of non-luminescent phases such as graphite (in metacarbonates AL8-1 and AL17), magnetite, or weakly luminescent quartz. Multiple spectra were collected for several crystals in each sample, and they differ mostly in the intensity of the peaks depending on the crystal size and distribution of the luminescence activators. The CL spectra presented in Figure 7 and Figure S2 are representative of each studied specimen and correspond to the analytical spots marked in Figure 6.
The incorporation of even small amounts of Mn2+ in the apatite structure results in a very intense, broad peak in the yellow-green part of the spectrum that may overlap with other types of luminescence centers. The main activation center in BIF AL15B is Mn2+, although small Dy3+ (486 nm and 579 nm) and Sm3+ (704 nm) contributions are also seen in the spectrum (Figure 7). The intensity of the Mn2+ emission in AL15B is also much lower than in spectra from other samples, which is noticeable from the more greenish luminescence colors (Figure 6). The spectrum of BIF AL35-6 (Figure 7) shows a small Mn2+ contribution, clearly revealing overlapping features of other luminescence centers: Dy3+ (at 485 nm and 579 nm), Er3+ (551 nm), Sm3+ (599 nm, 645 nm and 704 nm), and Nd3+ (873 nm) [80,81,82]. Two very weak bands related to Dy3+ (486 nm) and Sm3+ (696 nm) luminescence centers, which do not overlap with the intensive Mn2+ peak, are also visible in the spectra of BIFs AL4-1, AL10-1, and AL13 (Figure S2).

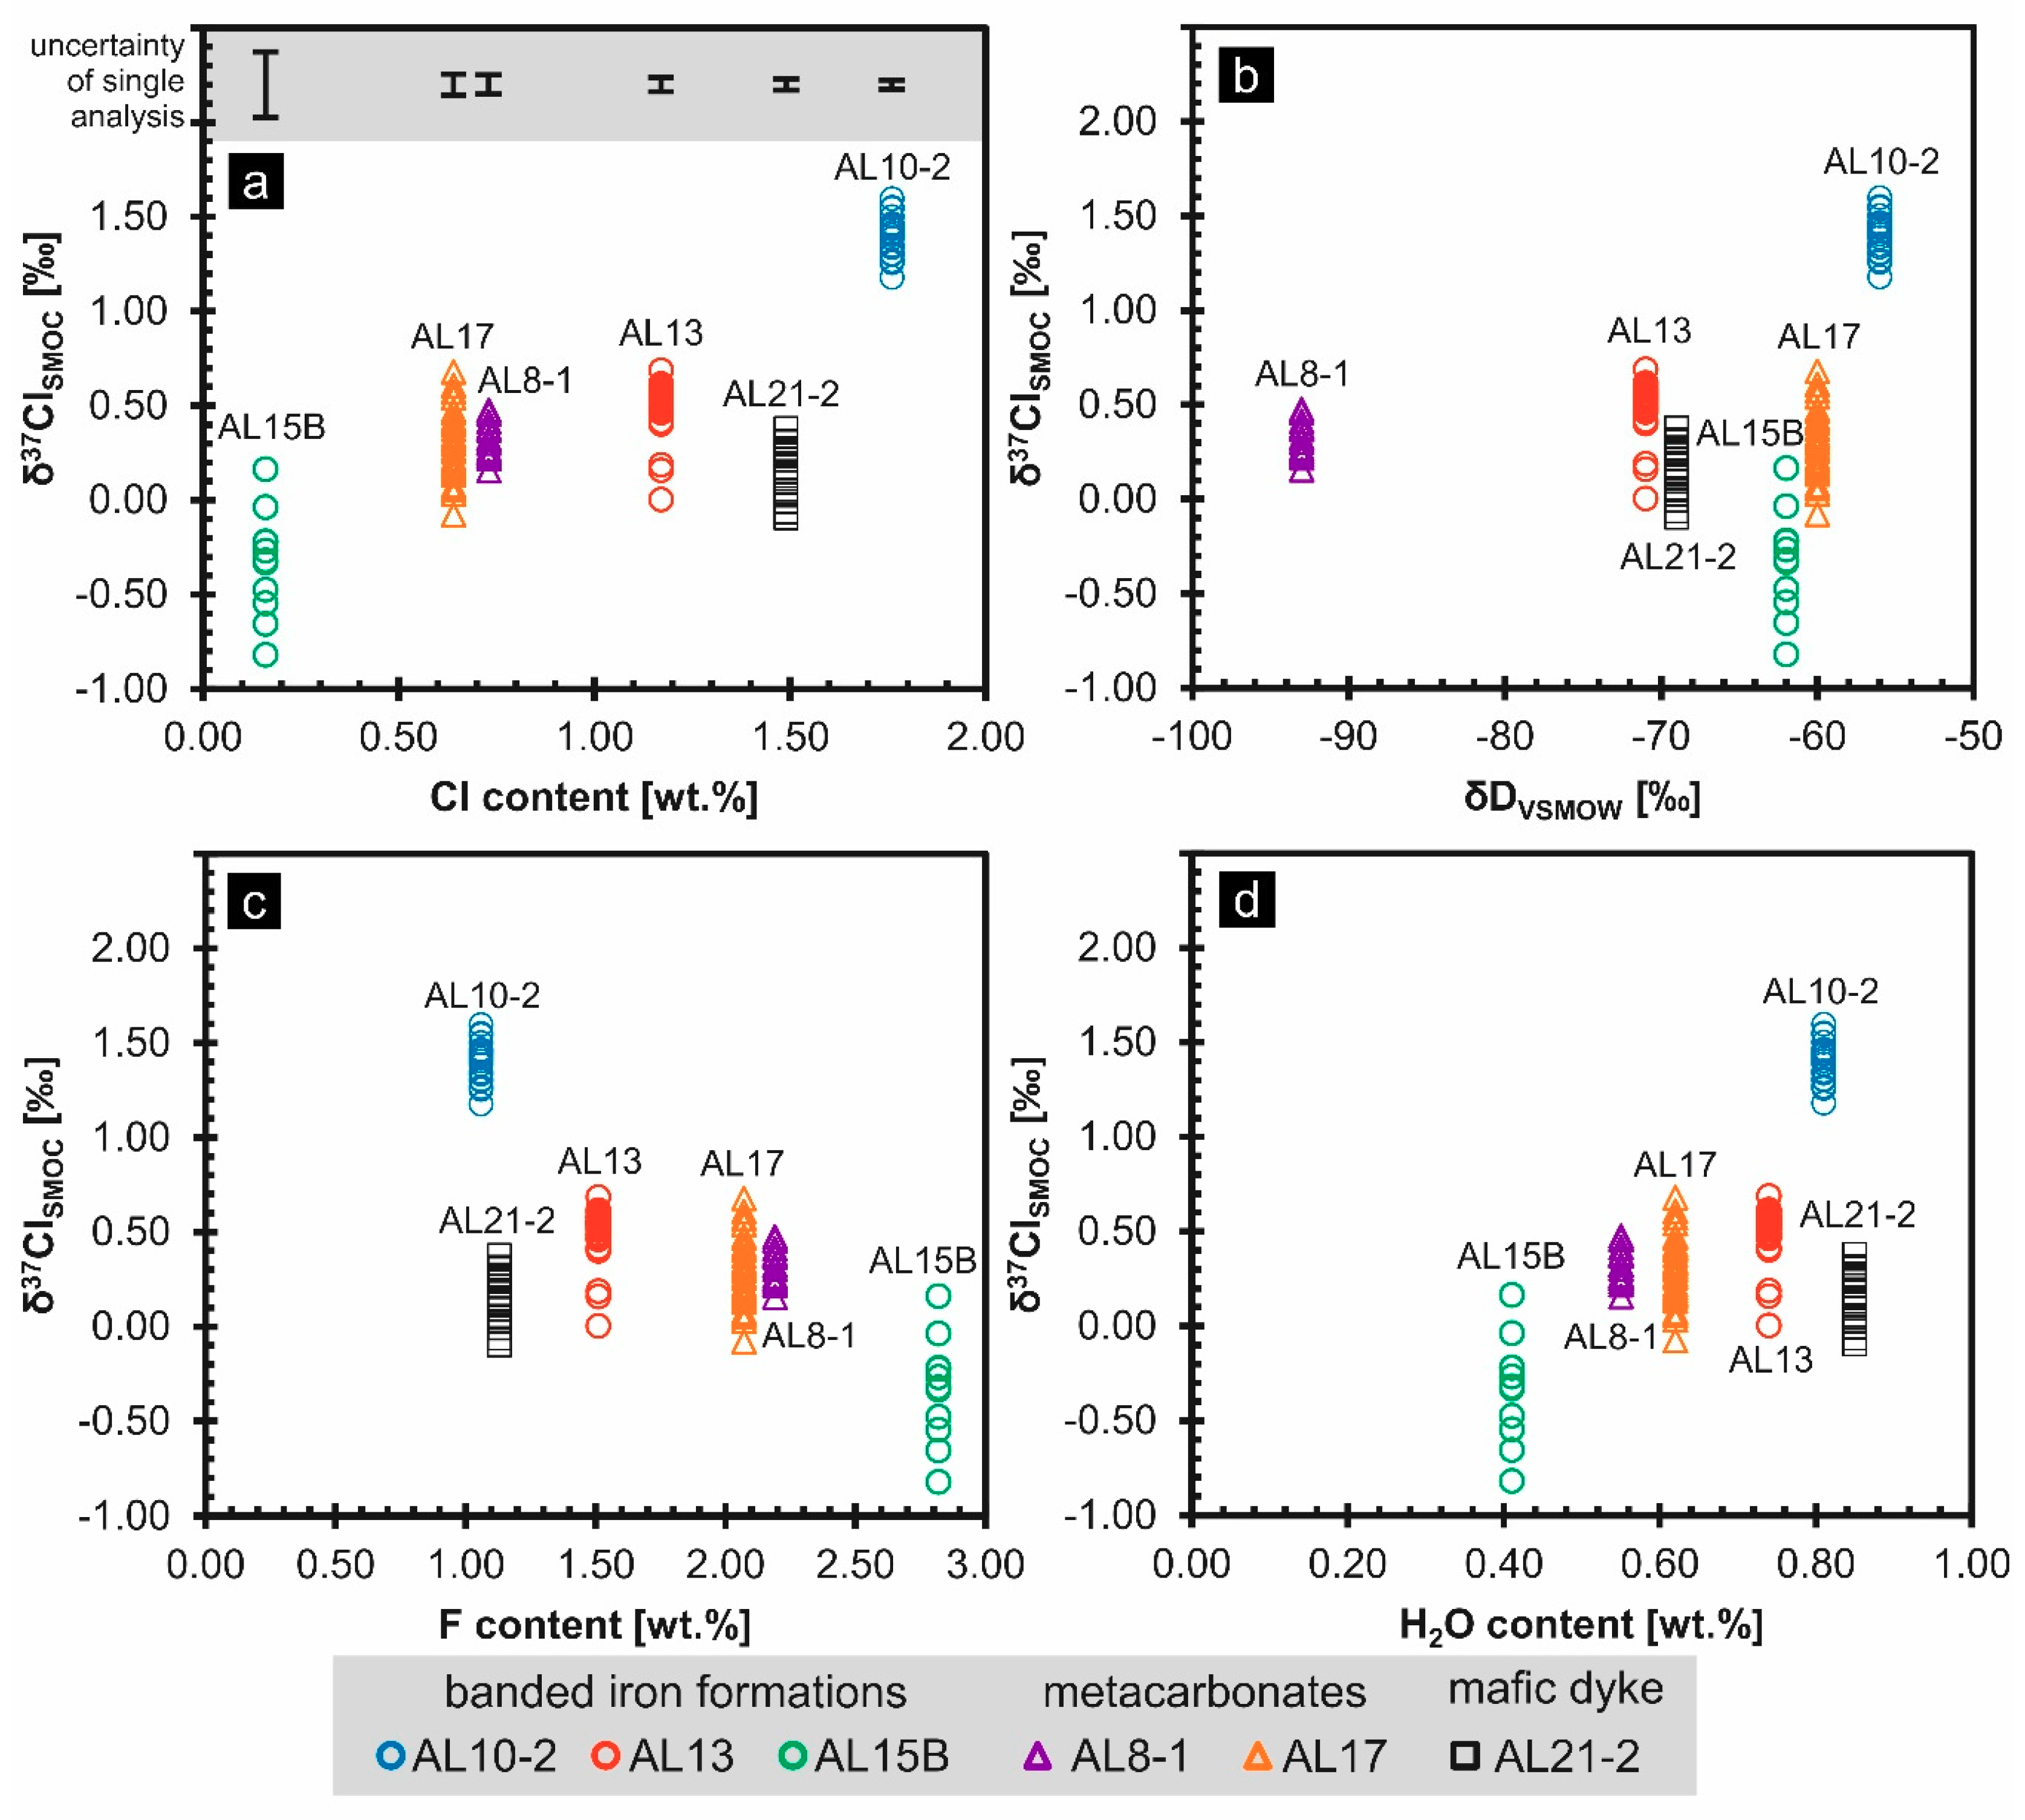
4.3. Secondary Ion Mass Spectrometry

The 37Cl/35Cl ratios for all samples were found to be similar to modern standard mean ocean chloride (Table 3, Table S1, Figure 8) with the most extreme δ37Cl values of −0.82‰ and 1.60‰ determined for two of our BIF samples, AL15B and AL10-2, respectively. The δ37Cl results show correlations with Cl, F, and H2O concentrations in apatite from BIFs and metacarbonates. Higher δ37Cl values were determined in Cl- and OH-enriched samples, while lower δ37Cl values were measured in F-rich crystals. No correlation is found between δ37Cl values and earlier obtained hydrogen isotope compositions determined on the same apatite specimens (Figure 8). Fluorapatite AL15B (BIF) has the largest scatter in its chlorine isotope ratios, which fall between −0.82‰ and 0.16‰. The chlorine isotope compositions of both metacarbonates samples AL8-1 and AL17 are very similar to each other, and they both have an average δ37Cl value ~0.3‰. Hydroxylapatite AL13 has slightly higher δ37Cl values than fluorapatite crystals of AL8-1 and AL17, with the average at ~0.5‰. One crystal having a distinct δ37Cl signature (0.2‰) and enriched in chlorine (1.86 wt %) was identified in AL13 in three spot analyses during two different sessions. Hydroxylapatite from BIF AL10-2 has the most distinctive characteristics in our isotopic investigation. Determined δ37Cl values fall within the range between 1.18‰ and 1.60‰ with a mean value of 1.40‰. Hydroxylapatite AL21-2 from mafic intrusion shows little intra-grain variation, but all the δ37ClSMOC values are within a range between −0.10‰ and 0.38‰. The repeatability of the measurements of the reference materials determined based on IMF factors was between 0.09‰ and 0.26‰ (1 s) in all analytical sessions, which indicates that the variations in δ37Cl in our dataset, although slight, are genuine and they reflect real variations between apatite samples.

5. Discussion

5.1. Micron-Scale Heterogeneity of Isua Apatite Crystals and its Implications for Chlorine Isotope Compositions

The secondary processes affecting Isua apatite are recorded in the microdomains of crystals, as revealed by our TEM and CL data. The types and abundances of microdomains of the crystals do not correlate with their host rocks, and features such as fluid or solid inclusions and pores are heterogeneously distributed in studied apatite crystals. Each TEM foil provides the information from only small crystal domains, and therefore, the collected TEM data could not be fully representative of apatite in studied Isua samples. We conclude that detected microstructures and inclusions should be in most cases interpreted as a sum of different transformation processes influencing Isua metasedimentary rocks or mafic dykes rather than deciphered separately for each sample.
An earlier SEM investigation of fluorapatite from the BIF sample AL15B documented significant porosity [27]. Many nanopores are also visible in HAADF images (Figure 3), both inside a crystal as well as in the contact zone with neighboring amphibole. It has been shown that the development of porosity is often a consequence of mineral replacement processes, and individual pores may have a crystallographic orientation [83,84,85]. Significantly, the pores in AL15B, which take the form of triangular dissolution zones, have a crystallographic orientation. The lack of mineral inclusions filling the pores suggests that they formed during a late stage under modest confining pressure. However, among them there are a few much smaller, elongated (200–300 nm) Si-rich inclusions. Cathodoluminescence imaging further supports our TEM observations showing heterogeneous, porous crystals with both brighter and dull greenish CL.
A different type of internal feature was observed in a TEM investigation of BIF AL35-6 and the mafic dyke AL1-2, which consist of subgrains separated by low-angle grain boundaries, which formed due to the migration (glide and climb) of lattice dislocations. Such low-angle boundaries can either form during crystal growth [86] or due to annealing at elevated temperatures, which activates diffusion-controlled dislocation climb [67]. Abundant, very short dislocations in AL35-6 form distinct intragranular patterns from those observed in AL1-2.
Previous research on porphyry copper deposits containing apatite [70] showed that hydrothermal alteration can change the bright yellow luminescence of apatite to green colors via the mechanism of Mn2+ removal (lower Mn/Fe ratio), and such an effect is coupled with the depletion of Cl, Si, and Na. Our apatite samples AL35-6 and AL15B have greenish luminescence colors and both are chlorine-poor (Table 1). Apatite crystals from the mafic dyke AL1-2 are also depleted in chlorine, but they exhibit more yellowish CL colors and are characterized by a very intensive peak in the CL spectrum corresponding to the Mn2+ activation center. The BIF specimens AL15B and AL35-6 may have been exposed to alteration processes that partially leached out Mn2+. Cherniak [87] showed that the diffusion of Mn2+ in apatite is approximately two orders of magnitude faster than the diffusion of rare earth elements, when coupled substitution mechanisms occur. Therefore, we argue that these secondary processes could have influenced the Mn2+ content in both of these BIF specimens with little or no impact on their REE signatures, which were previously interpreted as reflecting a sedimentary origin for these apatite samples [27].
Fluorapatite AL15B preserves traces of hydrothermal fluid activity in the form of nanoporosity and Si-rich inclusions, which may have led to chlorine depletion. It is possible that the low-angle grain boundaries in AL35-6 are also a result of secondary processes (e.g., annealing at elevated temperatures), which facilitated chlorine loss.
TEM data show that fluid inclusions enriched in Cl are rare in Isua apatite. They have been detected in only two specimens AL4-1 (BIF) and AL26 (metachert), neither of which were used for SIMS δ37Cl determinations. Solid inclusions identified in AL10-1, AL15B (BIFs), and AL21-2 (mafic intrusion) were Si-rich phases without chlorine. Therefore, we assume that the presence of any nanoinclusions would have little or no impact on our SIMS results from AL15B and AL21-2. However, such inclusions are evidence of both fluid activity and the recrystallization of Isua apatite. An Fe and Si-bearing amorphous phase in the mafic dyke AL21-2 is probably a quench product from a fluid inclusion. TEM study of foils lifted out from AL13, AL10-2 (BIFs), AL8-1, and AL17 (metacarbonates) revealed only single dislocations in these four apatite samples.
The heterogeneity of all the studied crystals visible in CL is probably related to Mn2+ loss and/or enrichment in some crystal domains, which is mostly concentrated along fractures or grain boundaries. This further suggests the hydrothermal alteration of all the Isua apatite samples investigated here, and therefore, diverse chlorine isotope signatures should be expected.

5.2. Chlorine Isotope Ratios

Our SIMS results for apatite from the Isua supracrustal belt show only a relatively narrow 2‰ range of δ37Cl values as compared to the variations found in other isotopic systems (e.g., δD) and in the earlier study of metasomatic alteration of Proterozoic apatite by Kusebauch et al. [43] (−1.1‰ to 3.7‰). We observe correlation between chlorine isotope ratios and chlorine content in BIFs and metacarbonates (Figure 8), which is in contrast to the apatite reference materials covering the wide range of F–Cl–OH compositions and yet having similar Cl isotope compositions (Table 3). The extreme δ37Cl values were determined for two BIF samples having 0.16 wt % and 1.76 wt % of Cl. Correlations between δ37Cl values and Cl content have also been noticed for vastly different terrestrial materials: mid-ocean ridge basalts (MORBs), in which high δ37Cl values are related to MORBs highly contaminated by Cl-rich sources (such as seawater), while low δ37Cl values correspond to MORBs with characteristics of uncontaminated mantle-derived magmas [49]. We also observe correlations of δ37Cl values with fluorine and H2O concentrations (Figure 8), but these results are partially related to the mutual substitution of F, Cl, and OH in the apatite structure. The studied apatite crystals are relatively homogeneous in terms of Cl content, while the F and OH components are more variable. This feature may result, to some extent, from the challenging analytical protocol of fluorine determination by EPMA [88], while OH and H2O are calculated based on ideal stoichiometry. However, the most likely cause of heterogeneous F and OH abundances in Isua apatite is the various extent of alteration of single crystals within each rock sample. Volatile elements such as F are very mobile under the influence of secondary alteration and undergo exchange processes more easily than, for example, rare earth elements. The evolution pathways of volatile compositions of Isua apatite are further discussed in Section 5.3.
Hydroxylapatite specimen AL21-2 was previously described as having magmatic origin [27], and the similarity of its chlorine isotopic composition (δ37Cl ~0.2‰) to other previously studied magmatic apatite crystals [43] is consistent with these findings. On the other hand, the mineral composition of the mafic dyke AL21-2 (chlorite, amphibole, and quartz, accompanied by pyrite, apatite, titanite, and zircon [27]) suggests the secondary alteration of the whole rock as chlorite, and abundant quartz could not be the primary component of this mafic intrusion. This may have also involved fluids affecting the δ37Cl signature.
Previous studies of the hydrogen isotope compositions of Isua apatite [27] showed that our two metacarbonate specimens AL17 and AL8-1 have different δD values (60‰ and 93‰, respectively), while the multiple measurements of δ37Cl reported here shows that they have similar chlorine isotope compositions with the average δ37Cl value of ~0.3‰. The fluorapatite in AL17 show more variations than AL8-1, which may be related to the fact that δ37Cl data from AL17 were collected on two different sample mounts. However, these values mostly overlap, and the average δ37Cl determined for two AL17 mounts differ by less than 0.2‰. The different behavior of hydrogen and chlorine isotopes in these two metacarbonate samples can be explained by the fact that hydrogen isotopes readily undergo exchange processes [30]. Hence, the secondary processes that affected Isua apatite crystals may have non-uniformly overprinted their isotopic compositions, resulting in variable δD signatures corresponding to relatively homogenous δ37Cl values of apatite crystals from metacarbonates. It is not clear whether this results from different diffusion mechanisms of hydrogen and chlorine or is due to differences between the lithologies hosting the apatite crystals: AL17—carbonate-rich layer in metachert, AL8-1—carbonate-rich layer in mafic rock. These two specimens were sampled in different areas of the Isua low-strain domain (Figure 1), and therefore may have also been influenced by different fluids causing a variable overprint of the δD signatures. Alternatively, the nature of the fluid-rock interactions may have differed between areas of the Isua belt overprinting these apatite crystals at different geologic times. Accordingly, δD values determined for all other studied apatite specimens [27] show no correlation with the δ37Cl data reported here.
In the earlier study of Wudarska et al. [27], it was concluded that fluorapatite from BIF AL15B experienced volatile (Cl and OH) loss during alteration. Evidence for fluid alteration in AL15B is consistent with the TEM data, which show a rough and porous contact zone with an adjacent amphibole crystal. We conclude that fluorapatite AL15B was altered by fluids, as it contains many nanopores that take the form of triangular dissolution zones. In this way, metasomatic fluids may have affected the chlorine concentration and may also have caused an isotopic overprinting. The sample AL15B has the lowest 37Cl/35Cl ratios of our dataset, while at the same time, it is characterized by the largest range of δ37Cl, spanning between −0.82‰ and 0.16‰, possibly reflecting variable alteration. However, an assessment of our raw data indicates that some of this dispersion results from the background correction on the relatively small ion signal provided to the Faraday cup (only between 0.5 and 2 × 10⁶ ions per second on the 37Cl mass station). AL15B has the lowest Cl content of about 0.16 ± 0.02 wt % (Table 1), causing relatively high internal uncertainty (±0.17‰) of the individual SIMS measurements. The total uncertainty of AL15B analyses was between ±0.13‰ and 0.24‰ (Table S1). Therefore, the interpretation of heterogeneous grain-to-grain variations should be made with caution.
In contrast, the more Cl-enriched samples such as AL8-1 and AL10-2, for which δ37Cl values were determined with a lower total uncertainty of 0.09‰, clearly show variations in Cl isotope compositions. This could be related to the heterogeneous apatite textures observed in CL images. Due to different standards of crystal preparation for CL and SIMS analyses (thin section versus mineral separates embedded in epoxy), it was not possible to confirm this conclusion by conducting isotope measurements in the microdomains identified by CL. The studied Isua apatite crystals do not show any zonation in BSE images. Some of them have inclusions, which are especially abundant in AL17 and AL8-1 (graphite), but a postanalytical investigation of SIMS craters using reflected light optical microscopy allowed the elimination of any data that may have been influenced by inclusions and cracks (Figure S1, Table S1). The little intra-grain variation observed in hydroxylapatite from mafic dyke AL21-2 (e.g, −0.06 to 0.27 in #Ap10; Table S1) may partially result from the analytical uncertainty of ±0.10‰.
Hydroxylapatite AL10-2 from the BIF is our isotopically most distinct specimen, with δ37Cl values falling within the range of 1.18–1.60‰. In the earlier study of Proterozoic apatite by Kusebauch et al. [43], it was concluded that relatively heavy δ37Cl values from 1.1–3.7‰ in OH-replaced chlorapatite represent the δ37Cl values of the hydrothermal fluid. Previous results of a detailed investigation of apatite in AL10-2 (REE distribution patterns, superchondritic Y/Ho ratio and F–Cl–OH composition) have suggested a sedimentary origin for these hydroxylapatite crystals [22,27], and it was concluded that AL10-2 represented the least altered apatite specimen amongst all the Isua samples that have been studied. Modern marine sedimentary apatite is usually chlorine-poor [89,90], but the environment of crystallization in Isua cannot be identified via analogy, as vastly different conditions may have prevailed in the Archean ocean (Cl concentration in Archean seawater may have been 1.65 times higher than that in modern seawater [53,54]). Apatite bearing banded iron formation units developed in an environment influenced by hydrothermal fluids [23], which may have provided a source of chlorine that contributed to apatite formation. Positive Eu anomaly in REE patterns of hydroxylapatite AL10-2 is evidence for hydrothermal input in its crystallization environment [22,27,91,92]. Hydroxylapatite AL13 was previously assigned a metasomatic origin, but its REE pattern is also characterized by a positive Eu anomaly suggestive of a hydrothermal component. The average δ37value of ~0.5‰ for this sample is much lower than expected for hydrothermally altered apatite [43], and can be explained by re-equilibration with fluid (instead of kinetic reaction) shifting δ37Cl toward lower values than a δ37Cl signature for AL10-2. In earlier work, Kusebauch et al. [43] concluded that heterogeneous crystals of OH-replaced primary chlorapatite were affected by various competing fractionation and mixing processes, making interpretation of the δ37Cl data challenging. Similar conclusions can be drawn for Isua apatite, which has undergone extensive alteration since the Archean. Due to the many overlapping secondary processes in Isua operating at variable spatial scales, it is not possible to identify which reactions finally set δ37Cl to the present values. The δ37Cl signature of apatite from BIF AL13 (~0.5‰), which is close to the δ37Cl values determined for the apatite crystals from metacarbonates AL8-1 and AL17 (~0.3‰), suggests an extensive overprint of this BIF rock sample and confirms the earlier classification of AL13, which was made based on REE patterns [22,27]. Assuming that the isotopic fractionation between Cl-bearing phases is more significant in low-temperature processes [40,45,48,49], it is possible that such processes led to the variable δ37Cl signatures of apatite from the studied metasedimentary rocks.

5.3. Evolution Pathways of Volatile Compositions of Isua Apatite

Chlorine isotope ratios can be useful for assessing the extent of metamorphic overprinting. Apatite crystals from AL10-2, AL15B, and AL35-6 were previously shown to have REE signatures and Y/Ho ratios consistent with the Archean ocean, suggesting sedimentary origins [22,27]. Precise δ37Cl measurements could not be conducted in AL35-6 due to the very low chlorine content (<0.09 wt %; see the second paragraph of the Section 3.3.); therefore, the distinction between three apatite specimens AL10-2, AL15B, and AL35-6 would not be possible without complementary data from transmission electron microscopy and cathodoluminescence imaging and spectroscopy. In an earlier study of δD values [27], it was concluded that Isua apatite crystals in BIFs could have been derived either from chlorine-rich (AL10-2) or chlorine-poor (AL35-6) sources, and some of the crystals derived from a chlorine-rich source would have subsequently lost both Cl and OH (e.g., AL15B) due to amphibolite-facies metamorphism and carbonate metasomatism. Experimental studies on apatite replacement processes [85,93,94,95,96] indicate that chlorapatite is more easily replaced by fluorapatite or hydroxylapatite, whereas the replacement of fluorapatite or hydroxylapatite by chlorapatite is less effective. This effect is related to the greater incompatibility of the larger chlorine anion (1.81 Å) as compared to F (1.33 Å) or OH (1.37 Å) within the apatite structure [97,98,99]. Harlov et al. [95] showed that chlorapatite when reacted with only H2O at relatively low temperature and pressure (300 °C, 500 MPa) can be partially replaced by OH-enriched apatite, given enough time. However, when a fluid contains fluorine, then the F ion will be preferentially incorporated into the structure [85]. The present composition (Cl content and isotopes) of AL15B could be a result of a reaction with F-enriched secondary fluid and/or may be partially inherited from the originally Cl-poor protolith. It should be noted that apatite AL15B was hosted by BIF having different mineral compositions dominated by grunerite as compared to other BIF samples. The BIF AL35-6 was sampled in part of the Isua belt apart from the other BIF localities (Figure 1); therefore, it is possible that apatite crystals extracted from this rock originally crystallized from a chlorine-poor source, as predicted by the model for evolution pathways of apatite volatile composition proposed by Wudarska et al. [27]. The low-angle grain boundaries observed in TEM may simply be evidence for the metamorphic overprinting of this BIF.
In a recent study by D’Andres et al. [28], it was concluded that local carbonation of the serpentinites caused halogen (Cl, Br, I) loss and fractionation. Similar conclusions could be drawn for the rock samples studied here, in which carbonate minerals were identified [22,27]. All apatite specimens underwent amphibolite-facies metamorphism and subsequent localized metasomatism, which probably influenced their F–Cl–OH compositions. Taking into consideration all the data covered by this study and earlier research of Wudarska et al. [27] as well as the general trend of the apatite replacement processes (Cl replacement by F and/or OH), we conclude that hydroxylapatite AL10-2 did not remain pristine, but it might be the closest proxy of the volatile-rich phosphate precipitate from the Archean banded iron formation, which has ever been found. The hydroxylapatite replacement of primary chlorapatite is a common process associated with metasomatism in nature [43,100], and therefore, original apatite AL10-2 forming in the Archean could have been more chlorine-enriched. Accordingly, hydroxylapatite AL13, which was previously described as having a metasomatic origin, could have crystallized under similar conditions as AL10-2 and originally had a higher Cl content and different isotopic composition.

6. Conclusions

Here, we have described the first δ37Cl data for the apatite crystals from the early Archean Isua supracrustal belt, SW Greenland. Our investigation of chlorine isotope ratios in apatite combined with data from complementary analytical techniques—REE signatures, F–Cl–OH compositions, and the imaging of crystal microdomains—has shown to provide a more faithful record for overprinted crystals than hydrogen isotope ratios, which more readily undergo exchange processes. Nonetheless, collected δ37Cl data has not preserved the primordial signatures. Absolute δ37Cl values do not point unambiguously to the origin of apatite crystals, but intercomparisons of the Cl ratios in samples from the same geological formation are helpful for understanding the secondary alteration processes that have taken place.
Using δ37Cl values determined by SIMS, we have characterized apatite crystals from the Isua supracrustal belt in detail. High-precision isotope ratio measurements have revealed heterogeneous chlorine isotope compositions of different crystals extracted from individual rock samples as well as different δ37Cl signatures between the investigated BIFs, metacarbonates, and mafic intrusion. However, due to the many overlapping secondary processes that have affected the Isua area, it is not possible to trace back the types, extent, and sequence of these processes based on the chlorine data. Therefore, further geochronological study of Isua apatite is required.

Supplementary Materials

The following are available online at https://www.mdpi.com/2075-163X/10/1/27/s1, Figure S1: BSE and reflected light optical images of the SIMS analytical spots. Figure S2: Cathodoluminescence spectra collected from apatite crystals in BIFs (AL4-1, AL10-1, AL10-2, AL13, AL15B, AL35-6), metachert (AL26), metacarbonate rocks (AL8-1, AL17), and mafic dykes (AL1-2, AL21-2). Table S1: Results of SIMS measurements of chlorine isotopes in apatite from Isua rocks.

Author Contributions

Conceptualization, A.W. and E.S.; validation, A.W. and M.W; formal analysis, A.W. and M.W.; investigation, A.W., E.S., M.W., Ł.B., R.W., J.G., A.L., C.K., I.K.; resources, A.L., E.S., M.W., R.W. and J.G.; writing—original draft preparation, A.W., E.S., M.W., Ł.B., R.W., J.G., A.L., C.K., I.K.; writing—review and editing, A.W., E.S., M.W., Ł.B., R.W., J.G., A.L., C.K. and I.K.; visualization, A.W.; supervision, E.S.; project administration, E.S.; funding acquisition, E.S. and A.W. All authors have read and agreed to the published version of the manuscript.

Funding

This research was funded by the Polish NCN grant no. 2013/11/B/ST10/04753 as well as supported by the COST Action TD 1308 “ORIGINS” and the German Academic Exchange Service (DAAD).

Acknowledgments

We would like to thank Uwe Dittmann for the sample preparation, Frédéric Couffignal for SIMS analyses, Anja Schreiber for FIB milling work, Anna Zagórska for her assistance in mineral separation, and Adam Sarafian for providing the reference material for SIMS analyses. We are also grateful to Andreas Massanek from TU Bergakademie Freiberg for providing apatite samples for the reference materials development as well as to Jaime Barnes, Magali Bonifacie, and Neil Sturchio for their crucial contribution in characterizing the reference materials by GS-IRMS. We would like to thank the editorial team and the reviewers for their suggestions and comments, which helped us to improve the quality of the manuscript.

Conflicts of Interest

The authors declare no conflict of interest.

References

  1. Black, L.P.; Gale, N.H.; Moorbath, S.; Pankhurst, R.J.; McGregor, V.R. Isotopic dating of very early Precambrian amphibolite facies gneisses from the Godthaab district, West Greenland. Earth Planet. Sci. Lett. 1971, 12, 245–259. [Google Scholar]
  2. Moorbath, S.; O’nions, R.K.; Pankhurst, R.J. Early Archaean age for the Isua iron formation, West Greenland. Nature 1973, 245, 138–139. [Google Scholar] [CrossRef]
  3. Frei, R.; Rosing, M.T.; Waight, T.E.; Ulfbeck, D.G. Hydrothermal-metasomatic and tectono-metamorphic processes in the Isua supracrustal belt (West Greenland): A multi-isotopic investigation of their effects on the Earth’s oldest oceanic crustal sequence. Geochim. Cosmochim. Acta 2002, 66, 467–486. [Google Scholar] [CrossRef]
  4. Schidlowski, M.; Appel, P.W.U.; Eichmann, R.; Junge, C.E. Carbon isotope geochemistry of the 3.7 × 10⁹-yr-old Isua sediments, West Greenland: Implications for the Archaean carbon and oxygen cycles. Geochim. Cosmochim. Acta 1979, 43, 189–199. [Google Scholar] [CrossRef]
  5. Mojzsis, S.J.; Arrhenius, G.; McKeegan, K.D.; Harrison, T.M.; Nutman, A.P.; Friend, C.R.L. Evidence for life on Earth before 3800 million years ago. Nature 1996, 384, 55. [Google Scholar] [CrossRef] [PubMed]
  6. Rosing, M.T.; Rose, N.M.; Bridgwater, D.; Thomsen, H.S. Earliest part of Earth’s stratigraphic record: A reappraisal of the >3.7 Ga Isua (Greenland) supracrustal sequence. Geology 1996, 24, 43–46. [Google Scholar] [CrossRef]
  7. Ueno, Y.; Yurimoto, H.; Yoshioka, H.; Komiya, T.; Maruyama, S. Ion microprobe analysis of graphite from ca. 3.8 Ga metasediments, Isua supracrustal belt, West Greenland: Relationship between metamorphism and carbon isotopic composition. Geochim. Cosmochim. Acta 2002, 66, 1257–1268. [Google Scholar] [CrossRef]
  8. van Zuilen, M.A.; Lepland, A.; Teranes, J.; Finarelli, J.; Wahlen, M.; Arrhenius, G. Graphite and carbonates in the 3.8 Ga old Isua supracrustal belt, southern West Greenland. Precambrian Res. 2003, 126, 331–348. [Google Scholar] [CrossRef]
  9. Lepland, A.; van Zuilen, M.A.; Arrhenius, G.; Whitehouse, M.J.; Fedo, C.M. Questioning the evidence for Earth’s earliest life—Akilia revisited. Geology 2005, 33, 77–79. [Google Scholar] [CrossRef]
  10. Craddock, P.R.; Dauphas, N. Iron and carbon isotope evidence for microbial iron respiration throughout the Archean. Earth Planet. Sci. Lett. 2011, 303, 121–132. [Google Scholar] [CrossRef]
  11. Ohtomo, Y.; Kakegawa, T.; Ishida, A.; Nagase, T.; Rosing, M.T. Evidence for biogenic graphite in early Archaean Isua metasedimentary rocks. Nat. Geosci. 2014, 7, 25. [Google Scholar] [CrossRef]
  12. Yoshiya, K.; Sawaki, Y.; Hirata, T.; Maruyama, S.; Komiya, T. In-situ iron isotope analysis of pyrites in ~3.7 Ga sedimentary protoliths from the Isua supracrustal belt, southern West Greenland. Chem. Geol. 2015, 401, 126–139. [Google Scholar] [CrossRef]
  13. Nutman, A.P.; Bennett, V.C.; Friend, C.R.L.; Van Kranendonk, M.J.; Chivas, A.R. Rapid emergence of life shown by discovery of 3700-million-year-old microbial structures. Nature 2016, 537, 535. [Google Scholar] [CrossRef] [PubMed] [Green Version]
  14. Hassenkam, T.; Andersson, M.P.; Dalby, K.N.; Mackenzie, D.M.A.; Rosing, M.T. Elements of Eoarchean life trapped in mineral inclusions. Nature 2017, 548, 78. [Google Scholar] [CrossRef] [PubMed]
  15. Allwood, A.C.; Rosing, M.T.; Flannery, D.T.; Hurowitz, J.A.; Heirwegh, C.M. Reassessing evidence of life in 3700-million-year-old rocks of Greenland. Nature 2018, 563, 241. [Google Scholar] [CrossRef]
  16. Nutman, A.P.; Bennett, V.C.; Friend, C.R.L.; Van Kranendonk, M.J.; Rothacker, L.; Chivas, A.R. Cross-examining Earth’s oldest stromatolites: Seeing through the effects of heterogeneous deformation, metamorphism and metasomatism affecting Isua (Greenland) similar to 3700 Ma sedimentary rocks. Precambrian Res. 2019, 331, 105347. [Google Scholar] [CrossRef]
  17. Dodd, M.S.; Papineau, D.; She, Z.-B.; Manikyamba, C.; Wan, Y.-S.; O’Neil, J.; Karhu, J.A.; Rizo, H.; Pirajno, F. Widespread occurrences of variably crystalline 13C-depleted graphitic carbon in banded iron formations. Earth Planet. Sci. Lett. 2019, 512, 163–174. [Google Scholar] [CrossRef] [Green Version]
  18. Whitehouse, M.J.; Dunkley, D.J.; Kusiak, M.A.; Wilde, S.A. On the true antiquity of Eoarchean chemofossils—Assessing the claim for Earth’s oldest biogenic graphite in the Saglek Block of Labrador. Precambrian Res. 2019, 323, 70–81. [Google Scholar] [CrossRef]
  19. Tashiro, T.; Ishida, A.; Hori, M.; Igisu, M.; Koike, M.; Méjean, P.; Takahata, N.; Sano, Y.; Komiya, T. Early trace of life from 3.95 Ga sedimentary rocks in Labrador, Canada. Nature 2017, 549, 516. [Google Scholar] [CrossRef]
  20. Appel, P.W.U.; Fedo, C.M.; Moorbath, S.; Myers, J.S. Recognizable primary volcanic and sedimentary features in a low-strain domain of the highly deformed, oldest known (~3.7–3.8 Gyr) Greenstone Belt, Isua, West Greenland. Terra Nova 1998, 10, 57–62. [Google Scholar] [CrossRef]
  21. Appel, P.W.U.; Rollinson, H.R.; Touret, J.L.R. Remnants of an early Archaean (>3.75 Ga) sea-floor, hydrothermal system in the Isua Greenstone Belt. Precambrian Res. 2001, 112, 27–49. [Google Scholar] [CrossRef]
  22. Lepland, A.; Arrhenius, G.; Cornell, D. Apatite in early Archean Isua supracrustal rocks, southern West Greenland: Its origin, association with graphite and potential as a biomarker. Precambrian Res. 2002, 118, 221–241. [Google Scholar] [CrossRef]
  23. Klein, C. Some Precambrian banded iron-formations (BIFs) from around the world: Their age, geologic setting, mineralogy, metamorphism, geochemistry, and origins. Am. Mineral. 2005, 90, 1473–1499. [Google Scholar] [CrossRef]
  24. Frei, R.; Polat, A. Source heterogeneity for the major components of ~3.7 Ga Banded Iron Formations (Isua Greenstone Belt, Western Greenland): Tracing the nature of interacting water masses in BIF formation. Earth Planet. Sci. Lett. 2007, 253, 266–281. [Google Scholar] [CrossRef]
  25. Pope, E.C.; Bird, D.K.; Rosing, M.T. Isotope composition and volume of Earth’s early oceans. Proc. Natl. Acad. Sci. USA 2012, 109, 4371–4376. [Google Scholar] [CrossRef] [Green Version]
  26. Aoki, S.; Kabashima, C.; Kato, Y.; Hirata, T.; Komiya, T. Influence of contamination on banded iron formations in the Isua supracrustal belt, West Greenland: Reevaluation of the Eoarchean seawater compositions. Geosci. Front. 2018, 9, 1049–1072. [Google Scholar] [CrossRef]
  27. Wudarska, A.; Wiedenbeck, M.; Słaby, E.; Lepland, A.; Birski, Ł.; Simon, K. Halogen chemistry and hydrogen isotopes of apatite from the >3.7 Ga Isua supracrustal belt, SW Greenland. Precambrian Res. 2018, 310, 153–164. [Google Scholar] [CrossRef]
  28. D’Andres, J.; Kendrick, M.A.; Bennett, V.C.; Nutman, A.P. Halogens in serpentinites from the Isua supracrustal belt, Greenland: An Eoarchean seawater signature and biomass proxy? Geochim. Cosmochim. Acta 2019, 262, 31–59. [Google Scholar] [CrossRef]
  29. Nishizawa, M.; Takahata, N.; Terada, K.; Komiya, T.; Ueno, Y.; Sano, Y. Rare-earth element, lead, carbon, and nitrogen geochemistry of apatite-bearing metasediments from the ~3.8 Ga Isua Supracrustal Belt, West Greenland. Int. Geol. Rev. 2005, 47, 952–970. [Google Scholar] [CrossRef]
  30. Higashi, Y.; Itoh, S.; Hashiguchi, M.; Sakata, S.; Hirata, T.; Watanabe, K.; Sakaguchi, I. Hydrogen diffusion in the apatite-water system: Fluorapatite parallel to the c-axis. Geochem. J. 2017, 51, 115–122. [Google Scholar] [CrossRef]
  31. Brenan, J. Kinetics of fluorine, chlorine and hydroxyl exchange in fluorapatite. Chem. Geol. 1993, 110, 195–210. [Google Scholar] [CrossRef]
  32. Sharp, Z.D.; Shearer, C.K.; McKeegan, K.D.; Barnes, J.D.; Wang, Y.Q. The chlorine isotope composition of the moon and implications for an anhydrous mantle. Science 2010, 329, 1050–1053. [Google Scholar] [CrossRef] [PubMed] [Green Version]
  33. Tartèse, R.; Anand, M.; Joy, K.H.; Franchi, I.A. H and Cl isotope systematics of apatite in brecciated lunar meteorites Northwest Africa 4472, Northwest Africa 773, Sayh al Uhaymir 169, and Kalahari 009. Meteorit. Planet. Sci. 2014, 49, 2266–2289. [Google Scholar] [CrossRef]
  34. Treiman, A.H.; Boyce, J.W.; Gross, J.; Guan, Y.; Eiler, J.M.; Stolper, E.M. Phosphate-halogen metasomatism of lunar granulite 79215: Impact-induced fractionation of volatiles and incompatible elements. Am. Mineral. 2014, 99, 1860–1870. [Google Scholar] [CrossRef]
  35. Boyce, J.W.; Treiman, A.H.; Guan, Y.; Ma, C.; Eiler, J.M.; Gross, J.; Greenwood, J.P.; Stolper, E.M. The chlorine isotope fingerprint of the lunar magma ocean. Sci. Adv. 2015, 1, e1500380. [Google Scholar] [CrossRef] [Green Version]
  36. Potts, N.J.; Barnes, J.J.; Tartèse, R.; Franchi, I.A.; Anand, M. Chlorine isotopic compositions of apatite in Apollo 14 rocks: Evidence for widespread vapor-phase metasomatism on the lunar nearside ~4 billion years ago. Geochim. Cosmochim. Acta 2018, 230, 46–59. [Google Scholar] [CrossRef] [Green Version]
  37. Wang, Y.; Hsu, W.; Guan, Y. An extremely heavy chlorine reservoir in the Moon: Insights from the apatite in lunar meteorites. Sci. Rep. 2019, 9, 5727. [Google Scholar] [CrossRef] [Green Version]
  38. Sharp, Z.; Williams, J.; Shearer, C.; Agee, C.; McKeegan, K. The chlorine isotope composition of Martian meteorites 2. Implications for the early solar system and the formation of Mars. Meteorit. Planet. Sci. 2016, 51, 2111–2126. [Google Scholar] [CrossRef] [Green Version]
  39. Bellucci, J.J.; Whitehouse, M.J.; John, T.; Nemchin, A.A.; Snape, J.F.; Bland, P.A.; Benedix, G.K. Halogen and Cl isotopic systematics in Martian phosphates: Implications for the Cl cycle and surface halogen reservoirs on Mars. Earth Planet. Sci. Lett. 2017, 458, 192–202. [Google Scholar] [CrossRef] [Green Version]
  40. John, T.; Layne, G.D.; Haase, K.M.; Barnes, J.D. Chlorine isotope evidence for crustal recycling into the Earth’s mantle. Earth Planet. Sci. Lett. 2010, 298, 175–182. [Google Scholar] [CrossRef]
  41. Barnes, J.D.; Sharp, Z.D. Chlorine isotope geochemistry. Rev. Mineral. Geochem. 2017, 82, 345–378. [Google Scholar] [CrossRef]
  42. Morton, R.D.; Catanzaro, E.J. Stable chlorine isotope abundances in apatites from Ødegårdens verk, Norway. Nor. Geol. Tidsskr. 1964, 44, 307–313. [Google Scholar]
  43. Kusebauch, C.; John, T.; Whitehouse, M.J.; Engvik, A.K. Apatite as probe for the halogen composition of metamorphic fluids (Bamble Sector, SE Norway). Contrib. Mineral. Petrol. 2015, 170, 34. [Google Scholar] [CrossRef]
  44. Eggenkamp, H. The Geochemistry of Stable Chlorine and Bromine Isotopes; Springer: Berlin/Heidelberg, Germany, 2014; pp. 1–172. [Google Scholar]
  45. Schauble, E.A.; Rossman, G.R.; Taylor, H.P., Jr. Theoretical estimates of equilibrium chlorine-isotope fractionations. Geochim. Cosmochim. Acta 2003, 67, 3267–3281. [Google Scholar] [CrossRef]
  46. Sharp, Z.D.; Barnes, J.D.; Fischer, T.P.; Halick, M. An experimental determination of chlorine isotope fractionation in acid systems and applications to volcanic fumaroles. Geochim. Cosmochim. Acta 2010, 74, 264–273. [Google Scholar] [CrossRef]
  47. Kusebauch, C.; John, T.; Barnes, J.D.; Klügel, A.; Austrheim, H.O. Halogen element and stable chlorine isotope fractionation caused by fluid—Rock interaction (Bamble Sector, SE Norway). J. Petrol. 2015, 56, 299–324. [Google Scholar] [CrossRef] [Green Version]
  48. Barnes, J.D.; Selverstone, J.; Sharp, Z.D. Chlorine isotope chemistry of serpentinites from Elba, Italy, as an indicator of fluid source and subsequent tectonic history. Geochem. Geophys. Geosyst. 2006, 7. [Google Scholar] [CrossRef]
  49. Bonifacie, M.; Jendrzejewski, N.; Agrinier, P.; Humler, E.; Coleman, M.; Javoy, M. The chlorine isotope composition of Earth’s mantle. Science 2008, 319, 1518–1520. [Google Scholar] [CrossRef] [Green Version]
  50. Sarafian, A.R.; John, T.; Roszjar, J.; Whitehouse, M.J. Chlorine and hydrogen degassing in Vesta’s magma ocean. Earth Planet. Sci. Lett. 2017, 459, 311–319. [Google Scholar] [CrossRef] [Green Version]
  51. Sharp, Z.D.; Mercer, J.A.; Jones, R.H.; Brearley, A.J.; Selverstone, J.; Bekker, A.; Stachel, T. The chlorine isotope composition of chondrites and Earth. Geochim. Cosmochim. Acta 2013, 107, 189–204. [Google Scholar] [CrossRef]
  52. Knauth, L.P. Salinity history of the Earth’s early ocean. Nature 1998, 395, 554. [Google Scholar] [CrossRef] [PubMed]
  53. De Ronde, C.E.; Channer, D.M.; Faure, K.; Bray, C.J.; Spooner, E.T. Fluid chemistry of Archean seafloor hydrothermal vents: Implications for the composition of circa 3.2 Ga seawater. Geochim. Cosmochim. Acta 1997, 61, 4025–4042. [Google Scholar] [CrossRef]
  54. Pinti, D.L. The origin and evolution of the oceans. In Lectures in Astrobiology; Springer: Berlin/Heidelberg, Germany, 2005; pp. 83–112. [Google Scholar]
  55. Nutman, A.P. The early Archaean to Proterozoic history of the Isukasia area, southern West Greenland. Bull. Gronl. Geol. Unders. 1986, 154, 55–68. [Google Scholar]
  56. Komiya, T.; Maruyama, S.; Masuda, T.; Nohda, S.; Hayashi, M.; Okamoto, K. Plate tectonics at 3.8–3.7 Ga: Field evidence from the Isua accretionary complex, southern West Greenland. J. Geol. 1999, 107, 515–554. [Google Scholar] [CrossRef]
  57. Myers, J.S. Protoliths of the 3.8–3.7 Ga Isua greenstone belt, west Greenland. Precambrian Res. 2001, 105, 129–141. [Google Scholar] [CrossRef]
  58. Nutman, A.P.; Friend, C.R.L. New 1: 20,000 scale geological maps, synthesis and history of investigation of the Isua supracrustal belt and adjacent orthogneisses, southern West Greenland: A glimpse of Eoarchaean crust formation and orogeny. Precambrian Res. 2009, 172, 189–211. [Google Scholar] [CrossRef]
  59. Rollinson, H. The metamorphic history of the Isua greenstone belt, West Greenland. Geol. Soc. Lond. Spec. Publ. 2002, 199, 329–350. [Google Scholar] [CrossRef]
  60. Rollinson, H. Metamorphic history suggested by garnet-growth chronologies in the Isua Greenstone Belt, West Greenland. Precambrian Res. 2003, 126, 181–196. [Google Scholar] [CrossRef]
  61. Hayashi, M.; Komiya, T.; Nakamura, Y.; Maruyama, S. Archean regional metamorphism of the Isua supracrustal belt, southern West Greenland: Implications for a driving force for Archean plate tectonics. Int. Geol. Rev. 2000, 42, 1055–1115. [Google Scholar] [CrossRef]
  62. Komiya, T.; Hayashi, M.; Maruyama, S.; Yurimoto, H. Intermediate-P/T type Archean metamorphism of the Isua supracrustal belt: Implications for secular change of geothermal gradients at subduction zones and for Archean plate tectonics. Am. J. Sci. 2002, 302, 806–826. [Google Scholar] [CrossRef]
  63. Arai, T.; Omori, S.; Komiya, T.; Maruyama, S. Intermediate P/T-type regional metamorphism of the Isua Supracrustal Belt, southern west Greenland: The oldest Pacific-type orogenic belt? Tectonophysics 2015, 662, 22–39. [Google Scholar] [CrossRef]
  64. Nutman, A.P.; Hagiya, H.; Maruyama, S. SHRIMP U-Pb single zircon geochronology of a Proterozoic mafic dyke, Isukasia, southern West Greenland. Bull. Geol. Soc. Den. 1995, 42, 17–22. [Google Scholar]
  65. White, R.V.; Crowley, J.L.; Myers, J.S. Earth’s oldest well-preserved mafic dyke swarms in the vicinity of the Isua greenstone belt, southern West Greenland. Geol. Greenl. Surv. Bull. 2000, 186, 65–72. [Google Scholar]
  66. Komiya, T. Geochemistry of the oldest MORB and OIB of the World, Isua (3.8 Ga), Greenland. EOS Trans. 1995, 76, 700. [Google Scholar]
  67. Birski, Ł.; Wirth, R.; Słaby, E.; Wudarska, A.; Lepland, A.; Hofmann, A.; Schreiber, A. (Ca-Y)-phosphate inclusions in apatite crystals from Archean rocks from the Barberton Greenstone Belt and Pilbara Craton: First report of natural occurrence. Am. Mineral. 2018, 103, 307–313. [Google Scholar] [CrossRef]
  68. Birski, Ł.; Słaby, E.; Wirth, R.; Koch-Müller, M.; Simon, K.; Wudarska, A.; Götze, J.; Lepland, A.; Hofmann, A.; Kuras, A. Archaean phosphates: A case study of transformation processes in apatite from the Barberton greenstone belt. Contrib. Mineral. Petrol. 2019, 174, 25. [Google Scholar] [CrossRef] [Green Version]
  69. Harlov, D.E. Apatite: A fingerprint for metasomatic processes. Elements 2015, 11, 171–176. [Google Scholar] [CrossRef]
  70. Bouzari, F.; Hart, C.J.R.; Bissig, T.; Barker, S. Hydrothermal alteration revealed by apatite luminescence and chemistry: A potential indicator mineral for exploring covered porphyry copper deposits. Econ. Geol. 2016, 111, 1397–1410. [Google Scholar] [CrossRef] [Green Version]
  71. Słaby, E.; Gros, K.; Förster, H.-J.; Wudarska, A.; Birski, Ł.; Hamada, M.; Götze, J.; Martin, H.; Jayananda, M.; Moyen, J.-F.; et al. Mineral–fluid interactions in the late Archean Closepet granite batholith, Dharwar Craton, southern India. Geol. Soc. Lond. Spec. Publ. 2019, 489, SP489–SP2019. [Google Scholar] [CrossRef]
  72. Wirth, R. Focused Ion Beam (FIB) A novel technology for advanced application of micro-and nanoanalysis in geosciences and applied mineralogy. Eur. J. Mineral. 2004, 16, 863–876. [Google Scholar] [CrossRef] [Green Version]
  73. Wirth, R. Focused Ion Beam (FIB) combined with SEM and TEM: Advanced analytical tools for studies of chemical composition, microstructure and crystal structure in geomaterials on a nanometre scale. Chem. Geol. 2009, 261, 217–229. [Google Scholar] [CrossRef]
  74. Neuser, R.D.; Bruhn, F.; Götze, J.; Habermann, D.; Richter, D.K. Kathodolumineszenz: Methodik und anwendung. Z. Geol. Paläontol. Teil I H 1995, 1, 287–306. [Google Scholar]
  75. McCubbin, F.M.; Hauri, E.H.; Elardo, S.M.; Vander Kaaden, K.E.; Wang, J.; Shearer, C.K., Jr. Hydrous melting of the martian mantle produced both depleted and enriched shergottites. Geology 2012, 40, 683–686. [Google Scholar] [CrossRef]
  76. Sarafian, A.R. Personal Communication; Woods Hole Oceanographic Institution: Woods Hole, MA, USA, 2016. [Google Scholar]
  77. Wudarska, A.; Słaby, E.; Wiedenbeck, M.; Barnes, J.D.; Bonifacie, M.; Sturchio, N.C.; Couffignal, F.; Glodny, J.; John, T.; Kusebauch, C.; et al. Inter-Laboratory Characterization of Apatite Reference Materials for Chlorine Isotope Analysis. Manuscript in preparation.
  78. Xiao, Y.K.; Yinming, Z.; Qingzhong, W.; Haizhen, W.; Weiguo, L.; Eastoe, C.J. A secondary isotopic reference material of chlorine from selected seawater. Chem. Geol. 2002, 182, 655–661. [Google Scholar] [CrossRef]
  79. Wei, H.-Z.; Jiang, S.-Y.; Xiao, Y.-K.; Wang, J.; Lu, H.; Wu, B.; Wu, H.-P.; Li, Q.; Luo, C.-G. Precise determination of the absolute isotopic abundance ratio and the atomic weight of chlorine in three international reference materials by the positive thermal ionization mass spectrometer-Cs2Cl+-graphite method. Anal. Chem. 2012, 84, 10350–10358. [Google Scholar] [CrossRef] [PubMed]
  80. Kempe, U.; Götze, J. Cathodoluminescence (CL) behaviour and crystal chemistry of apatite from rare-metal deposits. Mineral. Mag. 2002, 66, 151–172. [Google Scholar] [CrossRef]
  81. Gaft, M.; Reisfeld, R.; Panczer, G.; Blank, P.; Boulon, G. Laser-induced time-resolved luminescence of minerals. Spectrochim. Acta Part A Mol. Biomol. Spectrosc. 1998, 54, 2163–2175. [Google Scholar] [CrossRef]
  82. Blanc, P.; Baumer, A.; Cesbron, F.; Ohnenstetter, D.; Panczer, G.; Rémond, G. Systematic cathodoluminescence spectral analysis of synthetic doped minerals: Anhydrite, apatite, calcite, fluorite, scheelite and zircon. In Cathodoluminescence in Geosciences; Springer: Berlin/Heidelberg, Germany, 2000; pp. 127–160. [Google Scholar]
  83. Putnis, A. Mineral replacement reactions: From macroscopic observations to microscopic mechanisms. Mineral. Mag. 2002, 66, 689–708. [Google Scholar] [CrossRef]
  84. Putnis, A. Mineral replacement reactions. Rev. Mineral. Geochem. 2009, 70, 87–124. [Google Scholar] [CrossRef]
  85. Kusebauch, C.; John, T.; Whitehouse, M.J.; Klemme, S.; Putnis, A. Distribution of halogens between fluid and apatite during fluid-mediated replacement processes. Geochim. Cosmochim. Acta 2015, 170, 225–246. [Google Scholar] [CrossRef]
  86. Brès, E.F.; Hutchison, J.L.; Voegel, J.-C.; Frank, R.M. Observation of a low angle grain boundary in tooth enamel crystals using HREM. Le J. Phys. Colloq. 1990, 51, C1-97. [Google Scholar] [CrossRef]
  87. Cherniak, D.J. Uranium and manganese diffusion in apatite. Chem. Geol. 2005, 219, 297–308. [Google Scholar] [CrossRef]
  88. Stormer, J.C.; Pierson, M.L.; Tacker, R.C. Variation of F and Cl X-ray intensity due to anisotropic diffusion in apatite during electron microprobe analysis. Am. Mineral. 1993, 78, 641–648. [Google Scholar]
  89. Gulbrandsen, R.A. Physical and chemical factors in the formation of marine apatite. Econ. Geol. 1969, 64, 365–382. [Google Scholar] [CrossRef]
  90. Krajewski, K.P.; van Cappellen, P.; Trichet, J.; Kuhn, O.; Lucas, J.; Martin-Algarra, A.; Prevot, L.; Tewari, V.C.; Gaspar, L.; Knight, R.I.; et al. Biological processes and apatite formation in sedimentary environments. Eclogae Geol. Helv. 1994, 87, 701–746. [Google Scholar]
  91. Ayers, J.C.; Watson, E.B. Apatite/fluid partitioning of rare-earth elements and strontium: Experimental results at 1.0 GPa and 1000 °C and application to models of fluid-rock interaction. Chem. Geol. 1993, 110, 299–314. [Google Scholar] [CrossRef]
  92. Chu, M.-F.; Wang, K.-L.; Griffin, W.L.; Chung, S.-L.; O’Reilly, S.Y.; Pearson, N.J.; Iizuka, Y. Apatite composition: Tracing petrogenetic processes in Transhimalayan granitoids. J. Petrol. 2009, 50, 1829–1855. [Google Scholar] [CrossRef]
  93. Rendon-Angeles, J.C.; Yanagisawa, K.; Ishizawa, N.; Oishi, S. Conversion of calcium fluorapatite into calcium hydroxyapatite under alkaline hydrothermal conditions. J. Solid State Chem. 2000, 151, 65–72. [Google Scholar] [CrossRef]
  94. Rendon-Angeles, J.C.; Yanagisawa, K.; Ishizawa, N.; Oishi, S. Effect of metal ions of chlorapatites on the topotaxial replacement by hydroxyapatite under hydrothermal conditions. J. Solid State Chem. 2000, 154, 569–578. [Google Scholar] [CrossRef]
  95. Harlov, D.E.; Forster, H.-J.; Nijland, T.G. Fluid-induced nucleation of (Y+REE)-phosphate minerals within apatite: Nature and experiment. Part I. Chlorapatite. Am. Mineral. 2002, 87, 245–261. [Google Scholar] [CrossRef]
  96. Harlov, D.E.; Forster, H.-J. Fluid-induced nucleation of (Y+REE)-phosphate minerals within apatite: Nature and experiment. Part II. Fluorapatite. Am. Mineral. 2003, 88, 1209–1229. [Google Scholar] [CrossRef]
  97. Elliott, J.C. Structure and Chemistry of the Apatites and other Calcium Orthophosphates; Elsevier: Amsterdam, The Netherland, 1994; pp. 1–389. [Google Scholar]
  98. Hughes, J.M.; Harlov, D.; Kelly, S.R.; Rakovan, J.; Wilke, M. Solid solution in the apatite OH-Cl binary system: Compositional dependence of solid-solution mechanisms in calcium phosphate apatites along the Cl-OH binary. Am. Mineral. 2016, 101, 1783–1791. [Google Scholar] [CrossRef]
  99. Hughes, J.M.; Harlov, D.; Rakovan, J.F. Structural variations along the apatite F-OH join. Am. Mineral. 2018, 103, 1981–1987. [Google Scholar] [CrossRef]
  100. Marks, M.A.W.; Wenzel, T.; Whitehouse, M.J.; Loose, M.; Zack, T.; Barth, M.; Worgard, L.; Krasz, V.; Eby, G.N.; Stosnach, H.; et al. The volatile inventory (F, Cl, Br, S, C) of magmatic apatite: An integrated analytical approach. Chem. Geol. 2012, 291, 241–255. [Google Scholar] [CrossRef]
Figure 1. Simplified geological map of the Isua supracrustal belt, adapted from Nutman and Friend [58], Lepland et al. [22], and Wudarska et al. [27], showing our 11 sampling locations. For geographic coordinates, see Lepland et al. [22].
Minerals 10 00027 g001
Figure 2. Bright-field images (a,b,d) and high-angle annular dark-field (HAADF) images (c,e) of spherical fluid inclusions in apatite crystals from BIF and metachert. EDX analyses indicate chlorine enrichment of such an inclusion (analysis No. 2) in Cl-poor apatite AL26 (analysis No. 1).
Minerals 10 00027 g002
Figure 3. (a) An overview HAADF image of cummingtonite (Cum) inclusion in hydroxylapatite (Ap) from BIF AL10-1; (b) a HAADF image and (c) lattice fringe image of elongated amorphous iron silicate inclusions in hydroxylapatite from mafic dyke AL21-2; (d) a HAADF image of a chlorite-filled zone (Chl) between magnetite (Mag) and hydroxylapatite (Ap) crystals in BIF AL35-6; (e,f) overview HAADF images of abundant nanopores and elongated Si-rich inclusions in fluorapatite from BIF AL15B. Note the rough crystal boundary between fluorapatite (Ap) and amphibole (Amp). The white lines represent the perforated carbon film on which the foil is resting.
Minerals 10 00027 g003
Figure 4. (ac) Bright-field images and (d) an overview HAADF image of single dislocations in apatite crystals from banded iron formations (AL10-2, AL13) and metacarbonate rocks (AL8-1, AL17). Electron irradiation damages due to TEM operations are visible in the left upper part of AL13 image.
Minerals 10 00027 g004
Figure 5. Overview HAADF and bright-field images of apatite subgrains separated by arrays of dislocations that form low-angle grain boundaries in crystals from mafic dyke AL1-2 (ac) and BIF AL35-6 (df). Apatite crystals in the mafic dyke have straight parallel and simply curved (b) as well as strongly curved (c) low-angle grain boundaries. Overview images show abundant dislocations throughout the TEM foils. Ap—apatite, Cal—calcite, Mag—magnetite.
Minerals 10 00027 g005
Figure 6. Cathodoluminescence images collected from apatite crystals in BIFs (ai), metachert (j), metacarbonate rocks (k,l), and mafic dykes (m–o). Crystal with intensive red luminescence surrounding apatite AL35-6 (h,i), AL17 (l), and AL1-2 (m) is the carbonate mineral. White circles indicate analytical spots in which the cathodoluminescence (CL) spectra (Figure 7 and Figure S2) were collected.
Minerals 10 00027 g006
Figure 7. (ac) Representative cathodoluminescence spectra collected from apatite crystals in three BIF samples. CL spectra for all the studied specimens are included in the Supplementary Materials (Figure S2). Mn2+ is the dominant luminescence activator in Isua apatite. A very intense, broad peak in the yellow-green part of the spectra corresponding to Mn2+ may overlap with other types of luminescence centers, which appear in the spectrum of AL35-6 (c).
Minerals 10 00027 g007
Figure 8. δ37ClSMOC values of Isua apatite crystals measured by SIMS and shown in relation to the chlorine (a), fluorine (c), and H2O (d) abundances as well as compared to δDVSMOW values (b) determined in the earlier study (Table 1). Error bars (a) show average uncertainty of single analysis determined for each sample, and they decrease from ±0.17 for Cl-poor fluorapatite AL15B to ±0.02 for Cl-rich hydroxylapatite AL10-2.
Minerals 10 00027 g008
Table 1. List of samples used in this study, which were previously characterized for their chemical compositions and possible origin.
Sample IDHost Rock 1,2Mineral Composition of Host Rock 1,2REE Profile of Apatite and Corresponding Apatite Origin 1,2Apatite Type 1Volatile Concentrations
in Apatite [wt %] 1
δDVSMOW
[‰] in Apatite 1
Major PhasesMinor Phases[Cl][F][H2O] 3
AL4-1banded iron formationquartz, magnetite, cummingtonitestilpnomelane, calcite, apatite, pyriteflat (sedimentary) or LREE-depleted (mafic)---nd 4ndndnd
AL10-1banded iron formationquartz, magnetite, cummingtonitepyrite, Fe-rich dolomite, apatite, monaziteMREE-enriched (metasomatic)hydroxylapatite1.38 ± 0.061.20 ± 0.140.83 ± 0.07−57
AL10-2banded iron formationquartz, magnetite, actinolitepyrite, Fe-rich dolomite, apatiteflat (sedimentary)hydroxylapatite1.76 ± 0.061.06 ± 0.140.81 ± 0.06−56
AL13banded iron formationquartz, magnetite, cummingtoniteFe-rich dolomite, apatiteMREE-enriched (metasomatic)hydroxylapatite1.17 ± 0.251.51 ± 0.140.74 ± 0.06−71
AL15Bbanded iron formationgrunerite, magnetite, quartzactinolite, chlorite, apatiteflat (sedimentary)fluorapatite0.16 ± 0.022.82 ± 0.160.41 ± 0.07−62
AL35-6banded iron formationquartz, magnetiteFe-rich dolomite, apatiteflat (sedimentary)hydroxylapatite0.06 ± 0.021.70 ± 0.180.95 ± 0.09−87
AL26metachertquartzmagnetite, apatite, cummingtonite, pyriteMREE-enriched (metasomatic),
flat (sedimentary) or
LREE-depleted (mafic)
---ndndndnd
AL8-1metacarbonate (carbonate-rich layer in mafic rock)chlorite, magnetite, Mg–Mn-rich siderite, Fe-rich dolomite, cummingtonitequartz, pyrite, graphite, apatiteMREE-enriched (metasomatic)fluorapatite0.73 ± 0.042.19 ± 0.190.55 ± 0.08−93
AL17metacarbonate (carbonate-rich layer in metachert)quartz, Fe-rich dolomite, calcite, cummingtonitegraphite, chlorite, stilpnomelane, apatiteMREE-enriched (metasomatic)fluorapatite0.64 ± 0.162.07 ± 0.280.62 ± 0.10−60
AL1-2mafic dykechlorite, quartz, stilpnomelanecalcite, titanite, allanite, monazite, apatite, zirconLREE-depleted (magmatic)---ndndndnd
AL21-2mafic dykechlorite, actinolite-hornblende series, quartzpyrite, apatite, titanite, zirconLREE-depleted (magmatic)hydroxylapatite1.49 ± 0.131.13 ± 0.120.85 ± 0.07−69
1 Wudarska et al. [27]; 2 Lepland et al. [22]; 3 H2O calculated on ideal stoichiometry; 4 nd—No data available.
Table 2. List of Secondary Ion Mass Spectrometry (SIMS) reference materials used in this study.
Reference MaterialCl Content (wt.%)Recommended δ37ClSMOC (‰) 3
Eagle County (Colorado, USA) 10.95 ± 0.03 (1 s)0.22
TUBAF#37 (Bamble, Norway) 20.26 ± 0.04 (1 s)0.20 ± 0.13 (1 s)
TUBAF#50 (Spain) 20.56 ± 0.07 (1 s)0.32 ± 0.25 (1 s)
TUBAF#40 (Kragerø, Norway) 21.37 ± 0.11 (1 s)0.20 ± 0.24 (1 s)
1 The reference material was provided by the SIMS laboratory at Woods Hole Oceanographic Institution, USA. Cl content was measured by an electron probe micro-analyzer (EPMA) [75], while the δ37Cl value was determined by gas-source isotope ratio mass spectrometry (GS IRMS) at the University of New Mexico [76].2 The reference materials were developed at the Potsdam SIMS facility. Cl concentrations were analyzed by EPMA, while δ37Cl values were determined based on multiple measurements in the GS IRMS laboratories at the University of Texas, at the University of Delaware, and in the Paris Institute of Earth Physics [77]. 3 The 37Cl/35ClSMOC ratio of 0.319533 [78,79] was used for the data reduction.
Table 3. δ37Cl values of the Isua apatite crystals determined by SIMS.
Sample IDRock TypeMean δ37ClSMOC [‰]δ37ClSMOC Value Range [‰]Number of CrystalsNumber of Measurements
AL10-2BIF1.401.18–1.601820
AL13BIF0.480.00–0.691327
AL15BBIF−0.34−0.82–0.161515
AL8-1metacarbonate0.320.16–0.481415
AL17metacarbonate0.29−0.08–0.682737
AL21-2mafic dyke0.17−0.10–0.381225

