2. Related Works
There are two major categories of methods for the recognition of emotions including fear: single modality-based methods and multiple modality-based methods. Single modality-based methods include visible light camera-based methods [
8,
9,
10,
11,
12,
13,
14,
15], thermal camera-based methods [
16,
17], voice-based methods [
2,
12,
13,
14,
18,
19], physiological signal-based methods [
20,
21,
22,
23,
24,
25], and functional magnetic resonance imaging (fMRI)-based methods [
26]. As for visible light camera-based methods, images of subjects’ facial expression at different emotions are captured by a camera and the generated data used to study the information on subjects’ facial expression (changes in facial feature points by comparison between previous image frames and present image frames, etc.) [
8,
9,
10,
11,
12,
13,
14,
15].
These visible light camera-based methods are advantageous in that the instruments required for data acquisition are much more affordable than those required for thermal camera- and physiological-signal-based methods. In addition, since they use contactless sensors, they are suitable for use in circumstances where study subjects need to be unaware of the ongoing study or where it is difficult to attach contact sensors to subjects. However, when using the visible light camera-based methods, a separate near-infrared (NIR) lighting is required as it is difficult to identify facial feature points of subjects in dark rooms or dark environments. It may also be hard to obtain image data on changes in facial expression of subjects who do not express their emotions through facial expressions.
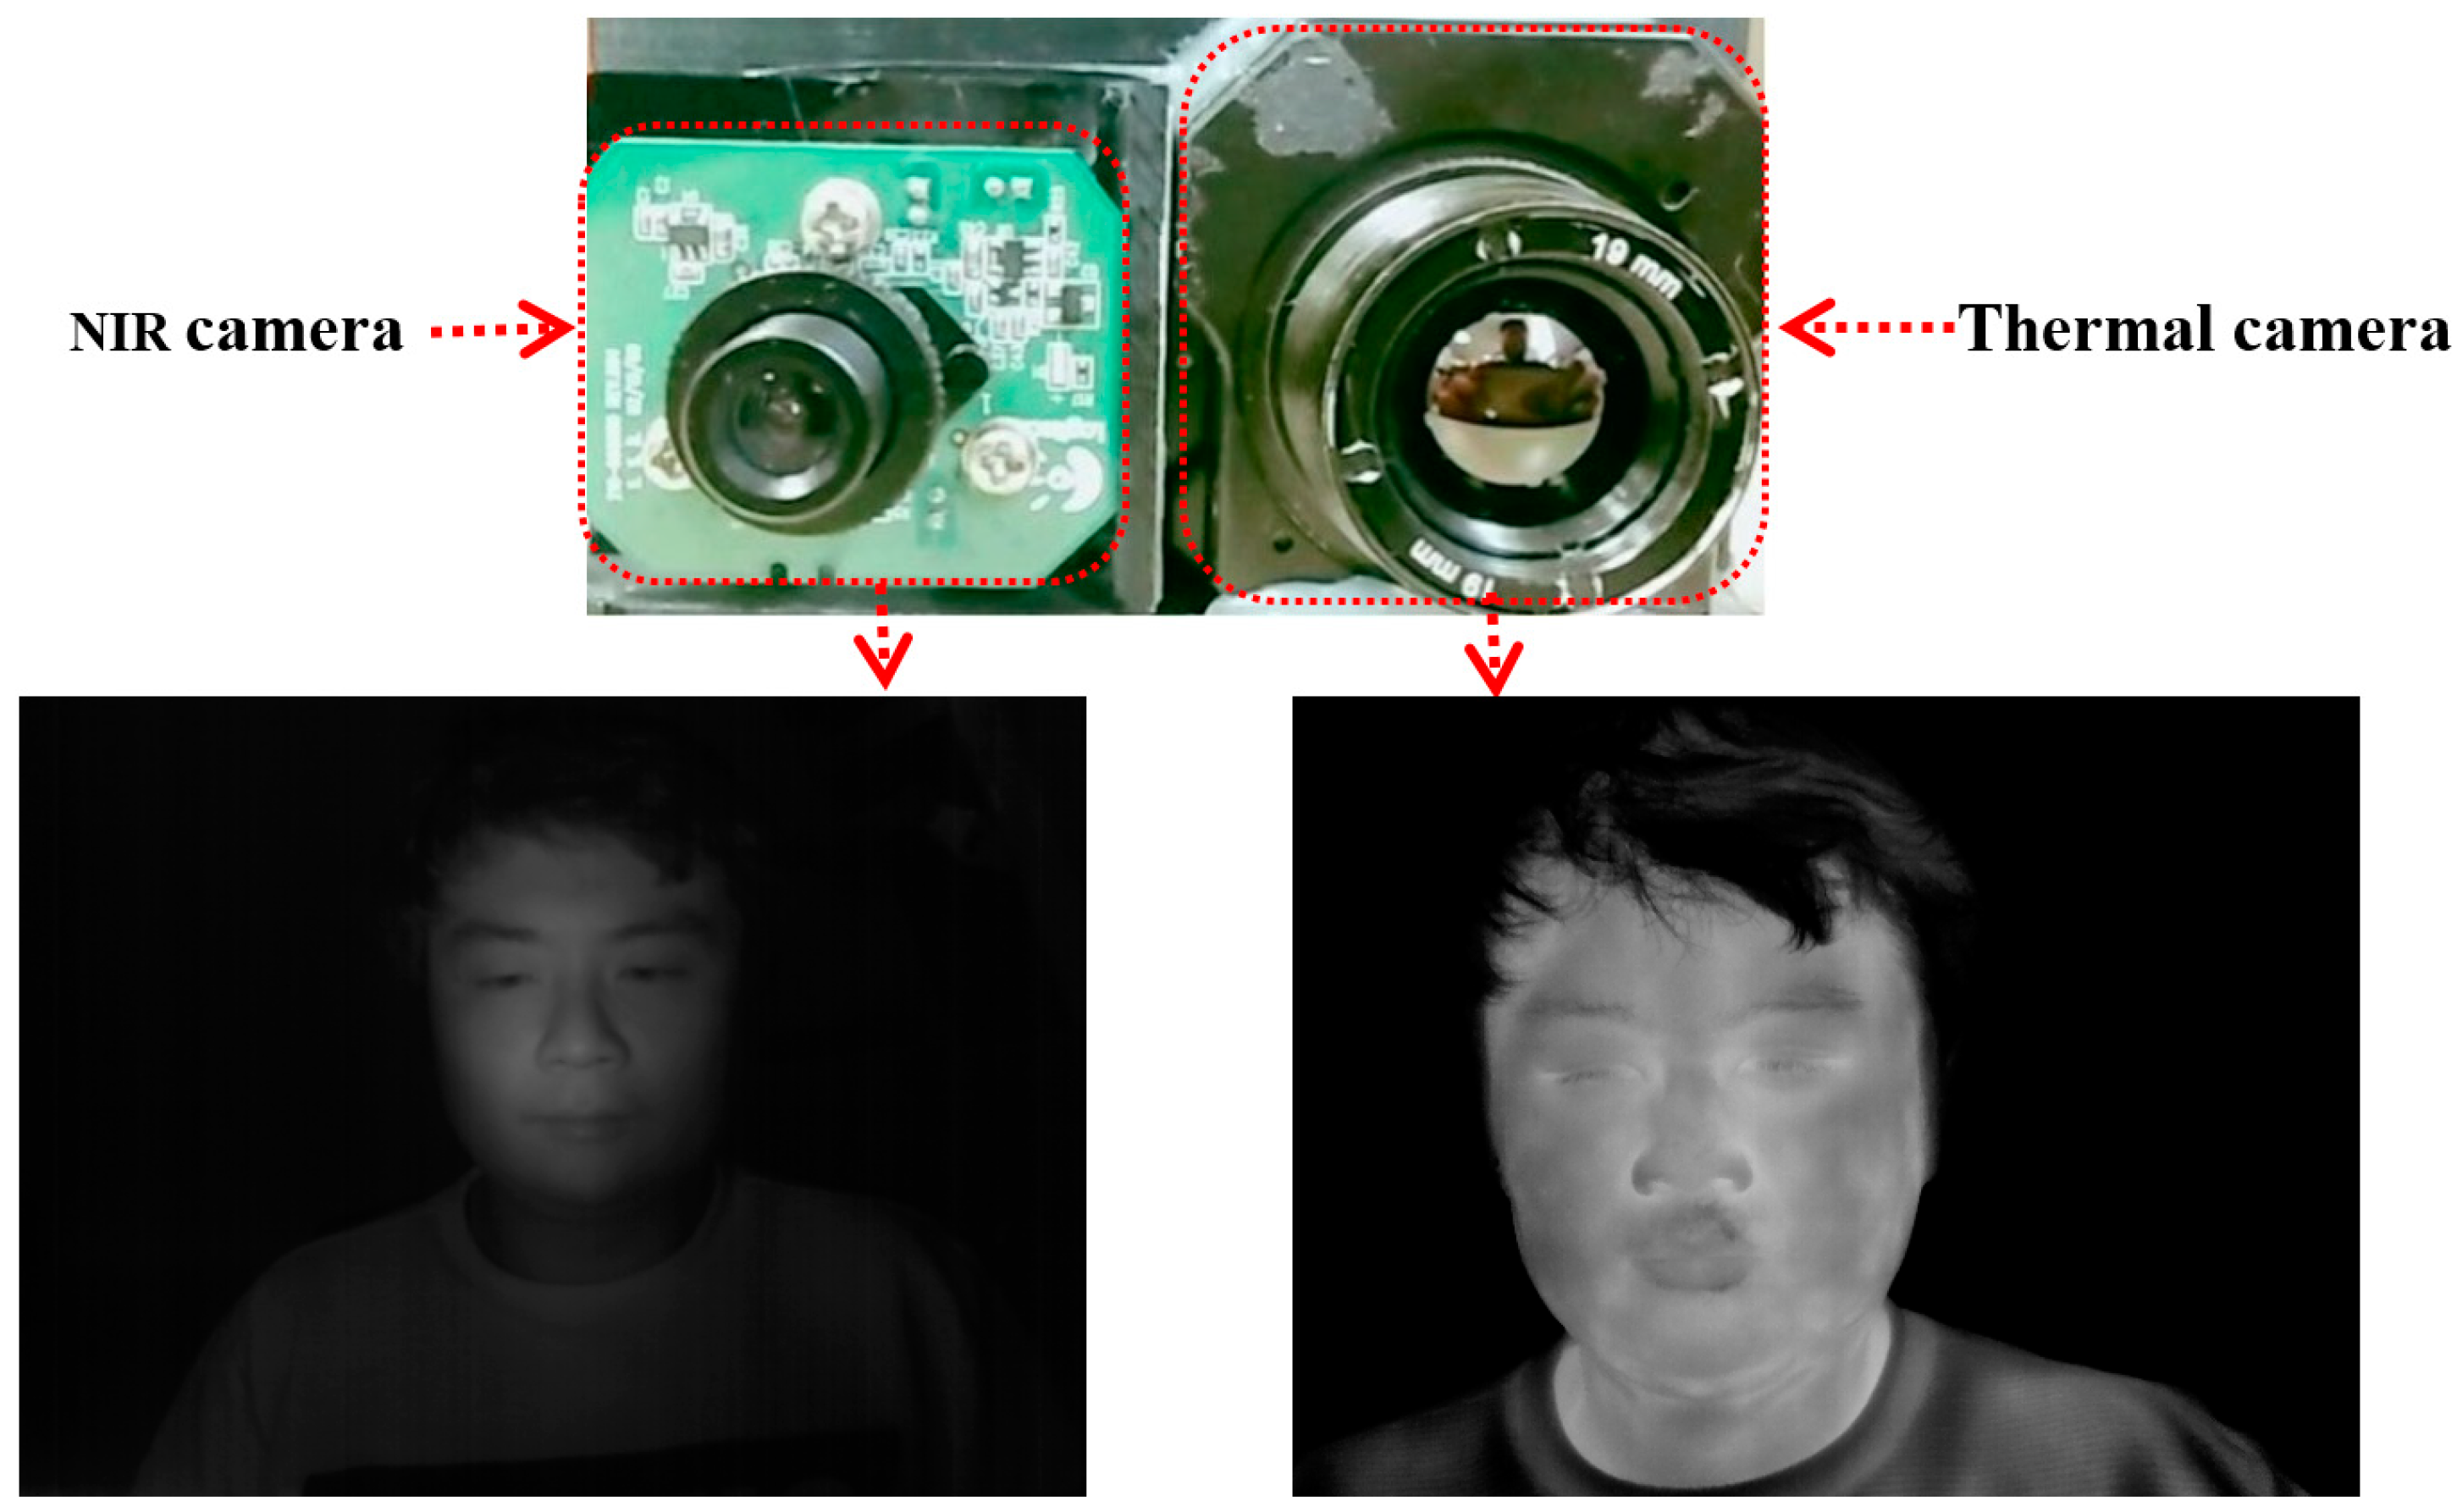
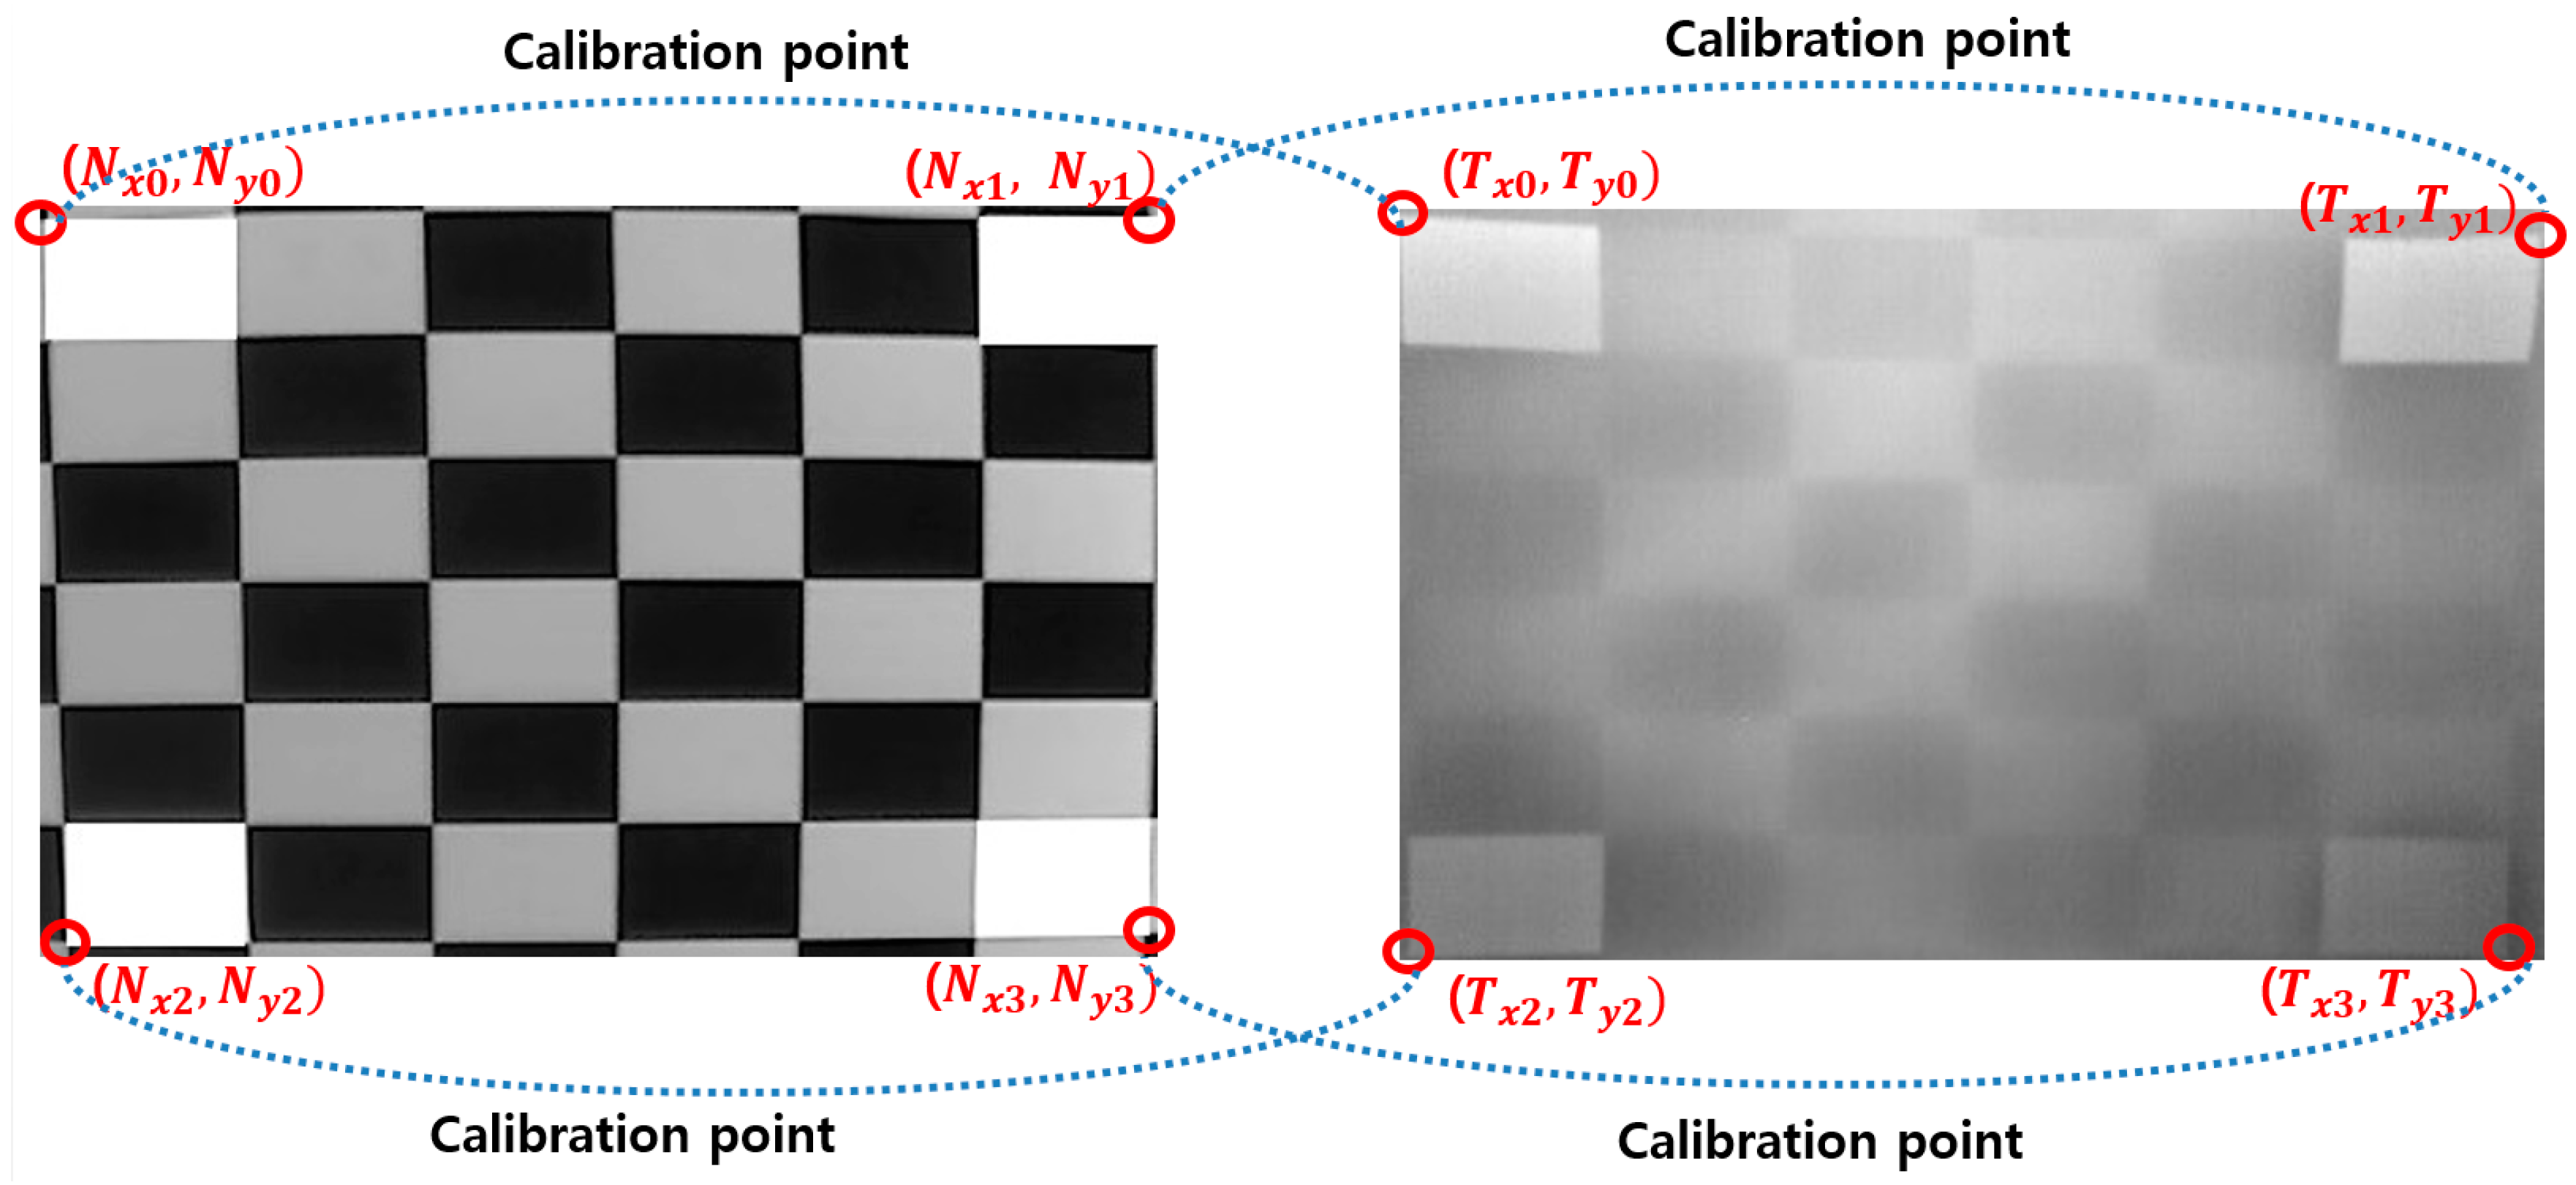
For thermal camera-based methods, unlike visible light camera-based methods, they are suitable for obtaining data even in dark rooms or dark environments and are able to observe and recognize emotional changes in study subjects by detecting facial temperature changes even if subjects do not express emotions through facial expression change [
16,
17]. In other words, pixel values obtained from thermal images provide thermal data by recording temperature even in poor lighting conditions (dark rooms and dark environments) and accordingly allow the recognition of subjects’ emotions by detecting facial temperature changes that result from heat generation and absorption by physiologic activities that occur whenever subjects experience emotional change. However, as mentioned earlier, thermal cameras are costlier than visible light cameras. It is also more difficult to obtain accurate data on facial feature points solely by thermal cameras as they are unable to clearly distinguish facial feature points such as the eyes, nose, and mouth from surrounding facial skin in images. Therefore, manual marking has been conducted to identify facial feature points in obtained images by thermal cameras [
16,
17]. In addition, visible light cameras are jointly used with thermal cameras to identify facial feature points with correlations of changes in location of the two groups of cameras, studied through prior calibration. Based on the data obtained from this calibration, coordinates of the location of facial feature points identified through visible light cameras were mapped onto the images obtained by thermal cameras to identify the facial feature points in them [
27].
For voice-based methods, the instruments required for obtaining data are more affordable than those required for visible light cameras or thermal cameras. They also allow for easier operation due to the use of contactless sensors and explicit changes according to subjects’ emotions, observed in input data. They, however, also have a disadvantage in that they are susceptible to surrounding noise [
2,
12,
13,
14,
18,
19]. For physiological-signal-based methods, they are operated based on electrocardiography (ECG), EEG, skin temperature (SKT), HR, RR, etc., and allow the acquisition of real-time data on emotional changes with high levels of accuracy when using high-cost instruments. However, they also have a disadvantage in that the level of accuracy of the instruments varies greatly depending on their price level. Hence, the use of low-cost instruments may undermine the credibility of data in a study [
20,
21,
22,
23,
24,
25,
28]. In the case of the fMRI-based method, the anger felt by study subjects was recognized through fMRI, and it was demonstrated that it is possible to analyze the response to fear by studying neural responses to anger [
26]. This method indicates accurate measurement value for emotional change, but the required instruments are costly and large in size such that it is difficult to use them in varied environments. In a previous study on the state of fear [
27], changes in facial temperature, subjective evaluation, EEG, and eye blinking rate of subjects were measured and a further study was conducted to analyze the modality that best reflected the state of fear among all parameters. However, studies to enhance the accuracy of evaluation of the state of fear by combining the resulting values of each modality have not been conducted. In addition, there are other issues in which the credibility of data obtained through EEG was undermined by the use of low-cost EEG sensors. There have also been issues regarding the accuracy of recognition of the state of fear of study subjects, using eye-blinking rate (EBR) as the only reference among many other changes in feature points that can be observed on subjects’ faces.
Due to such disadvantages of single modality-based methods, studies have been conducted on multiple modality-based methods that involve the use of two or more sensors to measure emotions including fear [
29,
30]. Cheng et al. conducted a study on emotion recognition using a support vector machine (SVM) that combined data based on photoplethysmography (PPG), EMG, ECG, galvanic skin response (GSR), temperature, etc. [
29]. Chun et al. also conducted a study of the same sort by combining data on physiological signals, such as SC, BPV, skin temperature (ST), EMG, respiration, etc. through adaptive boosting (Adaboost), bagging, and boosting-based ensemble learning methods [
30]. These multiple modality-based methods allow improvement in the credibility of data by combining data obtained from two or more sources and, accordingly, have a higher recognition accuracy compared to single modality-based methods. However, these studies [
29,
30] also used multiple contact sensors, with all the aforementioned disadvantages of physiological signal-based methods: discrepancy in the level of accuracy of instruments depending on their price level, user convenience of study subjects, sensor noise generated by movements among others.
In order to address these issues, this study proposes a new method that involves using non-intrusive multimodal sensors to obtain multiple data considering the symmetrical characteristics of face and facial feature points, selecting high-credibility data based on t-tests, combining the selected data into a fuzzy system using the membership functions of symmetrical shape, and ultimately, indicating a quantitative level of users’ fear. The proposed method is designed to enhance conventional subjective evaluation (SE) by fuzzy system based on multi-modalities. By using four objective features except for SE and combining these four features by fuzzy system, our system can produce the accurate level of fear not affected by the physical, psychological or fatigue condition of participants on SE. Our research is novel in the following four ways compared to previous work:
- -
We observed the changes in multiple facial feature points in users while using a reference image that evokes neutral emotions and other images that evoke fear in subjects, with the use of contactless sensors such as thermal (far-infrared (FIR)) and NIR cameras.
- -
With images obtained by thermal cameras, two feature values that derive from changes in facial temperature (FT) and facial temperature-based heart rate (HR) were measured. In addition, based on 68 facial feature points that were automatically detected on the faces of subjects using NIR cameras, five feature values of EBR, Euclidean distance change between left and right lip corners (DLRL), Euclidean distance change between upper and lower lips (DULL), eyebrow movement (EM), and nose movement (NM) were measured. The SE by users was also measured as a feature value.
- -
Through t-tests and Cohen’s d analysis on the aforementioned eight feature values of the state of fear compared to when in the neutral state, four feature values (DLRL, EM, FT, and SE) with p-values <0.05 (95% confidence interval (CI)) and high Cohen’s d values were selected as feature values with credibility. To compare the case only with objective features except for subjective one of SE, the system performance using four feature values (DLRL, EM, FT, and HR) were also evaluated.
- -
The four selected feature values were combined and used as input data to a fuzzy system to improve the level of accuracy and credibility for recognition of subjects’ fear. At this stage, the level of accuracy for recognition of fear in subjects was improved by applying the weighted values from a fuzzy rule table differently based on correlation sum-based credibility between the four feature values. In addition, the training procedure was minimized by using a fuzzy system instead of other methods such as SVM that require training procedures with lots of data or ensemble learning. Furthermore, the dependence of system performance on training data was minimized.
Table 1 shows a comparison between the proposed and previous methods.
The remainder of this paper is organized as follows. In
Section 3, the proposed system and method of fear measurement are described. In
Section 4, the experimental setup and results are discussed. Finally, the conclusions are presented in
Section 5.
4. Experimental Results and Analyses
Participants and experimental conditions are as follows. A total of 20 people (of sound mental and physical health, and aged between their twenties and forties) participated in the experiments. For considering the effect of gender on emotion, half of the participants were male and the other half were female. In addition, we had people from various countries (including Asian, Western, and African) participate in the experiments in order to consider the effect of race on emotion.
The room temperature and relative humidity were 26.6 °C and 51.9%, respectively. The participants watched horror movies with no lighting (turning off the light on the ceiling) to maximize the horror atmosphere. The maximum level of illumination in the room was 13 lux. Participants chose three horror movies that they had not watched before, out of the following four:
Epitaph [
48],
The Conjuring [
49],
Dead Silence [
50], and
Insidious [
51]. They watched 5-min edited clips of the three chosen movies that centered on fear-evoking scenes. (We will make these video clips available to other researchers if they request them by e-mail. Therefore, they can perform comparative experiments with our experimental video clips.)
We allowed the experimental participants to be in natural postures without any occlusion, and made sure all the participants had sufficient rest before experiments. From that, the natural emotion of fear could be measured by preventing any discomfort and guaranteeing that the emotion was spontaneous.
In addition, the neutral emotional state of the participants was measured using images for neutral emotion from the international affective picture system (IAPS) [
52] that are widely used as an emotion stimulus. According to the instruction in [
52], the image of IAPS is not allowed to be shown in the paper. All studies and data acquisition were conducted using a single desktop computer of the following specifications: 3.00 GHz CPU (Intel ® Core TM) i5 2526) with 4 GB RAM (Samsung Electronics, Suwon, Republic of Korea), Microsoft visual studio 2012 C++ (Microsoft Corporation, Redmond, WA, USA), and OpenCV (version 2.3.9) library.
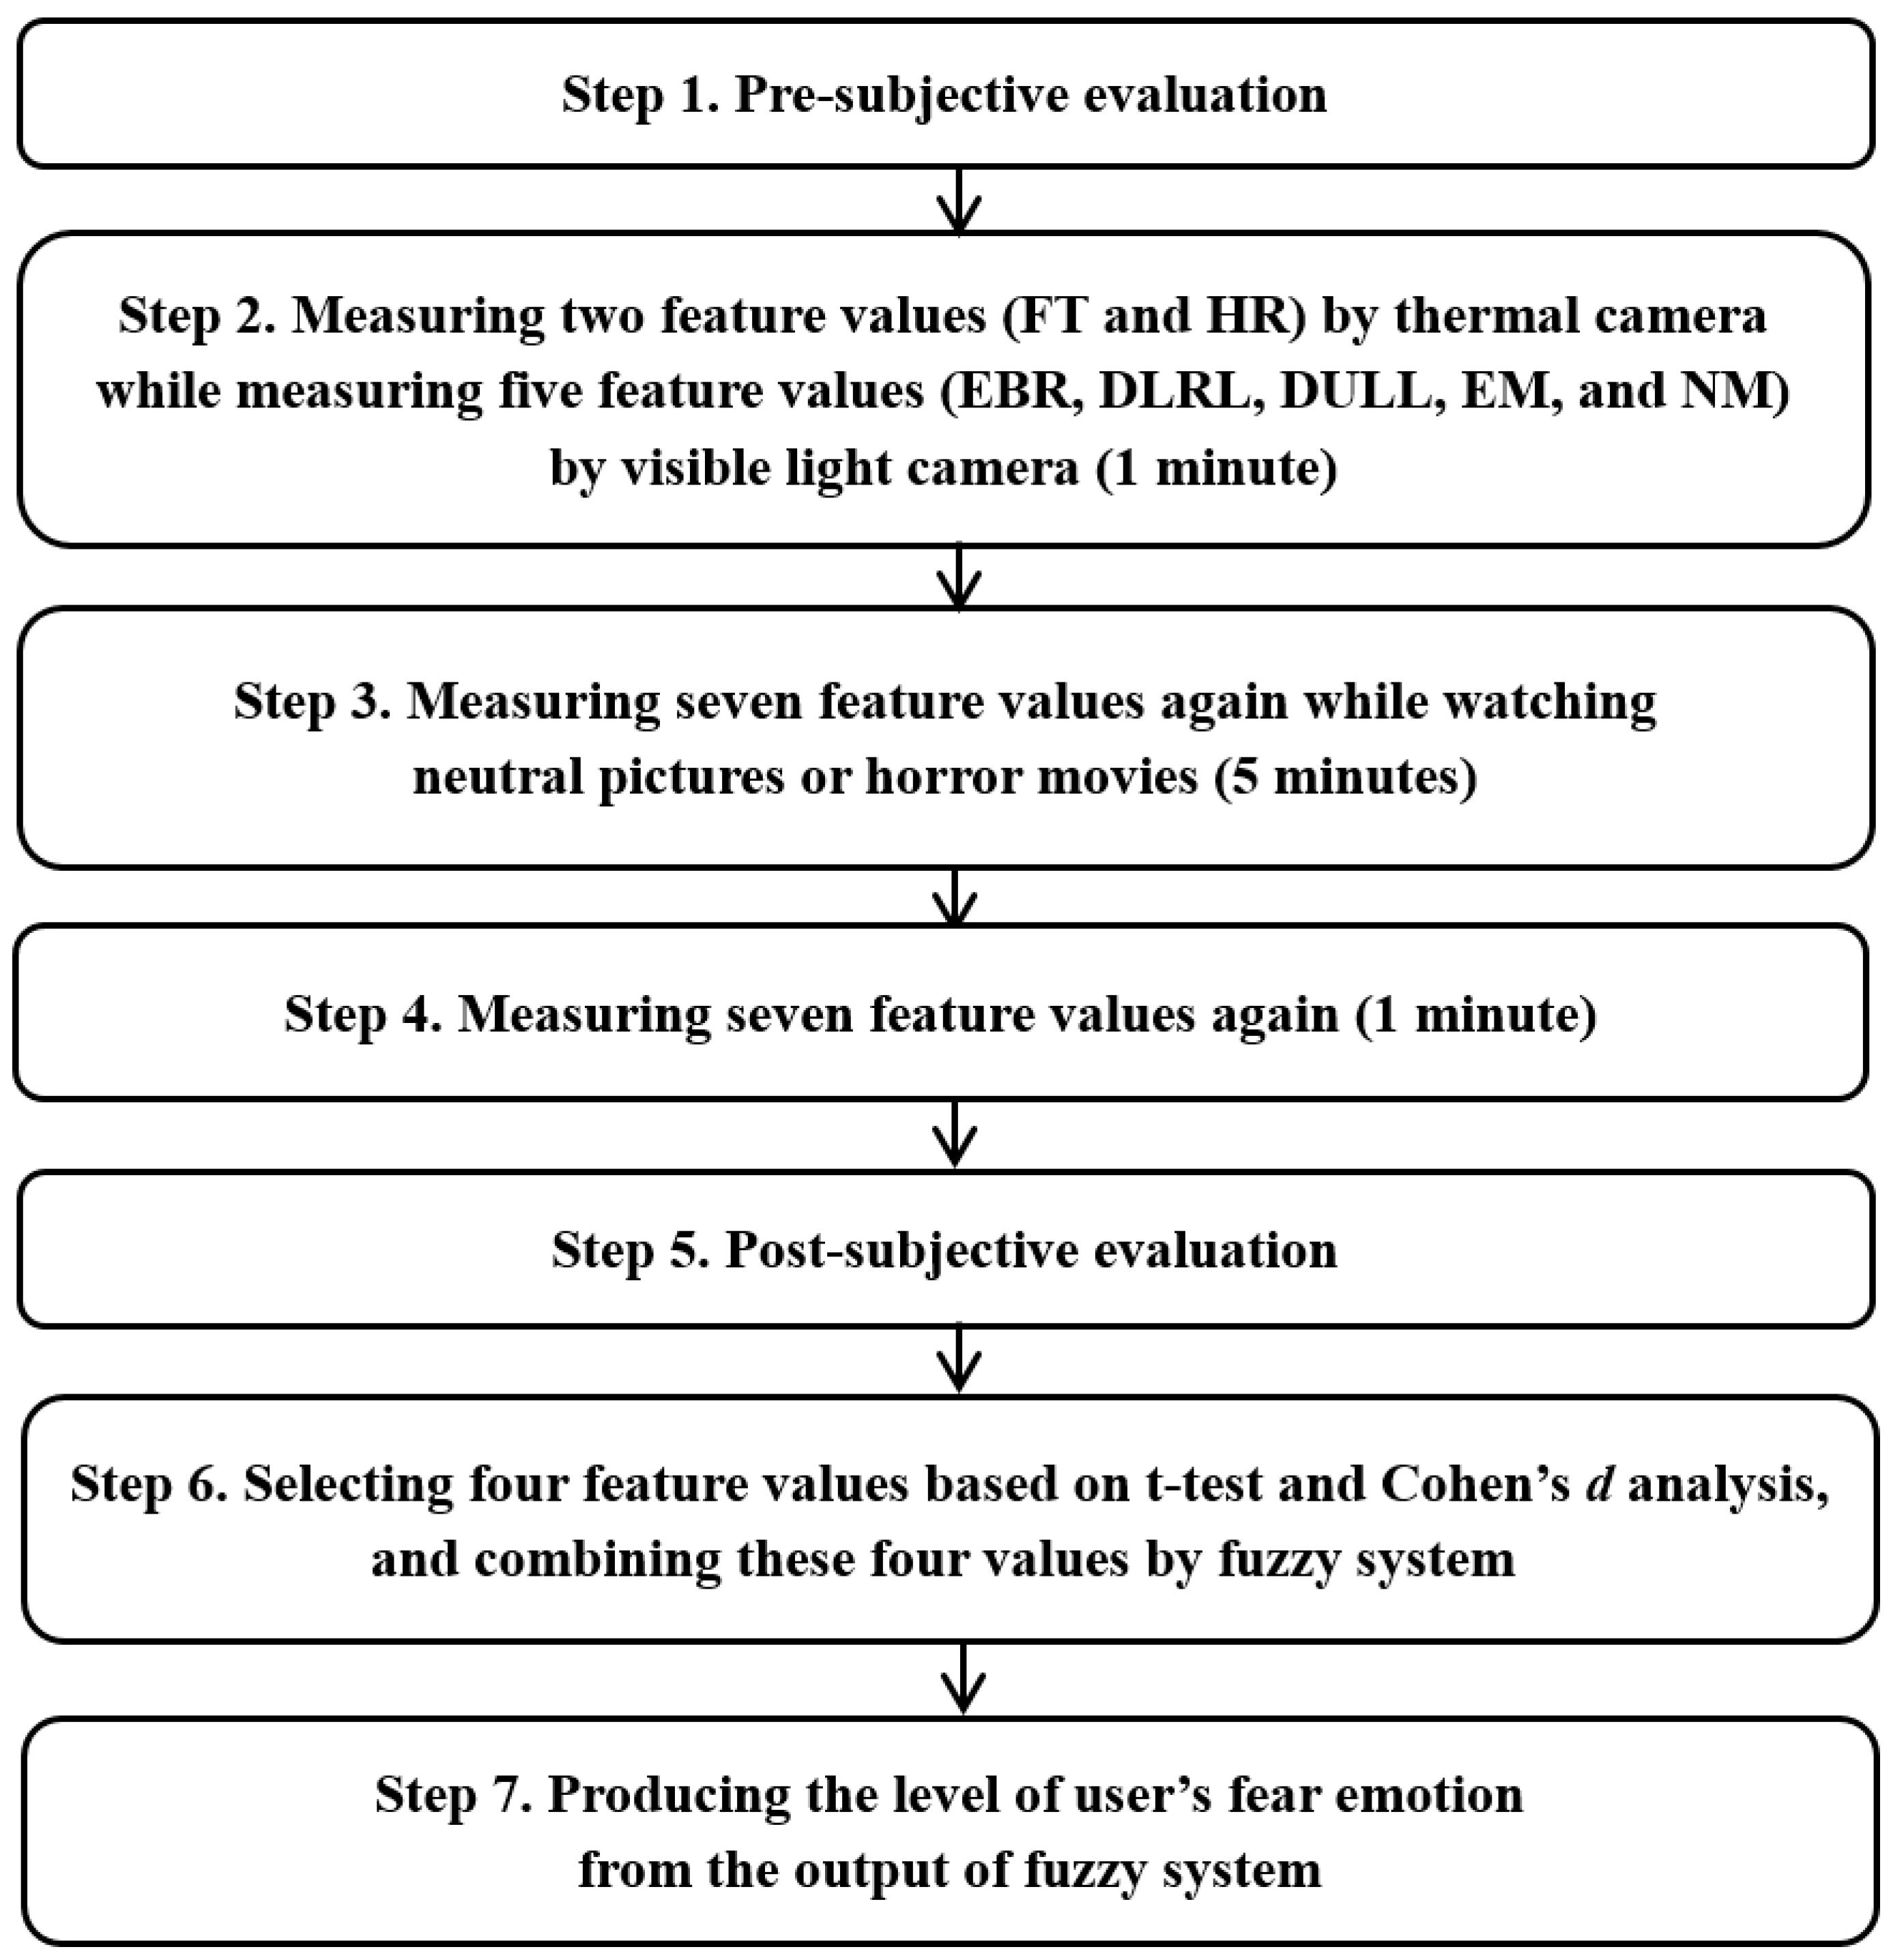
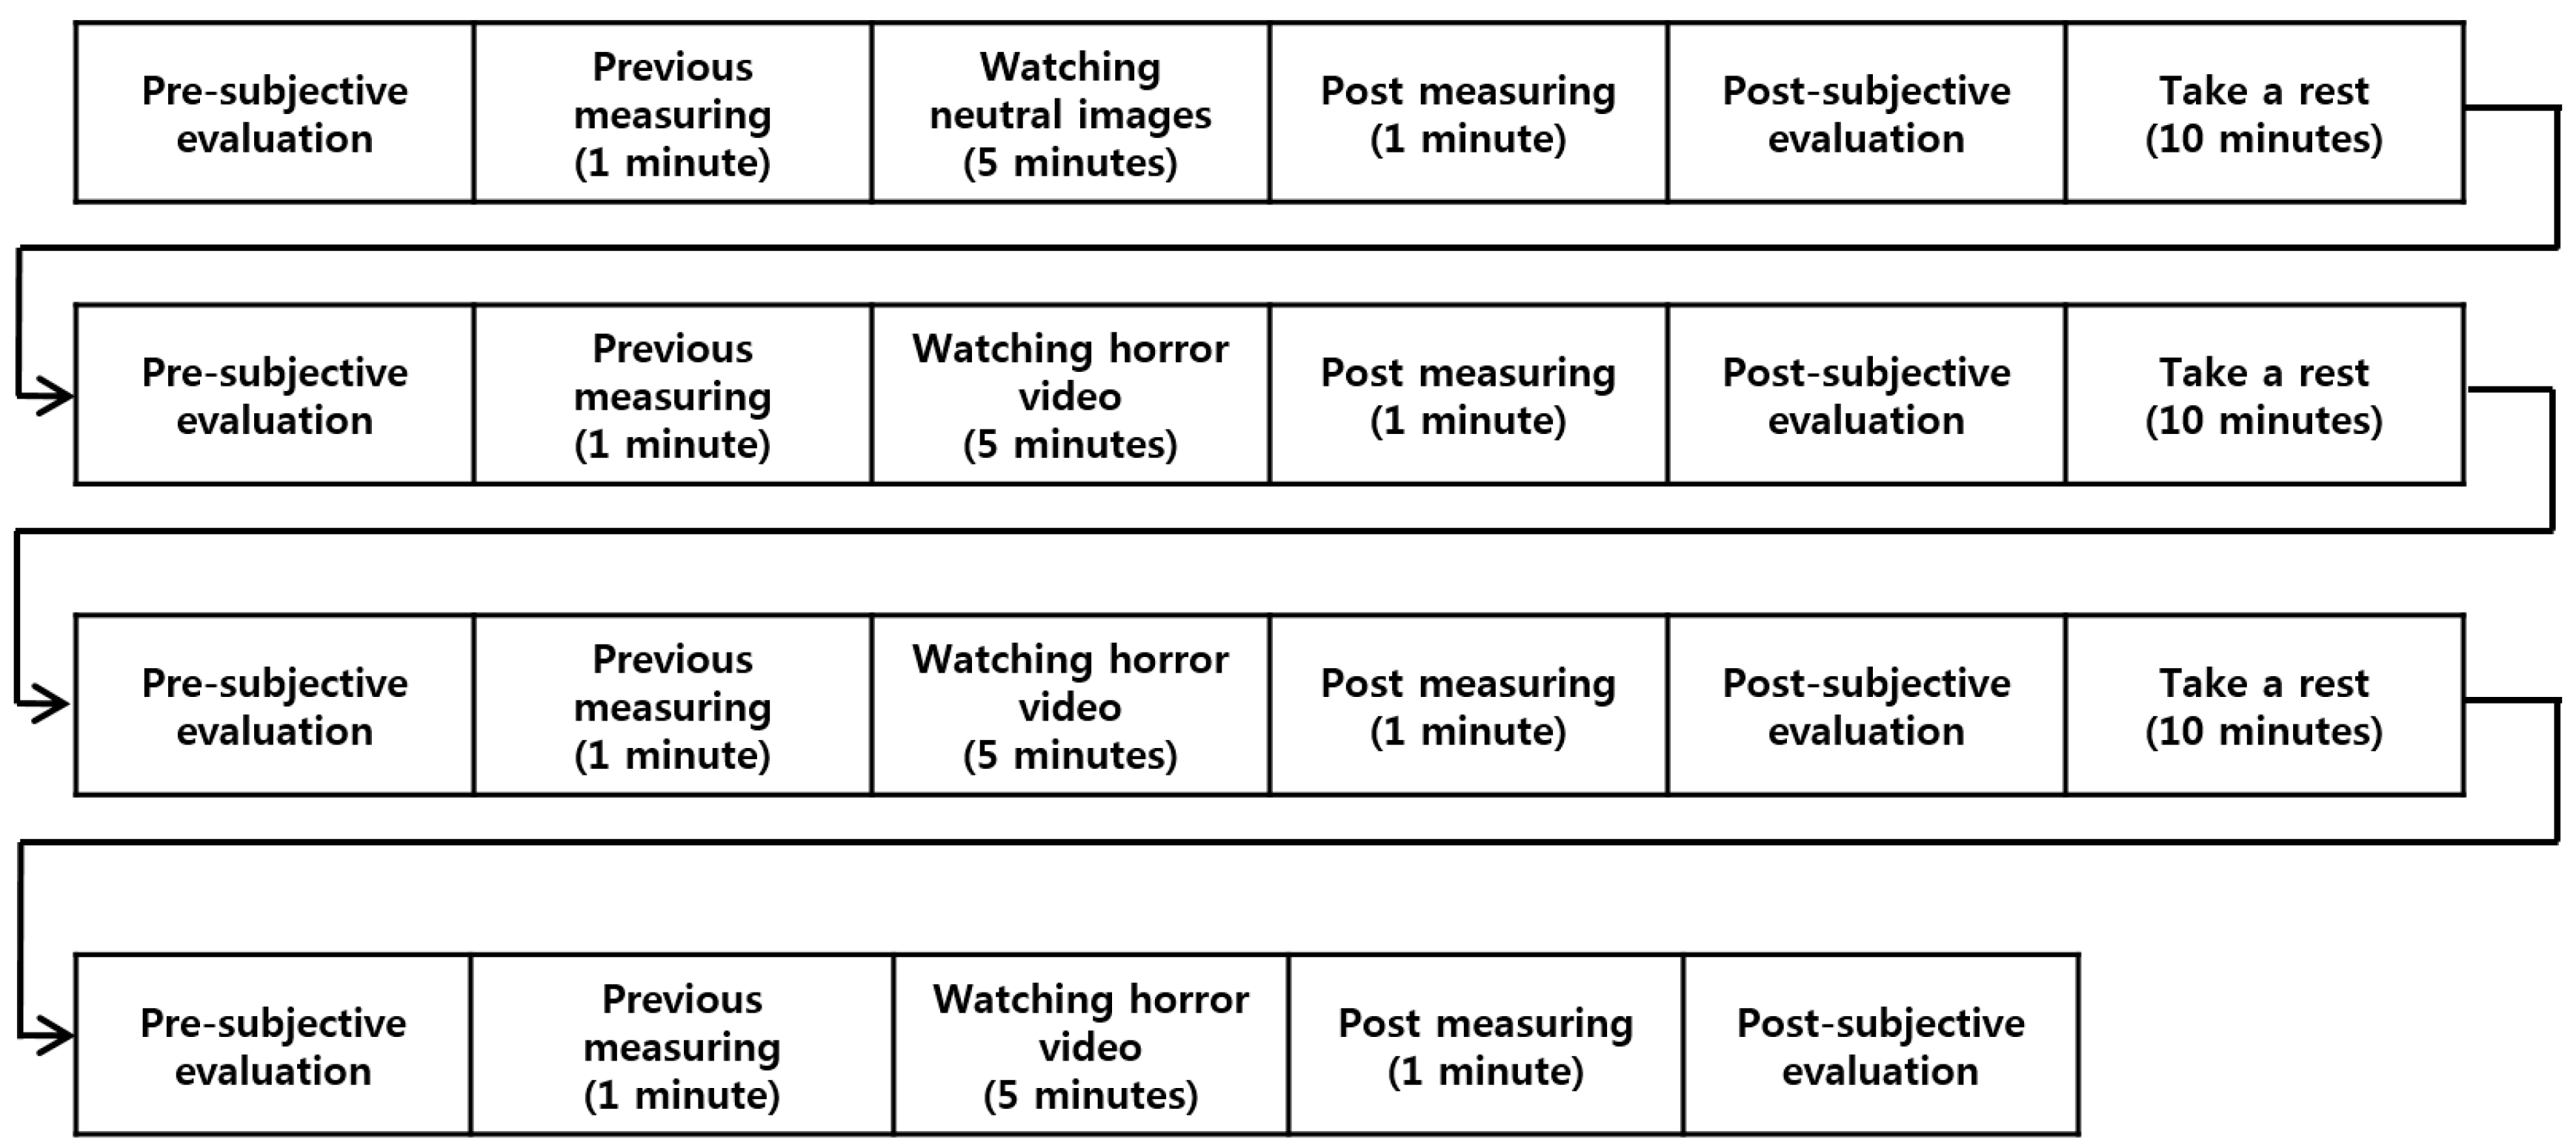
Figure 11 represents the experimental procedure.
As indicated in
Figure 11, each participant watched neutral images before being exposed to three horror movie clips. The data measured during this process were used as reference values for the neutral emotional state of each participant. For example, among the differences in values of eight feature values (FT, HR, EBR, DLRL, DULL, EM, NM, and SE) based on Equations (16) and (17) or (18), four feature values (DLRL, EM, FT, and SE) with
p-values <0.05 (95% CI) and high Cohen’s
d value were selected as feature values with credibility through
t-tests and Cohen’s d analysis.
In Equations (16) and (17), DFVi_wn represents the difference of ith feature value before and after watching neutral images. FVi_bwn, and FVi_awn respectively represent the ith feature values before and after watching neutral images. DFVi_wh represents the difference of ith feature value before and after watching horror movie. FVi_bwh, and FVi_awh respectively represent the ith feature values before and after watching horror movie. In Equations (16) and (17), i = 0 ~ 2, which represent FT, HR, and SE, respectively.
DFVj_wnh represents the difference of jth feature value of watching neutral images and horror movie. FVj_wn, and FVj_wh respectively represent the jth feature values of watching neutral images and horror movie. In Equation (18), j = 0 ~ 4, which represent EBR, DLRL, DULL, EM, and NM, respectively. We performed the t-tests and Cohen’s d analysis with these two values of DFVi_wn and DFVi_wh in case of FT, HR, and SE. In addition, we performed the t-tests and Cohen’s d analysis with these two values of FVj_wn, and FVj_wh in case of EBR, DLRL, DULL, EM, and NM.
In our research, we performed independent
t-test based on unequal variance and two-sample [
31]. For
t-tests, a null hypothesis has to be set [
31]. In this study, the null-hypothesis was set as: there was no difference in feature values measured for neutral images and horror movies. If the
p-value obtained through
t-tests is <0.05, the null hypothesis is rejected based on the confidence level of 95%, which in turn indicates that there is a discrepancy in the feature values measured when watching horror movies compared to watching neutral images based on the confidence level of 95%. In addition, if the
p-value obtained through
t-tests is <0.01, the null hypothesis is rejected based on the confidence level of 99%, which in turn indicates that there is a discrepancy in the feature values measured when watching horror movies compared to watching neutral images based on the confidence level of 99%. Based on these findings, it is suggested that the lower the
p-value is, the greater the difference is between the two sets of data measured, at a statistically significant level.
Based on the foregoing data, the
p-value for the eight feature values (FT, HR, DLRL, DULL, EM, EBR, NM, and SE) was obtained.
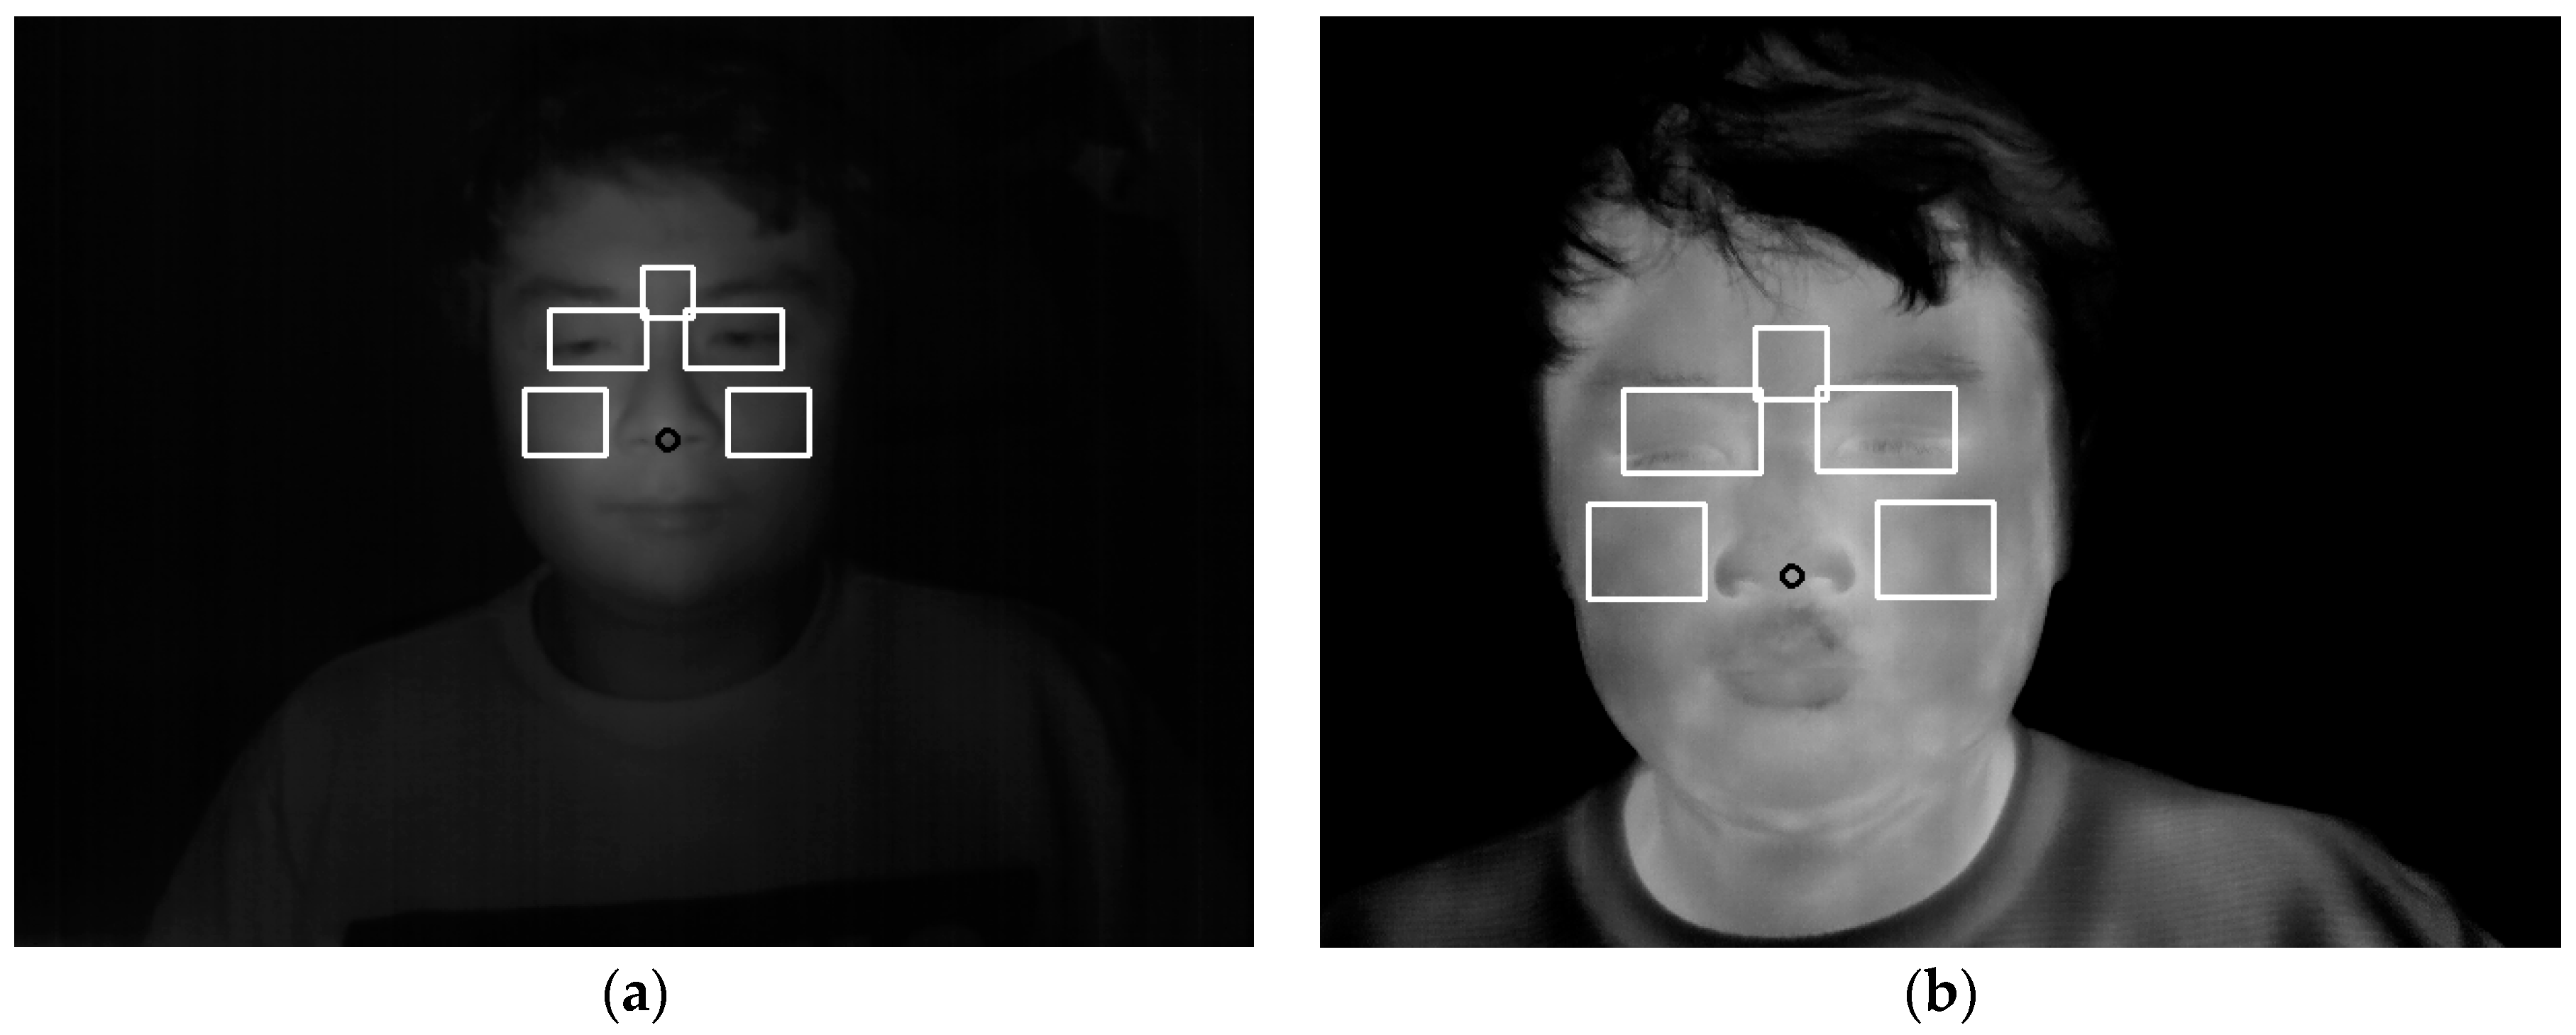
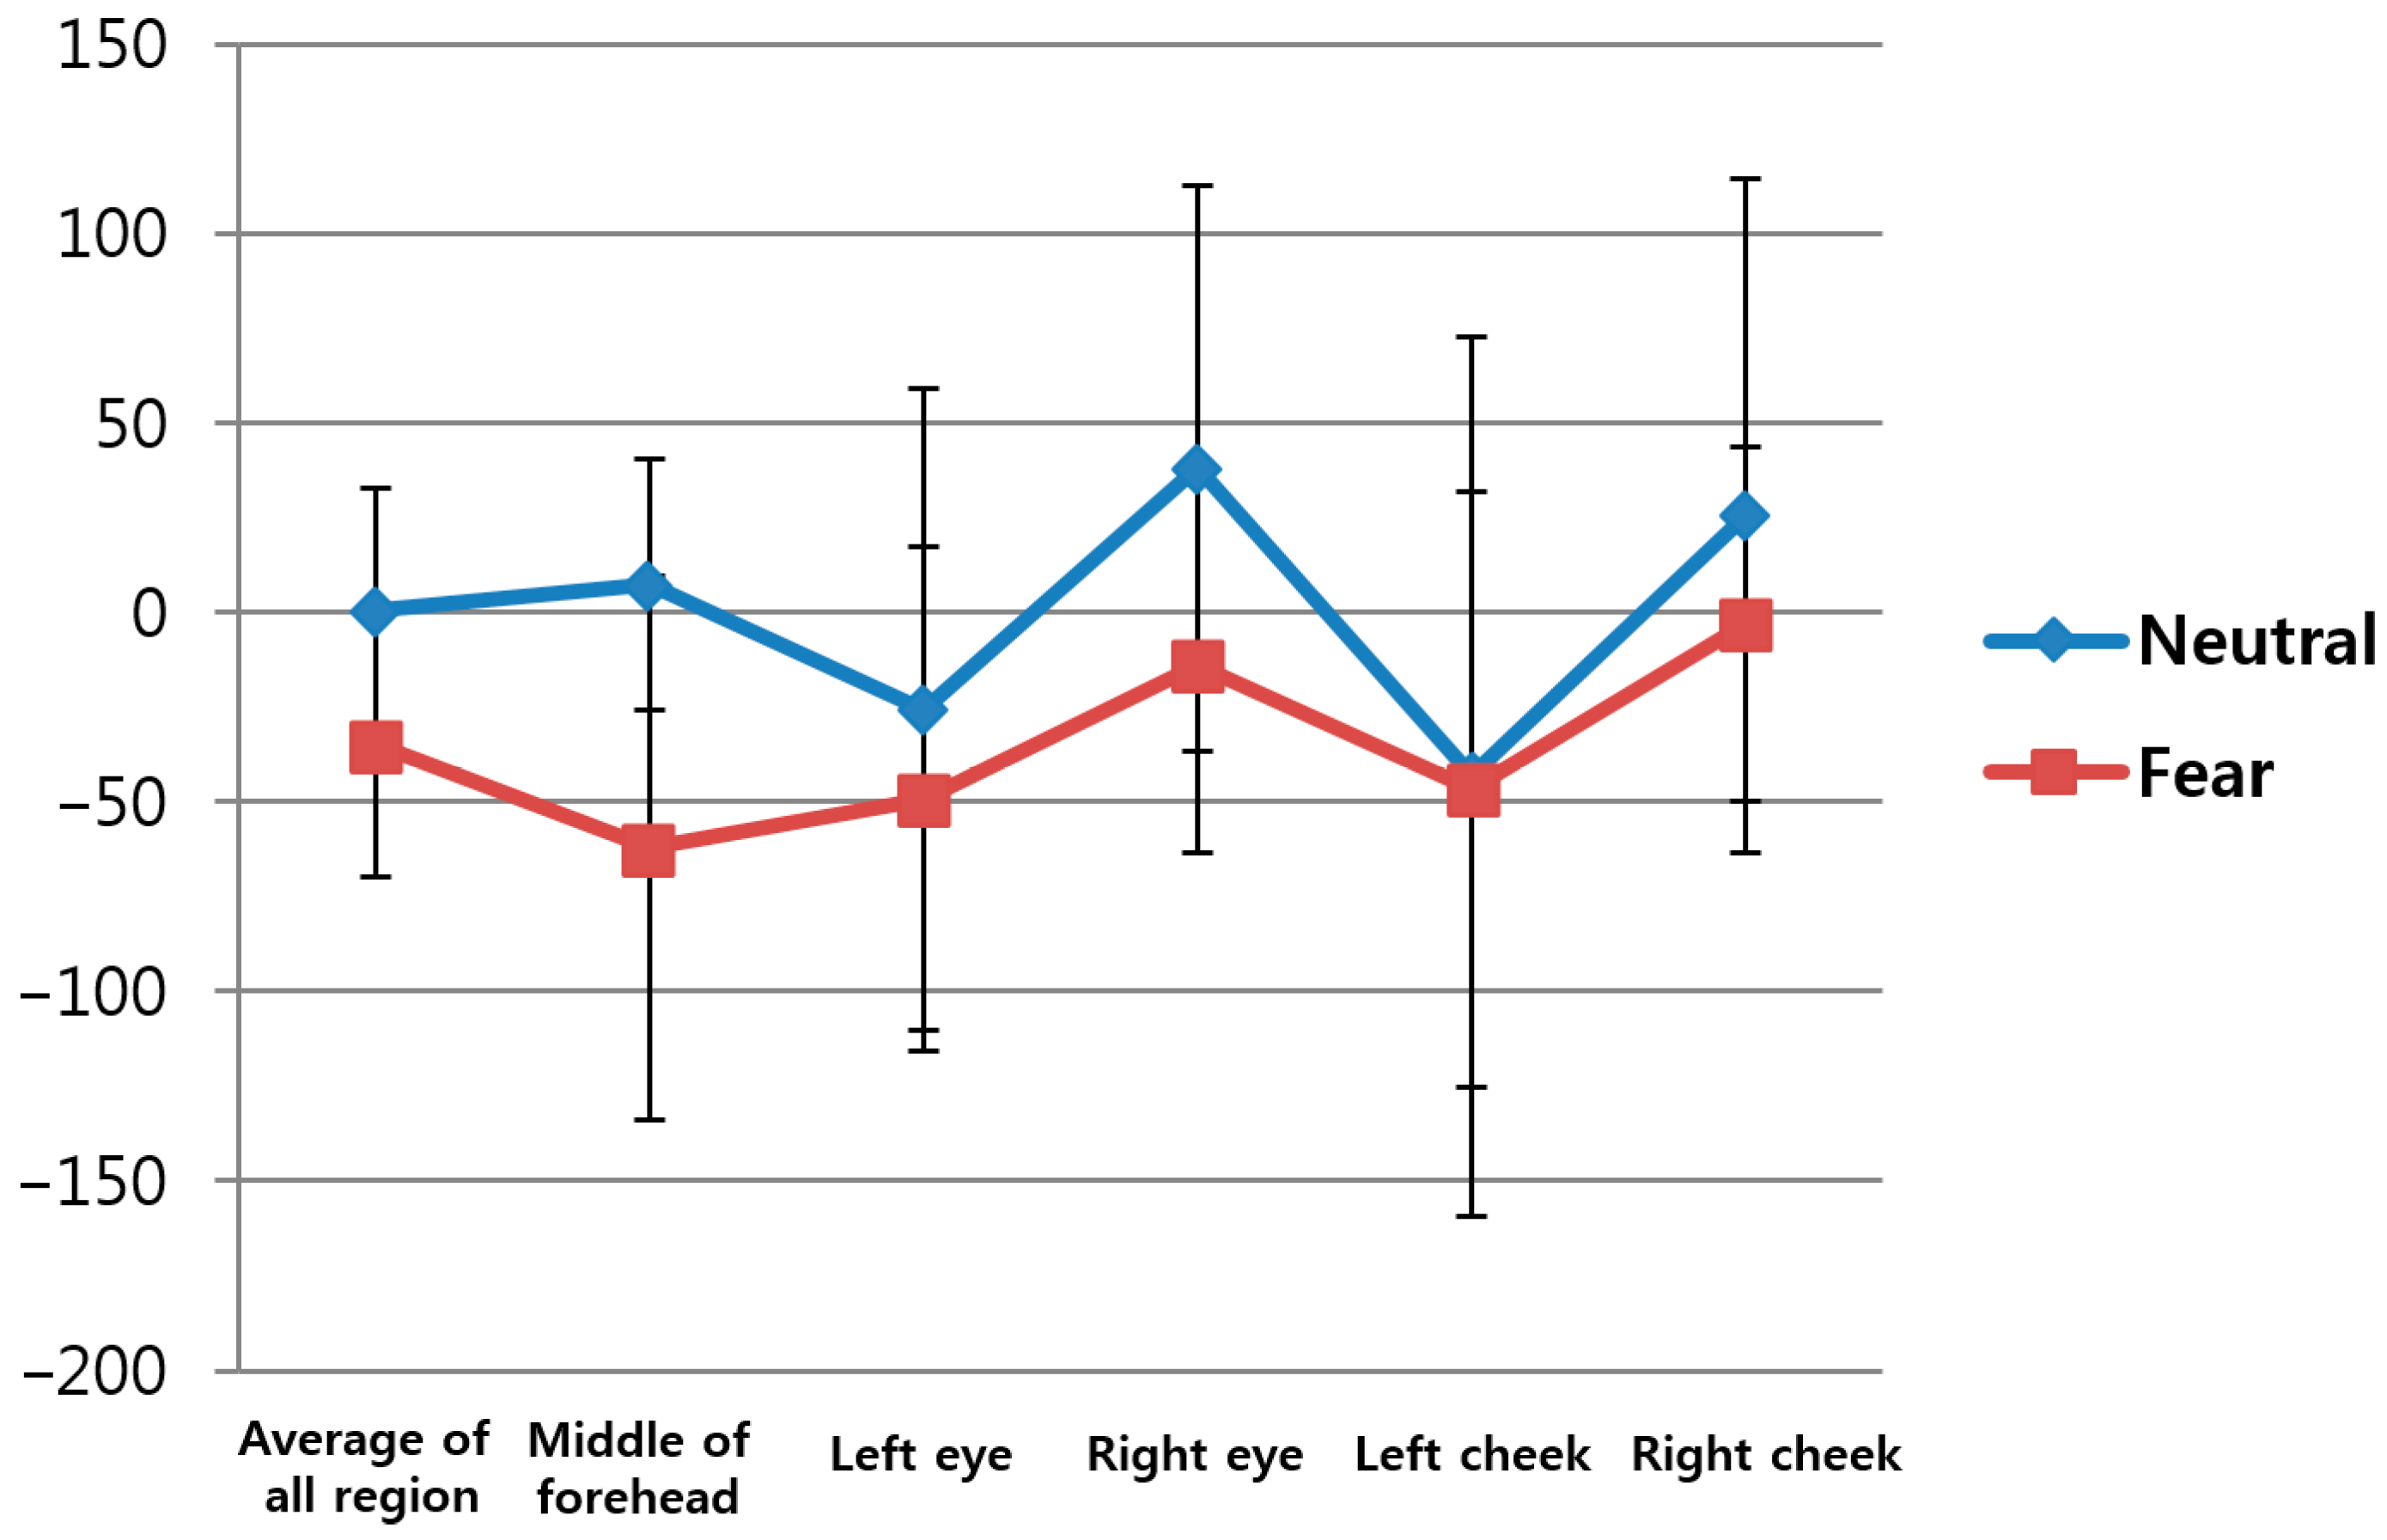
Table 5 shows the change of FT from facial region before and after watching neutral images versus before and after watching horror movies based on Equations (16) and (17) in the five ROIs (middle of forehead, left eye, right eye, left cheek, right cheek) on the face indicated in
Figure 5 and in the overall regions.
Figure 12 represents the average values and standard deviations in
Table 5. In this study, the average FT values of the five ROIs were used as the first feature value to reduce the influence of the partial changes in FT. The
p-value for the average FT of the five regions was 0.006994, which is lower than 0.05, indicating that the change in FT before and after watching horror movies was more significant than before and after watching neutral images at the confidence level of 95%.
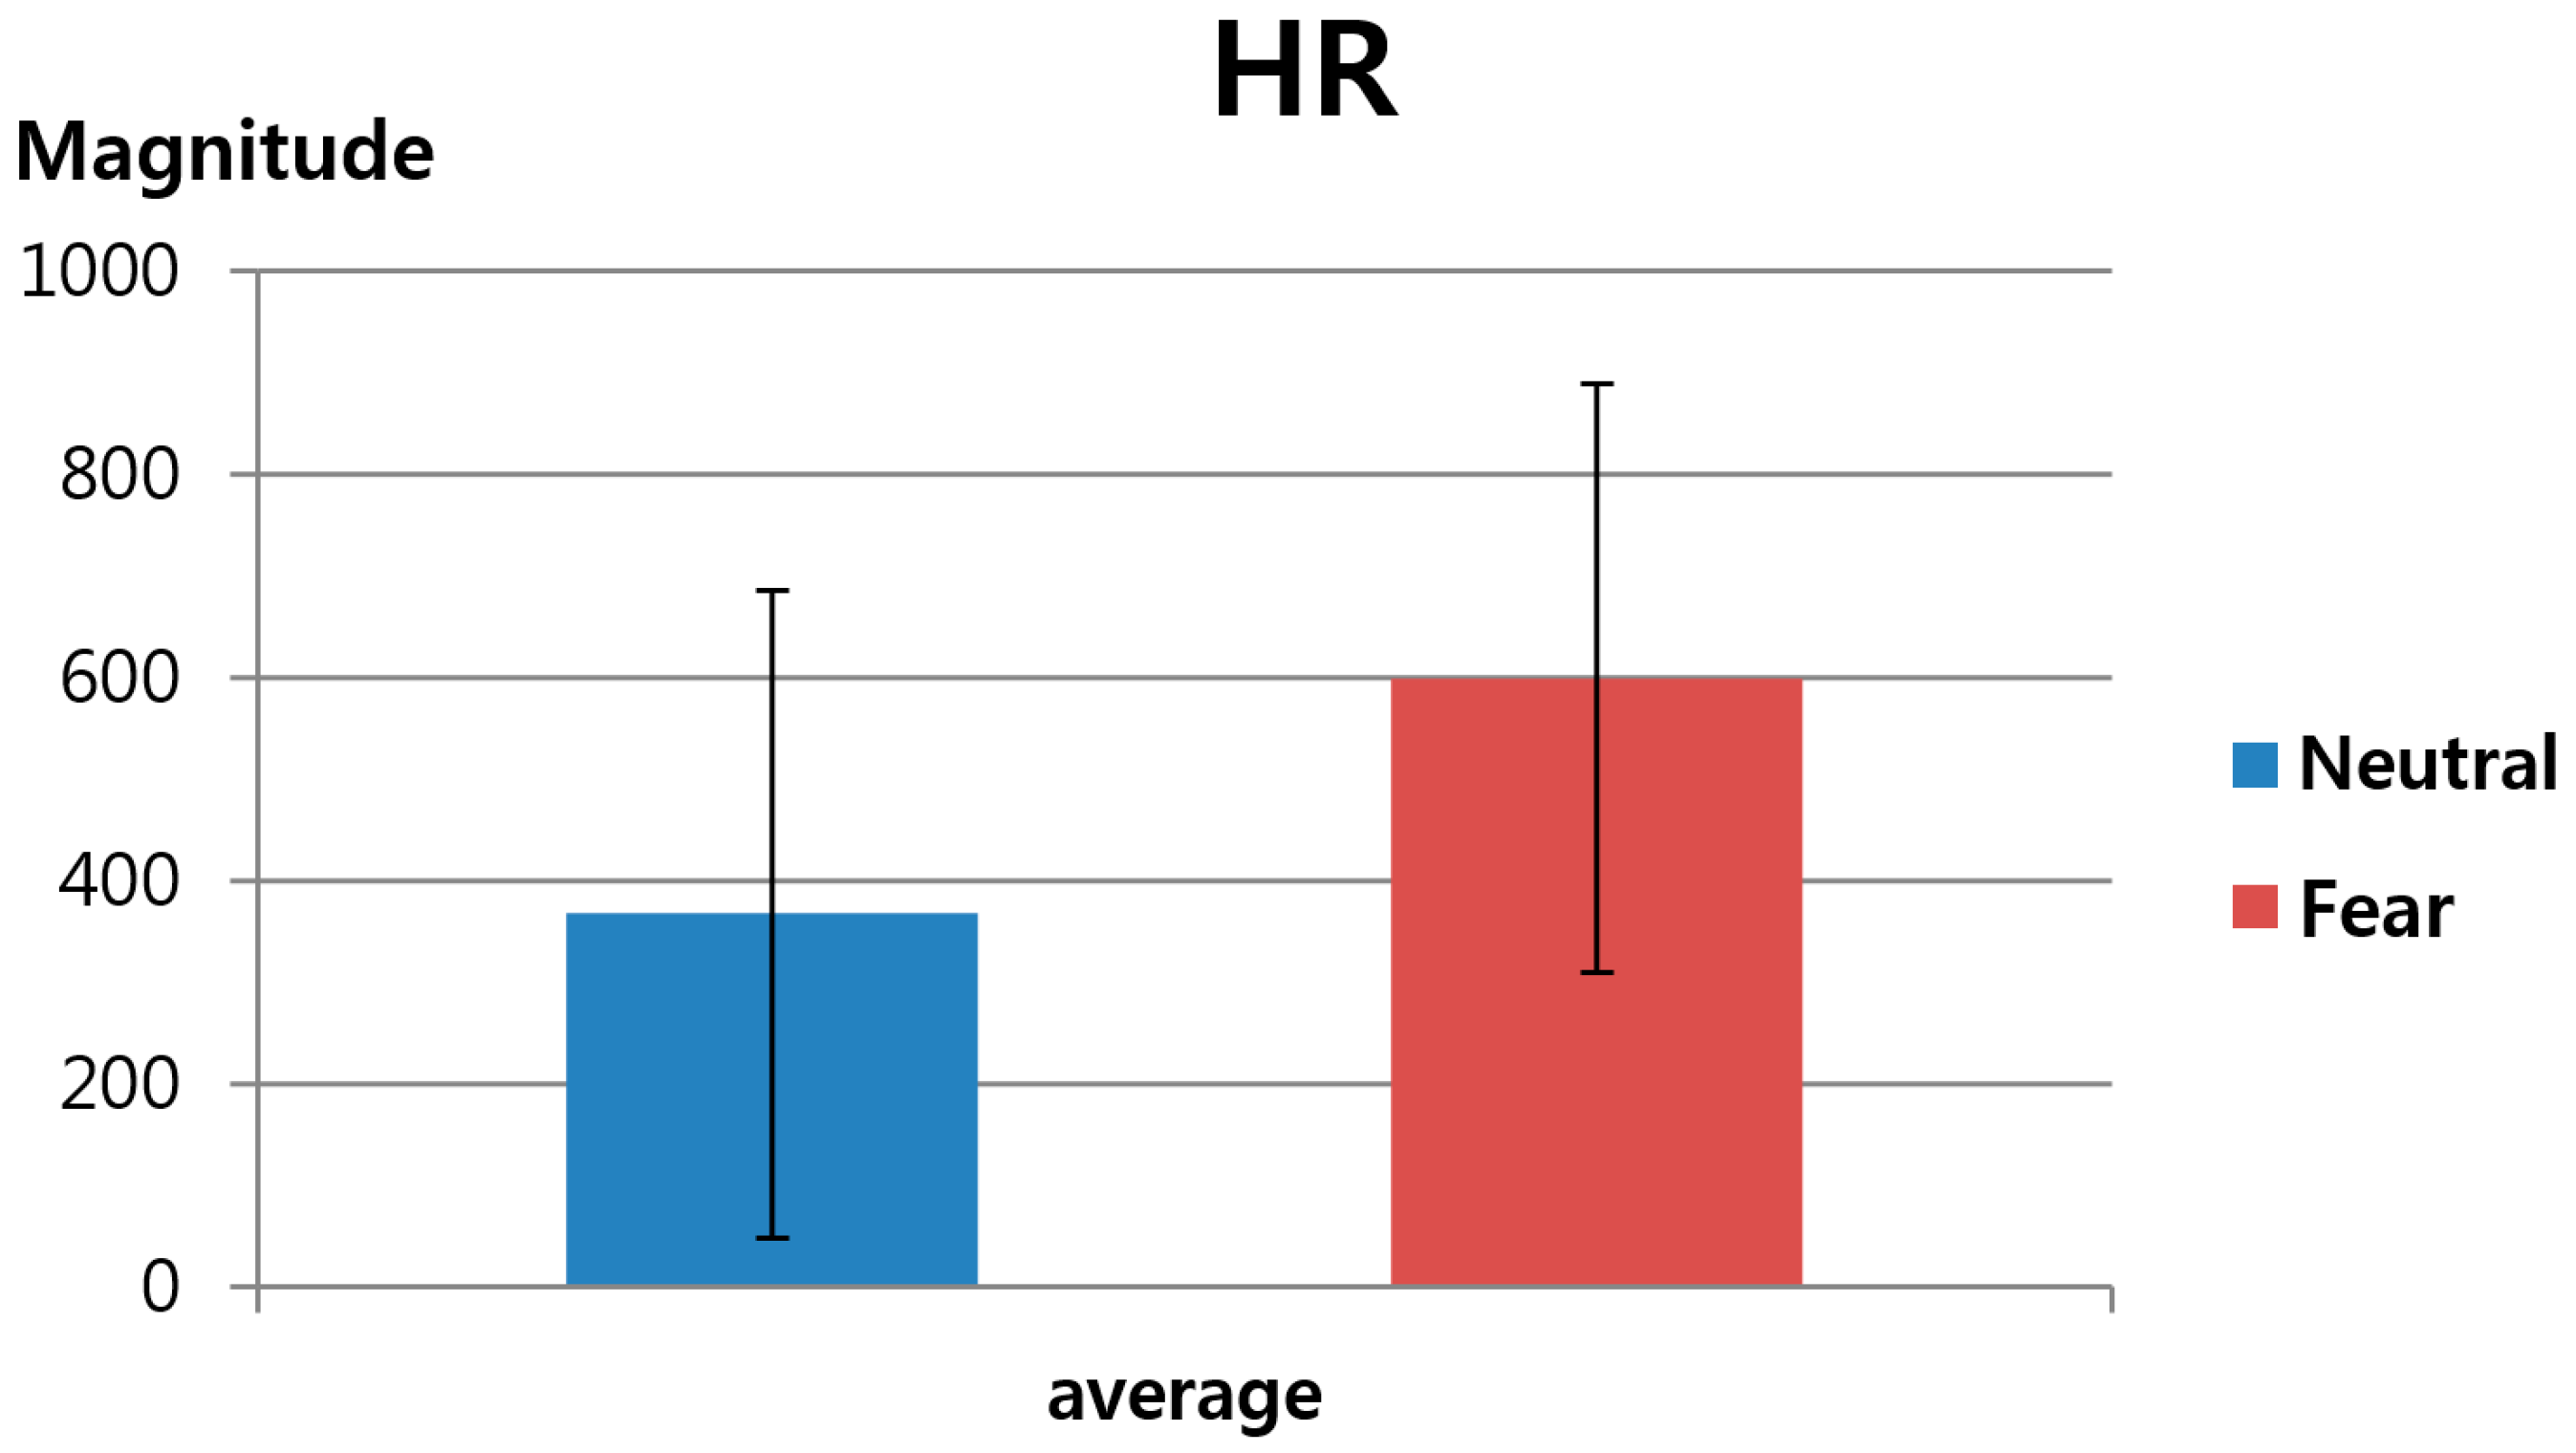
The second feature value was FT-based HR, as explained in
Section 3.3. As shown in
Table 6 and
Figure 13, this study measured the change in HR before and after watching neutral images versus before and after watching horror movies. Here, again, the HR calculated based on the average FT value of the five ROIs indicated in
Figure 5 was used as the second feature value in order to reduce the influence of the partial changes in FT. As shown in
Table 6 and
Figure 13, the
p-value for HR was 0.054867, which is higher than 0.05, indicating that the change in HR before and after watching horror movies was less significant than the change in HR before and after watching neutral images at the confidence level of 95%. In other words, it is assumed that feature value 2 did not show a statistically significant result to be used in the fuzzy system.
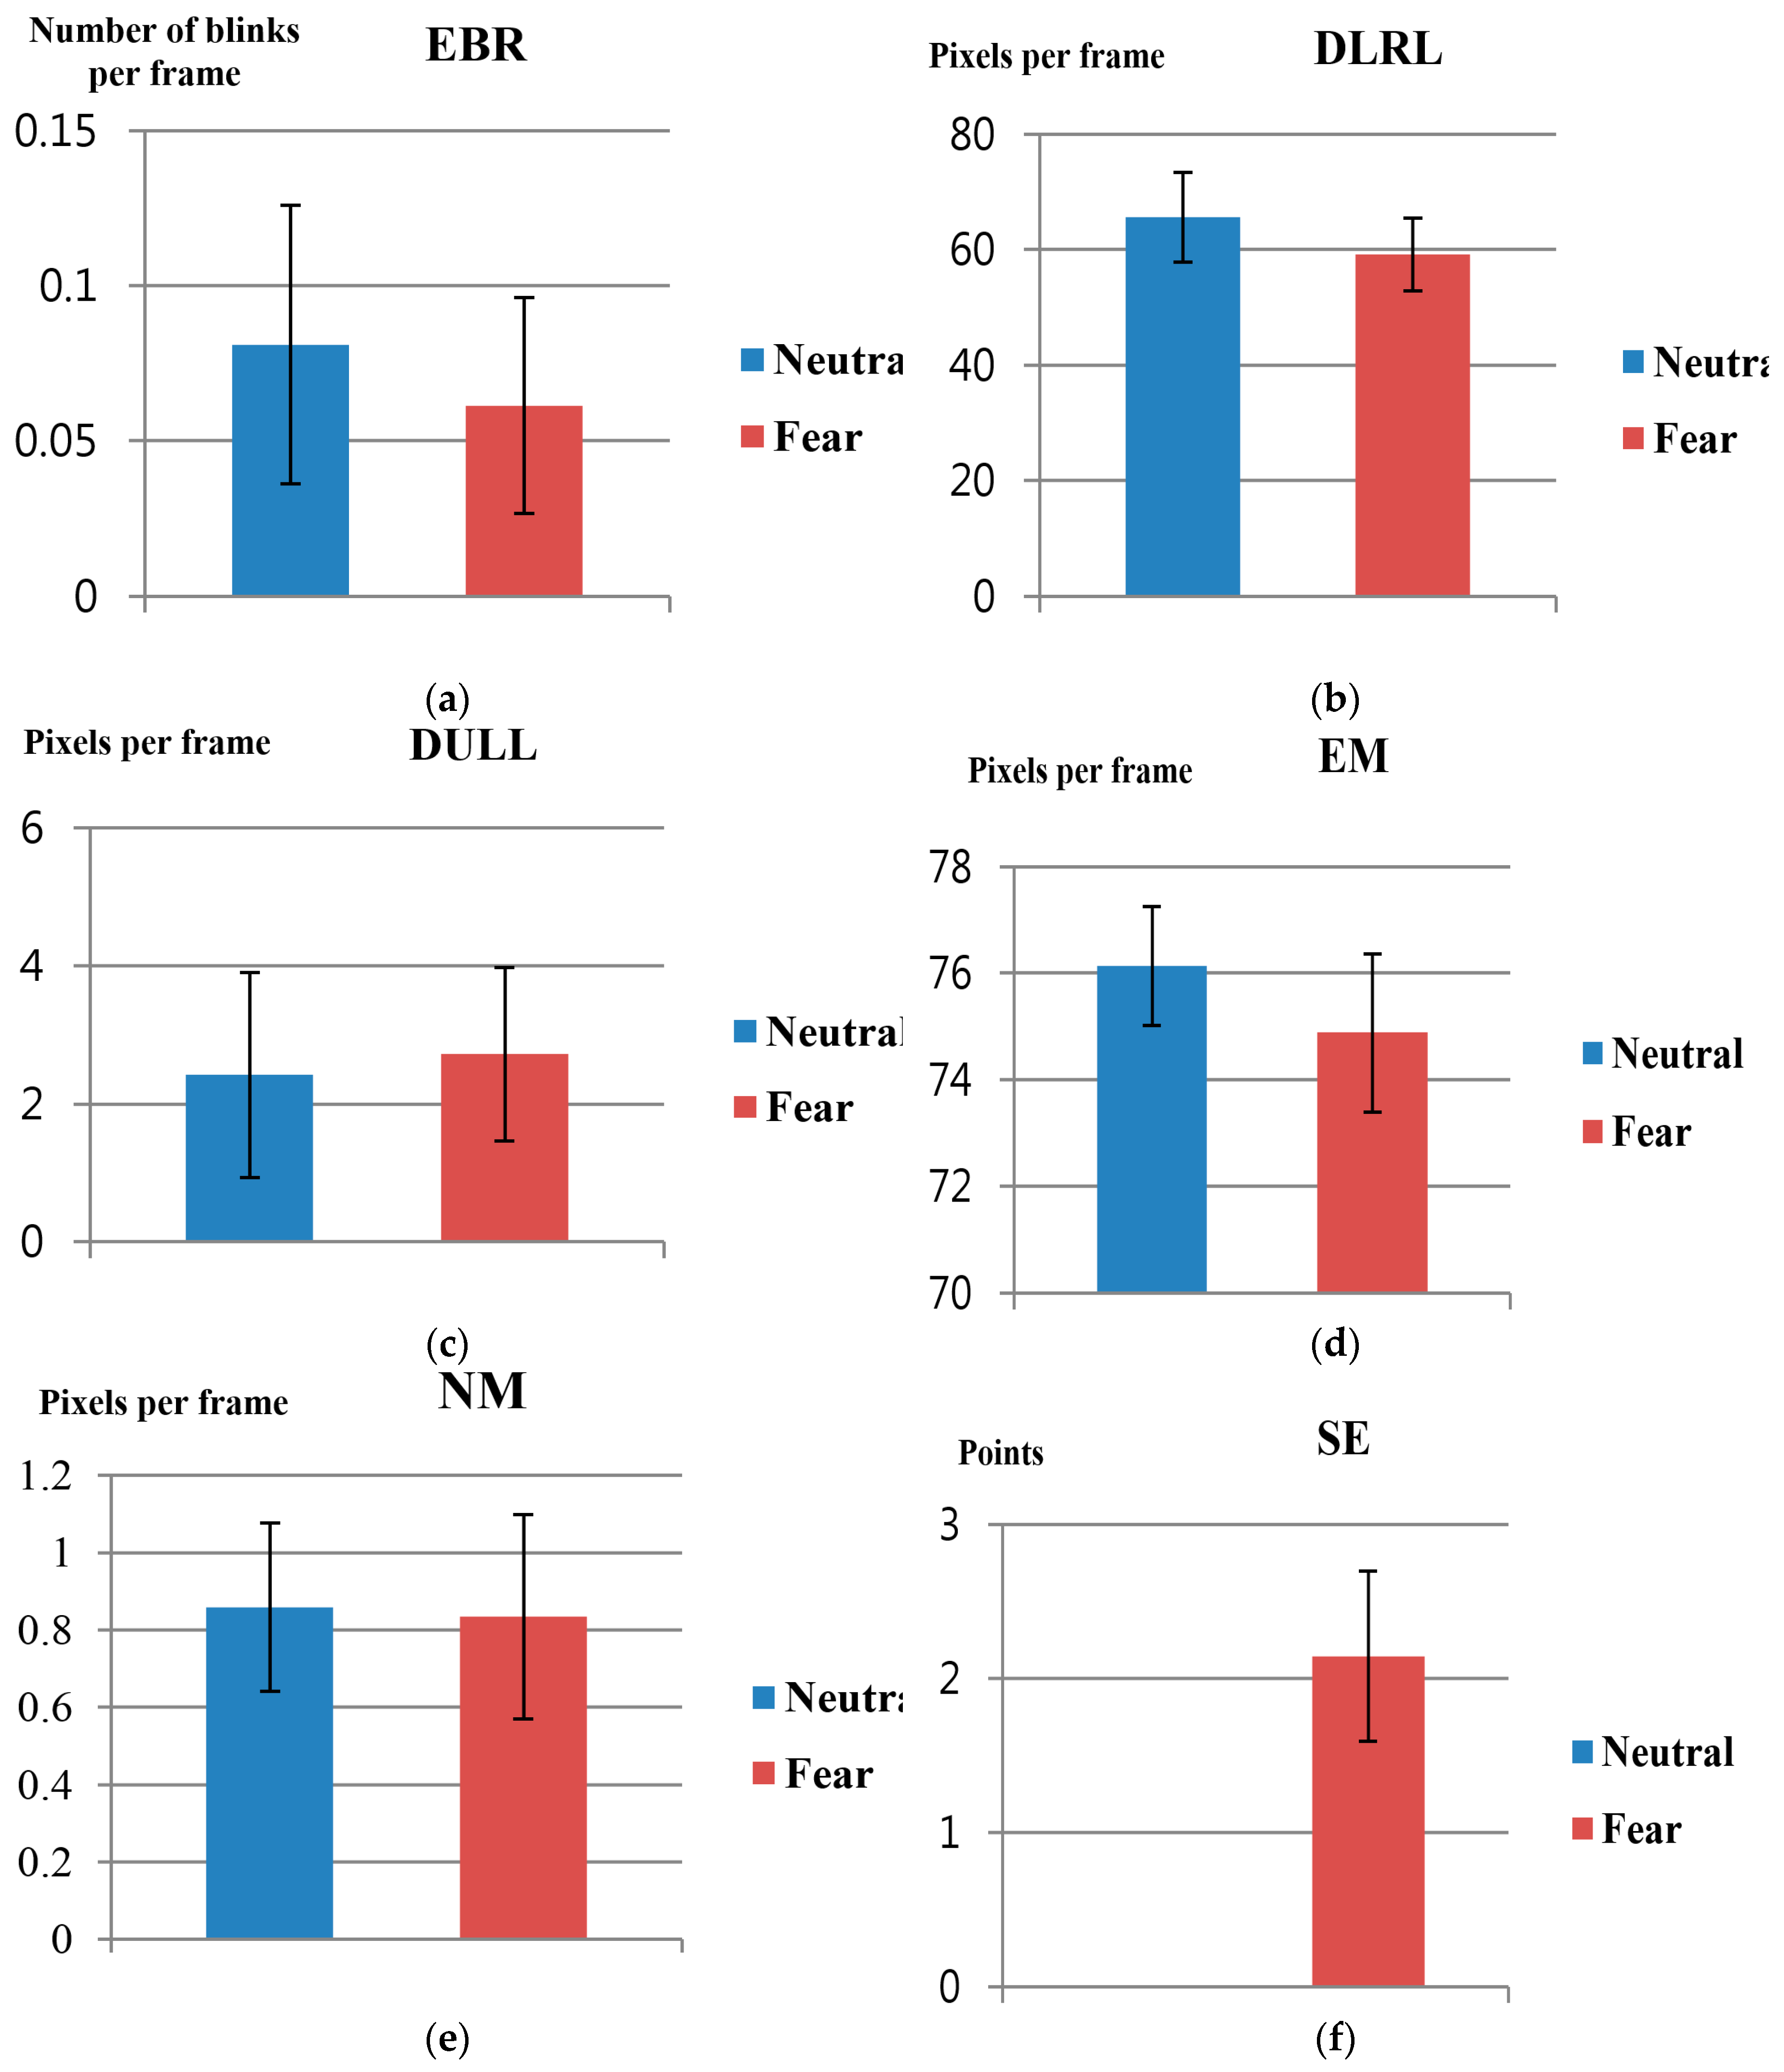
As a subsequent step,
t-tests for feature values 3 to 8 (EBR, DLRL, DULL, EM, NM, and SE) explained in
Section 3.4 and
Section 3.5, were conducted. Here, the
p-value for changes in feature value before and after watching neutral images versus before and after watching horror movies were also measured, as in
Table 7 and
Figure 14. As for SE, the average and standard deviation values were 0 since there was no difference in fear before and after watching neutral images.
In
Table 7, as for SE (
p-value: 1.97 × 10
−9), it can be assumed that it indicates the confidence level of 99% since
p < 0.01. In addition, as for DLRL (
p-value = 0.021694) and EM (
p-value = 0.013202), it can be assumed that it indicates the confidence level of 95% since
p < 0.05. As for the rest: EBR, DULL and NM, it can be assumed that the results have lower confidence levels compared to SE, DLRL, and EM since the
p-values are higher than 0.05 and also higher than those of SE, DLRL, and EM. From these findings, it can be inferred that FT, SE, DLRL, and EM are the most significant feature values as they show differences in values before and after watching neutral images vs. those before and after watching horror movies, based on confidence levels of 95%.
In addition, in this study, the confidence level of the feature values was double-checked through Cohen’s d analysis. The effect size obtained through the analysis is a descriptive statistic method used to indicate the confidence level of the observed phenomenon. In general, Cohen’s
d values of 0.2, 0.5, and 0.8 are defined as small, medium, and large effect sizes, respectively [
32,
53]. Cohen’s
d value shows the difference between two average values (before and after watching neutral images versus before and after watching horror movies), divided by the standard deviation of the data. Therefore, medium and large effect sizes suggest higher confidence levels for the difference between the two observed values than small effect sizes [
32,
53].
Table 8 shows Cohen’s
d value and effect sizes of 8 feature values before and after watching neutral images versus before and after watching horror movies. For example, the Cohen’s
d values for FT and EM are closer to 0.5 than to 0.8, thus falling into the category of medium effect size. For SE and DLRL, the values are closer to 0.8, thus falling into the category of large effect size. As shown in
Table 8, since the Cohen’s
d values for SE, FT, EM, and DLRL are greater than those of the rest of the four feature values (HR, EBR, DULL, and NM), while at the same time, corresponding to large effect sizes, it is suggested that the difference in values have a higher confidence level when watching horror movies than when watching neutral images.
Based on the results of the t-tests and Cohen’s d analysis, the four feature values (FT, SE, EM, and DLRL) with high confidence levels are used as input data to the fuzzy system in this study.
As a subsequent study, the accuracy level of fear recognition by the five defuzzification methods and Min or Max rule explained in
Section 3.6 was measured. Since there was no ground-truth data on fear, the accuracy level was measured based on the correlation average between the value obtained by the proposed fuzzy system method and eight individual feature values (SE, FT, DLRL, EM, HR, EBR, DULL, and NM). As shown in
Table 9, the average correlation value was the highest when the BOA method was used together with the Min rule. As for the COG, BOA, and MOM with Max rule, the average correlation values were not available (N/A) due to the final output values obtained by COG, BOA, and MOM with Max rule being 0.5 in all instances, thus resulting in 0 standard deviation and an inability to obtain correlation values.
Table 10 shows the average correlation values with the rest of feature values when each feature value was used individually and when the fuzzy system was used. We do not use any assumption that calculated correlation is positive or negative. Therefore, some correlation values are positive whereas others are negative. When we calculate the correlation average (sum), the original positive or negative correlation values are used (instead of the absolute value). From the study, it is seen that using output values from the fuzzy system—which uses four feature values (SE, FT, DLRL, and EM) selected through
t-tests and Cohen’s d analysis as input data—higher average correlation values are observed compared to when using the other individual feature values. Based on this finding, it is suggested that the level of fear measured by the proposed methods has a higher confidence level. In addition, as shown in
Table 10, the proposed method in this study was more accurate than the existing method [
21], which uses SE, FT, and EBR individually. The existing study [
27] also showed results where the average correlation values decrease in the following order: FT, SE, and EBR. The results derived from
Table 10 indicate the same order, showing consistency with the existing study results. In terms of machine learning, more correlation can mean more redundancy. However, ground-truth value (ground-truth fear value in our research) is necessary to reduce the redundant features. For example, the optimal (reduced) number of features (eigenvectors) can be determined in principal component analysis (PCA) based on the minimum error between the ground-truth value and predicted one of training data [
54]. In our research, we do not have ground-truth fear value. Therefore, we use the average correlation value as the selection criterion, with the assumption that all the feature values can be used as good predictors of fear.
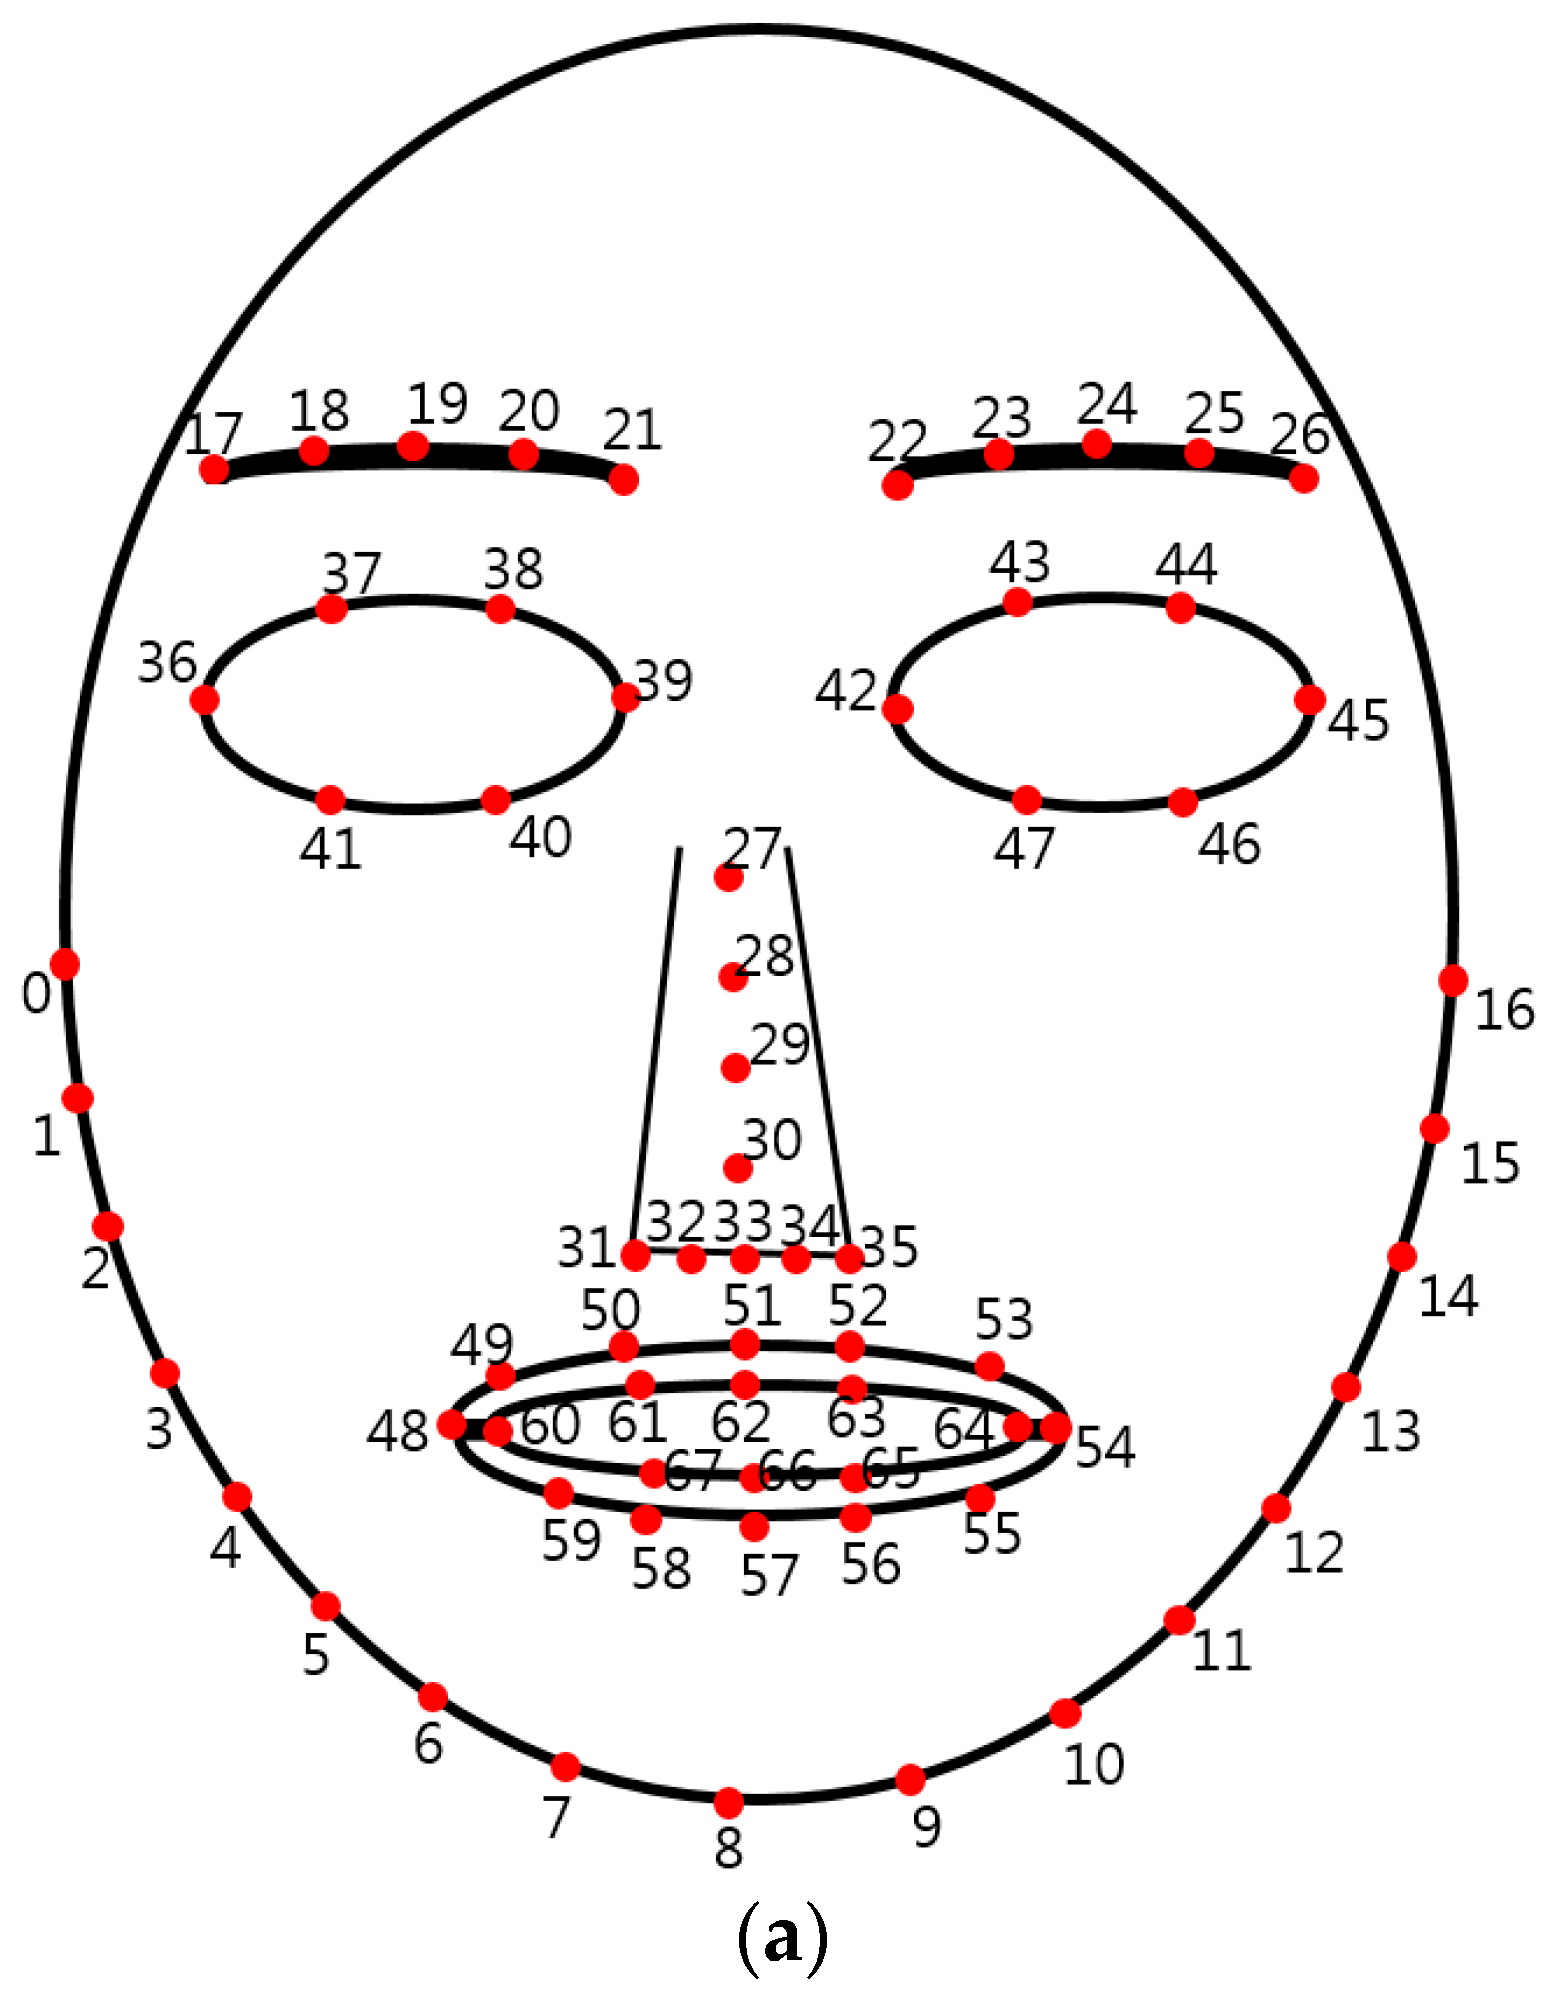
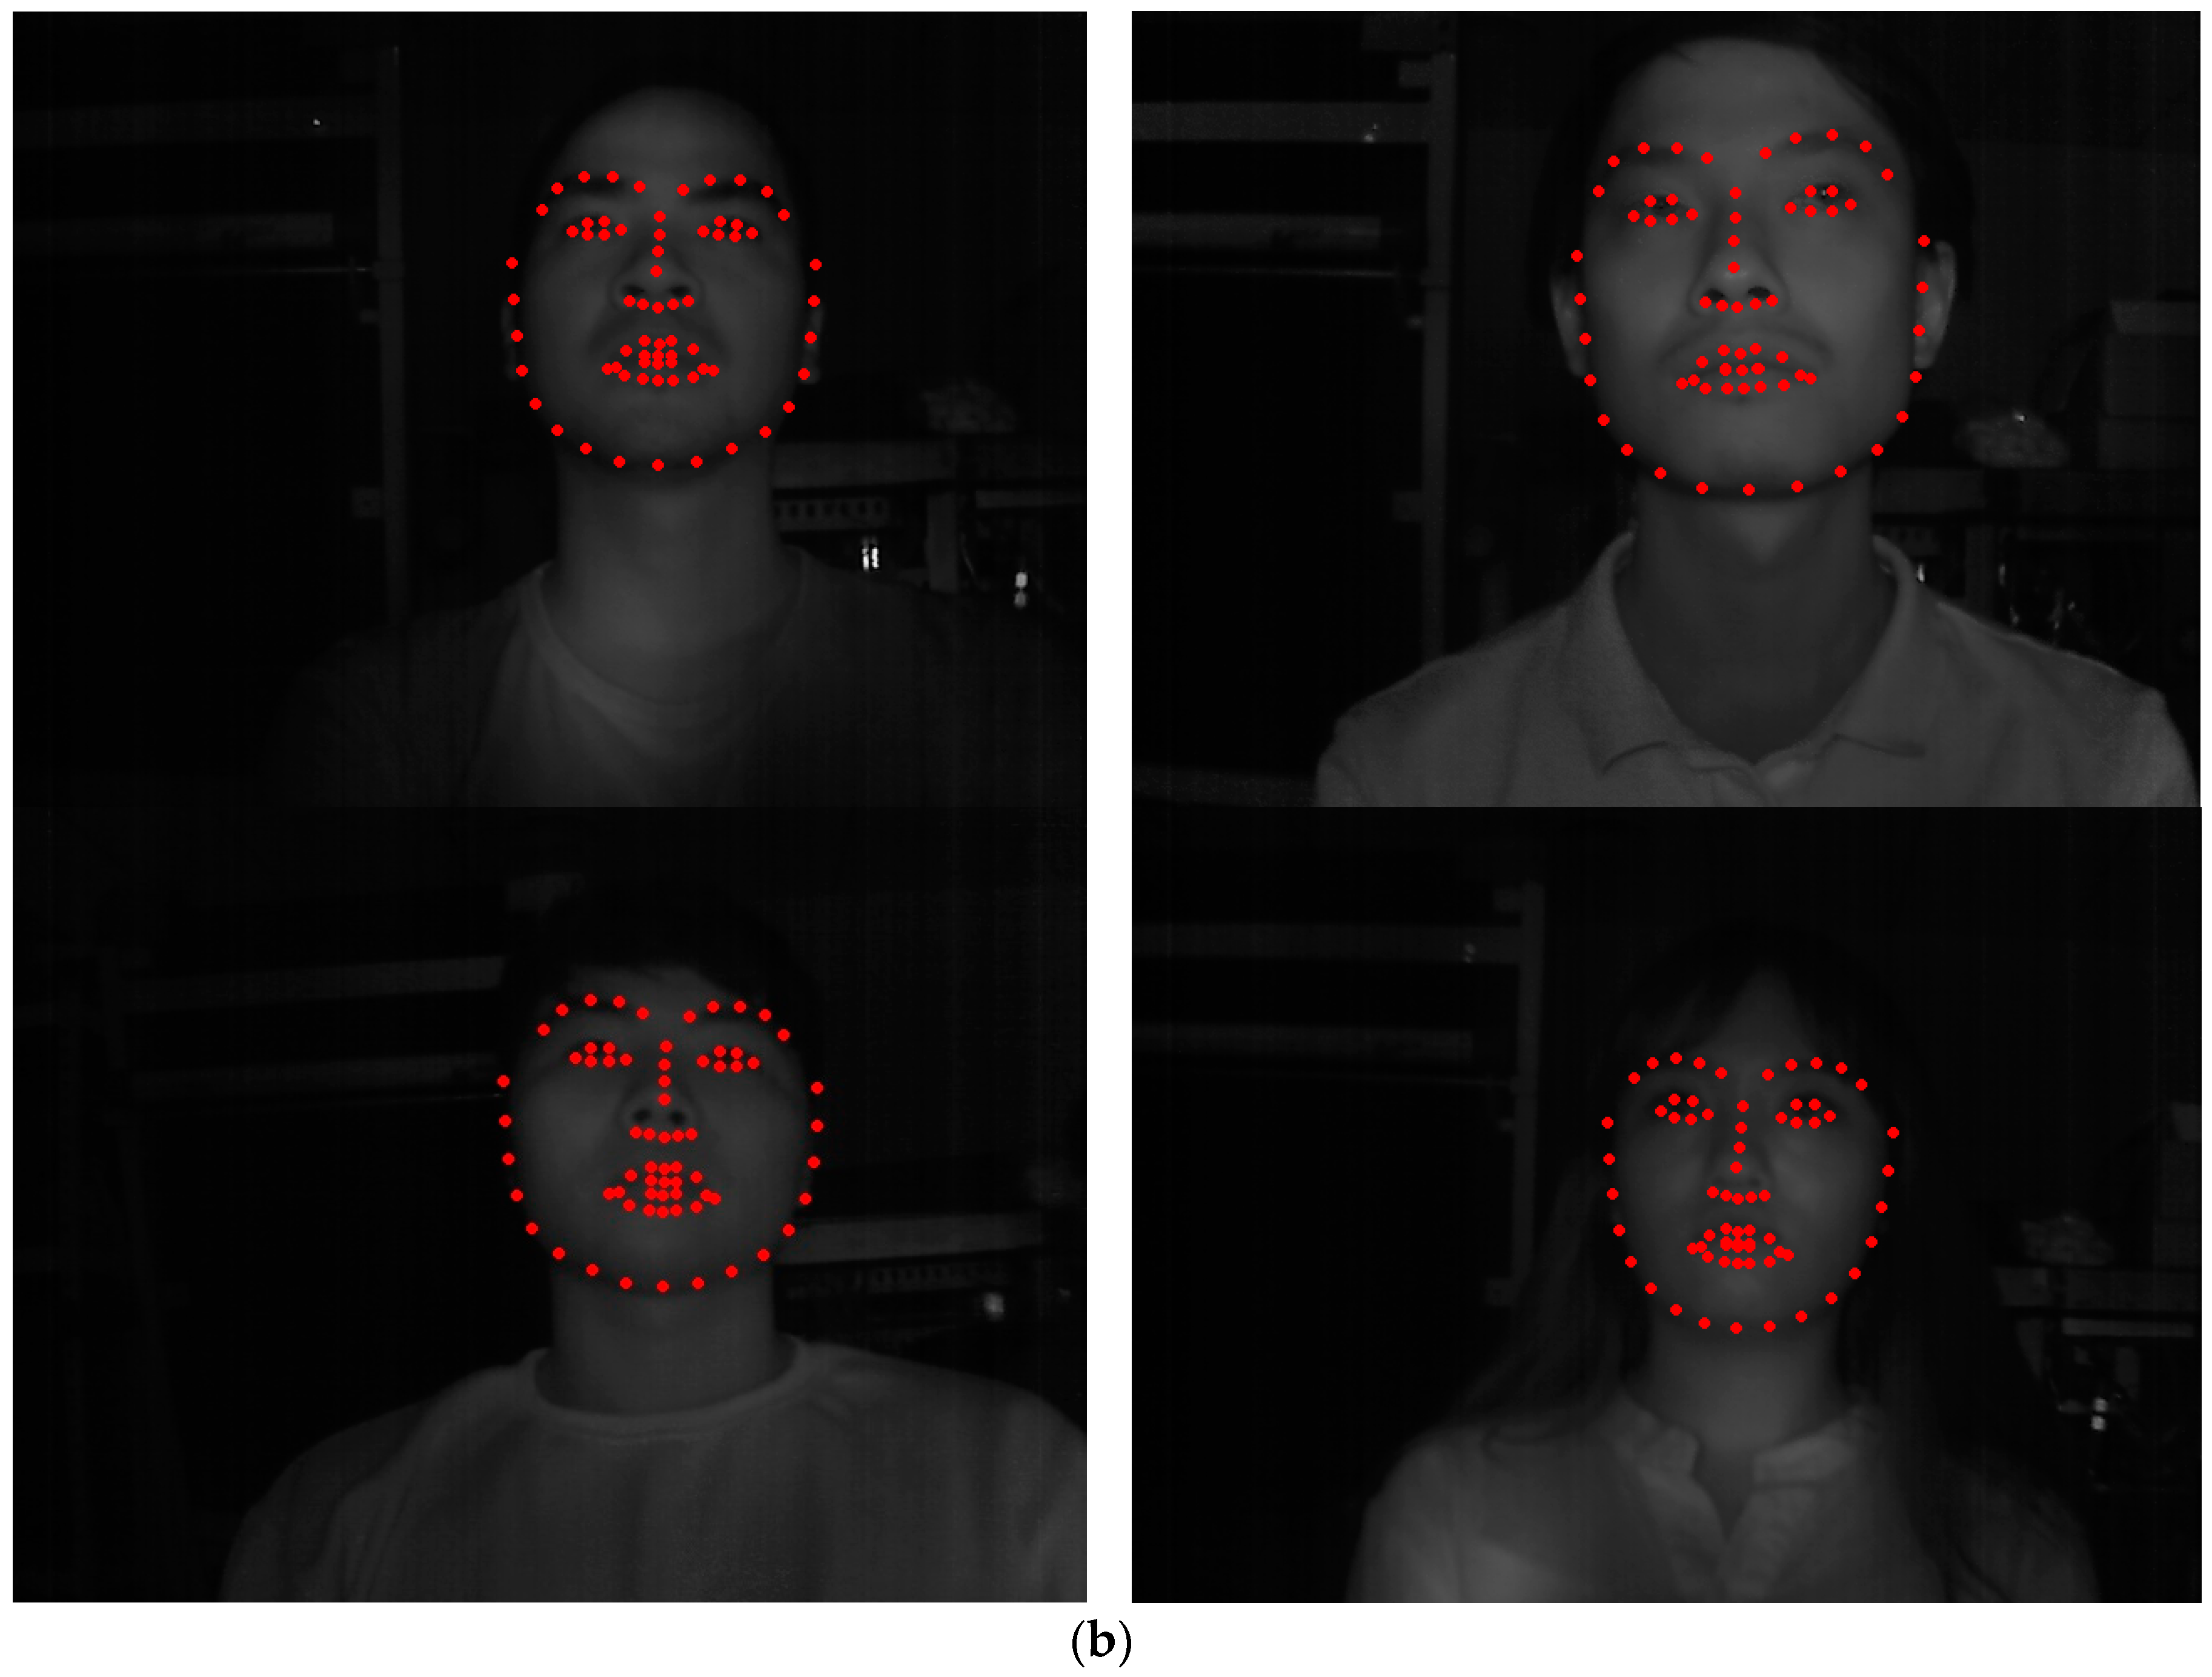
We measured the average detection errors of 68 feature points of
Figure 6a with experimental images. The average detection errors are 1.39 pixels, 1.81 pixels, and 2.73 pixels in the x-axis, y-axis, and diagonal directions, respectively. The detection error is measured based on the distance between the ground-truth position manually marked and that detected by our algorithm. To evaluate the impact of the error in the localization of feature points on the overall accuracy, we consider the eight cases that the errors (artificially and randomly generated) are reflected on the positions of detected feature points with some probability as shown in
Table 11. The first one is that the maximum error of ±1 pixel is included in the detected feature positions with the probability of 30%, whereas the second one is that the maximum error of ±2 pixels is included in the detected positions with the probability of 30%. The third and fourth cases are that the same errors are reflected with a probability of 50%. The fifth one is that the maximum error of ±3 pixels is included in the detected positions with the probability of 30%, whereas the sixth is that the maximum error of ±4 pixels is reflected on the detected positions with the probability of 30%. The seventh and eighth cases are that the same errors are included with the probability of 50%. Because these errors are included in the
x and
y positions of the detected feature points, the maximum error of ±1 corresponds to about 55.2% ~ 71.9% of the average detection errors (1.39 pixels and 1.81 pixels in
x-axis and
y-axis directions, respectively), whereas the maximum error of ±2 corresponds to about 110.5% ~ 143.9% of the average detection errors. In addition, the maximum errors of ±3 and ±4 correspond to about 165.7% ~ 215.8% and 221% ~ 287.8% of the average detection errors.
As shown in
Table 10, the accuracy of our system is shown based on the correlation average with the rest of feature values (SE, FT, EBR, DLRL, DULL, NM, HR, and EM), and the higher correlation average represents the higher accuracy of fear evaluation. As shown in
Table 11, in the first, second and third cases, the correlation average is 0.2651 which is same to our original result (where no error is included). In the fourth case (maximum error of ±2 pixels with probability of 50%), the correlation average is a little reduced, but the decrement is very small (0.0001) compared to our original result of 0.2651. However, in case the maximum error is increased to ±3 pixels or ±4 pixels (from the fifth to the eighth cases), the decrement of correlation average is increased, as shown in
Table 11. From that, we can confirm that the impact of error in the localization of the facial feature points on the overall accuracy is low until the error reaches a maximum of ±2 pixels (110.5% ~ 143.9% of the average detection errors).
As shown in
Table 5 and
Table 7, the
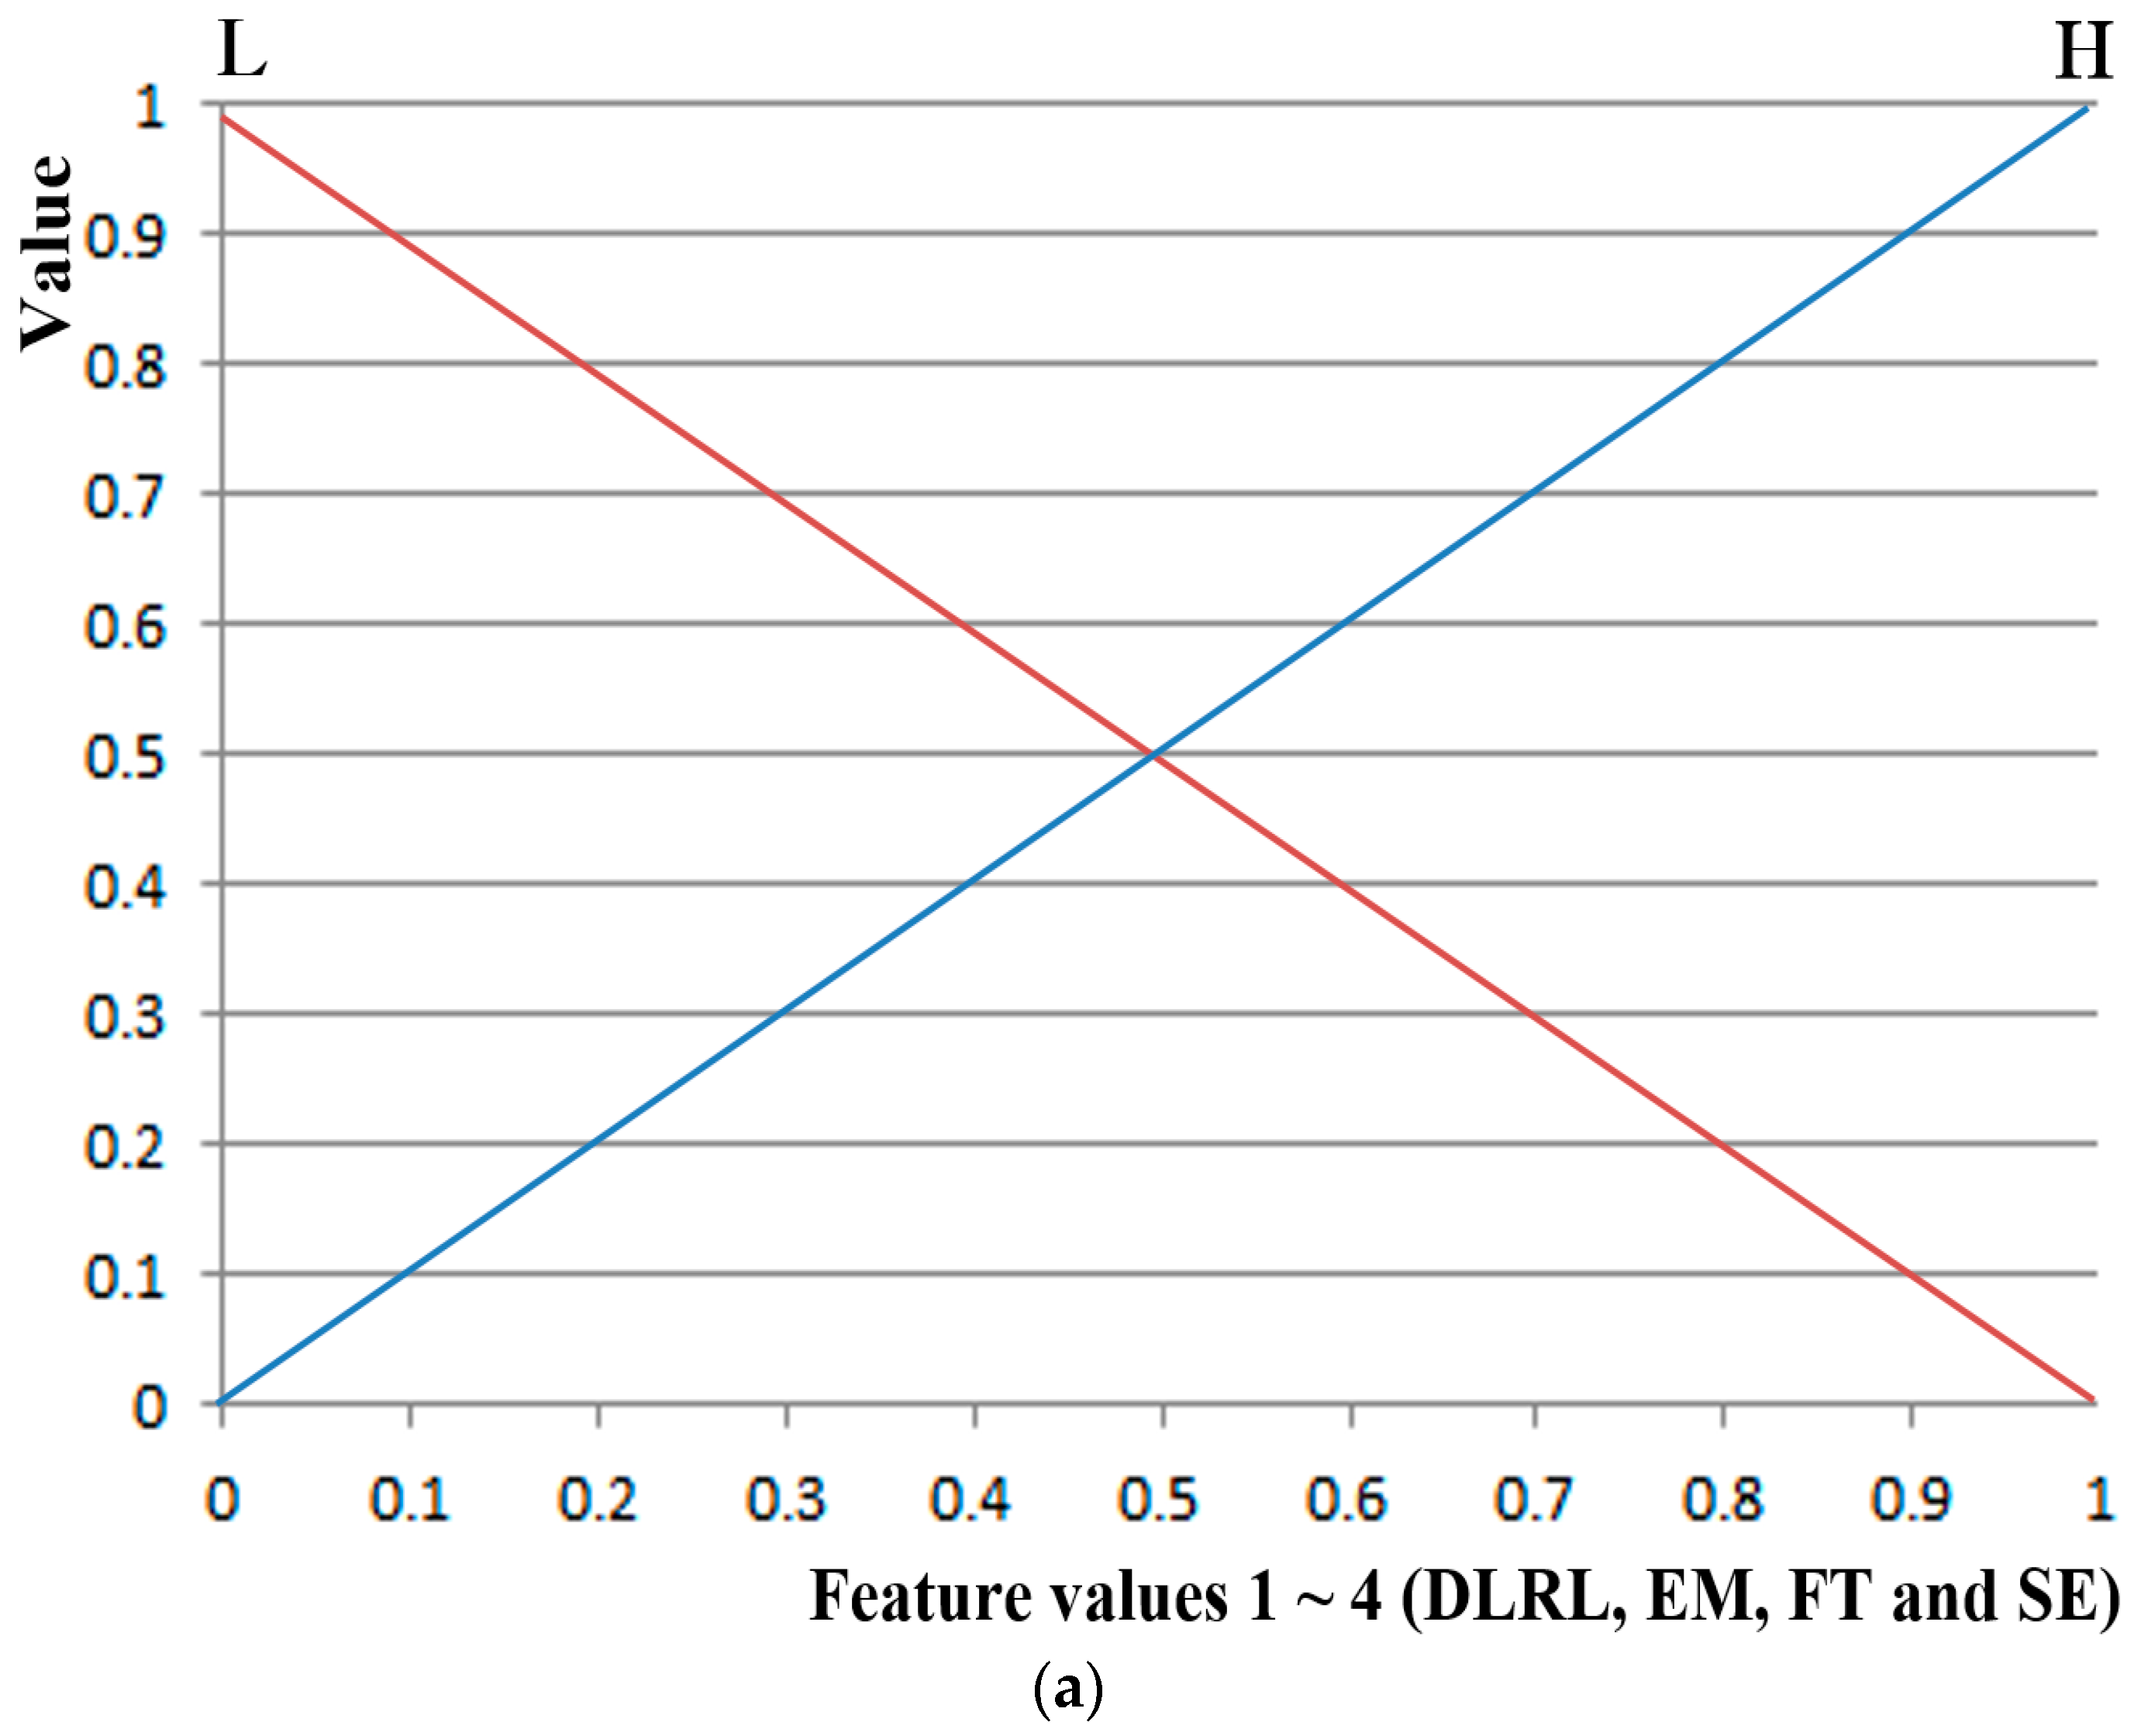
p-values of FT and SE are lower than 0.01 (confidence level of 99%) whereas those of DLRL and EM belongs to the range from 0.01 to 0.05 (confidence level of 95%). Therefore, the credibility of FT and SE is regarded as being higher than that of DLRL and EM. Based on that, we used the threshold of 0.3 in order to separate the four feature values of
Table 4 into two groups: FT with SE, and DLRL with EM. From them, we assigned the higher values for the first group (FT with SE) than the second group (DLRL with EM) in case of “H”, as shown in
Table 3. The other parameters of 0.5 and 0.25 for “H” (of the first and second groups) in
Table 3 were heuristically determined. By observing the small (preliminary) experimental data, we tried to find the optimal parameters, and these data were not used for our testing of
Section 4 for fair experiments. We evaluated the robustness of our method with respect to the parameters as shown in
Table 12. For example, the first case of
Table 12 shows that the values of 0.5 and 0.15 are assigned to “H” in
Table 3 for the first (FT and SE) and second (DLRL and EM) groups, respectively. The sixth case of
Table 12 shows that the threshold of 0.2 is used for
Table 4, that is, SE, FT, and EM become the first group whereas DLRL is the second group. As shown in
Table 12, the correlation average with our original parameters is higher than other cases. From that, we can confirm that our parameters can be regarded as optimal, and the accuracy can be reduced with other parameters.
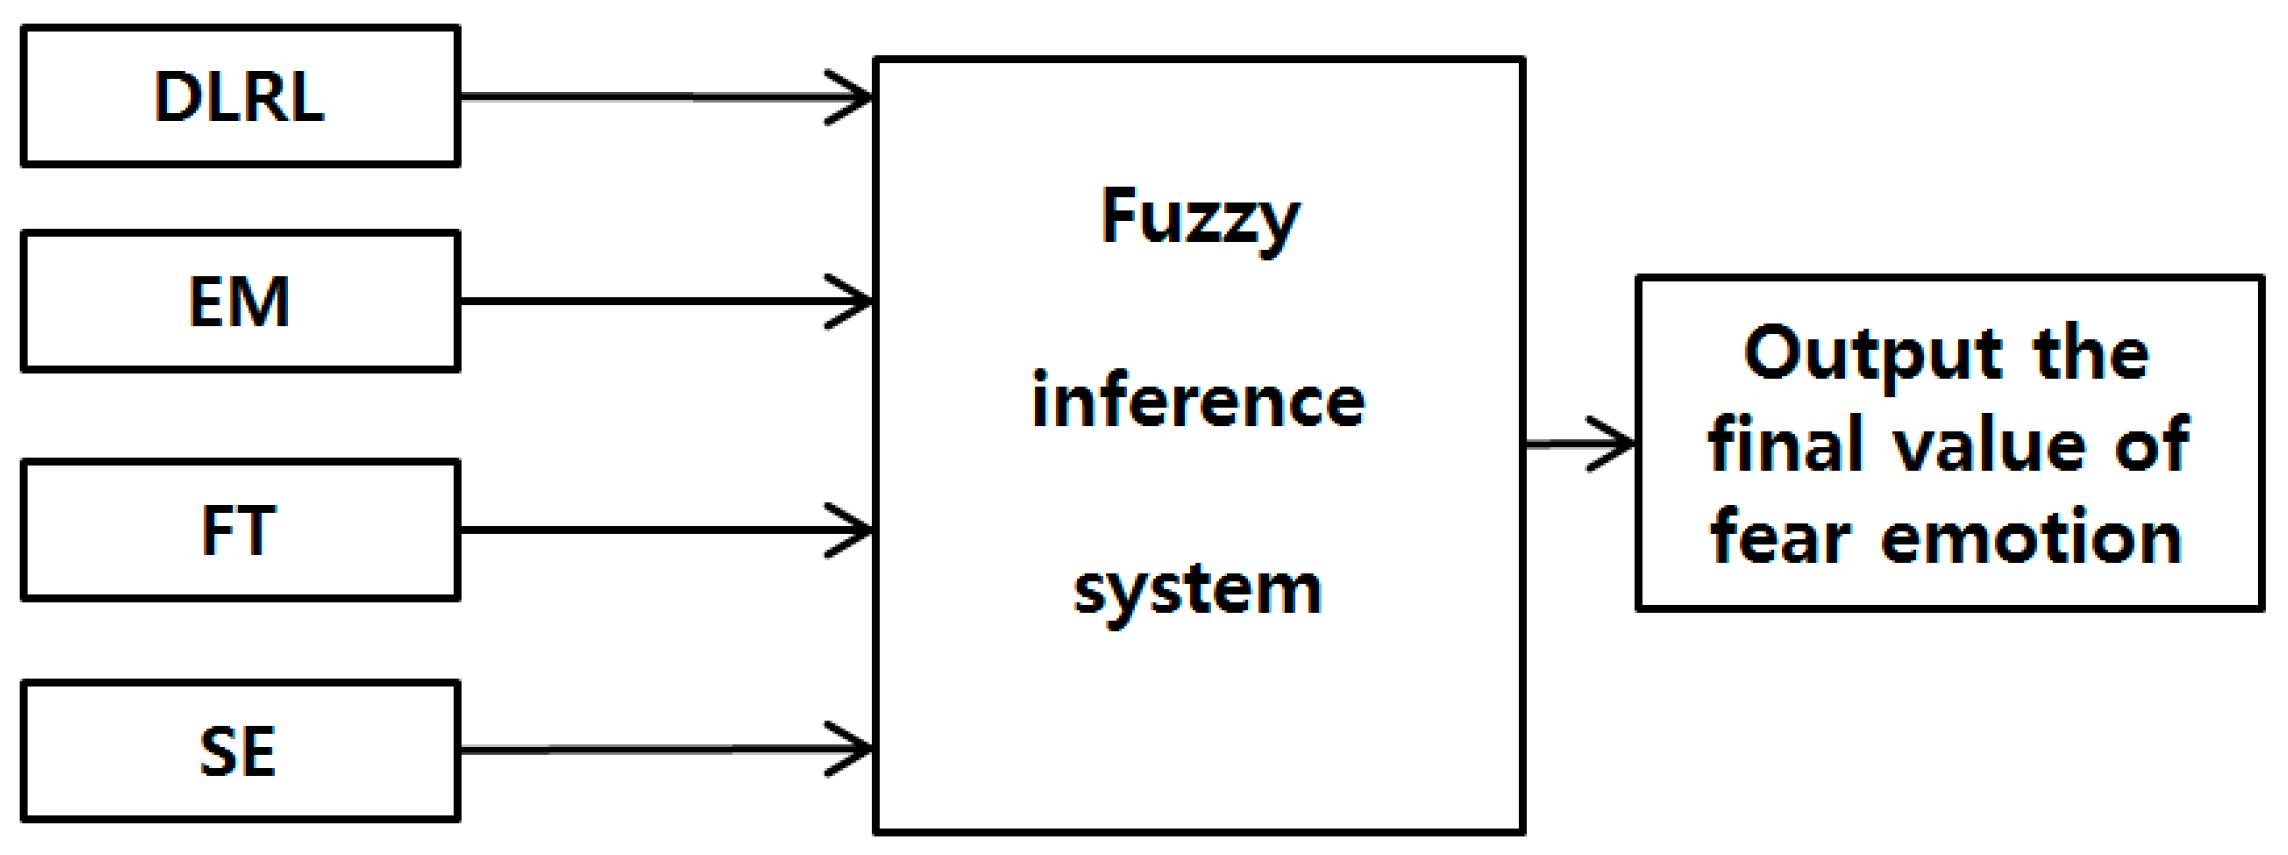
As the last experiment, we compared the performance in case of using seven features (without SE) and eight features (with SE). In
Figure 7, we replaced SE by HR which was selected in terms of smaller
p-value of
Table 5,
Table 6 and
Table 7 and higher Cohen’s
d value of
Table 8, and these four objective feature values of DLRL, EM, FT, and HR are combined by our fuzzy system. As shown in
Table 13, experimental results showed that the proposed method was more accurate than other methods, and its accuracy was higher than those in the case of using eight feature values including SE of
Table 10. From that, we can find that the accurate evaluation of fear can be possible only with four objective features values of DLRL, EM, FT, and HR based on our fuzzy system.
In order to measure the performance based on the machine learning approach (as a support vector machine), the ground-truth (desired) output is required for all the training data. However, in our case, there is no ground-truth (desired) output of level of fear, and it is difficult to manually determine the output value. For example, with one horror movie, we cannot determine the ground-truth level of fear, which can be different in different people. Therefore, a comparison with machine learning approaches cannot be performed. In contrast, our fuzzy system-based evaluation method of fear produces a level of fear in the range of 0 to 1, which does not require a training procedure with the ground-truth (desired) output of level of fear.
The main application of our system is for the quantitative evaluation of the level of fear induced by commercial horror movies. When a moviemaker makes horror movies, it is very difficult to quantitatively and objectively evaluate the level of fear that audiences would feel. Therefore, it has been evaluated based only on subjective tests using audience questionnaires. However, the results can be highly affected by the physical, psychological, or fatigue condition of participants, so these questionnaires cannot show the accurate and objective measurement of the level of fear. Therefore, we propose the multimodalities-based fear evaluation method using 4four features such as DLRL, EM by near-infrared (NIR) light camera, FT by thermal camera, and SE. In addition, by using four objective features except for SE and combining them in a fuzzy system, our system can produce the accurate level of fear not affected by the physical, psychological or fatigue condition of participants on SE. Therefore, we performed various tests with four commercial horror movies [
48,
49,
50,
51] with the prototype of our system as shown in
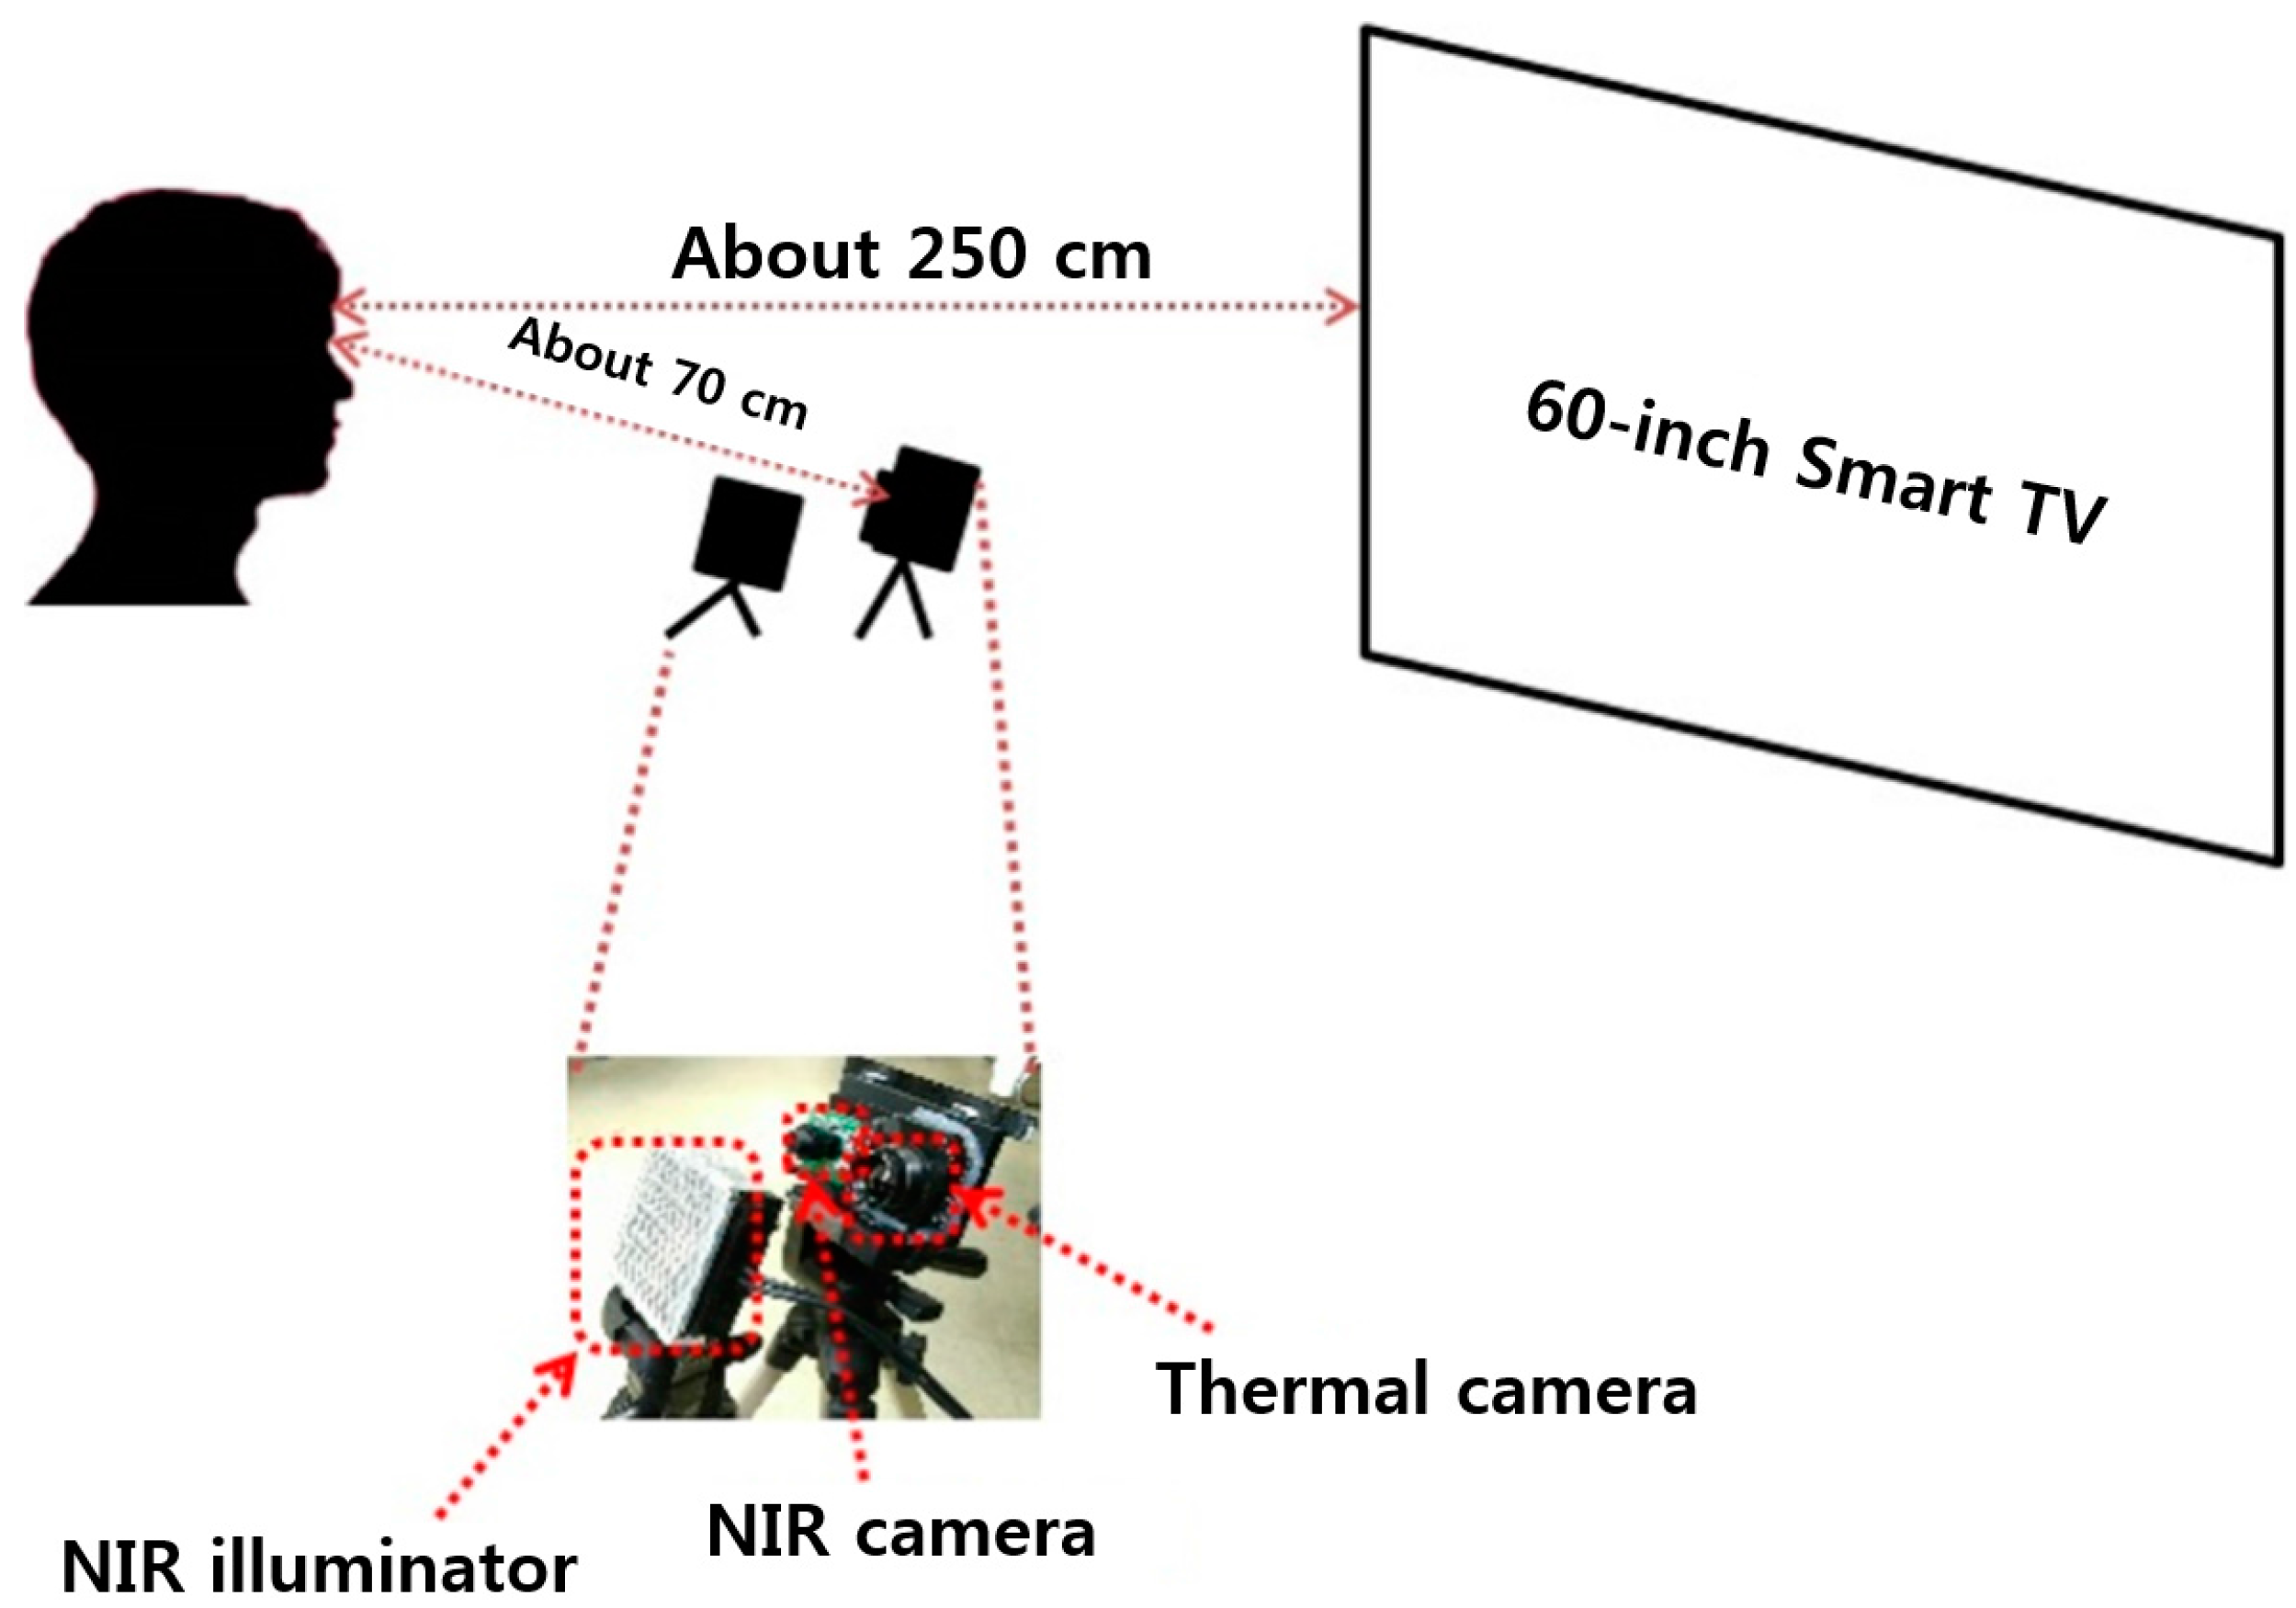
Section 4. This kind of evaluation of the level of fear can be actually performed with some participants before final production and release of horror movie. For example, if a movie scene cannot cause a high level of fear of participants, the moviemaker can revise the scene by including additional sound effects or lighting, etc., while doing the post-processing. This can be feasible considering the conventional procedures of moviemaking. Therefore, our system cannot be attached to the ceiling or walls at a great distance from the audience. Instead, our system can be used at a distance of about 70 cm in front of the audience (not obscuring the line of sight) as shown in
Figure 2, and experiments were performed according to the scenarios of
Figure 11 considering the situation of evaluation of the level of fear with some participants before final production and release of a horror movie. Our system can also be used for quantitative evaluation of the level of fear of a horror drama, advertisement, or game before final production and release. In addition, we can consider a scenario of using our system for monitoring the clerk in a convenience store. By attaching our system on a low ceiling in front of the clerk at the counter (at a distance of about 70 cm), based on the evaluated level of fear, our system can perceive an emergency situation that the clerk cannot report to the police although he or she is being threatened by a robber. In this case, our system can automatically call the police.
Because our fuzzy system produces an output in the range of 0 to 1, 0 represents no fear and 1 shows the highest level of fear. Therefore, our system can evaluate the intensity (continuous level) of fear. Ekman defined the emotions and the activation of action unit. According to his research [
55], fear is related to the movement of action units of eyebrow and lip, etc. Because our experimental results showed that EM and DLRL are more affected by fear, as shown in
Table 8, our results are consistent with the studies by Ekman. However, he did not define the changes in facial temperatures or heart rate in case of fear, so we also measured these features of changes in FT and HR by thermal camera. Fear can be confused with anger in many cases. Also in our experiments, the measured emotion can be a mixture of fear and anger instead of only fear. However, separating fear alone from mixed emotions was not attempted in our research, as it can be regarded as very challenging work. Nevertheless, just for the applications mentioned above, the fear confused with other emotions measured by our system can be useful. In addition, DLRL is only affected by fear (not by other emotions such as happiness, sadness, surprise, anger, disgust, and contempt), as shown in the studies by Ekman [
55]. Because we use DLRL and SE with a questionnaire only about fear (as shown in
Table 2) for two inputs to fuzzy system as shown in
Figure 7, we can guess that fear is the largest component of the measured emotion. In future work, we would do more intensive research on measuring only fear by separating it from other emotions.


