1. Introduction
Major public health emergencies expose populations to biological risk, informational uncertainty, emotional disruption, and competing messages. Communication is therefore not a peripheral activity but a core component of emergency response. Emergency risk communication guidance emphasizes that people must be able to make informed decisions and adopt protective actions under uncertainty [
1]. The COVID-19 pandemic also demonstrated that the public does not merely face a shortage of information. It often faces too much information, inconsistent cross-channel content, unverified claims, and rapidly shifting expert interpretation [
2,
3,
4,
5,
6]. The Risk Information Seeking and Processing (RISP) model remains one of the most important theoretical frameworks for explaining why individuals seek risk information and how they process it. The original model links perceived hazard characteristics, affective response, informational subjective norms, information insufficiency, perceived information-gathering capacity, channel beliefs, information seeking, processing mode, and preventive behavior [
7]. Later developments, including the Planned Risk Information Seeking Model and meta-analytic evidence, reinforced the roles of information insufficiency and social norms [
8,
9]. RISP has been applied to health risks, online health information, vaccination, and outbreak settings [
10,
11,
12,
13,
14].
However, a major emergency infodemic differs from the environment implicitly assumed by many RISP applications [
15,
16,
17,
18]. First, exposure is random and multi-channel. Individuals do not choose from a fixed information menu; they encounter official updates, expert interviews, algorithmically ranked social-media posts, community messages, interpersonal discussion, and rumors [
19,
20,
21]. Second, trust is endogenous. Clear and coherent messages may increase trust, while delayed correction or visible inconsistency can reduce it. Third, misinformation does not simply add a negative covariate; it competes with official information for attention and may reshape future channel choices. Fourth, public health agencies need policy-relevant forecasts rather than static associations [
22,
23,
24]. They must decide how much to communicate, how quickly to clarify, whether to amplify experts, how to reduce overload, and how to use community engagement.
Despite the success of the RISP model and its extensions in explaining risk information behaviors, existing studies remain largely confined to static regression or structural equation modeling, which cannot capture the dynamic, stochastic, and nonlinearly evolving nature of modern infodemics [
25,
26,
27]. In contemporary information environments, individuals face daily stochastic information streams from multiple sources including official channels, experts, social media, community networks, and rumor outlets. These information inputs arrive asynchronously, often overlap or contradict one another, and dynamically reshape individuals’ trust states, cognitive load, and information processing strategies over time. The situation is further complicated by bidirectional coupling between individual heterogeneity, such as differences in trust propensity, health literacy, and information processing capacity, and external intervention policies including communication intensity, clarification speed, and community engagement. These characteristics render traditional analytical approaches based on static associations or mean regression inadequate [
28] for capturing the complex interactions between micro-level behaviors and macro-level emergence in an infodemic.
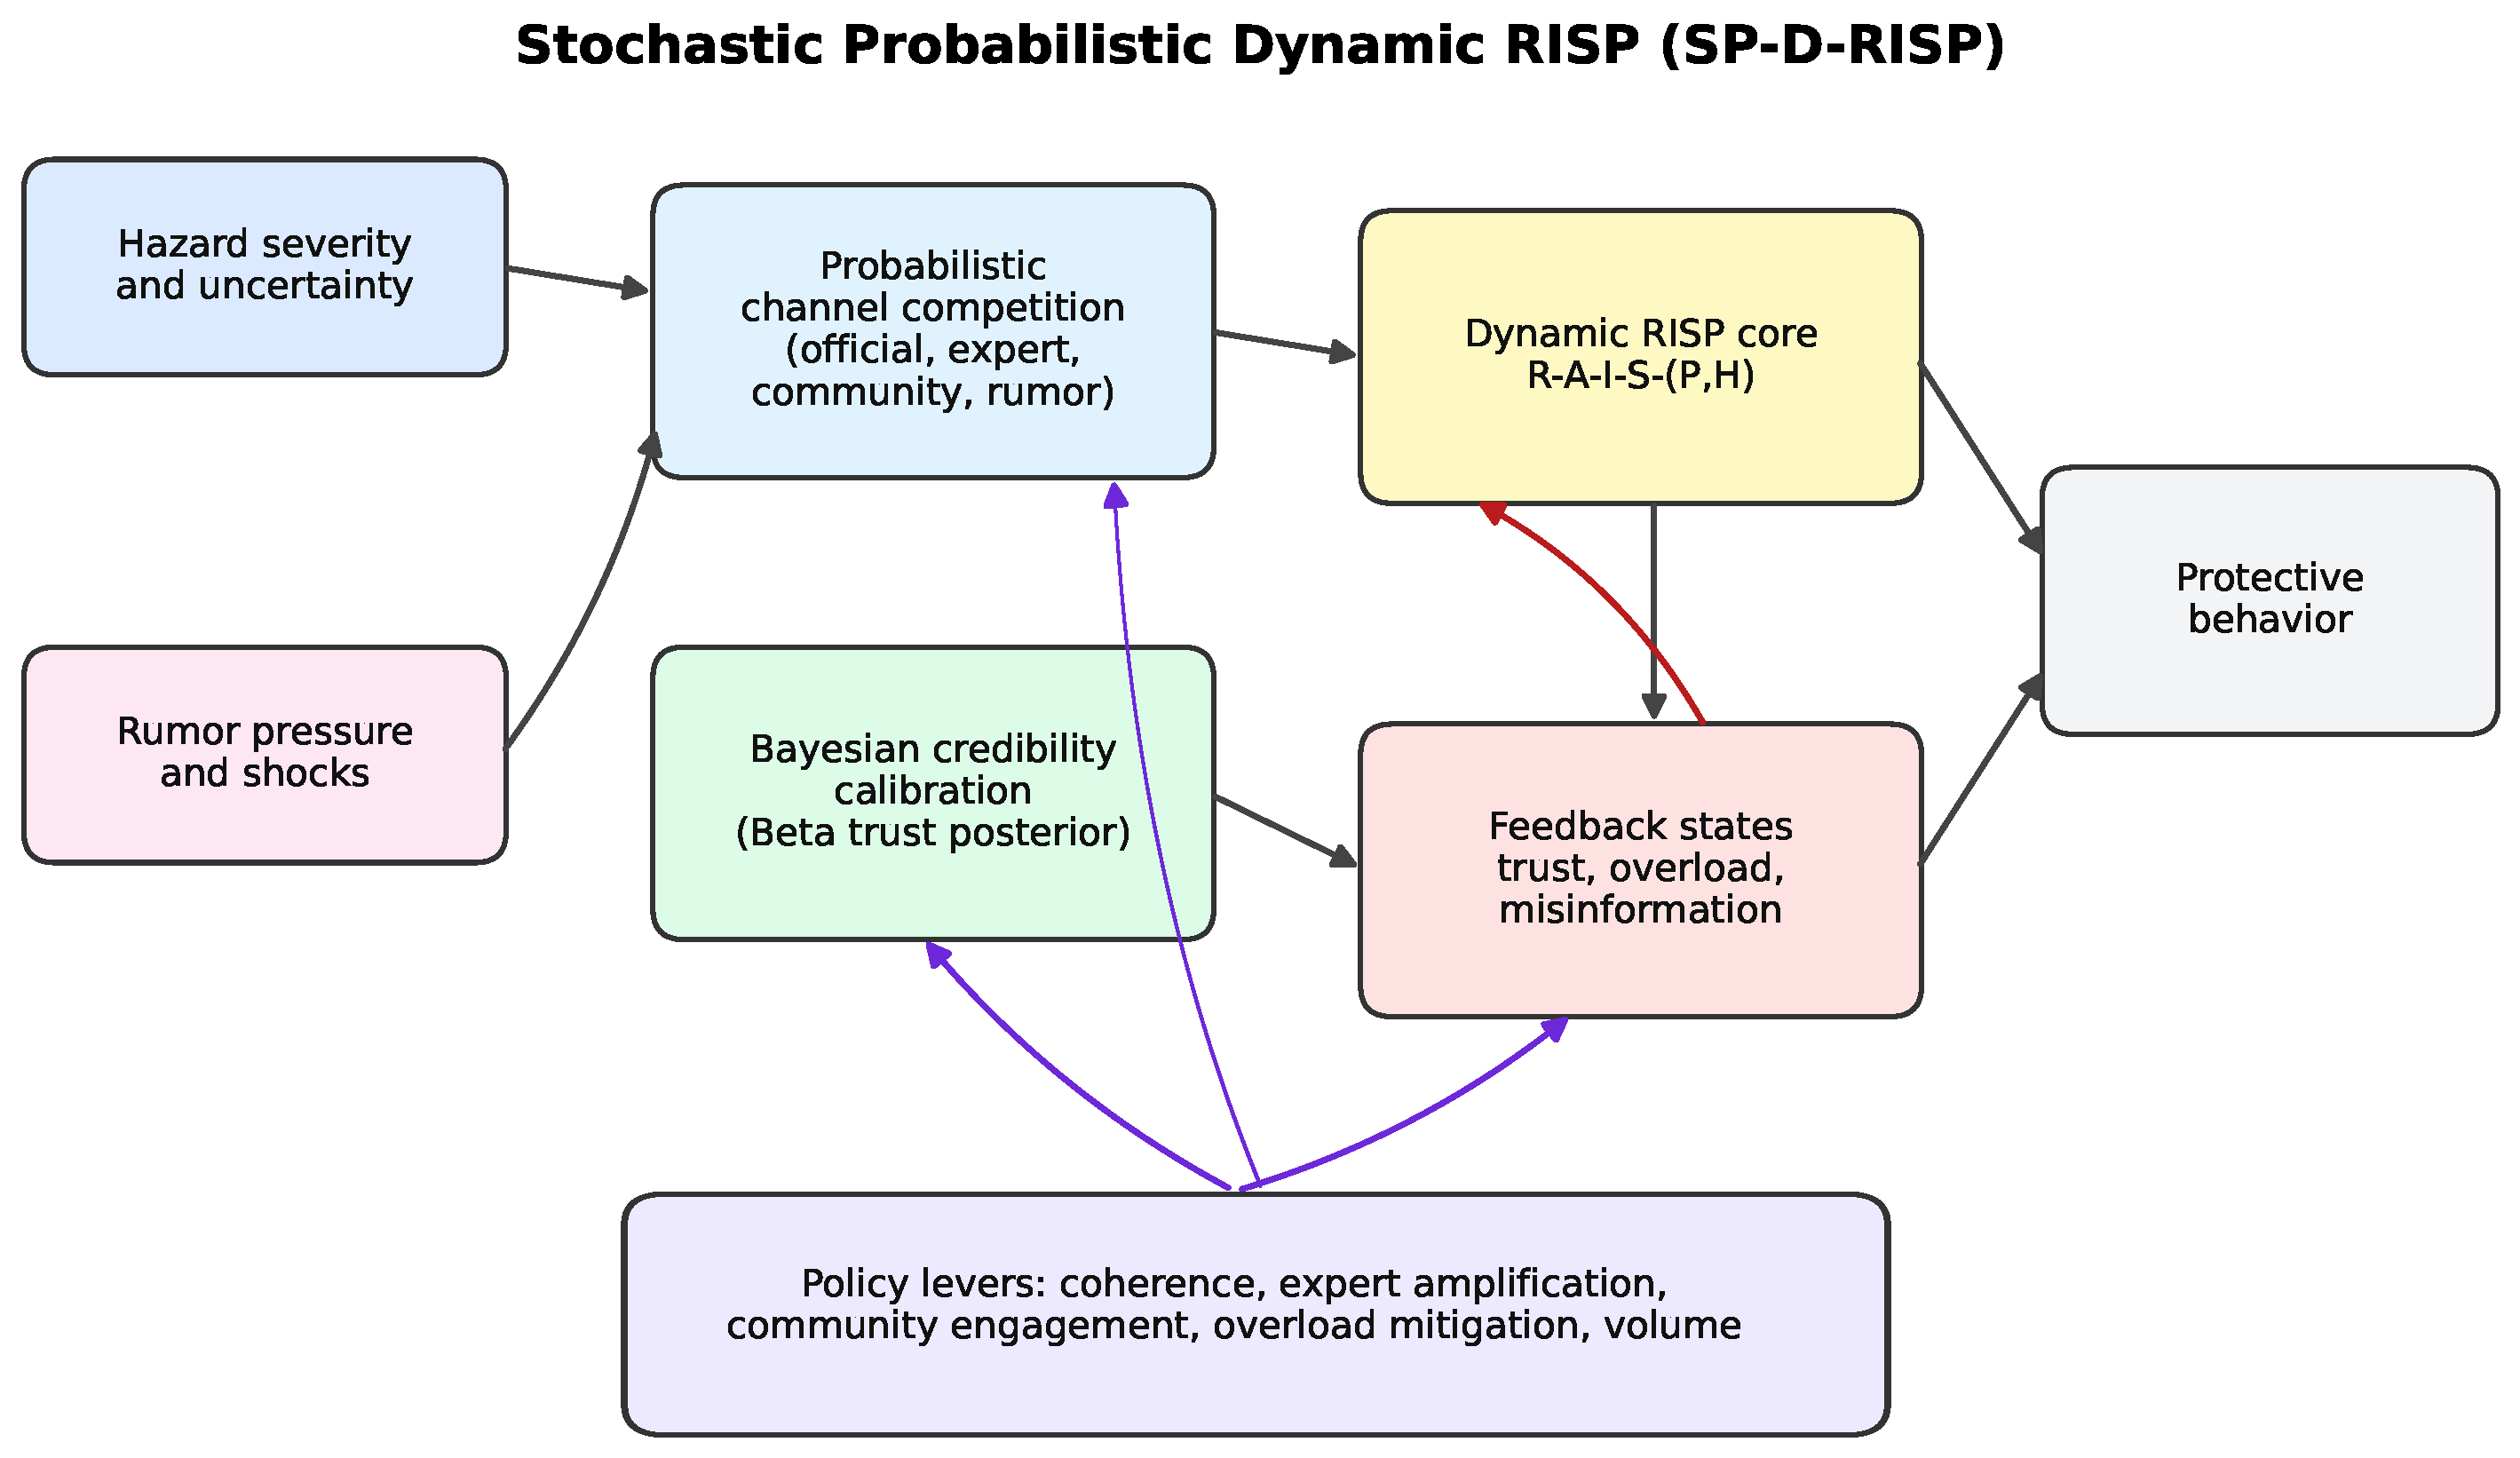
To address this gap, this study attempts to reconstruct the RISP model as a probabilistic, state-space representation grounded in stochastic dynamic systems theory. The proposed technical framework treats individual-level risk perception, affective response, information insufficiency, trust states, and information processing modes as time-varying stochastic state variables. Multichannel information exposure is modeled as a stochastic input process with competitive structure, and a Bayesian trust updating mechanism is introduced to characterize individuals’ dynamic inference about source reliability. On this basis, we further employ Lyapunov drift analysis, Wasserstein contraction theory, and stochastic approximation methods to analyze system stability, mixing properties, and the rate of forgetting initial distributions. The framework can describe individual-level stochastic evolution and, through mean-field approximation or Monte Carlo simulation, aggregate population-level statistical regularities, thereby providing theoretically grounded predictions and intervention recommendations for public health agencies under different policy scenarios. The introduction of these theoretical tools is expected to establish a more rigorous foundation for modeling and analysis in risk communication, addressing the limitations of existing methods in terms of dynamics, stochasticity, and structural identifiability. The main contributions are as follows.
- (1)
A new SP-D-RISP model is proposed. It preserves the classical RISP pathway
but adds stochastic channel competition, Bayesian trust updating, bounded nonlinear state transition, and policy-coupled exposure dynamics.
- (2)
The analytical results are organized as a hierarchy rather than treated as interchangeable notions. Projection-induced boundedness is a construction guarantee, the Markov and Feller properties establish probabilistic well-posedness and continuity of the kernel, and the spectral-radius small-gain condition is the coefficient-level sufficient certificate for Wasserstein contraction, uniqueness of the invariant distribution, and geometric forgetting. Finite-horizon simulation diagnostics are reported separately and are not used as substitutes for this contraction certificate. The complete coefficient vector and scenario bounds are now disclosed, and direct computation gives across the reported fixed and mode-wise calibrations.
- (3)
Instead of presenting only deterministic curves, the revised simulation uses heterogeneous agents, repeated Monte Carlo runs, confidence bands, concentration bounds, and policy-frontier analysis.
- (4)
Under the specified model structure and semi-synthetic calibration, the simulations generate testable hypotheses about how clarification delay, communication overload, and multi-component interventions may shape cognitive and behavioral outcomes.
The remainder of this paper is organized as follows.
Section 2 formulates the research problem and hypotheses.
Section 3 develops the SP-D-RISP model.
Section 4 provides probabilistic proofs.
Section 5 describes calibration and simulation design.
Section 6 reports numerical results.
Section 7 discusses implications and limitations.
Section 8 concludes.
2. Problem Description and Assumptions
2.1. Emergency Communication as a Stochastic Socio-Cognitive Process
Consider an emerging infectious disease, a food-contamination crisis, a vaccine-safety rumor, or a large hospital-acquired infection event. At each time t, individual i observes a random bundle of messages generated by official agencies, experts, community actors, news media, peers, and rumor sources. The individual then updates risk perception, emotion, knowledge, trust, overload, misinformation acceptance, information seeking, processing mode, and protective behavior. The central problem is therefore:
How can we model and analyze the probabilistic time-varying process through which individuals seek, evaluate, and process risk information under competing official and misinformation channels, and how can we compare communication policies with explicit uncertainty guarantees?
This problem differs from a static regression problem. It requires a dynamic state vector, random exposures, feedback loops, bounded latent states, and formal statements about sample reliability and stability.
2.2. Core Variables and Research Hypotheses
The proposed model retains the main constructs inherited from RISP and adds probabilistic communication constructs.
Table 1 and
Table 2 summarize the notation and research hypotheses, respectively.
3. The SP-D-RISP Model
3.1. State Vector and Bounded Domain
For
N individuals and discrete time
, define
The compact state-space is
. Trait variables are
The policy vector is
where
is a compact subset of
.
3.2. Probabilistic Channel Competition
Let the four communication channels be official, expert, community, and rumor/social media. Define the channel-attention probability vector
where a representative specification is
The actual exposure counts are random:
For the reported simulation calibration, the message count is generated by the bounded mechanism
The coefficients are reported in
Appendix A. Under a common-uniform coupling, only the seeking term contributes a state-dependent count gain, so that
and
for
. Effective official exposure and misinformation pressure are defined by
where
is the exogenous rumor environment and
. This layer is the first major innovation: official and misinformation channels compete through a stochastic attention mechanism rather than appearing only as fixed covariates.
3.3. Bayesian Trust Calibration
Trust is modeled through a latent credibility posterior. Let
and
be Beta pseudo-counts for credible and non-credible official communication signals. The posterior trust mean is
The Beta pseudo-counts are initialized with strictly positive values,
where
,
, and
. Since all increments in Equations (14) and (15) are non-negative, this initialization implies
and
for all
t.
Let
be a bounded reliability signal with conditional mean
:
The pseudo-count update is
where
. The parameters
are learning-rate parameters. Specifically,
and
control how strongly reliability-weighted official exposure contributes to credible and non-credible pseudo-count increments,
controls the credibility increment associated with expert amplification, and
controls the non-credible evidence increment induced by rumor pressure. These parameters are scale factors for the Bayesian trust filter rather than probabilities. This layer captures an important emergency-communication mechanism: coherent and expert-supported information accumulates credibility evidence, while conflict and rumor pressure accumulate contrary evidence.
For the compact-state analysis below, the cumulative pseudo-counts are represented through the posterior mean and inverse evidence mass rather than through the raw counts themselves. Define
Let
Then Equations (14) and (15) are equivalently represented as
For finite accumulated evidence, this normalized recursion is algebraically equivalent to the raw Beta pseudo-count recursion. The boundary value
represents the limiting case of infinite accumulated evidence and is included to obtain a compact closure of the state-space.
3.4. Bounded Stochastic Transition
Let be the scalar projection and apply it componentwise to vectors.
Each state component follows
where
is the adjustment rate of component
j, and
is a conditionally zero-mean bounded or sub-Gaussian disturbance.
The target functions are
with
3.5. Population Metrics
The simulation and policy analysis use the following bounded statistics:
where
and
are risk-window frequencies for misinformation and overload. The constants
are prespecified risk thresholds for the population-average misinformation and overload states, respectively. They are scenario-design parameters and are reported with the simulation settings.
Remark 1. The eleven components of are dynamic state variables rather than eleven free parameters. In an empirical application, these states and individual traits would be measured using repeated survey indicators, whereas emergency severity, rumor intensity, communication volume, and policy inputs could be constructed from epidemiological records, communication logs, fact-checking databases, and digital traces. The coefficients governing channel attention, trust updating, and state transitions are empirically estimable in principle from longitudinal data; however, in the present study, their signs and zero restrictions follow the hypothesized RISP pathways, while their magnitudes are assigned through theory-constrained semi-synthetic calibration. Initial distributions, shock paths, policy levels, population size, simulation horizon, replication count, and risk thresholds are simulation-design choices. Accordingly, this study does not claim full structural or practical identification of the complete parameter vector, and the results should be interpreted as mechanism-based and comparative-policy evidence rather than population-specific parameter estimates or forecasts.
Equation (
38) is a mean-field abstraction of social influence. The scalar
summarizes baseline norms, the individual’s own behavior, and a common community-engagement input; it is not computed from an explicit adjacency matrix or from neighborhood-specific exposures. Consequently, the present specification does not represent degree heterogeneity, clustering, homophily, scale-free hubs, echo-chamber segregation, or network-mediated cascades. This abstraction preserves the permutation-equivariant population structure and permits the single-agent Markov/Feller and coefficient-level contraction analysis, but it limits topology-specific diffusion claims. An explicit network extension would require time-varying, possibly multilayer adjacency matrices for exposure, credibility exchange, and behavioral norms, together with new dependence, stability, and concentration conditions; such an extension is outside the scope of the present study.
3.6. Permutation Symmetry and Symmetry Breaking
In this study, symmetry is used in the precise mathematical sense of invariance or equivariance under the relabeling of structurally identical indices. It does not imply that official, expert, community, and rumor channels have equal credibility, equal attention shares, or equal causal effects. Instead, symmetry characterizes the structural properties of the channel-allocation operator and the multi-agent transition mechanism, whereas symmetry breaking describes departures from a channel-balanced reference state.
Let
For any permutation
, where
denotes the symmetric group on the four communication channels, let
be the corresponding permutation matrix. A simultaneous relabeling means that the channel labels, their score functions, and their associated parameter blocks are permuted together. The softmax operator then satisfies
Thus, the channel-attention operator is permutation equivariant. The same property is inherited by the multinomial exposure mechanism. In particular, if
then
Equations (
46) and (
48) imply that the probabilistic allocation mechanism does not depend on the arbitrary ordering used to store the four channels in a vector.
A related symmetry occurs at the population level. Define the complete augmented state of individual
i by
and let
denote the complete population state. For a permutation
, let
permute the
N complete agent tuples. The
N-agent transition kernel is written as
where
Under a common label-independent policy and exchangeable sampling of initial states, traits, reliability signals, and idiosyncratic disturbances, the transition kernel satisfies
Proposition 1. The softmax–multinomial channel-allocation layer is equivariant under the action of . Under a common label-independent policy and exchangeable initial complete states, traits, reliability signals, and disturbances, the N-agent SP-D-RISP transition kernel is equivariant under the action of . Consequently, an initially exchangeable population remains exchangeable at every subsequent time.
Proof. For the channel-allocation layer, permutation of the score vector only permutes the exponential terms in the numerator of the softmax function, whereas the denominator remains unchanged because
Therefore,
Relabeling the categories of a multinomial random vector similarly permutes both its count vector and its probability vector, which proves Equation (
48).
At the population level, every individual is updated through the same measurable SP-D-RISP transition rule. The common policy does not depend on the numerical label assigned to an individual, and the complete tuple containing the state, Bayesian pseudo-counts, and traits is permuted as a single unit. Conditional on the common exogenous paths, permutation of the complete agent tuples therefore only permutes the corresponding conditional transition laws. This gives Equation (
52). Applying this identity inductively shows that exchangeability of the initial population law is preserved for all
. □
An immediate consequence of agent-permutation symmetry is that the empirical state measure
is invariant to arbitrary relabeling of individuals. Population means, empirical distributions, and the policy metrics introduced below are therefore natural permutation-invariant observables. Importantly, heterogeneous traits do not invalidate this result when the traits are included in the complete agent tuples and sampled exchangeably: heterogeneity creates population dispersion but does not make the model depend on arbitrary agent labels.
Structural equivariance should be distinguished from equality of realized channel-attention probabilities. The fully channel-symmetric reference set is
For every
,
Channel-specific coefficients, heterogeneous traits, policy inputs, credibility differences, and rumor shocks move the process away from this symmetric reference state and thus generate explicit or dynamic symmetry breaking.
To quantify the magnitude of channel-level symmetry breaking, define
The normalization follows because the maximum
distance between a probability vector on four channels and the uniform vector is
. Hence,
if every individual allocates equal attention to all four channels, whereas values closer to one indicate stronger concentration on a subset of channels. Moreover, the index is itself invariant to channel relabeling because
Because
measures the magnitude but not the direction of symmetry breaking, define the rumor-channel dominance index as
A positive value indicates directional symmetry breaking toward the rumor channel, whereas a negative value indicates that the average attention assigned to the other three channels exceeds rumor attention.
This directional asymmetry has a direct dynamic interpretation in the SP-D-RISP model. With the positive rumor-attention coefficient in Equation (14), an increase in
raises misinformation pressure
. The resulting disturbance then propagates to trust, heuristic processing, misinformation acceptance, and protective behavior through Equations (19) and (25)–(27). Symmetry breaking is therefore not merely a descriptive difference among channel shares; it is a mechanism linking competitive information exposure to subsequent cognitive and behavioral dynamics. The uniform distribution in Equation (
55) is used as a diagnostic reference rather than as a claim that equal channel attention is normatively optimal.
4. Probability-Theoretic Analysis
This section gives the theoretical foundation requested in the revision: proofs based on Markov processes, concentration inequalities, posterior convergence, and monotone coupling.
The analytical statements below do not have the same logical status. Projection-induced forward invariance is a feasibility guarantee imposed by the model construction. The Markov and Feller properties are well-posedness results conditional on an appropriately augmented state and continuity of the conditional transition laws. Existence and uniqueness of a stationary regime require additional compactness and small-gain conditions. The concentration inequality and Monte Carlo central limit theorem quantify sampling and replication uncertainty under independence assumptions, whereas the clarification-delay result is a model-specific comparative-static statement under monotonicity restrictions.
Accordingly, projection-induced boundedness and generic probabilistic limit theorems are not interpreted as evidence of endogenous behavioral stability. The substantive stability claim is made only when the coefficient-level gain condition introduced below is verified for the parameterization under consideration.
In particular, the Feller property alone implies neither uniqueness nor geometric mixing. Those stronger conclusions follow here only from the separate spectral-radius condition that yields a weighted Wasserstein contraction.
Assumption 1. Emergency severity , rumor environment , policy , and traits are bounded. The policy set is compact.
Assumption 2. For each state component, is conditionally zero-mean and conditionally -sub-Gaussian:The final projection ensures bounded states even when the unprojected disturbance is not interval-preserving. Assumption 3. For every fixed policy u and trait vector θ, the target map is globally Lipschitz on . Let satisfy Assumption 4. Conditional on common exogenous paths and policy, the present mean-field analysis assumes that agents’ idiosyncratic shocks and reliability signals are independent across i. The population concentration bounds below are stated under this conditional independence. For an explicit interaction network, analogous bounds would require separately specified dependency-graph, mixing, or martingale conditions and cannot in general be justified merely by replacing N with an unspecified effective sample size.
Lemma 1. For all ,The same properties hold componentwise for vectors under the sup norm. Proof. If , the result is immediate. If either value lies outside , projection replaces it with the nearest endpoint. This operation cannot reverse order and cannot increase distance because it is the metric projection onto a closed convex interval. Componentwise application gives the vector result. □
Proposition 2. For any , any admissible policy sequence, and any disturbance sequence, the projected transition system satisfies Proof. For every component, the argument of the outer projection is a real number, and the projection operator maps every real number into . Componentwise application and induction over time establish the result. □
Let the compact normalized augmented state be
If the initial total pseudo-count satisfies
then
Thus,
is compact. The raw pseudo-counts
and
may grow over time; compactness is claimed only for the normalized representation
, which is sufficient for the Markov and Feller analysis because future trust dynamics depend on the raw counts only through
and
.
For fixed policy
u, define the transition kernel
Proposition 3. Under Assumptions 1–2, is a controlled Markov process on a compact augmented state-space whenever the policy at time t is a measurable function of the current state and the exogenous time index.
Proof. Given
and
, the next exposure vector, reliability signal, noise vector, Beta pseudo-counts, and RISP state are generated from the conditional laws specified in (
8). These laws depend on the past only through
and
. Therefore, the conditional distribution of
given the full history equals the conditional distribution given the current augmented state and control. □
Proposition 4. If the conditional distributions of exposure and noise vary continuously with and the target functions are continuous, then is a Feller kernel on the compact normalized state-space : for every bounded continuous function f,is continuous. Proof. The softmax probabilities, reliability probabilities, target functions, projection operator, and the normalized trust updates (
24) and (
25) are continuous in
on the compact state-space
. The boundary
is well defined by
which is the continuous limit of the normalized update as accumulated evidence tends to infinity. For bounded continuous
f, dominated convergence applies to the expectation of
. Hence, the transition operator maps bounded continuous functions to bounded continuous functions. □
4.1. Invariant Probability Measures
Theorem 1. For any stationary policy , the Markov kernel on the compact normalized augmented state-space admits at least one invariant probability measure.
Proof. By Proposition 1, the RISP state vector remains in
. By Equations (
24) and (
25), the normalized trust variables satisfy
and
. Therefore, the normalized augmented state-space
is compact. Proposition 3 gives the Feller property. The empirical occupation measures
are tight on the compact space. By compactness, they have a weakly convergent subsequence, and the Krylov–Bogolyubov averaging argument for Feller Markov kernels implies that any weak limit is an invariant probability measure. □
4.2. Parameter-Level Sufficient Conditions for Wasserstein Stability
The contraction condition is now formulated in terms of coefficients that can be evaluated for each calibrated parameter set. For a calibrated setting
u, let
denote the matrix obtained from Equations (
65)–(
83), where
collects the remaining coefficients listed in
Appendix A. To avoid symbol collisions in the target equations, the stability calculation uses the aliases
for Equation (
14),
for Equation (
17),
for the processing target, and
for the behavior target. Policy-only, trait-only, and intercept terms cancel when two chains are coupled under the same policy, traits, and exogenous path; communication volume remains relevant through
and
. Let the augmented state be
where
is compact under bounded message counts, bounded misinformation pressure, and the discounted evidence updates (
18) and (
19).
For the channel logits, write
and define
For the specification in Equations (4)–(7), the nonzero logit-gain coefficients are
with the remaining
equal to zero.
The softmax operator satisfies
and, for the rumor component,
Assume that
and that the message-count mechanism admits a coupling satisfying
Coupling the common messages category by category gives
Because the positive-part and projection operators are nonexpansive, misinformation pressure satisfies
The informational-norm target satisfies
For the reliability probability in Equation (16), define
For the Bernoulli reliability implementation, a common-uniform coupling satisfies
Let
The posterior-mean map then satisfies
Accordingly, define
Let
denote the target-function gain matrix. For
, its rows are
Let
For the first eleven rows of the augmented one-step gain matrix
, define
Let
. For the discounted evidence rows, define
where
.
Theorem 2. Assume that the additive state disturbances are coupled synchronously and that the exposure and reliability variables are coupled as in Equations (69) and (75). If the spectral radius of the non-negative gain matrix satisfiesthen there exists a vector and a constant such that the transition kernel is contractive in the 1-Wasserstein distance induced bySpecifically,Consequently, the stationary-policy kernel has a unique invariant probability measure and Proof. Nonexpansiveness of the inner and outer projection operators, together with the exposure, reliability, misinformation-pressure, and posterior-mean coupling bounds, gives the componentwise inequality
Since
is non-negative and
, the Perron–Frobenius and Collatz–Wielandt characterizations imply that, for any
, there exists
such that
Therefore,
Taking the infimum over initial couplings yields Equation (
86). Completeness of the Wasserstein space over the compact augmented state-space gives uniqueness of the invariant measure and geometric convergence. □
Corollary 1. A sufficient, although generally more conservative, condition for Theorem 2 is Remark 2. Condition (84) is sufficient rather than necessary. A computed upper bound greater than or equal to one means that this global certificate is inconclusive; it does not by itself prove that the simulated process is unstable. Projection saturation and state-dependent cancellations may make the realized dynamics more stable than the global absolute-coefficient bound. 4.3. Concentration of Population Means and Monte Carlo Central-Limit Inference
For a bounded state component , define .
Theorem 3. Under conditional independence across agents, for any and any fixed time t,Moreover, uniformly over a horizon , Proof. For fixed t, the variables are bounded in . Conditional on common inputs, Hoeffding’s inequality gives the first bound. The unconditional bound follows by taking expectations over common inputs. The uniform result follows from the union bound over time points. □
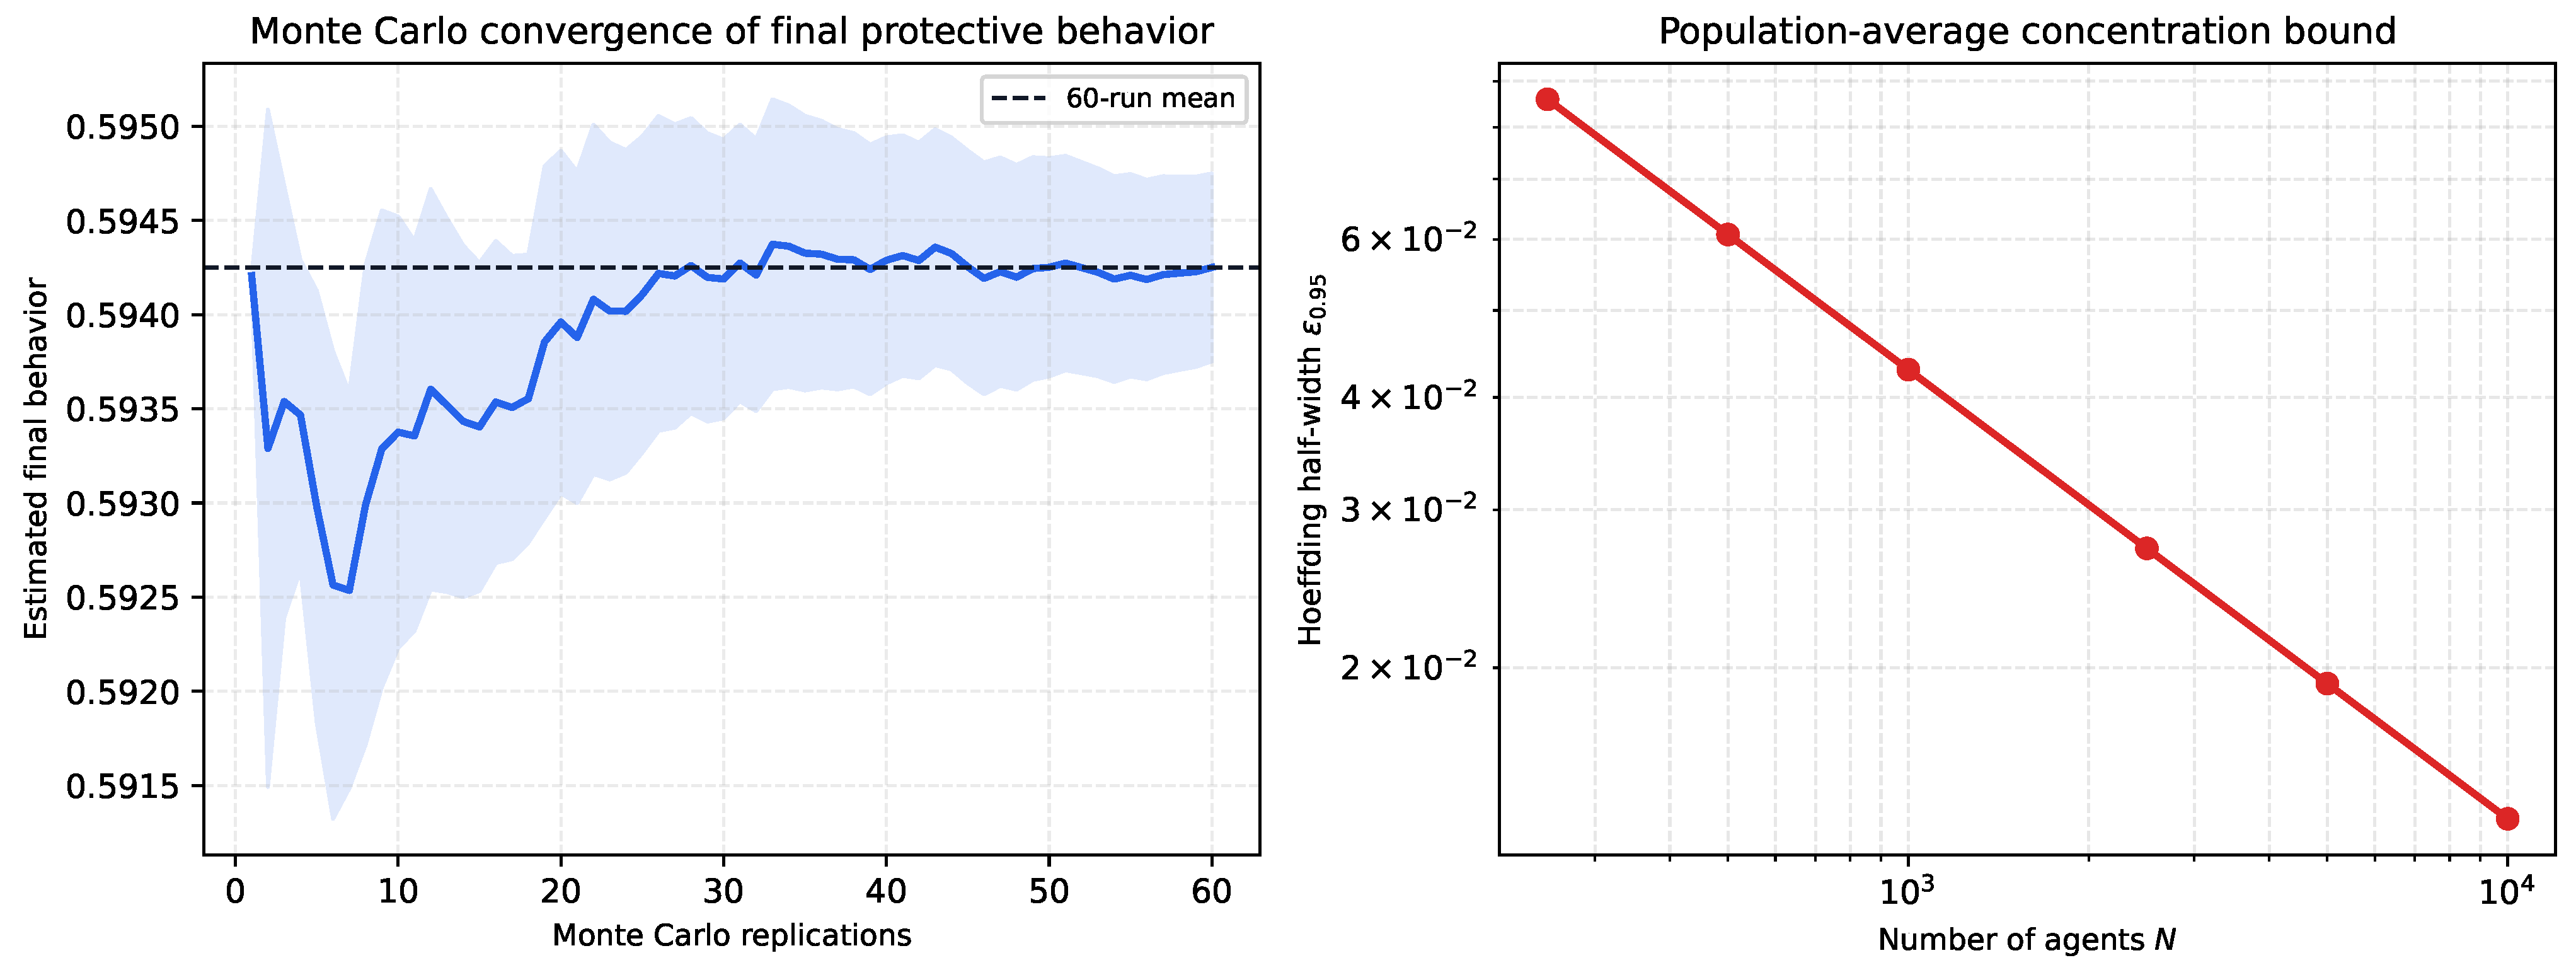
Remark 3. With and , the Hoeffding half-width for a single-time 95% population mean is approximately . Empirical Monte Carlo intervals are often much narrower because the statistic averages many heterogeneous agents and because the realized dynamics are less variable than the worst-case bounded-variable inequality.
Let be a scalar simulation statistic from replication r, such as final behavior or peak misinformation , and let .
Theorem 4. If the replications are independent and , thenand the usual confidence intervalis asymptotically valid. Proof. All simulation statistics are bounded functions of bounded state trajectories, so their variances are finite. The result is the classical Lindeberg–Levy central-limit theorem for independent replications. □
4.4. Bayesian Trust Concentration
Proposition 5. Suppose reliability signals are conditionally independent Bernoulli variables with fixed mean during a stable phase and with bounded exposure weights. If is the Beta posterior mean in (15), then almost surely as the accumulated exposure weight diverges. Furthermore, for an unweighted special case,where is the number of observed reliability signals and depends on the prior pseudo-counts. Proof. The posterior mean is a convex combination of the prior mean and the sample mean of reliability signals. The prior weight divided by tends to zero, and the sample mean converges almost surely to by the strong law of large numbers. The finite-sample bound follows by applying Hoeffding’s inequality to the Bernoulli sample mean and accounting for the prior bias. □
Theorem 5. Consider two policies identical except that clarification under policy starts later than under policy . Suppose that before saturation, the misinformation target is increasing in rumor pressure and heuristic processing, decreasing in trust, coherence, and expert amplification; the trust target is increasing in coherence and expert amplification and decreasing in misinformation and rumor pressure. Under a common-noise monotone coupling, if , thenfor all t in the pre-recovery window, where denotes first-order stochastic dominance. Proof. Use the same initial state and the same exogenous rumor shock for both systems. Before the earlier clarification time, the two systems are equal. Between the earlier and later clarification times, policy has higher coherence and expert amplification. By monotonicity of the projection and the sign structure of the targets, this weakly increases trust and weakly decreases misinformation in system 1 relative to system 2. These inequalities are preserved by induction because lower misinformation supports higher trust and higher trust suppresses misinformation. Hence, the later-clarification process has misinformation that is pathwise no smaller under the common-noise coupling throughout the transient response window, which implies first-order stochastic dominance. □
For a policy trajectory
, define
If is compact, is continuous, and the transition kernel is weakly continuous in u, then there exists a policy trajectory maximizing . The product set is compact. Weak continuity of the transition kernel and boundedness of the state variables imply that , , and are upper semicontinuous under mild boundary regularity, and continuous when threshold events have zero probability at the optimum. The cost term is continuous. Therefore, J attains its maximum on the compact policy set by the Weierstrass theorem.
5. Calibration and Semi-Synthetic Evaluation Protocol
Because no public longitudinal benchmark jointly measures the full set of SP-D-RISP states (see, Algorithm 1), channel-level exposures, credibility signals, rumor intensity, policy inputs, and protective behavior at the temporal resolution required by the model, the present study uses a semi-synthetic evaluation design. Coefficient signs and zero restrictions are constrained by the hypothesized RISP pathways, but coefficient magnitudes are not field-estimated. The numerical results therefore support mechanism comparison, internal coherence checks, and hypothesis generation; they are not population-specific forecasts and should not be used to set operational communication levels without external estimation and validation.
Table 3 summarizes new theoretical results.
| Algorithm 1 SP-D-RISP Monte Carlo evaluation pipeline |
- 1:
Choose N, T, number of replications R, policy scenario , and random seeds. - 2:
for do - 3:
Sample heterogeneous traits . - 4:
Initialize and Beta pseudo-counts . - 5:
for do - 6:
Generate emergency severity and rumor environment . - 7:
Compute channel probabilities by ( 3). - 8:
Generate effective exposure , , and . - 9:
Update Bayesian trust pseudo-counts. - 10:
Update all bounded RISP states. - 11:
end for - 12:
Record , , , , , and . - 13:
end for - 14:
Report sample means, 95% Monte Carlo confidence intervals, and sensitivity plots.
|
A field application would require repeated individual-level measurements linked, where ethically and legally permissible, to channel-exposure logs, communication records, and rumor/fact-check traces. The attention, trust, and transition coefficients could then be estimated in a hierarchical Bayesian state-space model, with measurement error represented explicitly and practical forecasting assessed through posterior predictive checks, calibration diagnostics, and held-out temporal or geographic validation. The local sensitivity analysis reported below cannot substitute for this field-estimation step.
6. Simulation Evaluation and Analysis
Before presenting the numerical results, we clarify the interpretation of the hypotheses in
Table 2. Hypotheses H1–H6 are structural pathway hypotheses encoded through the sign and zero-restriction structure of the transition equations. The semi-synthetic simulations therefore do not constitute independent empirical tests of H1–H6; rather, they illustrate whether the encoded mechanisms generate coherent dynamic patterns under the selected calibration. Hypotheses H7–H9 are assessed more directly through the clarification-delay experiment, the intervention-portfolio comparison, and the population/Monte Carlo reliability diagnostics.
Table 4 provides the recommended empirical measurement approaches and semi-synthetic calibration sources.
Table 5 summarizes this mapping.
The simulation uses heterogeneous agents, days, and independent Monte Carlo replications. The baseline scenario uses 60 replications; delay and portfolio scenarios use 45 replications; volume sweeps use 40 replications per volume. Unless otherwise stated, tables report mean ±95% Monte Carlo confidence interval. A value of means that the interval is smaller than 0.0005 after rounding.
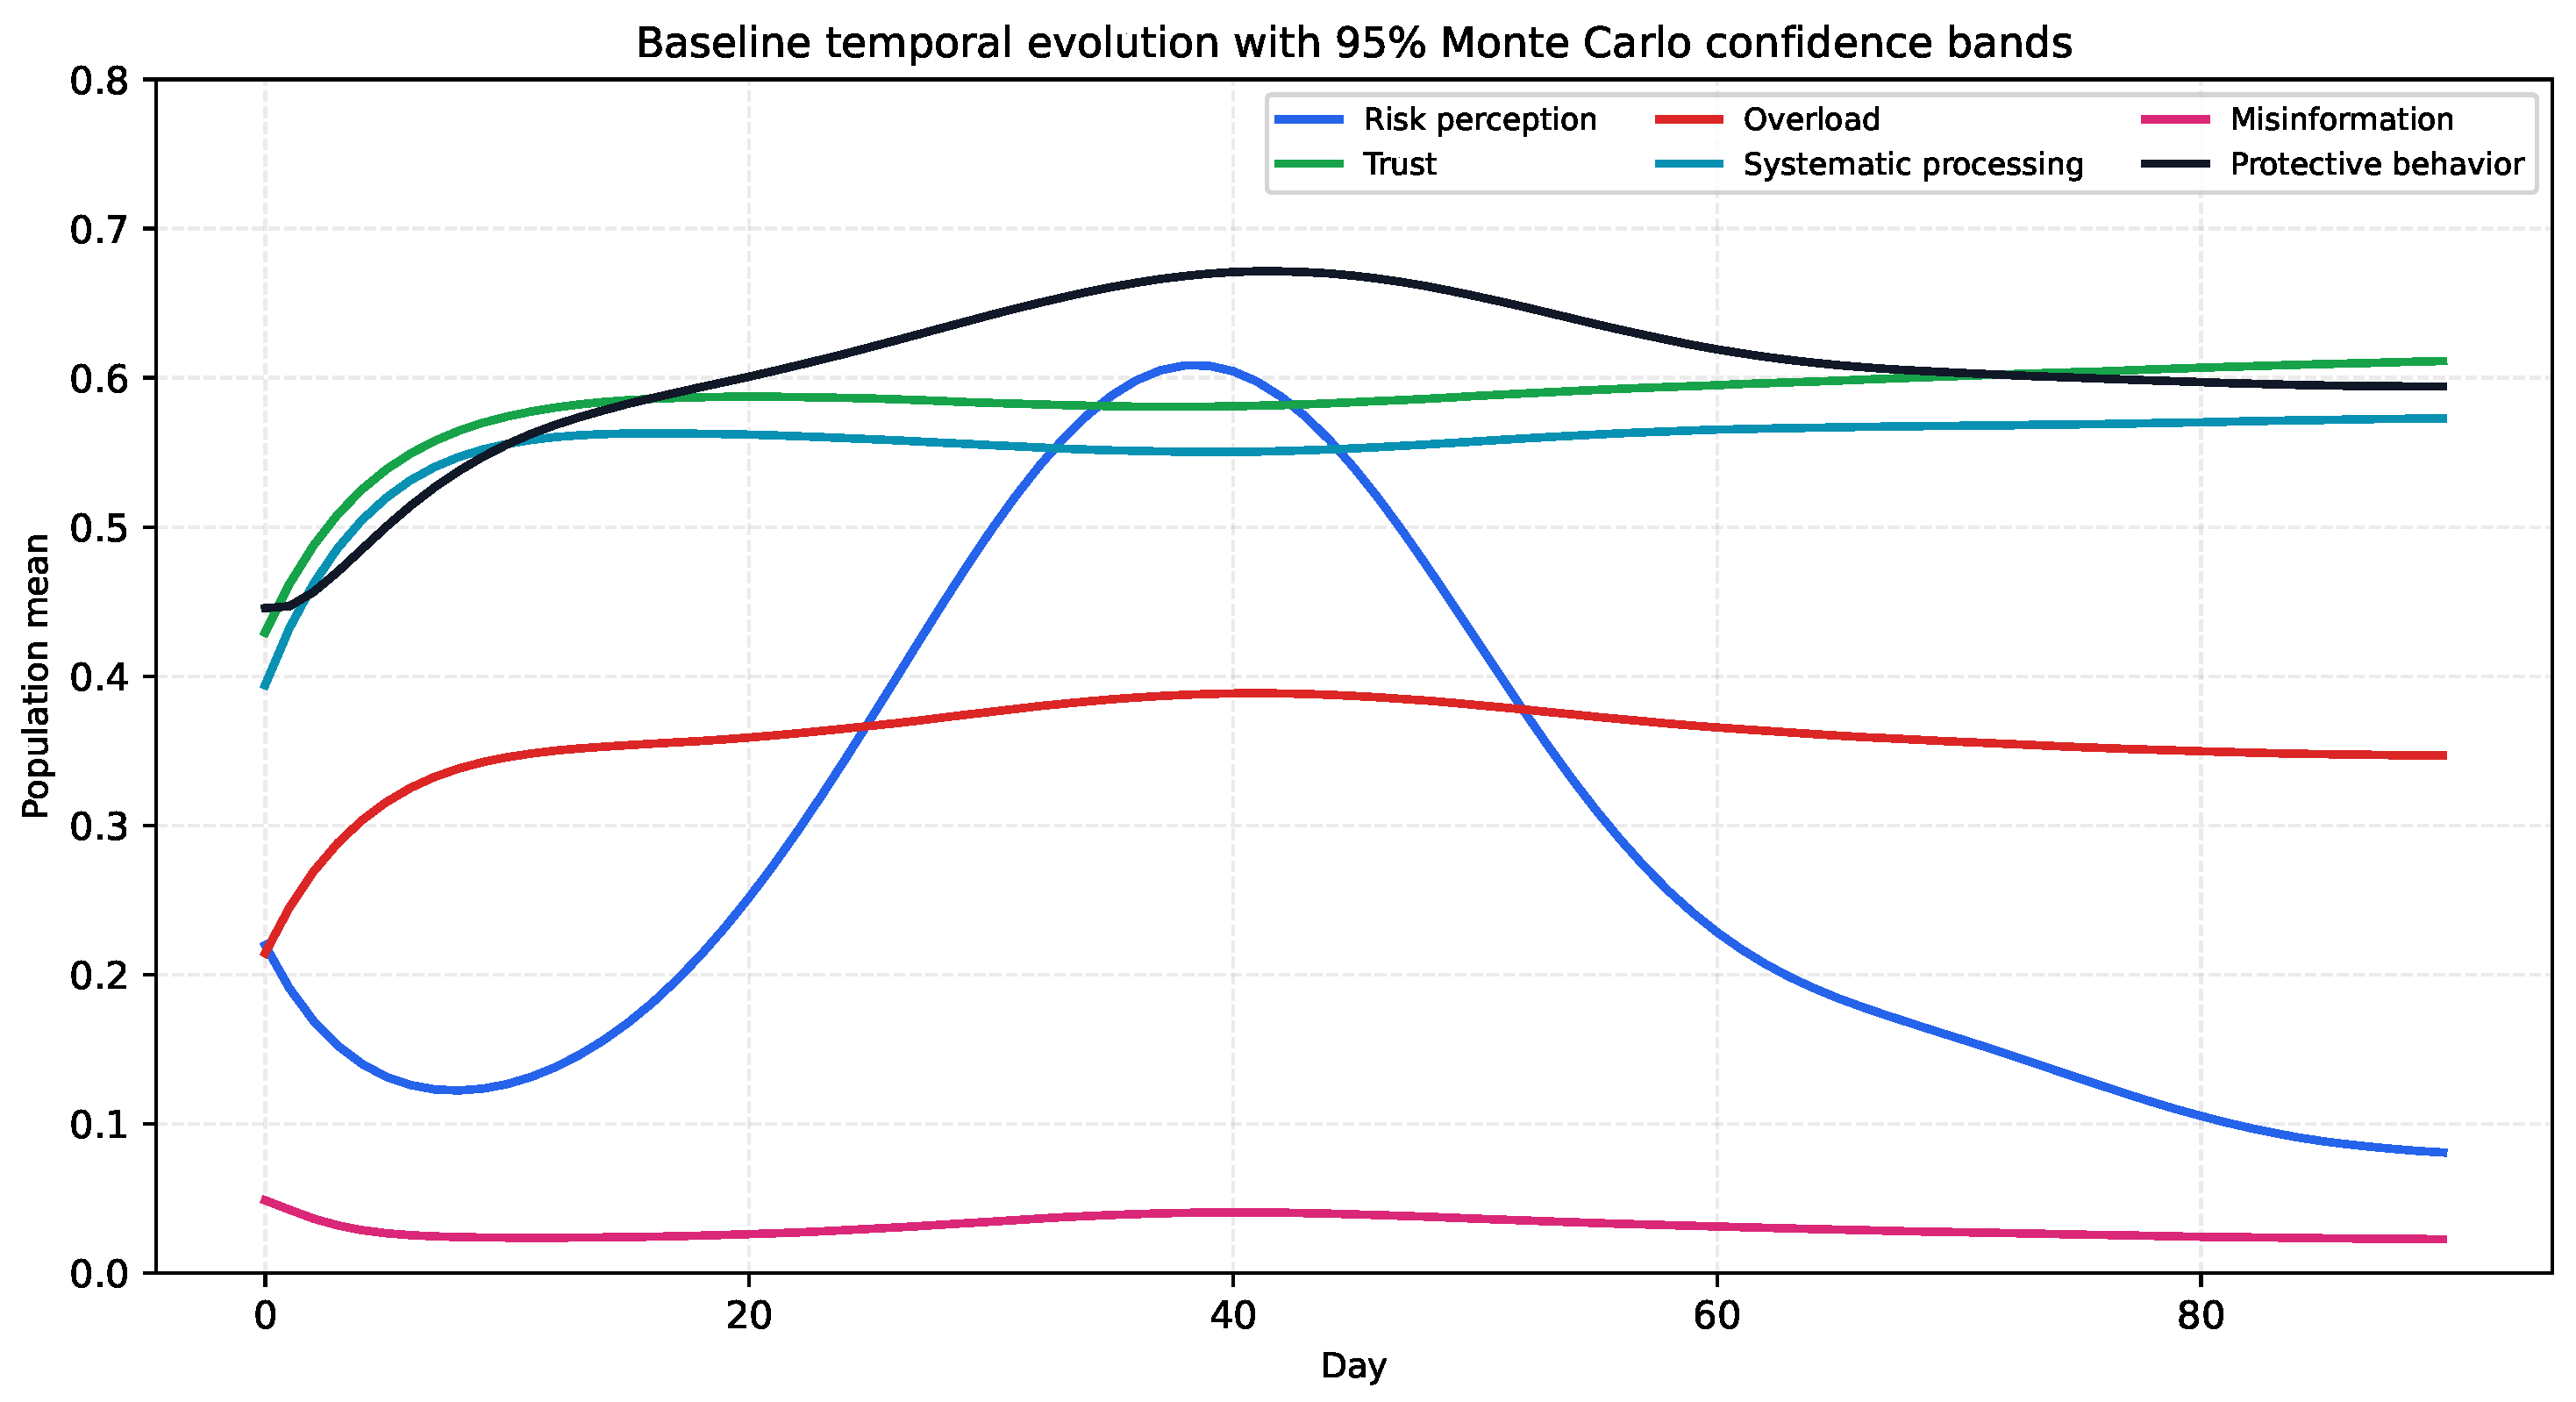
The baseline scenario describes an emergency whose severity rises in the first half of the horizon and gradually stabilizes.
Figure 2 displays population-average trajectories with 95% Monte Carlo confidence bands.
The baseline final protective behavior is 0.594 ± 0.000, peak misinformation is 0.049 ± 0.000, peak overload is 0.389 ± 0.000, average systematic processing is 0.555 ± 0.000, final trust is 0.611 ± 0.001, and final knowledge is 0.498 ± 0.000. The main substantive finding is that information seeking and systematic processing rise during the crisis, but overload prevents the system from converting all additional exposure into better behavior.
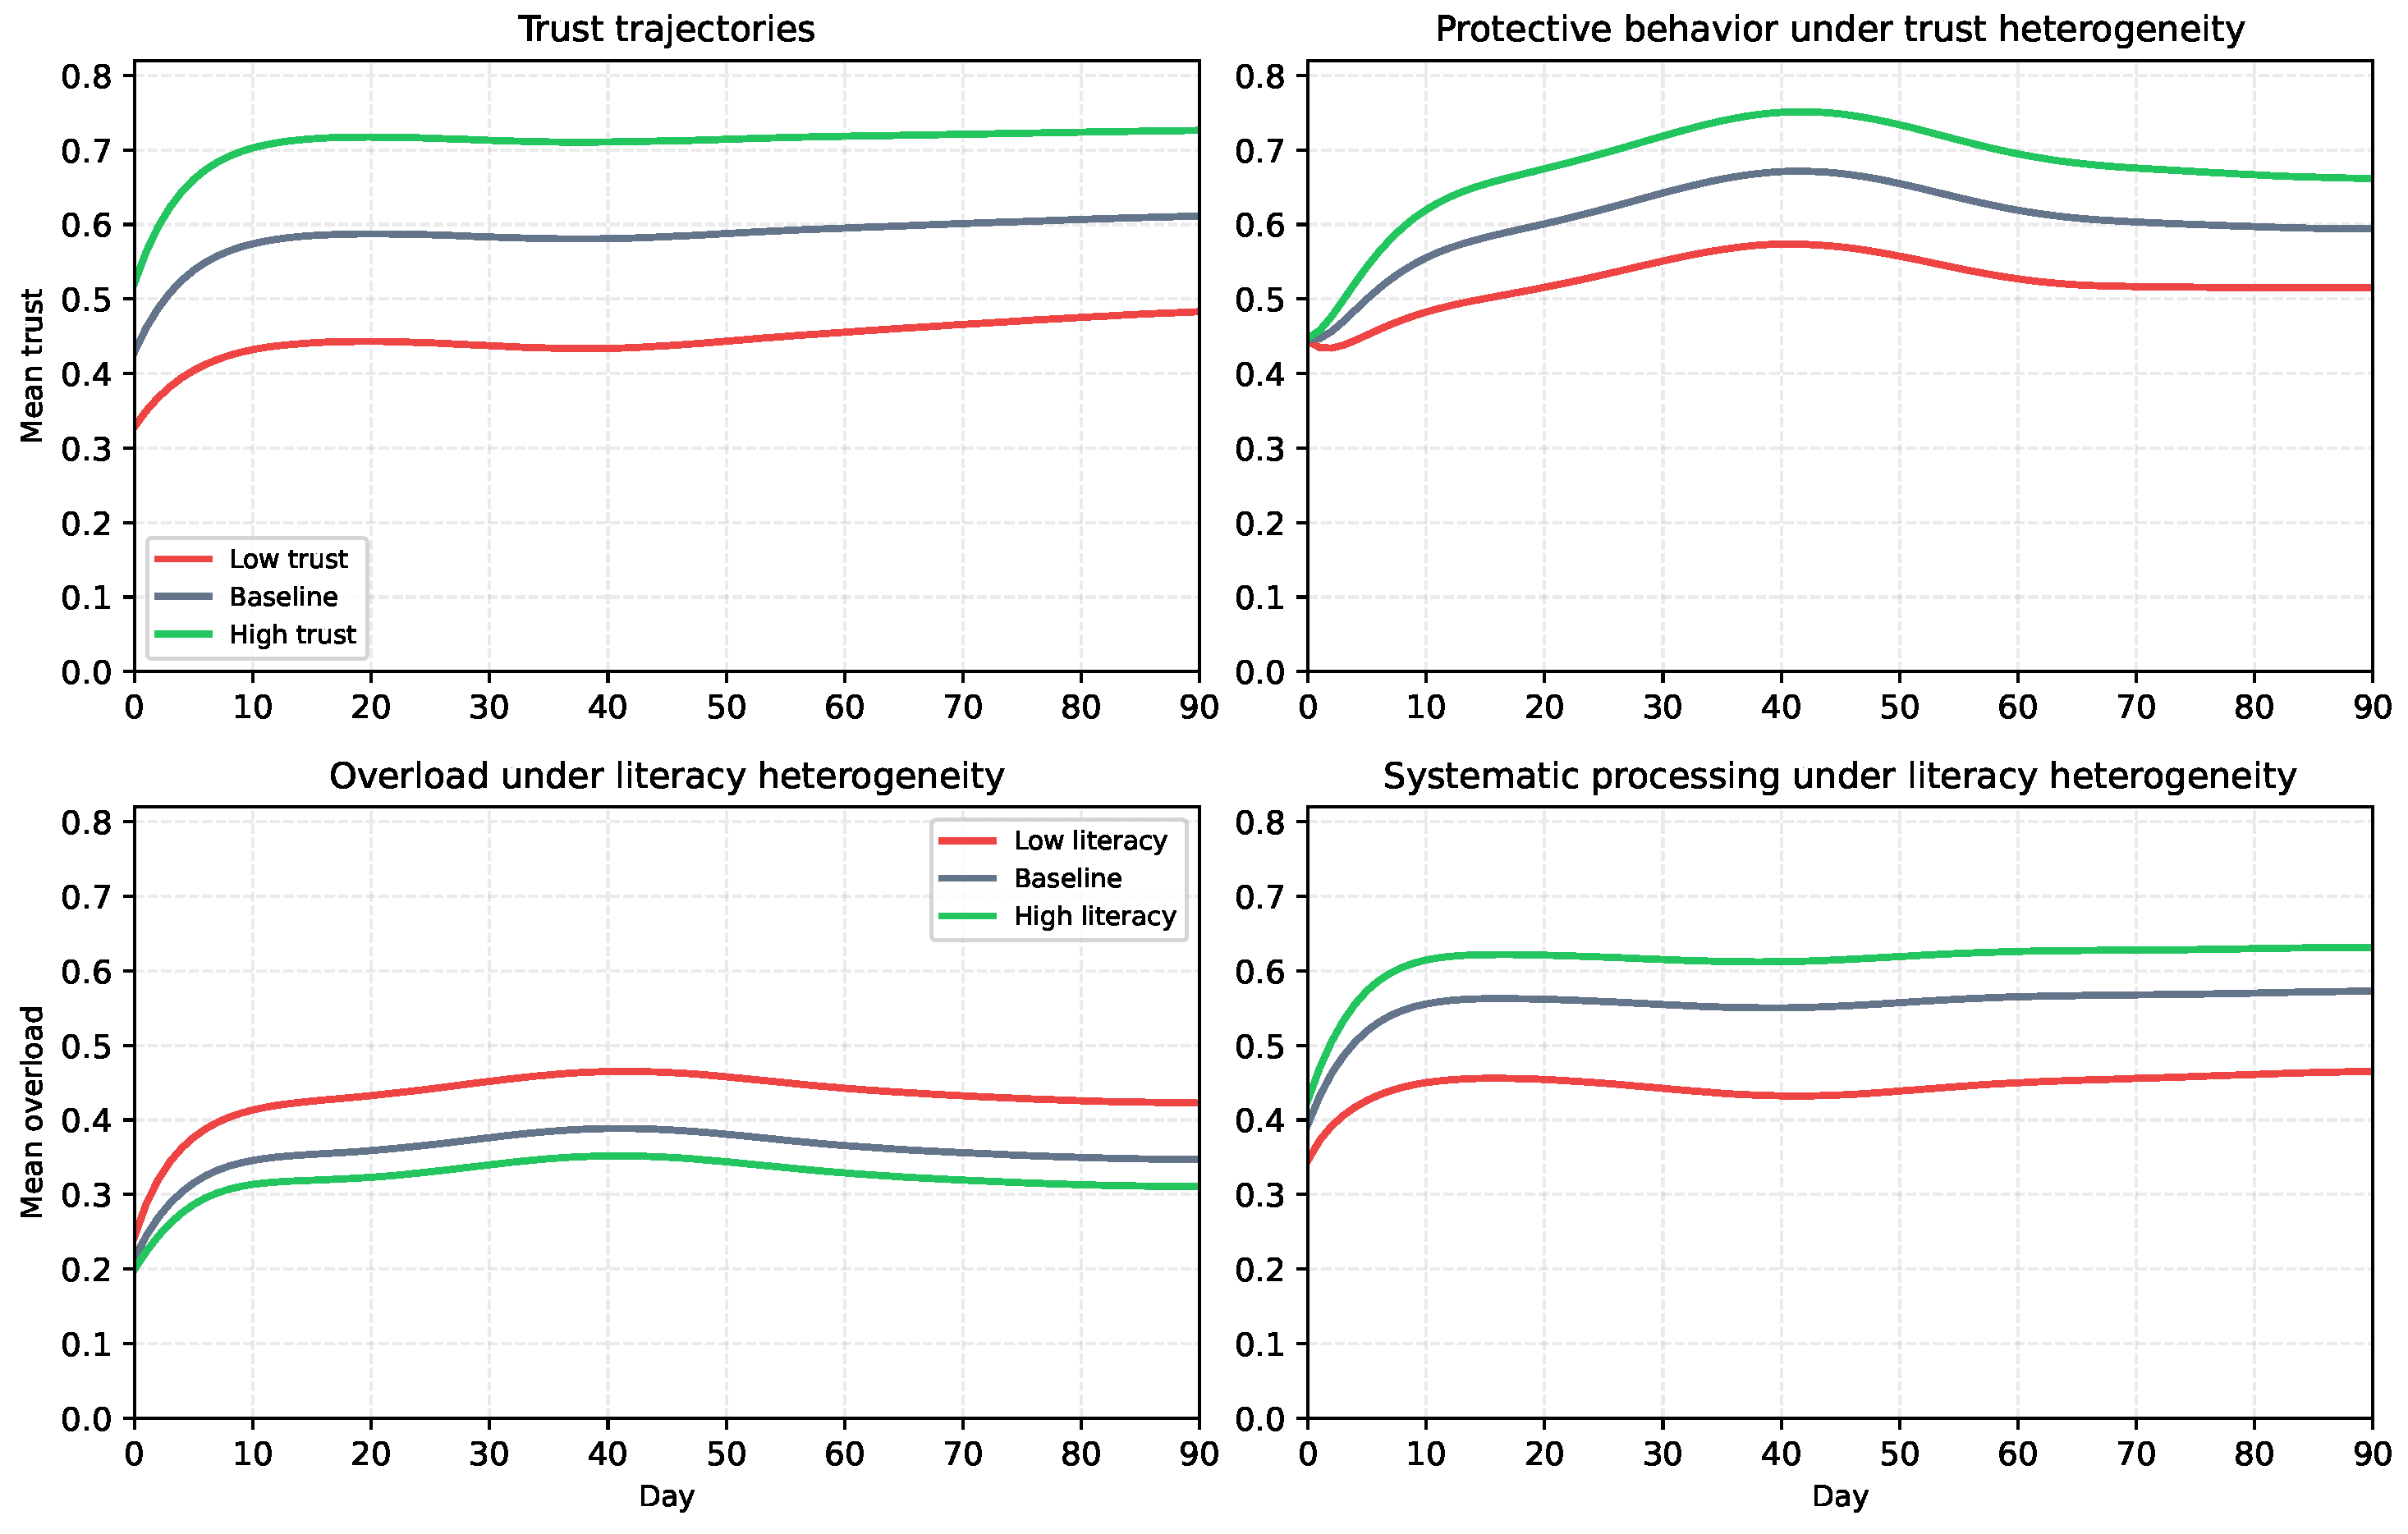
Figure 3 and
Table 6 show that high baseline trust increases final trust, systematic processing, and protective behavior. Low literacy increases overload and misinformation vulnerability.
The probability model clarifies why these differences persist. Trust changes channel-attention probabilities and Bayesian credibility updates, while literacy reduces both overload and rumor susceptibility. Thus, trust and literacy are not descriptive controls; they are structural moderators.
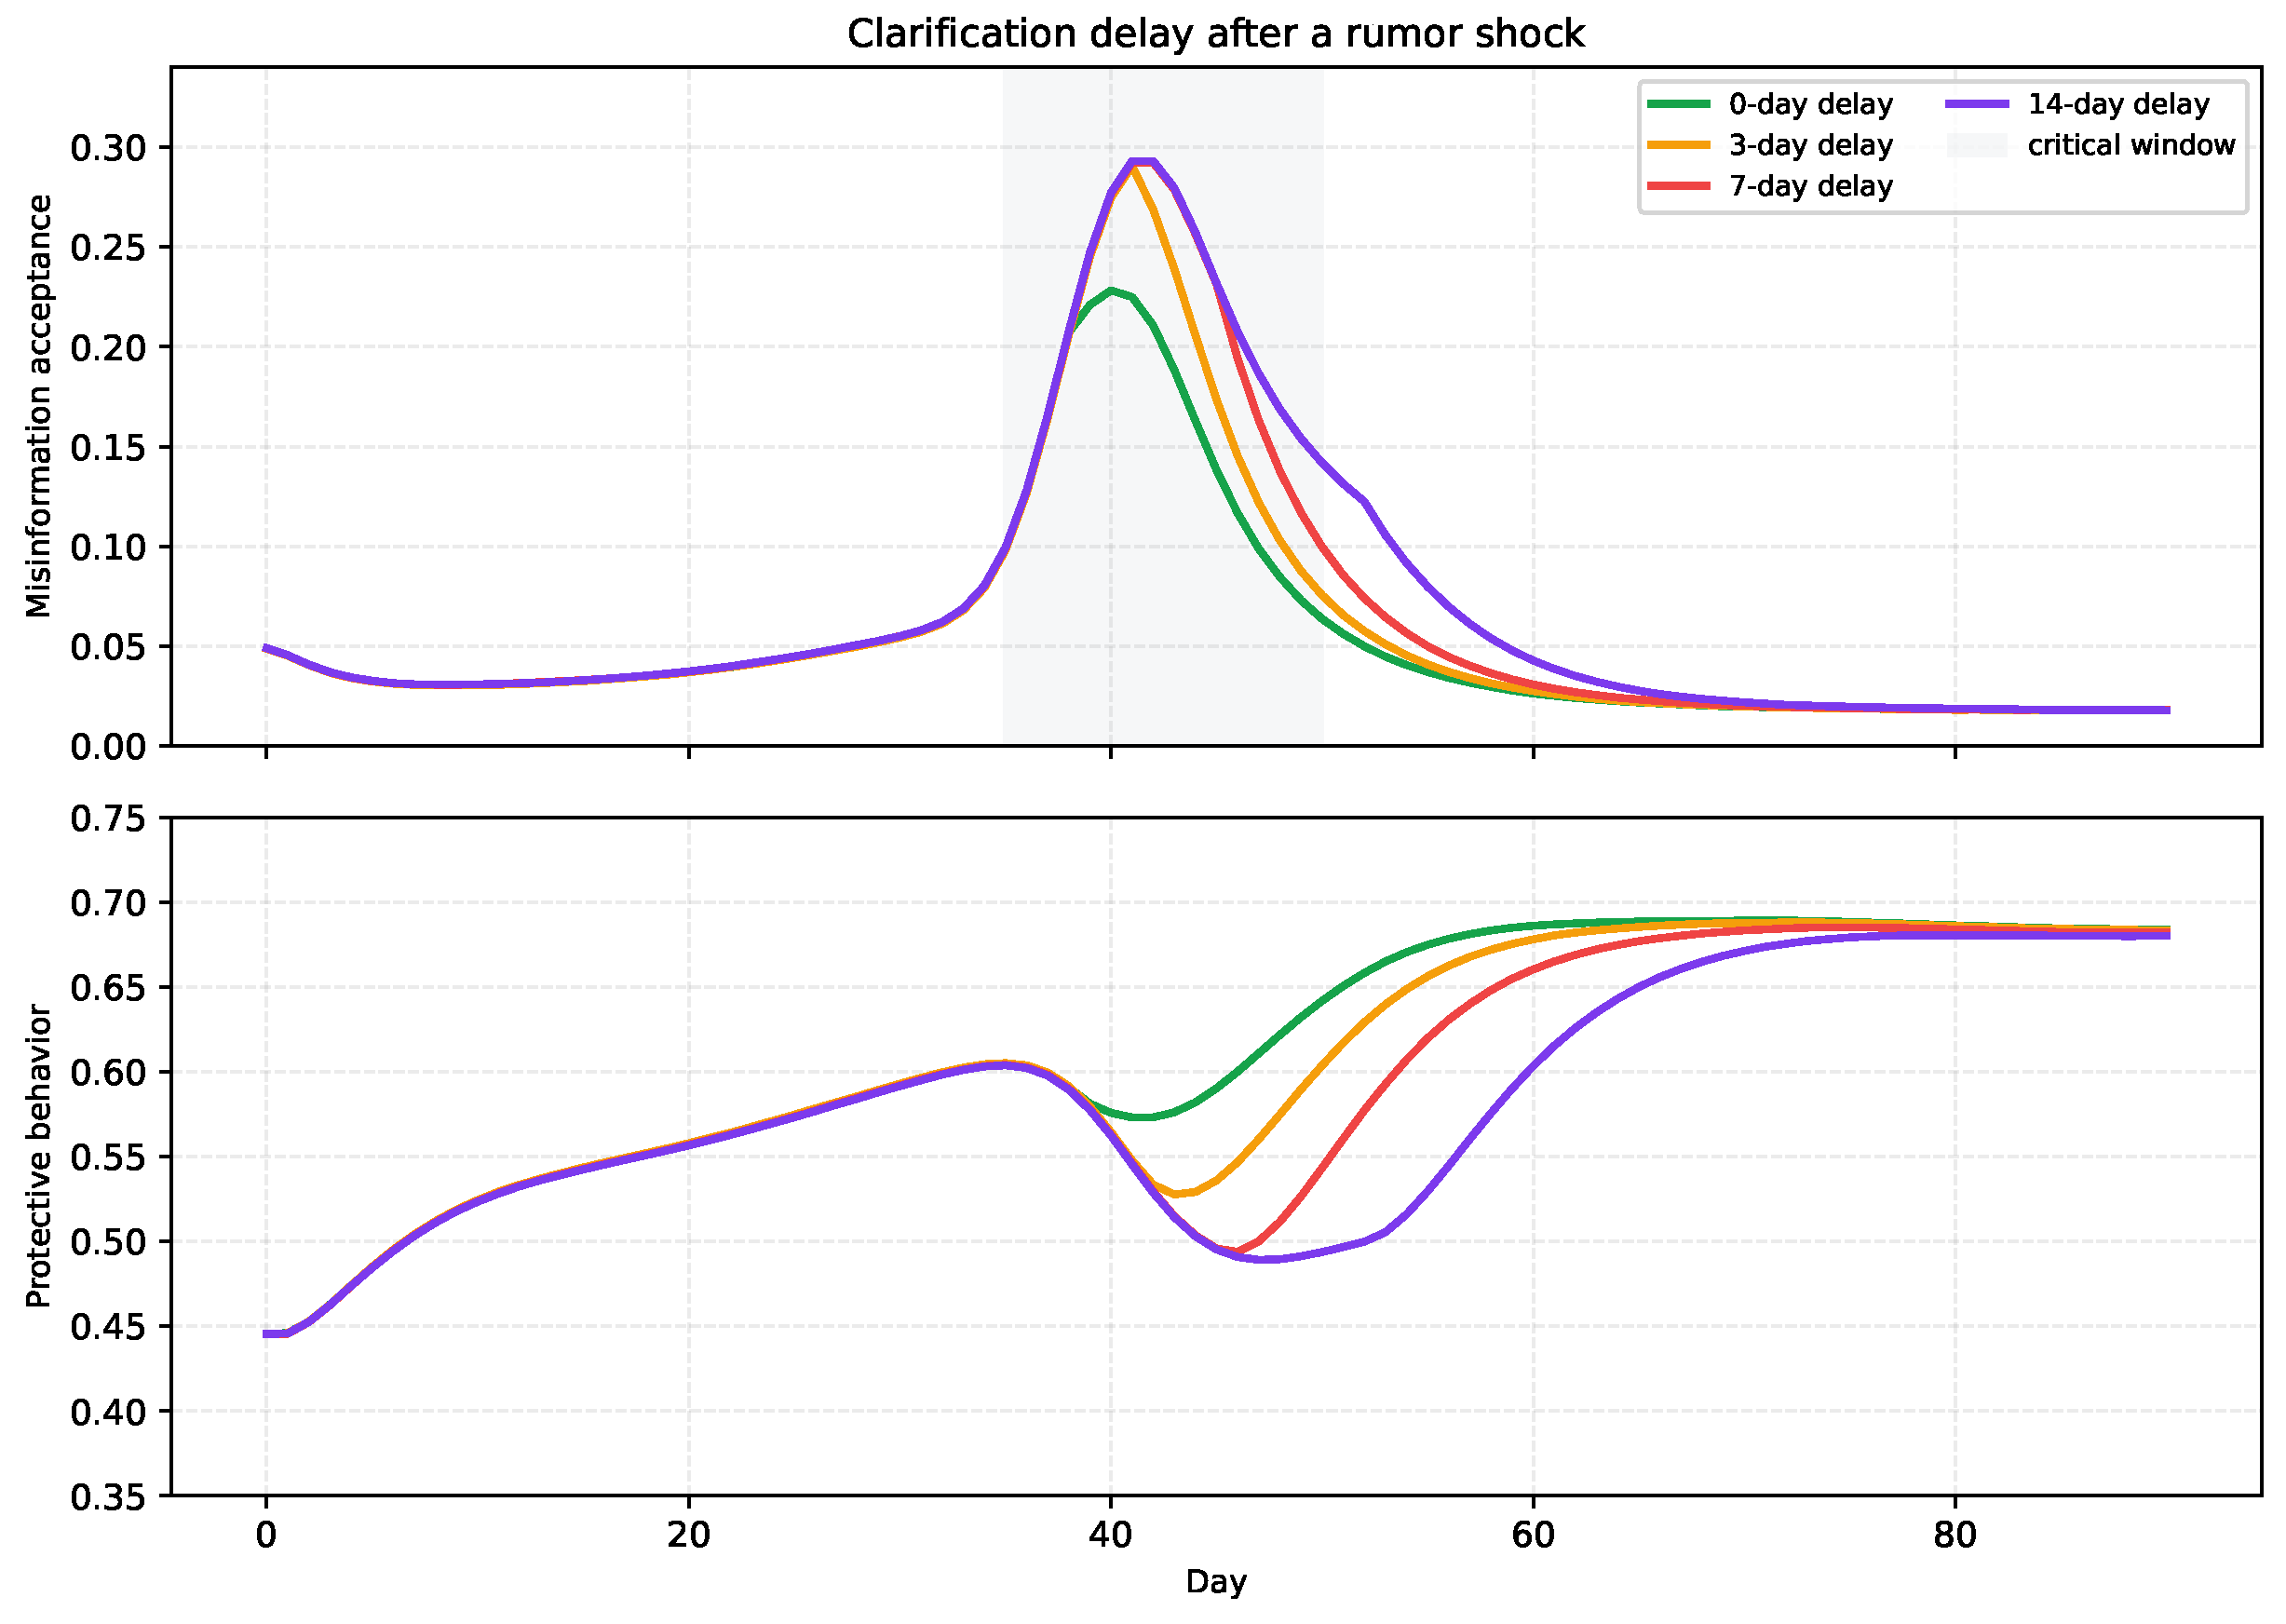
A misinformation shock is injected near the peak uncertainty window. Clarification begins immediately, after 3 days, after 7 days, or after 14 days.
Figure 4 and
Table 7 show the delay effect.
The delay theorem explains the pattern: before correction starts, rumor pressure lowers trust, and higher misinformation further suppresses trust. A longer delay extends the interval over which this positive feedback loop operates without countervailing coherence and expert amplification.
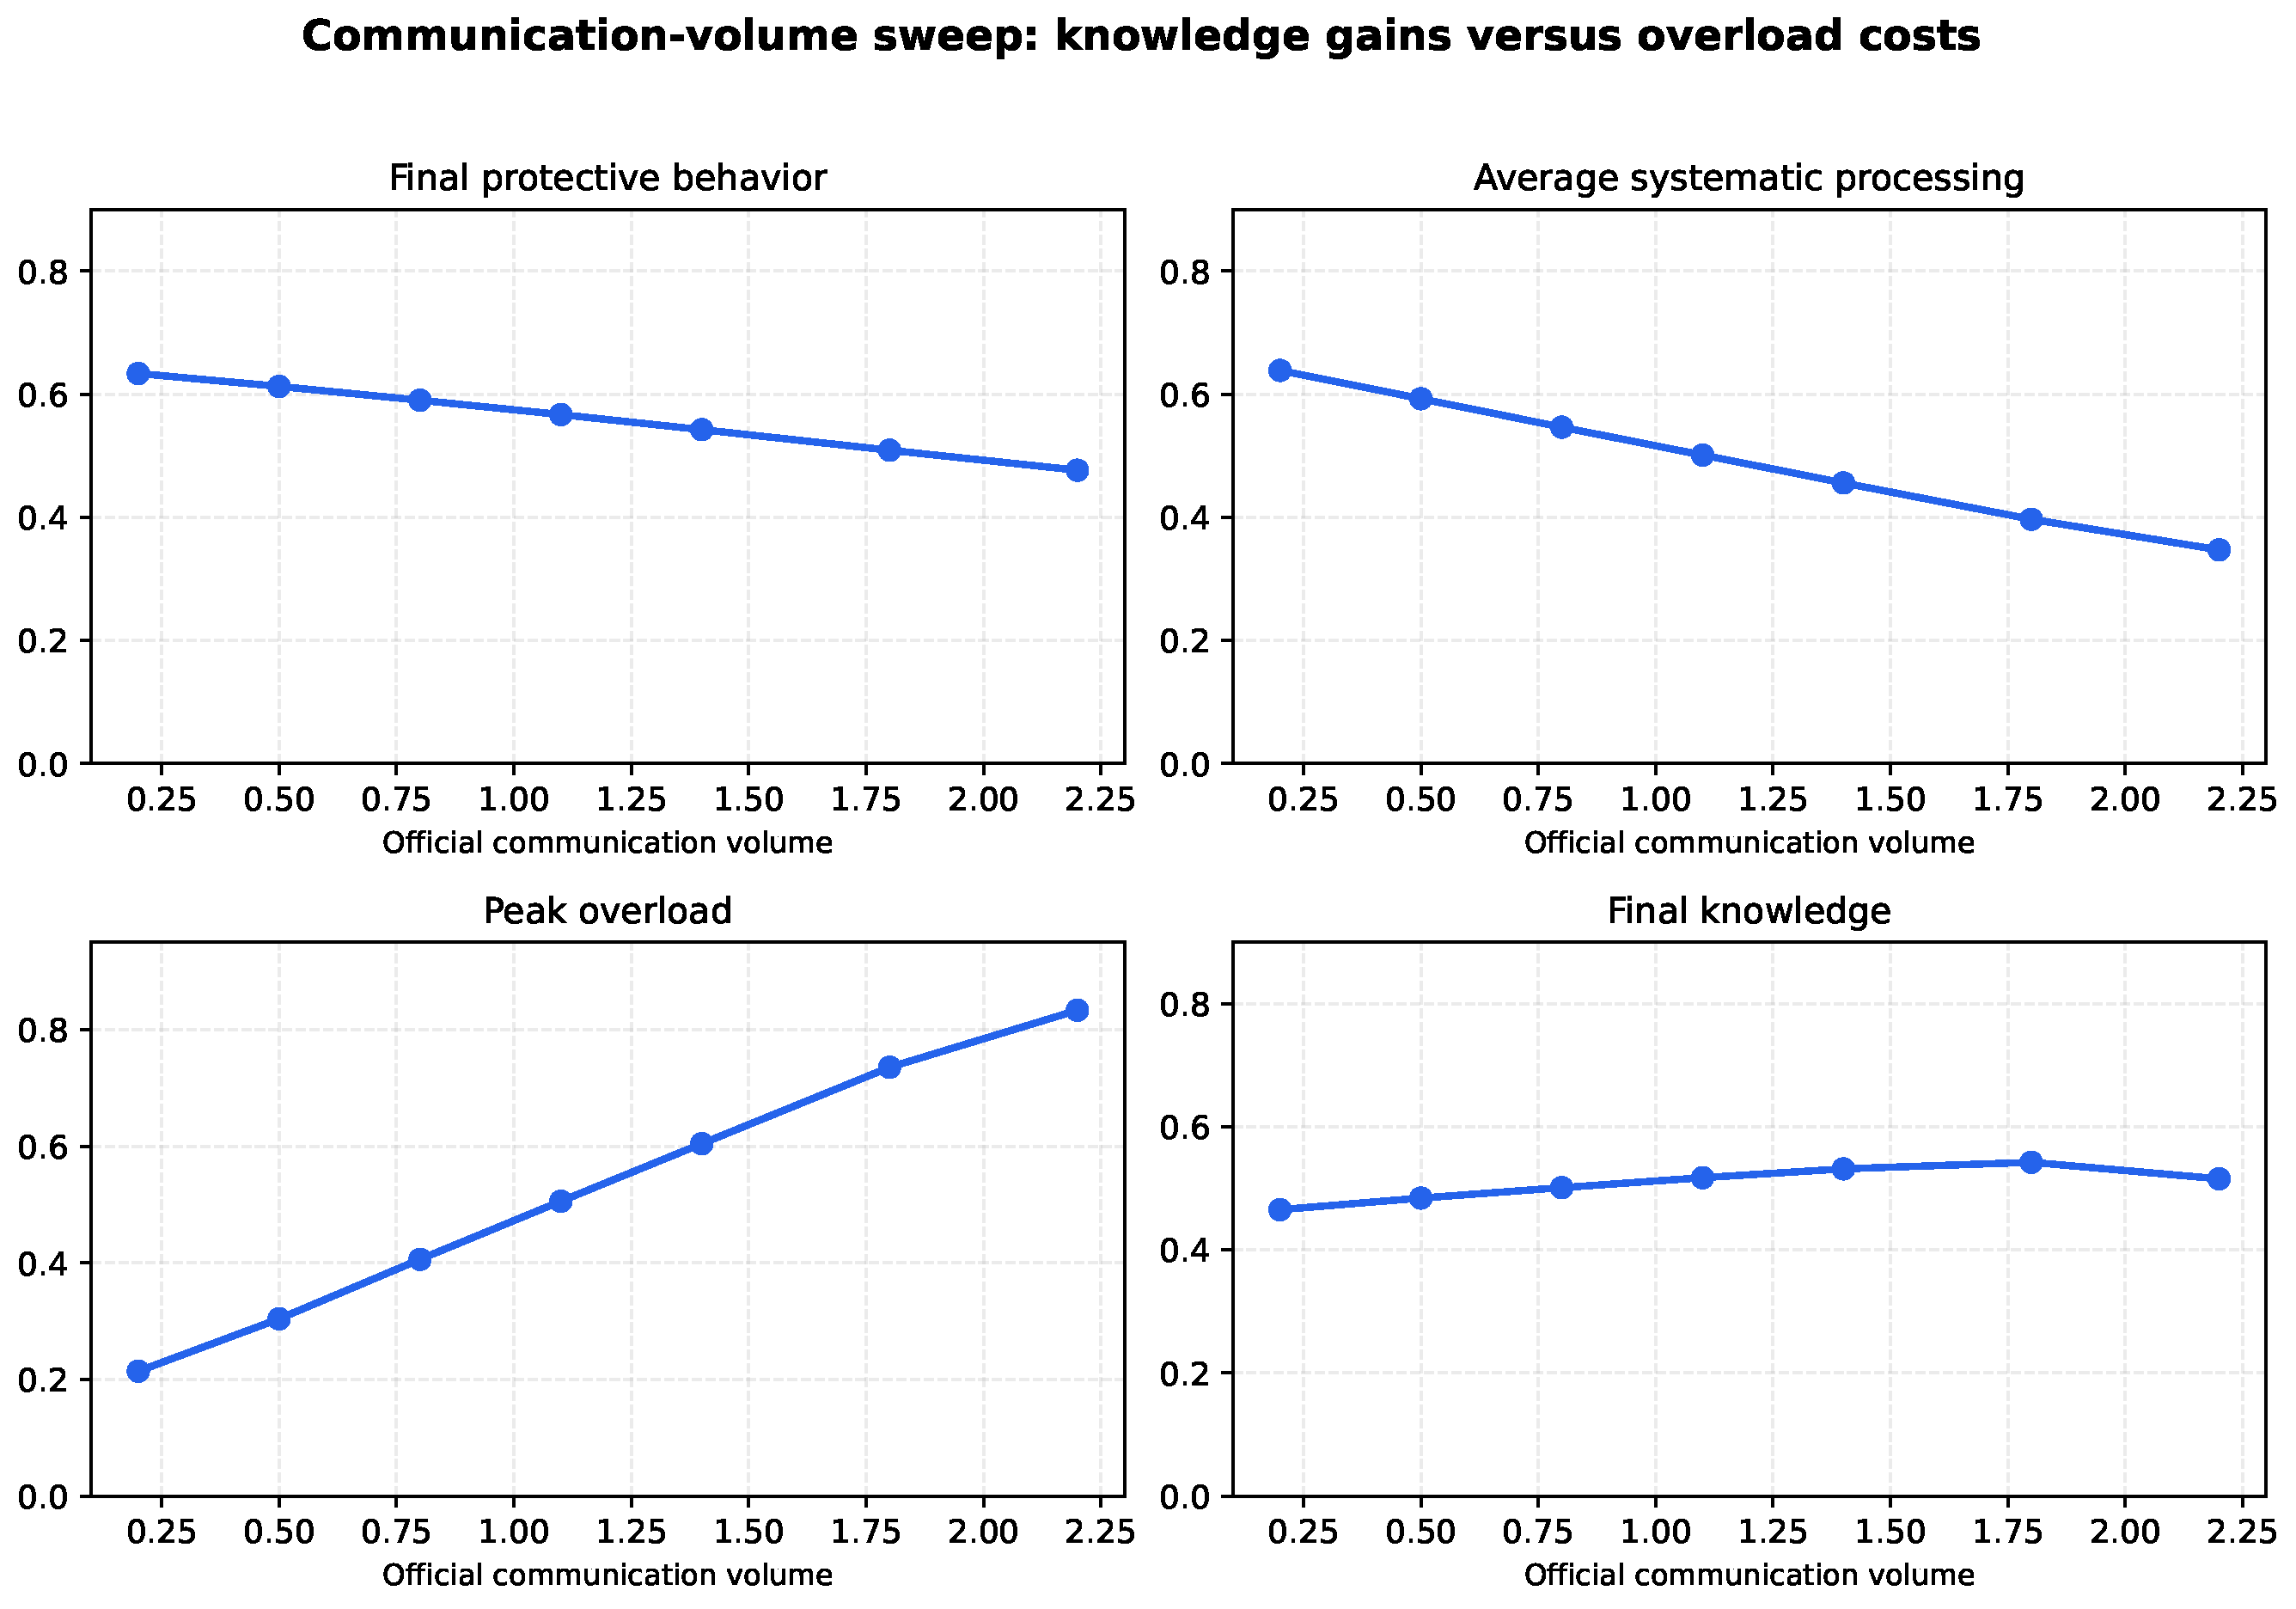
The volume sweep varies official communication volume while holding message quality fixed.
Figure 5 and
Table 8 show a non-monotone policy trade-off. Higher volume increases final knowledge at first, but also raises peak overload and lowers average systematic processing.
This result is important because it challenges the operational intuition that more official communication is always better. In SP-D-RISP, the sign of the marginal volume effect depends on whether knowledge gains exceed overload costs.
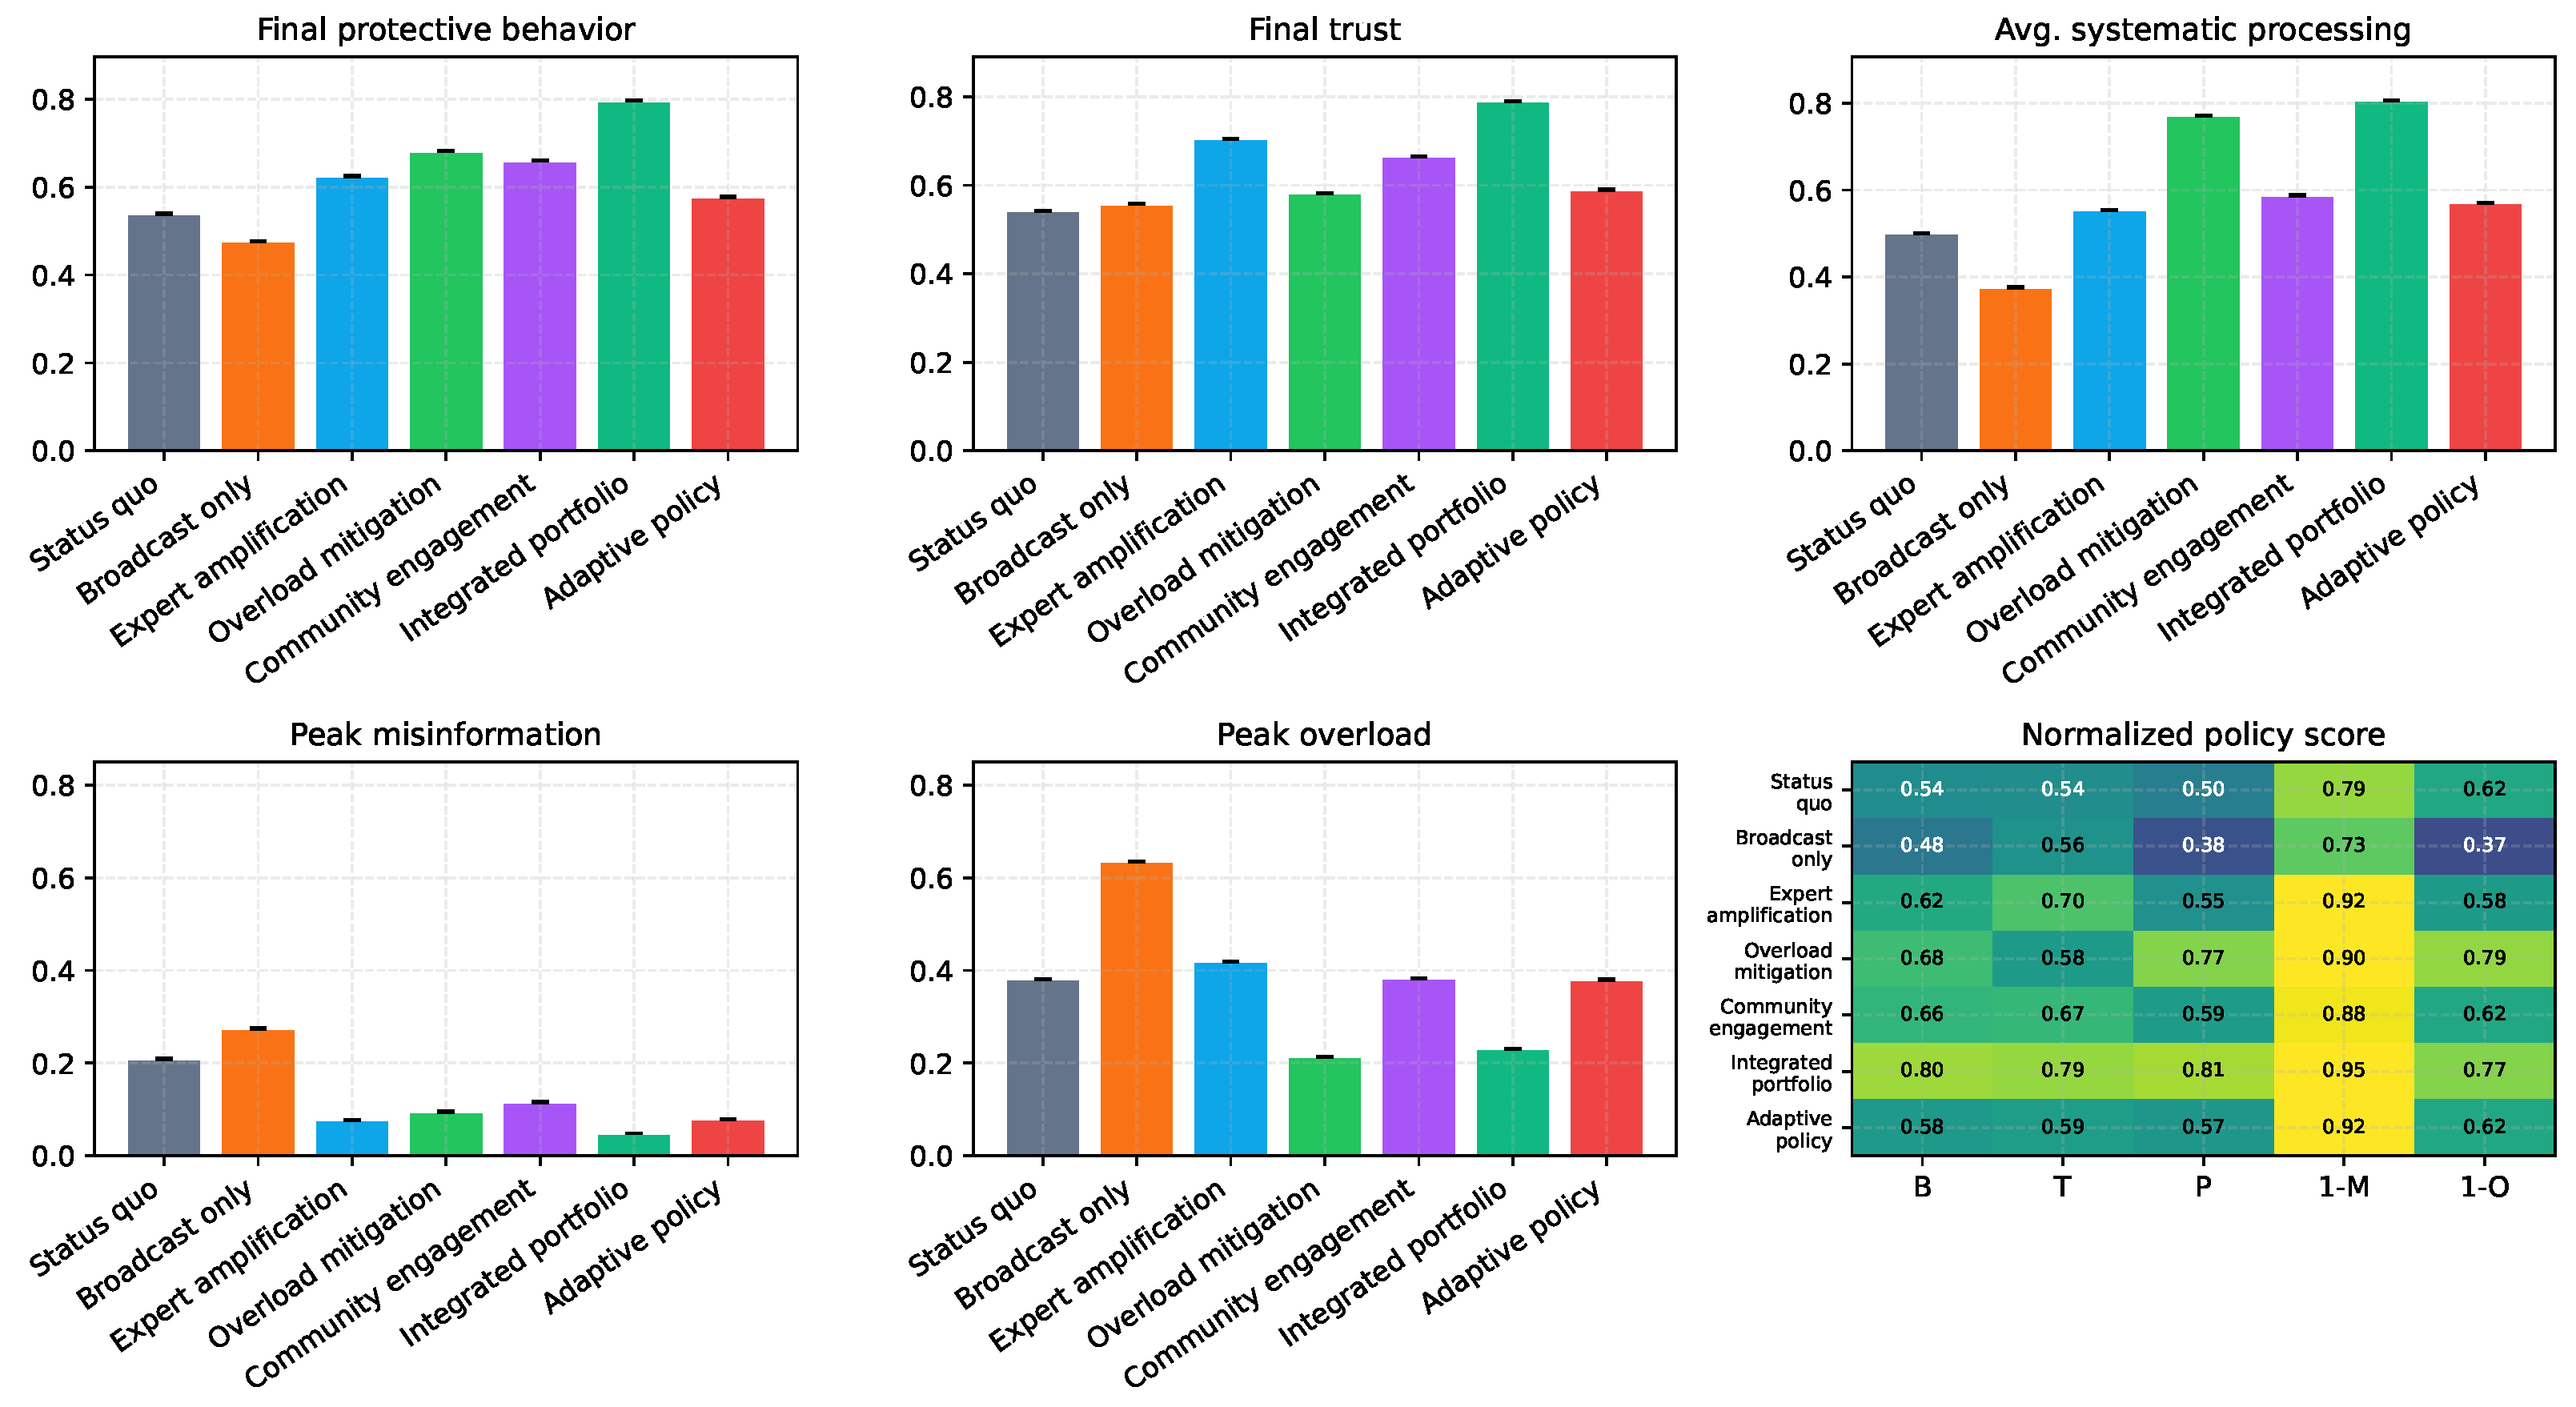
Before reporting the intervention comparison, we define the adaptive policy used in
Figure 6 and
Table 8. Let
The adaptive policy is a threshold-based reactive rule using lagged population averages:
where
is the status-quo policy,
and
are the misinformation and overload thresholds used in Equations (33) and (34), and
projects the result back to the admissible policy set. The activation vectors are
with non-negative entries. Thus, when misinformation exceeds the threshold, the rule increases coherence, expert amplification, and community engagement; when overload exceeds the threshold, it increases overload mitigation and caps communication volume. Unlike the integrated portfolio, which applies a fixed multi-component intervention throughout the stress scenario, the adaptive policy changes only after the corresponding lagged risk indicator crosses its threshold.
The intervention experiment compares seven policies: status quo, high-frequency broadcast only, expert amplification, overload mitigation, community engagement, integrated portfolio, and adaptive policy. A moderate rumor shock is included so that the strategies are compared under stress.
Figure 6 and
Table 9 present the results.
Here,
is a bounded finite-horizon simulation score, where larger values indicate higher protective behavior, higher trust, stronger systematic processing, lower peak misinformation, and lower peak overload under the fixed semi-synthetic calibration. This score summarizes realized finite-horizon outcomes only. It is not the coefficient-level Wasserstein certificate in Theorem 2, which is evaluated separately through
.
6.1. Numerical Verification of the Coefficient-Level Contraction Certificate
Using the complete parameter vector in
Appendix A, we constructed the
non-negative matrix
in the state order
for every distinct pair
used by the reported experiments.
Table 10 is deliberately separated from
Table 9: the former is a coefficient-level contraction calculation, whereas the latter contains simulated outcomes. Policy changes in coherence, expert amplification, community engagement, and overload mitigation enter as common additive inputs and therefore do not alter
; communication volume changes
.
Every reported matrix has a spectral radius below one. The largest value is
for broadcast-only communication under rumor stress. Moreover, the corresponding worst-case column-sum norm is
, so the more conservative sufficient condition in Corollary 1 also holds. Hence, no reported calibrated setting has
. For stationary fixed-policy kernels, Theorem 2 is invoked directly. For deterministic delay or shock paths, the common worst-case matrix yields contraction of the composed one-step kernels conditional on the shared exogenous path, but the invariant-distribution conclusion is not invoked for the time-inhomogeneous process. Finally, Equation (
89) contains discontinuous threshold indicators; nearby coupled populations may therefore select different policy modes. The mode-wise values in
Table 10 do not by themselves establish a global switched-policy contraction, and Theorem 2 is not invoked for the adaptive closed loop.
The high-frequency broadcast-only policy performs poorly because it increases overload and misinformation risk. Expert amplification is effective for trust and rumor suppression, while overload mitigation strongly increases systematic processing. The integrated portfolio dominates because it targets the coupled system rather than a single pathway.
Figure 7 reports two reliability diagnostics. The left panel shows convergence of the Monte Carlo estimate of baseline final protective behavior. The right panel gives the Hoeffding worst-case concentration half-width as a function of agent count.
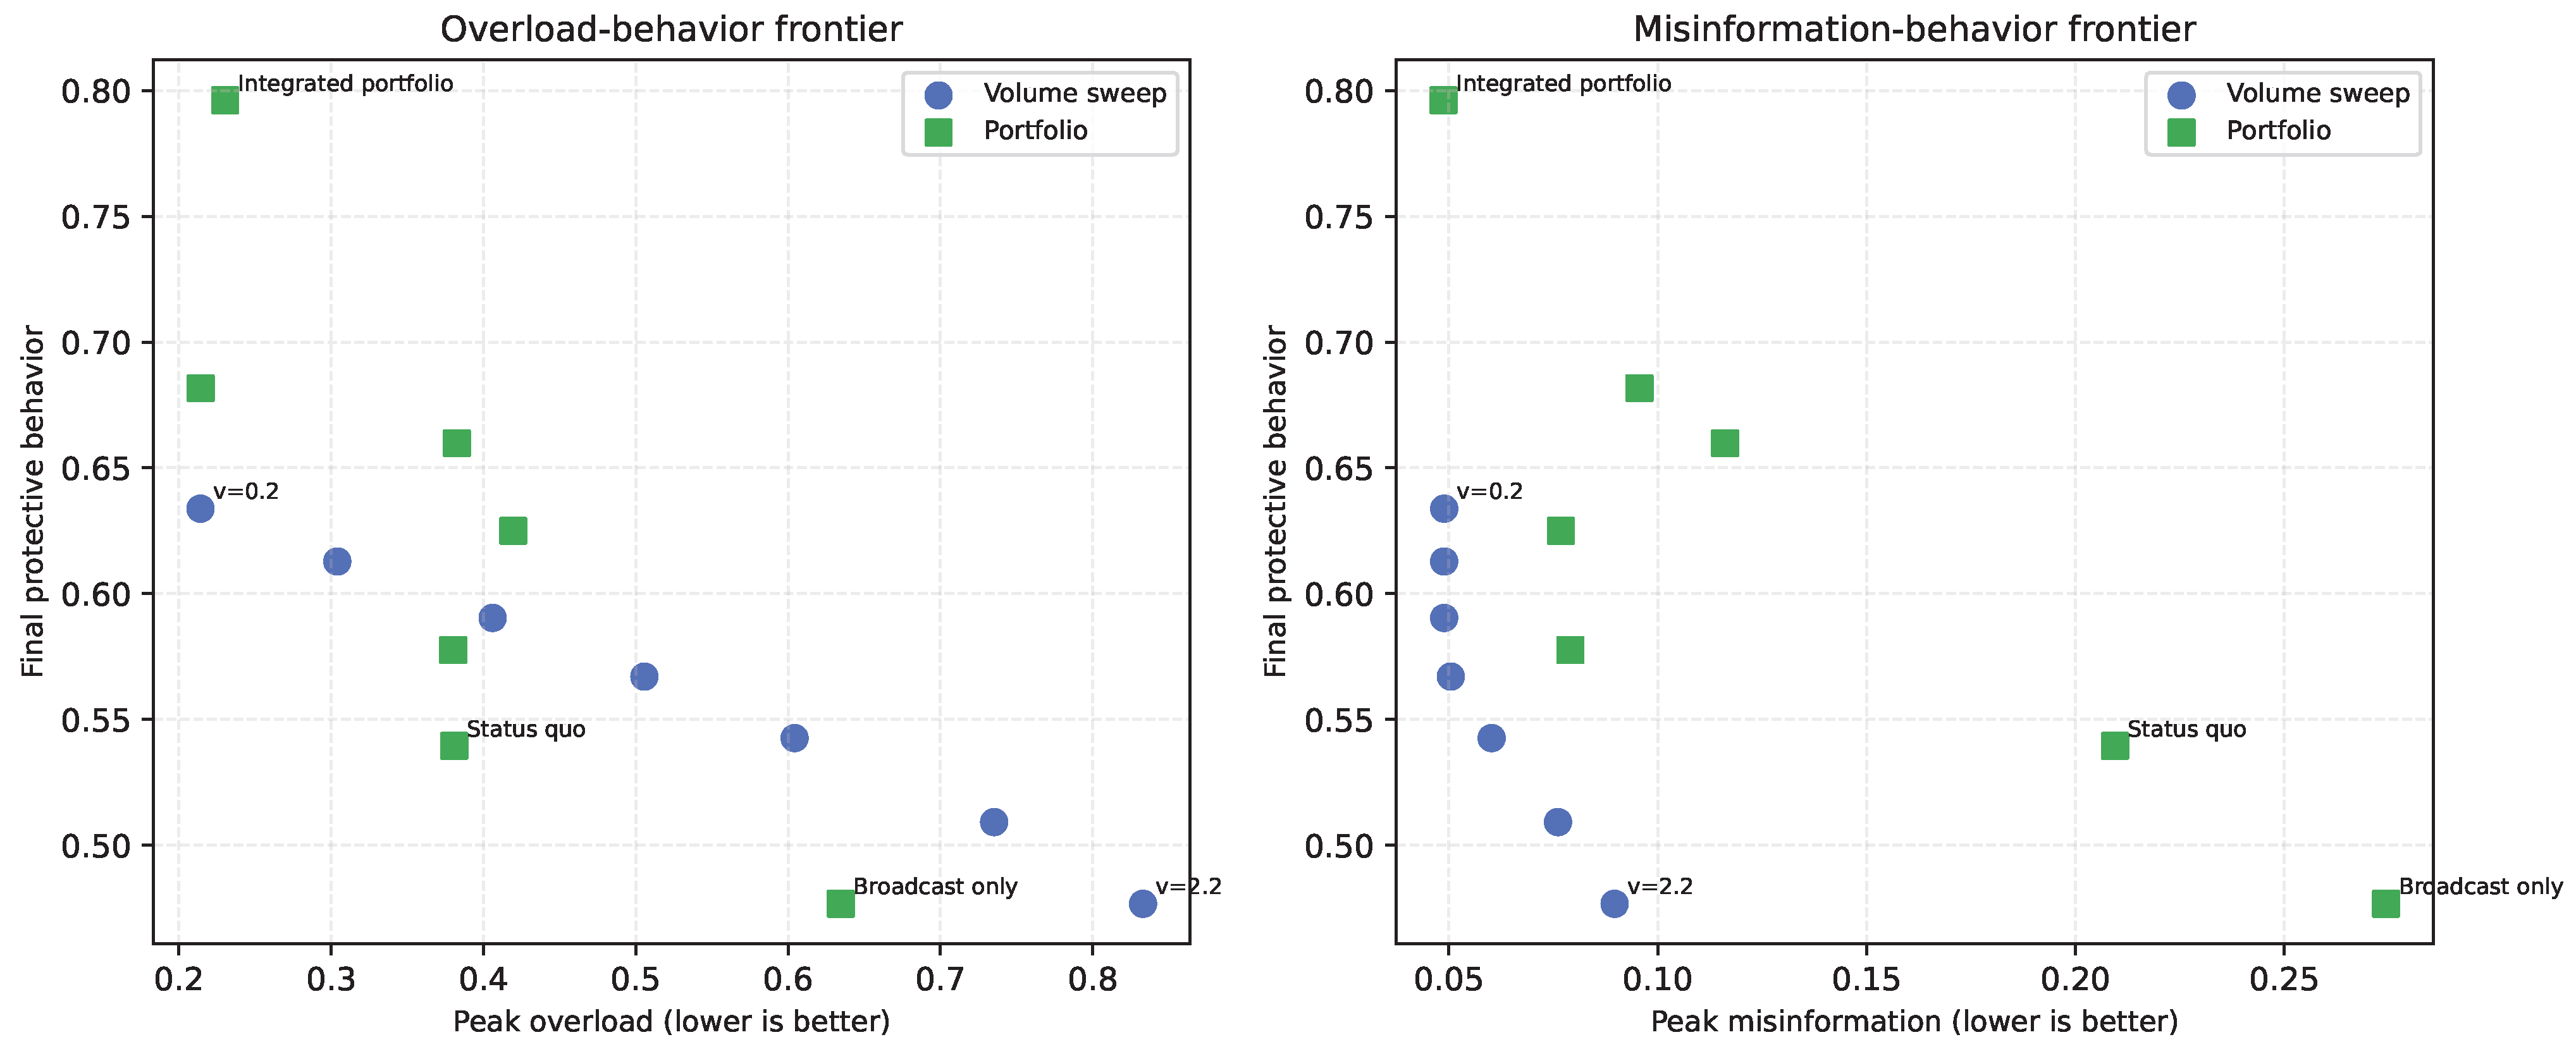
Figure 8 shows policy frontiers. A good strategy should be located high on final protective behavior and low on peak overload or peak misinformation. The integrated portfolio is close to the desirable upper-left region in both panels.
6.2. Basic Parameter Sensitivity Analysis
Because the simulation is semi-synthetic, the main policy patterns should not depend only on one hand-selected coefficient vector. We therefore conducted a local parameter-sensitivity analysis around the baseline calibration. Let
denote the baseline vector of all nonzero behavioral coefficients in the channel-attention, trust-update, misinformation, overload, processing, and behavior equations. For sensitivity draw
, each nonzero coefficient was perturbed as
while preserving the sign and zero-restriction structure implied by the hypotheses in
Table 2. The same scenario definitions were then re-evaluated under the perturbed parameter sets.
Within each sensitivity draw, all nonzero coefficients receive their own multiplier in , so the full nonzero coefficient vector is perturbed simultaneously rather than one coefficient at a time. This is a local, sign-preserving robustness diagnostic; it does not characterize global parameter uncertainty and does not replace posterior uncertainty obtained from field estimation.
Three qualitative robustness criteria were examined. The clarification delay pattern is retained when
The volume-overload trade-off is retained when
The portfolio result is retained when the integrated portfolio has the largest composite simulated score
among the evaluated strategies.
Table 11 reports the sensitivity results. The baseline contrasts are computed from the main simulation tables, while the robustness frequencies summarize the proportion of perturbed parameter sets for which the corresponding qualitative pattern is preserved. These diagnostics do not provide empirical validation, but they reduce the possibility that the reported patterns are artifacts of one exact coefficient vector.
The sensitivity analysis supports a cautious interpretation: the three patterns are not treated as empirically validated policy laws, but as model-based hypotheses that remain stable under the reported local coefficient perturbations.
7. Discussion
The proposed model offers several substantive and methodological implications.
First, trust and literacy are structural moderators. Trust affects channel attention and posterior credibility updating, while literacy lowers overload and misinformation vulnerability. This explains why high-trust and high-literacy groups show better protective behavior even under the same external emergency severity.
Second, overload should be treated as a policy constraint rather than a side effect. The volume sweep shows that communication volume can improve knowledge while reducing behavior if it pushes the audience into overload. This generates the empirically testable hypothesis that effective crisis communication may need to balance message frequency against clarity, coherence, and digestibility. Accordingly, within the scope of the model, communication volume should be optimized jointly with coherence, timing, targeting, and overload mitigation rather than maximized as an isolated policy objective. This is a conditional, testable implication rather than a universal claim that additional communication is harmful.
Third, delayed clarification has a probabilistic feedback explanation. The monotone-coupling theorem shows that a longer delay gives the rumor-trust-misinformation loop more time to operate before correction. The simulation confirms this mechanism by showing higher transient misinformation and lower behavior in the critical window.
Fourth, within the evaluated semi-synthetic scenarios, the integrated portfolio produces more favorable modeled outcomes than the examined single-lever strategies because it acts on several coupled pathways. Expert amplification improves trust and suppresses rumors; overload mitigation preserves systematic processing; community engagement strengthens norms; coherent communication supports Bayesian trust accumulation. A single intervention rarely controls all these pathways.
Fifth, the simulation is more reliable than a purely deterministic demonstration. Confidence bands, Monte Carlo standard errors, and concentration inequalities provide uncertainty statements. This is important for a methods paper because policy claims should not depend on a single random seed or one illustrative trajectory.
The first substantive limitation is that the present paper remains semi-synthetic. The coefficient signs and zero restrictions are theory-constrained, but their magnitudes have not been estimated from longitudinal field data. The reported sensitivity frequencies show that selected directional patterns are not tied to one exact coefficient vector, but they do not establish external validity, population transportability, or out-of-sample forecasting accuracy. Immediate operational forecasting therefore requires field estimation and validation before the model is used to select communication intensity, timing, or intervention thresholds.
The second substantive limitation is the mean-field, conditionally exchangeable population representation. Community engagement and social-media dependence summarize social influence, but the model does not encode an explicit contact or information-sharing graph. It therefore cannot presently distinguish scale-free from homogeneous degree distributions, represent clustering and homophily, or quantify echo-chamber amplification and topology-dependent cascades. Extending SP-D-RISP to multilayer networks with channel-specific edges, group-specific trust sources, and endogenous rewiring is an important next step, but it will require a joint-state transition kernel and topology-specific stability and concentration analysis rather than a direct reuse of the current independent-agent results.
These limitations do not invalidate the present mechanism-based comparisons, but they delimit their interpretation: the current results concern a theory-constrained, mean-field SP-D-RISP specification and not a field-calibrated forecasting system or a network-topology model.
8. Conclusions
This paper revises the dynamic RISP framework into a Stochastic Probabilistic Dynamic RISP model for public health crisis communication. Compared with a deterministic variable-extension model, SP-D-RISP introduces probabilistic channel competition, Bayesian trust updating, bounded stochastic transitions, and formal policy-risk metrics. Theoretical results establish boundedness, Markov/Feller properties, invariant-measure existence, a coefficient-level sufficient condition for Wasserstein stability, finite-sample concentration, Monte Carlo CLT inference, trust posterior concentration, delay amplification, and existence of risk-constrained optimal policies. For the disclosed coefficient vector, all distinct calibrated matrices satisfy , with range – and worst-case . The stationary-kernel conclusion is restricted to fixed policies; time-varying paths use a common-path one-step bound, and the threshold-adaptive policy is reported only with mode-wise diagnostics. Within the semi-synthetic scenarios examined, the simulations generate the hypotheses that high-frequency broadcasting may reduce modeled protective behavior when overload effects dominate, delayed clarification may increase misinformation during the critical response window, and integrated portfolios may produce a stronger combined simulated profile than the evaluated single-lever strategies. These conditional findings require validation with longitudinal public health communication data before they are interpreted as general policy recommendations. They should likewise be interpreted as mean-field comparative results rather than topology-specific diffusion forecasts.
SP-D-RISP also generates testable predictions that differ from simpler dynamic extensions of RISP. A simpler dynamic RISP model may preserve lagged pathways among risk perception, affect, information insufficiency, seeking, processing, and behavior, but typically treats information exposure as an aggregate scalar input and trust as an exogenous or deterministic state. In contrast, SP-D-RISP predicts that source composition matters even at fixed total exposure, because official, expert, community, and rumor channels compete for attention. It further predicts path-dependent clarification effects through the rumor–trust–misinformation feedback loop, non-monotone communication volume effects when overload dominates knowledge gains, and distributional risk-window outcomes such as peak misinformation, peak overload, and threshold-exceedance frequencies. These predictions can be tested by estimating nested dynamic RISP and SP-D-RISP specifications using longitudinal survey indicators, channel-level exposure records, fact-checking or rumor traces, and observed protective behaviors.