1. Introduction
Digital core technology is a cornerstone research method for characterizing and simulating the microstructure and physical properties of porous media in petroleum engineering, geology, and geophysics [
1,
2]. Digital core modeling methods are generally categorized into physical experiments and numerical reconstruction [
3,
4,
5]. Physical experimental methods mainly include computed tomography (CT) [
6,
7], scanning electron microscopy (SEM) [
8] and focused ion beam scanning electron microscopy [
9]. These methods yield high-precision images, which provide a key basis for multi-scale pore structure analysis and macro–micro mechanism analysis [
10]. However, they generally face the limitations of high cost, complex operation and high destructiveness of samples, which are more prominent in large-scale or special lithology samples [
11]. In practical scientific research and industrial applications, only a limited number of two-dimensional slices or small-size three-dimensional image samples can be obtained. Therefore, efficient reconstruction of high-quality three-dimensional digital core models based on limited data has become a frontier challenge and actual demand in this field [
12,
13].
To address these challenges, numerical reconstruction technology has evolved through several developmental stages [
14]. Early process-based methods simulate the geological stages of sedimentation, compaction, and diagenesis to build 3D models [
15]. While these methods possess strong geological interpretability, they are computationally intensive and rely on numerous complex parameters that are difficult to calibrate for specific samples [
16]. In contrast, stochastic methods are more efficient. Among them, the traditional two-point geostatistical method has significant limitations in describing complex porous media, and it is difficult to effectively capture the morphological characteristics of complex spatial structures such as curved rivers and dissolved pores. Multiple-Point Geostatistics (MPS) has emerged, which significantly improves the ability to characterize complex pore structures by introducing training images (TI) with rich spatial structure information. Furthermore, recent advancements in deep learning, such as Generative Adversarial Networks (GANs) and Variational Autoencoders (VAEs), have demonstrated remarkable capabilities in generating highly realistic pore structures [
17]. However, deep learning models often function as “black boxes” and require massive high-quality training datasets, which limits their interpretability and applicability under data-scarce conditions [
5].
Among many MPS algorithms, the SNESIM (Single Normal Equation Simulation, SNESIM) algorithm is widely used in three-dimensional reconstructions of porous media because of its high efficiency and flexibility [
18] and has become a classic representative in this field [
19]. SNESIM, proposed by Strebelle, utilizes a multi-grid search strategy and pattern database to effectively maintain complex spatial structures while significantly reducing computational costs. A wealth of research has validated its efficacy; for instance, Okabe and Blunt demonstrated that MPS reconstruction excels in reproducing complex sandstone geometries where traditional Gaussian simulations fail [
20,
21]. Mariethoz and Caers further established a discussion system for non-Gaussian modeling [
22]. Building on these foundations, recent studies have explored parameter sensitivity [
23], 2D-to-3D feasibility [
24], and optimization via CNN/GLCM [
25]. To meet the demands of large-scale modeling, efficiency has been further enhanced through GPU migration and fast simulation strategies [
26,
27,
28].
While reconstruction algorithms have matured, the methodologies for evaluating the fidelity of these models have remained fragmented. Traditionally, evaluations rely on isolated metrics that capture only specific aspects of the rock structure. Macroscopic statistical parameters, such as porosity and pore size distribution, are used to reflect reservoir capacity [
29,
30], while microscopic topological features, such as coordination numbers, determine the connectivity of the pore network [
31,
32]. From a geometric perspective, fractal dimension provides a powerful tool to quantify the complexity and self-similarity of pore spaces [
33,
34]. Finally, transport behaviors are validated through pore-scale simulations like the Lattice Boltzmann Method (LBM) [
35,
36].
However, a critical gap remains: these parameters are often treated as independent indicators, leading to a disconnected assessment of reconstruction quality. Current research often emphasizes visual or statistical similarity (e.g., matching variograms or porosity) [
37,
38] but fails to provide a holistic framework that correlates multi-scale structural attributes—from macroscopic capacity to microscopic topology and fractal complexity—with the resulting physical transport properties. Most of the existing literature focuses on the performance of algorithms in small-scale reproduction, but few studies systematically evaluate the stability and fidelity of algorithms during the process of scale extrapolation (from small TIs to large domains). Crucially, the fractal dimension, which represents the cross-scale symmetry of the pore system, has not yet been integrated into an organic, collaborative analysis with connectivity and permeability. Therefore, establishing a logical evaluation framework that bridges the gap from microstructure to macro-function is an urgent necessity.
The primary contribution of this work is the proposal of an integrative multi-dimensional evaluation framework that transcends conventional single-metric assessments in digital rock physics. To demonstrate the efficacy of this framework, an improved SNESIM algorithm is utilized to reconstruct 3D digital core models across five expanding scales (from 40 × 40 × 40 to 120 × 120 × 120 voxels) based on a 60 × 60 × 60 voxel training image. To ensure statistical robustness and mitigate stochastic uncertainty, ten independent realizations are performed for each scale. By systematically linking metrics across macroscopic statistical, microscopic topological, complex morphological, and seepage properties, this work provides a more holistic and mechanistic understanding of reconstruction fidelity. Furthermore, while validated here using the SNESIM algorithm, the proposed evaluation framework is inherently generic and can be readily applied to evaluate other reconstruction techniques, such as process-based or deep learning models. Thus, this study not only clarifies the applicability and limitations of SNESIM in scale extrapolation but also offers a standardized methodology for benchmarking future reconstruction algorithms in the field.
2. Methodology
2.1. Training Image Parameters
Sandstone is selected as the model material for this study because it represents a classic benchmark in digital rock physics. Its well-defined pore structures and documented petrophysical properties provide a stable baseline for validating new evaluation frameworks. Furthermore, while sandstone is the testbed here, the proposed evaluation metrics are inherently generic and applicable to other lithologies, such as shale, provided the imaging resolution is sufficient to capture their characteristic pore scales.
The training data used in this study are derived from the scanning electron microscope (SEM) images of sandstone samples. After processing, a three-dimensional training image with a size of 60 × 60 × 60 voxel is constructed (denoted as T60), which clearly shows the microscopic pores and skeleton structure of the rock. Each voxel corresponds to a physical space of 1.5 × 1.5 × 1.5 μm3, resulting in a total volume of 7.29 × 105 μm3. While this scale may be smaller than the theoretical Representative Elementary Volume (REV) for highly heterogeneous sandstone, this selection was an intentional research design to simulate limited data conditions. The primary focus of this work is on a comparative methodological assessment of scaling effects rather than the absolute petrophysical characterization of a specific rock sample.
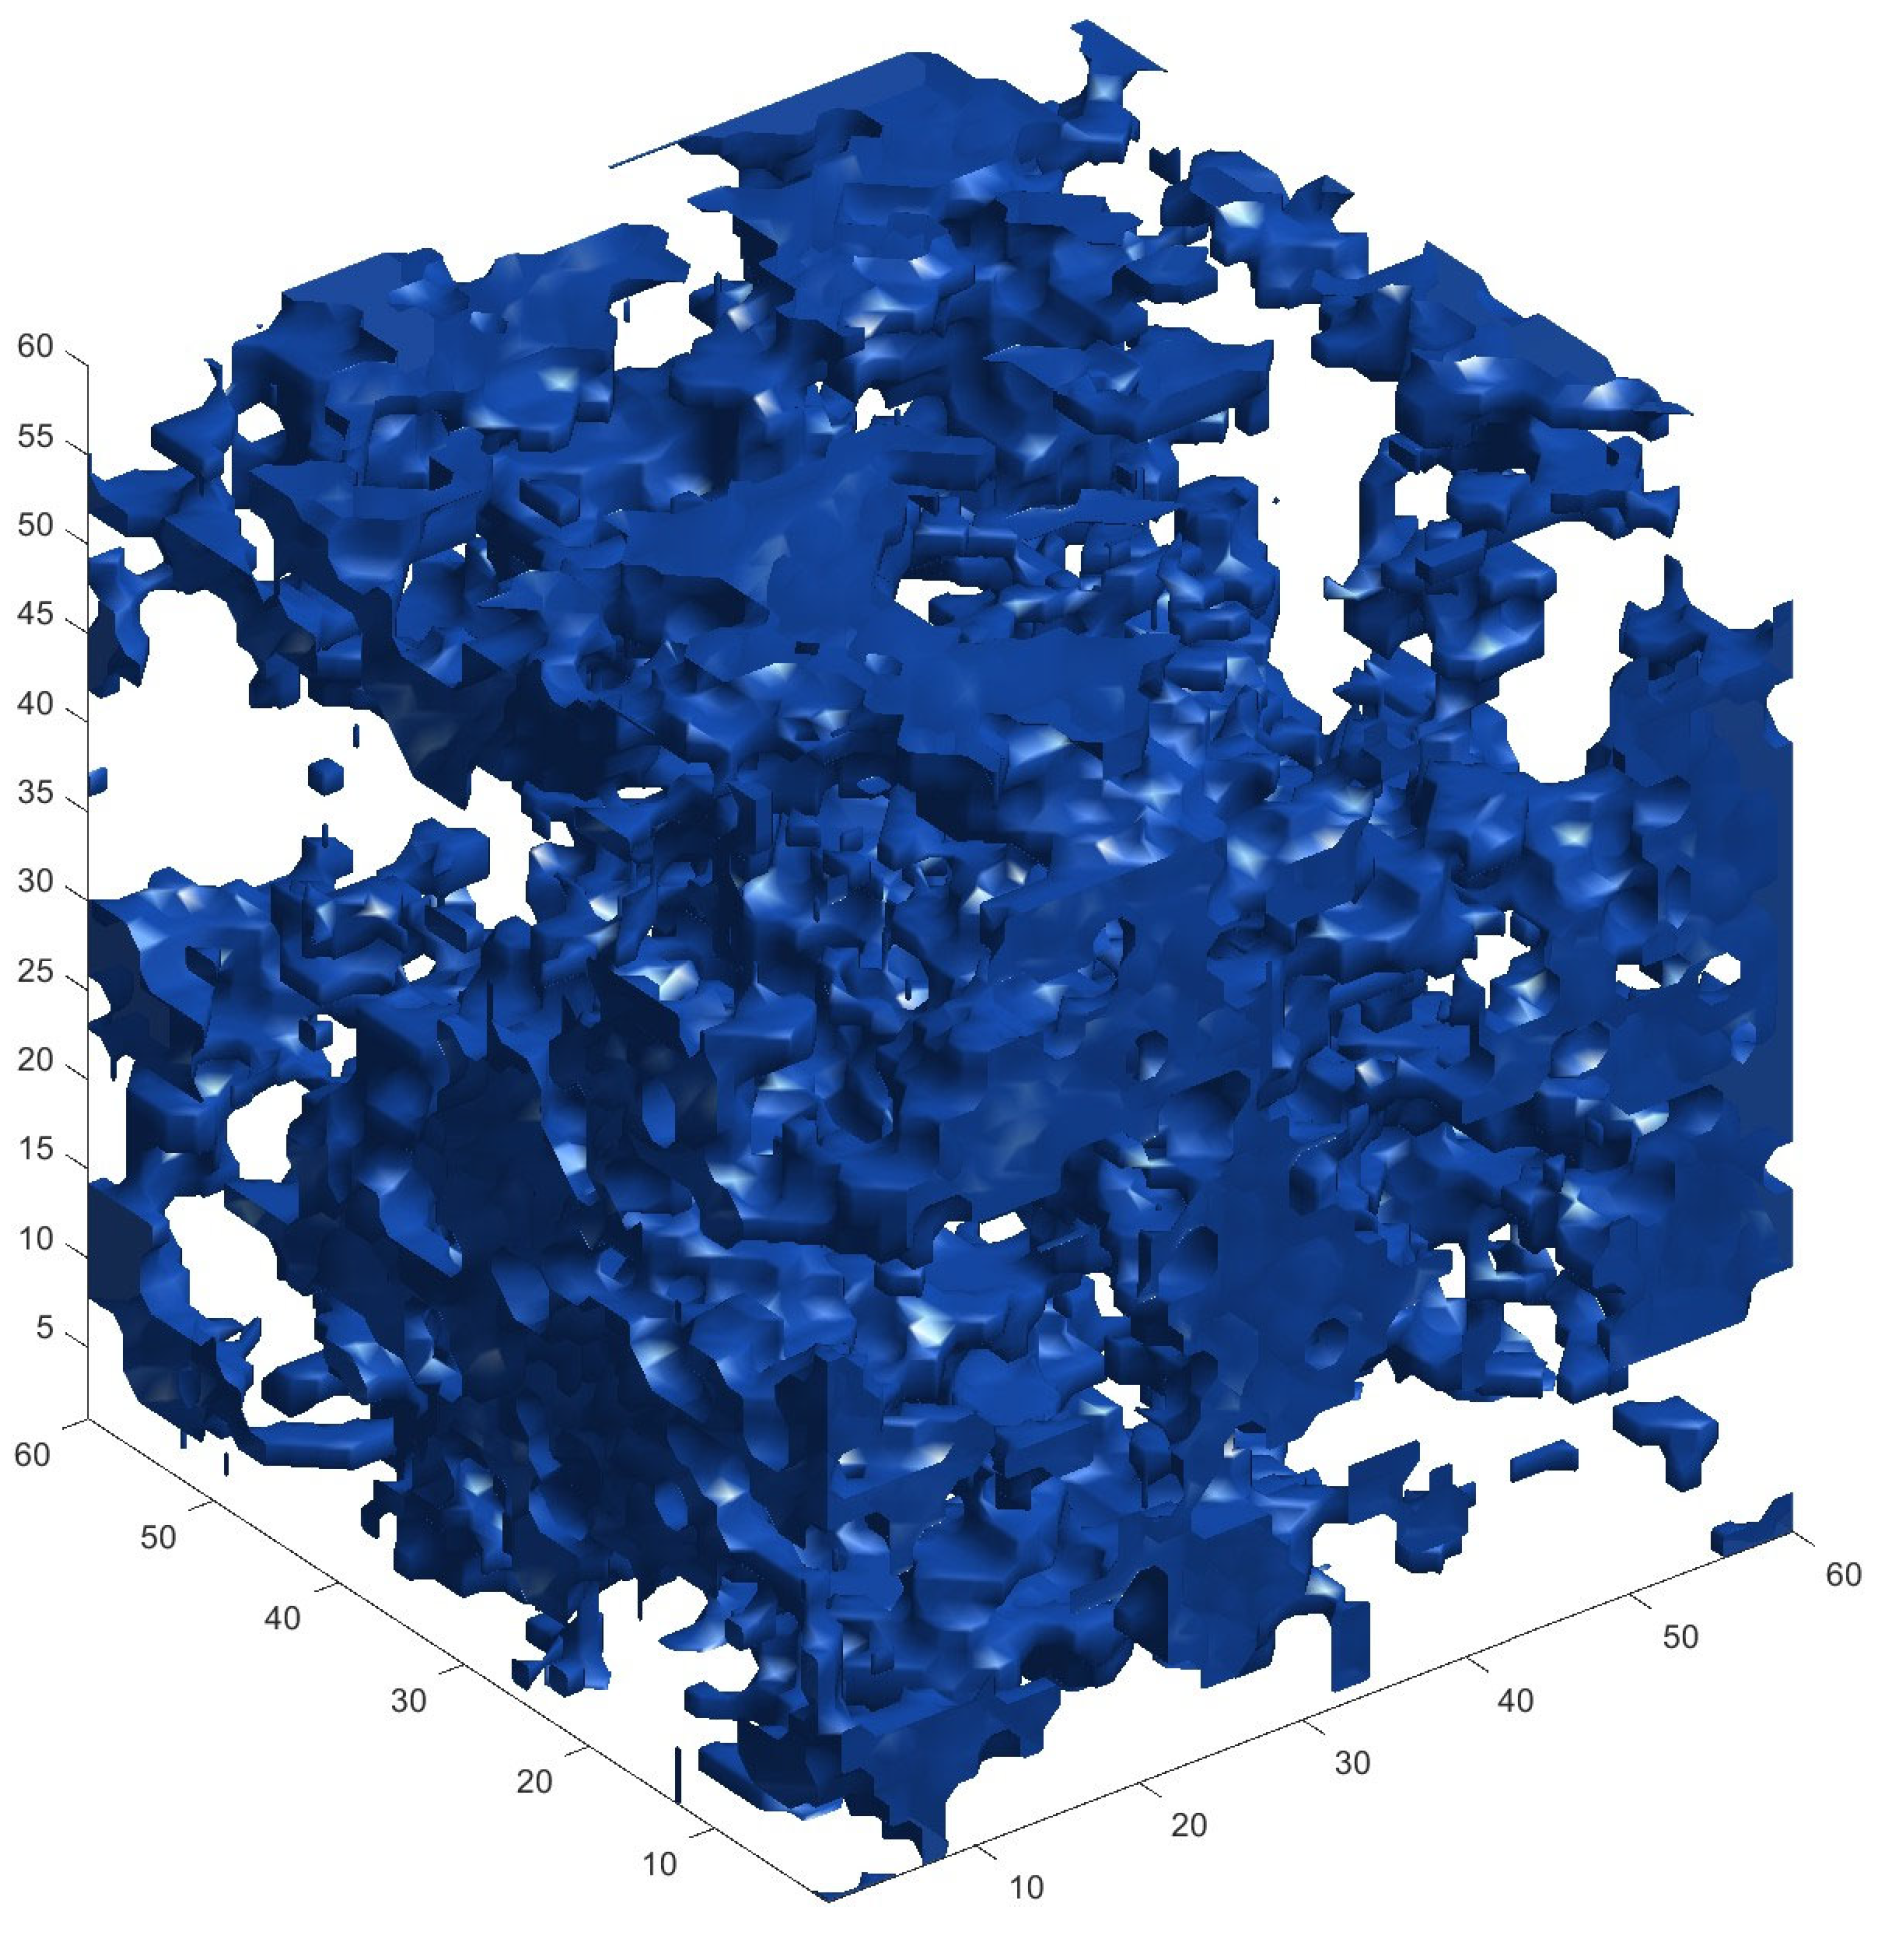
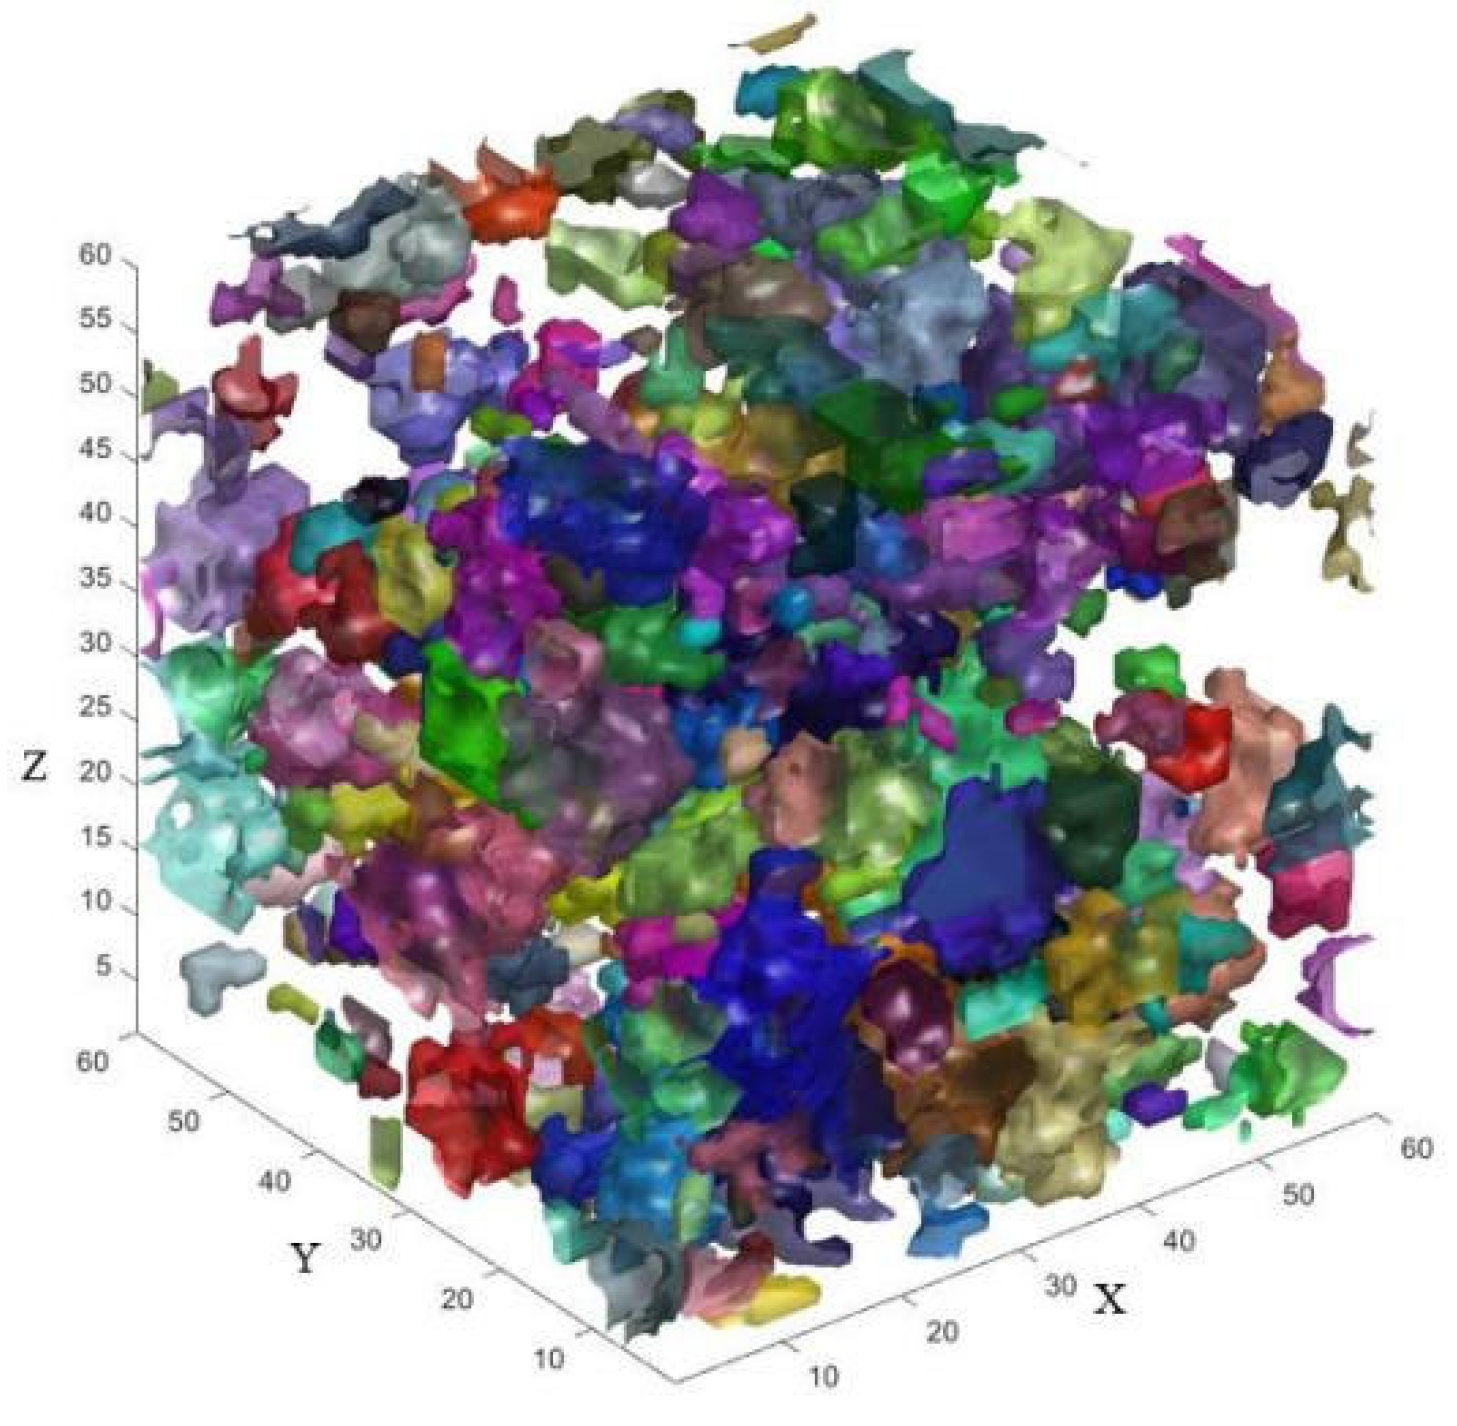
Figure 1 shows the constructed three-dimensional pore structure model, in which the blue area represents the rock pore phase, and the rest is the skeleton phase. The model retains the key spatial information of the multi-scale pore structure, serving as the input for the subsequent SNESIM-based multi-scale reconstruction.
2.2. Multiple-Point Geostatistics Reconstruction Based on SNESIM Algorithm
The SNESIM (Single Normal Equation Simulation) algorithm, a cornerstone of Multiple-Point Geostatistics (MPS), was employed for the 3D reconstruction of the digital rock. Unlike traditional variogram-based methods, SNESIM captures high-order spatial statistics and complex pore–throat connectivity by scanning a 3D Training Image to construct a search tree database [
39,
40,
41].
In this study, the simulation was implemented as a binary categorical system (number of categories = 2), representing the pore space and the grain matrix. To ensure structural fidelity and statistical consistency, the key implementation parameters were optimized based on the quantitative sensitivity analysis and methodological frameworks established in our previous study on SNESIM-based porous media reconstruction [
23]:
Search Template: The template was configured with 40 nodes. This high-order setting enables the algorithm to capture the intricate 3D tortuosity of the pore system from the TI, ensuring that complex pore–grain interfaces are accurately reproduced.
Search Neighborhood: An isotropic search radius of 25 voxels was defined. As verified by our prior sensitivity tests [
23], this radius is sufficient to encompass the maximum correlation length of the pore structures, ensuring a balance between capturing curvilinear connectivity and maintaining simulation diversity.
Multi-grid Strategy: A 3-level multi-grid strategy was employed. By performing sequential simulations from coarse to fine scales, this approach maintains long-range structural continuity while improving computational efficiency.
Target Distribution and Realizations: The target marginal distribution was strictly defined based on the porosity measured from the TI. For each case, 10 independent realizations were generated to evaluate stochastic uncertainty and ensure statistical stability.
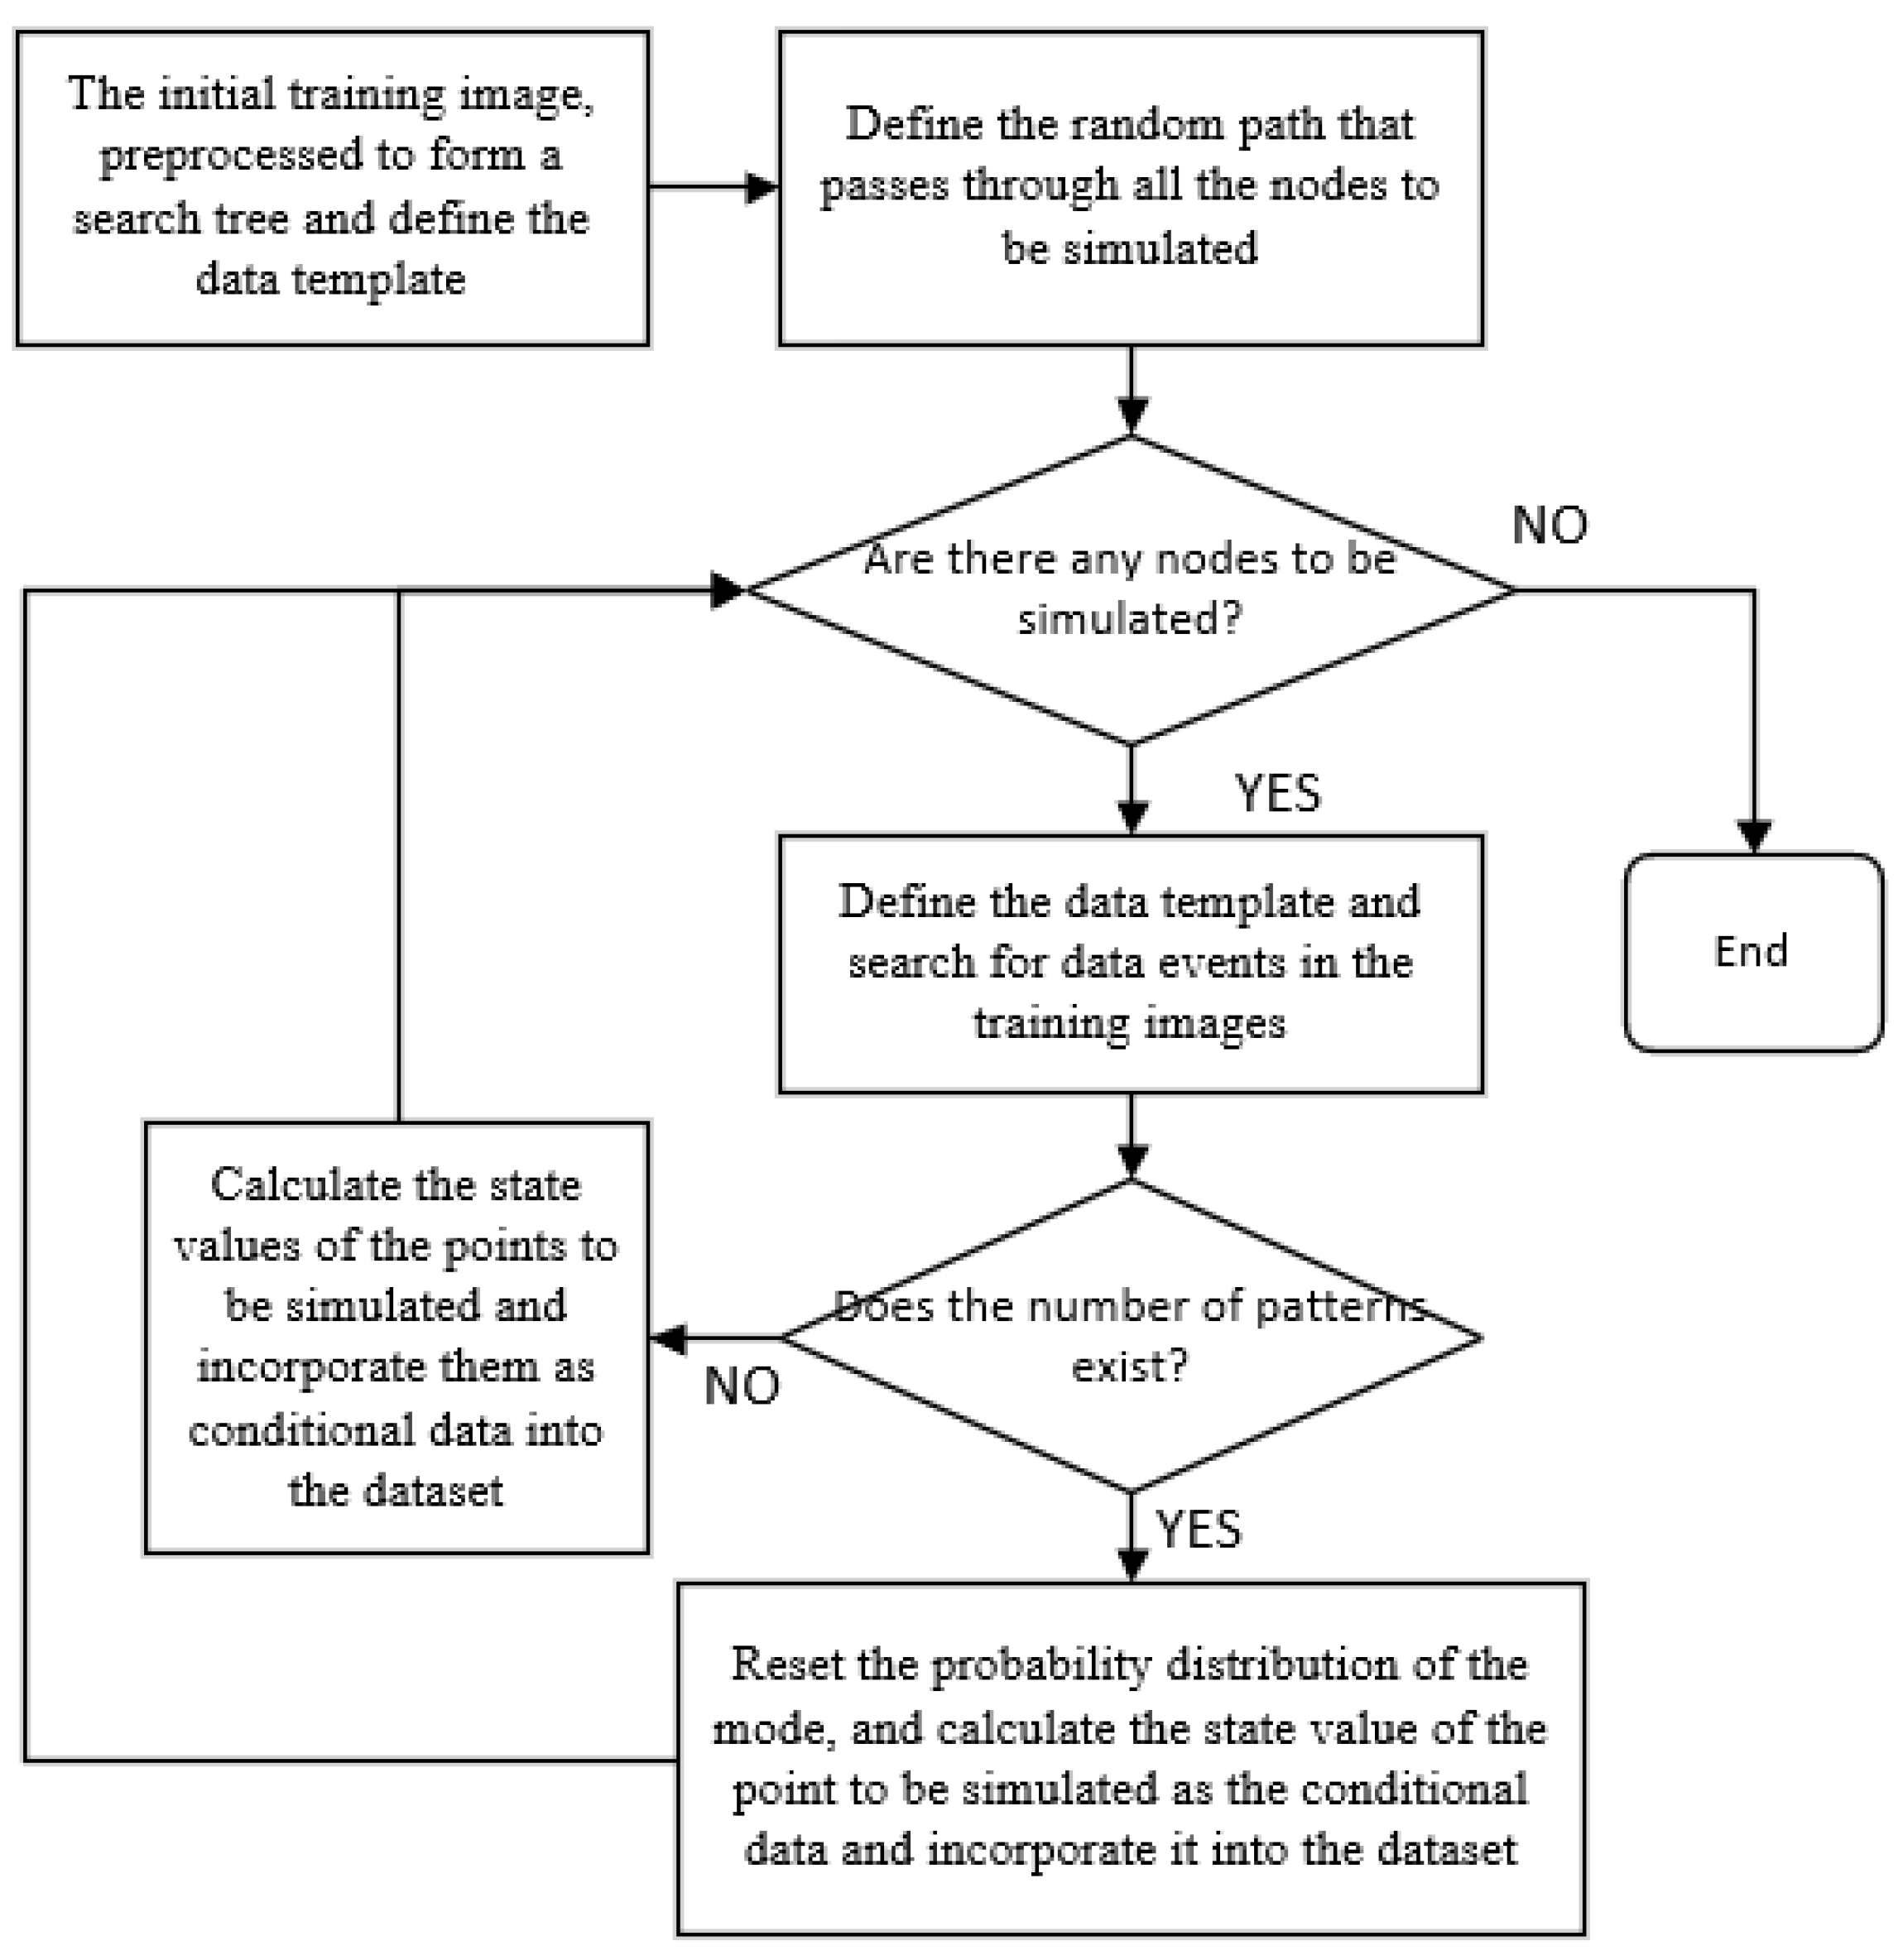
The simplified workflow of the SNESIM reconstruction process is illustrated in
Figure 2.
Applying these optimized configurations and utilizing the 60 × 60 × 60 voxels 3D training image (T60), five digital cores with dimensions ranging from 40 × 40 × 40 to 120 × 120 × 120 voxels were reconstructed. This range was strategically selected to cover three distinct modeling scenarios relative to the TI size: sub-scale reproduction (403), scale-matching baseline (603), and expanded-scale extrapolation (803 to 1203). Specifically, the 1203 scale represents an eight-fold volumetric expansion of the original TI, serving as a rigorous stress test for the algorithm’s extrapolation stability. This setup allows for a systematic quantification of the performance evolution and potential structural decay inherent in the reconstruction process, effectively mimicking practical workflows where representative simulation domains must be extrapolated from compact, high-resolution datasets. By synergizing the search template with a multi-grid strategy, the algorithm’s capacity to reproduce complex topologies is bolstered, providing a robust foundation for evaluating its reliability, structural representativeness, and scaling performance under limited data constraints.
2.3. Quantitative Analysis Method
In order to overcome the one-sidedness of traditional evaluation relying on a single physical property index, this study constructs a multi-dimensional evaluation system including macroscopic statistical characteristics, microstructure characteristics, complex morphological parameters and physical transport properties. The specific evaluation parameters include porosity, specific surface area, pore radius distribution, coordination number, spatial fractal dimension, surface fractal dimension, permeability and variogram.
2.3.1. Macro Statistical Parameter Calculation
Porosity is the core macroscopic parameter to characterize the volume ratio of pore space in porous media, which directly determines the reservoir capacity of rocks. In the evaluation of the reconstruction quality of three-dimensional core, whether the reconstruction model can accurately reproduce the porosity of the training image is the primary index to judge the effectiveness of the random reconstruction algorithm.
The specific surface area is an important parameter to characterize the interaction between fluid and solid in porous media, which represents the ratio of the total area of the pore–skeleton interface to the corresponding volume. The specific surface area is easily affected by the change in pore space. Whether the algorithm can maintain the stability of the specific surface area during the reconstruction process directly reflects its ability to capture and reproduce the topological connectivity of the original pore space. The specific surface area calculation formula is
is the total area of pore–skeleton interface; is the total volume of the core.
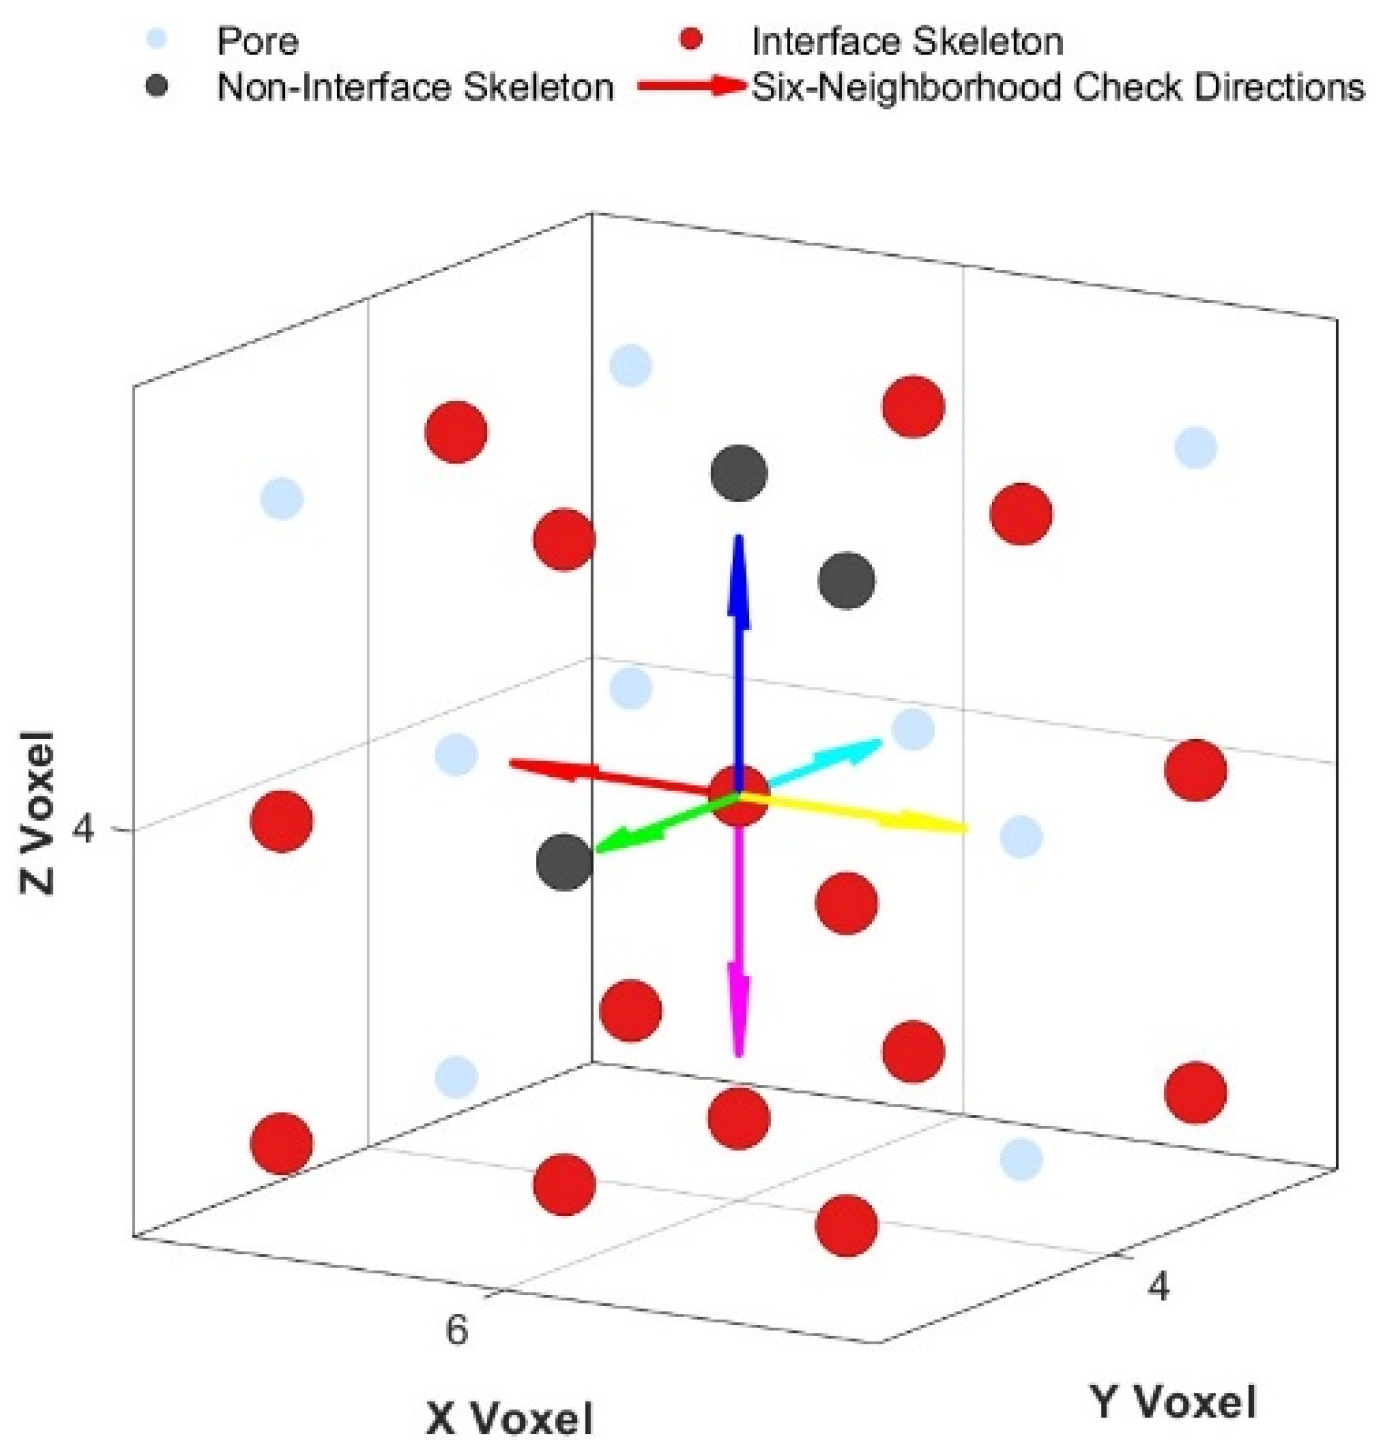
The voxel neighborhood detection method is widely used because it is directly based on the discrete voxel grid and has high computational efficiency and clear physical meaning.
Figure 3 is a schematic diagram of the six-neighborhood method. The total surface area is estimated by systematically detecting the contact interface between each solid skeleton voxel and the pore voxel in the orthogonal neighborhood direction, thereby obtaining the specific surface area and providing accurate interface characteristic parameters for the subsequent multi-dimensional evaluation system.
is the indicator function (1 when satisfied, otherwise 0); is the area of a single voxel.
2.3.2. Microstructural Topological Characterization
Pore radius and its distribution frequency are the key parameters to characterize the microstructure characteristics of porous media, which quantitatively describe the size of pore space and directly affect the storage capacity and migration efficiency of fluid [
42,
43].
In this study, a combination of distance transform and watershed segmentation is used. The Euclidean distance from each pore voxel to the nearest skeleton voxel is calculated by distance transform [
44].
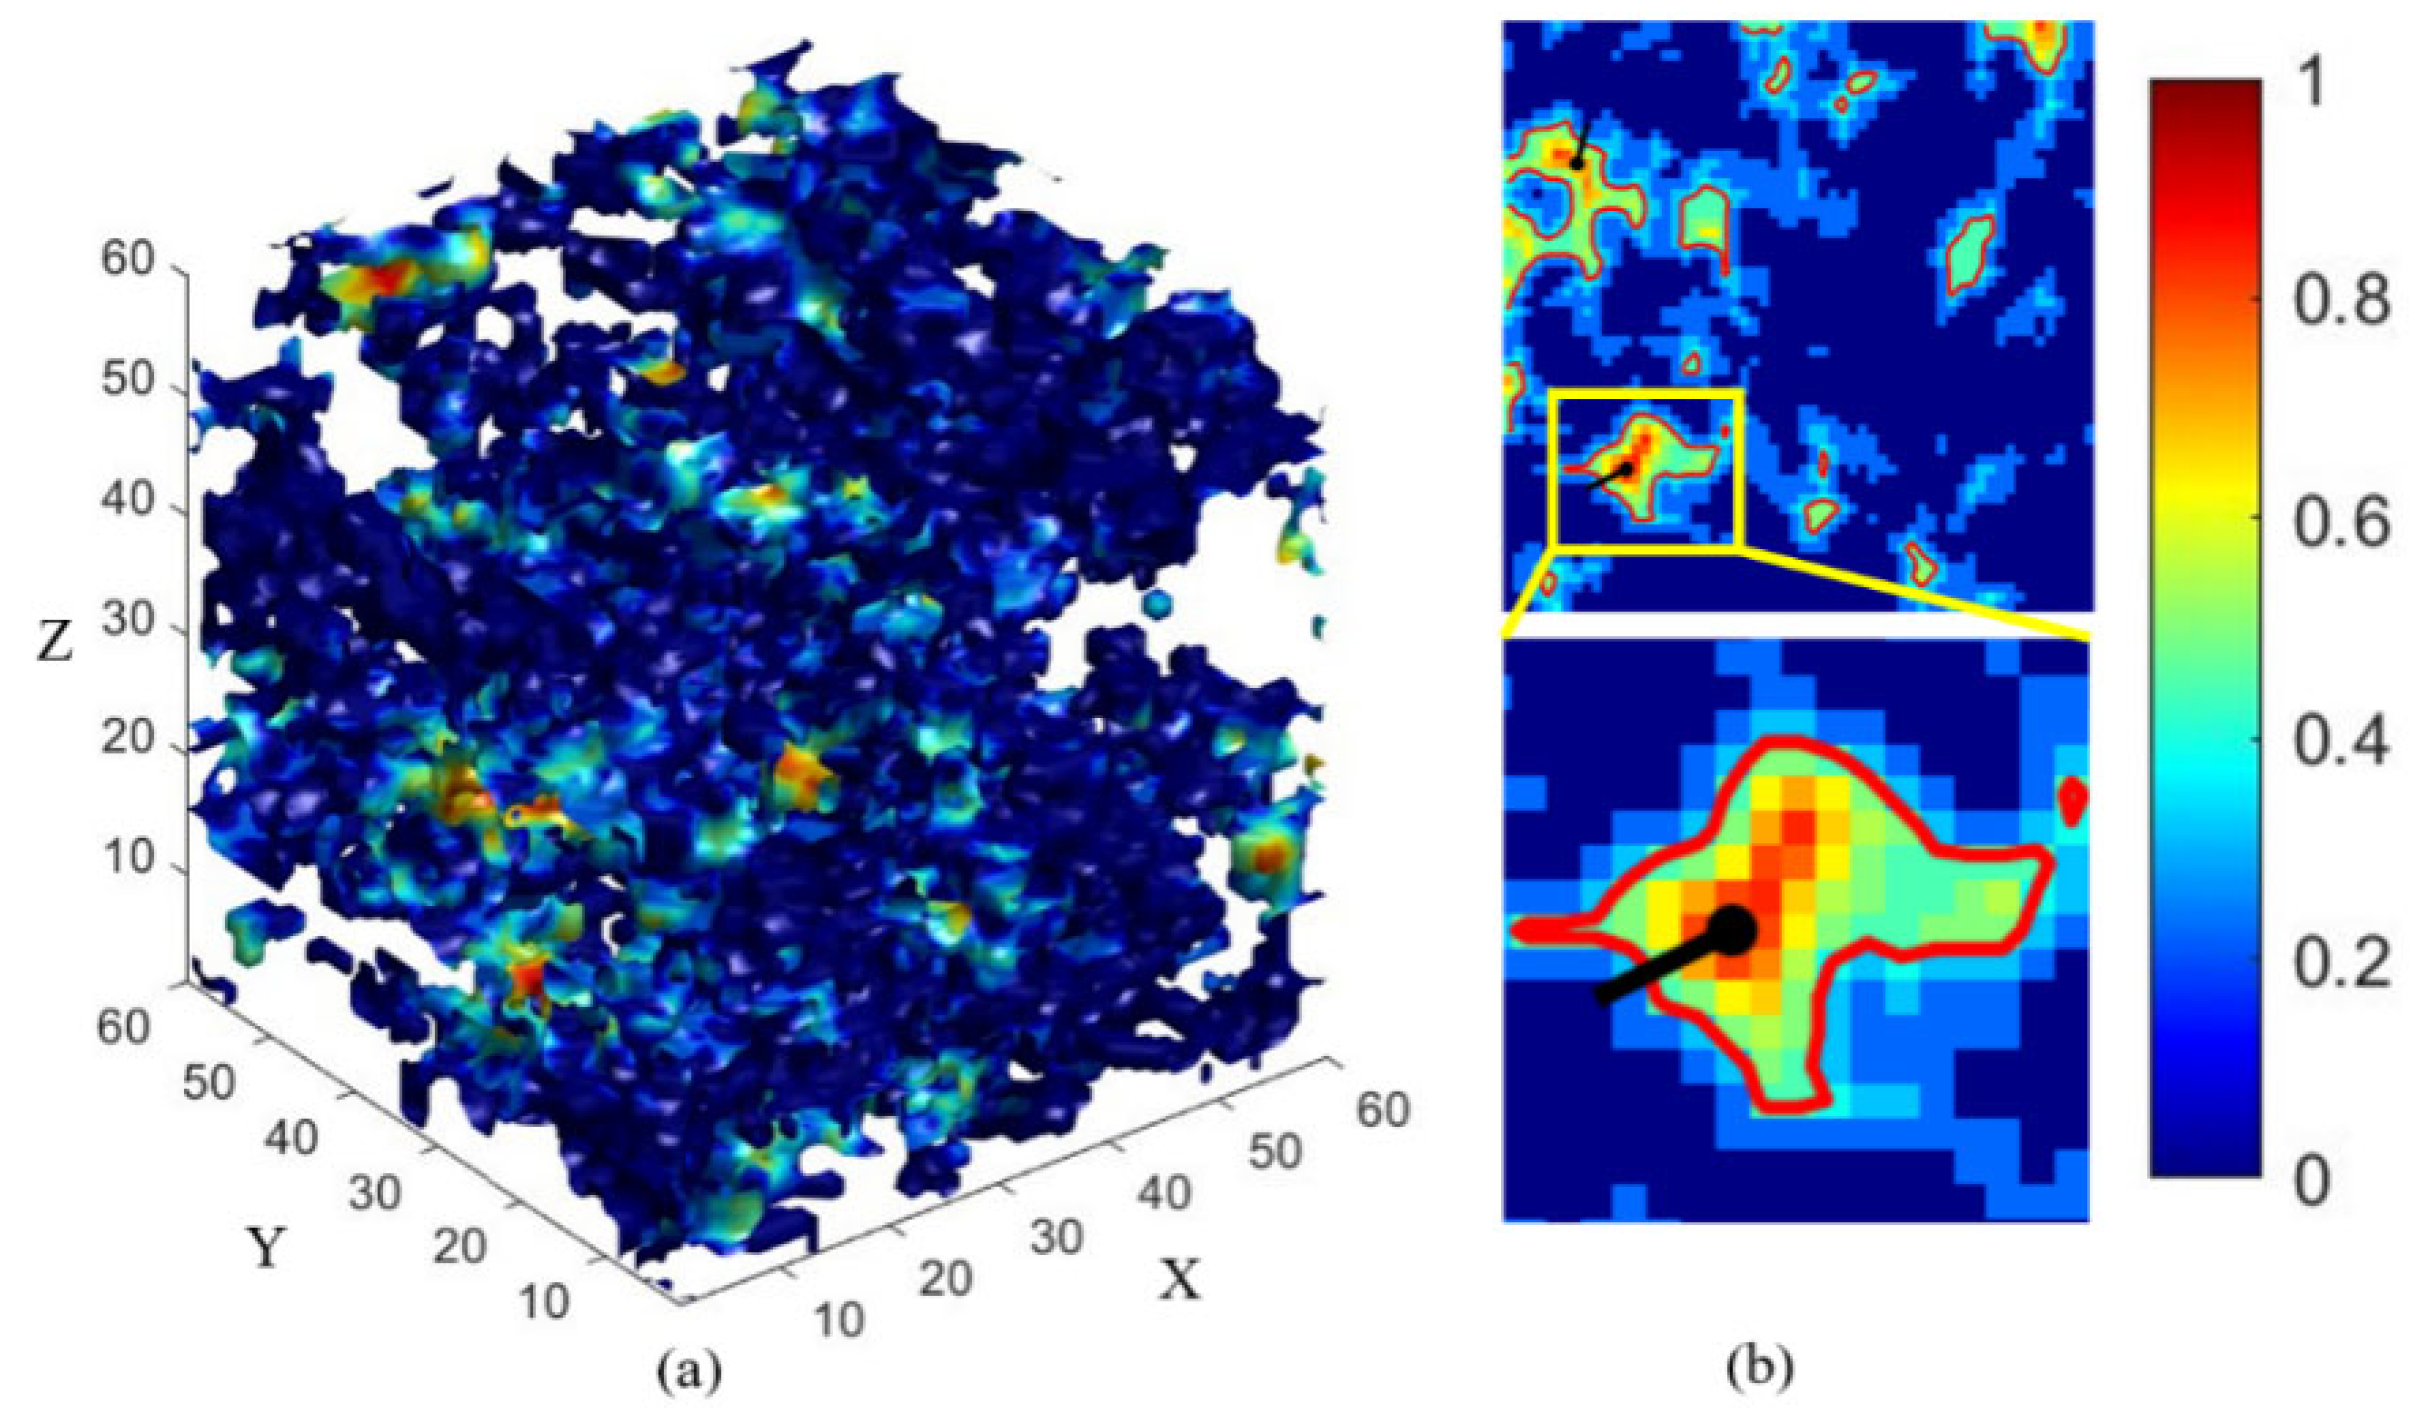
Figure 4 is the result of T60 distance transform of training image.
Figure 4b shows the distance transformation slice results of the digital core in the XY plane. The color gradient represents the Euclidean distance from the pore voxel to the nearest skeleton voxel. The brighter the color, the farther away from the solid surface. The black vertical line connects the pore center with the nearest skeleton voxel, and the red closure curve is the contour line of the distance transformation, which intuitively shows the spatial contour and distance gradient distribution characteristics of the pores.
The watershed algorithm is based on the topological features of the distance transform.
Figure 5 illustrates the result of the watershed segmentation of the training image, where distinct colors are assigned to individual, discrete pore bodies to visualize the segmentation effect. Each unique color represents a separate pore space that has been successfully identified and isolated from the continuous pore network. This labeling process allows for the accurate identification and subsequent quantification of individual pores within the 3D digital core, such as calculating the local maximum inscribed sphere radius for each segmented pore.
The coordination number is the core parameter to characterize the microscopic network topology of porous media, which affects the flow path distribution of fluid in rock and is the key link between microstructure and macroscopic seepage characteristics [
45].
The conventional calculation method of coordination number is divided into geometric analysis method and physical simulation method. Geometric analysis method judges connectivity by extracting the geometric center of pores and analyzing their spatial distribution characteristics. The advantage is that it has high computational efficiency and is suitable for large-scale three-dimensional data. The physical simulation method identifies the pore–throat structure by simulating the fluid displacement process. Although the physical meaning is clearer, it usually has higher computational complexity and greater resource consumption. In this paper, the distance threshold method in the geometric analysis method is used to calculate, and it is improved to improve the accuracy and efficiency of the calculation. The calculation process is as follows:
Read the three-dimensional core matrix data.
Identify single pore regions using distance transform and watershed segmentation.
Calculate the physical coordinates of the geometric center of each pore region.
Construct a KD-tree spatial index to enable efficient neighborhood retrieval.
Determine the adaptive distance threshold by counting the pores and measuring their distances.
Construct the adjacency matrix based on this threshold and count the coordination number for each pore.
This method improves the disadvantages of the traditional distance threshold method by referring to the adaptive threshold and can stably and efficiently quantify the microscopic connectivity structure of core models of different sizes, which provides a reliable quantitative basis for systematically evaluating the reconstruction accuracy of SNESIM algorithm at multiple scales.
2.3.3. Complex Morphological Parameter Quantification
Spatial fractal dimension is a key parameter to quantify the self-similarity and scale invariance of complex and irregular pore–space structure. The higher the spatial fractal dimension is, the more complex the pore structure is. The surface fractal dimension is a key index to quantify the complexity, roughness and self-similarity of the pore–skeleton interface, and its value is between 2 and 3. The higher the surface fractal dimension is, the more complex and rough the interface between the pore and the rock skeleton is, the larger the specific surface area is, and the more complex the fluid migration path is.
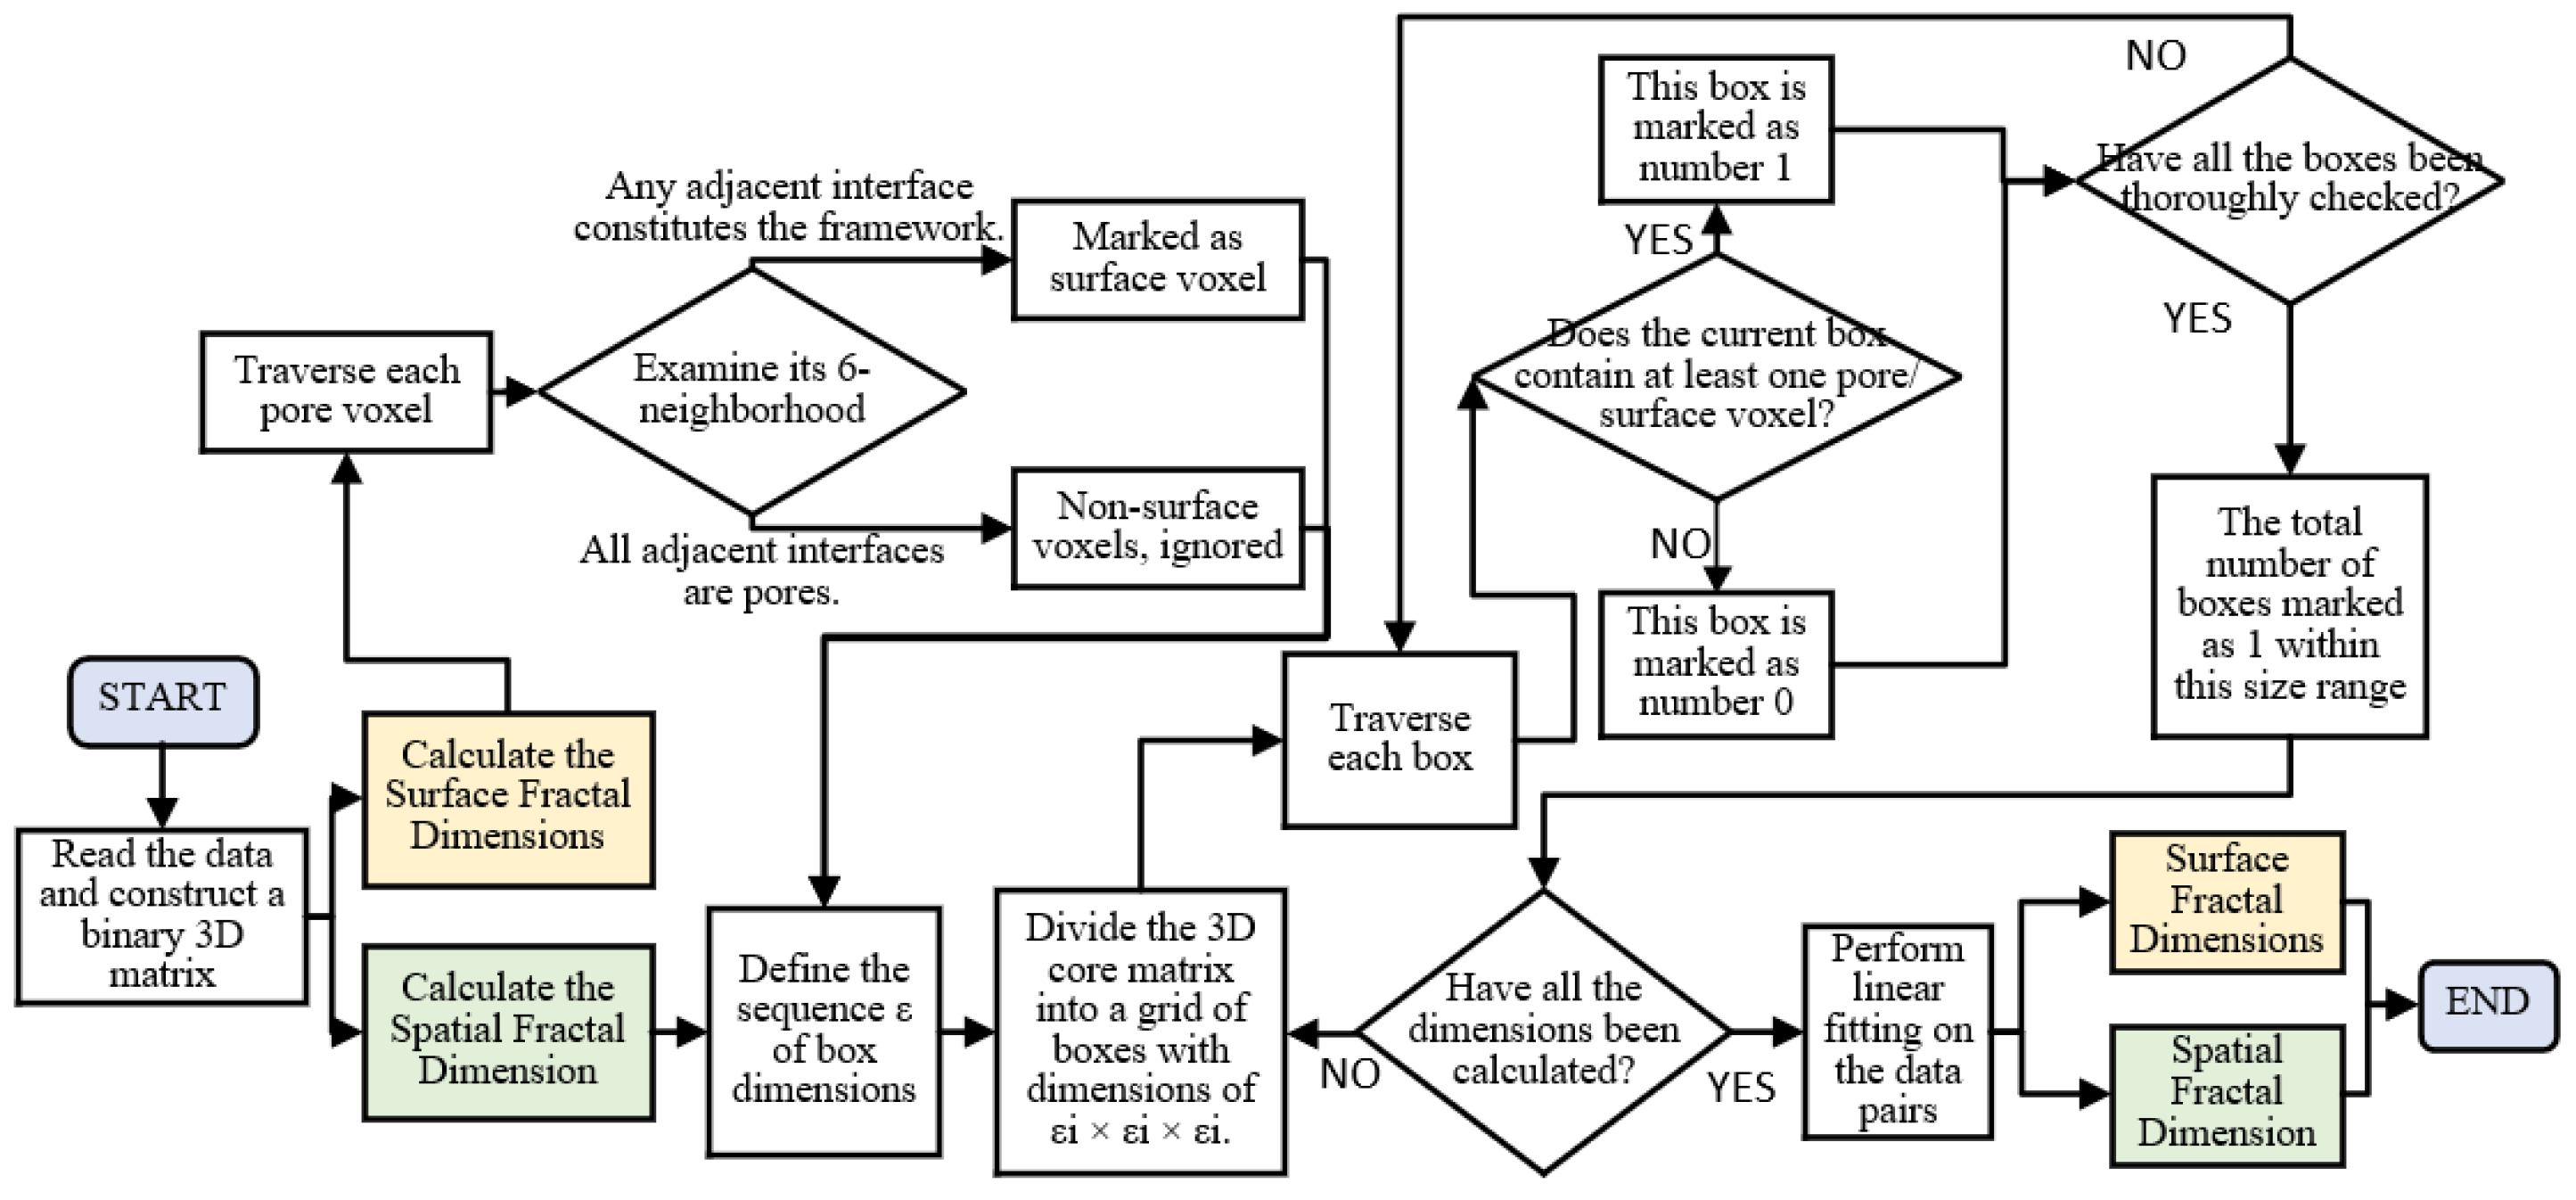
The traditional macroscopic parameters can only reflect the overall statistical average, while the fractal dimension can keenly capture whether the pore structure and interface characteristics maintain the self-similar pattern consistent with the training image at different scales. Fractal dimension is an important bridge connecting microstructure and macro function from morphological dimension, and it is a key index to evaluate the advantages and disadvantages of reconstruction algorithm systematically. The calculation principle of spatial fractal dimension and surface fractal dimension is shown in
Figure 6.
The fractal dimension of this study is calculated by box counting method, based on the following power law relationship:
is the size of the box; is the minimum number of boxes of size required to cover all pore space; and is the fractal dimension.
Taking natural pairs on both sides of the above equation, a linear relationship is obtained:
is a constant, so the fractal dimension D can be obtained by calculating a series of different box sizes and their corresponding , and then performing linear regression () under the double logarithmic coordinates to . The absolute value of the slope k of the regression line is the fractal dimension D.
2.3.4. Seepage and Spatial Statistical Parameter Evaluation
The absolute permeability tensor K was calculated by directly solving the steady-state Stokes equations at the pore scale using a custom finite element method (FEM) solver implemented in MATLAB R2024a. This voxel-based solver treats solid voxels as regions of infinite resistance, capturing the influence of complex pore geometries more accurately than empirical formulas. Key features include periodic boundary conditions, batch-processed matrix assembly for memory efficiency, and an adaptive strategy utilizing both direct and preconditioned conjugate gradient (PCG) solvers.
Under low Reynolds number conditions (Re ≪ 1), the flow is governed by
where
,
, and
denote the velocity vector(m/s), pressure (Pa), and dynamic viscosity (set to 1 Pa·s), respectively. The macroscopic Darcy velocity
is obtained by volume-averaging the local velocity field
. According to Darcy’s law, K is related to the pressure gradient
by
By applying unit pressure gradients independently in the x, y, and z directions, the full 3 × 3 permeability tensor was determined.
The following assumptions were made: (1) incompressible fluid, (2) Newtonian rheology, (3) steady-state flow, and (4) laminar regime. While real reservoir conditions involve multiphase and non-isothermal complexities, these standard assumptions are justified here for two reasons. First, the primary objective is a comparative methodological evaluation of reconstruction algorithms rather than absolute permeability prediction for specific fields. Relative differences in flow response are more critical for this benchmarking. Second, at the micrometer scale with low applied gradients, Re ≪ 1 ensures the physical validity of the Stokes formulation. Using water as a Newtonian reference fluid provides a consistent baseline for evaluating structural-to-functional equivalence.
As one of the traditional tools to verify the consistency of spatial structure reconstruction in geostatistics, the variogram has important application value in the simulation and evaluation of geological structure. For example, in the study of deep learning reconstruction of porous media, Du et al. evaluated the ability of the model to reproduce the spatial distribution characteristics of shale and sandstone pores by comparing the variogram curves of the reconstructed model and the real samples [
46]. Zhou et al. also clearly pointed out that the variogram function is the core tool for traditional geostatistics to quantify spatial correlation in the study of underground stratigraphic section reconstruction [
47]. In the study of three-dimensional spatial reconstruction of buried peat, De Weerdt et al. also quantified the spatial correlation of peat ratio by fitting the variogram function model in horizontal and vertical directions and provided key spatial structure parameters for interpolation modeling of ordinary Kriging and indicator Kriging [
48]. In view of the basic role of the variogram in quantifying the correlation of spatial variables and verifying the rationality of simulation results, this paper also adds the variogram to the analysis system when evaluating the reconstruction effect of SNESIM algorithm on 3D digital core.
3. Application Example
To ensure the statistical robustness of the evaluation results and eliminate the interference of stochastic uncertainty, ten independent stochastic simulations were performed for each reconstruction scale (from 40 × 40 × 40 to 120 × 120 × 120 voxels) in this section. By comparing the multi-dimensional statistical parameters of the training image with the series of reconstruction results, the performance of the SNESIM algorithm in structural restoration and petrophysical property prediction is systematically evaluated.
Table 1 summarizes the statistical means and standard deviations of the ten stochastic simulation results at each scale. The data indicate that the reconstructed models exhibit extremely high statistical stability across all physical parameters, with standard deviations generally maintained at a low level. Based on the high statistical consistency of the ten simulation results at each scale, and to ensure visual clarity during analysis processes such as 3D visualization, distribution curve plotting, and fractal fitting, the following sections will select a representative realization for each reconstruction scale. This representative realization is chosen because its key physical parameters (e.g., porosity, specific surface area, coordination number) are closest to the statistical means of the ten simulations at that scale. This approach aims to accurately reflect the inherent physical and structural characteristics of the reconstructed models at each scale using the most statistically representative cases.
3.1. Multi-Scale Three-Dimensional Core Models
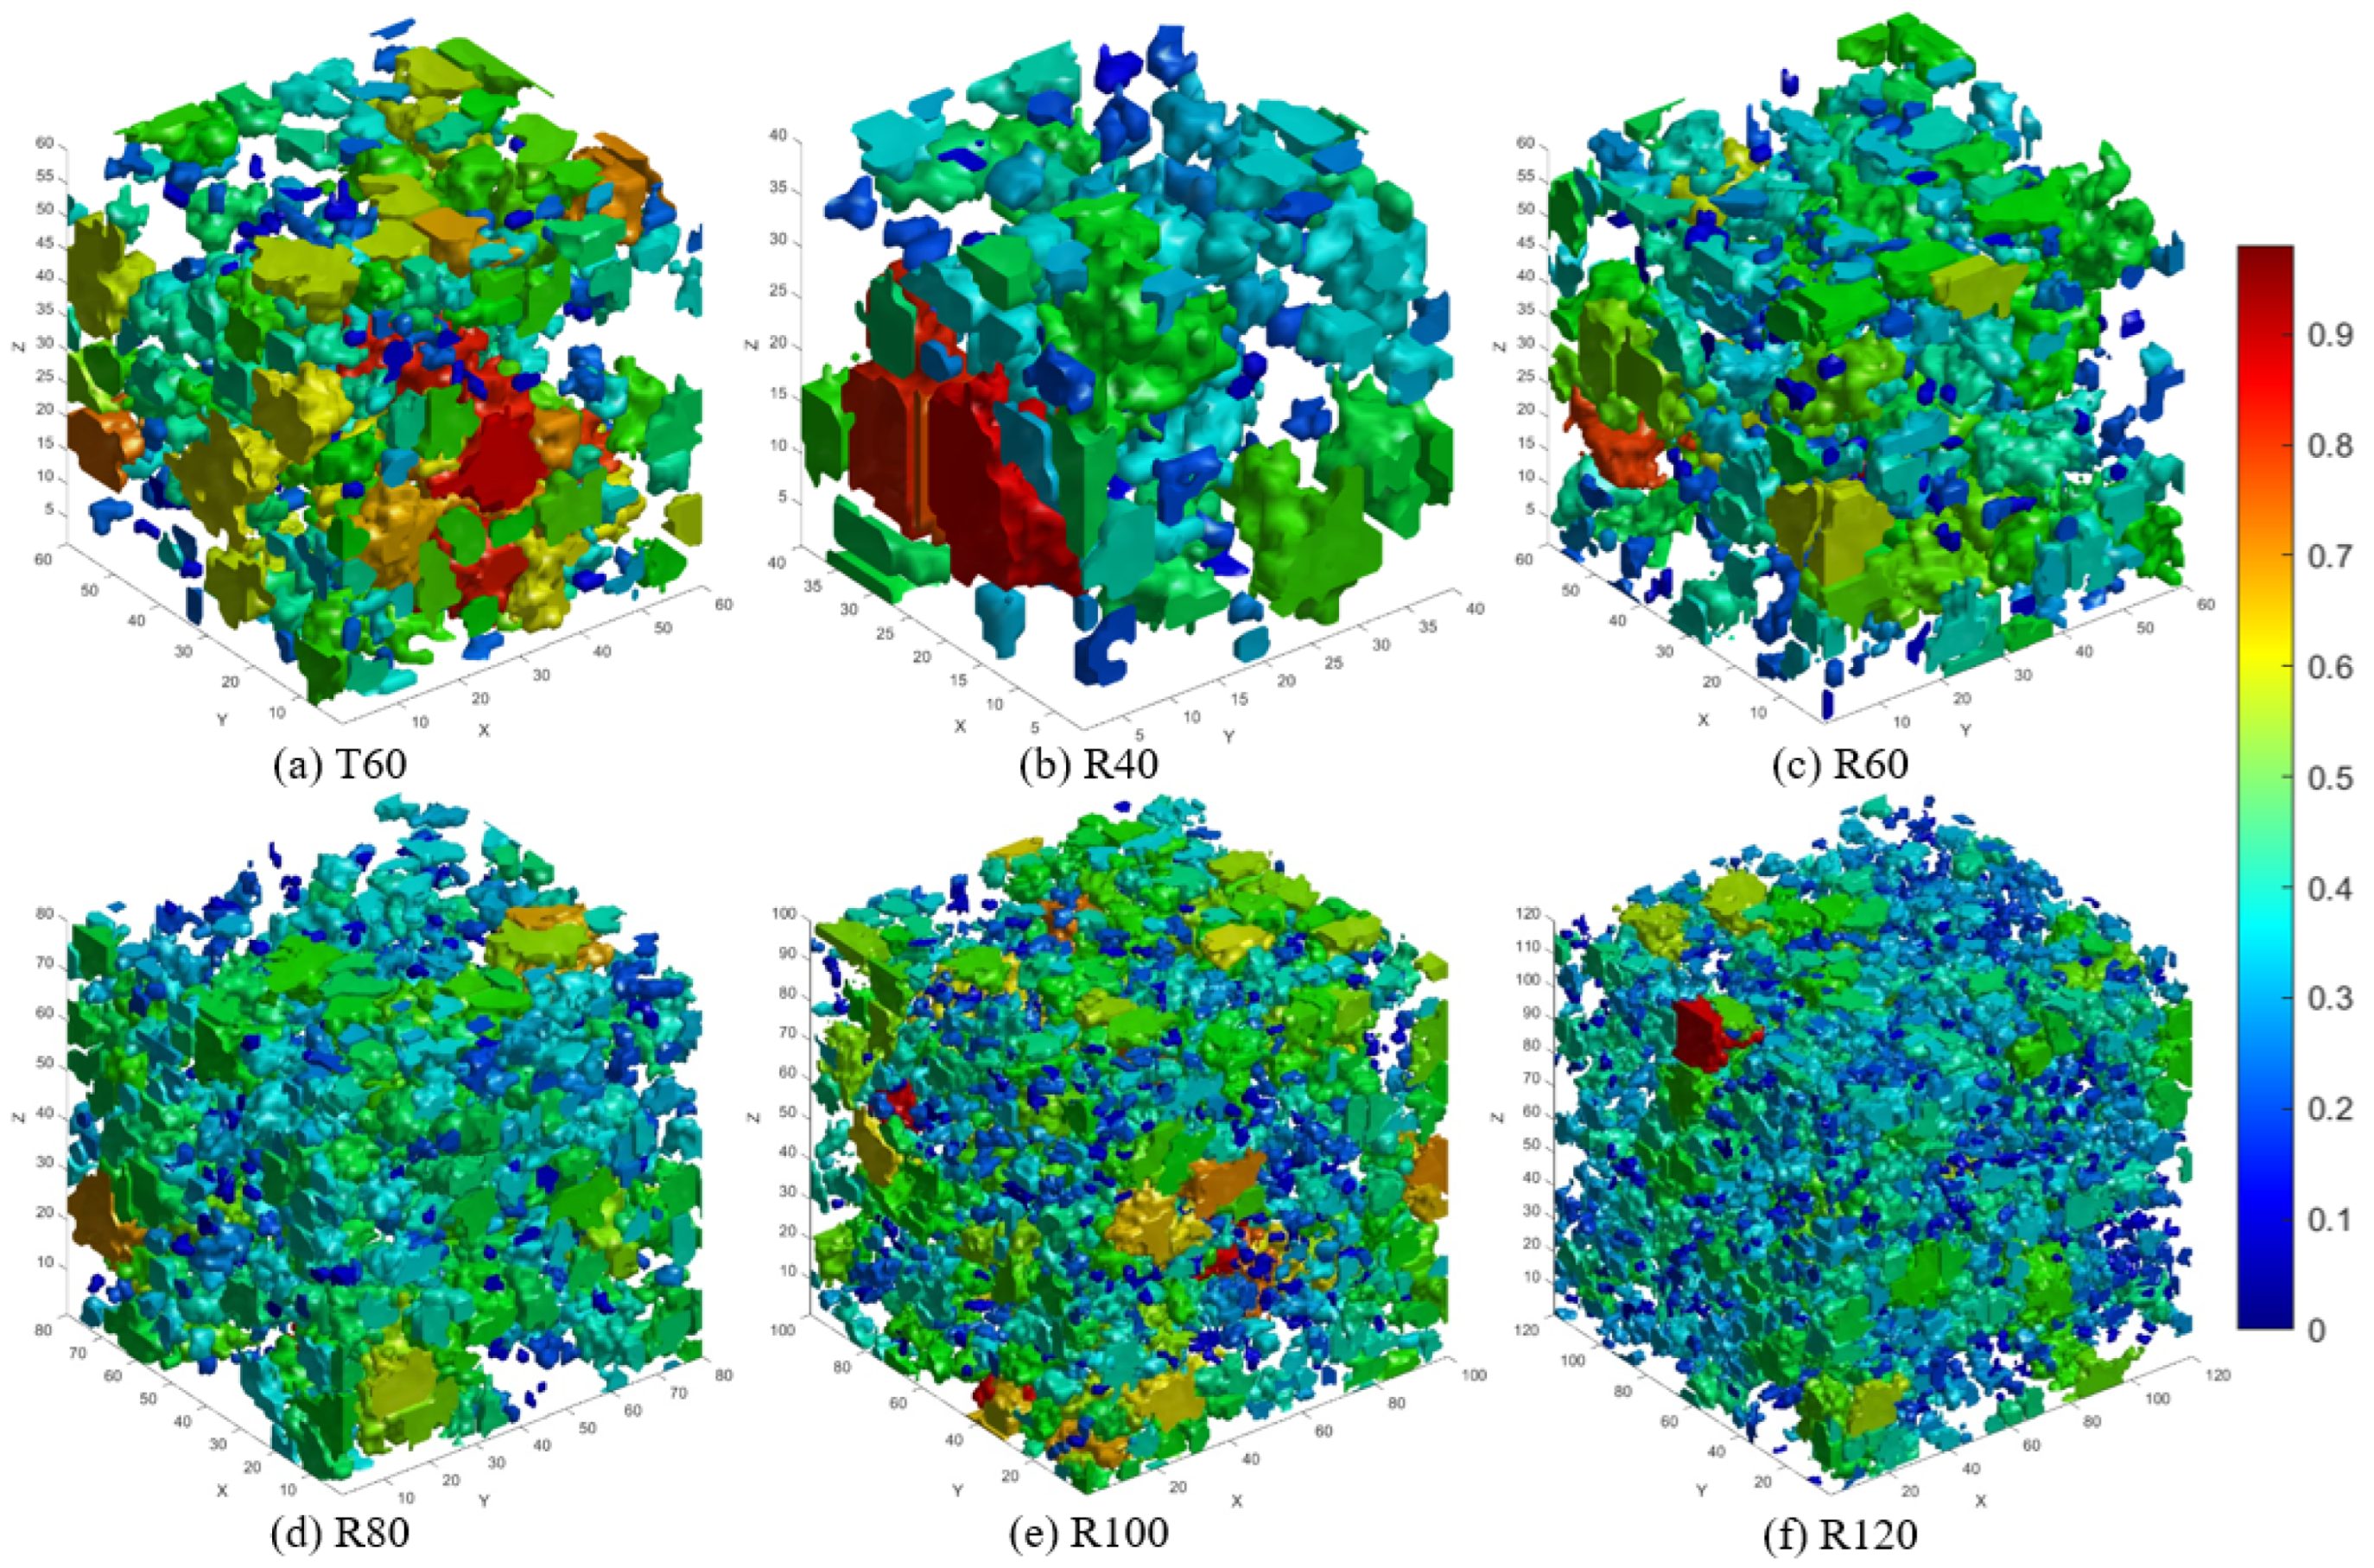
Figure 7a shows the 3D pore structure model with a size of 60 × 60 × 60 voxels (denoted as T60), which serves as the training image for this study. The colored areas represent the rock pore phase, while the rest corresponds to the skeleton phase. Blue represents smaller pores, green represents mesopores, and red represents larger pores.
Figure 7b–f presents the representative 3D models of different scales reconstructed by the SNESIM algorithm. Visual observation indicates that as the reconstruction scale expands, the models successfully maintain the visual characteristics and pore distribution patterns of the training image.
3.2. Analysis of Macro Statistical Properties
Macroscopic statistical parameters are the fundamental indicators for evaluating the quality of core reconstruction in the multi-dimensional evaluation system of this study. Porosity and specific surface area directly reflect the overall reservoir capacity of the core and the size of the fluid contact interface.
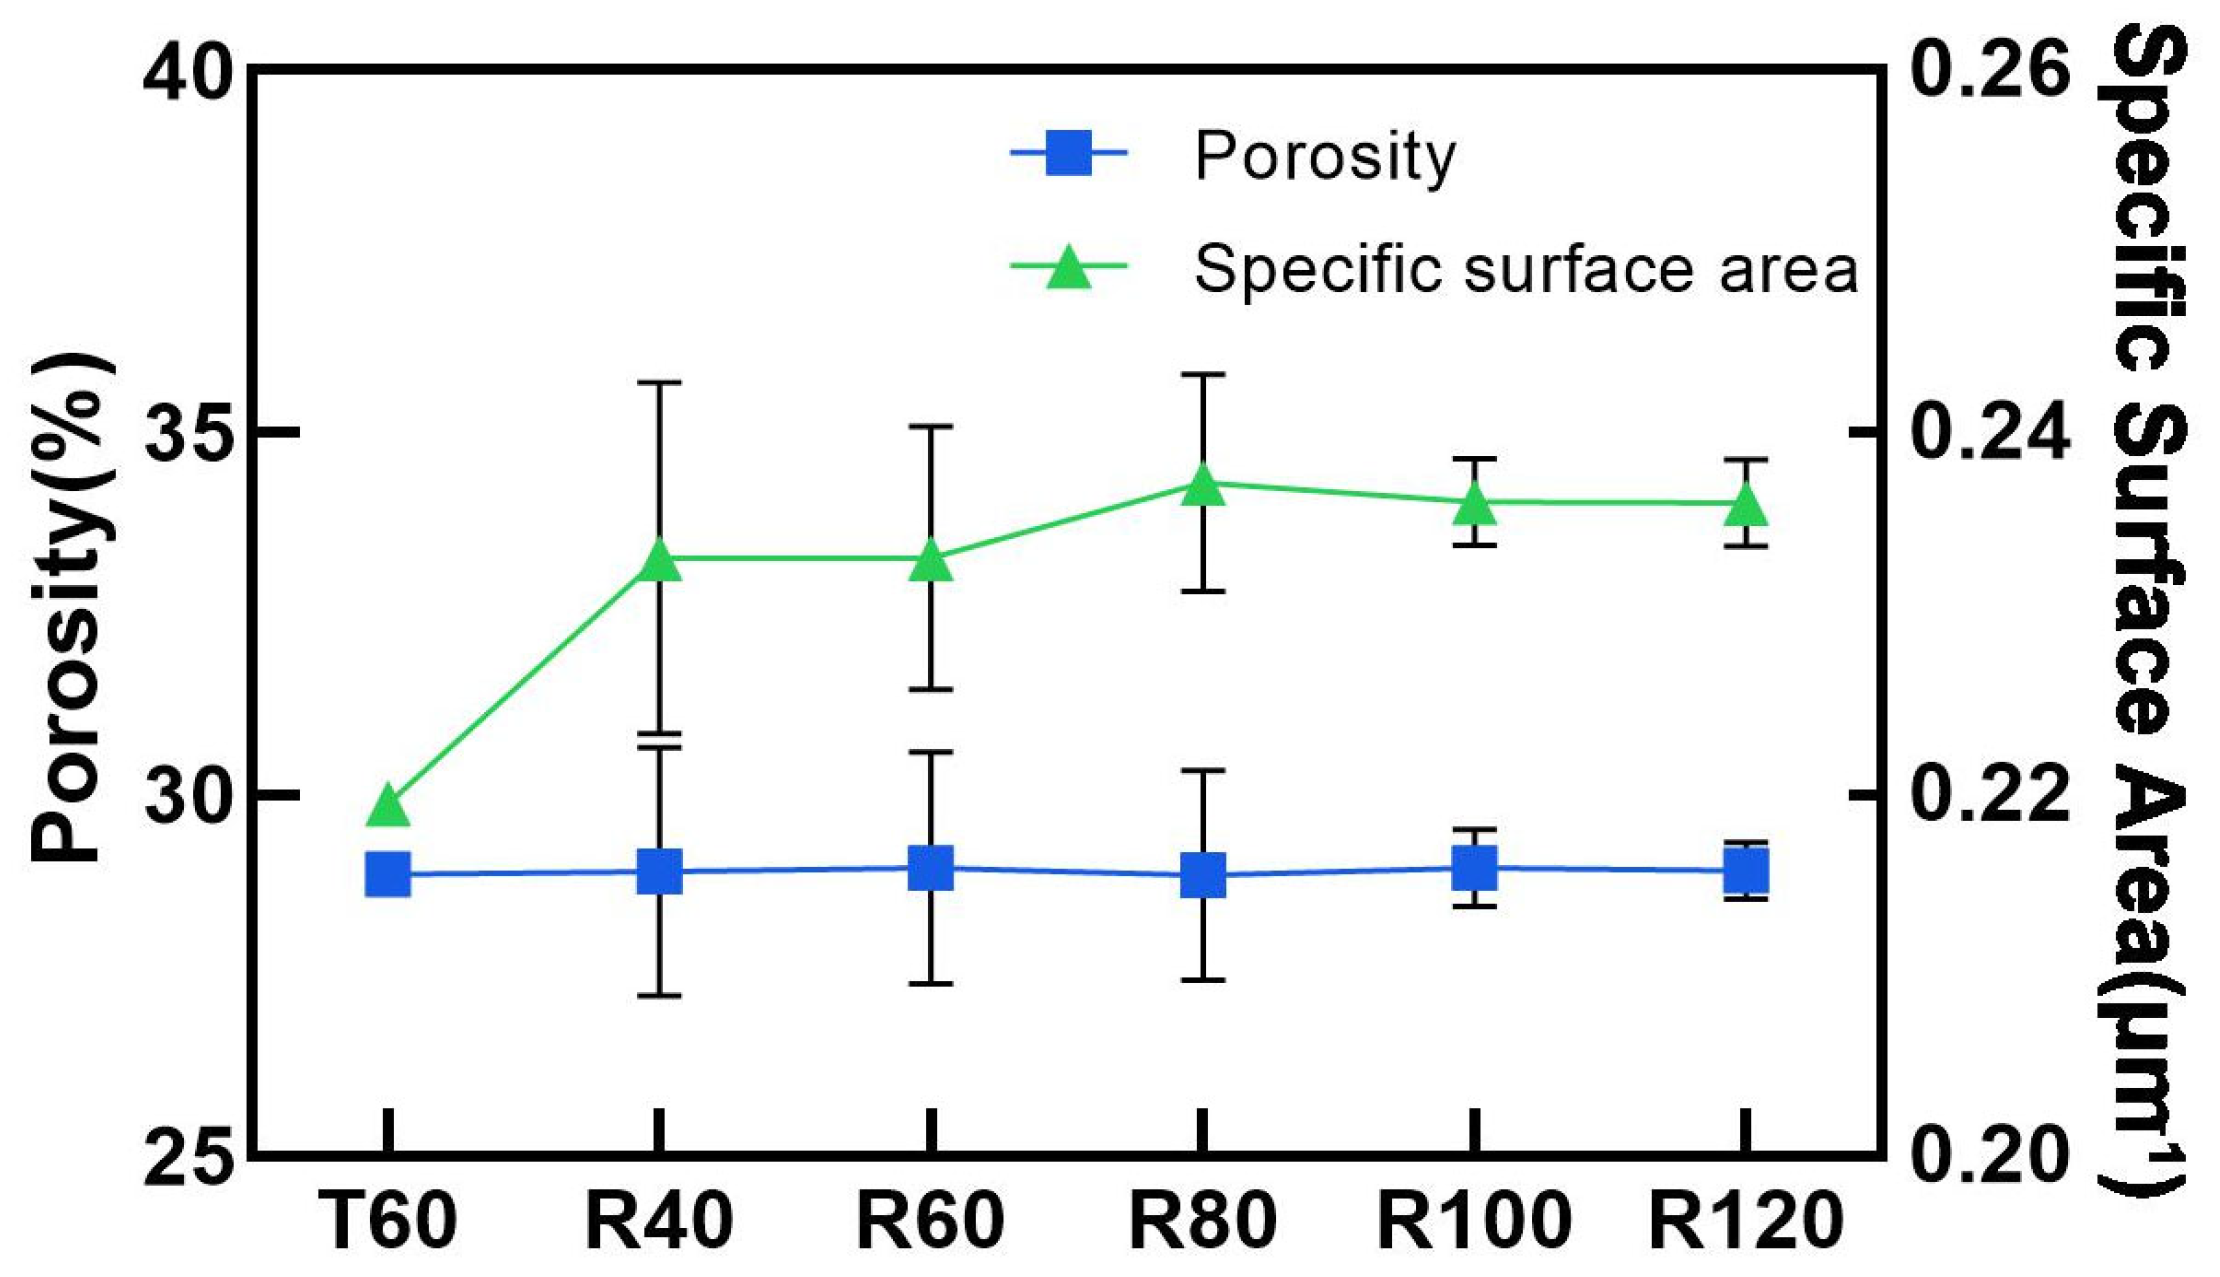
Figure 8 shows the specific surface area (SSA) and porosity of different samples, where the scatter points represent the mean values of ten simulations, and the error bars denote the standard deviations.
The algorithm demonstrates excellent stability in maintaining the overall pore volume of the rock. The total porosity of the training image is 28.90%, while the average total porosity of all reconstructed samples ranges from 28.88% to 28.98%, with a maximum absolute error of less than 0.1%. More importantly, the 95% confidence interval for the total porosity of the large-scale sample (R120) is (28.60%, 29.37%), with an interval width of only 0.77%. This indicates that the algorithm possesses high estimation accuracy and reliability in restoring pore volume at this scale.
However, the analysis of specific surface area reveals a systematic deviation in the algorithm. The mean specific surface areas of all reconstructed samples are significantly higher than the reference value of the training image (0.21 μm−1). For instance, the average specific surface area of the R120 sample reaches 0.23 μm−1, an increase of 7.5% compared to the training image, and its confidence interval (0.23, 0.23 μm−1) does not overlap with the training image value, indicating that this deviation is statistically significant. This suggests that the algorithm consistently increases the pore–grain matrix interface area during the reconstruction process. Combined with the underlying principles of the SNESIM algorithm, this deviation likely originates from the algorithm’s inherent pattern stitching process. SNESIM constructs models by matching and pasting data events from the training image. At the pore–matrix boundaries, the stitching of pattern fragments from different sources may produce unnatural, high-frequency seam marks. Statistically, this is equivalent to introducing additional surface ruggedness, thereby leading to a systematic overestimation of the specific surface area. This mechanism is related to the “conditional simulation noise” or boundary over-complication phenomena commonly observed in multiple-point geostatistical simulations.
3.3. Analysis of Microstructural Topological Characteristics
Topological parameters of the microstructure are key to deeply understanding the characteristics and connectivity of the pore–space structure in the multi-dimensional evaluation system. These primarily include pore radius distribution and coordination number. Together, these parameters describe the morphology and size distribution of the internal pores within the core, serving as the crucial link connecting macroscopic reservoir performance to the microstructure.
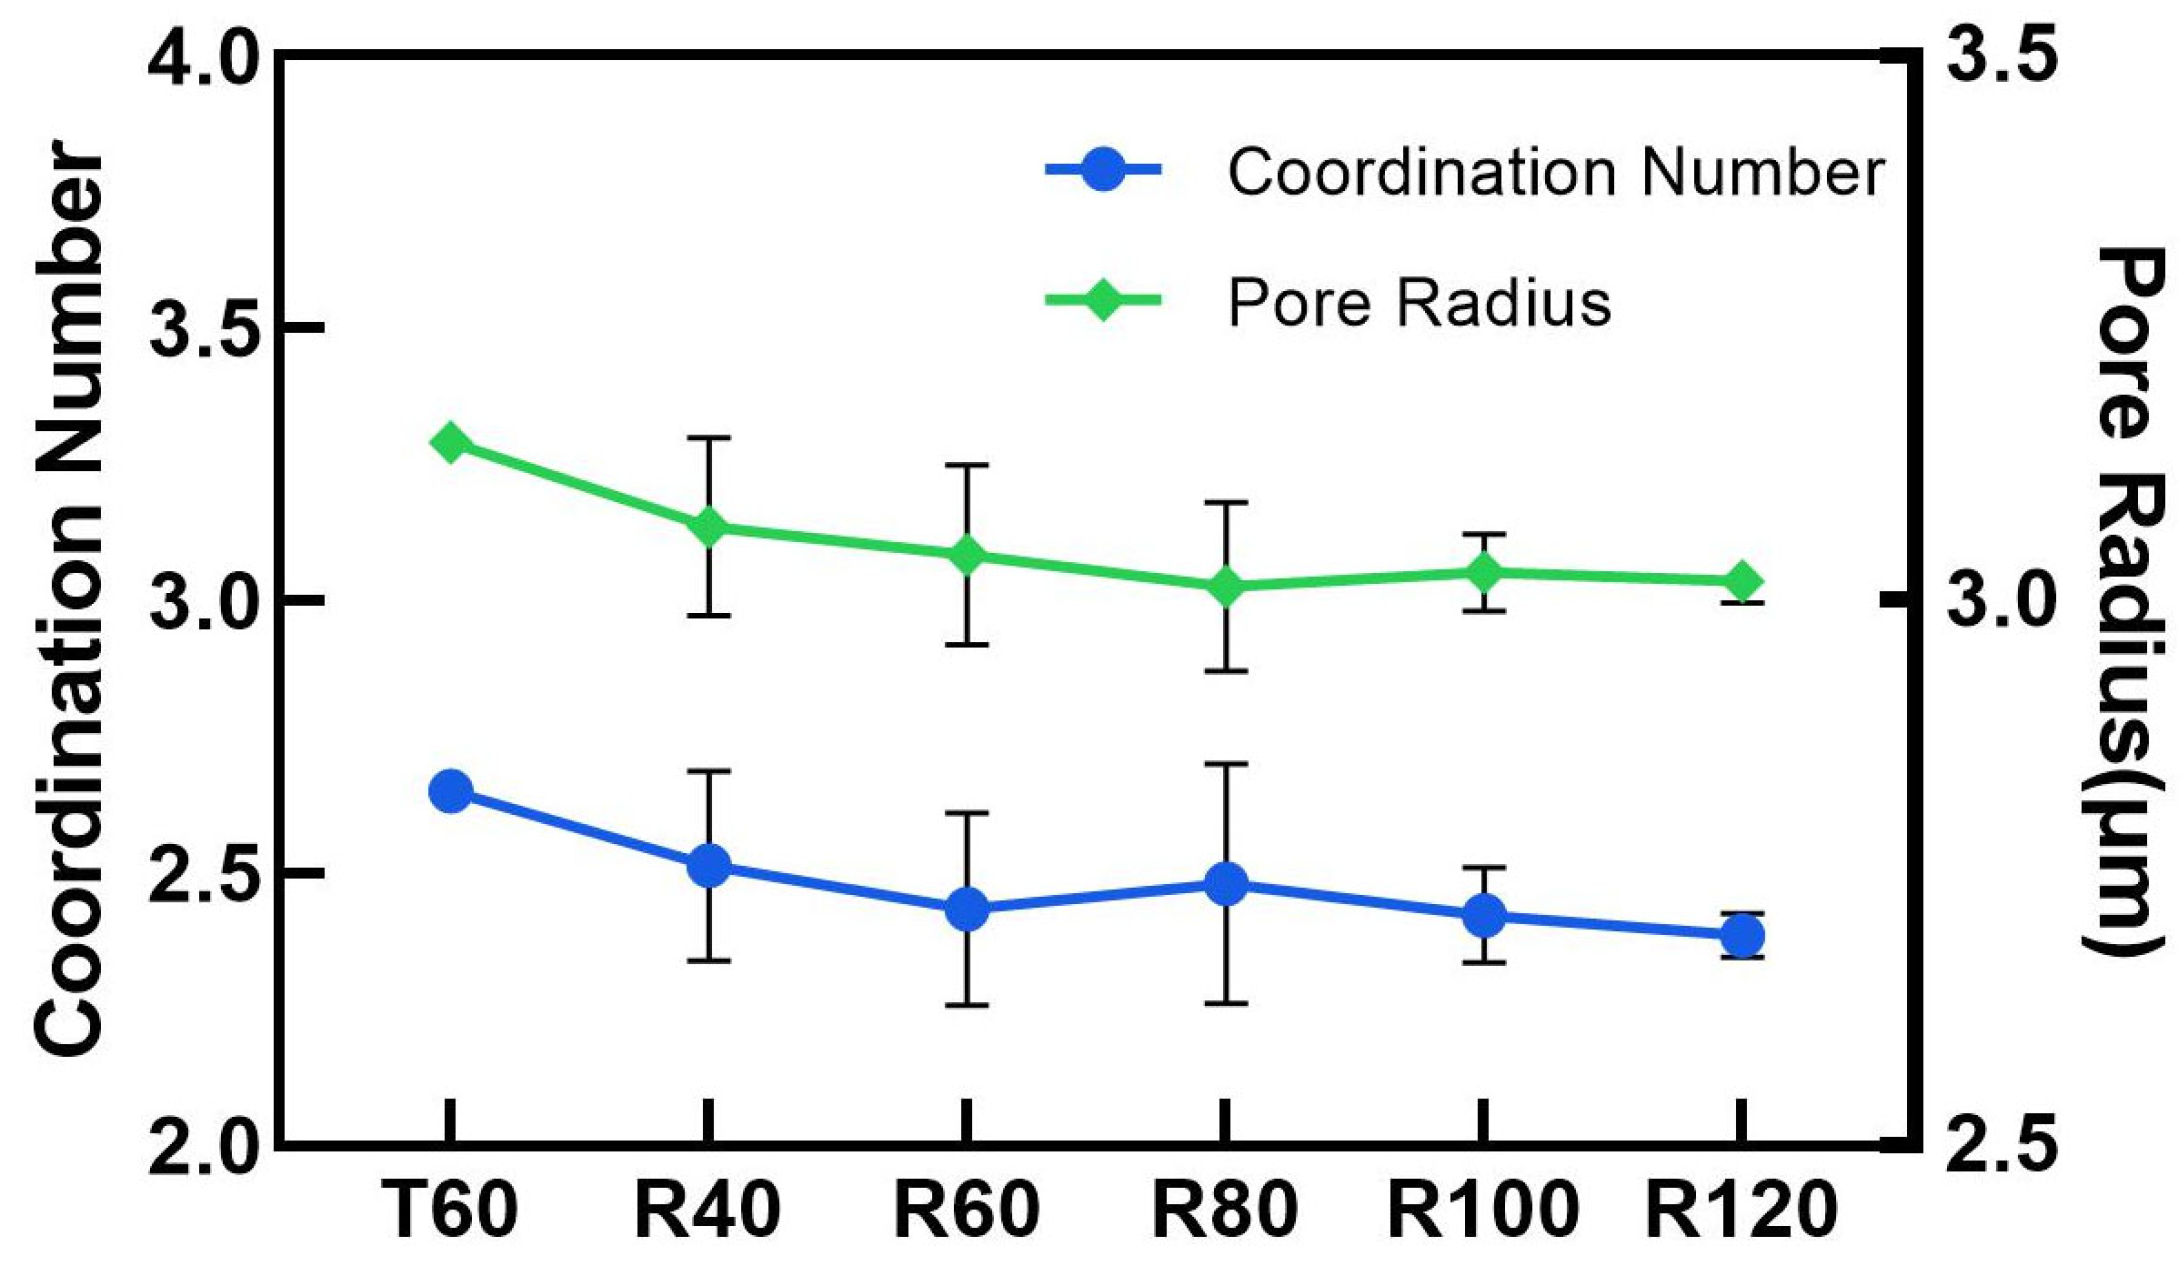
Figure 9 illustrates the evolutionary trends of the average coordination number and average pore radius.
The average coordination number is systematically lower than that of the training image across all reconstructed samples. For example, the average coordination number of the R40 sample is 2.51, and the upper limit of its 95% confidence interval (2.39, 2.64) is still lower than the mean value of the training image (2.65). This directly indicates that the connectivity of the 3D pore network reconstructed by the algorithm is weakened; the number of throat connections between pores is reduced, and the pore–throat network topology is significantly simplified. Conversely, the average pore radius across samples of different scales is highly consistent with the training image. This demonstrates that the algorithm accurately restores the size distribution of the pore bodies, and its deficiencies are mainly concentrated in the topological structure that controls the connectivity between pores.
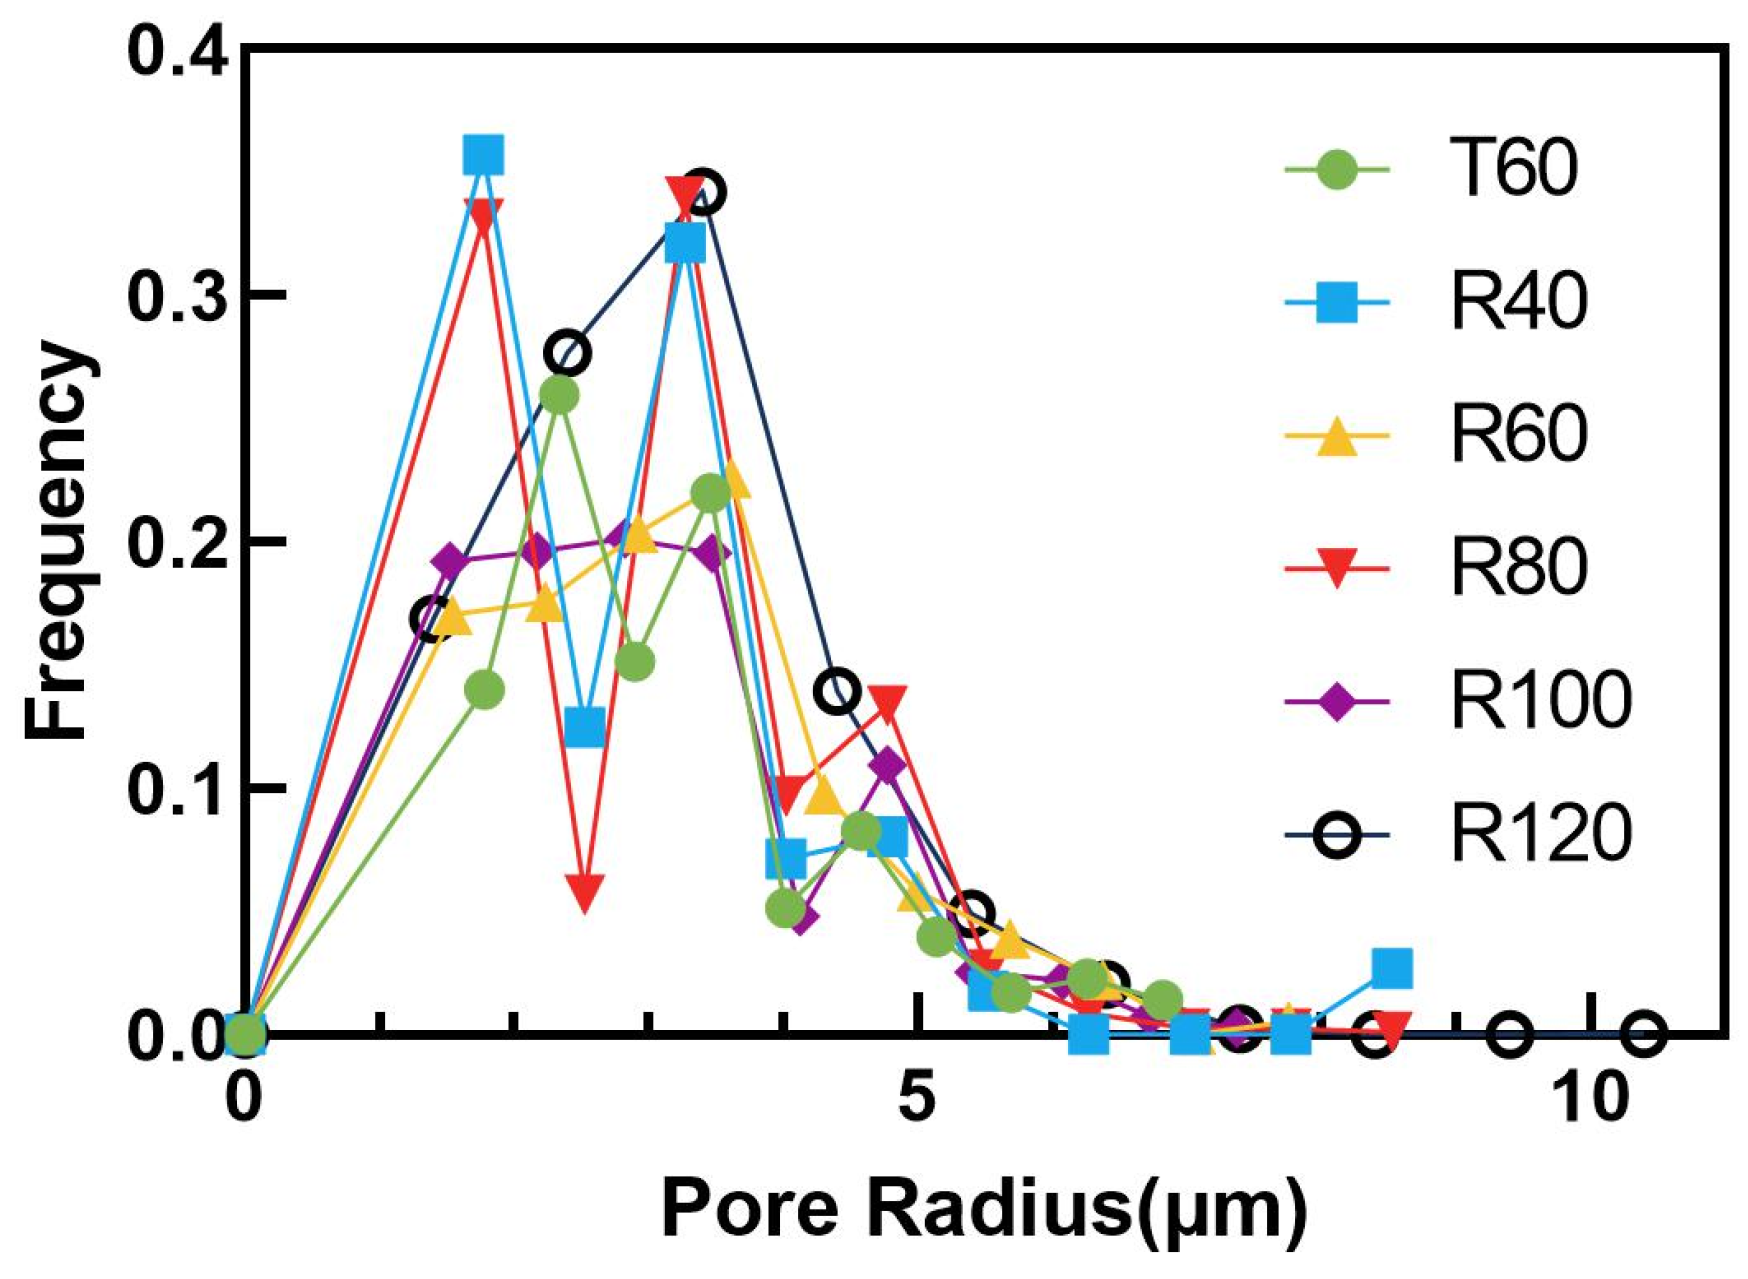
Figure 10 presents the pore radius distribution frequency of a representative realization. Since the results of the ten realizations highly overlap, a typical case was selected to clearly illustrate the trend. The results prove that the algorithm can accurately restore the size distribution of the pore bodies, and its shortcomings are primarily focused on the topological construction of the inter-pore connection relationships.
3.4. Analysis of Complex Morphological Characteristics
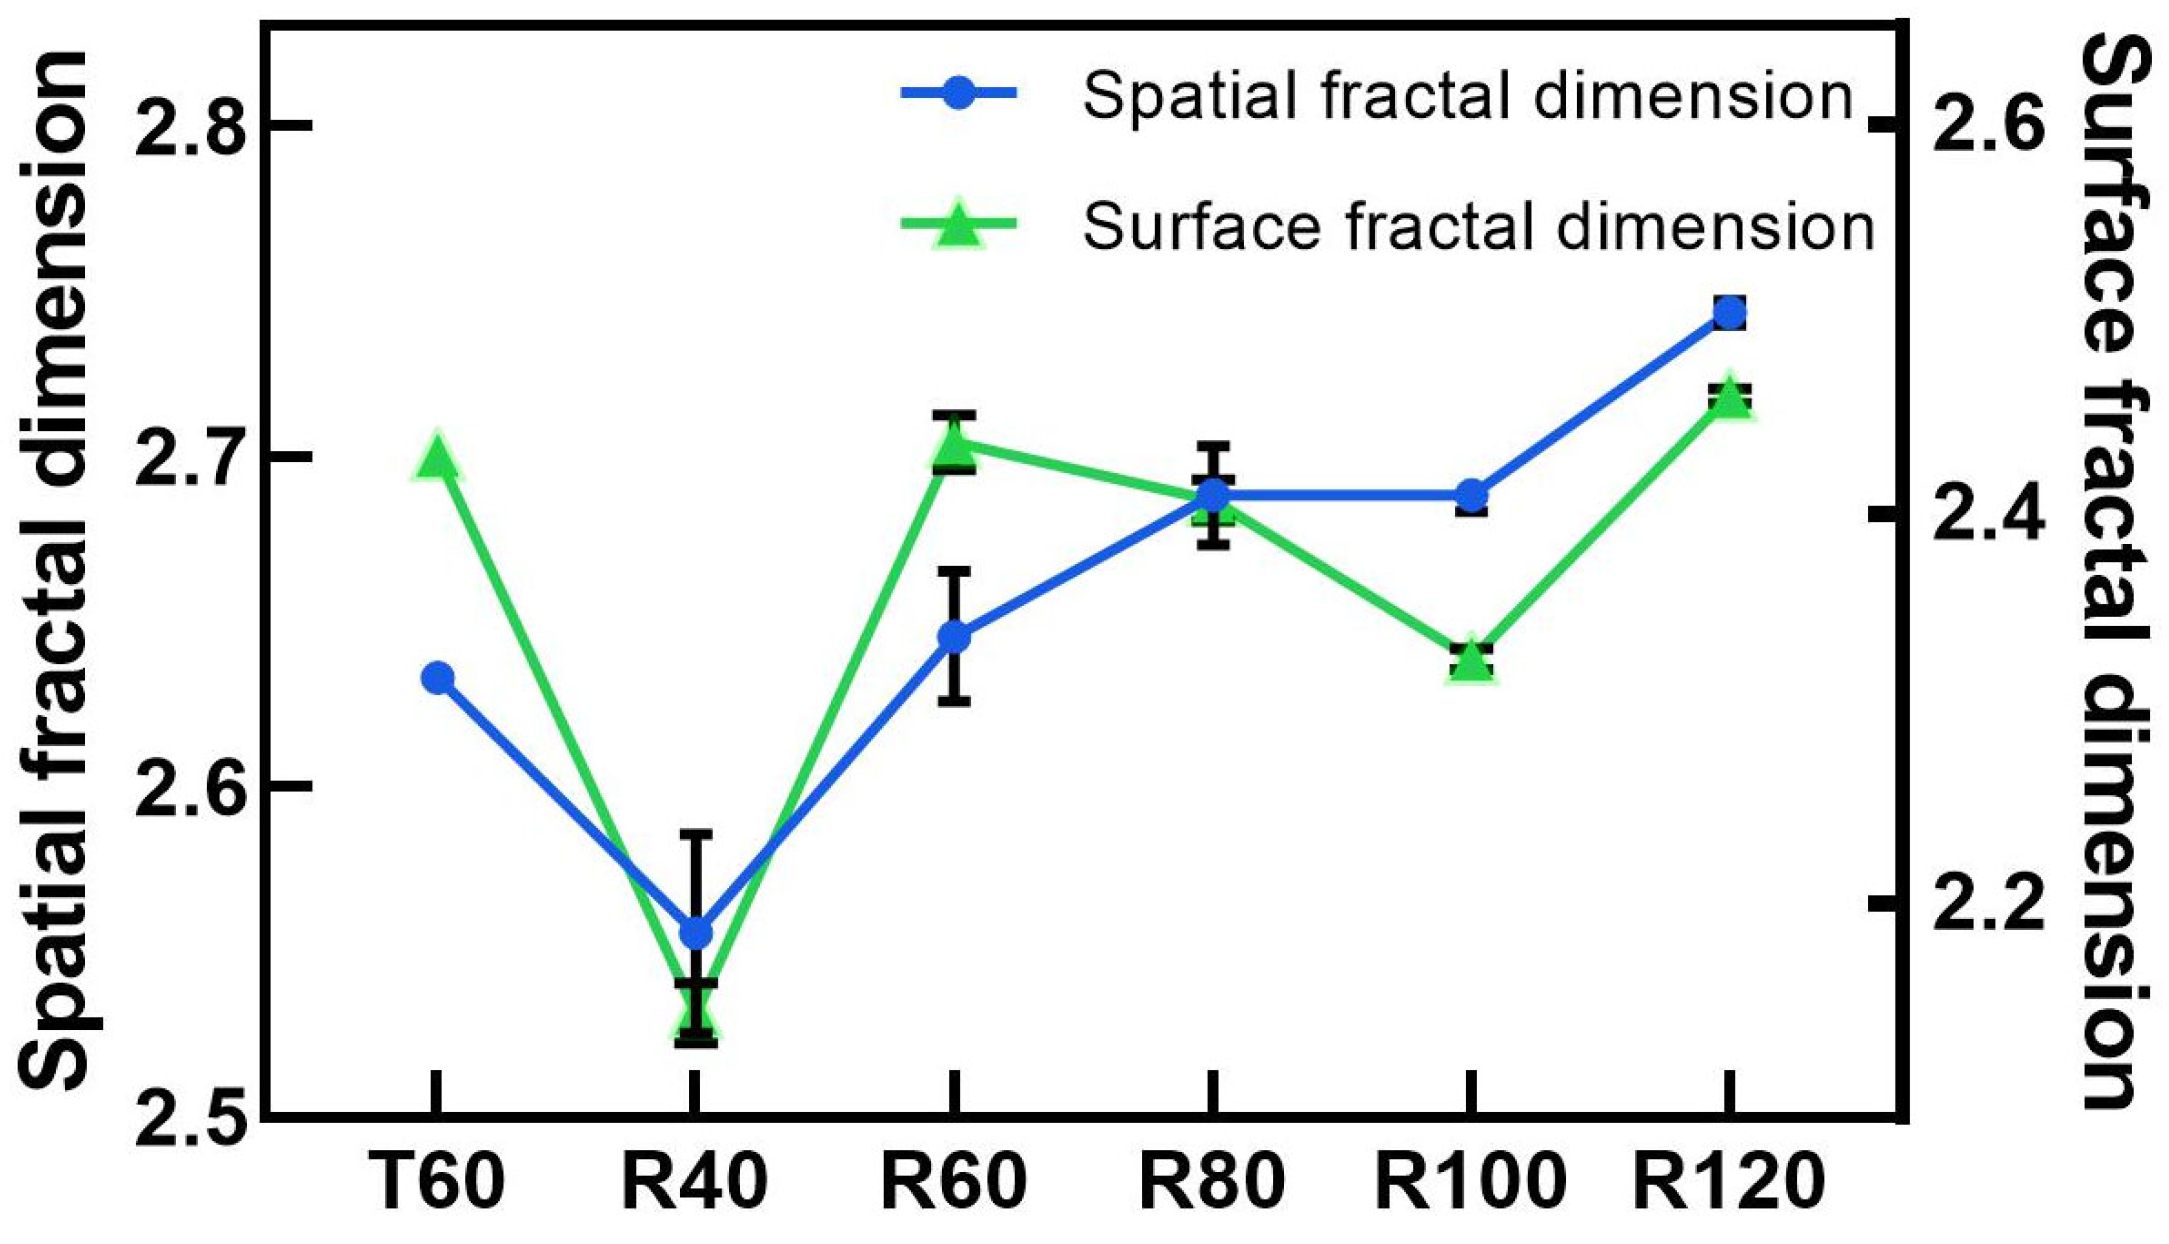
Fractal dimensions can quantify the complexity and self-similarity of pore systems. The variation trends of the spatial fractal dimension and surface fractal dimension are shown in
Figure 11. Their responses to changes in core scale are completely different, revealing the scale-dependent discrepancy in the algorithm’s restoration capabilities for spatial and surface structures.
The spatial fractal dimension exhibits a positive correlation with core size. Its value increases monotonically from 2.56 for R40 to 2.74 for R120, even exceeding the spatial fractal dimension of the training image (2.63). This clear trend indicates that the algorithm’s output is not a random distortion; rather, its ability to restore the geometric complexity of the pore space is systematically enhanced as the model size increases. The R120 sample has the highest spatial fractal dimension, suggesting that at this scale, the pore space reconstructed by the algorithm may statistically exhibit stronger heterogeneity and structural complexity than the training image. This aligns with the fact that larger simulation domains incorporate more spatial structural combinations, leading to statistically higher heterogeneity and geometric complexity in the pore space.
In contrast, the restoration of the surface fractal dimension shows significant scale dependence, revealing the algorithm’s complex behavior when handling the microscopic roughness of pore interfaces. In small-scale core models (e.g., 40 × 40 × 40), the surface fractal dimension is significantly lower than that of the training image, and its 95% confidence interval is completely separated from the training image value. This indicates that the algorithm produces a severe smoothing effect at coarse scales, resulting in the loss of a large amount of microscopic ruggedness information on the pore surfaces. However, as the model size increases, the surface fractal dimension systematically increases. In the largest R120 sample, the surface fractal dimension reaches 2.46 ± 0.003, slightly higher than the training image. This reversal phenomenon implies that with the expansion of model size, the algorithm can not only effectively recover surface complexity, but its reconstruction process may also become overly sensitive to micro-details, leading to a reconstructed surface that is statistically slightly rougher than the original image. This transition from smoothing to over-restoration highlights the sensitivity of the algorithm’s performance to the scale of the input data and also demonstrates that its restoration of surface morphology is not linearly faithful but exhibits different bias characteristics at different scales. The restoration bias of the surface fractal dimension reveals the limitations of the algorithm in processing microscopic geometric details. Since interface roughness is directly related to rock wettability and fluid distribution states, fluctuations in the surface fractal dimension may introduce additional uncertainty into subsequent multiphase flow simulations.
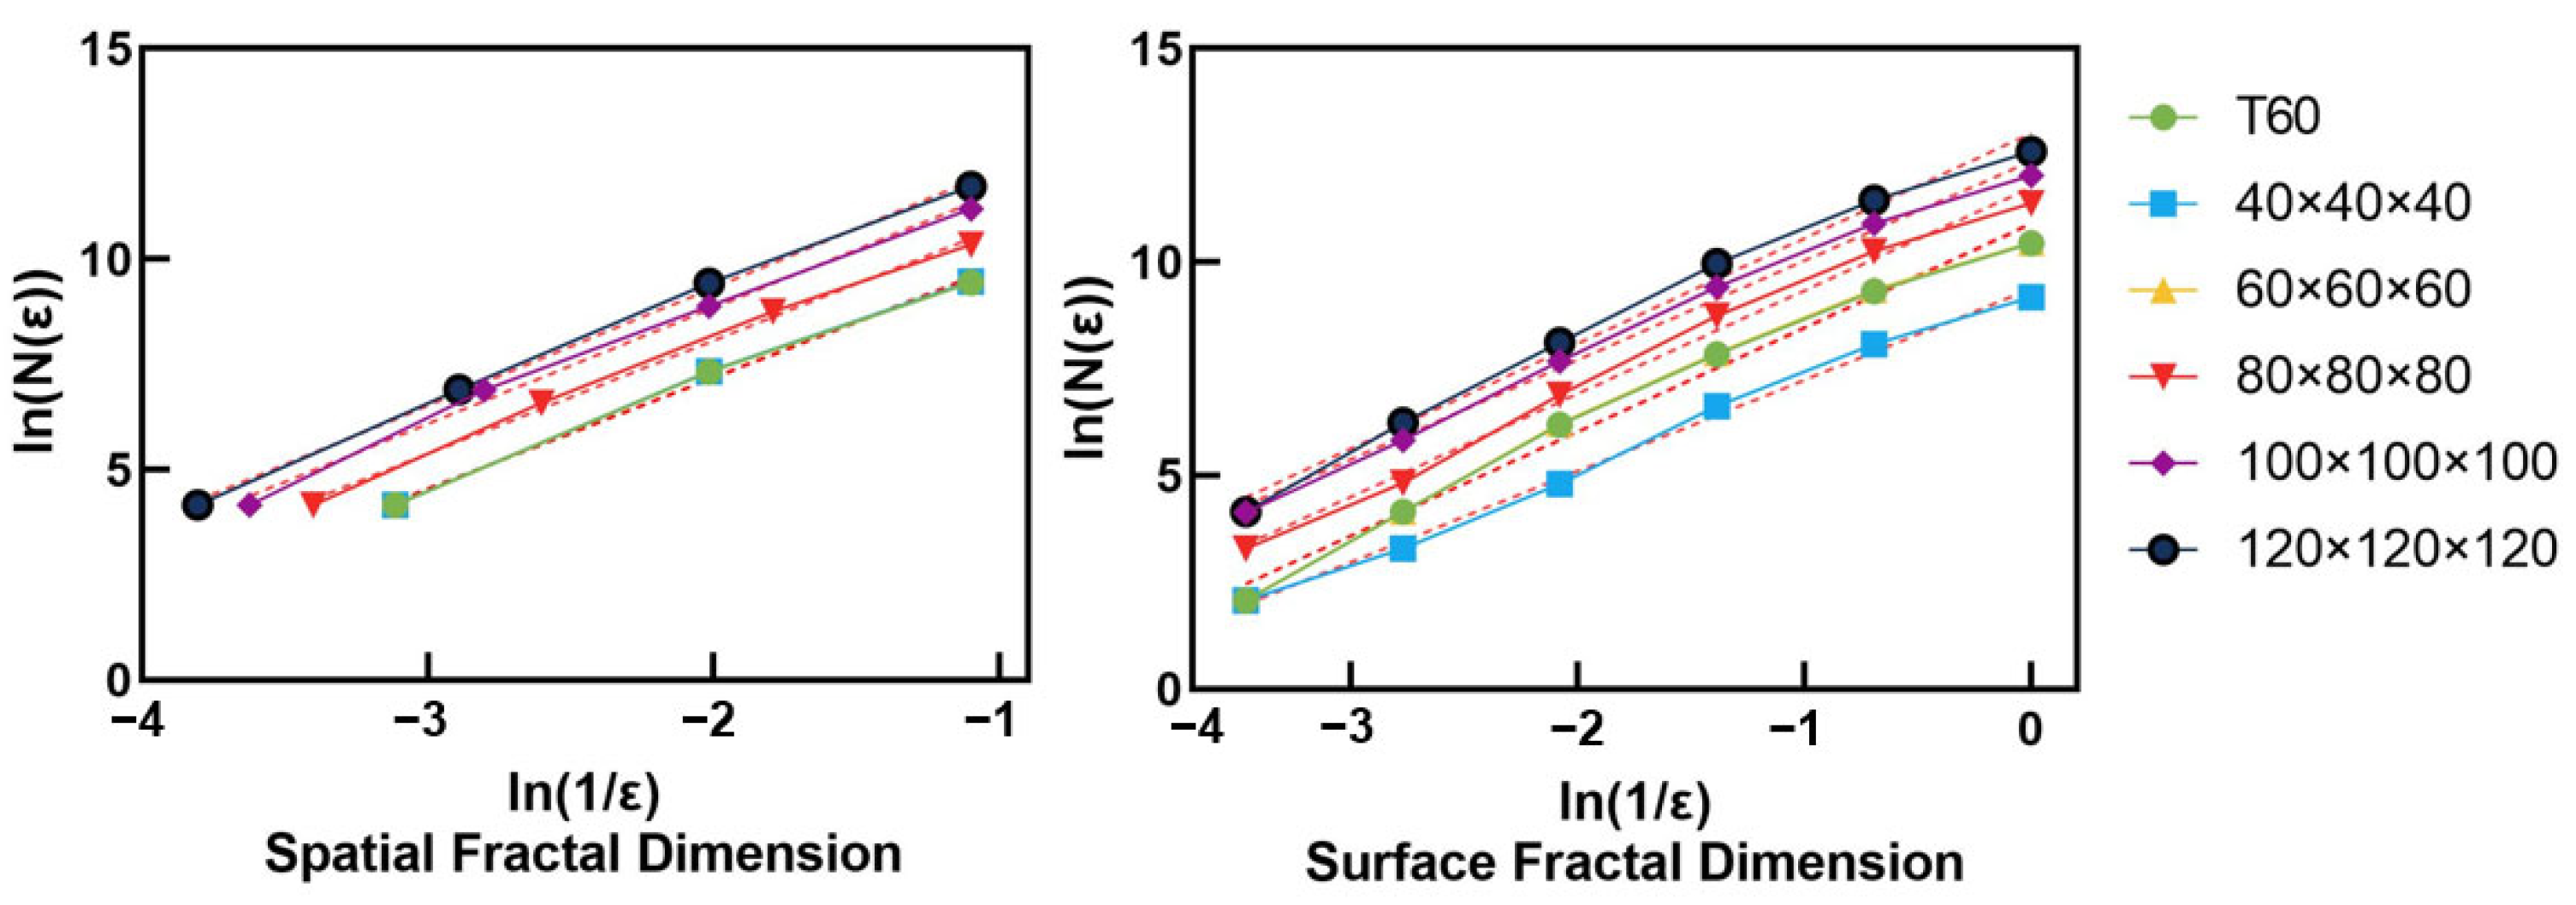
Figure 12 displays the box-counting method fitting curves for a representative realization. The excellent linear fit further confirms the significant fractal characteristics of the reconstructed structures.
3.5. Analysis of Seepage Performance and Spatial Statistical Properties
Comprehensive seepage capacity and spatial statistical patterns are key dimensions for evaluating engineering application value. Since permeability possesses tensor characteristics and variograms involve multi-directional correlations, utilizing mean values would mask the physical details of directional heterogeneity. Therefore, this section selects representative realization cases for each scale for in-depth analysis to more clearly compare anisotropic features and spatial evolution laws.
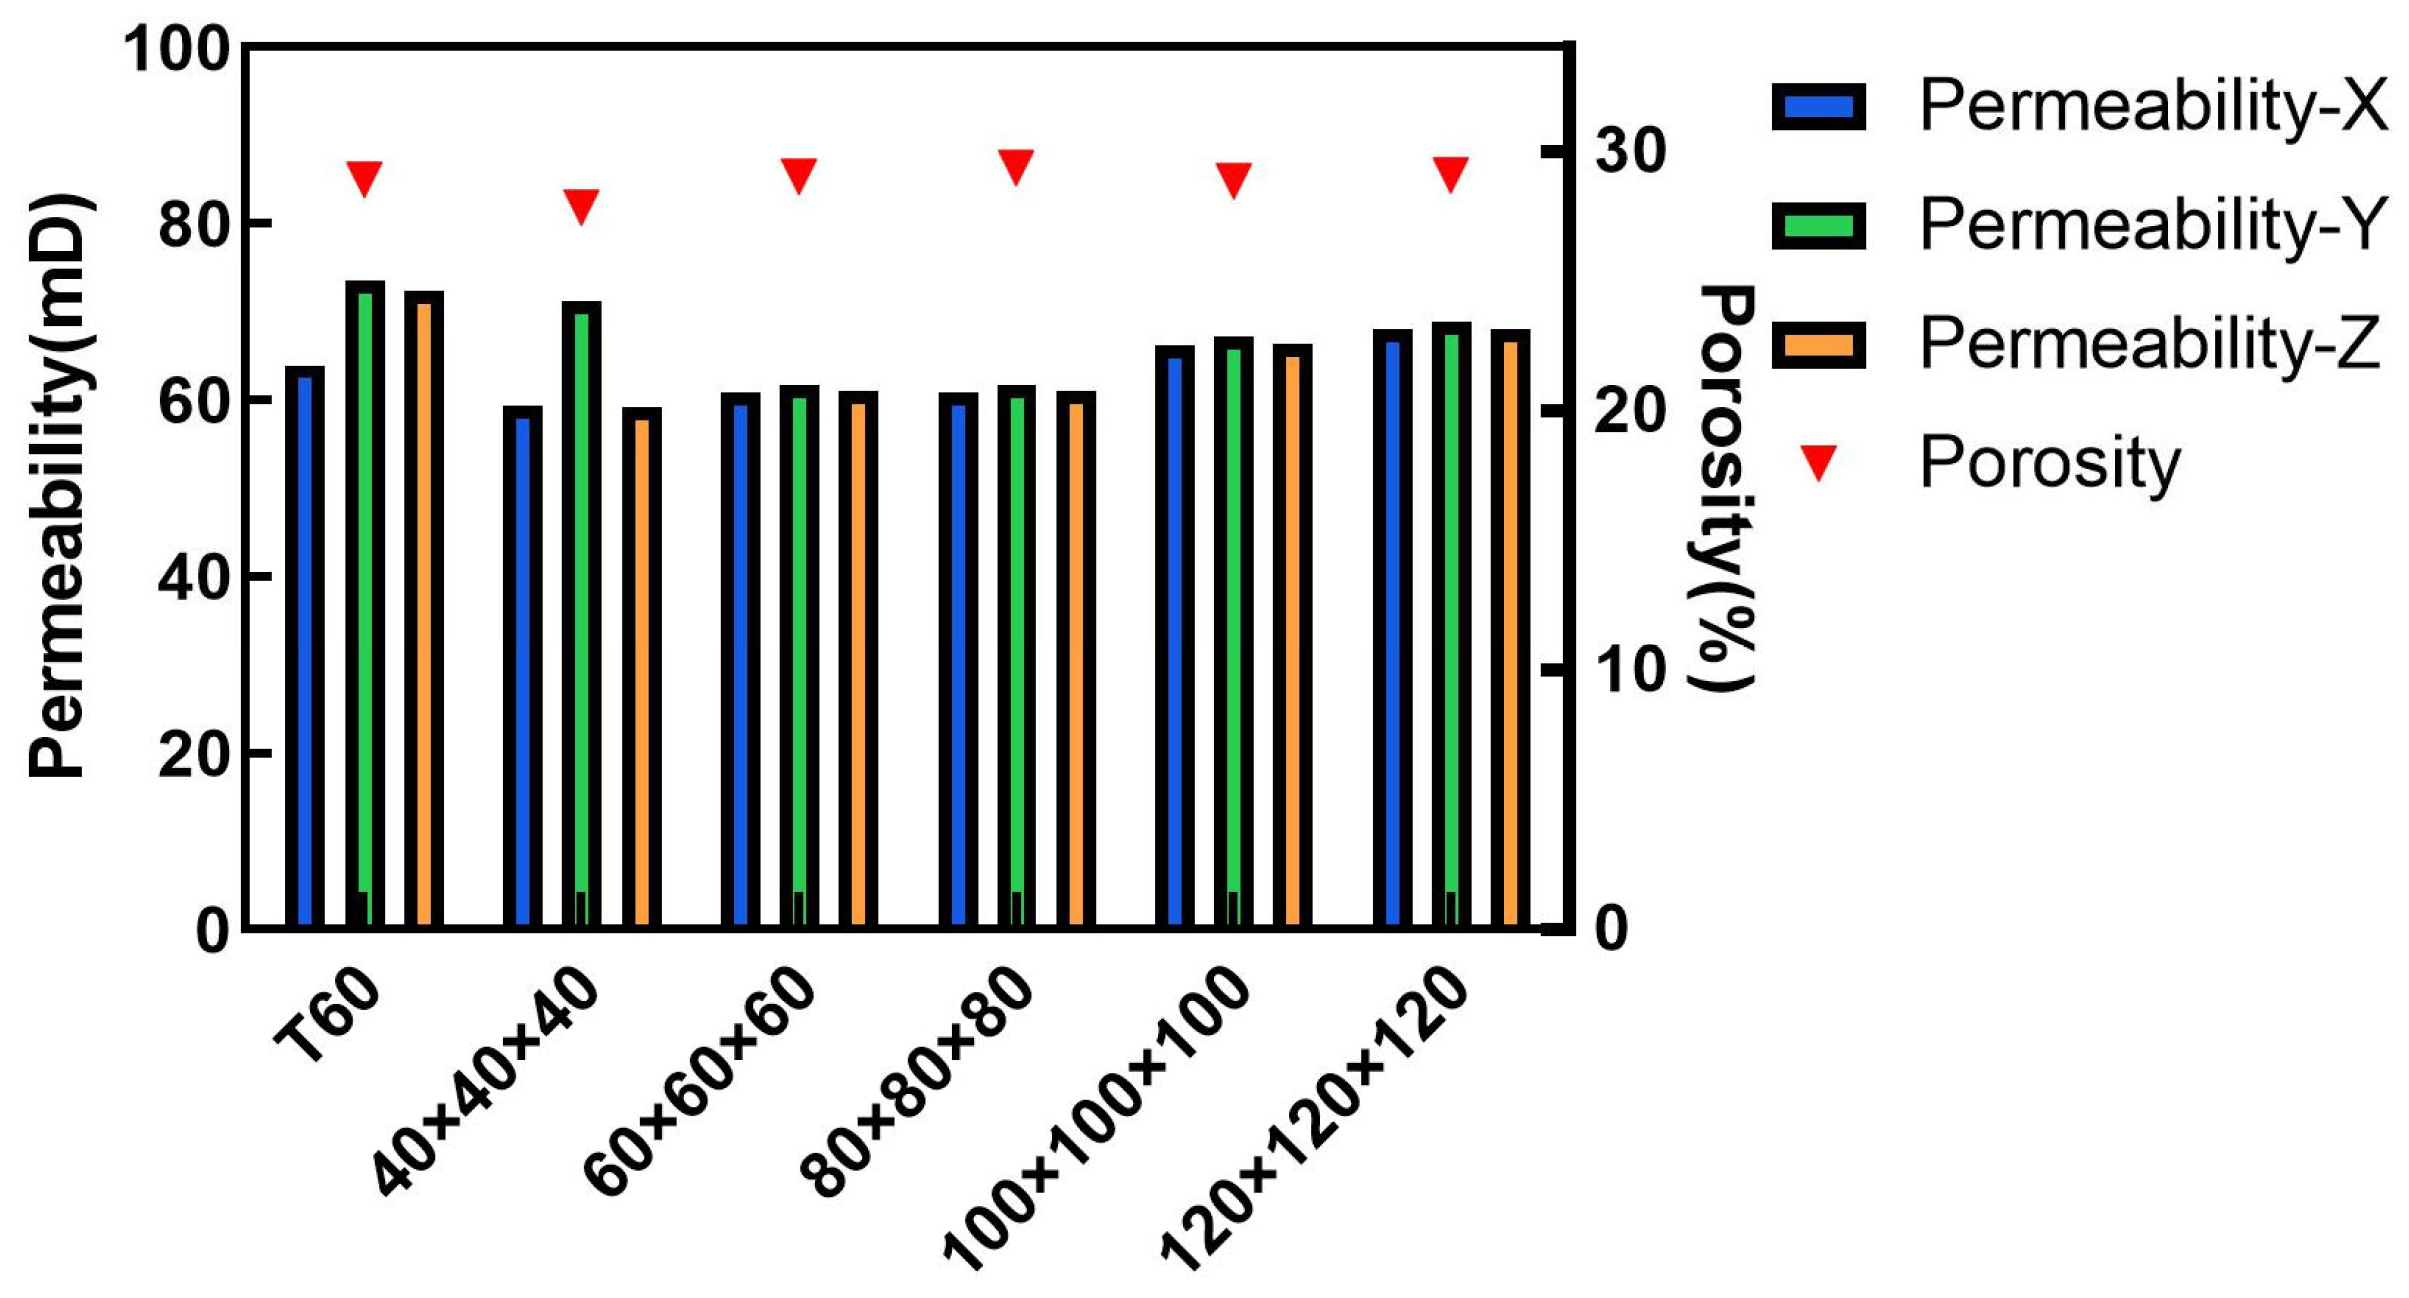
In terms of seepage capacity, the training image T60 exhibits clear inherent directional heterogeneity (
Figure 13). Its permeabilities in the X, Y, and Z directions are 63.97 mD, 73.57 mD, and 72.44 mD, respectively, presenting typical anisotropic characteristics (Kz/Kx ≈ 1.13). This difference originates from the non-random arrangement of microscopic pores and throats in 3D space, serving as a direct manifestation of the directional nature of pore structures after real rocks undergo deposition and diagenesis. However, all reconstructed samples significantly weaken this feature. Taking the R120 sample as an example, its permeabilities in the three directions are highly similar, with the anisotropy ratio (Kz/Kx ≈ 1.00) approaching 1. Moreover, the confidence intervals in the X, Y, and Z directions exhibit substantial overlap, indicating that the differences are not statistically significant.
This homogenization trend is prevalent across cases of all scales. Accompanying this weakening of permeability anisotropy, the average coordination number also exhibits a systematic decrease (
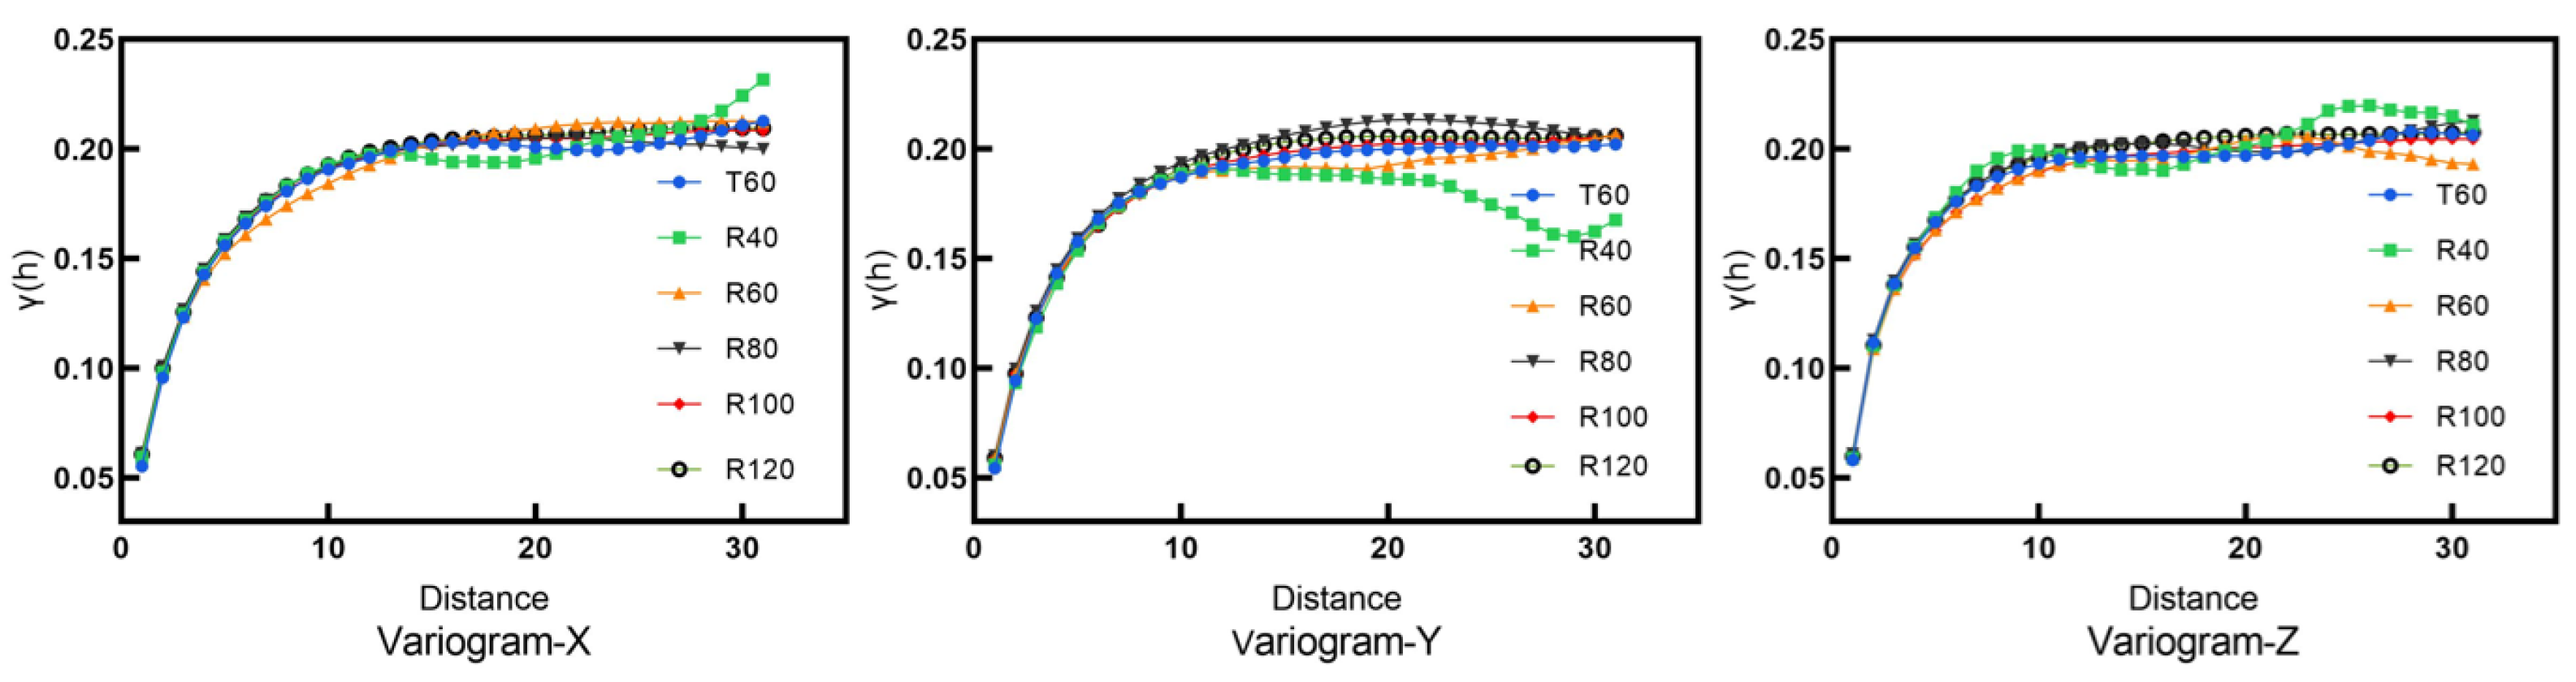
Section 3.3). Notably, the variogram analysis reveals that at smaller scales, the reconstructed model fails to reproduce the full spatial correlation length (
Figure 14). These combined observations, including weakened anisotropy, reduced connectivity, and truncated spatial correlation, raise important questions about the underlying mechanisms that are explored in the
Section 4. This systematic loss of anisotropy indicates that while the SNESIM algorithm maintains statistical similarity during scale extrapolation, it still falls short in functional equivalence. In practical reservoir characterization, ignoring this weakening of directional seepage characteristics may lead to deviations in predicting hydrocarbon migration dynamics.
Variograms reveal the spatial correlation and heterogeneity of the pore structure. Analysis based on the representative realizations shows that the reconstructed models exhibit obvious scale dependence in inheriting spatial statistical patterns. At the minimum reconstruction scale of 40 × 40 × 40 voxels, the variogram curves fail to show obvious signs of convergence within the calculation range. This phenomenon reveals a severe small-size effect: because the simulation window is too small—even lower than the spatial correlation length of the pore structure contained within the training image (T60)—the algorithm is unable to reproduce complete second-order statistical features within such a confined space.
In contrast, as the scale increases, the morphology, range, and sill values of the variogram curves for the reconstructed cores highly match those of the training image. For instance, in the X direction, the curve of the 120 × 120 × 120 voxel reconstructed core almost overlaps with that of T60 across the entire lag distance, with a relative error in the sill value of less than 2%. This proves that the SNESIM algorithm is inherently a powerful spatial statistical simulator; as long as the simulation space is large enough to accommodate the correlation scale of the structure, it can accurately capture and reproduce the distribution laws and aggregation patterns inherent in the training image. This result mutually corroborates the accurate restoration of the spatial fractal dimension, collectively demonstrating that the algorithm has reliable capabilities in characterizing the macroscopic complexity of pore spaces.
3.6. Cross-Dimension Correlation Analysis
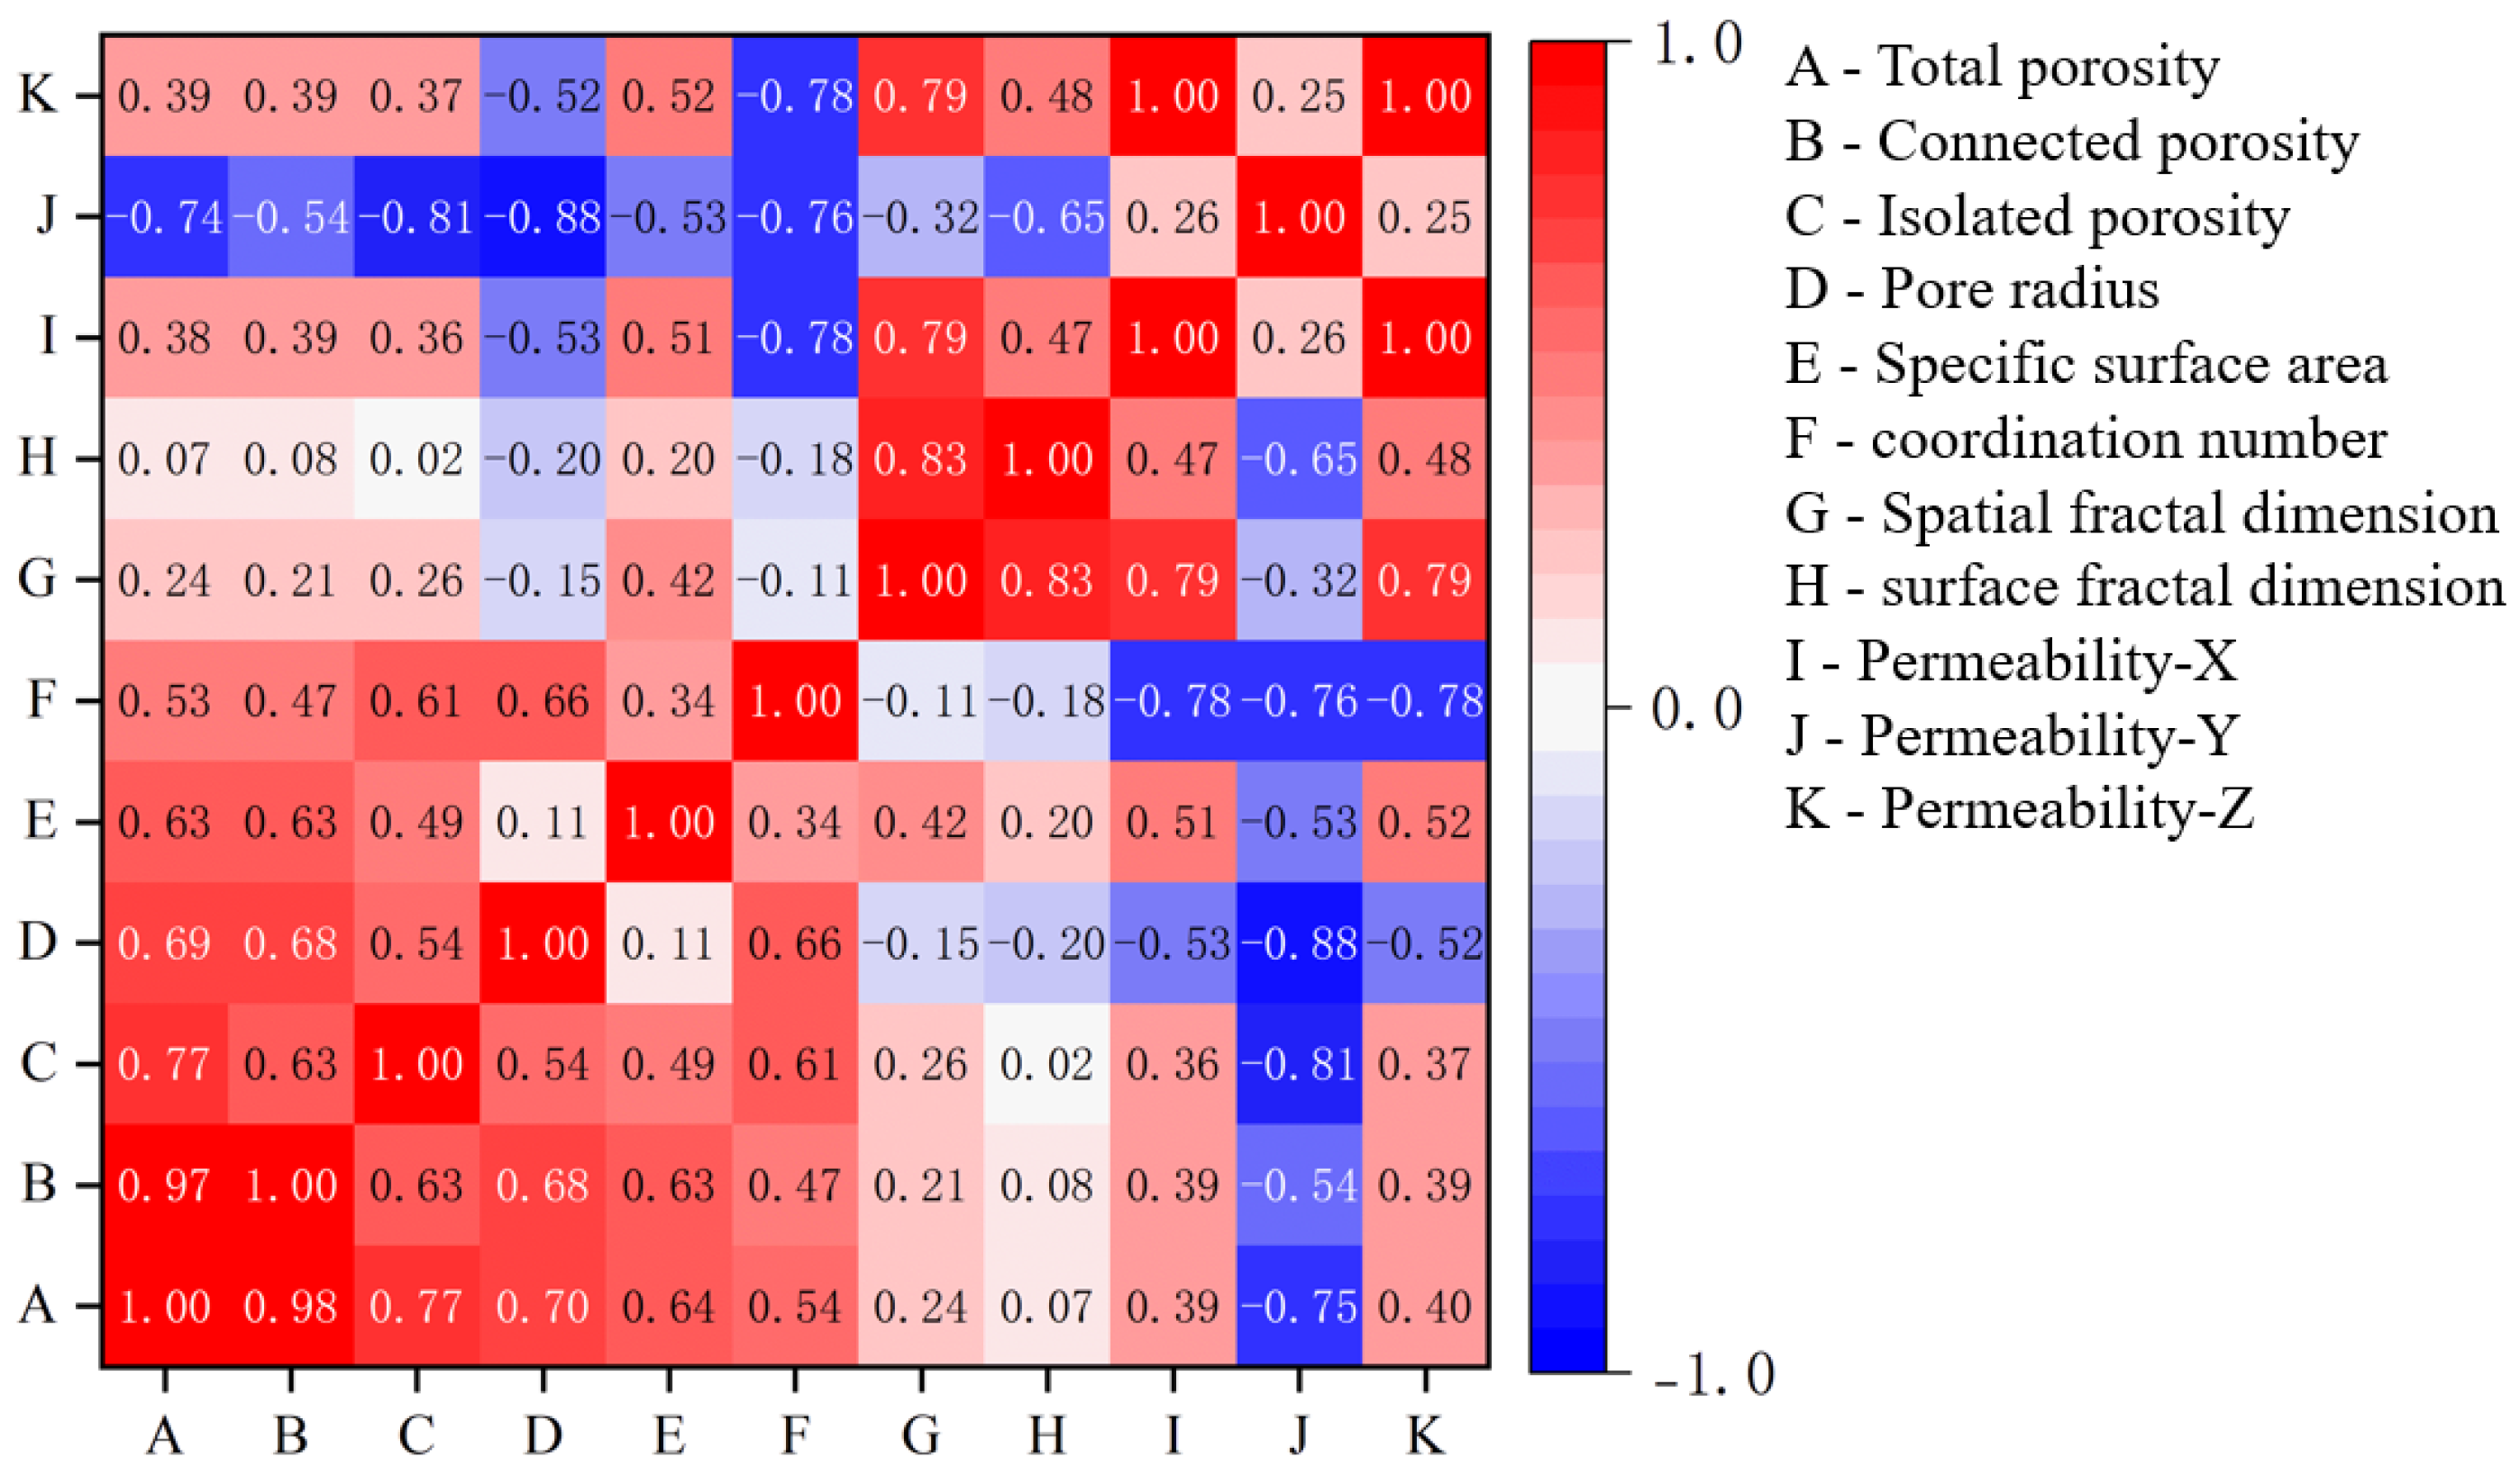
To evaluate the internal consistency of the proposed four-dimensional evaluation system, a Pearson correlation matrix of 11 core parameters was computed using all 50 re-constructed realizations, which comprise five scales with ten realizations each. The resulting matrix, visualized as a heatmap in
Figure 15, quantitatively maps the coupling relations among macroscopic statistics, microscopic topology, fractal morphology, and directional seepage properties. It should be noted that, owing to computational constraints, permeability data were obtained only from representative realizations at each scale. Consequently, the correlations involving permeability should be regarded as indicative trends rather than rigorous statistical inferences.
The matrix reveals several stable coupling patterns among the non-seepage dimensions. Total porosity and connected porosity exhibit a very strong positive correlation, with a coefficient of 0.98, consistent with their inherent physical definitions. Isolated porosity shows a moderate positive correlation with connected porosity, at 0.63, indicating that the algorithm generates a proportional amount of isolated pore structures alongside connected pores. The average coordination number is positively correlated with the aver-age pore radius, at 0.66, reflecting the topological rule that larger pore bodies tend to possess more throat connections, in agreement with typical pore network behavior.
The fractal dimension metrics display notable internal consistency. The spatial fractal dimension correlates strongly with the surface fractal dimension at 0.83, demonstrating that volumetric structural complexity and interfacial roughness remain highly synchronized in the algorithm outputs. The spatial fractal dimension shows a weak negative correlation with the average coordination number at negative 0.11, and the surface fractal dimension similarly shows a weak negative correlation with the average coordination number at negative 0.18. This subtle decoupling suggests that the algorithm exerts relatively independent effects on spatial filling complexity and topological connectivity, consistent with the parallel mechanisms of interfacial smoothing and topological homogenization discussed in
Section 4.
The indicative trends involving permeability align with the above findings. Permeability in the X and Z directions maintains a very high mutual correlation, whereas permeability in the Y direction shows notably weaker associations with both, consistent with the anisotropy attenuation observed in
Section 3.5. Furthermore, permeability in all three directions displays a positive association with the spatial fractal dimension and a negative association with the average coordination number. This pattern is consistent with the structural homogenization mechanism discussed in
Section 4, where increased volumetric complexity coexists with simplified topological connectivity, and the sustained permeability likely reflects compensatory adjustments in throat geometry rather than preserved network architecture. Nevertheless, these cross-seepage correlations require further validation through permeability simulations with larger sample sizes in future studies.
Collectively, these correlation patterns transform the originally disparate four-dimensional indicators into an internally coherent, statistically quantifiable system. The correlation matrix approach is not algorithm-specific and can be directly applied to benchmarking other reconstruction methods, such as deep generative models or process-based simulations.
5. Conclusions
This study presents a multi-dimensional framework for evaluating digital rock reconstructions by integrating macroscopic, topological, morphological, and seepage properties. Our findings confirm that while the SNESIM algorithm maintains high statistical fidelity in global attributes, it introduces systematic smoothing and homogenization effects during scale extrapolation. This manifests as a significant loss of intrinsic anisotropy and a reduction in pore connectivity, driven by fundamental structural homogenization during scale extrapolation. Such biases may lead to misinterpretations of directional transport behavior in reservoir characterization.
The proposed evaluation framework provides a standardized methodological foundation that can potentially be extended to various porous media, serving as a benchmark for comparing different reconstruction techniques such as deep learning or process-based models. While the current validation is focused on sandstone samples, the multi-dimensional metrics established here offer a robust starting point for benchmarking future reconstruction algorithms across diverse pore structures. Future research should involve a wider array of lithologies to further verify and consolidate the framework’s universal robustness. Additionally, integrating explicit topological constraints into the simulation process will be crucial to mitigate observed structural biases, ultimately enhancing the reliability of digital rock physics for functional prediction.