1. Introduction
Although the definition of sensitive personal data varies across territories and jurisdictions, it generally adheres to the principle that such data may pose a high risk to individuals’ rights, freedoms, or security if misused or disclosed. The General Data Protection Regulation (GDPR) [
1] of the European Union explicitly defines sensitive data as "special categories of personal data", covering eight categories, including racial or ethnic origin, political opinions, religious beliefs, trade union memberships, biometric data, health data, and sexual orientation, and imposes stringent conditions on their processing. In 2024, the United States issued the Executive Order on Preventing Access to Americans’ Bulk Sensitive Personal Data and United States Government-Related Data by Countries of Concern [
2]. This identifies six categories of sensitive personal data; however, it still lacks a unified and comprehensive definition of sensitive information. China’s Personal Information Protection Law (PIPL) [
3] explicitly defines the scope of sensitive personal information, including biometric data, health information, location and travel data, and information relating to minors, while emphasizing constraints related to national security. In China, the definition of sensitive information mainly relies on the Information Security Technology—Personal Information Security Specification (GB/T 35273) [
4], which serves as the basis for establishing a risk quantification indicator system for sensitive information leakage. This system is centered on key indicators such as leakage impact, identifiability, and circulation risk. However, this indicator framework is insufficient to accommodate complex and dynamic application scenarios, and the corresponding quantitative models do not adequately account for variations in data sensitivity over time and context. Japan, South Korea, and Middle Eastern countries have also enacted similar regulations that provide special protection for sensitive data such as racial and ethnic information, data on religious beliefs, health data, criminal records, and biometric information. International standards, such as the Organisation for Economic Co-operation and Development (OECD) Privacy Guidelines [
5] and ISO/IEC 27701 [
6] and ISO/IEC 29100 [
7], provide principle-based guidance that emphasizes data minimization, security safeguards, and risk management.
In the civil aviation domain, international organizations and industry associations have also established specialized regulations and standards specifically addressing the protection of passengers’ sensitive information. The International Civil Aviation Organization (ICAO) Guidelines on Passenger Name Record (PNR) Data (ICAO Doc 9944) [
8] clearly specify that airlines and national authorities should adhere to principles such as lawfulness, data minimization, data de-identification, and retention limitation when collecting, transmitting, and processing passenger information. The API-PNR Toolkit, developed by IATA [
9] in cooperation with ICAO and the World Customs Organization (WCO), provides comprehensive guidance on Advance Passenger Information (API) and Passenger Name Record (PNR) data exchange, including data elements, transmission standards, and privacy considerations. The European Union(EU) [
10] Passenger Name Record (PNR) Directive (Directive (EU) 2016/681) sets out a legal framework for the processing of passenger data by authorities of Member States, prohibits the processing of sensitive categories such as race, religion, health, and sexual orientation, and stipulates the rights of data subjects and requirements for data de-identification. The civil aviation industry standard issued by the Civil Aviation Administration of China, MH/T 3039-2025 [
11], further specifies the explicit requirements for the full life-cycle protection of passenger information. Overall, the global classification framework for sensitive information exhibits two key characteristics: firstly, a high degree of overlap in the core categories, primarily involving identity information, health data, biometric data, and social attributes such as political and religious information; secondly, stringent processing requirements that emphasize lawfulness, data minimization, and security safeguards. This international consensus not only provides an important reference for the classification and secure sharing of civil aviation passenger data but also offers a solid theoretical and practical foundation flow addressing cross-border data flows, privacy compliance, and risk mitigation in the aviation industry.
In the civil aviation sector, China has issued several standards such as the Smart Civil Aviation Data Governance Specification—Data Security (MH/T 5057-2021) [
12], establishing a multi-dimensional assessment framework. By analyzing historical data leakage incidents and incorporating factors such as passenger data protection capabilities and network attack situations, these standards define quantitative indicators to evaluate the probability of sensitive passenger data leakage. However, against rapidly changing and real-time operational scenarios, the existing indicator framework lacks a sufficiently robust dynamic updating mechanism, limiting its adaptability and responsiveness.
From the perspective of rule-based and privacy mechanism-driven methods, existing studies have systematically analyzed the passenger information stored by civil aviation enterprises and proposed sensitivity definitions based on identifier and quasi-identifier attributes [
13,
14]. While these approaches provide interpretable classification criteria, they are primarily designed for structured data and lack adaptability to dynamic and heterogeneous data environments. Moreover, recent studies have incorporated differential privacy and data partitioning strategies for sensitive data protection. Recent advances have further extended differential privacy into federated learning frameworks, where a differentially private scheme with an adaptive noise mechanism is proposed to balance model accuracy and privacy protection, and sensitivity is estimated based on both local and global historical information for adaptive noise calibration [
15,
16]. Nevertheless, these approaches still rely on predefined mechanisms, limiting their flexibility in complex civil aviation scenarios.
From the perspective of machine learning methods, researchers have introduced data-driven approaches to improve sensitivity classification in complex environments. Distributed classification frameworks based on machine learning have been widely explored [
17], and hybrid models combining feature distributions with classifiers such as support vector machines (SVM) have been developed [
18].
In addition, recent studies in intelligent transportation and networked data environments have explored privacy-preserving classification and anomaly detection methods. For example, a secure and efficient support vector machine-based classification scheme has been proposed to protect sensitive data during computation and transmission through cryptographic mechanisms [
19]. Furthermore, machine learning-based anomaly detection frameworks incorporating privacy protection mechanisms, such as homomorphic encryption, have been developed to enable accurate detection while preserving data confidentiality [
20].
However, these methods exhibit strong dependence on data distribution and feature engineering, which limits their generalization capability across heterogeneous civil aviation data environments.
From the perspective of deep learning methods, recent studies leverage neural networks to capture complex semantic and structural features of sensitive data.
For example, privacy-preserving deep learning-based classification methods have been proposed to securely process sensitive data by integrating encryption mechanisms, such as partially homomorphic encryption, with neural architectures [
21]. Other studies combine sequential models such as LSTM and CNN to enhance sensitivity recognition in large-scale datasets [
22]. Furthermore, in transportation-related scenarios, end-to-end deep learning frameworks have been developed for temporal anomaly detection, achieving improved accuracy and robustness [
23].
However, despite these advancements, existing studies still lack scenario-independent measurement criteria and fail to design adaptive sensitivity quantification frameworks tailored to civil aviation operational characteristics. This limitation significantly restricts their effectiveness in cross-scenario applications involving large-scale, heterogeneous passenger data.
The aforementioned studies address the identification and classification task of sensitive data in single and relatively simple data scenarios, yet several limitations remain. Firstly, existing research on sensitive information measurement largely relies on scenario-specific customization, resulting in significant discrepancies in the definition and quantification of sensitive data. Such business-scenario-dependent classification and measurement approaches are difficult to transfer or generalize across domains. Secondly, current measurement frameworks are predominantly static, isolated, and generic, and they fail to adequately adapt to the distinctive characteristics of civil aviation operations, preventing their effective deployment in real-world aviation scenarios.
Sensitive passenger data in civil aviation frequently flows across multiple business systems, where privacy protection requirements and application contexts vary substantially, leading to pronounced differences in sensitivity assessment. Moreover, the sensitivity level of the same type of data dynamically changes across diverse business nodes and operational scenarios. During data exchange and sharing among systems, business messages carry varying types and quantities of sensitive information, further exacerbating data heterogeneity. Traditional sensitive data assessment methods that rely on expert knowledge or fixed business rules struggle to maintain objectivity in environments characterized by multi-system, multi-source, and heterogeneous data.
(1) Rule-based modeling of civil aviation passenger sensitive data. By integrating civil aviation passenger sensitive data with operational business scenarios, a two-level privacy element framework consisting of primary elements and secondary elements is constructed. The secondary elements are mapped to their corresponding primary elements based on attribute characteristics, thereby achieving structural unification and dimensionality reduction and enabling standardized sensitivity classification.
(2) Information entropy-based sensitivity measurement for civil aviation passenger data. On the basis of the rule-based civil aviation passenger sensitive dataset, the categories of primary elements contained in each data record are identified. The information entropy of secondary elements is first calculated and then aggregated to derive the corresponding measurement values of primary elements within the dataset. Consequently, a measurement vector for the i-th data record is obtained.
(3) Sensitive level classification for civil aviation passenger sensitive data. Leveraging the rule-based representation and the derived measurement vectors, classification methods are employed to assign sensitivity levels to passenger data, thereby enabling hierarchical privacy protection for civil aviation passenger sensitive information.
2. RF-HM-SICA Model
In this paper, based on the Chinese national standard Data Security Technology—Rules for Data Classification and Grading (GB/T 43697-2024 [
24]) and the National Cybersecurity Standardization Technical Committee guideline Cybersecurity Standard Practice Guide—Guidelines for Identifying Sensitive Personal Information (TC260-PG-20244A), in conjunction with the civil aviation industry standard Requirements for Data Classification and Grading in the Civil Aviation Domain (MH/T 3039-2025) and the characteristics of civil aviation passenger sensitive data, a structured sensitive information framework is constructed. It consists of seven primary elements (e.g., demographic information, financial information, and flight travel data) and multiple corresponding secondary elements. For each category, specific protection requirements, classification principles, and sensitivity levels (L1–L3) are defined.
Subsequently, information entropy is employed to model the occurrence probability of each sensitive field within the data samples, thereby quantifying the privacy level of individual fields. The structured sensitive information is then transformed into vectorized feature representations, which are used to train and predict sensitivity levels through a random forest model, enabling a hierarchical mapping between sensitivity levels (L1, L2, L3) and corresponding protection requirements.
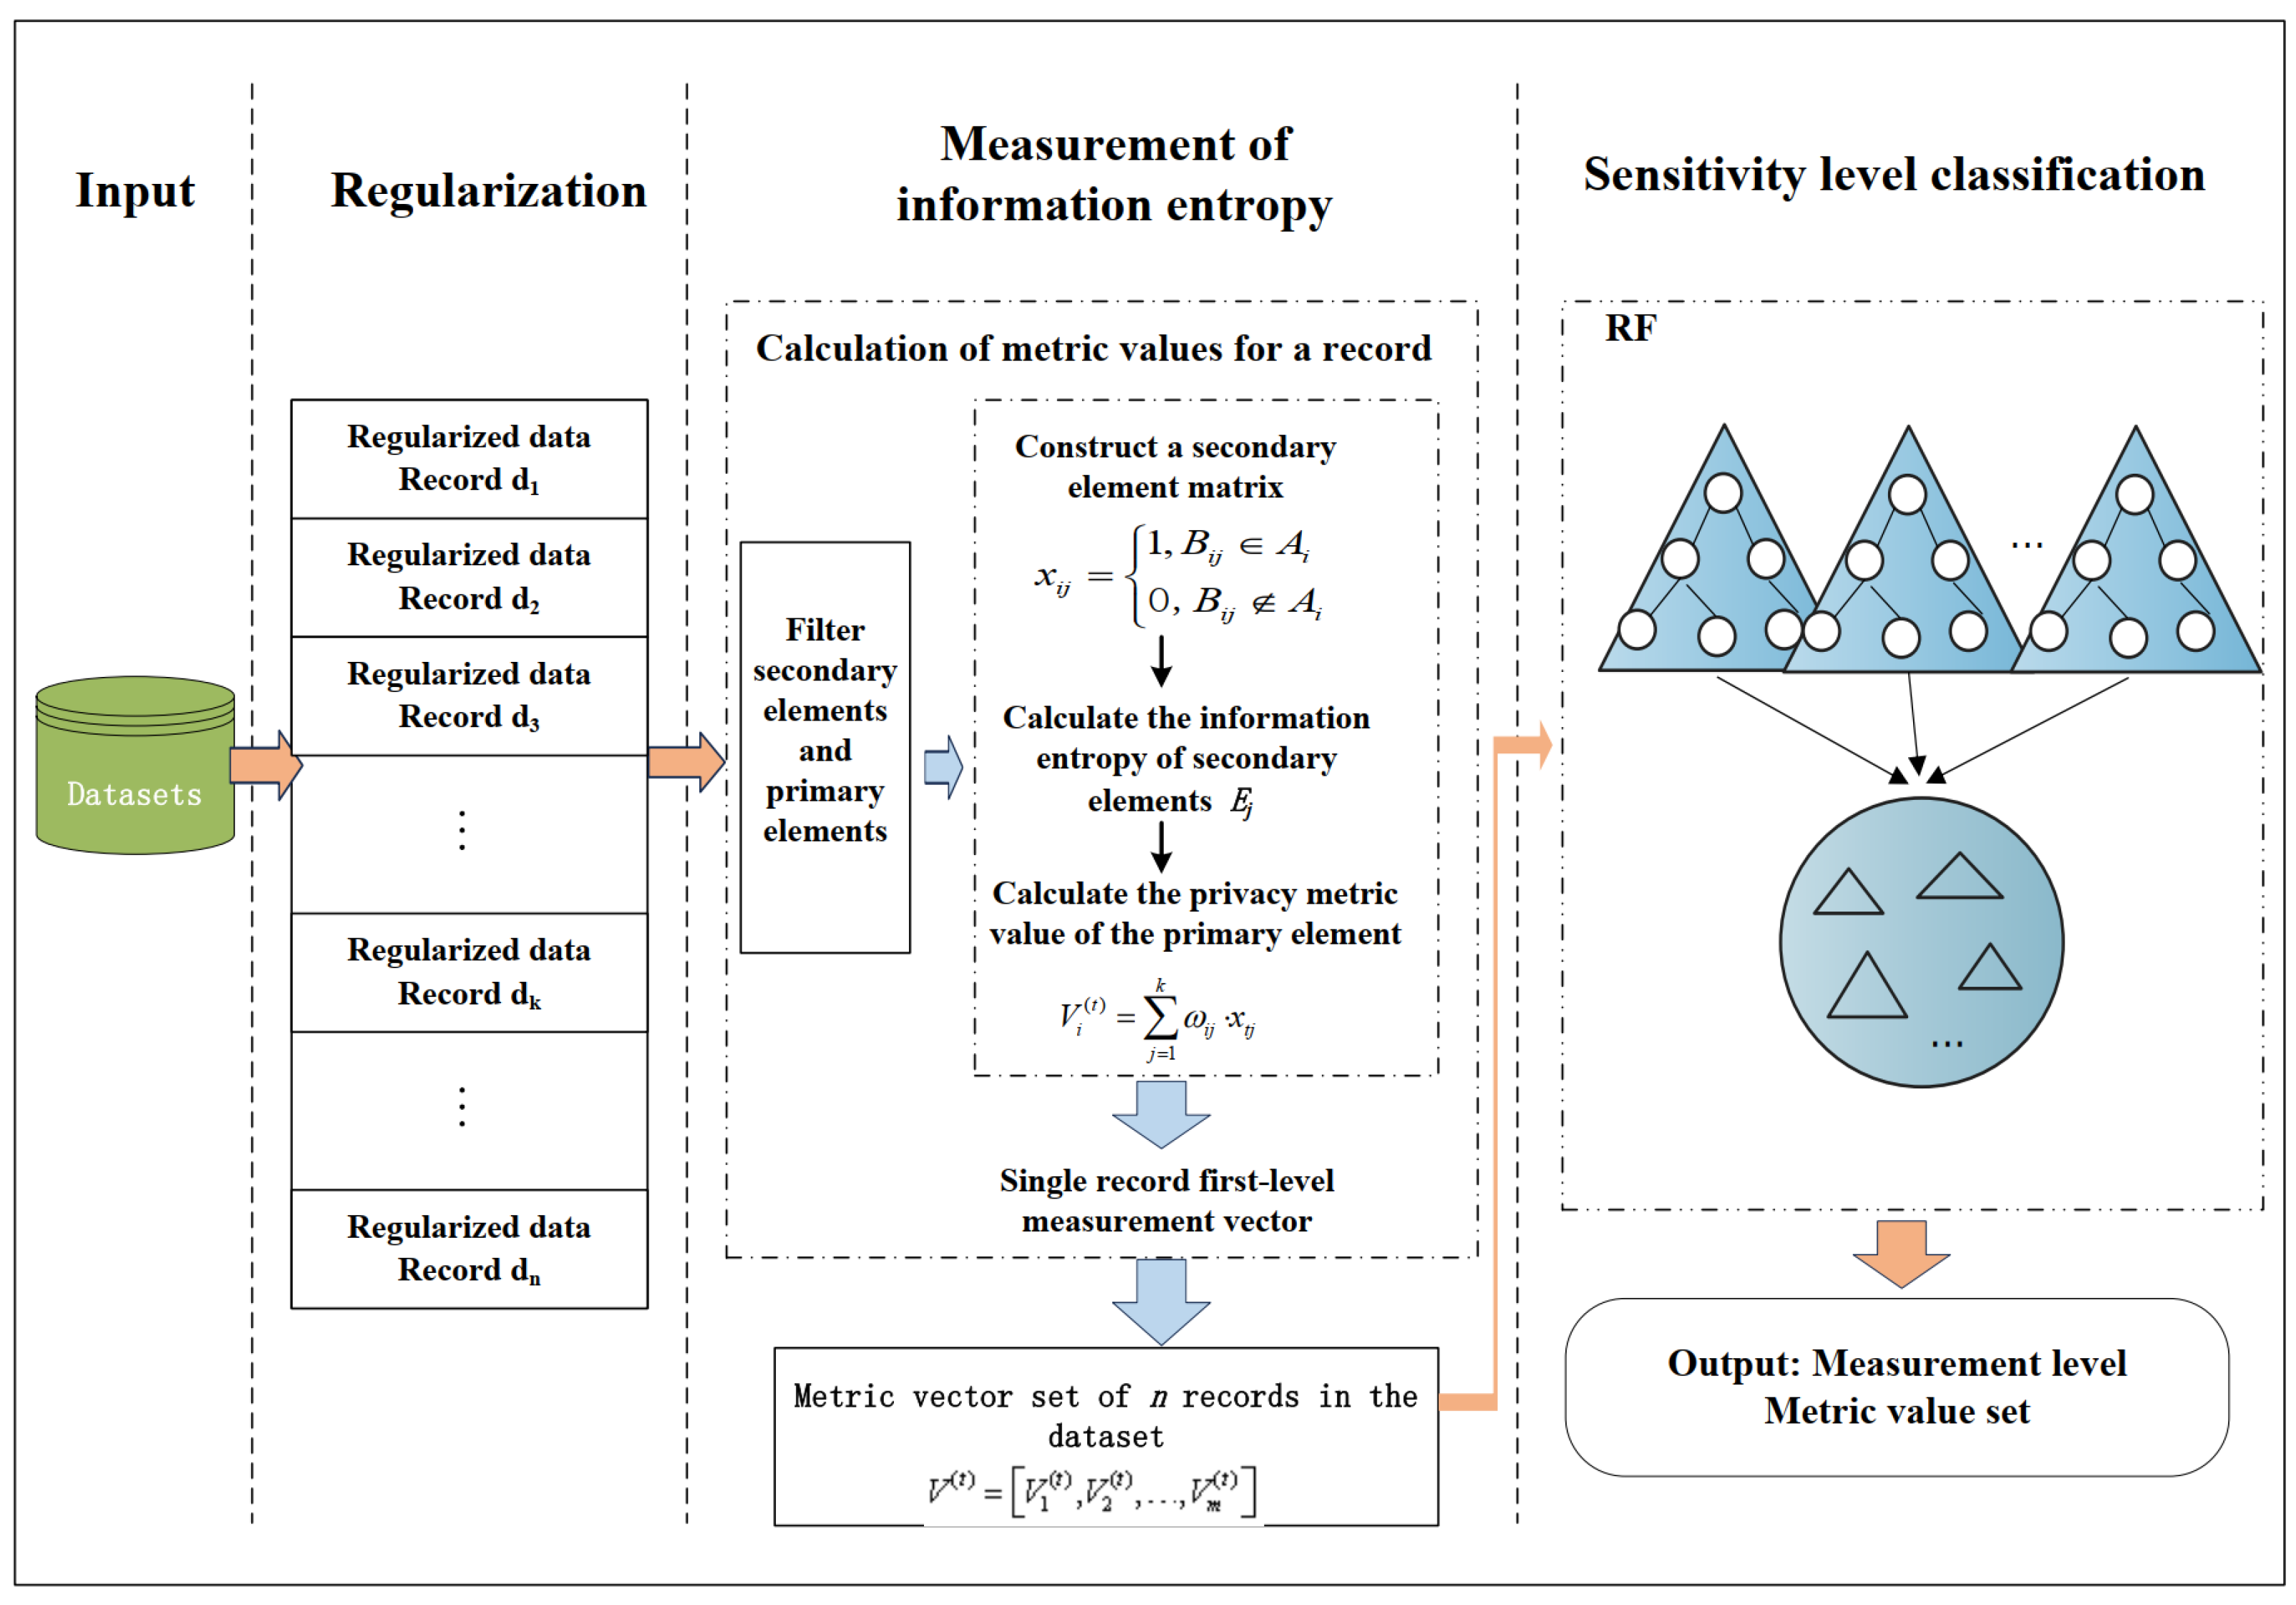
The proposed RF-HM-SICA consists of three main modules: sensitive data rule regularization, information entropy-based measurement, and sensitive level classification, as illustrated in
Figure 1. First, following the element framework shown in
Table 1, information entropy is applied to measure secondary elements, after which measurement vectors corresponding to each primary element are derived. This process achieves the effective dimensionality reduction in high-dimensional sensitive information features, significantly lowering computational complexity while preserving representational capability. Next, the resulting set of primary privacy element measurement vectors is used as the training dataset to construct a sensitive data classifier based on random forests, enabling the accurate classification of passenger data across different sensitivity levels.
2.1. Rule-Based Sensitive Data
In this paper, on the basis of the data element classification and grading rules shown in
Table 1, and in conjunction with civil aviation passenger sensitive data and operational scenarios, a two-level privacy framework consisting of primary and secondary elements is constructed. Within this framework, secondary elements are mapped to higher-level primary elements according to their attribute characteristics, thereby achieving structural unification and dimensionality reduction. Then, according to differences in data sensitivity, the primary elements are further classified into three sensitivity levels, each corresponding to distinct privacy protection strategies.
(1) Sensitive information identification. Sensitivity determination criteria vary significantly across diverse scenarios [
25]. Based on the secondary elements summarized in
Table 1, sensitive data include, but are not limited to, identification numbers, phone numbers, communication account identifiers, email addresses, home addresses, bank card numbers, Chinese and English names, flight numbers, ticket numbers, flight schedules, departure and destination locations, and frequent flyer information.
(2) Sensitive information dimensionality reduction. Passenger data in civil aviation information systems are highly complex and high-dimensional. For example, the civil aviation passenger reservation system alone contains more than one hundred secondary elements. In such high-dimensional spaces, directly performing sensitivity measurement not only incurs high computational complexity but also leads to low classification efficiency. To address this issue, primary elements are introduced as an intermediate abstraction layer to aggregate and categorize secondary elements, enabling dimensionality reduction at both semantic and structural levels, thereby improving model scalability and computational efficiency.
(3) sensitive level classification. On the basis of the aggregation of primary elements, sensitivity levels are determined according to the potential harm caused by data leakage. Sensitive data are classified into three levels, as detailed below.
High sensitivity (L3): Passenger data whose direct disclosure may result in identity theft or major security incidents. Such data require mandatory encryption and desensitized storage, along with strictly minimized access control.
Medium sensitivity (L2): Data that may lead to privacy exposure or impact operational security when combined. These data require desensitized storage and encryption.
Low sensitivity (L1): Data with low correlation and controllable leakage risk. Such data are subject to non-mandatory desensitization and basic access control mechanisms.
Through this process, the privacy element framework becomes scalable, while it effectively addresses the computational efficiency challenges caused by the diversity and high dimensionality of data types. The detailed rules are presented in
Table 1.
The experiments are conducted on departure data, and the dataset to be measured is denoted as D. The dataset D contains n records, denoted as . Each record is mapped to the corresponding primary elements and secondary elements within the proposed privacy element framework. After rule-based regularization, the data are transformed into a structured input dataset. For example, in a given record , the primary element Demographic Information contains three secondary elements: English name, gender, and identification document information. In this case, the set of secondary elements associated with the demographic primary element in record rri can be expressed as , where each element in the vector indicates whether the corresponding primary sensitivity is present 1 or absent 0.
2.2. Information Entropy-Based Secondary Element Measurement Module
Information entropy was first introduced by Shannon in 1948 within the framework of information theory [
26]. Inspired by the concept of entropy in thermodynamics, information entropy is used to quantify the uncertainty of an information source, thereby reflecting the degree of disorder or randomness in a system. Specifically, let us suppose that a dataset
D has
m possible states, denoted as
, with corresponding occurrence probabilities
. The information entropy
of the dataset
D is then defined as
where
and
; where
, it is defined that
.
Information entropy is used to characterize the disorder and uncertainty of a random variable, with a higher entropy value indicating a greater degree of disorder and uncertainty, as well as a larger amount of information contained in the data, and a lower entropy value implying a lower degree of disorder and less information content. Therefore, information entropy can serve as an important indicator for measuring data sensitivity and classification significance.
Secondary elements differ in their impact on sensitivity levels. We apply Shannon entropy to weight these elements, aggregating them into primary-element features that retain key discriminative information for classification.
For
n records, the information entropy is computed on each secondary element to obtain its measurement value, and the corresponding primary element measurement vector is then derived. Suppose that a given primary element
contains secondary elements
k secondary elements
. After applying rule-based regularization to the dataset
D, a binary feature matrix
is constructed, where
The occurrence probability of each secondary element is defined as
and then information entropy is calculated:
when
or 1,
. For each primary element, its corresponding measurement value is obtained by taking a weighted sum of the information entropy values of all its associated secondary elements. The weight of the secondary element
is defined in Equation (
5) as
Therefore, the privacy measurement of the
t record on the primary element
can be defined as
By combining the measurement results of all primary elements, the privacy measurement vector of the record is obtained as
This vector is used as the feature input for subsequent model training and sensitivity-level classification.
In the proposed two-level privacy element framework, primary elements represent aggregated and abstract categories of passenger information, while secondary elements correspond to observable and quantifiable attributes within each passenger record. However, the contribution of different secondary elements to data sensitivity is inherently unequal. For instance, within the primary element demographic information, identifiers such as passport or identification numbers exhibit high uniqueness and sensitivity, whereas attributes such as gender or age are significantly less sensitive. Treating all secondary elements equally during aggregation would obscure these intrinsic differences and weaken the discriminative capability of the resulting feature representation.
To address this issue, Shannon entropy is employed to assign data-driven weights to secondary elements. The underlying intuition is that highly sensitive elements (e.g., passport numbers, bank card numbers) tend to appear sparsely across records, whereas low-sensitivity elements (e.g., seat numbers, boarding gates) are more uniformly distributed. Entropy effectively captures this variability: elements with moderate occurrence probability exhibit higher entropy and contribute more to distinguishing sensitivity levels, while elements with near-zero entropy (i.e., almost always present or absent) provide limited discriminative information. Specifically, the entropy of each secondary element is first computed and then normalized to derive its corresponding weight. Subsequently, a weighted aggregation of all secondary elements under each primary element is performed to obtain a scalar measurement value (as defined in Equation (
6)). This process transforms the multi-dimensional representation of secondary elements into a compact, one-dimensional sensitivity descriptor for each primary element.
The entropy-based weighting mechanism is unsupervised and data-driven, preserving the inherent structural characteristics of sensitivity without introducing additional bias. Moreover, the mathematical properties of entropy are well aligned with the objective of sensitivity discrimination: higher entropy indicates greater variability and thus a stronger contribution to distinguishing different sensitivity levels. This provides a principled and effective low-dimensional feature representation for subsequent classification using the random forest model.
2.3. Random Forest-Based Sensitivity Grading of Civil Aviation Passenger Information
Random forest (RF) [
27] is a supervised machine learning model constructed based on decision tree algorithms that can be applied to both classification and regression tasks. RF adopts an ensemble learning strategy by integrating multiple decision trees, where each individual tree acts as a classifier. Thus, an ensemble of
T trees produces
T classification results. RF employs the Bagging mechanism to aggregate these results and determines the final output by majority voting, i.e., selecting the class with the highest frequency. RF has strong robustness in handling heterogeneous structured data and its ability to mitigate overfitting through ensemble learning mechanisms.
Following the information entropy-based measurement stage, a random forest model is applied to classify passenger sensitive data into different sensitivity levels. A dataset
D is constructed as
, where
denotes the primary-element privacy measurement vector of the
passenger record, and
represents its corresponding sensitivity level, with L1, L2, and L3 indicating low, medium, and high sensitivity, respectively. To improve model training performance, all features are normalized as follows:
where
and
denote the minimum and maximum values of the
j-th feature, respectively.
A random forest model consists of
T decision trees, each of which is independently trained on a different bootstrap subset of the data. At each internal node,
candidate features are randomly selected from the total
d features to determine the optimal split. Tree growth is terminated according to predefined stopping criteria, such as the maximum tree depth or the minimum number of samples at leaf nodes, and each leaf node estimates the class posterior probability
. The final classification result is obtained by aggregating the outputs of all decision trees, which can be expressed as
where
denotes the classification function of the
t decision tree, and g is an indicator function, which equals 1 when the condition is satisfied and is 0 otherwise. Here,
c represents a candidate class.
3. Experimental Results and Analysis
Five evaluation metrics are adopted in the experiments. For the entity recognition task of sensitive fields for civil aviation passengers, performance is evaluated using training time, precision, recall, and F1-score. For the random forest-based hierarchical sensitivity measurement model for civil aviation sensitive data, evaluation is conducted using precision, recall, and F1-score [
28,
29].
3.1. Experimental Parameter Settings and Dataset Preparation
- (1)
Experimental Environment
The experiments are conducted using the PyTorch 2.1.0 deep learning framework with CUDA 12.1 acceleration. In terms of hardware configuration, the experimental platform is equipped with an Intel® Core™ i9-14900KF processor and an NVIDIA GeForce RTX 3090 graphics processing unit. To ensure fair comparison, all models are trained and evaluated under identical software and hardware environments.
- (2)
Experimental Hyperparameter
The experiments are conducted using a self-constructed sensitive information dataset, which is derived from a simulated operational environment of an actual testing platform and a dedicated data generation system. This approach ensures the authenticity and integrity of the data, while also guaranteeing compliance and controllability throughout the data usage process. To support comprehensive model training and evaluation, three datasets are employed, denoted as Dataset A, Dataset B, and Dataset C, each with distinct sources, contents, and characteristics, emphasizing different aspects of the experimental objectives. The key hyperparameter settings used for model training are summarized in
Table 2.
All models were evaluated under the same experimental conditions to ensure fairness. The other model hyperparameters were set as follows:
- (1)
CNN search space: Learning rate [0.0001, 0.01], batch size [8, 32], kernel size [3, 5], hidden dimensions [16, 64], epochs [10, 30].
- (2)
LSTM search space: Learning rate [0.0001, 0.01], batch size [8, 32], hidden dimensions [16, 64], number of layers [1, 2], epochs [10, 30].
- (3)
SVM search space: Kernel type [rbf, poly, linear], C [0.1, 100], gamma [scale, auto, 0.001, 0.1].
- (4)
Transformer Search Space: Learning rate [0.0001, 0.01], batch size [8, 32], embedding dimension dmodel [16, 64], number of attention heads nhead [2, 8], number of encoder layers [1, 4], epochs [10, 30].
- (5)
Gradient Boosting Search Space: Number of estimators nestimators [50, 200], max depth [3, 10], learning rate [0.05, 0.2], subsample ratio [0.6, 1.0].
- (6)
MLP Search Space: Learning rate [0.0001, 0.01], batch size [8, 32], hidden layer dimensions [16, 128], epochs [10, 30].
- (3)
Experimental Datasets
Dataset A is obtained from an actual testing platform, where the data format is consistent with passenger business data messages used in production systems. The dataset covers sensitive fields throughout the entire air travel lifecycle, including identification numbers, names, contact information, frequent flyer numbers, flight information, biometric information, and payment information.
Dataset B is automatically synthesized by a data generation system based on predefined business rules. It simulates the data structures and field distributions encountered in real operational workflows, including identification numbers, names, contact information, frequent flyer numbers, flight information, biometric information, and payment information.
Dataset C is collected from another testing platform and contains a certain proportion of nested structures, missing fields, and data contamination. The sensitive fields in this dataset include identification numbers, names, contact information, frequent flyer numbers, flight information, and payment information.
The three datasets are complementary in nature, capturing real-world characteristics (Dataset A), controlled and privacy-preserving synthetic scenarios (Dataset B), and large-scale data with increased structural complexity (Dataset C), thus facilitating a comprehensive evaluation of the proposed method across diverse practical settings. Dataset A contains 3000 records, Dataset B contains 15,000 records, and Dataset C contains 20,000 records. Datasets A, B, and C consist of 30 fields grouped under 7 primary categories. Missing values in the original data are represented by the symbol “–”. To ensure data security and consistency in model input, all features are transformed into a binary (0–1) representation, where the presence of a feature is encoded as 1 and absence (including missing values) is encoded as 0.
- (4)
Methodology Workflow
The overall procedure of the RF-HM-SICA consists of four main steps:
- Step 1:
Data Loading and Splitting
The civil aviation passenger dataset, which contains 31 attributes and corresponding sensitivity labels, is first loaded. The dataset is then divided into training and testing sets using a stratified sampling strategy with a ratio of 70:30%, ensuring that the distribution of sensitivity levels (low, medium, high) remains consistent across both sets.
- Step 2:
Entropy-Based Feature Extraction
Feature engineering is performed separately on the training and testing sets. The 31 secondary elements are grouped into seven primary elements, including demographic information, financial information, communication information, user preference information, static information, travel flight data, and basic flight information.
For each category, the Shannon entropy of non-missing attribute values is calculated, resulting in a 7-dimensional feature vector that captures the information distribution characteristics of each record.
- Step 3:
Model Training
The extracted 7-dimensional entropy feature vectors are used as input features, while the sensitivity levels serve as labels. RF is trained on the training set.
- Step 4:
Prediction and Evaluation
The trained models are applied to the testing set for prediction. Model performance is evaluated using standard metrics, including precision, recall, F1-score, and accuracy.
3.2. Analysis of Results
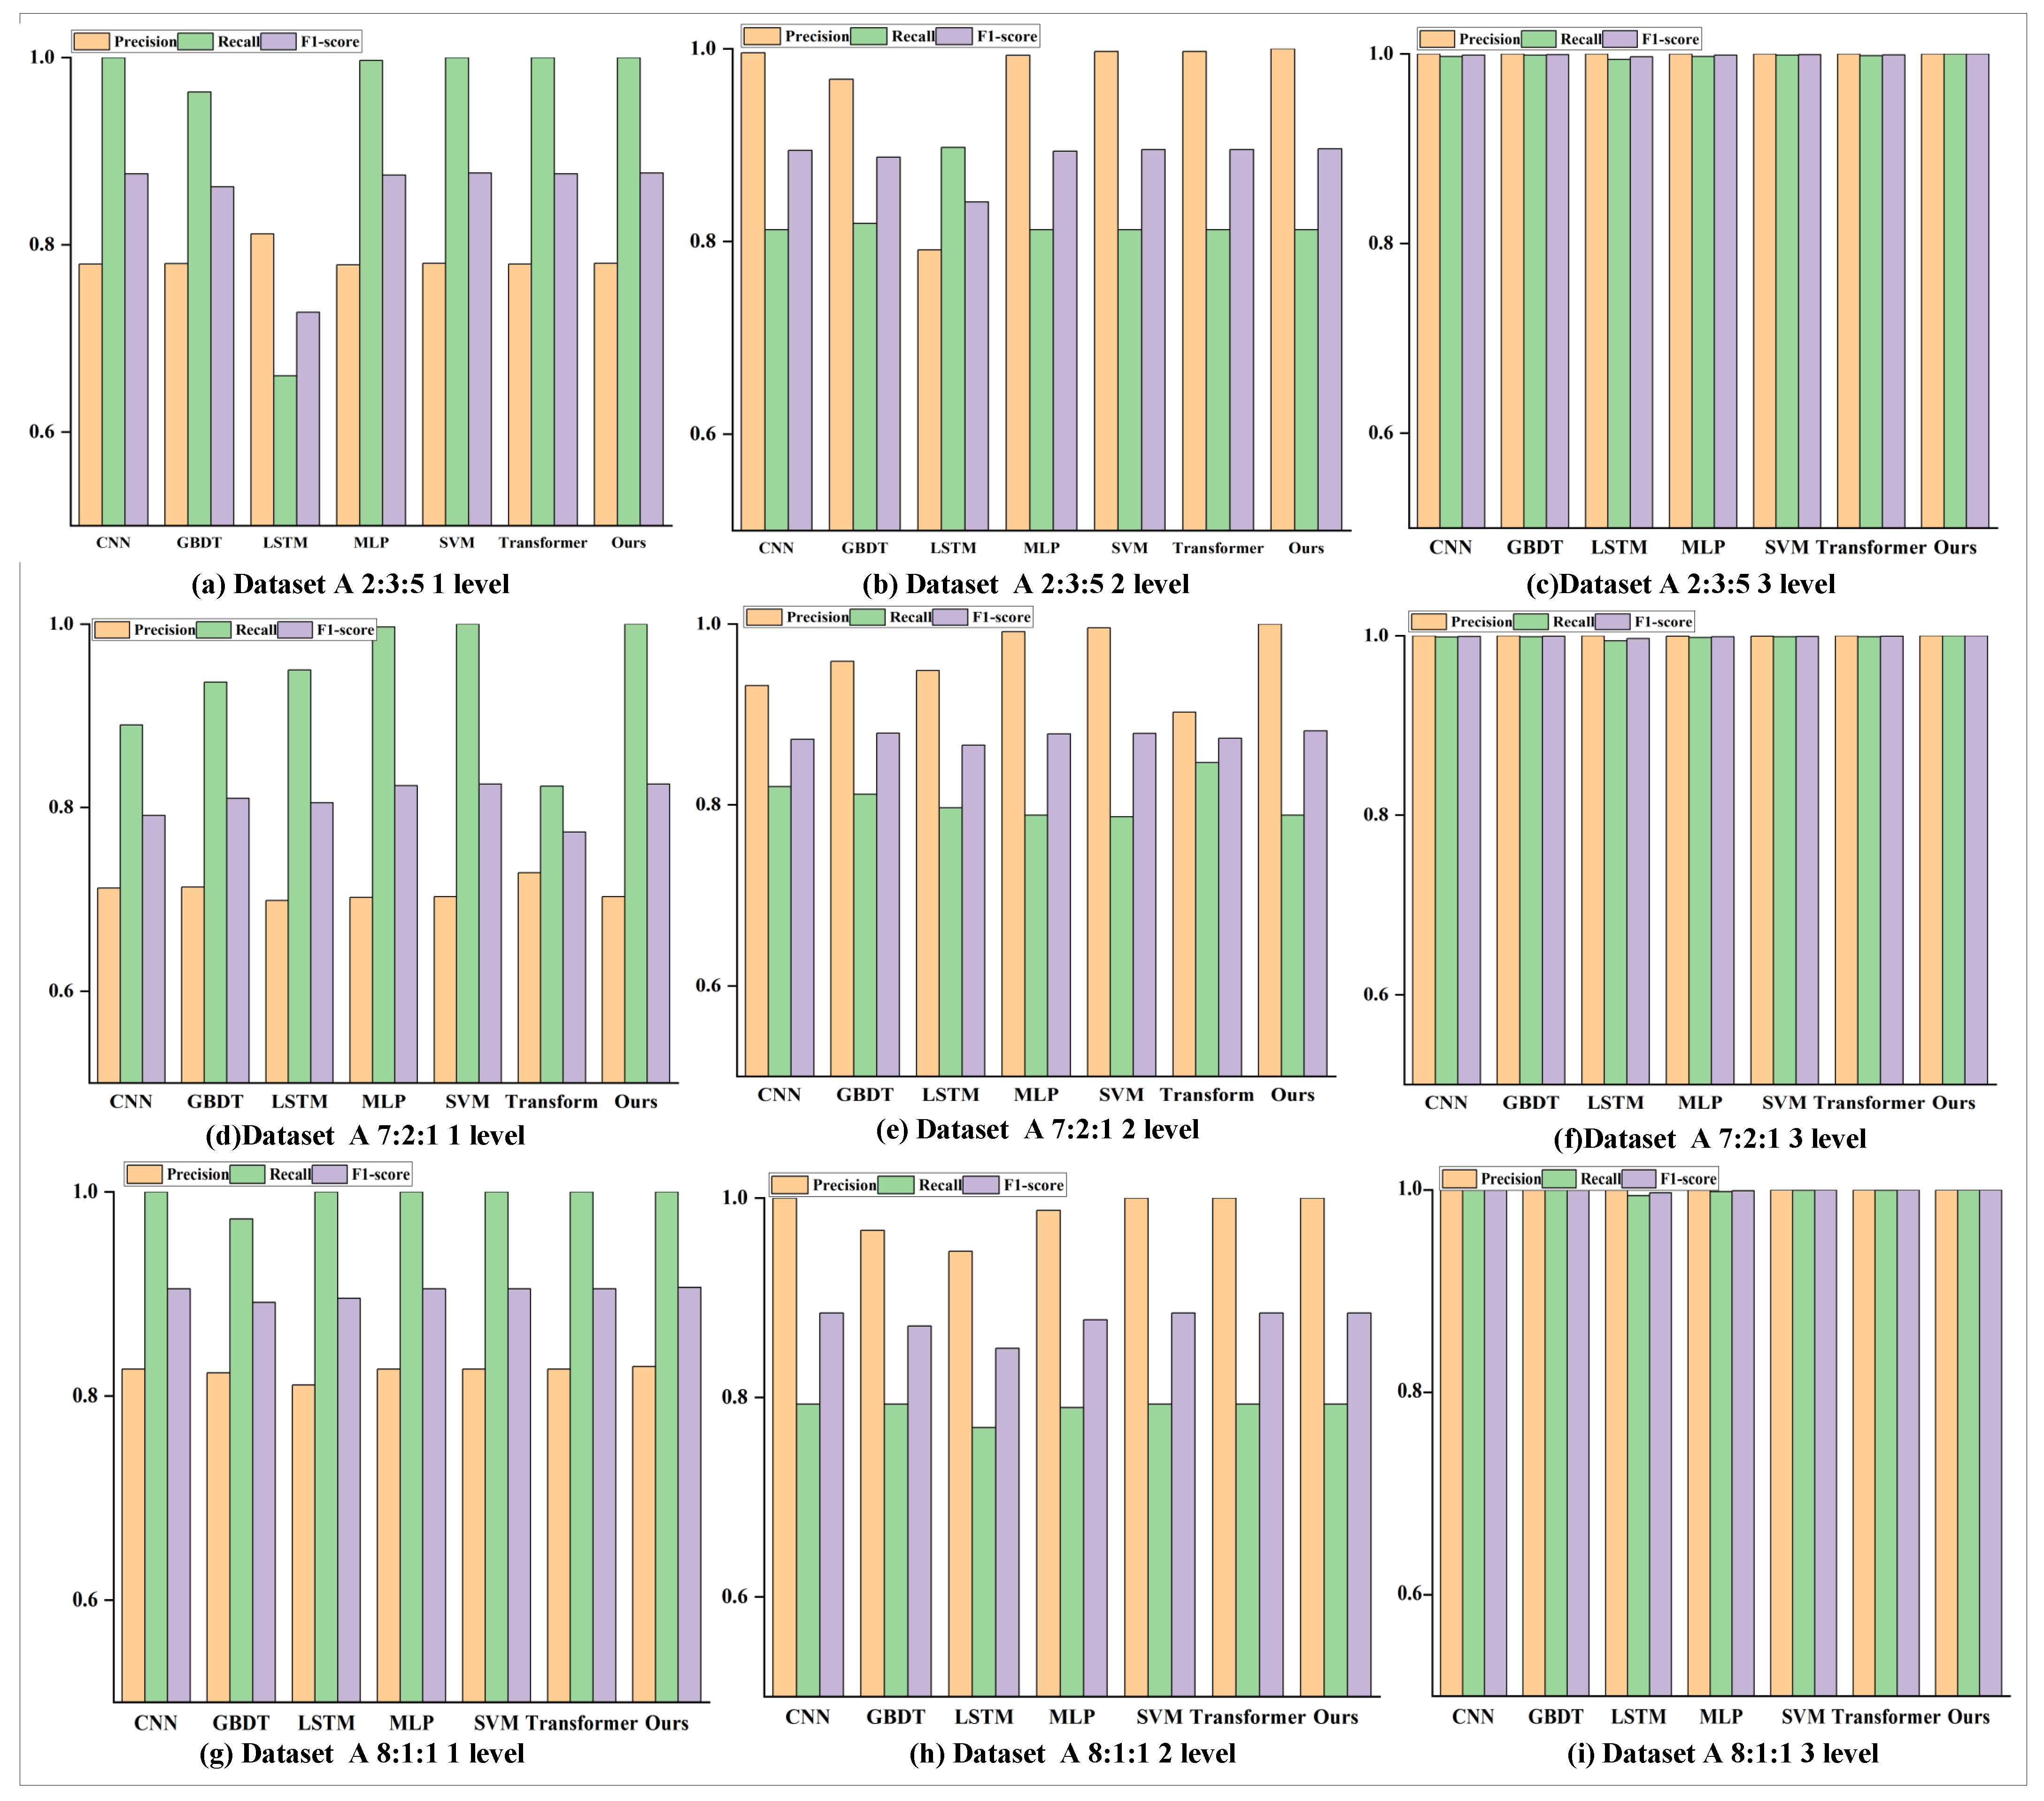
To analyze model performance across different sensitivity levels, each dataset is statistically partitioned according to the proportions of high-, medium-, and low-sensitivity data, forming three dataset types: high-sensitivity-dominated, high–medium mixed, and low-sensitivity-dominated datasets. Dataset A contains 3000 records, Dataset B contains 15,000 records, and Dataset C contains 20,000 records. Each dataset is further divided using three representative sensitivity-level partition—8:1:1, 7:2:1, and 2:3:5—corresponding to high, medium, and low sensitivity levels, respectively. In order to verify the effectiveness of the RF-HM-SICA model in sensitivity-level protection of sensitive data, experiments are conducted on Datasets A, B, and C using three representative sensitivity-level ratio schemes (8:1:1, 7:2:1, and 2:3:5). The proposed model is compared against several baseline methods, including CNN, LSTM, MLP, SVM, Transformer, and Gradient Boosted Decision Tree (GBDT). For each subset, 30% of the data is reserved as the test set, and model performance is evaluated using precision, recall, and F1-score. The results are shown in
Table 3For Dataset A, comparative experiments are conducted on CNN, GBDT, LSTM, MLP, SVM, Transformer, and RF-HM-SICA under three sensitivity-level ratio settings (8:1:1, 7:2:1, and 2:3:5).
- (1)
Results under the 8:1:1 sensitivity partition.
As shown in
Table 3 and
Figure 2, the RF-HM-SICA model achieves the best overall performance, particularly on the high-sensitivity level (L3) task, where precision and recall both reach 1.0, resulting in an F1-score of 1.0. The overall accuracy reaches 0.9793, and the weighted average F1-score reaches 0.9791, demonstrating the strong generalization capability of RF-HM-SICA under training data dominated by high-sensitivity samples. The performances of CNN and SVM are comparable, with F1-scores of 0.905 and 0.8848 on the low-sensitivity (L1) and medium-sensitivity (L2) levels, respectively, and both achieving an accuracy of 0.979, indicating that traditional deep learning models and support vector machines exhibit similar performance under relatively balanced data distributions.
In contrast, LSTM shows certain limitations. Although its recall on the low-sensitivity level (L1) reaches 1.0, this reflects an overfitting tendency toward minority classes.
- (2)
Results under the 7:2:1 sensitivity partition.
Under the 7:2:1 sensitivity-level distribution, MLP achieves the highest F1-score (0.8237) on the low-sensitivity level (L1), while RF-HM-SICA attains the best performance on the medium-sensitivity level (L2), with an F1-score of 0.8816. These results indicate that when the proportion of high-sensitivity samples (L3) in the training set is slightly reduced, fully connected neural networks and ensemble learning-based models are still able to maintain stable performance.
In contrast, the Transformer model exhibits relatively weaker performance on the low-sensitivity level (L1), with an F1-score of 0.7731, which is lower than that of other models. This degradation can be attributed to the difficulty of the self-attention mechanism to effectively capture feature correlations under moderate-scale datasets.
- (3)
Results under the 2:3:5 sensitivity partition.
Under the 2:3:5 sensitivity-level distribution, RF-HM-SICA achieves perfect performance on the high-sensitivity level (L3), with precision, recall, and F1-score all reaching 1.0. The overall accuracy reaches 0.9437, and the weighted average F1-score reaches 0.9442, significantly outperforming other models. These results indicate that ensemble learning methods exhibit stronger noise resistance in small-sample training scenarios, demonstrating the robustness of the RF-HM-SICA model.
In contrast, the performance of LSTM degrades substantially under this setting. The recall for the low-sensitivity level (L1) drops to 0.66, and the overall accuracy decreases to 0.8983, which may be attributed to a mismatch between the long-sequence dependency modeling requirements of LSTM and the limited size of the training dataset, leading to overfitting.
Overall, the RF-HM-SICA model consistently delivers superior performance across all three sensitivity-level distributions (8:1:1, 7:2:1, and 2:3:5), highlighting the general applicability and robustness of random forest-based approaches. In particular, the model achieves perfect classification on the high-sensitivity level (L3), making it the preferred choice for this dataset scenario. When the proportion of training data is reduced from 80% to 20%, LSTM exhibits the largest performance degradation (accuracy decreasing from 0.9723 to 0.8983), whereas the accuracy fluctuation of RF-HM-SICA is only 0.0356, further validating its low sensitivity to data volume. For extreme sensitivity distributions such as 2:3:5, an ensemble strategy combining RF-HM-SICA and CNN is recommended to further enhance the generalization performance.
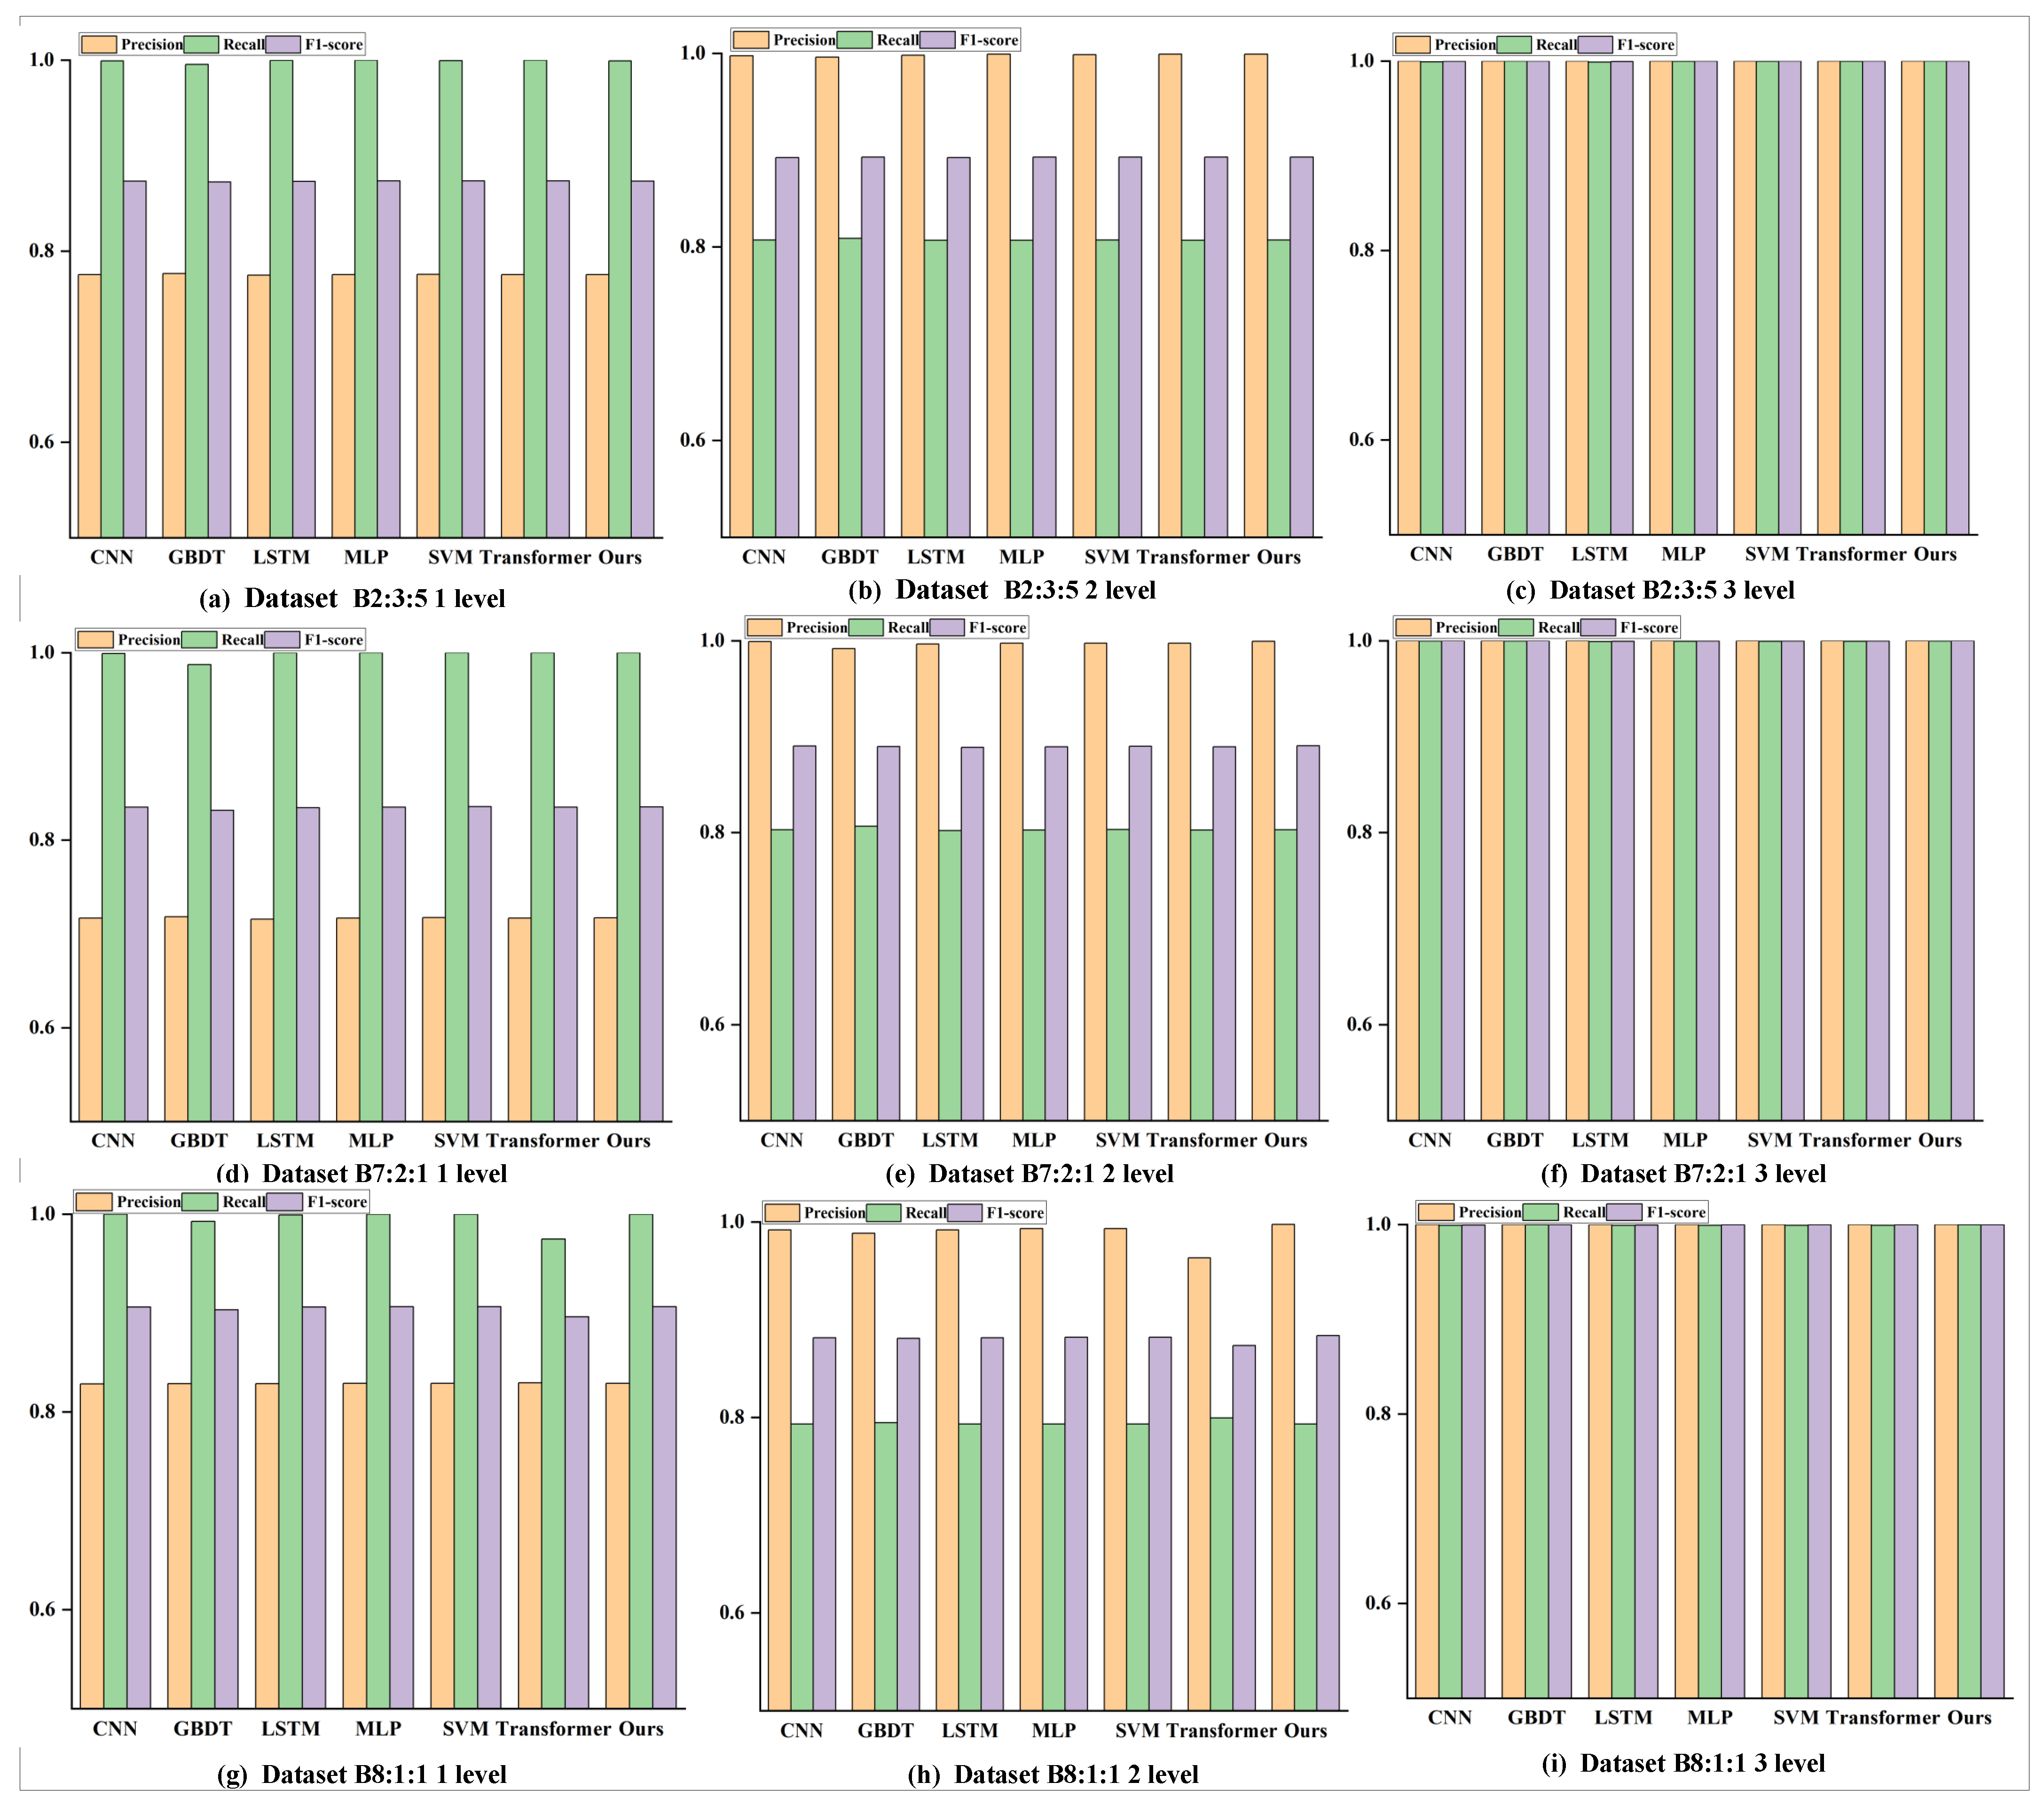
As shown in
Figure 3, on Dataset B, compared with Dataset A, the models exhibit overall improvements in F1-scores and accuracy across all sensitivity levels, particularly for the high-sensitivity level (L3), where classification performance is nearly perfect, highlighting the advantages of large-sample training. However, under the 8:1:1 distribution, the F1-scores of the low-sensitivity (L1) and medium-sensitivity (L2) levels are lower than those of other models. This may be attributed to the Transformer model, whose self-attention mechanism exhibits limited efficiency in capturing feature representations in large-scale datasets, resulting in insufficient adaptability.
As illustrated in
Figure 3, both CNN and RF-HM-SICA achieve an accuracy of 0.9605 while attaining an F1-score of 1.0 on the high-sensitivity level (L3), indicating strong discrimination capability for boundary samples under moderately balanced sensitivity distributions. Compared with Dataset A, Dataset B leads to a general reduction in misclassification rates across models, suggesting that larger datasets help alleviate overfitting, while ensemble learning models continue to exhibit clear performance advantages.
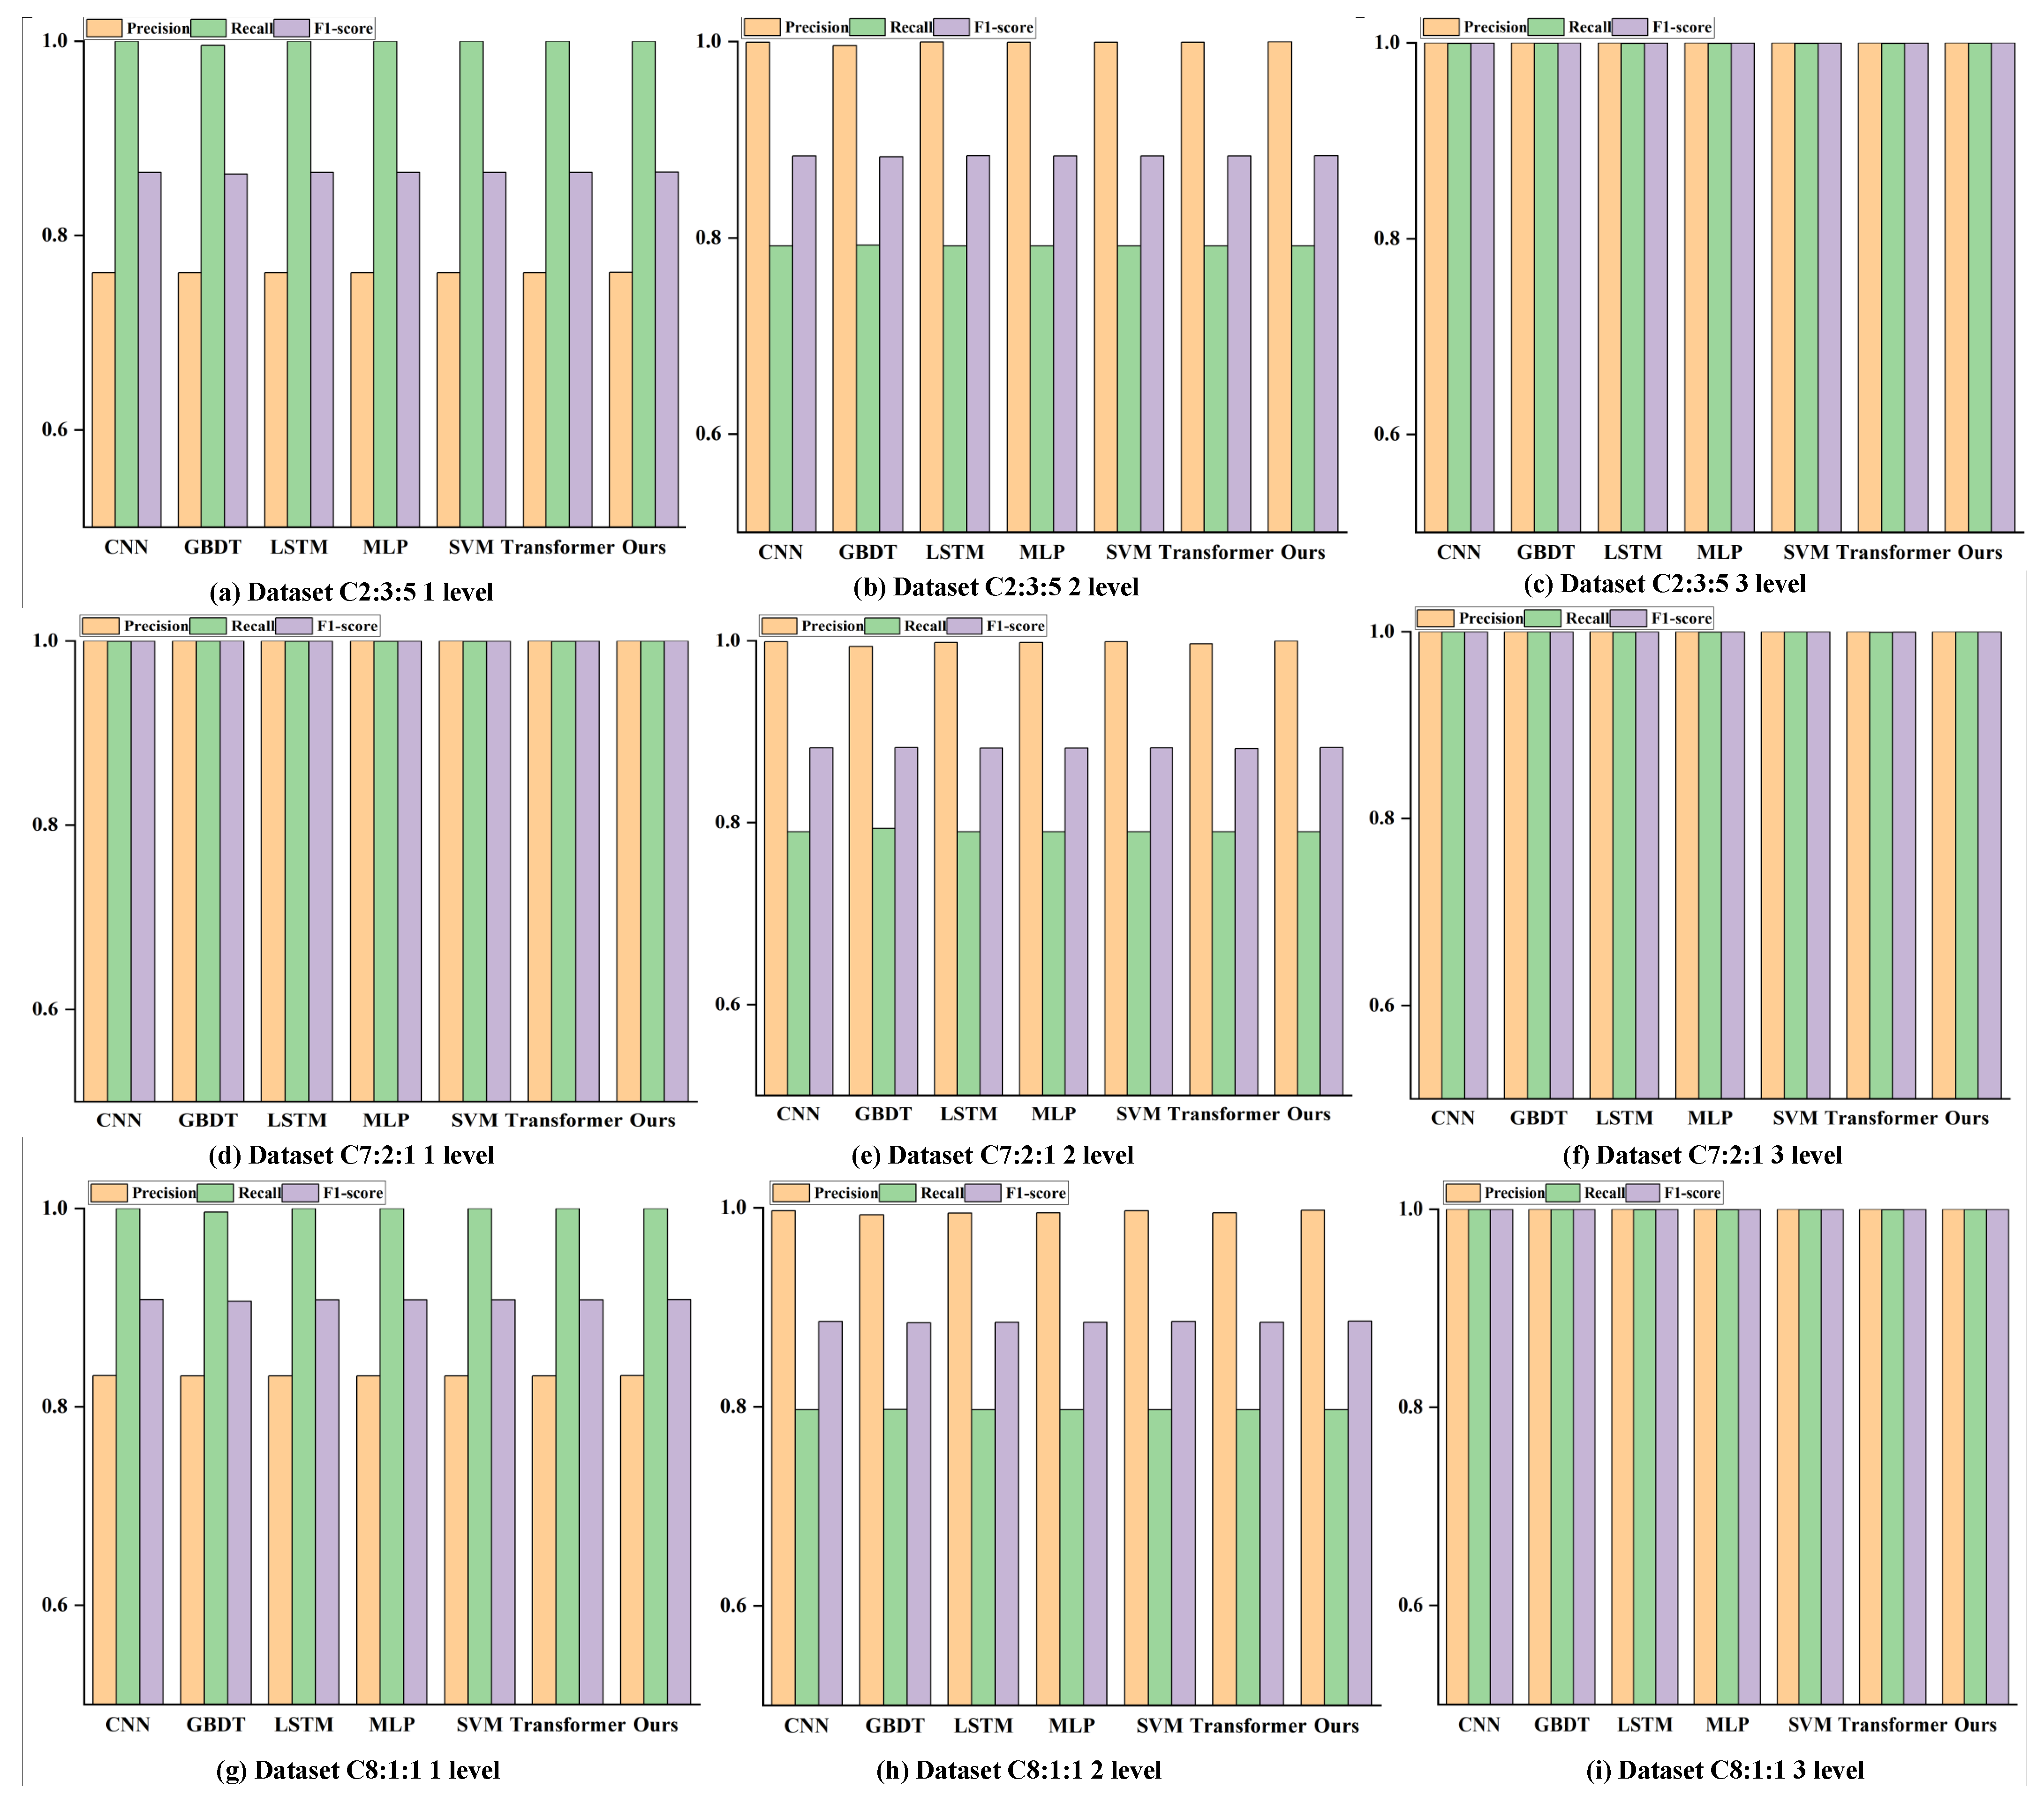
As shown in
Figure 4, on Dataset C, both RF-HM-SICA and GBDT achieve F1-scores of at least 0.86 across all sensitivity levels, further validating their robustness under large-sample conditions and confirming the sustained superiority of ensemble learning models. In addition, CNN, MLP, and other feedforward architectures achieve F1-scores exceeding 0.999 on the high-sensitivity level (L3), demonstrating that large-scale datasets effectively mitigate overfitting and enhance the convergence behavior of deep learning models.
Although the Transformer model still exhibits certain limitations under the 7:2:1 sensitivity distribution, its performance improves notably under the 8:1:1 setting, where the F1-score of the low-sensitivity level (L1) reaches 0.9077, representing a 2.6% improvement compared with Dataset A. This indicates an enhancement in the adaptability of the Transformer model.
Under the 7:2:1 distribution, both RF-HM-SICA and GBDT achieve an accuracy of 0.9577, with the F1-score of the high-sensitivity level (L3) reaching 0.9999, reflecting a 50% reduction in misclassification rate compared with the corresponding setting on Dataset B. These results demonstrate that larger datasets significantly enhance model adaptability to imbalanced data distributions.
From Dataset A to Dataset C, the average classification accuracy of RF-HM-SICA increases by 2.3%, confirming that large-scale data substantially reduce prediction errors. However, the performance advantage of ensemble learning models exhibits diminishing marginal returns as data volume increases (e.g., the accuracy of RF-HM-SICA on Dataset C improves by only 0.0005 compared with Dataset B).
Figure 3 and
Figure 4 show the results on Datasets B and C under similar partition. While overall the results appear more similar across models, a closer look reveals that for sensitivity levels 1 and 2, there are still noticeable differences. For sensitivity level 3, the results are nearly identical. This is primarily because Dataset C is larger than Datasets A and B, and the proportion of samples in sensitivity level 3 is higher, which leads to more stable predictions and smaller relative differences between models.
3.3. Analysis of Results with K-Fold Cross-Validation
After identifying RF as the most effective model among the compared algorithms, a stratified 10-fold cross-validation strategy was adopted to further evaluate its statistical reliability and stability, thereby mitigating the potential bias caused by a single random data split. Specifically, the RF model was validated on Dataset A using stratified sampling, ensuring that the distribution of the three sensitivity levels (L1, L2, and L3) in each fold remains consistent with that of the original dataset, thus alleviating the impact of class imbalance on performance evaluation. The final results are reported as the average values over the 10 folds, which ensures stable and consistent model performance across different data partitions and demonstrates the robustness and statistical reliability of the proposed method.
As shown in
Table 4, the proposed method achieves consistently high F1-scores across different data partition ratios (8:1:1, 7:2:1, and 2:3:5), with near-perfect performance on the L3 category, indicating its strong discriminative capability for highly sensitive data. Although the precision of the L1 category exhibits slight fluctuations (ranging from 0.7178 to 0.8396), the recall remains close to 1 across all settings, suggesting that the model maintains a high detection capability while preserving balanced overall performance.
3.4. Summary and Discussion
(1) Performance differences across sensitivity levels: Significant differences are observed among L1, L2, and L3. In particular, L3 (high sensitivity) samples contain distinctive high-risk attributes (e.g., identification information, biometric data, and payment accounts), which lead to substantially different entropy characteristics compared to L1 and L2. Moreover, in datasets A, B, and C, L3 generally has a relatively larger number of samples, which facilitates model learning. In addition, L3 is defined by clear decision boundaries (e.g., presence of any high-risk attribute or multiple financial attributes), making it easier to distinguish from other classes. (2) Near-perfect performance for L3: L3 samples are characterized by the presence of at least one high-sensitivity attribute, which creates highly distinguishable patterns in the feature space. Attributes such as identification documents, biometrics, and payment accounts introduce strong separability due to their higher information entropy and strong correlation with the L3 label. As a result, across all datasets and partition settings, most models consistently achieve near-perfect accuracy, precision, and F1-scores for L3. (3) Performance degradation under certain class partitions: We observe that L2 (medium sensitivity) is the most challenging class. It represents a narrow boundary condition (e.g., the presence of exactly one financial attribute without high-risk attributes), which leads to overlap with L1 in the feature space. Furthermore, deep learning models (CNN, LSTM, Transformer) show slight performance degradation compared to tree-based models. This is mainly due to the following reasons: the feature dimension is relatively low (only 7 primary categories), limiting the advantages of deep architectures; tree-based models are better suited to capture discrete and rule-based decision boundaries; class imbalance may cause deep models to overfit dominant patterns (especially L3). Due to class imbalance, models tend to bias toward the majority class (L3), occasionally misclassifying L1/L2 samples as L3, which is reflected in lower recall for minority classes. To further support these findings, we have incorporated confusion matrix analysis and feature importance analysis in the revised manuscript.
In summary, the RF-HM-SICA model demonstrates high stability, strong generalization capability, and the effective protection of boundary samples across varying dataset sizes and sensitivity level distributions, making it particularly well-suited to complex and imbalanced data environments encountered in civil aviation passenger sensitive information classification and grading tasks.
4. Conclusions and Future Work
By integrating information entropy-based measurement with random forest (RF) classification, this study constructs a unified sensitive information measurement and grading method, termed RF-HM-SICA, to effectively address data heterogeneity. Experimental results across multiple datasets demonstrate that RF-HM-SICA outperforms CNN, LSTM, MLP, SVM, Transformer, and GBDT in sensitivity classification tasks. In particular, the recognition accuracy and precision for high-sensitivity data approach 1.0 across datasets of different scales, while RF-HM-SICA exhibits the lowest misclassification rate among all compared models.
Despite the promising performance achieved in this study, several limitations still exist in terms of dataset scale, network structure, and application scope. The current models are trained on datasets of limited scale. Future work will investigate deeper network architectures, improved attention mechanisms, and multi-granularity feature fusion strategies to further enhance classification performance. The current experiments are limited to civil aviation passenger data. Although the proposed entropy-based feature engineering and sensitivity classification framework have potential general applicability, future work will validate the proposed approach on cross-domain datasets and explore domain adaptation techniques.
Furthermore, RF-HM-SICA shows high stability, strong generalization capability, and the effective protection of boundary samples under varying data volumes and sensitivity-level distributions. These characteristics make it especially suitable for the complex, imbalanced, and heterogeneous data environments encountered in civil aviation passenger sensitive data classification and grading. The accurate identification and hierarchical measurement of civil aviation passenger sensitive data provided by RF-HM-SICA establish a solid foundation for subsequent secure data sharing and privacy protection mechanisms.