Article

Symmetry and Skewness in Weibull Modeling: Optimal Grouping for Parameter Estimation in Fertilizer Granule Strength

by
Wojciech Przystupa
1,
Paweł Kurasiński
1,* and
Norbert Leszczyński
2
1
Department of Applied Mathematics and Computer Science, University of Life Sciences in Lublin, Głęboka 28, 20-612 Lublin, Poland
2
Department of Agricultural, Forestry and Transport Machinery, University of Life Sciences in Lublin, Głęboka 28, 20-612 Lublin, Poland
*
Author to whom correspondence should be addressed.
Symmetry 2025, 17(9), 1566; https://doi.org/10.3390/sym17091566
Submission received: 12 August 2025 / Revised: 2 September 2025 / Accepted: 16 September 2025 / Published: 18 September 2025
(This article belongs to the Section Mathematics)

Abstract

This study investigates Weibull distribution modeling for data under grouped observations. Two data grouping methods (equal-width and optimal) were compared for estimating parameters of the Weibull distribution using maximum likelihood estimation (MLE) in each case. Methodologically, our contribution is twofold: First, we derive the correct Fisher information matrix for grouped data in the two-parameter Weibull and use it to compute optimal interval boundaries. Second, we derive maximum likelihood estimators for data grouped under these optimal intervals. The fit of the assumed distributions was evaluated using chi-squared goodness-of-fit tests. We also calculated Asymptotic Relative Efficiency (ARE) to compare the precision of parameter estimates across different grouping approaches. Optimal boundaries yielded systematically higher ARE than equal-width grouping in 100% of comparisons for the shape parameter c . Gains for the scale parameter b were smaller and occurred in about 62% of cases. Optimal grouping also produced generally higher chi-squared ( χ 2 ) goodness-of-fit p-values than equal-width grouping, indicating a better fit. From a symmetry standpoint, the Weibull distribution is inherently asymmetric, with the degree of asymmetry governed by the shape parameter c . We show that the choice of grouping affects the estimate of c and, thus, the inferred skewness, further explaining why optimally designed intervals yield both higher precision and a more faithful representation of failure behavior.

1. Introduction

The Weibull distribution [1,2] is widely used in statistical analyses due to its versatility and flexibility in modeling a variety of phenomena. It is particularly commonly applied in reliability analysis [3,4,5,6,7,8,9] and material strength testing [10,11,12,13,14,15,16,17]. Weibull distribution is also commonly used in the wind energy sector in order to assess wind resources and model wind speed [18,19,20].
Grouping of observations is used both for estimating parameters of the distribution [5,6,21,22,23] and in statistical hypothesis testing problems [3,10,11,24]. Until now, grouping has normally referred to dividing the range of the random variable into intervals of constant width, constant probability, or asymptotically best intervals. The first two types of data grouping both fall within the published literature [25,26].
The literature [27,28,29,30,31,32,33,34] studies asymptotically efficient data grouping for parameter estimation across several distributions, mostly via MLE. Highlights include the following: Kulldorff [27] on exponential and normal distributions; MLE equations and an asymptotic variance–covariance procedure for the three-parameter Weibull [28]; optimal (equal/unequal) group boundaries for the two-parameter gamma [29], two-parameter Weibull [30], and scaled log-logistic distributions [31]; MLE for the exponentiated Fréchet with computed asymptotic variance and optimal unequal groupings [32]; and Mohan et al. [33], who estimated the two-parameter Weibull via least squares on optimally grouped samples and compared efficiency to rank regression on ungrouped data, with a numerical example.
One of the goals of this paper is to find the correct formulae for the Fisher information matrix for Weibull-grouped data. Papers [30] and [34] provide incorrect expressions for the matrix. Additionally, [34], despite having a correct optimal interval table, was constructed using incorrect formulae. This paper provides a clear derivation for the correct equations and has an optimal grouping-intervals calculator.
This study also tries to bridge a literature gap by estimating the unknown parameters b and c through the maximum likelihood estimation (MLE) method for optimally grouped intervals. These parameters thus estimated are contrasted with equally spaced interval parameters. To the best of our knowledge, no earlier study has been conducted on estimating Weibull distribution parameters using the MLE method based on optimally grouped data. In earlier studies, the Weibull distribution had often been generated using fixed values of the parameters b and c , rather than being estimated from group data. In this study, we employ real experimental data, which fit the Weibull distribution well, thus enabling more reliable analysis and practical conclusions.
Another objective of this research is to show that the choice of grouping intervals may influence the size of the chi-squared ( χ 2 ) statistic. Some researchers [18,24], during their research, compared certain distributions and chose the same intervals to come to conclusions about which distribution best represented their data, and they may have been misled by that information.
In addition, the relations developed in this research for the calculation of Weibull distribution’s unknown parameters employing the maximum likelihood estimation (MLE) technique are also valid for grouped data via sieving. This is reasonable because grouped data via sieving are often encountered in the study of granular materials, where data tend to be sorted by particle size.
Moreover, the techniques discussed in this paper are not limited to applying to the Weibull distribution. Other two-parameter distributions, such as normal, log-normal, gamma, and generalized exponential distributions, can be readily addressed by the proposed method. This flexibility increases the usefulness of these results and provides an orderly framework for further studies in many other areas of statistical modeling.
A distribution is called symmetric if there exists m such that f m δ = f m + δ ; the normal distribution is the canonical reference. The Weibull distribution has support [ 0 , ) and is fundamentally asymmetric: the shape parameter c governs departure from symmetry—for c < 3.6 it is right-skewed (positive skewness), for c 3 4 it can be nearly symmetric, and for c > 3.6 it becomes left-skewed (negative skewness). This has direct consequences for inference from grouped data: binning interacts with skewness, altering the Fisher information and the precision of the estimators b ^ , c ^ . Therefore, we adopt an optimal binning scheme to limit information loss relative to equal-width intervals.

2. Materials and Methods

2.1. Research Data

Lab tests were carried out on 21 commercial fertilizers produced by Polish manufacturers. After preliminary statistical analysis of compressive strength results, three fertilizers best fit the two-parameter Weibull distribution. These three were selected for detailed analysis: FosdarTM calcium-enriched superphosphate from Grupa Azoty Gdańskie Zakłady Nawóz Fosforowych “Fosfory” Sp. z.o.o., (Gdańsk, Poland), Salmag by Grupa Zakłady Azotowe Kędzierzyn S.A. (Kędzierzyn-Koźle, Poland), and Polifoska 8 from Grupa Azoty Zakłady Chemiczne Police S.A. (Police, Poland).
The goodness of fit was confirmed by the Anderson–Darling (AD) test, the coefficient of determination (R2), the Kolmogorov–Smirnov (K–S) test, and the Akaike Information Criterion (AIC).
Before the strength tests, the fertilizers were divided into the following particle size fractions—1–2, 2–2.5, 2.5–3.15, 3.15–3.55, 3.55–4, 4–5, and 5–6 mm—in a Multiserw Morek LPzE-2e sieve analyzer. From each fraction, approximately 100 granules were randomly sampled for tests. For each selected fertilizer, the particle size fraction that most closely fitted the Weibull distribution was used in the further statistical analysis.
The tests were conducted on a Zwick/Roell Z005 test machine using a 500 N compression load cell. The instrument is located at the University of Life Sciences in Lublin, Głęboka 28, 20-400 Lublin, Poland. The crosshead displacement rate was maintained constant at 3 mm∙min−1, and no rotation of the compression plates was applied. The tests recorded the force applied as a function of crosshead displacement up to the fracture of the granule. The break point, corresponding to a sudden drop of the force–displacement curve, was automatically identified using the testXpert II (V3.5) software (Zwick).
The test procedure is fully detailed in [35,36].
Data analysis and visualization were performed using the Google Colab Researcher environment. The code was written in Python version 3.11.11 using the following libraries: SymPy, NumPy, pandas, matplotlib, and SciPy (see Supplementary Materials for the full code).

2.2. The Weibull Distribution for Ungrouped Data

The Weibull distribution represents a widely applied statistical model in the interpretation of experimental data. Its probability density function can be described by the following formula:
f x ; b , c = c b x b c 1 exp x b c ,       x 0 ,
where b > 0 is the scale parameter and c > 0 is the shape parameter.
The Weibull distribution is given by
F x ; b , c = 1 exp x b c ,     x 0 .
To obtain the maximum likelihood estimators (MLEs) of the parameters of the Weibull distribution from ungrouped data in Python, one can simply use the built-in function scipy.stats.weibull_min.fit, which returns the MLEs of the shape and scale parameters.
The asymptotic variance–covariance matrix for the maximum likelihood parameters is found by inverting the Fisher information matrix. For the two-parameter Weibull with θ = b , c T , the Fisher information matrix I ( θ ) is given by [37]
I b b = n c 2 b 2 ,
I b c = I c b = n b γ 1 0.422784 n b ,
I c c = n c 2 π 2 6 + γ 1 2 1.823680 n c 2 ,
where γ = 0.57721 is the Euler–Mascheroni constant.
Finally, the asymptotic variance–covariance matrix is
As Var θ ^ Var ( b ^ ) Cov ( b , c ^ ^ ) Cov ( b , ^ c ^ ) Var ( c ^ ) = V b b V b c V b c V c c = 1 n 1.1087 b 2 c 2 0.2570 b 0.2570 b 0.6079 c 2

2.3. Weibull Distribution for Grouped Data

Suppose we have N independent observations of a random variable X that has a Weibull distribution with a cumulative distribution function given by (2). These observations are divided into a finite number k of disjoint groups, assigning to the i -th group those values that belong to the interval t i 1 , t i . Let us denote by 0 = t 0 < t 1 < < t k = the boundaries of these groups, and by n i the number of observations in the i -th interval.
The probability P i that an observation x i of the random variable X falls into the given interval t i 1 , t i can be computed from the following expression:
P i = P t i 1 X < t i = F t i ; b , c F t i 1 ; b , c = exp t i 1 b c exp t i b c ,
where F t 0 ; b , c = 0 and F t k ; b , c = 1 .
For notational convenience, we set z i = t i b c , and then
P i = exp z i 1 exp z i ,
In the case of grouped data, the likelihood function L takes a polynomial form [23,38] and can be expressed as follows:
L = C i = 1 k P i n i ,
where C = N ! i = 1 k n i ! ,   i = 1 k n i = N ,   and i = 1 k P i = 1 , and its logarithm can be expressed as follows:
ln L = ln C + i = 1 k n i ln P i .
To obtain the maximum likelihood estimators (MLEs) of the Weibull distribution parameters from grouped data, we numerically maximize the log-likelihood function defined in (10), using the scipy.optimize.minimize function from the SciPy library.

2.3.1. Fisher Information Matrix and Covariance Matrix for Grouped Data

In the literature, formulae for the elements of the Fisher information matrix for grouped data from the Weibull distribution can be found; however, some of these formulae are incorrect [30,34]. Therefore, in this work, the correct formulae are derived.
Since the expressions for the second partial derivatives of the logarithm of the likelihood function are very complex, a well-known relationship proposed by Kendall and Stuart [39] was used to determine the elements of the Fisher information matrix for grouped data.
E 2 ln L θ i θ j = E l n L θ i l n L θ j ,
where E denotes expected value, and θᵢ and θⱼ are model parameters.
So, for grouped data, the elements of the Fisher information matrix can be expressed as follows [25]:
I i j G = N n = 1 k 1 P n P n θ i P n θ j ,
where
  • P n is the probability that an observation falls into the n-th interval;
  • θᵢ and θⱼ are model parameters;
  • k is the number of intervals;
  • N is the number of total observations.
For the Weibull distribution, we have
P i b = c b z i 1 exp ( z i 1 ) z i exp ( z i ) ,
P i c = 1 c z i exp ( z i ) l n ( z i ) z i 1 exp ( z i 1 ) l n ( z i 1 ) .
Therefore, we obtain
I b b G = N c b 2 z 1 exp z 1 2 1 exp z 1 + i = 2 k 1 z i 1 exp z i 1 z i exp z i 2 exp z i 1 exp z i + z k 1 exp z k 1 2 exp z k 1 ,
I c c G = N c 2 z 1 exp z 1 ln ( z 1 ) 2 1 exp z 1 + i = 2 k 1 z i exp z i ln ( z i ) z i 1 exp z i 1 ln ( z i 1 ) 2 exp z i 1 exp z i + z k 1 exp z k 1 ln ( z k 1 ) 2 exp z k 1
I b c G = N b z 1 exp z 1 z 1 exp z 1 ln ( z 1 ) 1 exp z 1 + i = 2 k 1 z i 1 exp z i 1 z i exp z i z i exp z i ln ( z i ) z i 1 exp z i 1 ln ( z i 1 ) exp z i 1 exp z i z k 1 2 exp z k 1 ln ( z k 1 ) ,
To simplify the notation, let us introduce the following notations:
For ( i = 2 , 3 , , k 1 ) , we define
A i = z i 1 exp z i 1 z i exp z i ,
B i = z i exp z i ln z i z i 1 exp z i 1 ln z i 1 ,
Additionally, the boundary terms are given by
A 1 = z 1 exp z 1 ,   B 1 = z 1 exp z 1 ln z 1 ,   A k = z k 1 exp z k 1 ,   B k = z k 1 exp z k 1 ln z k 1 ,
Now, the Fisher information matrix of the MLEs is given by
I b ^ G , c ^ G = I b b G I b c G I b c G I c c G ,
where I b b G = N c b 2 i = 1 k A i 2 P i ,   I b c G = N b i = 1 k A i B i P i ,   I c c G = N c 2 i = 1 k B i 2 P i .
The asymptotic variance–covariance matrix of the MLEs is given by
Var ( b ^ G , c ^ G ) = I b b G I b c G I b c G I c c G 1 V b b G V b c G V b c G V c c G
where Var b ^ G = V b b G and Var c ^ G = V c c G represent the asymptotic variances of the estimators b ^ G and c ^ G , respectively.

2.3.2. Optimal Grouping

Here, we introduce one method of finding optimal grouping intervals for the Weibull distribution using D-optimality, which is aimed at maximizing the determinant of the Fisher information matrix [40]. Step-by-step computation of optimal interval boundaries is depicted with numerical tools that can be found in Python. Independent sample code that allows optimization is provided as well (Appendix B).
The optimal intervals occur from maximizing the following expression:
Φ = I b b G I c c G I b c G 2 ,
where Φ represents the determinant of the Fisher information matrix for grouped samples. Notably, parameters such as the scale parameter b , shape parameter c , and sample size n do not influence the optimal interval selection, as they can be factored out of the formula. Thus, the problem reduces to a numerical optimization task independent of these parameters. The optimal boundaries are listed in Appendix C, Table A1, and the corresponding probabilities in Table A2.
By maximizing the determinant of the Fisher information matrix, we are minimizing the uncertainty of the parameter estimates, thereby meaning our results are more precise. That is, we are minimizing the covariance matrix of the estimators, hence reducing the range of potential values around the true parameters

2.3.3. Construction of Optimal Intervals from Raw Data

Now, to calculate class boundaries t i for grouped Weibull data, we employ the theoretical probabilities P i associated with each interval, which are commonly generated from the CDF of the Weibull distribution. The probability of an observation in a given interval is
P i = exp z i 1 exp z i ,
where z i = t i b c . The probabilities P i for a fixed number of intervals k are provided in Table A2. The corresponding values of z i used in this computation can be found in Table A1.
For a given total sample size N, the expected number of observations in each group is calculated as n ^ i = N P i . Since these theoretical counts are likely to be non-integers, they must be converted into integer counts such that their summation will be precisely equal to N, and the resulting allocation will remain as close to the theoretical proportions as possible.
In order to accomplish this, each predicted count n i ^ is first rounded down to the next integer, producing initial group sizes n i . The sum of these is then compared with N, and the number of units left to be distributed, r, is determined as N minus the sum of rounded-down group sizes. Then, for every group, the fractional part of n i ^ (i.e., n i ^ n i ) is determined. Then, the r units of measure are distributed to those groups with the largest fractional parts by adding 1 to the respective n i . Thus, n 1 , n 2 , , n k are made equal to N and give quite a good approximation to the theoretical distribution of the observations. After calculating the integer group sizes, the empirical class boundaries t 1 < t 2 < < t k 1 are established so that each interval t i 1 , t i contains exactly n i observations in the ordered dataset. The dividing point for two neighboring intervals is determined as the arithmetic average of two successive data values: the last one in one group and the first one in the next one. In case the last group size n k equals zero, the upper bound of the second-last interval, t k 1 , is determined using the following formula: t k 1 = z k 1 1 / c ^ b ^ , where b ^ and c ^ are the MLEs calculated from the raw (ungrouped) data (computed using scipy.stats.weibull_min.fit, with floc = 0). These boundaries reconcile the empirical grouping into agreement with the theoretical structure, making the definitions of the intervals and the observed data distribution consistent.
Next, using the maximum likelihood estimation (MLE) method described in Section 2.3, the estimators for the scale and shape parameters,   b ^ G and c ^ G , are calculated. Finally, the precise interval boundaries are obtained by inverting the standardization formula, according to t i = z i 1 / c ^ G b ^ G .

2.3.4. Construction of Equal Intervals from Raw Data

In order to have equal-length intervals from the original data, first we find the greatest integer less than or equal to the minimum value, along with the lowest integer greater than or equal to the maximum value; then, this interval is divided into equal-length intervals. After these intervals are formed, the lower boundary of the first interval is fixed at 0 and the upper boundary of the last interval as infinity.

2.4. Analysis of Estimation Accuracy

This section is dedicated to the methods of measuring the performance of the Weibull distribution parameter estimators. The confidence intervals and the Asymptotic Relative Efficiency (ARE) were calculated using the variances of the estimators outlined in the previous subsections. The analysis was performed considering different data grouping methods and number of classes.

2.4.1. Asymptotic Relative Efficiency (ARE)

Asymptotic Relative Efficiency (ARE) was used to evaluate the relative loss of precision in the estimation of the Weibull distribution parameters caused by data grouping. The ARE was defined as the ratio of the variance in the parameter estimator using raw data to the variance calculated from grouped data. The ARE was computed separately for the scale parameter b and the shape parameter c , as follows:
ARE b = Var b ^ Var b ^ G ,
ARE c = Var c ^ Var c ^ G ,
where Var b ^ and Var c ^ are the variances of the estimators of the scale parameter b and shape parameter c calculated from raw data, respectively, as determined using Equation (6). Similarly, Var b ^ G and Var c ^ G are the variances calculated from grouped data using Equation (22).
The ARE was calculated for both equal-width and optimal grouping methods to compare the influence of each binning method on the accuracy of the estimates of both parameters.

2.4.2. Confidence Intervals

For ungrouped (raw) data, the approximate 100   1 α % two-sided confidence intervals for the Weibull distribution parameters b and c were calculated as follows:
b ^ ± Z α / 2 Var b ^ ,
c ^ ± Z α / 2 Var c ^ ,
where b ^ and c ^ are the maximum likelihood estimators (MLEs) of the scale and shape parameters, respectively, Var b ^ and Var c ^ are their variances, and Z α / 2 is the upper α / 2 th percentile of the standard normal distribution.
To obtain the confidence intervals for grouped data, in Formulas (27) and (28), it is sufficient to replace b ^ and c ^ with b ^ G and c ^ G , respectively.
The confidence intervals were calculated for estimators obtained using the MLE method for both ungrouped (raw) data and grouped data. With respect to grouped data, the equal-width and optimal interval groupings were evaluated for a range of classes, allowing a direct comparison of the widths of the confidence intervals and estimation accuracy, across different grouping and class options.

2.5. Chi-Squared Test

This test of goodness of fit with chi-squared was applied to ascertain the consistency between the two distributions, i.e., the empirical one and the theoretical Weibull distribution. Consider that a result with a p-value less than 0.05 stands as statistically significant. During the analysis, the standard assumption of the χ2 test was observed, namely, that the expected frequency in each class should not be less than 5. In cases where this condition was not met, the adjacent classes were combined to meet the assumption. Therefore, the number of classes used in the test was likely lower than the chosen k value. In addition, this has an impact on the degree of freedom, calculated as follows:
d f = n u m b e r   o f   c l a s s e s n u m b e r   o f   e s t i m a t e d   p a r a m e t e r s 1 .
For the Weibull distribution, since two parameters are being estimated, degrees of freedom were calculated as the number of classes minus three. In extreme cases, the process could lead to the test not being feasible to carry out. The chi-squared test was performed for equal-width and optimal interval groupings and for various class sizes in order to find the impact of the grouping method and number of intervals on the outcome of the test.
Because the χ2 test is performed on grouped data, parameters are estimated by MLE from the grouped likelihood. This satisfies the assumptions of Theorem 12.4.2 in [26]; estimating from raw data would violate them.

3. Results and Discussion

3.1. Estimation of the Parameters of the Weibull Distribution

In Table 1, for thee fertilizers (Polifoska 8, Salmag, and Superfosfat), their respective scale (b) and shape (c) parameters of the Weibull distribution, along with 95% confidence intervals, are presented. As discussed in the earlier sections, these parameter estimates were derived using the maximum likelihood method on both raw and grouped datasets, the latter grouped via optimal and equal-width binning for a range of class numbers k = 4 ,   5 , ,   11 . In confidence estimation, both parameters are reported, which helps to analyze the degree of estimation precision based on the data grouping technique and the number of classification intervals. It can be said that parameter estimates for raw data are benchmarks, and estimates based on grouped data are benchmarks for the effect of grouping on parameter estimation accuracy. This is even more true when the number of grouping intervals is large. In these cases, the resulting estimates are significantly closer to those estimated from the ungrouped raw data.
The analysis of asymptotic relative efficiency (ARE) of the scale and shape parameters of the Weibull distribution (Table 2) shows that there are considerable differences in estimation accuracy between the scale ( b ) and shape ( c ) parameters. The values of ARE close to one correspond to minimal information loss due to grouping, while lower values indicate loss of precision for estimation.
The behavior of the ARE values of scale parameter estimation was better than that of the shape parameter; in most cases, the ARE values with any method of estimation and number of classes k were close to one. The shape parameter estimation was worse than that of the scale parameter, particularly with a limited number of classes, having lower ARE values and greater information loss.
For the same number of classes, using optimal boundaries markedly improves the efficiency of estimating the shape parameter c : A R E   c G ^ is consistently higher than with equal-width grouping. For the scale parameter b , the gain is smaller and occurs in only about 62 % of comparisons, indicating that boundary optimization primarily strengthens information about c .
Also, with the increase in the number of classes, the tendency for the ARE to increase was present, but with non-monotonic character due to small oscillations with the increase in the number of intervals.

3.2. Chi-Squared Goodness-of-Fit Test for the Weibull Distribution

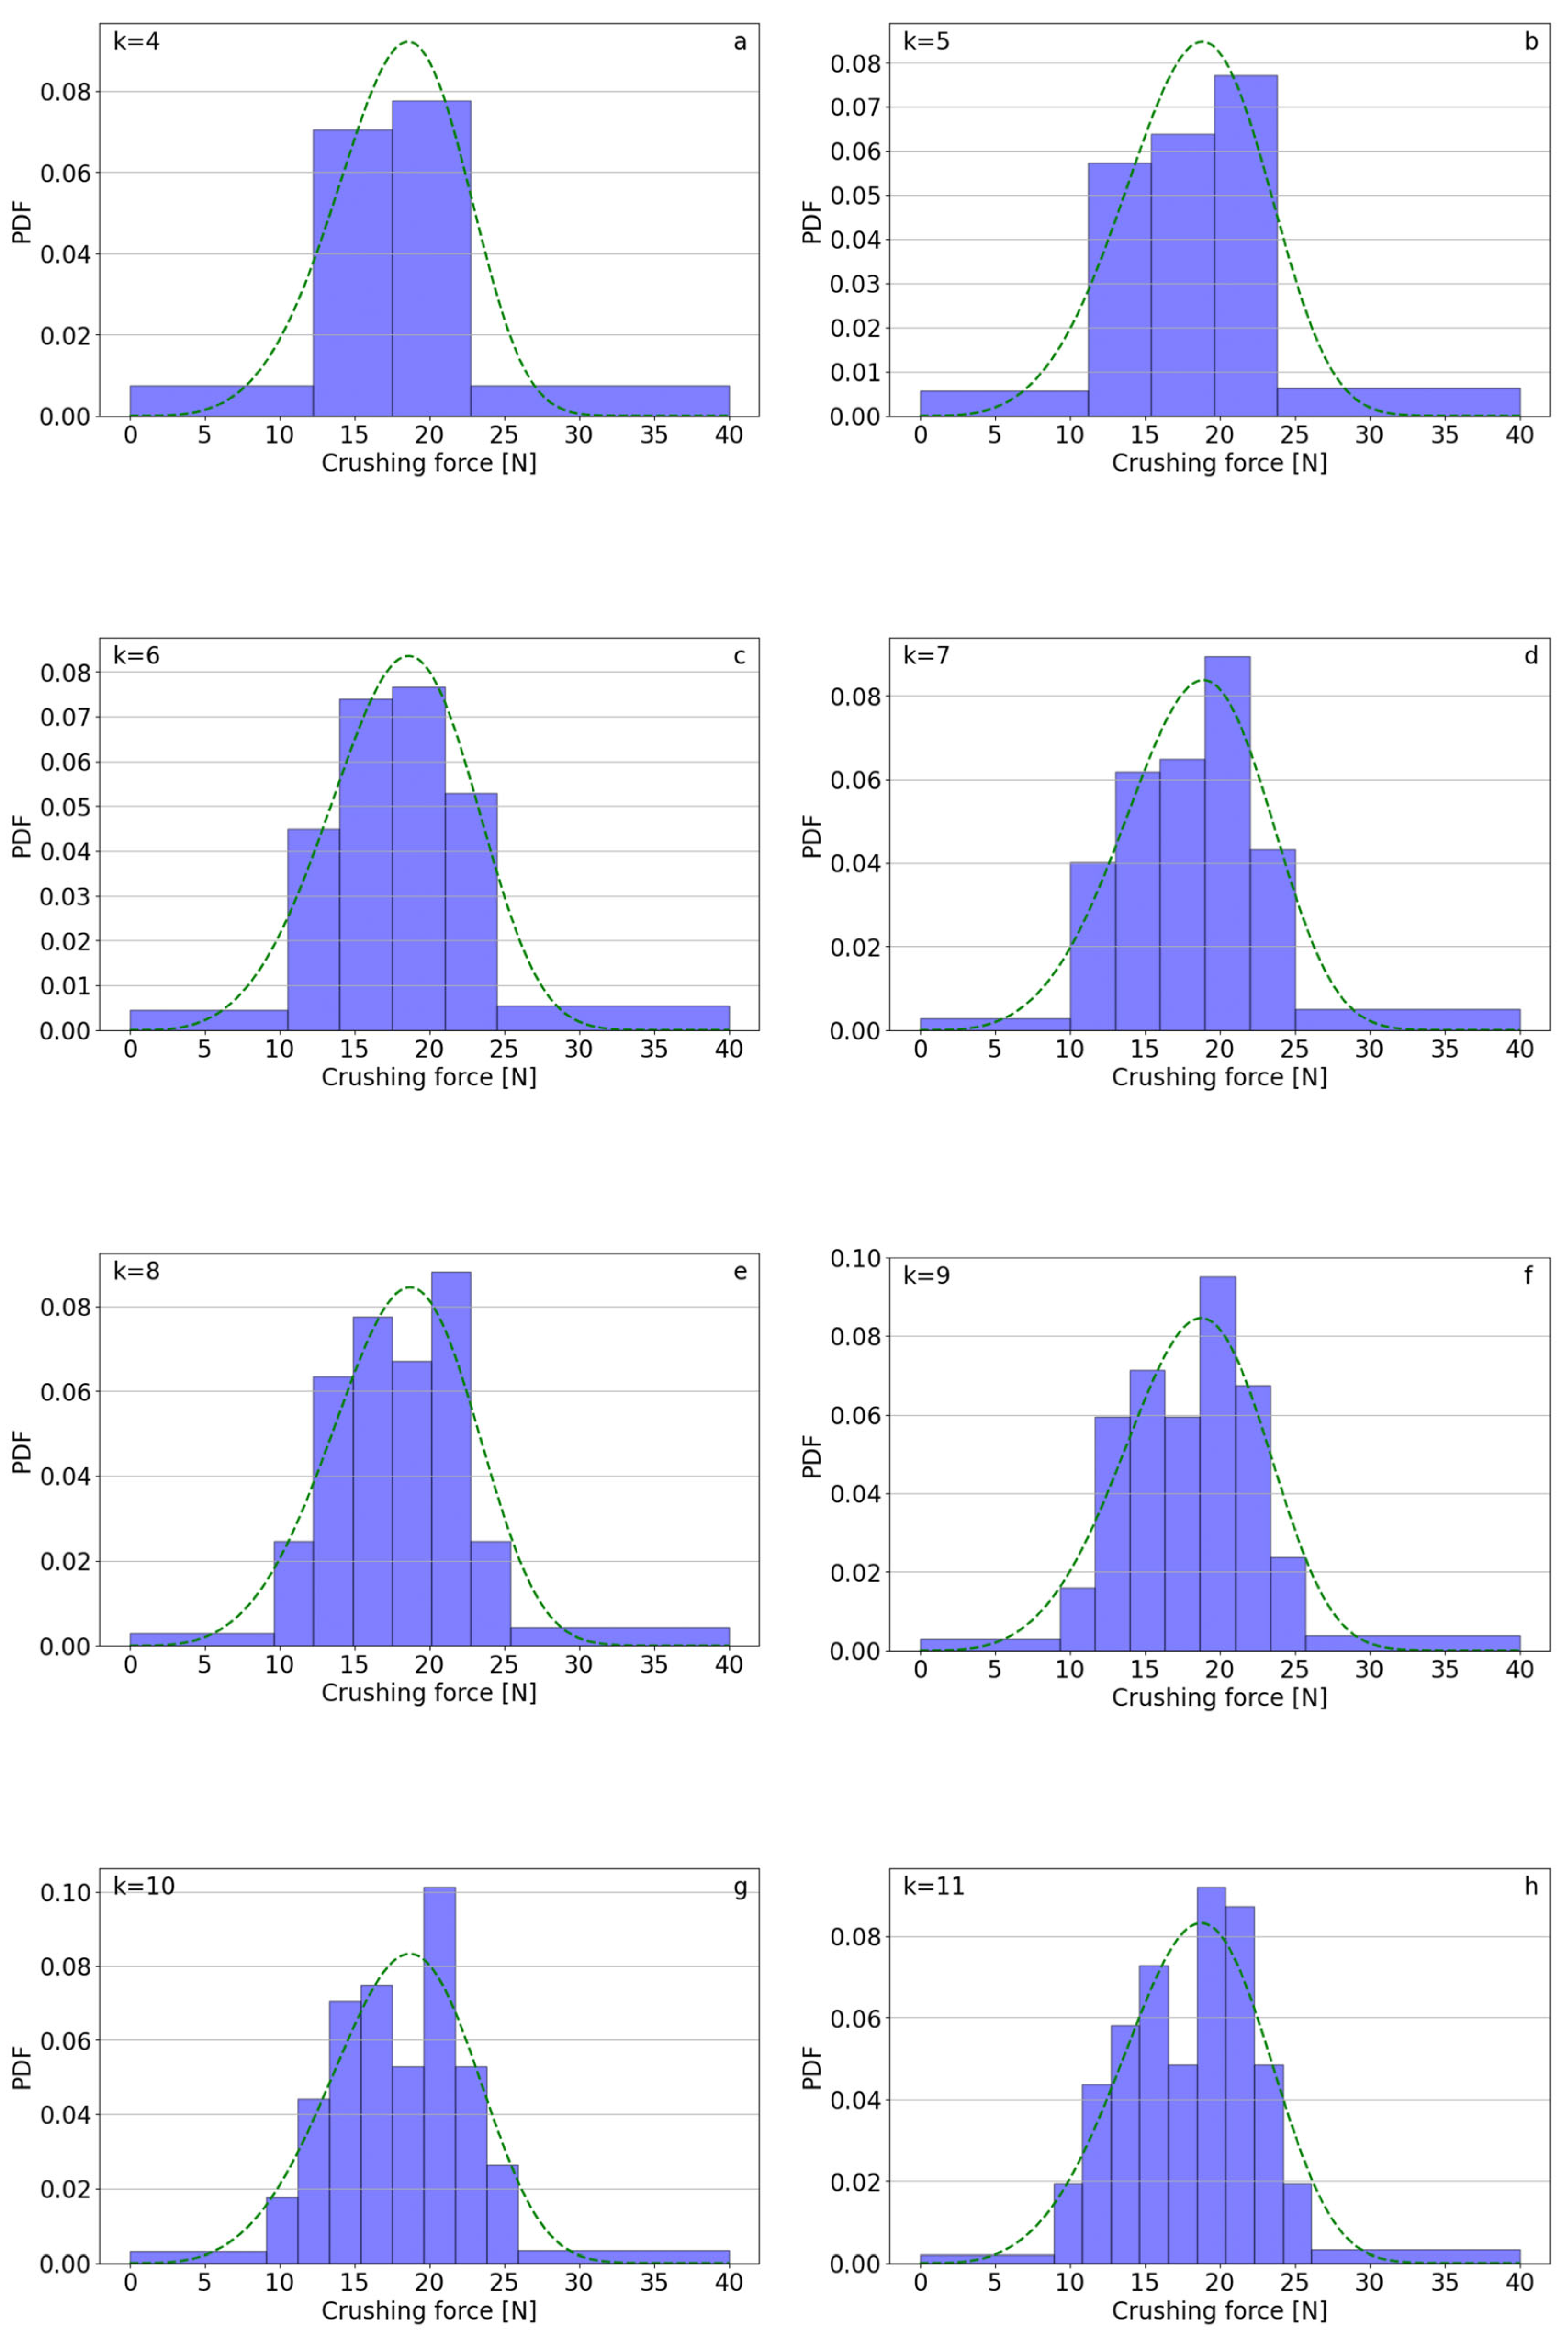
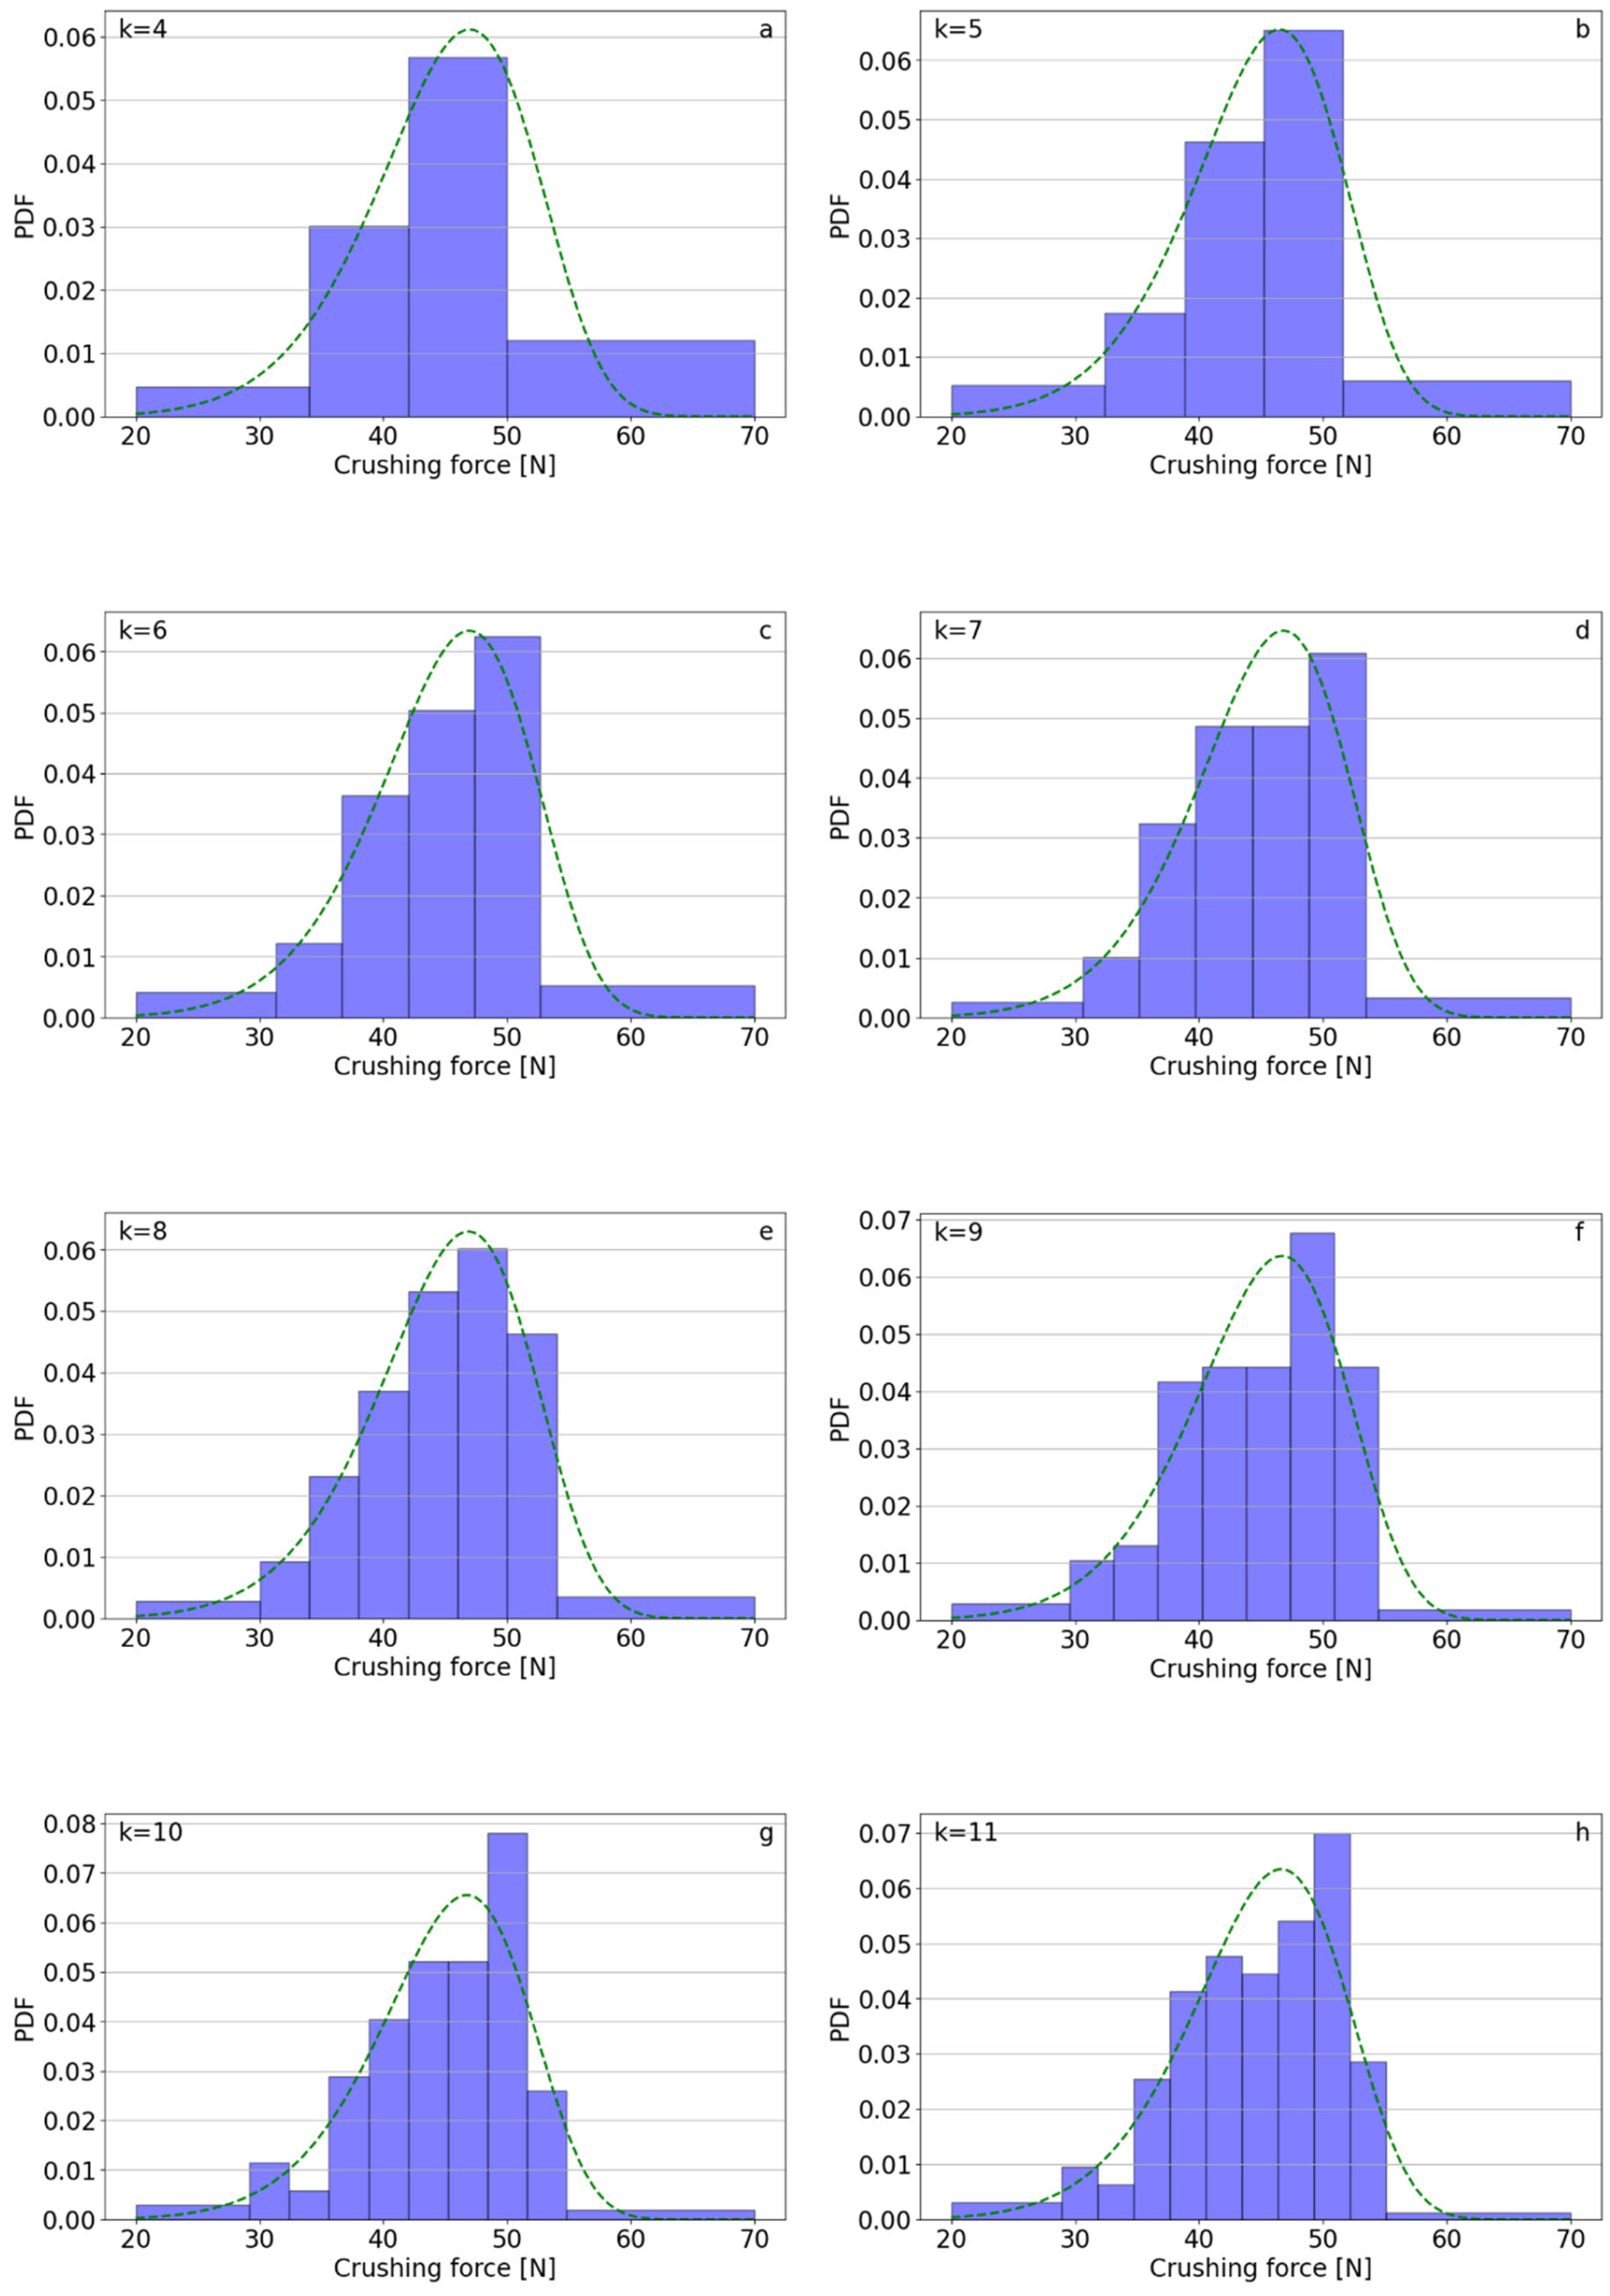
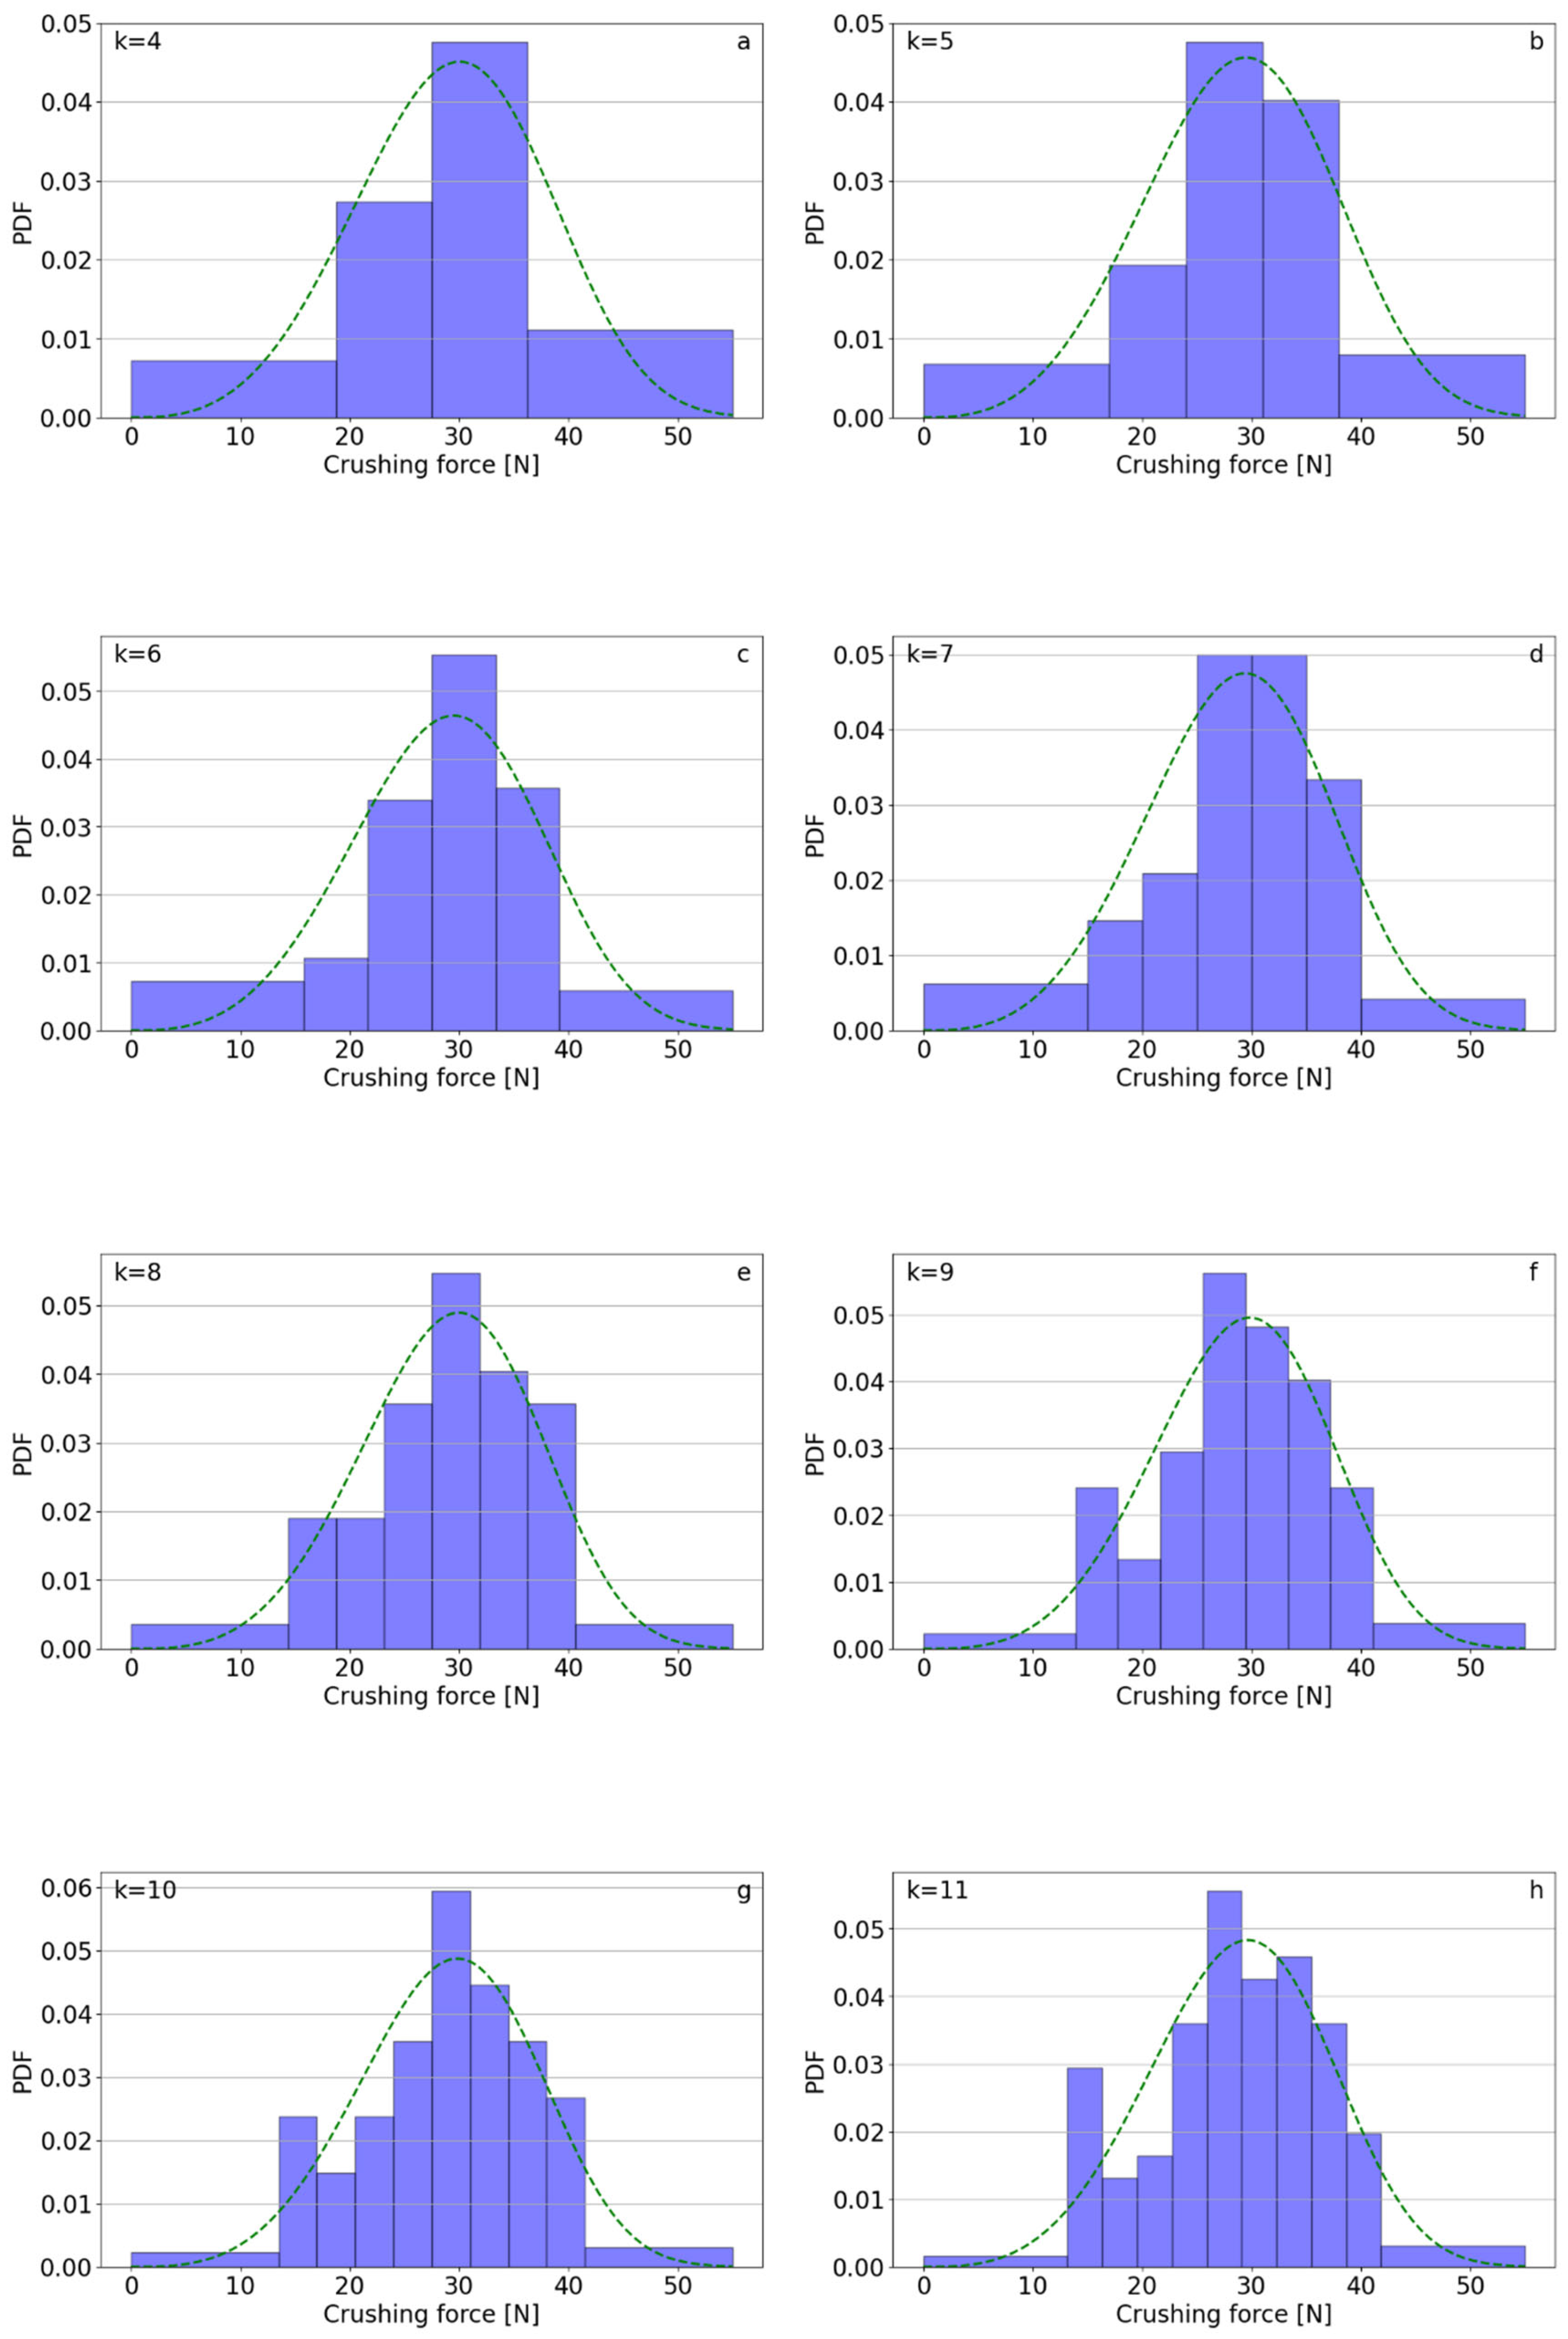
The charts (Figure 1, Figure 2, Figure 3, Figure 4, Figure 5 and Figure 6) below show data for three fertilizers, grouped using equal-width and optimal class intervals, for the number of intervals k   =   4 ,   5   ,   11 . The estimators shown in Table 1 were used to plot the density function of the Weibull distribution and to construct class intervals both equal and optimal.
The requirement of each class having an expected count of over five leads to problems in some cases (Table 3). In cases where k = 4 was the optimal grouping, there were only three classes remaining after merging intervals, which presented an issue. In these cases, since two Weibull parameters were estimated, the degrees of freedom of the model were df = 0, so performing the χ2 tests was impossible.
The test results indicate that both the grouping method and the number of classes affected the value of the χ2 statistic and its corresponding p-value. Nevertheless, no pattern was detected in the p-value in relation to k; the p-values fluctuated randomly.
For Polifoska 8, all p-values were >0.05 (range: 0.21–0.78), confirming a good Weibull fit regardless of the grouping method (Figure 1 and Figure 2). Optimal grouping sometimes yielded higher p-values (e.g., k = 8, p = 0.781), but differences versus equal-width bins did not change the χ2 tests’ conclusions.
For Salmag, the Weibull model also fitted well, with most p-values > 0.05 (Figure 3 and Figure 4). The best fit occurred with equal-width grouping at k = 8 (p = 0.965). However, for some values of k, optimal grouping produced lower p-values (e.g., k = 8, p = 0.08; k = 9, p = 0.039), suggesting potential misfit under certain grouping choices.
For Superfosfat, the fit was weakest and strongly dependent on k and the grouping method (Figure 5 and Figure 6). At low k (5–6), both methods gave statistically significant results (p < 0.05), indicating poor fit: k = 5, optimal, p = 0.038; k = 6, optimal, p = 0.03; k = 6, equal-width, p = 0.02. Only with more classes (k ≥ 7) did the test stop rejecting the model (typically p > 0.20), with the best result at k = 10 under optimal grouping (p = 0.469). Consequently, the choice of k and grouping scheme is decisive in this case.

4. Conclusions

Grouping data will usually lead to information loss, which reduces the accuracy of parameter estimation. However, some statistical analyses, such as the chi-squared test, involve grouped data. Under such circumstances, how data are grouped matters. Optimal grouping minimizes information loss, better fits the data distribution, and produces lower estimation variance and narrower confidence intervals compared to equal-width grouping, as per this research.
Because the Weibull distribution is asymmetric, binning influences the estimate of the shape parameter c and, thus, the inferred skewness; optimally designed intervals mitigate this distortion while improving precision.
The research carried out showed that both the method of data grouping and the number of classes significantly affect the results of the Weibull distribution goodness-of-fit test for experimental data. It was observed that too few or too many classes can deteriorate the quality of the fit. With few classes, there were issues with too-small expected frequencies in individual intervals, which made it impossible to use the χ2 test due to a lack of degrees of freedom.
The best results (i.e., highest p-values) were most often obtained with a moderate number of intervals (typically 6–9), and this is in line with the literature’s recommendations on the selection of class numbers. Also, the results indicate that optimal grouping more often led to higher p-values compared to equal-width grouping. The implication is that the choice of an optimal data grouping method is beneficial in improving the goodness of fit of the distribution and the validity of the Weibull model parameter estimates.
Therefore, when grouping is necessary, optimal grouping should be used.
Chi-squared test p-values are very sensitive to the number of intervals and how the data were grouped, and this can greatly influence the assessment of the fit of a distribution. To compare reliably the fit of different distributions to ungrouped data, therefore, one has to determine the optimal intervals separately for each distribution and for varying numbers of classes k and select those for which the p-value is a maximum. Only with such a strategy can p-value comparisons form a valid foundation for model fit comparison.
In [18,24], the comparison was performed on a common set of intervals for all distributions, which can benefit the model most suitable to the chosen grouping strategy rather than the one that best fits the underlying data.

Supplementary Materials

The following supporting information can be downloaded at https://www.mdpi.com/article/10.3390/sym17091566/s1.

Author Contributions

W.P. was responsible for writing the “Introduction” and “Materials and Methods” sections (excluding “Research Data”); P.K. prepared the “Results and Discussion” and “Conclusions” sections; N.L. contributed the “Research Data” section. All authors have read and agreed to the published version of the manuscript.

Funding

This research received no external funding.

Data Availability Statement

The data presented in this study are available in Appendix A of this article. Our Python code is included in the Supplementary Files.

Conflicts of Interest

The authors declare no conflicts of interest.

Appendix A

Appendix A.1. Superfosfat, Fraction 1–2 mm, Data

10.8, 11.3, 13.2, 14.0, 14.1, 14.4, 14.5, 14.6, 14.6, 15.3, 15.6, 17.0, 18.6, 18.9, 19.2, 19.9, 20.5, 22.1, 22.1, 22.5, 23.0, 23.2, 23.3, 23.5, 24.1, 24.6, 25.3, 25.4, 25.7, 25.7, 25.9, 26.7, 26.7, 27.0, 27.3, 27.4, 27.5, 27.5, 27.6, 27.9, 28.0, 28.2, 28.4, 28.5, 28.7, 28.8, 28.8, 28.8, 29.3, 29.8, 30.0, 30.1, 30.2, 30.4, 30.5, 30.7, 31.1, 31.1, 31.7, 32.1, 32.1, 32.4, 32.5, 32.9, 33.1, 33.1, 33.2, 33.8, 34.1, 34.2, 34.3, 34.5, 34.7, 34.7, 35.3, 35.7, 36.9, 37.0, 37.0, 37.1, 37.2, 37.2, 37.5, 38.1, 38.3, 38.3, 38.8, 39.2, 39.2, 39.3, 40.4, 41.3, 42.0, 42.5, 44.2, 44.4

Appendix A.2. Polifoska 8, Fraction 1–2 mm, Data

7.46, 8.15, 9.02, 10.1, 10.2, 10.6, 10.9, 11.7, 12, 12.2, 12.3, 12.3, 12.3, 12.4, 12.4, 12.8, 13.2, 13.4, 13.5, 13.6, 13.6, 13.8, 14, 14.3, 14.4, 14.4, 14.4, 14.7, 14.9, 15, 15, 15, 15.2, 15.5, 15.7, 15.9, 16, 16, 16.1, 16.2, 16.5, 16.5, 16.6, 16.7, 17.1, 17.1, 17.2, 17.2, 17.2, 17.3, 17.5, 18.1, 18.5, 18.6, 18.6, 18.7, 18.9, 19, 19.2, 19.3, 19.5, 19.5, 19.6, 19.6, 19.6, 19.8, 19.9, 19.9, 19.9, 20.3, 20.3, 20.4, 20.4, 20.5, 20.6, 20.6, 20.7, 20.7, 20.8, 21, 21, 21.2, 21.4, 21.4, 21.6, 21.9, 22, 22.1, 22.2, 22.4, 22.4, 22.6, 22.6, 22.7, 22.8, 23.3, 23.7, 23.8, 23.9, 24.9, 25.3, 25.5, 25.7, 27.1, 27.4, 27.5, 27.7, 27.9

Appendix A.3. Salmag, Fraction 2.5–3.15 mm, Data

26.5, 27, 28.8, 30.7, 31.3, 31.7, 32.3, 34.4, 35.5, 35.7, 36.1, 36.2, 37, 37.1, 37.2, 37.3, 37.7, 38.5, 38.7, 38.8, 38.9, 39.2, 39.5, 39.5, 39.8, 40, 40, 40, 40.5, 40.6, 40.7, 41, 41.4, 42, 42.2, 42.2, 42.3, 42.3, 42.3, 42.4, 42.6, 42.8, 43, 43.1, 43.7, 43.8, 43.9, 44, 44.4, 44.7, 45.1, 45.2, 45.3, 45.5, 45.6, 45.6, 46, 46, 46.6, 46.6, 46.8, 47.1, 47.4, 47.6, 47.6, 47.9, 48, 48.1, 48.3, 48.7, 48.8, 48.8, 48.9, 49, 49.1, 49.4, 49.5, 49.6, 49.6, 49.7, 49.7, 49.8, 50.2, 50.2, 50.2, 50.3, 50.4, 50.6, 50.9, 50.9, 51, 51.1, 51.1, 51.1, 51.1, 51.3, 52.1, 52.2, 52.7, 52.9, 53, 53.1, 54.2, 54.2, 54.3, 54.9, 56.3, 57.5

Appendix B

The following is code that is designed to be easily adapted to other two-parameter probability distributions, provided that the Fisher information matrix for a selected distribution is known. The code, as demonstrated below, symbolically calculates the objective function Φ, which is determined by the determinant of the Fisher information matrix for the Weibull distribution, and then performs a numerical optimization to determine optimal bin boundaries for binning data.
In order to obtain the code for some other distribution, one only has to redefine expressions for the terms A, B, and P that are corresponding elements of the Fisher information matrix. The system allows one and the same optimization algorithm to be used for a wide range of distributions, such as gamma, normal, or log-normal distributions, with minor adaptation.
import sympy as sp
import numpy as np
from scipy.optimize import minimize
# Number of interval
k = 5
z = sp.symbols(f’z1:{k + 1}’, real = True, positive = True)
# Define expressions for A, B, P
A = [-z [0] * sp.exp(-z [0])]
for i in range(1, k − 1):
A.append(z[i − 1] * sp.exp(-z[i − 1])–z[i] * sp.exp(-z[i]))
A.append(z[k − 2] * sp.exp(-z[k − 2]))
B = [z [0] * sp.exp(-z [0]) * sp.ln(z [0])]
for i in range(1, k − 1):
B.append(z[i] * sp.exp(-z[i]) * sp.ln(z[i])–z[i − 1] * sp.exp(-z[i − 1]) * sp.ln(z[i − 1]))
B.append(-z[k − 2] * sp.exp(-z[k − 2]) * sp.ln(z[k − 2]))
P = [1 − sp.exp(-z [0])]
for i in range(1, k − 1):
P.append(sp.exp(-z[i − 1]) − sp.exp(-z[i]))
P.append(sp.exp(-z[k − 2]))
# Fisher information matrix determinant
phi = (sum(A[i]**2/P[i] for i in range(k)) *
sum(B[i]**2/P[i] for i in range(k)) -
sum(A[i] * B[i]/P[i] for i in range(k))**2)
phi_func = sp.lambdify(z, phi, modules = “numpy”)
def objective(z_vals):
return -phi_func(*z_vals)
z0 = np.linspace(0.1,10, k)
bounds = [(0.0001, None)] * k
constraints = {‘type’: ‘ineq’, ‘fun’: lambda x: np.diff(x)—0.0001}
methods = [“SLSQP”, “trust-constr”]
results = {}
for method in methods:
res = minimize(objective, z0, bounds = bounds, constraints = constraints, method = method)
results[method] = res
print(f”\nMethod: {method}”)
print(“Status:”, res.success)
for i, val in enumerate(res.x[:−1], 1):
print(f”z_{i} = {val:.6f}”)
print(“phi =“, -res.fun)
best = max(results, key = lambda m: -results[m].fun if results[m].success else -np.inf)
print(f”\nBest method: {best}”)
for i, val in enumerate(results[best].x[:−1], 1):
print(f”z_{i} = {val:.6f}”)
print(“Maximum phi:”, -results[best].fun)

Appendix C

By maximizing the determinant of Fisher’s information matrix with grouped data, we derive optimal boundary points of grouping intervals in the form z i = t i b c , which are presented in Table A1. Table A2 presents suitable optimal probabilities of observation occurrence in an interval.
The values of the Relative Asymptotic Information (A) are also presented in Table A1 and are defined as A = I F G I F .
Table A1. Optimal boundary points of intervals of grouping in the form of z i = t i b c for simultaneous estimation of two parameters of Weibull’s distribution and suitable values of Relative Asymptotic Information (A).
iZ1Z2Z3Z4Z5Z6Z7Z8Z9Z10Z11Z12Z13Z14A
3
4
5
6
7
8
9
10
11
12
13
14
15
0.2731
0.2109
0.1044
0.0774
0.0501
0.0377
0.0275
0.0214
0.0165
0.0132
0.0106
0.0087
0.0072
2.6067
1.3998
0.5122
0.3653
0.2321
0.1737
0.1269
0.0723
0.0769
0.0617
0.0500
0.0412
0.0344

3.4137
1.9592
1.2266
0.6759
0.4836
0.3432
0.1378
0.2042
0.1636
0.1326
0.1093
0.0912


3.8608
2.5735
1.7189
1.1904
0.7828
0.5770
0.4347
0.3431
0.2755
0.2259
0.1878


4.4106
2.9924
2.2039
1.6027
1.1806
0.8561
0.6512
0.5105
0.4122
0.3392


4.7952
3.4271
2.5710
1.9933
1.5307
1.1785
0.9023
0.7109
0.5736


5.2048
3.7672
2.9273
2.3149
1.8562
1.4808
1.1788
0.9393


5.5258
4.1025
3.2261
2.6155
2.1406
1.7598
1.4436


5.8478
4.3866
3.5095
2.8812
2.4009
2.0130


6.1215
4.6581
3.7612
3.1276
2.6402


6.3843
4.9016
3.9988
3.3568


6.6212
5.1306
4.2193


6.8437
5.3470


7.0565
0.4079
0.5572
0.6836
0.7571
0.8109
0.8480
0.8756
0.8963
0.9123
0.9248
0.9349
0.9431
0.9498
Table A2. Optimal frequencies with simultaneous estimation of two parameters of Weibull’s distribution.
iP1P2P3P4P5P6P7P8P9P10P11P12P13P14P15
3
4
5
6
7
8
9
10
11
12
13
14
15
0.2390
0.1901
0.0992
0.0745
0.0489
0.0370
0.0271
0.0211
0.0164
0.0131
0.0105
0.0087
0.0072
0.6872
0.5628
0.3016
0.2315
0.1582
0.1225
0.0921
0.0729
0.0577
0.0468
0.0383
0.0317
0.0265
0.0738
0.2142
0.4582
0.4012
0.2842
0.2240
0.1713
0.1378
0.1107
0.0910
0.0754
0.0632
0.0535

0.0329
0.1199
0.2164
0.3294
0.3125
0.2524
0.2066
0.1679
0.1395
0.1165
0.0986
0.0840


0.0211
0.0641
0.1291
0.1937
0.2558
0.2545
0.2215
0.1882
0.1592
0.1357
0.1165


0.0121
0.0419
0.0779
0.1250
0.1708
0.2095
0.2137
0.1947
0.1710
0.1488


0.0083
0.0270
0.0533
0.0827
0.1175
0.1515
0.1779
0.1835
0.1726


0.0055
0.0191
0.0370
0.0591
0.0831
0.1099
0.1356
0.1548


0.0040
0.0136
0.0273
0.0432
0.0615
0.0815
0.1025


0.0029
0.0102
0.0204
0.0329
0.0468
0.0622


0.0022
0.0078
0.0158
0.0255
0.0365


0.0017
0.0061
0.0124
0.0203


0.0013
0.0048
0.0099


0.0011
0.0039


0.0009

References

  1. Weibull, W. A statistical distribution function of wide applicability. J. Appl. Mech. 1951, 18, 293–297. [Google Scholar] [CrossRef]
  2. Rinne, H. The Weibull Distribution: A Handbook; CRC Press: Boca Raton, FL, USA, 2009. [Google Scholar]
  3. Mudholkar, G.S.; Srivastava, D.K.; Freimer, M. The exponentiated Weibull family: A reanalysis of the bus-motor-failure data. Technometrics 1995, 37, 436–445. [Google Scholar] [CrossRef]
  4. Ambrožič, M.; Vidovič, K. Reliability of the Weibull analysis of the strength of construction materials. J. Mater. Sci. 2007, 42, 9645–9653. [Google Scholar] [CrossRef]
  5. Cheng, C.; Chen, J.; Li, Z. A new algorithm for maximum likelihood estimation with progressive type-I interval censored data. Commun. Stat. Simul. Comput. 2010, 39, 750–766. [Google Scholar] [CrossRef]
  6. Ng, H.K.T.; Wang, Z. Statistical estimation for parameters of Weibull distribution based on progressively type-I interval censored sample. J. Stat. Comput. Simul. 2009, 79, 145–159. [Google Scholar] [CrossRef]
  7. Barraza-Contreras, J.M.; Piña-Monarrez, M.R.; Torres-Villaseñor, R.C. Reliability by Using Weibull Distribution Based on Vibration Fatigue Damage. Appl. Sci. 2023, 13, 10291. [Google Scholar] [CrossRef]
  8. Turygin, Y.; Bozek, P.; Abaramov, I.; Nikitin, Y. Reliability determination and diagnostics of a mechatronic system. Adv. Sci. Technol. Res. J. 2018, 12, 274–290. [Google Scholar] [CrossRef] [PubMed]
  9. Młynarski, S.; Pilch, R.; Smolnik, M.; Szybka, J. Analysis of the Modernised Railway Vehicle Component with Regard to Reliability and Operational Safety. Adv. Sci. Technol. Res. J. 2024, 18, 21–32. [Google Scholar] [CrossRef]
  10. Fedorov, A.; Gulayeva, Y.K. Strength statistics for porous alumina. Powder Technol. 2019, 343, 783–791. [Google Scholar] [CrossRef]
  11. Tumidajski, P.J.; Fiore, L.; Khodabocus, T.; Lachemi, M.; Pari, R. Comparison of Weibull and normal distributions for compressive strengths. Can. J. Civ. Eng. 2006, 33, 1287–1292. [Google Scholar] [CrossRef]
  12. Subero-Couroyer, C.; Ghadiri, M.; Brunard, N.; Kolenda, F. Weibull analysis of quasi-static crushing strength of catalyst particles. Chem. Eng. Res. Des. 2003, 81, 953–962. [Google Scholar] [CrossRef]
  13. Datsiou, K.D.; Overend, M. Weibull parameter estimation and goodness-of-fit for glass strength data. Struct. Saf. 2018, 73, 29–41. [Google Scholar] [CrossRef]
  14. Quinn, J.B.; Quinn, G.D. A practical and systematic review of Weibull statistics for reporting strengths of dental materials. Dent. Mater. 2010, 26, 135–147. [Google Scholar] [CrossRef] [PubMed]
  15. Wu, D.F.; Zhou, J.C.; Li, Y.D. Distribution of the mechanical strength of solid catalysts. Chem. Eng. Res. Des. 2006, 84, 1152–1157. [Google Scholar] [CrossRef]
  16. Rozenblat, Y.; Portnikov, D.; Levy, A.; Kalman, H.; Aman, S.; Tomas, J. Strength distribution of particles under compression. Powder Technol. 2011, 208, 215–224. [Google Scholar] [CrossRef]
  17. Gorjan, L.; Vidovič, K. Bend strength of alumina ceramics: A comparison of Weibull statistics with other statistics based on very large experimental data set. Ceram. Int. 2012, 32, 1221–1227. [Google Scholar] [CrossRef]
  18. Burgos-Peñaloza, J.A.; Lambert-Arista, A.A.; García-Cueto, O.R.; Santillán-Soto, N.; Valenzuela, E.; Flores-Jiménez, D.E. Comparative Analysis of Estimated Small Wind Energy Using Different Probability Distributions in a Desert City in Northwestern México. Energies 2024, 17, 3323. [Google Scholar] [CrossRef]
  19. Teimourian, H.; Abubakar, M.; Yildiz, M.; Teimourian, A. A Comparative Study on Wind Energy Assessment Distribution Models: A Case Study on Weibull Distribution. Energies 2022, 15, 5684. [Google Scholar] [CrossRef]
  20. Alsaqoor, S.; Marashli, A.; At-Tawarah, R.; Borowski, G.; Alahmer, A.; Aljabarin, N.; Beithou, N. Evaluation of Wind Energy Potential in View of the Wind Speed Parameters—A Case Study for the Southern Jordan. Adv. Sci. Technol. Res. J. 2022, 16, 275–285. [Google Scholar] [CrossRef]
  21. Zaindin, M. Parameter estimation of the modified Weibull model based on grouped and censored data. Int. J. Basic Appl. Sci. 2010, 10, 122–132. [Google Scholar]
  22. Chien, Z.; Mi, J. Statistical estimation for the scale parameter of the gamma distribution based on grouped data. Commun. Stat. Theory Methods 1998, 27, 3035–3045. [Google Scholar] [CrossRef]
  23. Cheng, K.F.; Chen, C.H. Estimation on the Weibull parameters with grouped data. Commun. Stat. Theory Methods 1988, 17, 325–341. [Google Scholar] [CrossRef]
  24. Basu, B.; Tiwari, D.; Kundu, D.; Prasad, R. Is Weibull distribution the most appropriate statistical strength distribution for brittle materials? Ceram. Int. 2009, 35, 237–246. [Google Scholar] [CrossRef]
  25. Cramér, H. Mathematical Methods of Statistics; Princeton University Press: Princeton, NJ, USA, 1951. [Google Scholar]
  26. Fisz, M. Probability Theory and Mathematical Statistics; Wiley and Sons: New York, NY, USA, 1967. [Google Scholar]
  27. Kulldorff, G. Contributions to the Theory of Estimation from Grouped and Partially Grouped Samples; Almqvist and Wiksell: Stockholm, Sweden, 1961. [Google Scholar]
  28. Archer, N.P. Maximum likelihood estimation with Weibull models when the data are grouped. Commun. Stat. Theory Methods 1982, 11, 199–207. [Google Scholar]
  29. Rosaiah, K.; Kantam, R.R.L.; Narasimham, V.L. Optimum class limits for ML estimation in 2-parameter gamma distribution from grouped data. Commun. Stat. Simul. Comput. 1991, 20, 1173–1189. [Google Scholar] [CrossRef]
  30. Rao, A.V.; Rao, A.V.D.; Narasimham, V.L. Asymptotically optimal grouping for maximum likelihood estimation of Weibull parameters. Commun. Stat. Simul. Comput. 1994, 23, 1077–1096. [Google Scholar]
  31. Kantam, R.R.L.; Rao, A.V.; Rao, G.S. Optimum group limits for estimation in scaled log-logistic distribution from a grouped data. Stat. Pap. 2005, 46, 359–377. [Google Scholar] [CrossRef]
  32. Marwa, A.A.; Zaher, H.; Elsherpieny, E.A. Optimum group limits for maximum likelihood estimation on the exponentiated Fréchet distribution based on grouped data. Br. J. Appl. Sci. Technol. 2013, 3, 1464–1480. [Google Scholar] [CrossRef]
  33. Mohan, C.R.; Rao, A.V.; Anjaneyulu, G.V.S.R. Comparison of least square estimators with rank regression estimators of Weibull distribution—A simulation study. J. Stat. 2013, 20, 1–10. [Google Scholar]
  34. Lin, C.-T.; Balakrishnan, N.; Wu, S.J.S. Planning life tests based on progressively type-I grouped censored data from the Weibull distribution. Commun. Stat. Simul. Comput. 2011, 40, 574–595. [Google Scholar] [CrossRef]
  35. Leszczyński, N.; Przystupa, W.; Nowak, J.; Rusek, P. Compression strength of superphosphate and urea granules. Przem. Chem. 2017, 96, 1963–1967. [Google Scholar]
  36. Przystupa, W.; Rusek, P.; Nowak, J. Evaluation of the strength of mineral fertilizer granules by using Weibull distribution. Przem. Chem. 2018, 97, 2124–2127. [Google Scholar]
  37. Watkins, A.J. On expectations associated with maximum likelihood estimation in the Weibull distribution. J. Ital. Stat. Soc. 1998, 7, 15–26. [Google Scholar] [CrossRef]
  38. Xiao, X.; Mukherjee, A.; Xie, M. Estimation procedures for grouped data—A comparative study. J. Appl. Stat. 2016, 43, 859–875. [Google Scholar] [CrossRef]
  39. Kendall, M.G.; Stuart, A. The Advanced Theory of Statistics; Charles Griffin and Company: London, UK, 1973; Volume 2. [Google Scholar]
  40. Chimitova, E.V.; Lemeshko, B.Y. Chi-Squared Goodness-of-Fit Tests: The Optimal Choice of Grouping Intervals. In Recent Advances in Systems, Control and Information Technology; Shakirov, R., Ed.; Springer: Cham, Switzerland, 2017; Volume 543, pp. 760–774. [Google Scholar]
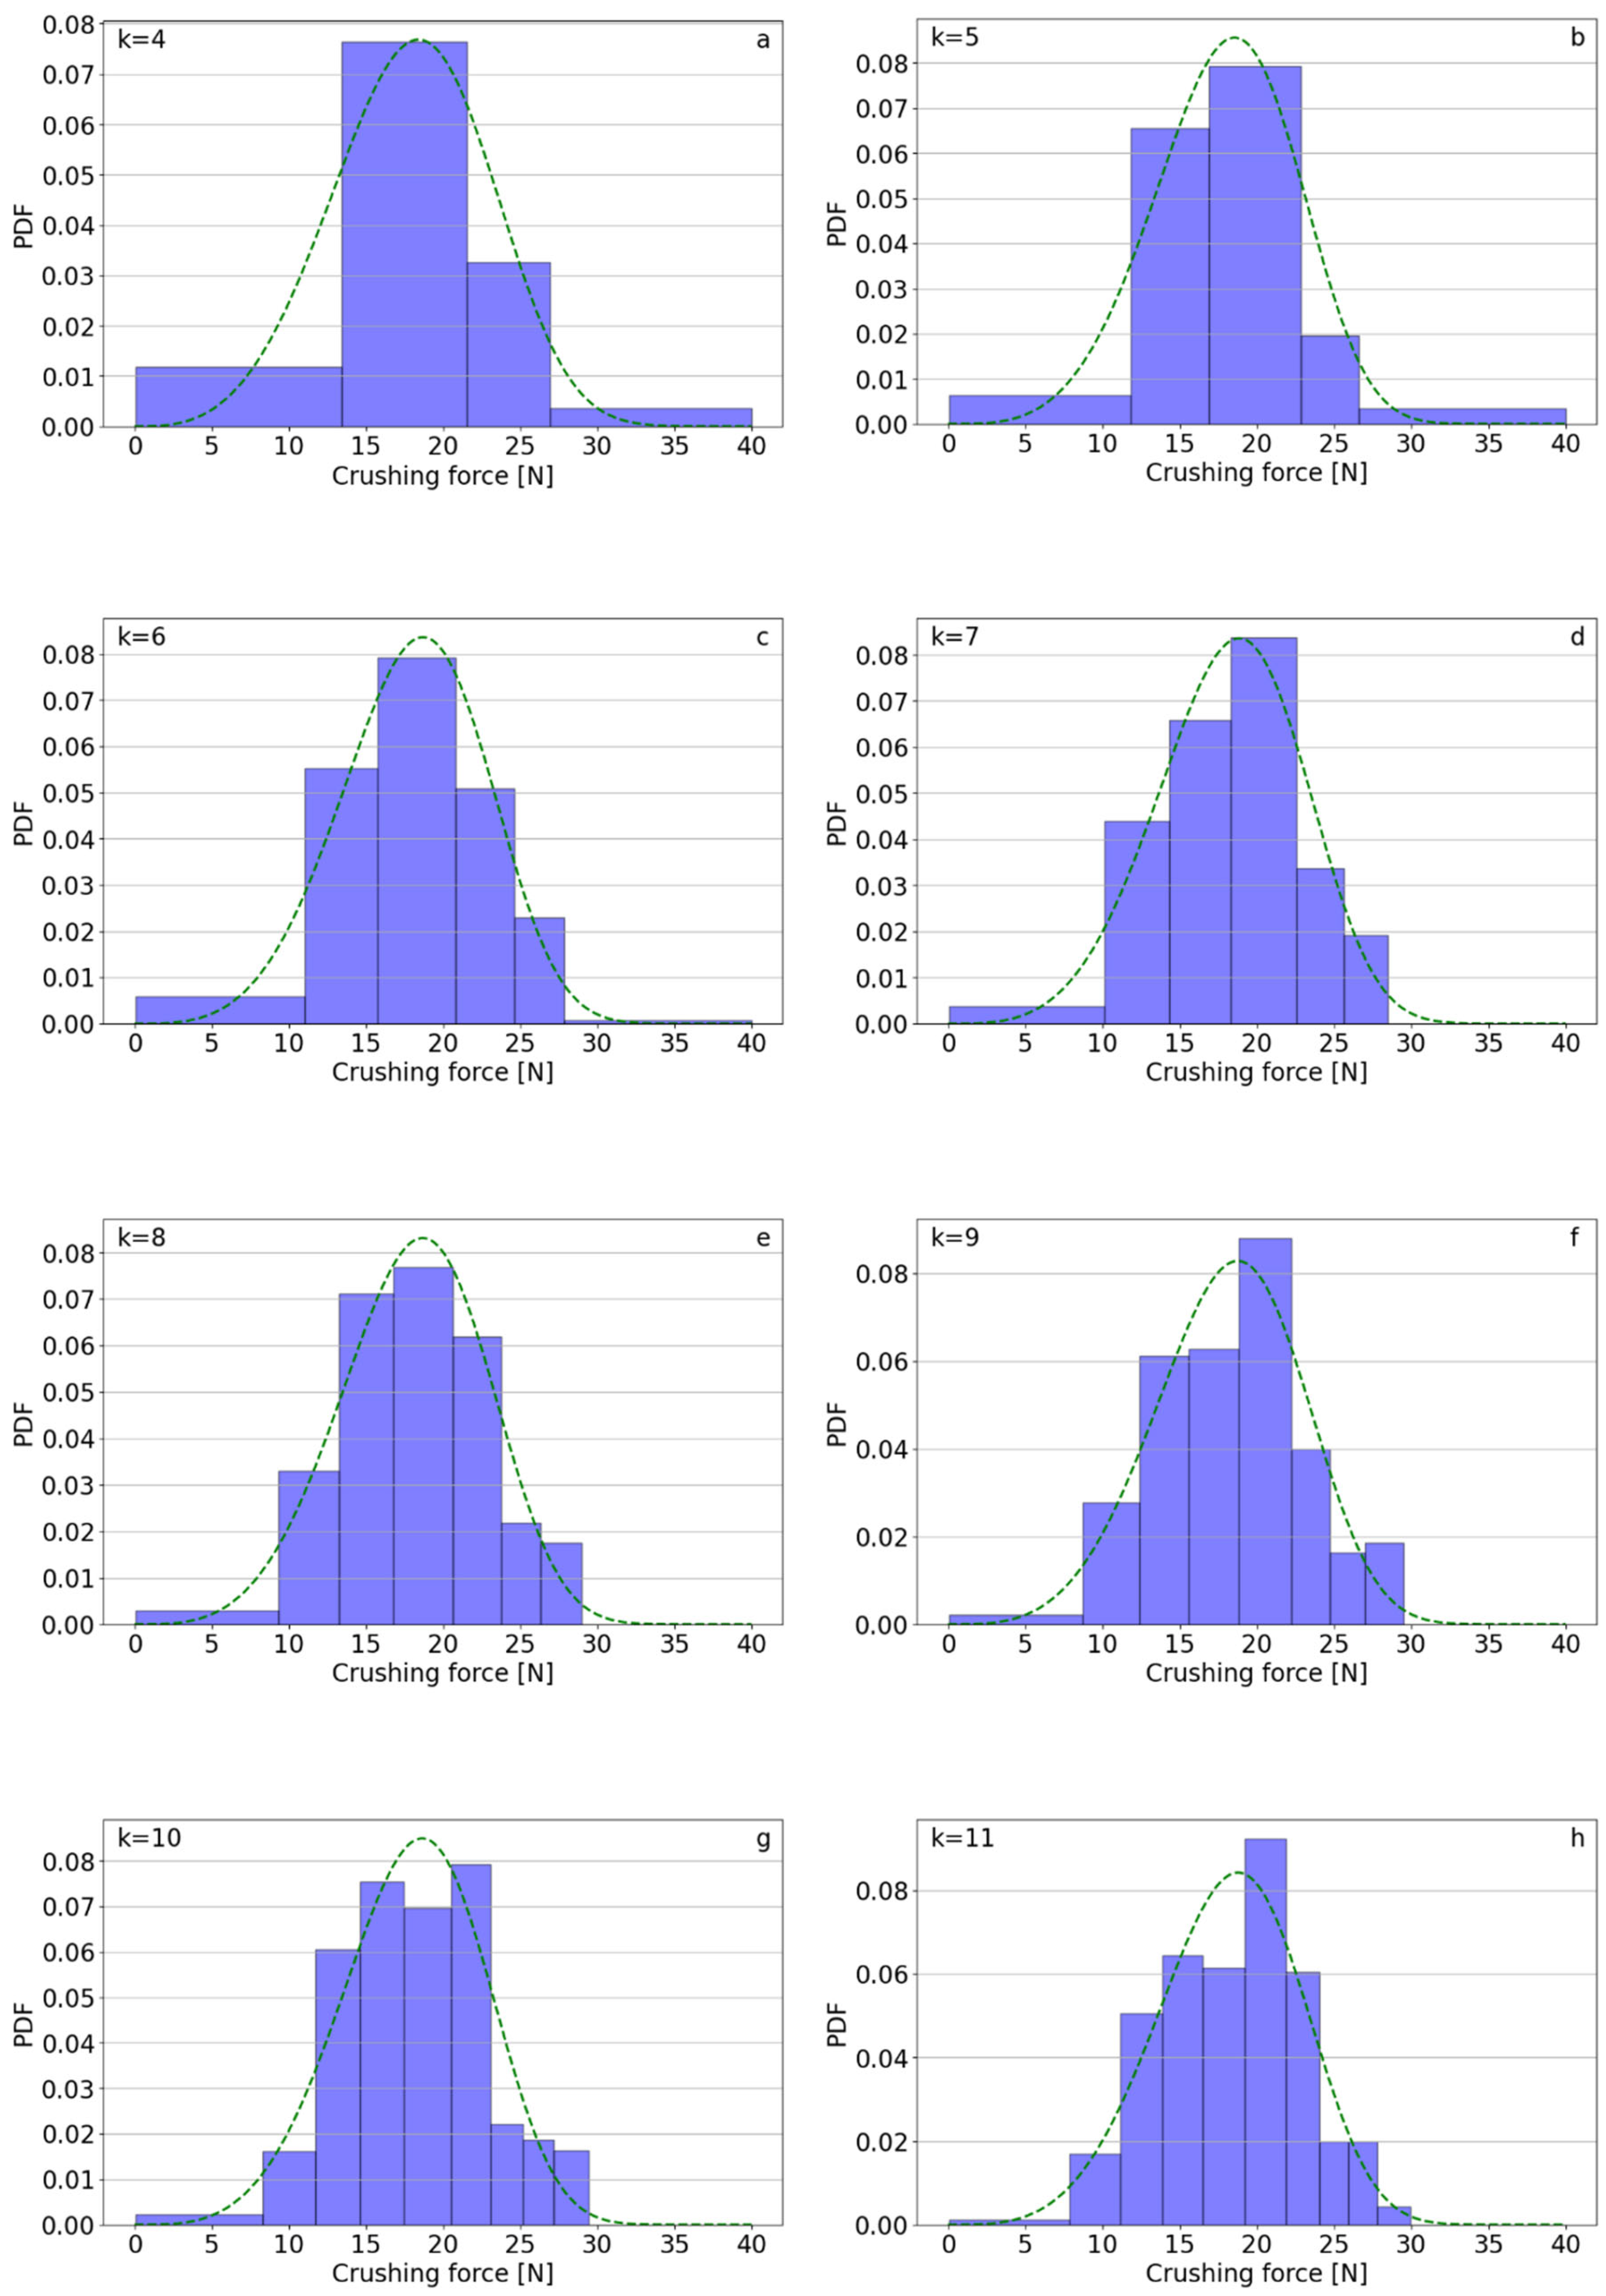
Figure 1. Weibull PDF and histogram with optimal interval widths for Polifoska 8 fertilizer data ( k = 4 ,   5 , ,   11 ).
Symmetry 17 01566 g001
Figure 2. Weibull PDF and histogram with equal-width bins for Polifoska 8 fertilizer data ( k = 4 ,   5 , ,   11 ).
Symmetry 17 01566 g002
Figure 3. Weibull PDF and histogram with optimal interval widths for Salmag fertilizer data ( k = 4 ,   5 , ,   11 ).
Symmetry 17 01566 g003
Figure 4. Weibull PDF and histogram with equal-width bins for Salmag fertilizer data ( k = 4 ,   5 , ,   11 ).
Symmetry 17 01566 g004
Figure 5. Weibull PDF and histogram with optimal interval widths for Superfosfat fertilizer data ( k = 4 ,   5 , ,   11 ).
Symmetry 17 01566 g005
Figure 6. Weibull PDF and histogram with equal-width bins for Superfosfat fertilizer data ( k = 4 ,   5 , ,   11 ).
Symmetry 17 01566 g006
Table 1. Weibull distribution parameters b and c with 95% confidence intervals for Salmag, Superfosfat, and Polifoska 8 fertilizers, using optimal bin widths and equal bin widths ( k = 4 ,   5 , ,   11 ) and raw data.
kPolifoska 8SalmagSuperfosfat
Optimal Bin Width
b ^ c ^ 95% CI for
b ^
95% CI for
c ^
b ^ c ^ 95% CI for
b ^
95% CI for
c ^
b ^ c ^ 95% CI for
b ^
95% CI for
c ^
419.7793.99019.779 ±
1.075
3.990 ± 0.72347.4708.31847.470 ± 1.2378.318 ± 1.50631.9414.34131.941 ± 1.5954.341 ± 0.786
519.6424.44619.642 ± 0.9334.446 ± 0.73947.0398.29947.039 ± 1.1978.299 ± 1.37831.5723.782 31.572 ± 1.7633.782 ± 0.628
619.827 4.38219.827 ± 0.9364.382 ± 0.70947.649 8.342 47.649 ± 1.1818.342 ± 1.3531.7924.18131.792 ± 1.5724.181 ± 0.677
719.976 4.41419.976 ±
0.927
4.414 ± 0.69647.4138.06847.413 ± 1.2048.068 ± 1.27231.8294.13331.829 ± 1.5784.133 ± 0.652
819.830 4.35419.830 ±
0.926
4.354 ± 0.67747.3338.14147.333 ± 1.1838.141 ± 1.26631.8084.213 31.808 ± 1.5364.213 ± 0.655
919.913 4.35319.913 ±
0.926
4.353 ± 0.6747.4008.33047.400 ±1.1528.330 ± 1.28131.9794.19431.979 ± 1.5444.1942± 0.645
1019.745 4.43419.745 ±
0.898
4.434 ± 0.67747.3548.275 47.354 ± 1.1558.275 ± 1.26331.7194.07931.719 ± 1.5694.079 ± 0.623
1119.8914.43019.891 ± 0.9034.430 ±
0.672
47.4418.28747.441 ± 1.1528.287 ± 1.25731.8604.23031.860 ± 1.5164.230 ± 0.642
Equal Bin Width
419.5134.77719.513 ± 0.877 4.777 ± 0.89147.7937.87047.793 ± 1.352 7.870 ± 1.61132.5033.83732.503 ± 1.9613.837 ± 0.834
519.9264.46619.926 ± 0.933 4.466 ± 0.795 47.2088.29747.208 ± 1.2058.297 ± 1.4831.9463.81331.946 ± 1.8653.813 ± 0.747
619.7524.35919.752 ± 0.932 4.359 ± 0.74147.7088.15647.708 ± 1.219 8.156 ± 1.410 31.8803.87131.880 ± 1.8043.871 ± 0.719
720.0124.43220.012 ± 0.922 4.432 ± 0.737 47.5458.27647.545 ± 1.181 8.276 ± 1.375 31.6733.94631.673 ± 1.7393.9456 ± 0.705
819.8154.42519.815 ± 0.908 4.425 ± 0.71747.6458.08747.645 ± 1.2028.087 ± 1.323 32.0734.13332.073 ± 1.6734.133 ± 0.724
919.8594.44119.859 ± 0.903 4.441 ± 0.71147.4488.14447.448 ± 1.1818.144 ± 1.18131.8784.15731.878 ± 1.6454.1574 ± 0.714
1019.8384.36119.838 ± 0.916 4.361 ± 0.69347.4668.39147.466 ± 1.1438.391 ± 1.324 31.9524.09831.952 ± 1.6684.098 ± 0.700
1119.8894.37319.889 ± 0.914 4.373 ± 0.691 47.3918.10647.391 ± 1.1788.106 ± 1.272 31.8144.03931.814 ± 1.6814.039 ± 0.684
Raw Data19.8494.43819.849 ± 0.8884.438 ± 0.65347.4278.29747.427 ±
1.135
8.297 ± 1.22031.8084.19631.808 ± 1.5064.196 ± 0.617
Table 2. Asymptotic Relative Efficiency (ARE) for Weibull parameters b and c based on optimal and equal bin widths ( k = 4 ,   5 , ,   11 ) for Polifoska 8, Salmag, and Superfosfat fertilizers.
kPolifoska 8SalmagSuperfosfat
A R E b G ^ A R E c G ^ A R E b E ^ A R E c E ^ A R E b G ^ A R E c G ^ A R E b E ^ A R E c E ^ A R E b G ^ A R E c G ^ A R E b E ^ A R E c E ^
40.6830.8161.0260.5370.8420.6560.7040.5730.8910.6160.6630.616
50.9060.7810.9070.6730.8990.7840.8870.6790.7290.9650.7330.767
60.9010.8470.9080.7760.9240.8170.8680.7480.9170.8320.7840.828
70.9180.8790.9280.7850.8890.9200.9240.7870.910.8960.8430.861
80.9190.9290.9570.8280.9210.9280.8920.8500.9610.8860.9110.818
90.9200.9500.9670.8430.9710.9070.9230.8750.9510.9150.9420.840
100.9780.9300.9400.8860.9670.9330.9860.8500.9210.9820.9160.875
110.9670.9430.9440.8930.9710.9420.9290.9200.9870.9240.9020.914
Table 3. Chi-squared (χ2) values and p-values.
kPolifoska 8SalmagSuperfosfat
Optimal GroupingEqui-ClassOptimal GroupingEqui-ClassOptimal GroupingEqui-Class
χ 2 p-Value χ 2 p-Value χ 2 p-Value χ 2 p-Value χ 2 p-Value χ 2 p-Value
4--0.4150.519--0.0110.917--1.9570.168
51.4160.2343.1240.2100.4390.5080.9000.3434.3150.0383.2410.198
60.8090.6670.9500.6224.0860.1301.7200.4236.9720.0309.5730.02
72.0560.5611.9760.5772.8170.4214.7200.1931.0190.3134.2020.2404
80.4930.7815.8900.2075.0610.0800.5830.9652.0260.3634.5770.333
92.5810.4614.8200.3068.3440.0396.5620.2553.4810.3235.2730.383
105.6110.2305.5550.3527.3530.1185.0710.2803.5600.4695.9860.425
113.6070.4624.8290.5664.1520.3865.2150.3907.3220.1207.3240.292
Disclaimer/Publisher’s Note: The statements, opinions and data contained in all publications are solely those of the individual author(s) and contributor(s) and not of MDPI and/or the editor(s). MDPI and/or the editor(s) disclaim responsibility for any injury to people or property resulting from any ideas, methods, instructions or products referred to in the content.