Article

Numerical Simulation of 3D Full Hydraulic Jumps Using a GPU-Based SPH Model

1
College of Ocean Engineering and Energy, Guangdong Ocean University, Zhanjiang 524088, China
2
Guangdong Provincial Key Laboratory of Intelligent Equipment for South China Sea Marine Ranching, Guangdong Ocean University, Zhanjiang 524088, China
3
Heilongjiang Province Hydraulic Research Institute, Harbin 150008, China
4
Heilongjiang Provincial Water Conservancy and Hydroelectric Power Investigation Design and Research Institute, Harbin 150006, China
*
Author to whom correspondence should be addressed.
Symmetry 2025, 17(9), 1564; https://doi.org/10.3390/sym17091564
Submission received: 20 August 2025 / Revised: 4 September 2025 / Accepted: 5 September 2025 / Published: 18 September 2025
(This article belongs to the Section Computer)

Abstract

Hydraulic jumps typically exhibit a distinct symmetry under ideal boundary conditions and are characterized by a sudden change in flow depth and velocity. They are commonly employed in a diverse array of water management systems to dissipate excess energy due to their high energy dissipation rate, strong adaptability to geological conditions and tailwater variation, small fluctuation in tailwater, and low cost of maintenance. In this study, a GPU-based Smoothed Particle Hydrodynamics (SPH) model of 3D hydraulic jumps is established. Numerical simulation of three 3D symmetric full hydraulic jumps with large Froude numbers are carried out, and satisfactory agreements are shown with a largest L 2 error of 0.442 between the numerical free surface and experimental data. The model can reliably reproduce the free surface, jump the toe position, and jump the skimming flow. The analysis of the model efficiency shows that a maximum GPU acceleration of 12, which is equivalent to the theoretical maximum speedups, against parallel CPU can be achieved with a common GPU device. Furthermore, the energy dissipation in the stilling basin of a real sluice gate is investigated by the model. Therefore, the SPH model is a powerful tool for investigating the complex and large-scale 3D full hydraulic jumps for similar hydraulic engineering with the same boundary condition.

1. Introduction

A hydraulic jump, typically occurring in rivers or spillways, is a prevalent event in hydrodynamics. In an open channel with vertical walls and constant width subjected to steady flow, the hydraulic jump exhibits spatial and temporal symmetry, which serves as the basis for its simplified analysis. Leveraging this symmetry can reduce the difficulty in modeling the hydraulic jump and facilitate the rapid derivation of hydraulic parameters such as jump length and energy loss. In a hydraulic jump, supercritical flow with high velocity changes quickly to subcritical flow with low velocity, making the water level rise obviously and the kinetic energy of the fluid partially dissipate and partially convert into potential energy. The characteristics of hydraulic jumps are that the water depth increases sharply and the velocity decreases correspondingly within a very short distance. The energy dissipation of hydraulic jumps is mainly attributed to the surface roller and strong turbulence, shear, and mixing between the surface roller and main flow to eliminate excess energy. Hydraulic jumps have a high energy dissipation rate, strong adaptability to geological conditions and tailwater variation, small fluctuation in tailwater, and low cost of maintenance. Therefore, hydraulic jumps are widely adopted to dissipate energy for various large, medium, and small discharge structures.
A few researchers have studied hydraulic jumps by theoretical methods [1]. Many researchers [2,3,4] have also used physical experiments to observe and analyze the turbulence characteristics and hydraulic parameters of hydraulic jumps. The increasing availability and power of computational resources have promoted the application of numerical methods in research. Currently, the Eulerian mesh-based approach is the most widely employed numerical model. For example, Chippada et al. [5] and Unami et al. [6] utilized a finite element model to investigate external and internal features of a hydraulic jump and the convection and diffusion coefficients of aerated flow. Hydraulic jumps in a rectangular flume were simulated by Gharangik and Chaudhry [7] using a finite difference model. Zhou and Stansby [8]; Shekari et al. [9]; Babaali et al. [10]; Gumus et al. [11]; Azimi et al. [12]; and Witt et al. [13] studied hydraulic jump parameters in a flat-bottomed, rectangular open channel, a U-shaped channel, and a lateral contraction stilling basin based on Finite Volume Models. However, because of the intricacy of hydraulic jumps—such as significant deformation and abrupt changes in the flow field—the Eulerian mesh-based models necessitate the use of sophisticated Level-Set (LS) or Volume-of-Fluid (VOF) methods for the capture of the free surface. Sometimes some special treatments were also necessary to accurately simulate the hydraulic jumps, such as refining the mesh near the jump zone or bed [10,11,13]. This further reduces such models’ efficiency.
The SPH method, which discretizes the calculation domain by particles instead of mesh, can naturally capture the free surface. Therefore, it has special advantages [14] in dealing with the kinematic interface, large deformation, and free surface breaking. The SPH approach is a noteworthy substitute for the Eulerian approach in flow simulations involving large free surface deformation or broken free surfaces. There have been some investigations into 2D hydraulic jumps using SPH models. The capabilities of a 2D SPH model were examined by López et al. [15]. In their study, a simple model was introduced, which is comparable to Morris and Monaghan’s method for increasing viscosity in more turbulent areas. Federico et al. [16] developed a new boundary algorithm for the SPH method. In addition to implementing the outlet and inlet boundary conditions, this boundary treatment may impose other upstream and downstream flow conditions. A series of 2D hydraulic jumps that had a Froude number varying from 1.15 to 1.88 were then successfully reproduced. A 2D hydraulic jump SPH model was developed by Chern and Syamsuri [17] to study the characteristics of corrugated bed hydraulic jumps. In order to implement the outlet and inlet boundary conditions in the 2D SPH model, a new open boundary algorithm was developed by Jonsson, Andreasson et al. [18]. Using a relatively coarse and basic SPH model, Jonsson, Jonsén et al. [19] examined the internal velocity field during a hydraulic jump. De Padova et al. [20,21,22] reproduced and investigated the cyclic mechanisms and oscillating characteristics between jump types using a 2D weakly compressible XSPH scheme. Gu et al. [23] investigated hydraulic jumps on a corrugated riverbed based on a 2D WCSPH model and examined how the height and length of the corrugation affect the properties of hydraulic jumps.
In short, though some researchers have conducted numerical experiments of hydraulic jumps using SPH models, there have been few attempts at performing 3D simulation due to the large computational effort. De Padova et al. [24,25] investigated the mechanism of vorticity in scour pits of a sandy riverbed flume and the size of the recirculation areas along the lateral walls and the undular hydraulic jumps’ trapezoidal wavefront pattern in a large 3D flume by an SPH model. Using a meshless SPH model based on GPUs, this paper will concentrate on large Froude number, symmetric, full hydraulic jumps involving millions of particles. By contrasting the free surface between the experimental and numerical results, the validation is carried out. The efficiency of the SPH model is analyzed by computing the speedups of GPU against paralleled CPU for various particle numbers. Finally, the dissipation of energy in the stilling basin of a real sluice gate project is investigated by the model.

2. Numerical Method

2.1. Governing Equations

The fundamental principles that control the behavior of viscous fluids are encapsulated in the momentum equations and continuity equations.
1 ρ D ρ D t + · u = 0
D u D t = 1 ρ P + g + Γ
where the velocity vector is represented by u ; density is represented by ρ ; pressure is represented by P; the gravitational acceleration is represented by g ; and the dissipative terms are represented by Γ .
Based on the SPH method, the following Navier–Stokes (NS) equations in Lagrangian form are obtained:
d ρ a d t = b m b u a b a W a b
d u a d t = b m b P a ρ a 2 + P b ρ b 2 + Γ a b a W a b + g
where u a b = u a u b ; the subscripts b and a represent the neighborhood particles and integration point; the mass is denoted by m ; and the kernel function is represented by W a b = W ( r a b , h ) , r a b = r a r b . To minimize density fluctuations, a delta-SPH scheme is also used, which adds a new diffusive portion to the continuity equation. Details of the delta-SPH algorithm can be discovered in Crespo et al. [26]. For all results, 0.1 is set to the delta-SPH coefficient. Because of its greater accuracy, the fifth-order kernel [27] is used in this paper:
W ( s ) = α D ( 1 s 2 ) 4 ( 2 s + 1 ) 0 s 2
where s = r / h ; the smoothing length ( 1 . 5 Δ x ) is represented by h ; Δ x denotes particle spacing; and the 3D normalization constants are represented by α D = 21 / 16 π h 3 .
In Equation (4), the viscous term Γ a b is determined by an artificial viscosity that is proposed by Monaghan [28]. The artificial viscosity has been successfully applied in the investigation of water waves [27], 2D hydraulic jumps [19], and tsunami and structure interactions [29].
Γ a b = α c a b ¯ μ a b ρ a b ¯ v a b · r a b < 0 0 v a b · r a b > 0
with
μ a b = h v a b · r a b r a b 2 + 0.01 h 2
where v i and r i represent the velocity and particle position, respectively; v a b / r a b = ( v a v b ) / ( r a r b ) ; artificial viscosity coefficient is represented by α ; and the mean numerical sound speed is presented by c a b ¯ = 0.5 ( c a + c b ) .
Tait’s state equation is adopted in this work to determine the pressure. Numerous water flow phenomena have been effectively investigated in SPH using this equation of state [30,31].
P = B ρ ρ 0 γ 1
where B = c 0 2 ρ 0 / γ ; γ = 7 for a fluid-like water; the reference density (1000 kg m−3) is represented by ρ 0 ; and c 0 denotes the reference sound speed. To keep the stability of the numerical model, the time step will particularly be very small when c 0 takes the real sound speed. Therefore, it usually takes ten times or more the maximum flow velocity of the simulation. Here, the Mach number is M = u max / c 0 0.1 , and with that the compression effect is O ( M 2 ) . Consequently, the density of fluid changes within 1% [18,30].
Given that it is second-order accurate and fully explicit, a Symplectic technique, which is a two-stage algorithm, is used to integrate Equations (3) and (4) in time. Taking into account the impacts of the viscous diffusion term, forcing terms, and the CFL condition, a variable time step technique [26] is adopted to estimate the time step.

2.2. Boundary Conditions

The mesh-free characteristics of the SPH methodology inherently resolve the free-surface conditions without additional treatment [14]. At the terminal section of the channel, an open boundary condition is implemented to permit unrestricted particle egress from the computational domain. Once the fluid particles cross this boundary, effluent particles are permanently excluded from subsequent computational processes and cease to interact with remaining fluid elements within the simulation zone.
The solid wall boundary is handled with a Dynamic Boundary Condition (DBC). All the walls of the channel are constructed by boundary particles. The boundary particles fixed in their position have certain characteristics in common with the fluid particles. They adhere to the equation of state and the momentum equation while the velocity remains zero. Meanwhile, their position remains unchanged during the entire simulation. As a particle marked as a fluid nears a solid boundary, the relative distance between certain particles that make up the boundary and the fluid particles will gradually decrease to r 2 Δ x . The boundary particles’ pressure that is affected by fluid particles increases because the density increases. Consequently, a repulsive force will be applied to the fluid particle induced by the pressure factor in the momentum equation [26]. The DBC approach has the advantage of not requiring any special calculation or non-physical effects, which makes it ideal for handling complex boundaries.

3. Validation

To validate the model’s ability to reproduce supercritical open-channel flows, two benchmark cases—dam break [32] and hydraulic jump [15]—are selected. The computed free-surface profiles are compared with experimental data and Finite Volume Method (FVM) results.

3.1. Dam Break

The dam-break test case describes a 9 m × 0.3 m rectangular flume (Figure 1). The upstream reservoir is 4.65 m in length with an initial water level h0 = 0.25 m, while the downstream bed is initially dry. A trapezoidal obstacle is positioned 6.18 m downstream of the channel inlet. The space between particles is set to 0.015 m.
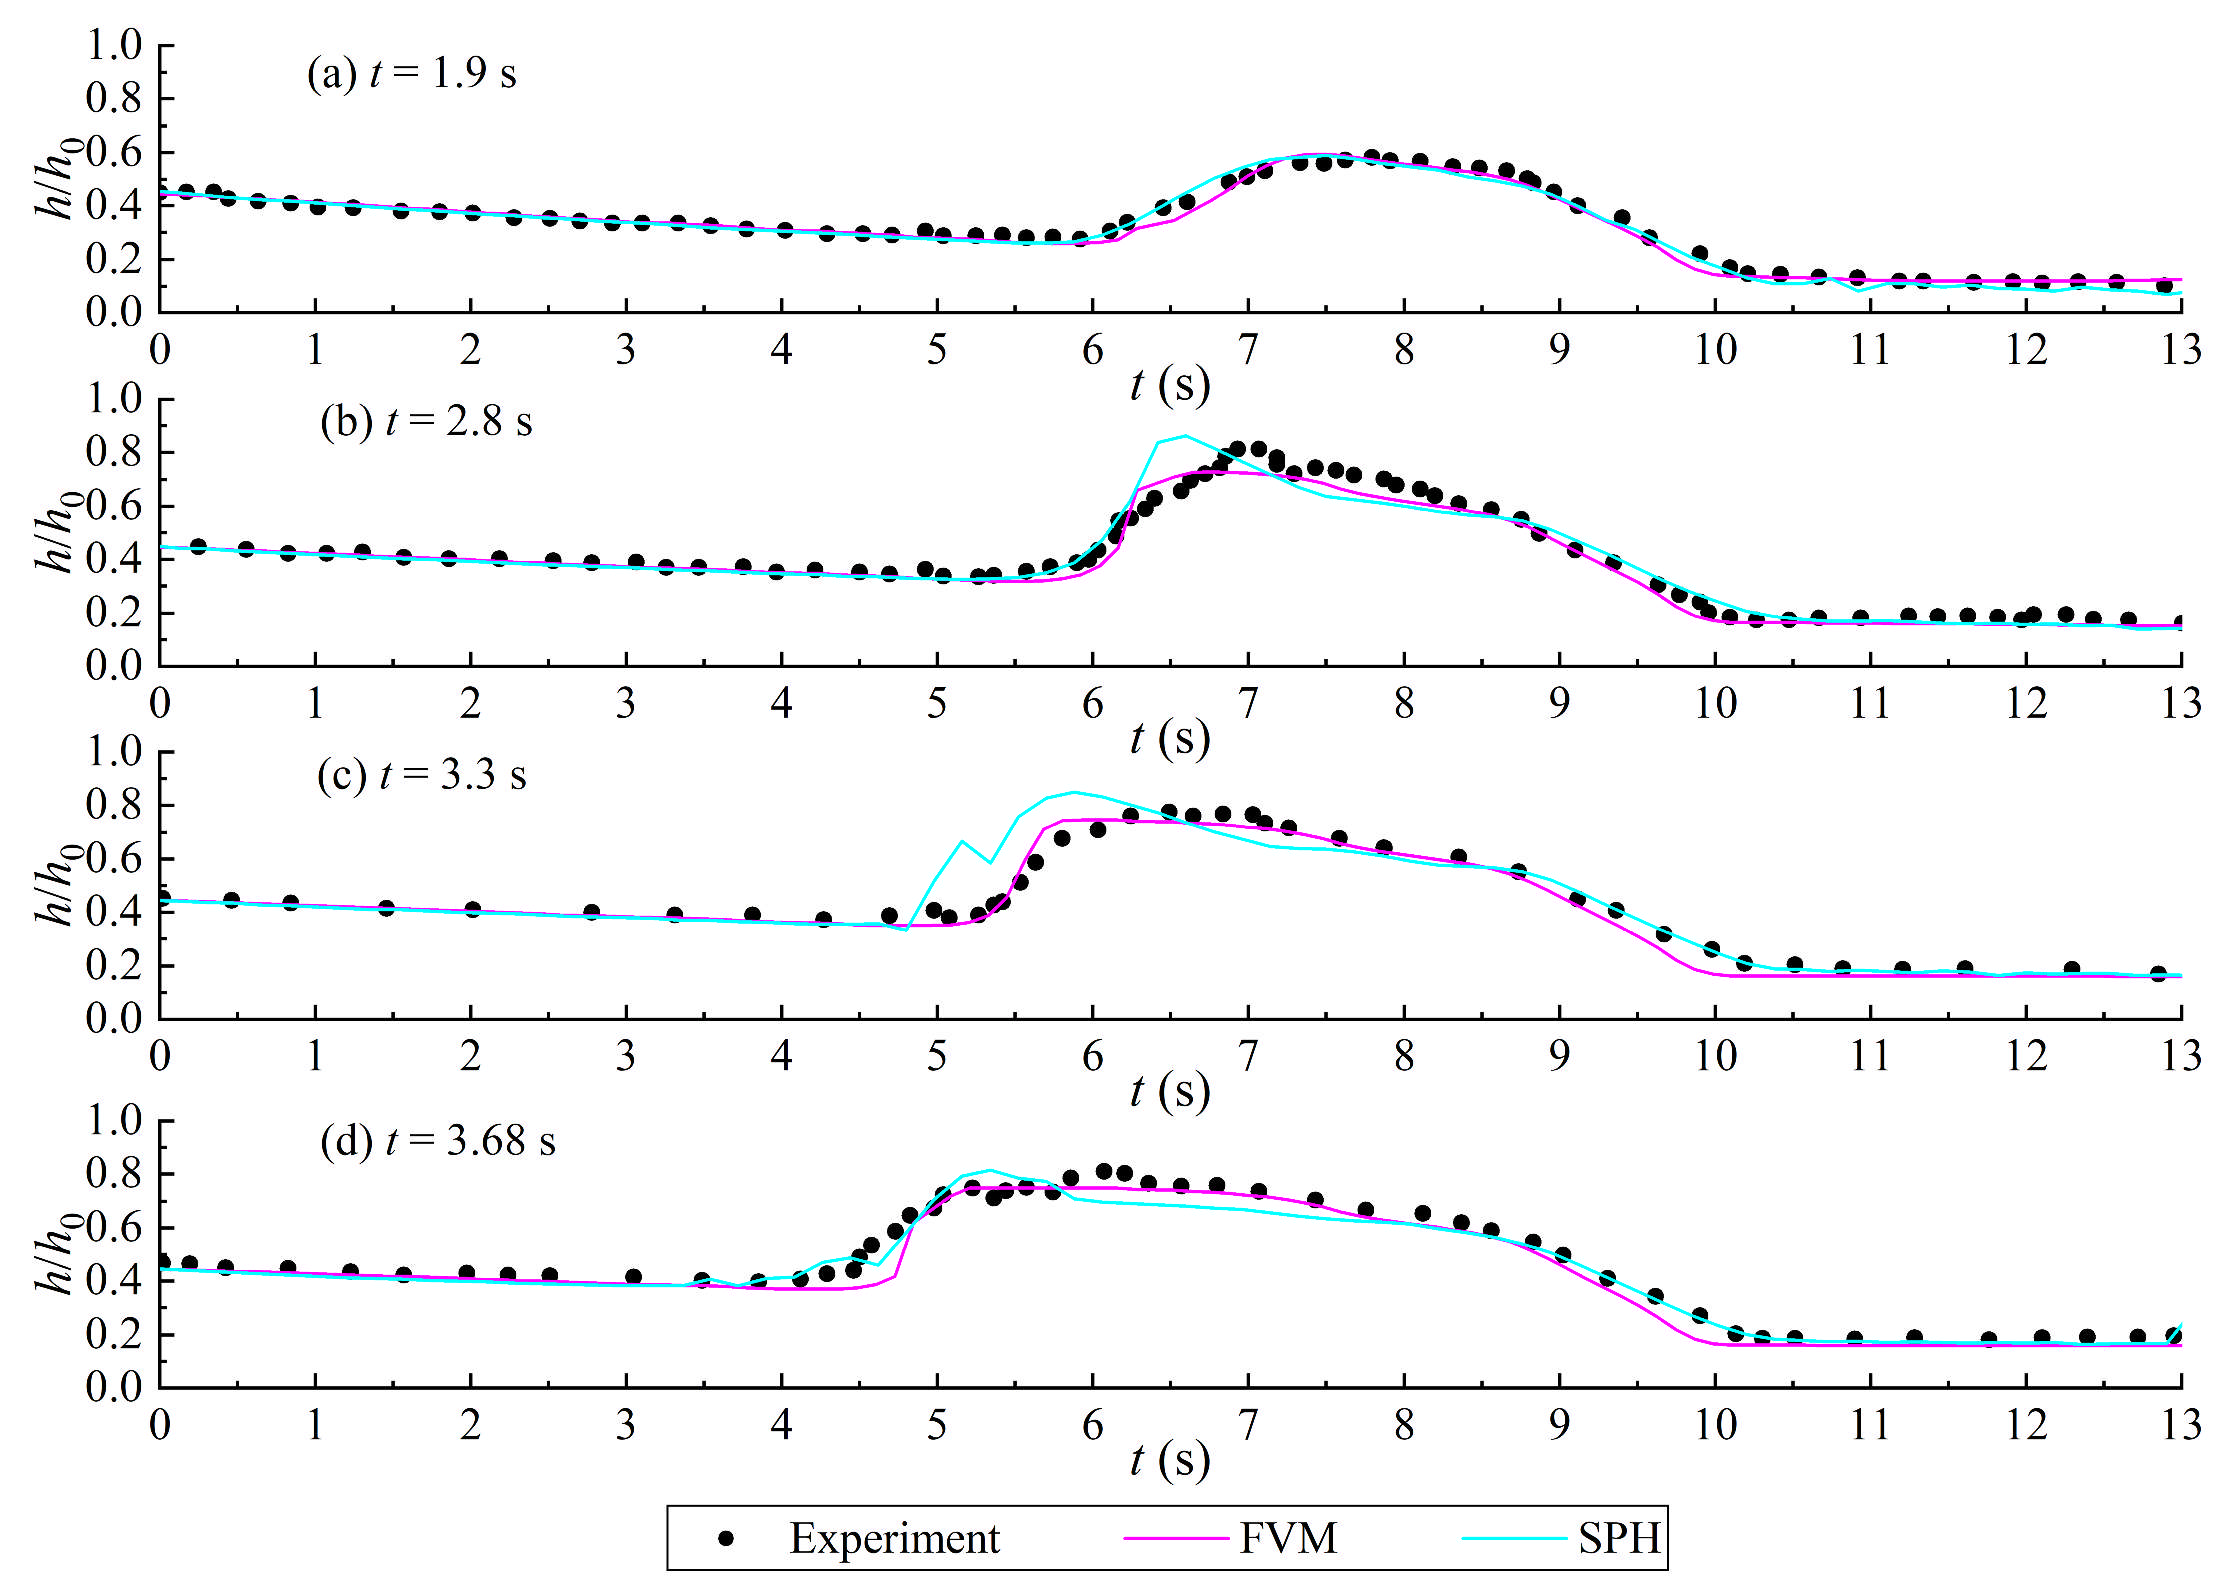
Figure 2 compares the free-surface profiles predicted by the SPH model with both the experimental data and the Finite Volume Method (FVM) results obtained using Hydroinfo—an extensively validated hydraulic solver developed by Prof. Sheng Jin’s group at Dalian University of Technology. Figure 2a,d reveal that the SPH solution agrees more closely with the experimental data than the FVM solution, whereas the opposite is observed in Figure 2b,c. Overall, both SPH and the FVM successfully capture the instantaneous propagation of the dam-break wave, demonstrating that each method can reliably simulate the dam-break flow.

3.2. Three-Dimensional Hydraulic Jumps

To estimate the model’s accuracy and efficiency for the simulation of hydraulic jumps, three test cases that are conducted by López et al. [15] are simulated. A broad crested weir, a reservoir, and a gate that opens instantly make up the flume. There is no roughness at the bottom and side walls of the flume. The flume’s width is 5 m for case 1 and case 2, while it is 10 m for case 3. The reservoir’s initial water level is h 0 = 10, 18, and 32 m, respectively. Correspondingly, the weir’s height is 1, 2, and 3 m. The Froude numbers in the three test cases are approximately 3.8, 5.5, and 8.0. The gate is positioned at 60 m downstream of the left wall. For the remainder of this work, 0.06 is adopted as the coefficient of artificial viscosity. Figure 3 (where (a), (b), (c) represent cases 1–3, respectively), giving the layout of the experimental flumes. The opening size of the gate is set to (1 + 1.5 Δ x ) m for all three cases due to that a larger boundary layer is produced by the DBC [15] and squeezes the flow through the gate, resulting in low accuracy. It is verified that the numerical results can be corrected effectively by increasing the width of the gate artificially [15], and to reduce computation time and obtain accurate results, an open boundary condition is applied at the right boundary condition to eliminate the impact of downstream reflected flow. The particle spacing is set to h 0 / Δ x = 100, 180, and 320. The fluid in the calculation domain is discretized by 2,687,417, 3,816,488, and 8,558,930 particles, respectively. The numerical experiment encompasses a 26 s temporal span, and 17.8, 37.7, and 91.6 h are the total simulation runtimes, respectively.
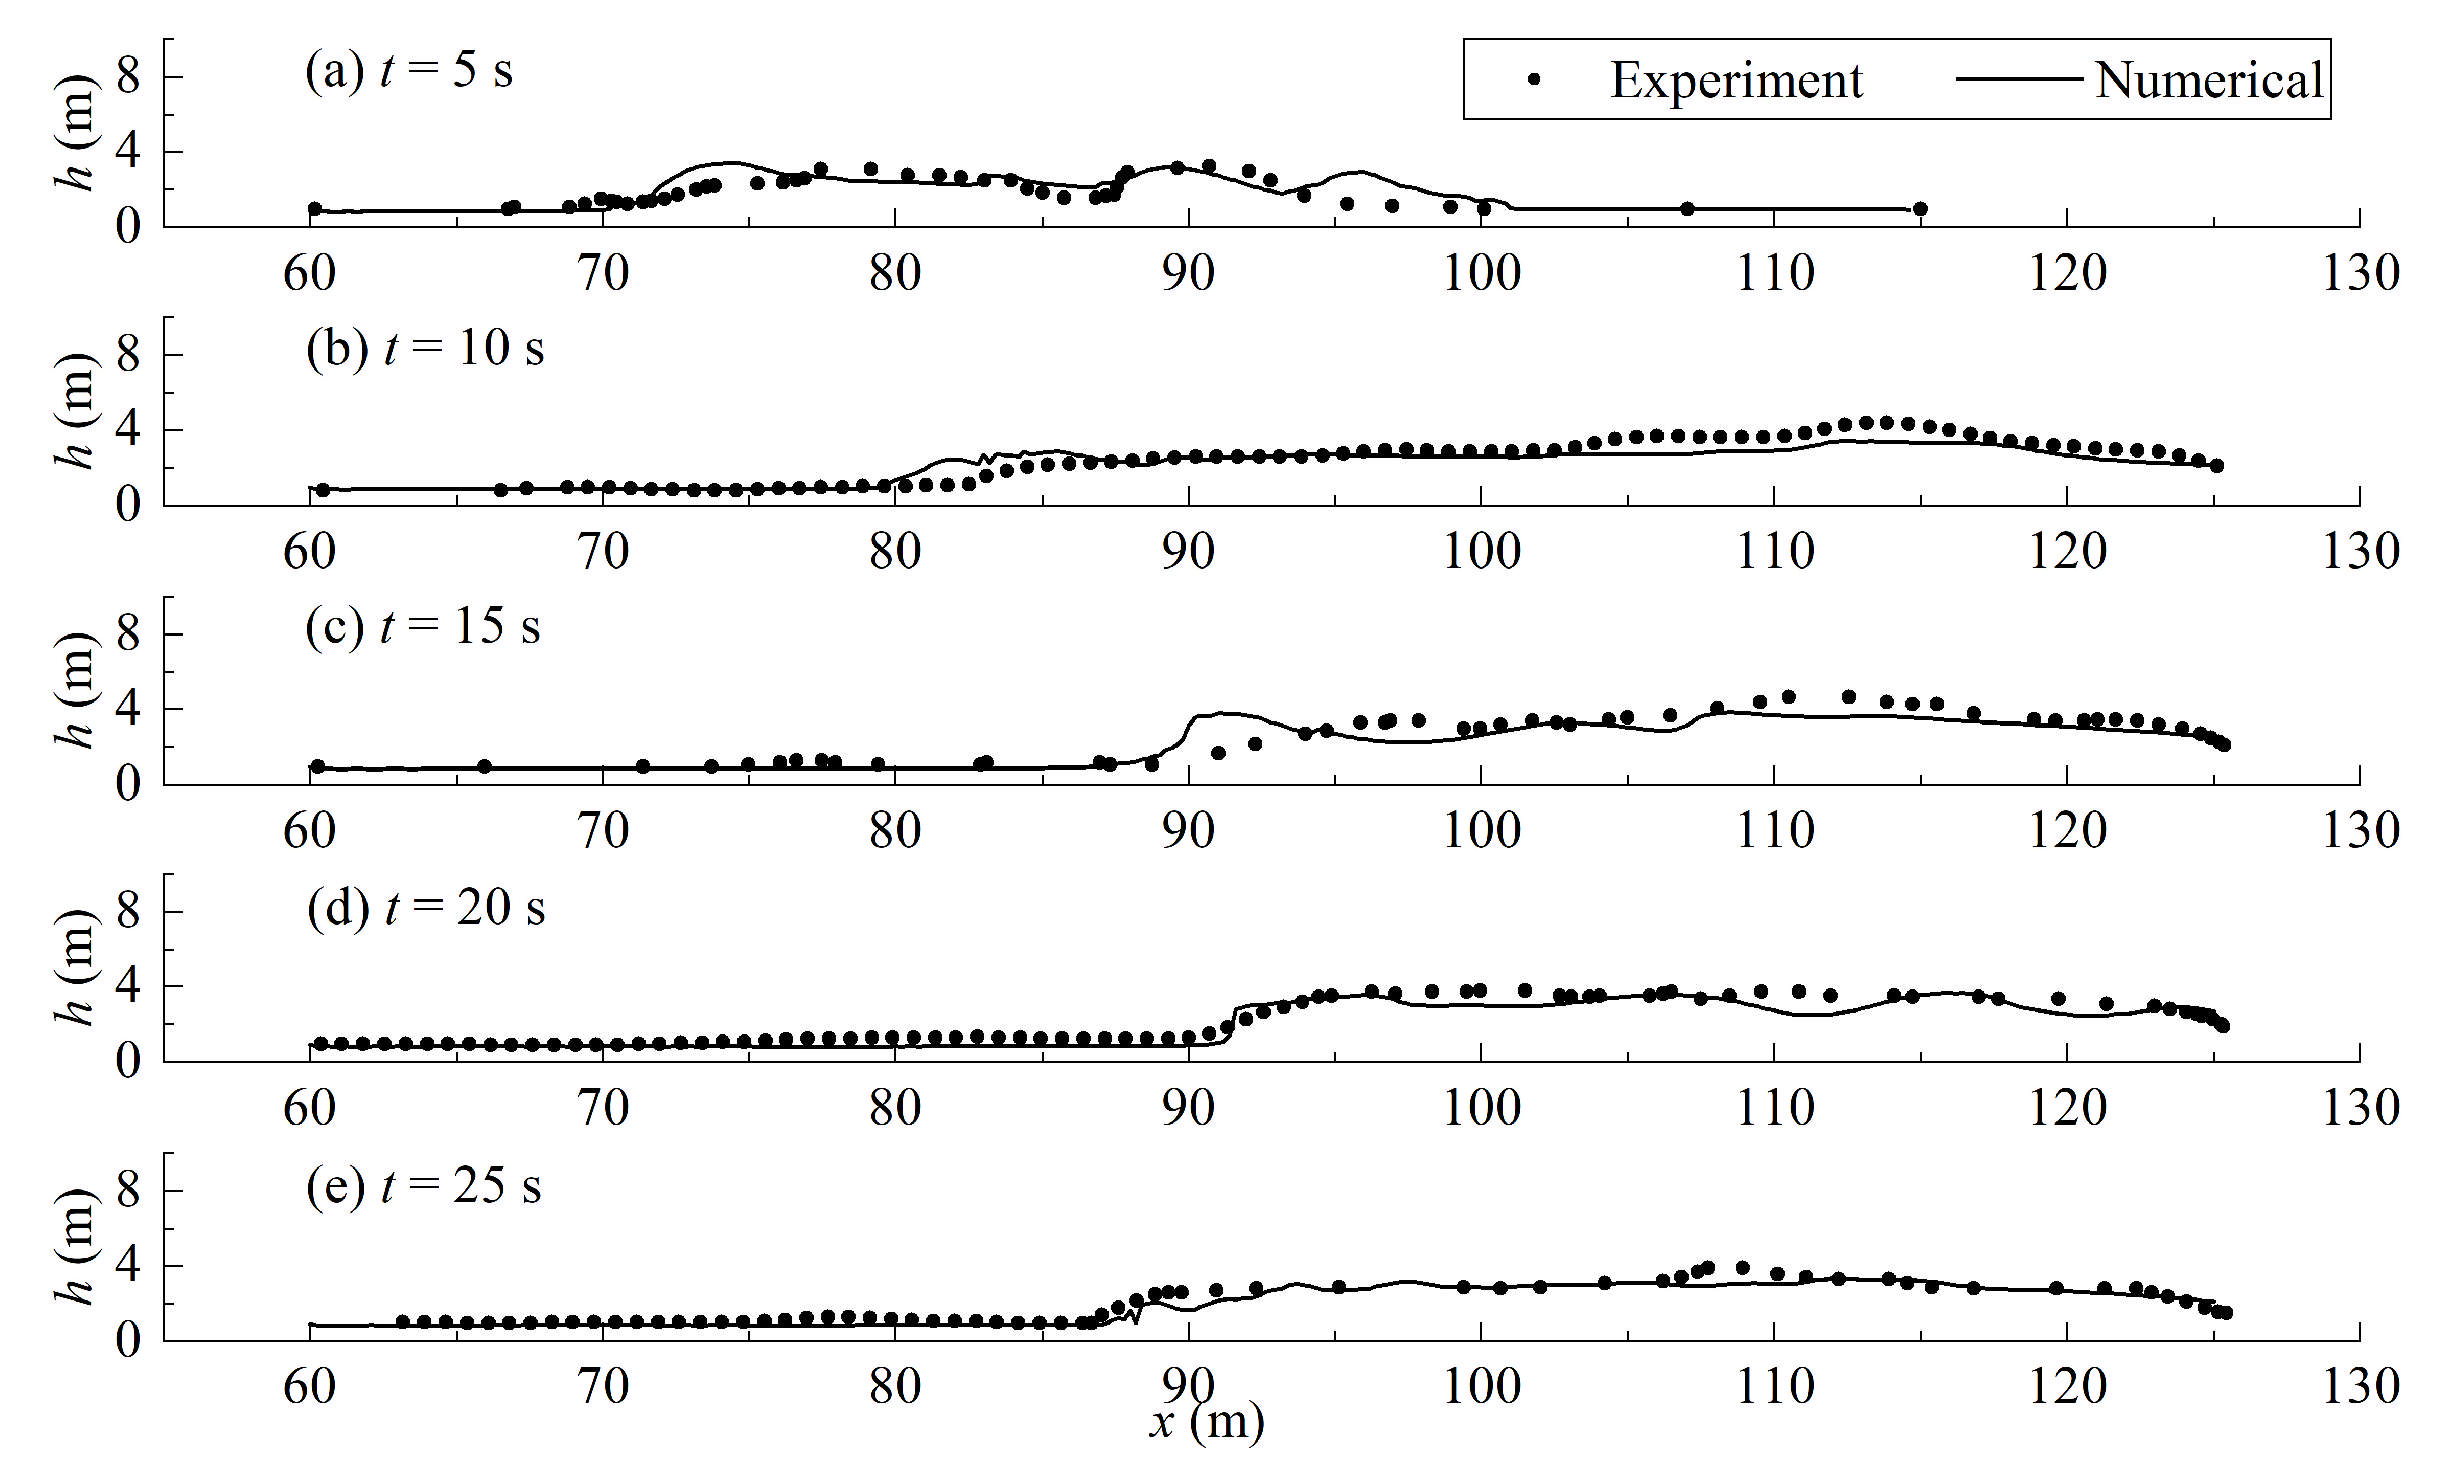
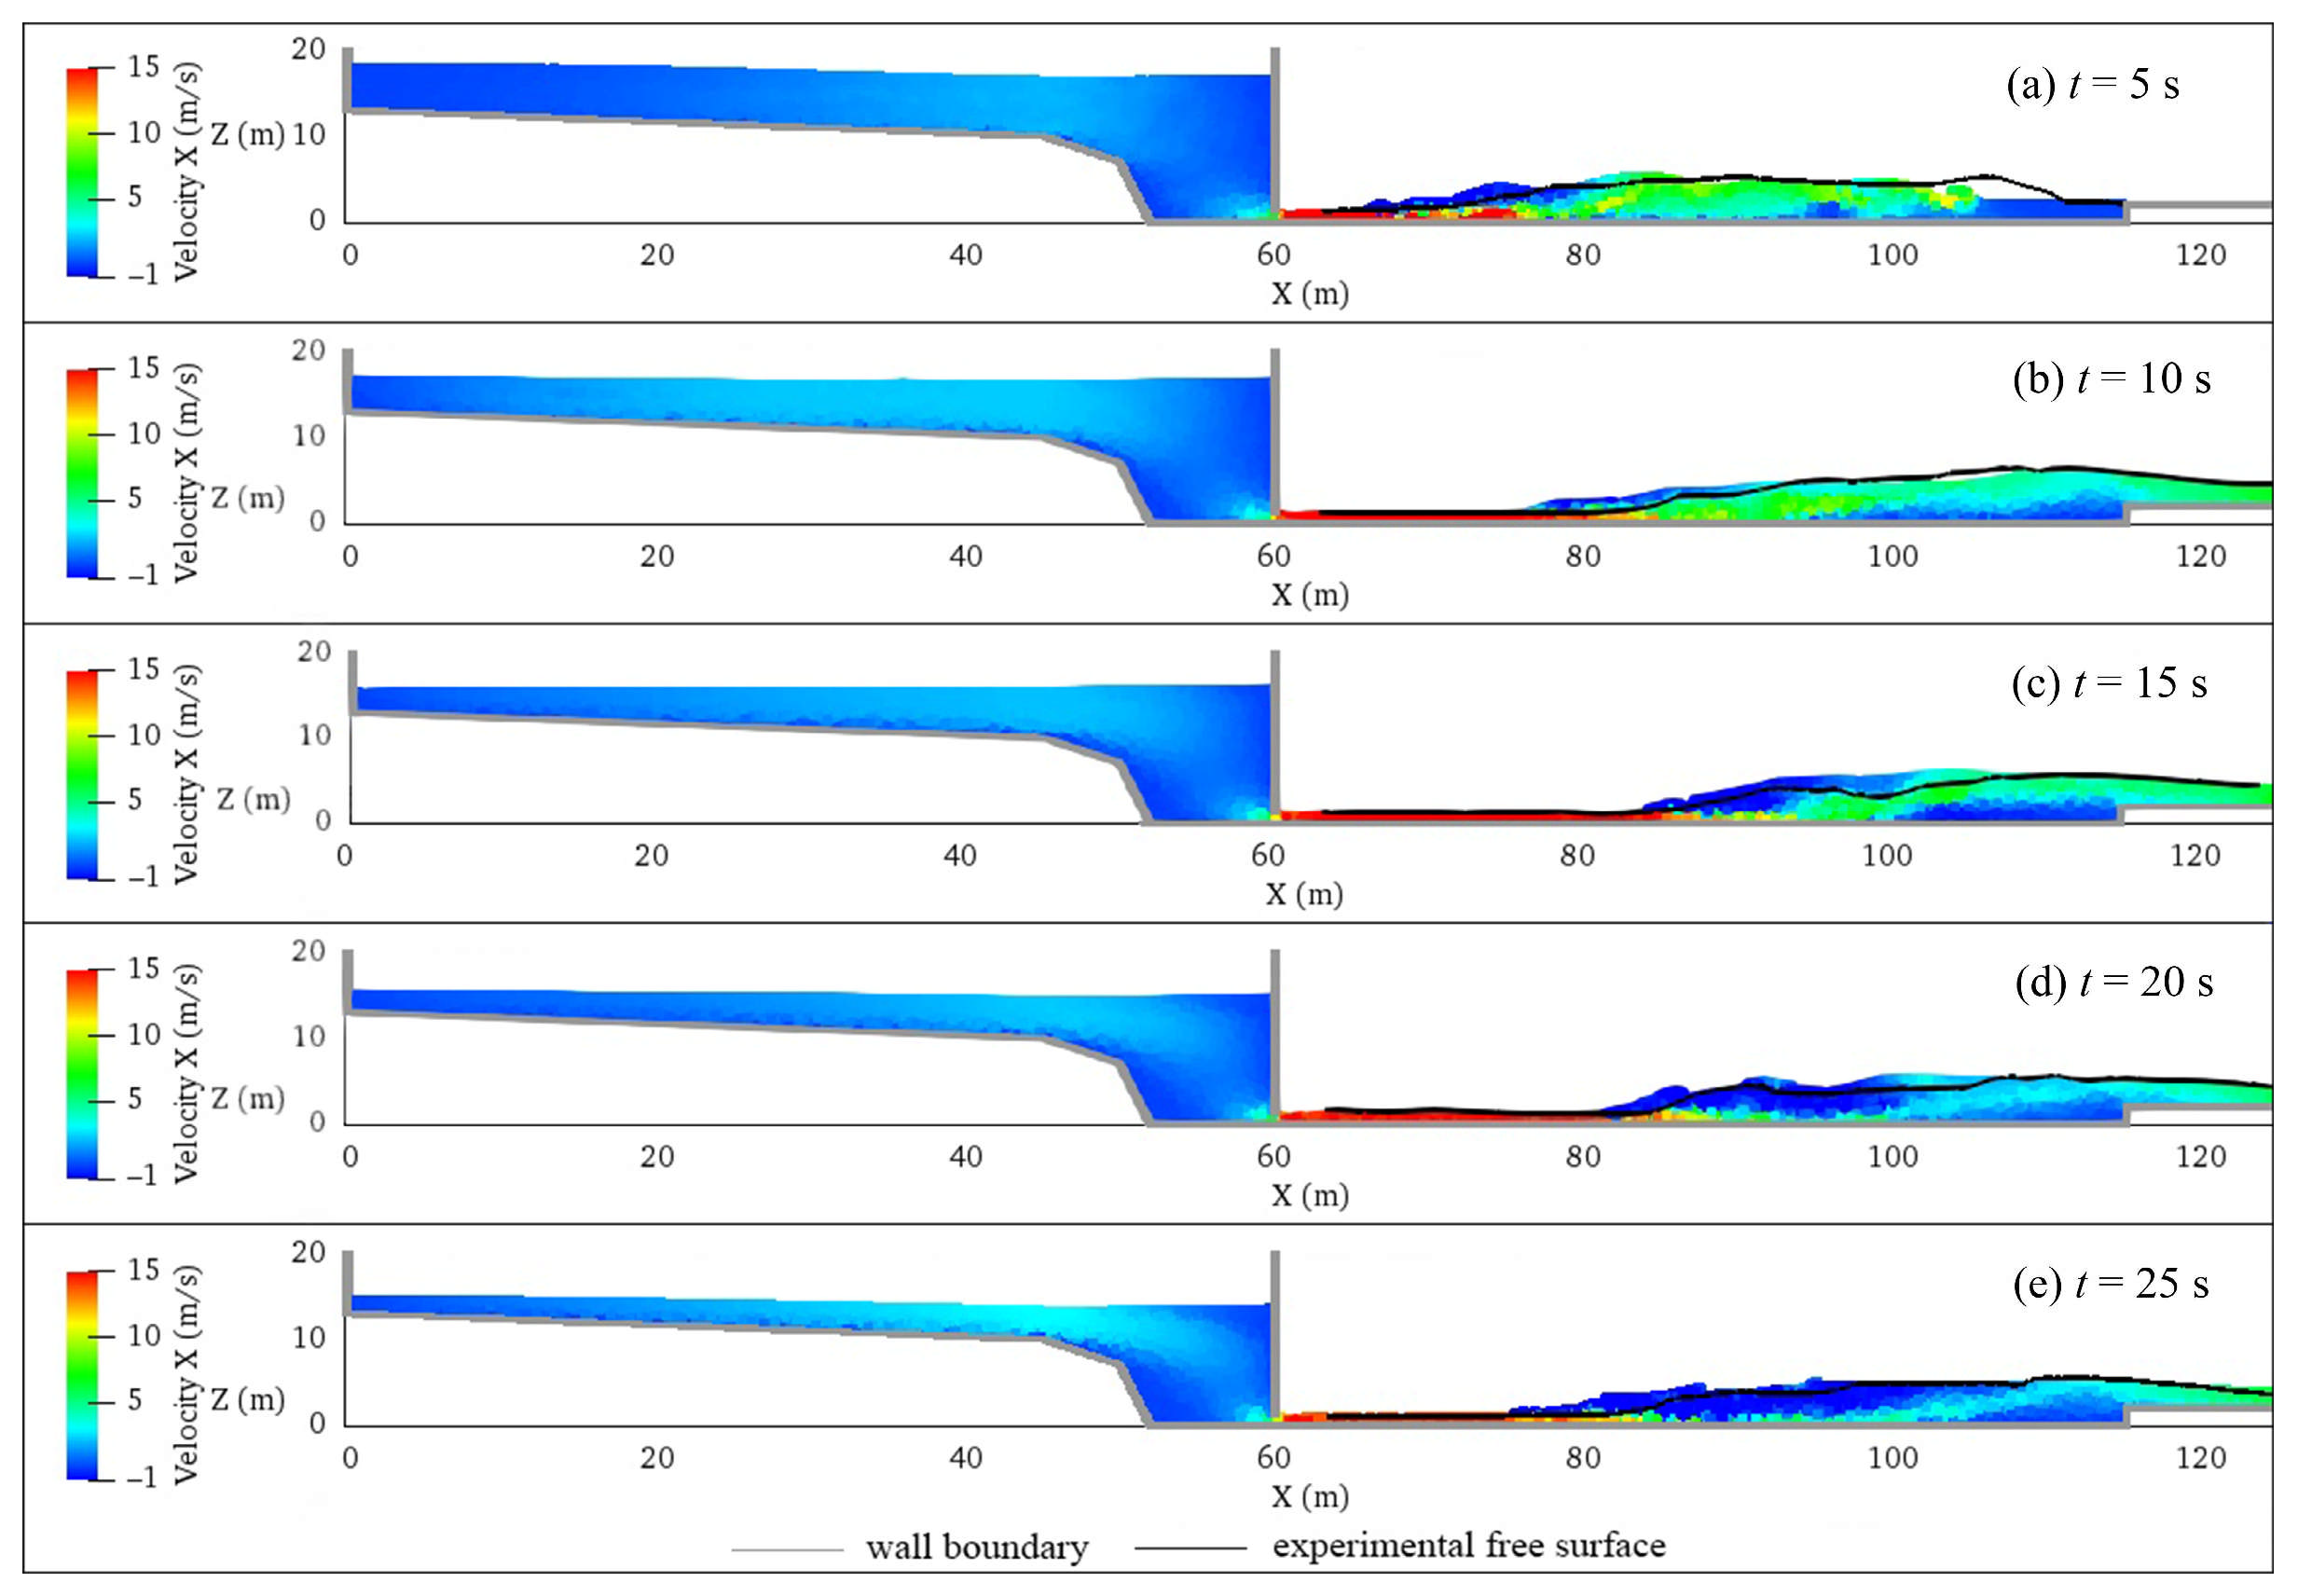
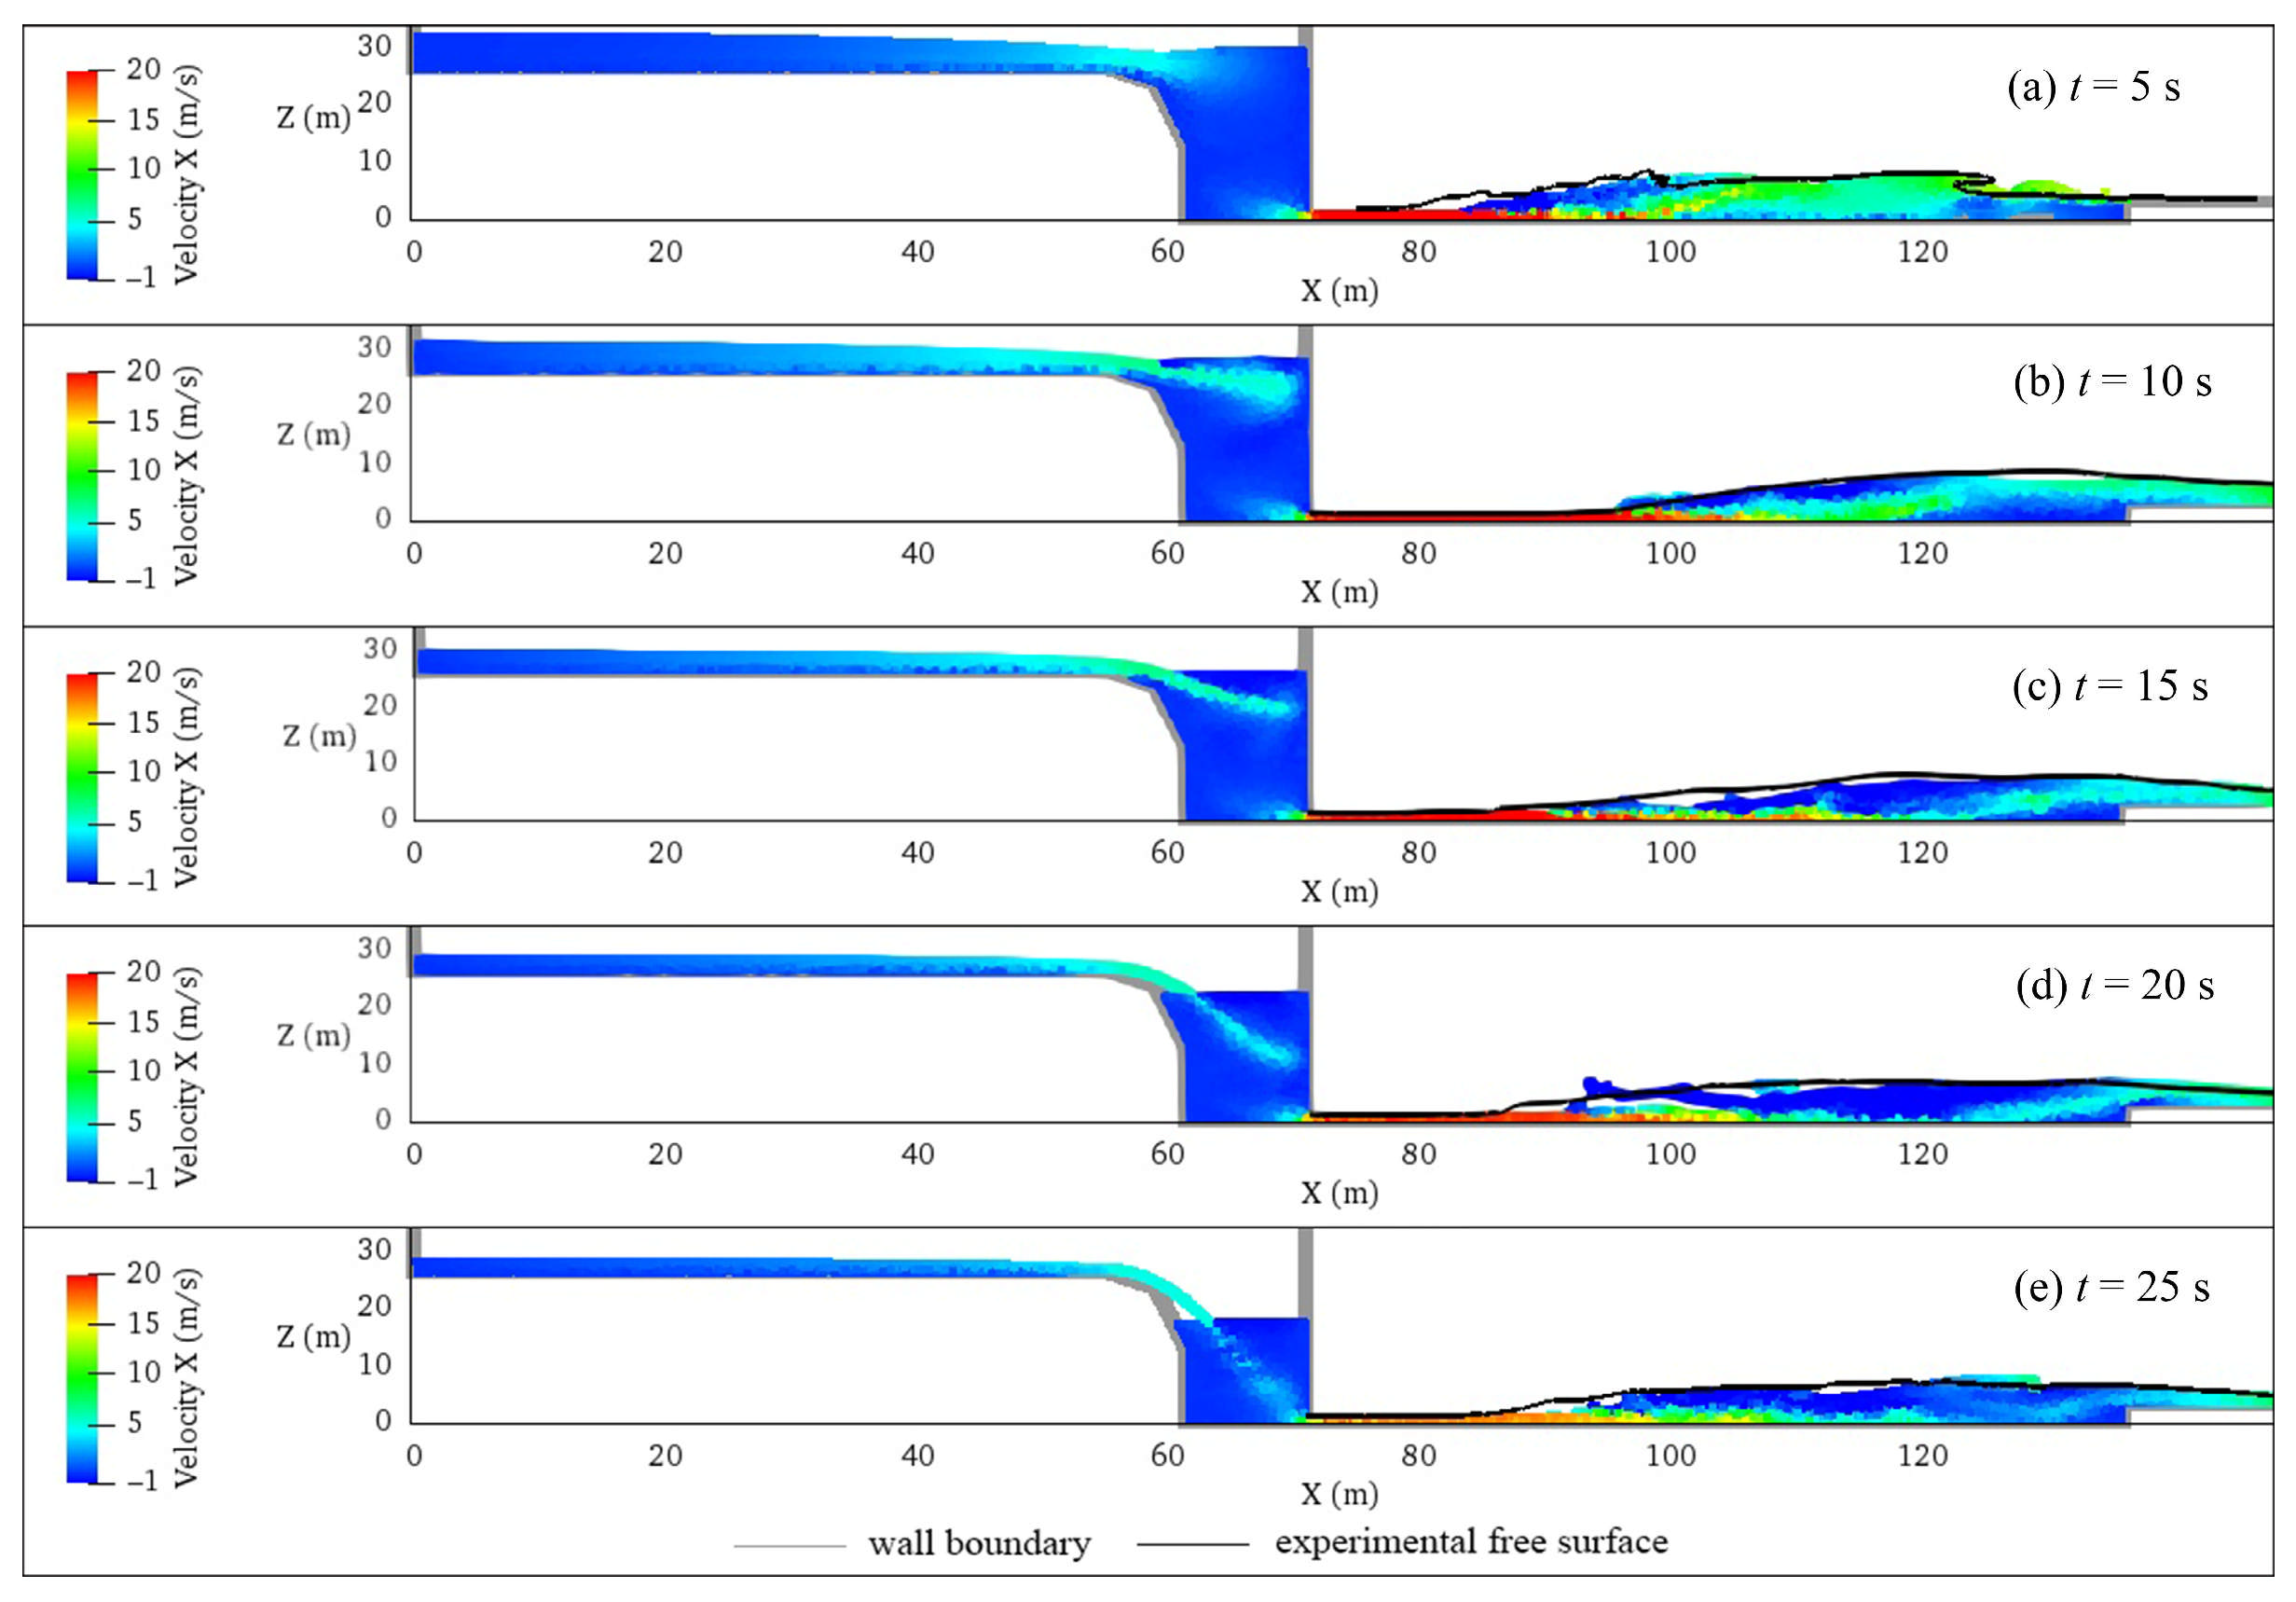
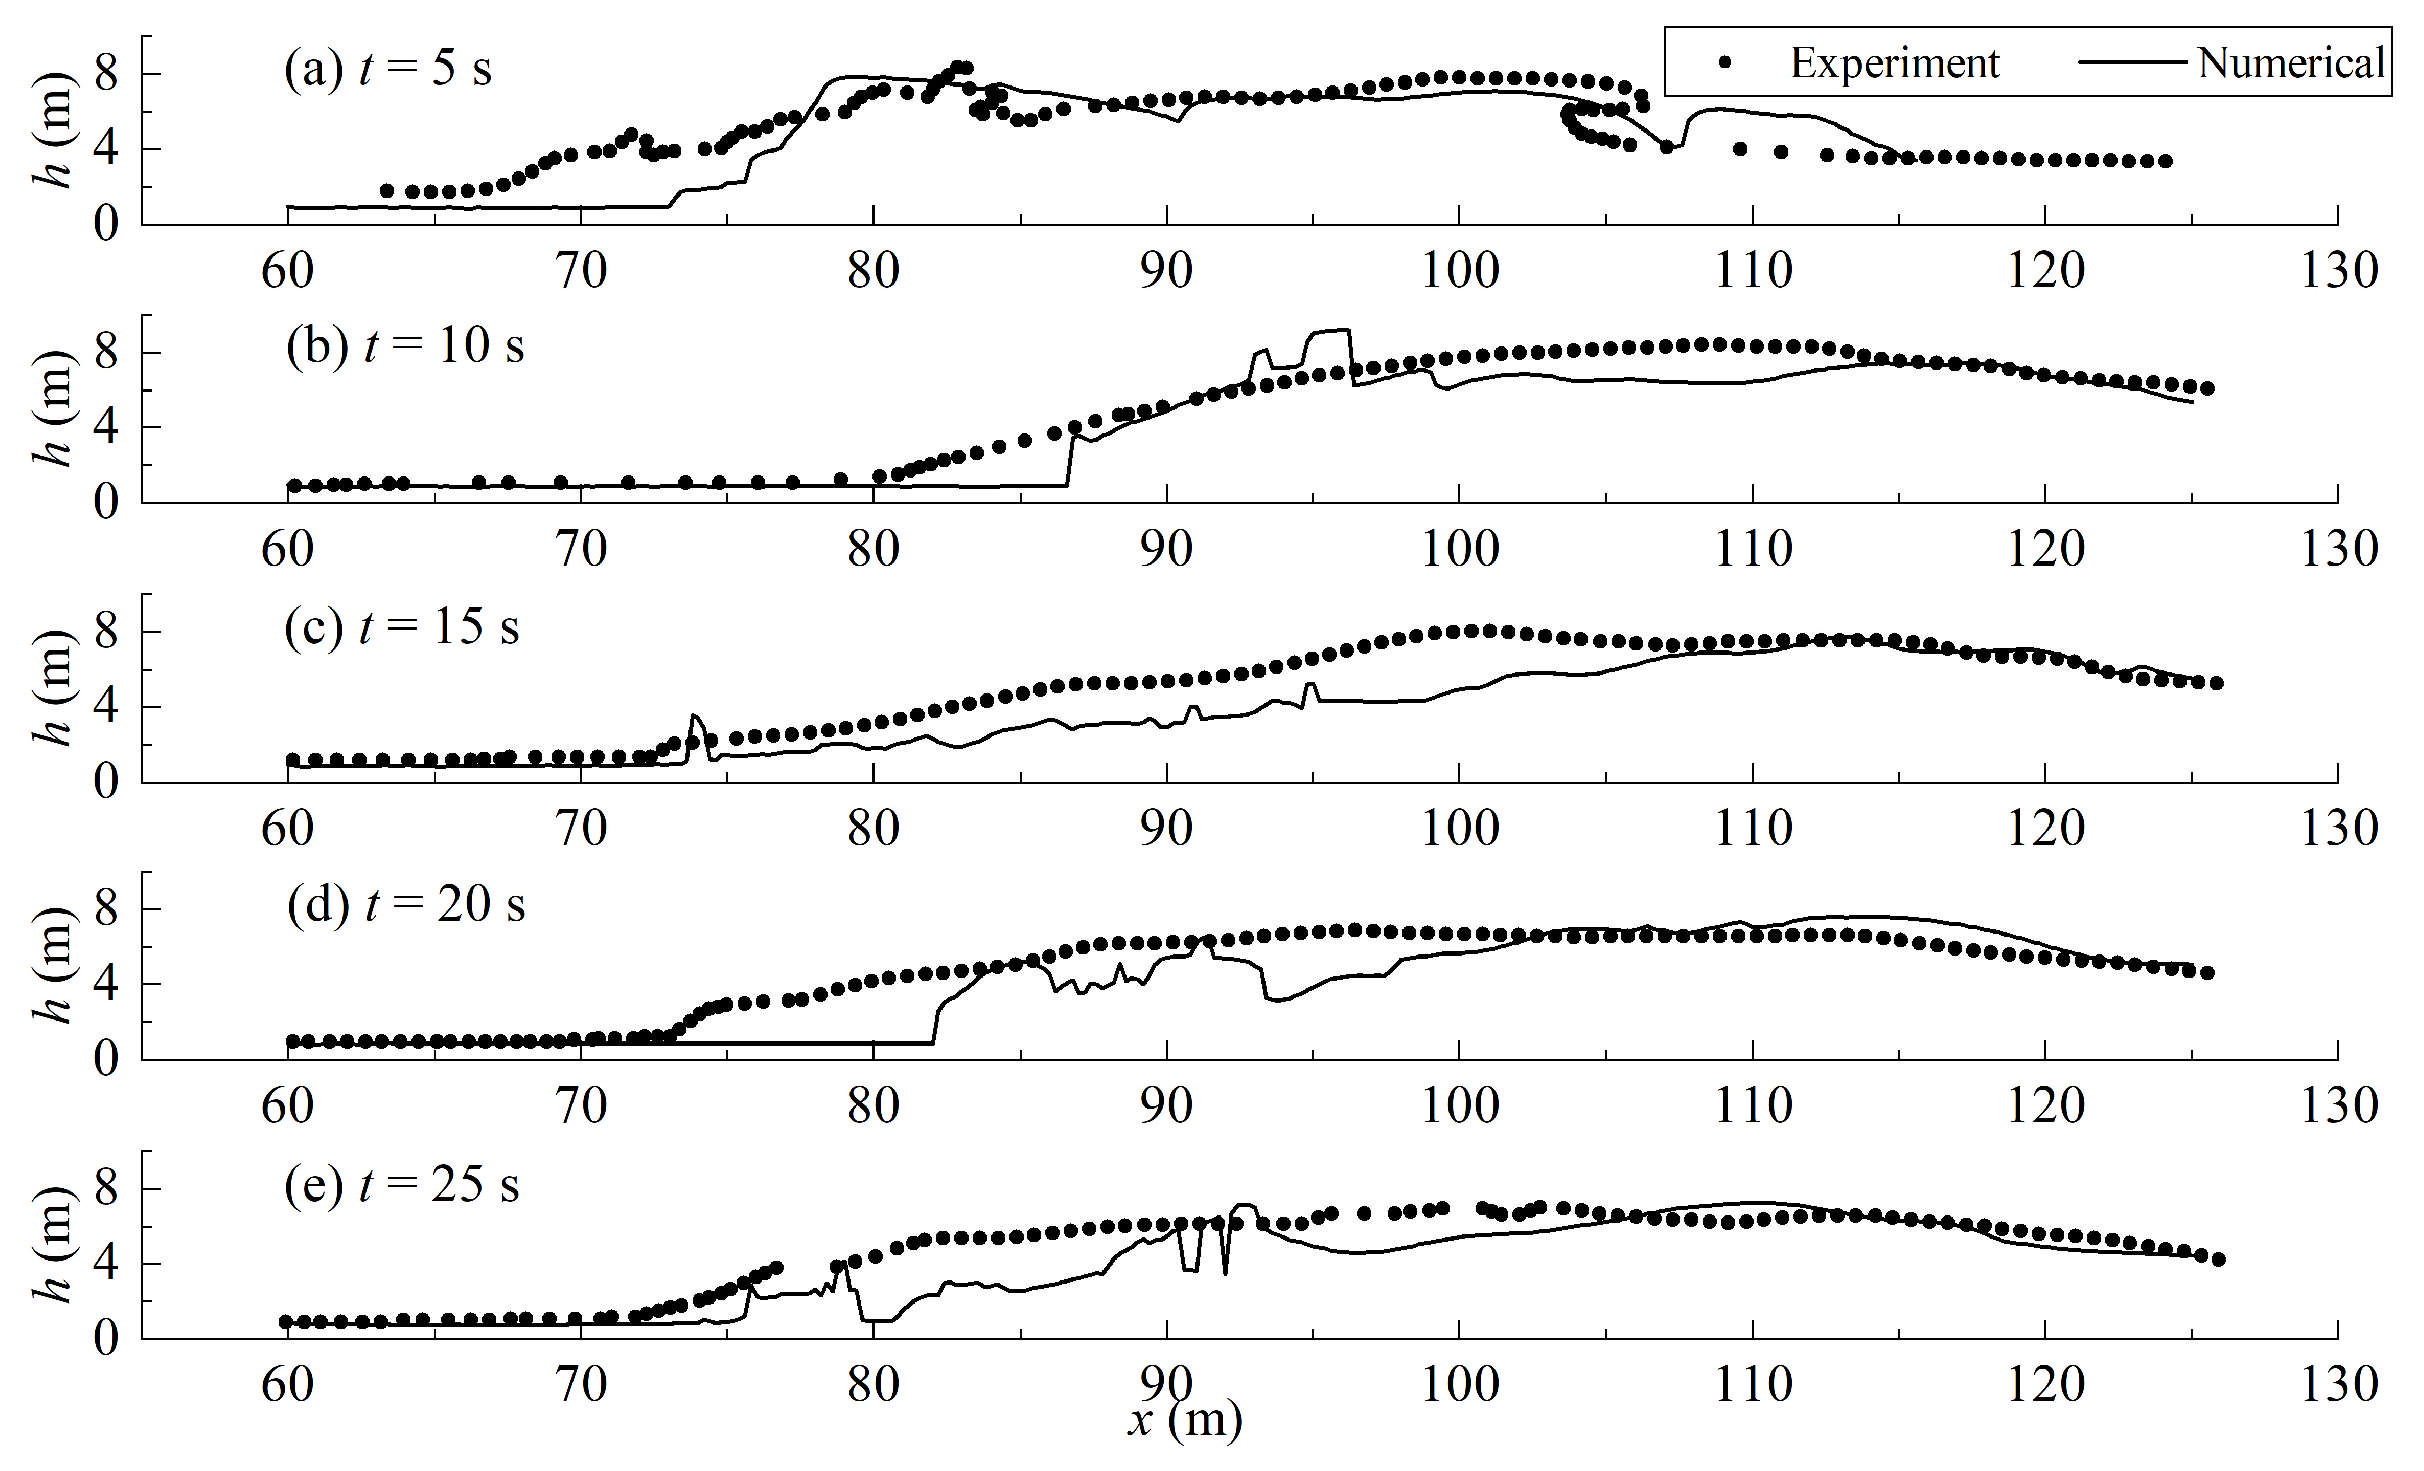
Figure 4, Figure 5 and Figure 6 present the comparative analysis of the water profile for three distinct calculated results alongside experimental data, captured at five different time instances. Figure 4, Figure 5 and Figure 6 a–e represent t = 5 s, 10 s, 15 s, 20 s, and 25 s, respectively. The color of particles represents the horizontal component of the velocity. All cases are basically similar in overall behavior. Upon the gate opening, a water wave is initiated, subsequently breaking into downstream and upstream components, leading to a hydraulic jump that travels downstream. As a hydraulic jump progresses, it eventually encounters a weir, triggering the water level to increase. This elevated free surface, in turn, exerts an influence on the hydraulic jump, causing it to reverse its direction of propagation. In three cases, the time when the hydraulic jumps shift the propagation direction is different. The direction of hydraulic jumps reverses at t = 20, 15, and 10 s in cases 1, 2, and 3, respectively. Therefore, the reversing time is gradually advanced with the increase in the Froude number. The reason may be that the larger the Froude number, the faster the velocity, and the faster the hydraulic jump develops.
Although the numerical models are capable of reasonably replicating the hydraulic jumps and the associated recirculation patterns, there exists a certain degree of discrepancy between the experimental and numerical data. Table 1 shows the L 2 errors and Root Mean Squar Errors (RMSEs) among the experimental data and three calculated data. The L2 error measures the accuracy of model calculations by comparing the relative differences between predicted values and true values. A smaller L2 error indicates that the predicted values are closer to the true values, meaning the error is smaller. Conversely, a larger L2 error signifies a greater discrepancy between the predicted and true values, resulting in a larger error. This error calculation method imposes a harsher penalty on large errors. Therefore, the L2 error is particularly sensitive to data points with significant deviations in prediction results. In general, the error increases with the increase in the Froude number. The maximum L2 error and RMSE are 0.442 and 1.494, respectively, occurring in case 2 (25 s) and case 3 (5 s and 15 s). In cases 1 and 3, it is noted that the calculated free surfaces are consistently slightly lower than the corresponding experimental data, while the opposite is true in case 2. In a word, all the calculated free surfaces have reasonable consistency with the experimental data. The calculated free surfaces from the numerical models show a high degree of agreement with the experimental data. The models accurately predict the behavior and propagation of the hydraulic jumps. The alignment between the experimental and calculated results underscores the reliability of the numerical models in simulating real-world fluid-flow conditions.
L 2 = 1 N i = 1 N h i n h i e h i e 2
where h i n represents the numerical water level; h i e represents experimental water level; and N represents the data number.
The 3D view of the hydraulic jumps for case 1 is shown in Figure 7, where (a), (b), (c), (d), and (e) represent = 5 s, 10 s, 15 s, 20 s, and 25 s, respectively. The velocity downstream of the gate is rapid, with a maximum value exceeding 10 m/s. At a certain distance downstream from the gate, a hydraulic jump forms, causing a rise in the water level accompanied by a significant decrease in velocity, even resulting in negative velocities. As time progresses, the hydraulic jump toes gradually move downstream and eventually reach dynamic stability. The hydraulic jump in the flow field exhibits distinct three-dimensional characteristics. Near the two side walls, where frictional forces exist, the jump is smaller and the velocity is slower. In contrast, near the middle section, the hydraulic jump is more pronounced, with large velocities and a more complex flow field. Therefore, the model is capable of reproducing the three-dimensional hydraulic jumps.
In general, though there is some discrepancy in the free surface because of a simple way to treat the viscosity and boundary, the experimental and calculated data are in good agreement, and the numerical model can reliably show the free surface, jump toe position, and jump skimming flow.
To test the GPU acceleration of the GPU-based SPH model for hydraulic jumps, the speedups of GPU against parallel CPU for various particle numbers of case 1 are shown in Figure 8. The speedups of GPU against parallel CPU S G = T C / T G . S G represents the speedups of GPU against parallel CPU; T C represents the calculation time of CPU; and T G represents the calculation time of GPU. The speedups of GPU are obtained by comparing GeForce GTX 1060 with 1280 CUDA cores, with a memory bandwidth of 192 GB s−1 and a theoretical peak performance of 4.4 TFlops in single precision against a CPU device using the full four cores of the Intel(R) Core (TM) i7-7700HQ with a theoretical peak performance of 0.36 TFlops in single precision. The theoretical speedup is 4.4/0.36 = 12.2. In Figure 8, the acceleration rises quickly with the increase in the particle numbers at the initial stage. The rising slows down with particle numbers greater than 0.1 million. A maximum of 12, which is basically consistent with the theoretical speedup, is reached when the particle numbers are approximately 2.7 million. Then, the speedup decreases slightly with the increase in the particle numbers. In short, the use of an inexpensive GeForce GTX 1060 can accelerate the computations ten times faster than the Intel(R) Core (TM) i7-7700HQ using all four cores when the particle numbers reach 0.1 million.

4. Study on Energy Dissipation Process of a Real Gate

4.1. Model Layout

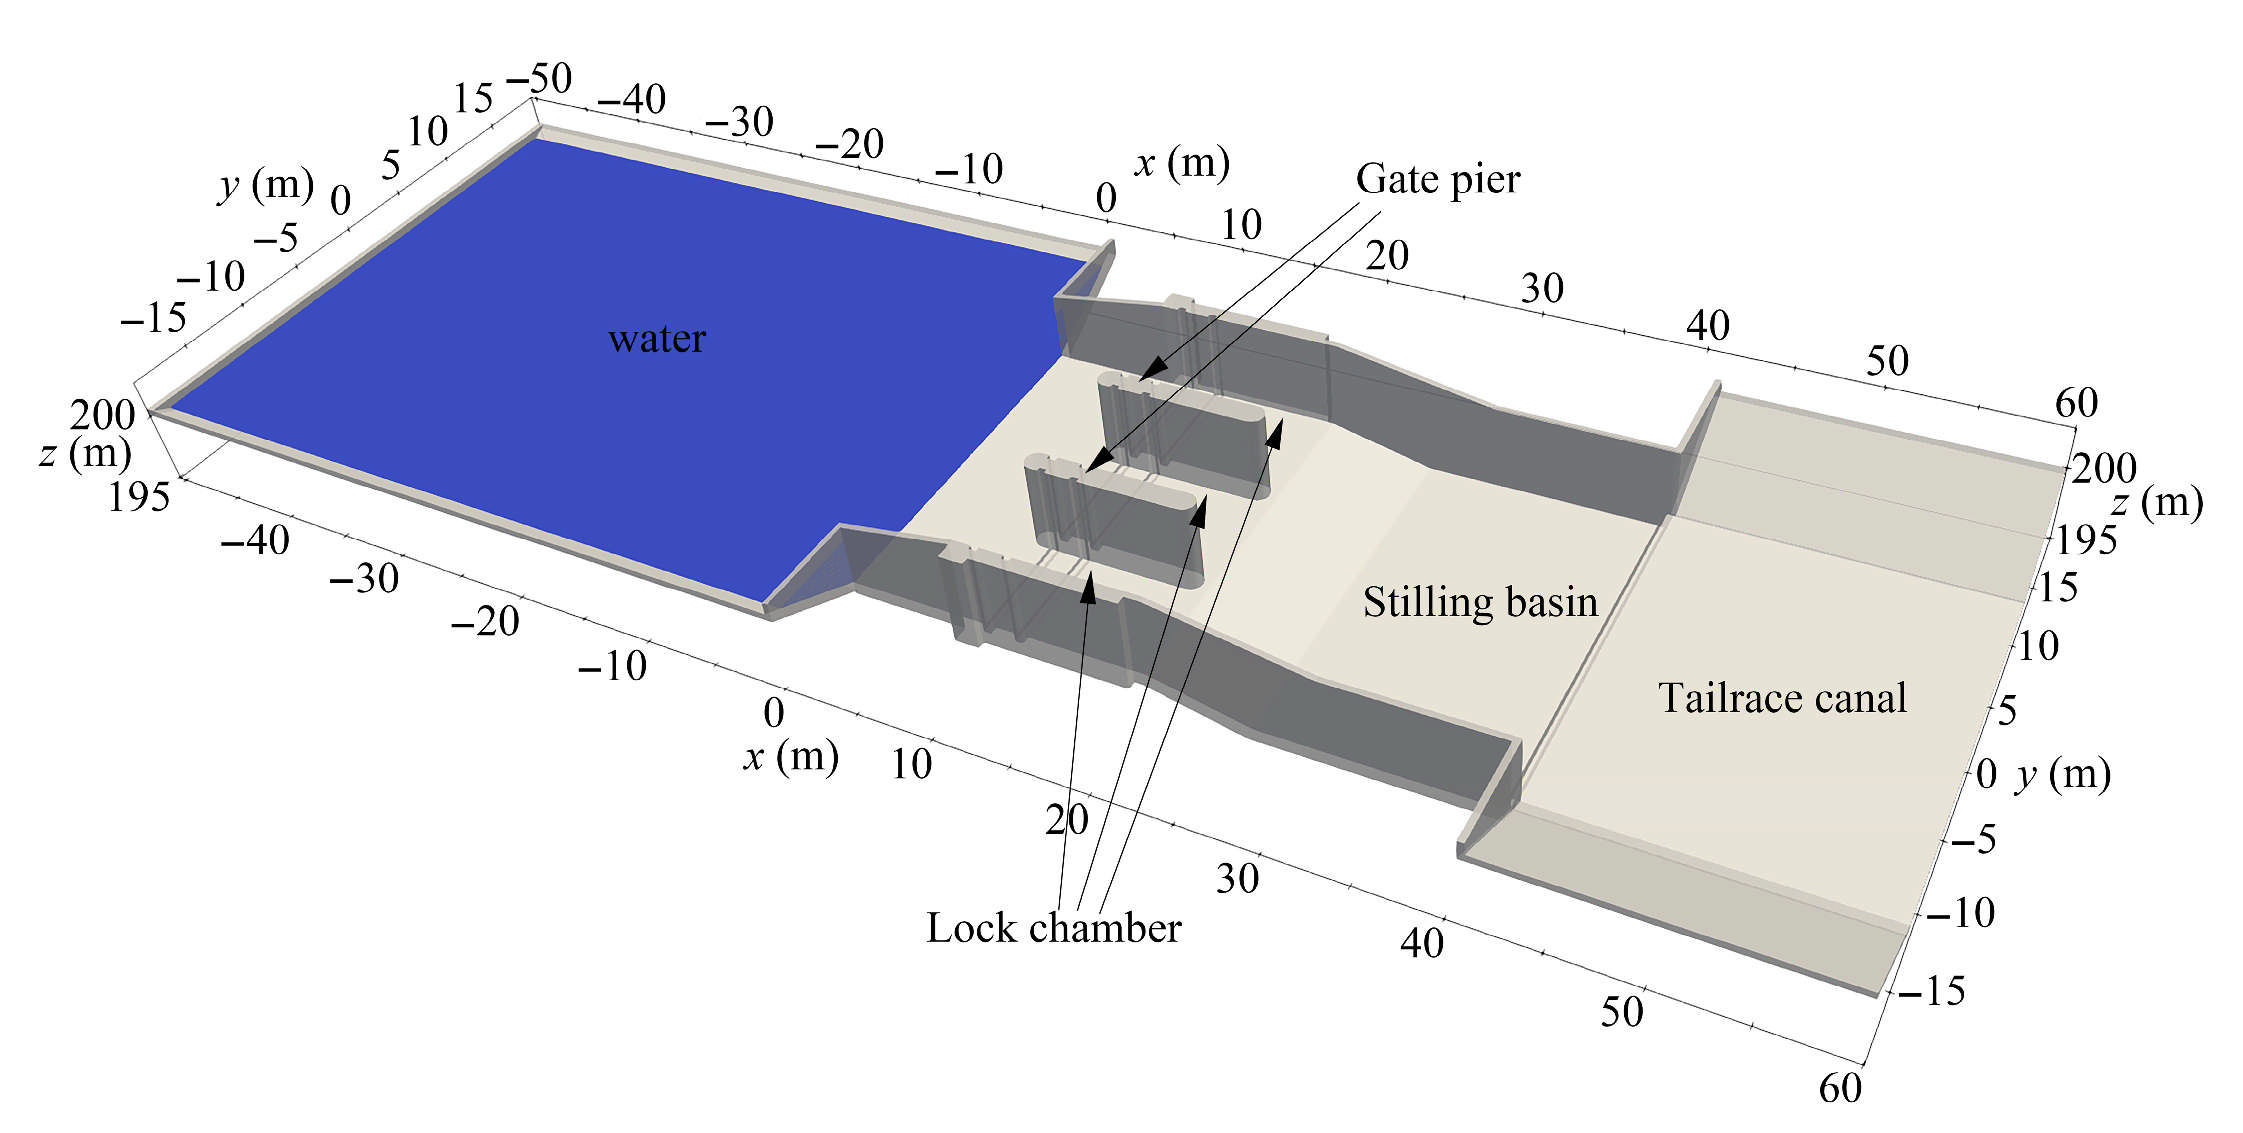
A sluice gate (Figure 9) is constructed on the Zhayin River. The gate, which is composed of an inlet channel, cover section, sluice chamber, stilling basin, apron, and tailwater channel, is a flat-bottomed gate. The length of the gate is 81 m. The top elevation of the sluice base plate is 196.9 m. There are three sluice holes, each with a net width of 7 m. The top elevation of the pier is 203.1 m. The size of the working gate is 7.0 × 3.5 m. The water level is set as the normal operating level, which is 200 m with a water depth H0 = 3.1 m, and the gate is fully opened. The open boundary condition is adopted for the downstream boundary, allowing water to flow out freely. The relative particle spacing Δ x/H0 is 0.016. The total physical time is 30 s.

4.2. Stilling Basin Flow Field

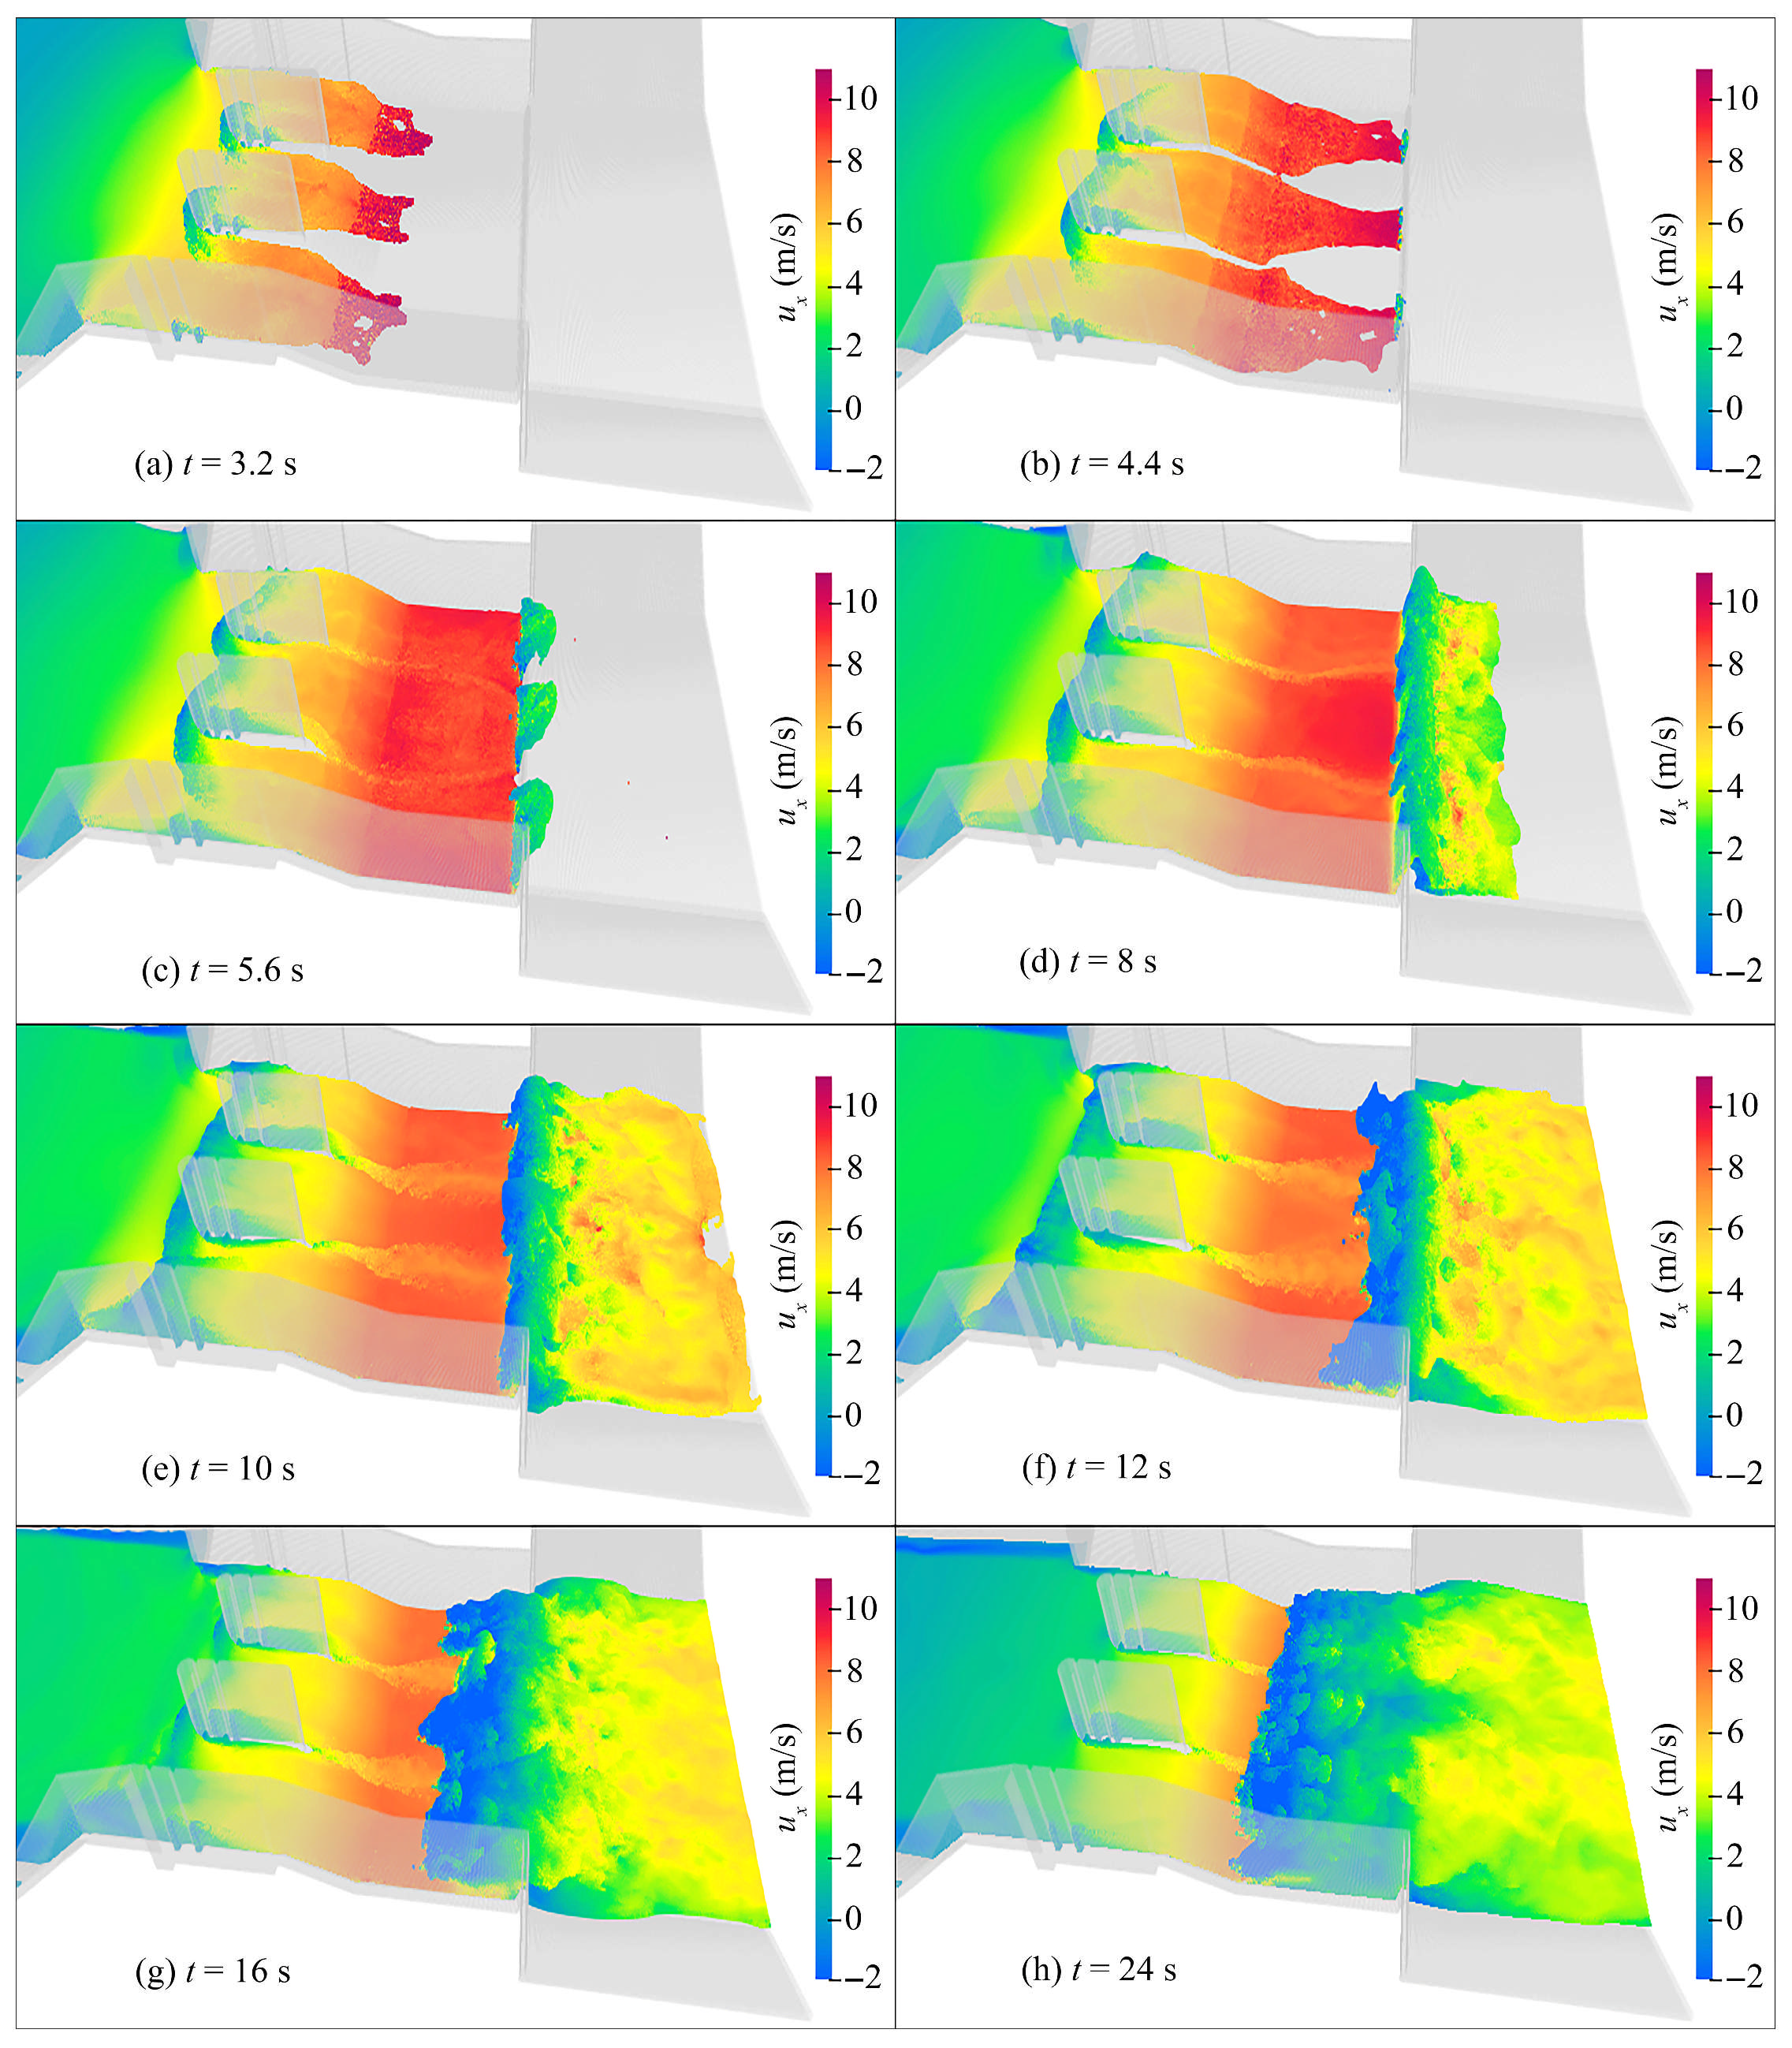
Figure 10 presents x-direction velocity fields within the stilling basin at various time instants. When t = 3.2 s, the flow enters the basin via the sluice chamber and continues to propagate downstream. This process is characterized by the water moving through the basin, potentially undergoing changes in velocity and direction due to the basin’s design and any obstacles or structures present. The incident flow velocity is notably high, with the maximum value above 11 m/s. At t = 4.4 s, the flow progresses to the downstream portion of the stilling basin, and it undergoes a division into three separate streams. These streams originate from the water that has passed through the gate chamber but has not yet merged back together. This separation can be attributed to the specific design of the structure. Subsequently, the flow with high velocity impacts against the baffle. This collision is a deliberate design feature aimed at dissipating the flow’s energy, thereby reducing its velocity and turbulence, resulting in a jet at t = 5.6 s. At this moment, the stilling basin is fully occupied by high-velocity water. It is not until t = 8 s that the lifted water falls into the downstream channel and propagates further downstream, while it leads to a hydraulic jump accompanied by a significant drop in flow velocity. The hydraulic jump starts to propagate towards the upstream direction, with the maximum negative velocity reaching −2 m/s at t = 10 s. The flow velocity gradually diminishes, and the water in the channel arrives at the downstream outlet and exits the boundary. From t = 12 s to 24 s, the hydraulic jump continuously travels upstream, leading to a gradual reduction in the flow velocity and a corresponding dissipation of flow energy. At t = 16 s, the hydraulic jump has progressed to the midsection, and it reaches the stilling basin’s entrance at t = 24 s. At this moment, the flow velocity in the downstream stilling basin is significantly reduced, with the maximum velocity decreasing to approximately 6 m/s and mainly concentrated near the entrance.
Free-surface evolution in the stilling basin: Upon the impact of the high-velocity jet on the downstream apron, the water surface rises rapidly in the impact zone, forming a local hump. Subsequently, the hump propagates downstream, and the surface begins to show the rudiment of rotating roller waves. The flow is strongly unsteady. As time advances, the scale of the roller waves expands. The water surface exhibits periodic bulges and depressions, and the wave crests break with intense aeration. During this stage, the surface fluctuations are at their most intense. The range of the breaking zone first expands and then contracts, showing typical turbulent characteristics of hydraulic jumps. Then, the energy is gradually dissipated. The amplitude of the water surface fluctuations decreases, and the wave form tends to be gentle. Finally, the breaking disappears. The tail waves gradually lengthen and eventually approach the still water surface. The stilling basin reaches a quasi-steady outflow condition. Overall, the free surface first rises sharply, then rolls violently, and finally decays steadily. This process clearly reflects the physical process of the stilling basin from strong impact to sufficient energy dissipation.
Velocity evolution in the stilling basin: A high-speed jet first skims the bed and surges downstream, exhibiting an extremely steep longitudinal velocity gradient and negligible lateral spreading. A powerful down-sweep is generated at the basin entrance. Subsequently, the jet lifts upward after impacting the bottom plate and creating a reverse backflow. The velocity vector flips in an S-shape. The circulation of the roller increases rapidly. The coupling of the high-velocity bottom-wall-attached flow and the surface reverse backflow forms a typical hydraulic jump velocity profile. As the jet expands, it induces lateral entrainment. Symmetric return currents develop on both sides, yielding a fully three-dimensional turbulent structure. Later, the main flow lifts and gradually becomes uniform as the backflow weakens. The overall velocity level decreases. The tail end tends to a smooth outflow. The jet–return-flow interaction zone is the region of the strongest turbulence, with highly variable velocity directions and large-scale vortical pairs. Near the side walls and bottom corners, velocities drop markedly, forming local slack water or secondary eddies that provide additional energy dissipation. In summary, the velocity field evolves dynamically from the jet impact to roller inversion and uniform diffusion, accomplishing the conversion and dissipation of kinetic energy into turbulent energy.

5. Conclusions

In this study, a GPU-based SPH model of 3D hydraulic jumps is established. Based on a dam-break test case, the results show that both SPH and FVM successfully capture the instantaneous propagation of the dam-break wave, demonstrating that the SPH model can reliably simulate the high-velocity flow. The model’s capacity to forecast complex and large-scale 3D symmetric full hydraulic jumps with a large Froude number is demonstrated by contrasting experimental data with the calculated free surface. A general good agreement is achieved with a maximum L 2 error of 0.442. The efficiency of the GPU-accelerated model can reach more than ten times faster than a CPU equipped with four cores when the particle numbers are larger than 0.1 million. Meanwhile, a maximum acceleration of 12, which is equivalent to the theoretical maximum speedups, is achieved with a common GPU device against the parallel CPU. Then, the GPU-based SPH model is successfully applied to study a real sluice gate project to analyze the energy dissipation. The free surface first rises sharply then rolls violently and finally decays steadily. This process clearly reflects the physical process of the stilling basin from strong impact to sufficient energy dissipation. The velocity field evolves dynamically from the jet impact to roller inversion and uniform diffusion, accomplishing the conversion and dissipation of kinetic energy into turbulent energy. In a word, the GPU-based SPH model is very suitable for simulating and investigating complex and large-scale 3D full hydraulic jumps to similar hydro-junction projects.

Author Contributions

Conceptualization, J.L. and Y.M.; methodology, J.L.; validation, R.W. and Z.T.; formal analysis, D.H.; investigation, J.L.; resources, J.Z. and L.L.; writing—original draft preparation, J.L.; writing—review and editing, Y.M.; visualization, R.W.; supervision, J.L. All authors have read and agreed to the published version of the manuscript.

Funding

The author(s) declare that financial support was received for the research, authorship, and/or publication of this article. This work was financially supported by the Special Fund Competition Allocation Project of the Guangdong Science and Technology Innovation Strategy (Grant No. 2023A01022); the Guangdong Basic and Applied Basic Research Foundation (Grant No. 2023A1515012183); the Marine Youth Talent Innovation Project of Zhanjiang (Grant No. 2024R3003, 2021E05010); the Doctor Initiate Projects of Guangdong Ocean University (No. 060302072404); the Student Innovation Team Project of Guangdong Ocean University (CXTD2023012); and the Guangdong Provincial College Students’ Innovation and Entrepreneurship training Program (S202510566061).

Data Availability Statement

The datasets used or analyzed during the current study are available from the corresponding author on reasonable request.

Conflicts of Interest

The authors declare that they have no conflicts of interest.

References

  1. Chanson, H. Convective transport of air bubbles in strong hydraulic jumps. Int. J. Multiph. Flow 2010, 36, 798–814. [Google Scholar] [CrossRef]
  2. Chanson, H. Current knowledge in hydraulic jumps and related phenomena. A survey of experimental results. Eur. J. Mech.-B/Fluids 2009, 28, 191–210. [Google Scholar] [CrossRef]
  3. Zobeyer, A.T.M.H.; Jahan, N.; Islam, Z.; Singh, G.; Rajaratnam, N. Turbulence characteristics of the transition region from hydraulic jump to open channel flow. J. Hydraul. Res. 2010, 48, 395–399. [Google Scholar] [CrossRef]
  4. Murzyn, F.; Chanson, H. Free-surface fluctuations in hydraulic jumps: Experimental observations. Exp. Therm. Fluid Sci. 2009, 33, 1055–1064. [Google Scholar] [CrossRef]
  5. Chippada, S.; Ramaswamy, B.; Wheeler, M.F. Numerical simulation of hydraulic jump. Int. J. Numer. Methods Eng. 1994, 37, 1381–1397. [Google Scholar] [CrossRef]
  6. Unami, K.; Kawachi, T.; Babar, M.M.; Itagaki, H. Estimation of diffusion and convection coefficients in an aerated hydraulic jump. Adv. Water Resour. 2000, 23, 475–481. [Google Scholar] [CrossRef]
  7. Gharangik, A.M.; Chaudhry, M.H. Numerical Simulation of Hydraulic Jump. J. Hydraul. Eng. 1991, 117, 1195–1211. [Google Scholar] [CrossRef]
  8. Zhou, J.G.; Stansby, P.K. 2D shallow water flow model for the hydraulic jump. Int. J. Numer. Methods Fluids 1999, 29, 375–387. [Google Scholar] [CrossRef]
  9. Shekari, Y.; Javan, M.; Eghbalzadeh, A. Three-dimensional Numerical Study of Submerged Hydraulic Jumps. Arab. J. Sci. Eng. 2014, 39, 6969–6981. [Google Scholar] [CrossRef]
  10. Babaali, H.; Shamsai, A.; Vosoughifar, H. Computational Modeling of the Hydraulic Jump in the Stilling Basin with Convergence Walls Using CFD Codes. Arab. J. Sci. Eng. 2015, 40, 381–395. [Google Scholar] [CrossRef]
  11. Gumus, V.; Simsek, O.; Soydan, N.G.; Akoz, M.S.; Kirkgoz, M.S. Numerical Modeling of Submerged Hydraulic Jump from a Sluice Gate. J. Irrig. Drain. Eng. 2016, 142, 04015037. [Google Scholar] [CrossRef]
  12. Azimi, H.; Shabanlou, S.; Kardar, S. Characteristics of Hydraulic Jump in U-Shaped Channels. Arab. J. Sci. Eng. 2017, 42, 3751–3760. [Google Scholar] [CrossRef]
  13. Witt, A.; Gulliver, J.S.; Shen, L. Numerical investigation of vorticity and bubble clustering in an air entraining hydraulic jump. Comput. Fluids 2018, 172, 162–180. [Google Scholar] [CrossRef]
  14. Gu, S.; Ren, L.; Wang, X.; Xie, H.; Huang, Y.; Wei, J.; Shao, S. SPHysics simulation of experimental spillway hydraulics. Water 2017, 9, 973. [Google Scholar] [CrossRef]
  15. López, D.; Marivela, R.; Garrote, L. Smoothed particle hydrodynamics model applied to hydraulic structures: A hydraulic jump test case. J. Hydraul. Res. 2010, 48, 142–158. [Google Scholar] [CrossRef]
  16. Federico, I.; Marrone, S.; Colagrossi, A.; Aristodemo, F.; Antuono, M. Simulating 2D open-channel flows through an SPH model. Eur. J. Mech.-B/Fluids 2012, 34, 35–46. [Google Scholar] [CrossRef]
  17. Chern, M.-J.; Syamsuri, S. Effect of Corrugated Bed on Hydraulic Jump Characteristic Using SPH Method. J. Hydraul. Eng. 2013, 139, 221–232. [Google Scholar] [CrossRef]
  18. Jonsson, P.; Andreasson, P.; Hellström, J.I.; Jonsén, P.; Lundström, T.S. Smoothed Particle Hydrodynamic simulation of hydraulic jump using periodic open boundaries. Appl. Math. Model. 2016, 40, 8391–8405. [Google Scholar] [CrossRef]
  19. Jonsson, P.; Jonsén, P.; Andreasson, P.; Lundström, T.S.; Hellström, J.G.I. Smoothed Particle Hydrodynamic Modelling of Hydraulic Jumps: Bulk Parameters and Free Surface Fluctuations. Engineering 2016, 8, 386–402. [Google Scholar] [CrossRef]
  20. De Padova, D.; Mossa, M.; Sibilla, S. SPH numerical investigation of characteristics of hydraulic jumps. Environ. Fluid Mech. 2017, 18, 849–870. [Google Scholar] [CrossRef]
  21. De Padova, D.; Mossa, M.; Sibilla, S. SPH modelling of hydraulic jump oscillations at an abrupt drop. Water 2017, 9, 790. [Google Scholar] [CrossRef]
  22. De Padova, D.; Mossa, M.; Sibilla, S. SPH numerical investigation of the characteristics of an oscillating hydraulic jump at an abrupt drop. J. Hydrodyn. 2018, 30, 106–113. [Google Scholar] [CrossRef]
  23. Gu, S.; Bo, F.; Luo, M.; Kazemi, E.; Zhang, Y.; Wei, J. SPH Simulation of Hydraulic Jump on Corrugated Riverbeds. Appl. Sci. 2019, 9, 436. [Google Scholar] [CrossRef]
  24. De Padova, D.; Mossa, M.; Sibilla, S.; Torti, E. 3D SPH modelling of hydraulic jump in a very large channel. J. Hydraul. Res. 2013, 51, 158–173. [Google Scholar] [CrossRef]
  25. De Padova, D.; Ben Meftah, M.; Mossa, M.; Sibilla, S. A multi-phase SPH simulation of hydraulic jump oscillations and local scouring processes downstream of bed sills. Adv. Water Resour. 2022, 159, 104097. [Google Scholar] [CrossRef]
  26. Crespo, A.; Domínguez, J.; Rogers, B.; Gómez-Gesteira, M.; Longshaw, S.; Canelas, R.; Vacondio, R.; Barreiro, A.; García-Feal, O. DualSPHysics: Open-source parallel CFD solver based on Smoothed Particle Hydrodynamics (SPH). Comput. Phys. Commun. 2015, 187, 204–216. [Google Scholar] [CrossRef]
  27. Altomare, C.; Crespo, A.J.; Domínguez, J.M.; Gómez-Gesteira, M.; Suzuki, T.; Verwaest, T. Applicability of Smoothed Particle Hydrodynamics for estimation of sea wave impact on coastal structures. Coast. Eng. 2015, 96, 1–12. [Google Scholar] [CrossRef]
  28. Monaghan, J. Simulating Free Surface Flows with SPH. J. Comput. Phys. 1994, 110, 399–406. [Google Scholar] [CrossRef]
  29. Pringgana, G.; Cunningham, L.S.; Rogers, B.D. Modelling of tsunami-induced bore and structure interaction. Proc. Inst. Civ. Eng.—Eng. Comput. Mech. 2016, 169, 109–125. [Google Scholar] [CrossRef]
  30. Barreiro, A.; Crespo, A.J.C.; Dominguez, J.M.; Garcia-Feal, O.; Zabala, I.; Gomez-Gesteira, M. Quasi-static mooring solver implemented in SPH. J. Ocean Eng. Mar. Energy 2016, 2, 381–396. [Google Scholar] [CrossRef]
  31. Canelas, R.B.; Domínguez, J.M.; Crespo, A.J.; Gómez-Gesteira, M.; Ferreira, R.M. A Smooth Particle Hydrodynamics discretization for the modelling of free surface flows and rigid body dynamics. Int. J. Numer. Methods Fluids 2015, 78, 581–593. [Google Scholar] [CrossRef]
  32. Marsooli, R.; Wu, W. 3-D finite-volume model of dam-break flow over uneven beds based on VOF method. Adv. Water Resour. 2014, 70, 104–117. [Google Scholar] [CrossRef]
Figure 1. Layout of the dam-break test case.
Symmetry 17 01564 g001
Figure 2. Comparison of the free-surface profiles obtained from the SPH model, the FVM solution, and the experimental data.
Symmetry 17 01564 g002
Figure 3. Schematic of three experimental flumes (the domain with blue color is water): (a) Case 1; (b) Case 2; (c) Case 3.
Symmetry 17 01564 g003
Figure 4. Free-surface comparison between experimental and numerical data for case 1: top (flow field); bottom (free surface).
Symmetry 17 01564 g004aSymmetry 17 01564 g004b
Figure 5. Free-surface comparison between experimental and numerical data for case 2: top (flow field); bottom (free surface).
Symmetry 17 01564 g005aSymmetry 17 01564 g005b
Figure 6. Free-surface comparison between experimental and numerical data for case 3: top (Flow field), bottom (Free surface).
Symmetry 17 01564 g006aSymmetry 17 01564 g006b
Figure 7. Three-dimensional view of hydraulic jumps for case 1.
Symmetry 17 01564 g007
Figure 8. Speedups of GPU against 4-core CPU.
Symmetry 17 01564 g008
Figure 9. Layout of the gate.
Symmetry 17 01564 g009
Figure 10. Flow field in the stilling basin.
Symmetry 17 01564 g010
Table 1. The L 2 errors between the experimental and computed free surface.
Time (s)510152025
L2 errorsCase 10.4000.2830.3310.2650.256
Case 20.3340.3300.2890.3200.442
Case 30.3620.2540.3070.3330.316
RMSECase 10.6140.5820.7520.5060.539
Case 21.1580.7990.7750.7010.706
Case 31.4941.1061.4941.4221.331
Disclaimer/Publisher’s Note: The statements, opinions and data contained in all publications are solely those of the individual author(s) and contributor(s) and not of MDPI and/or the editor(s). MDPI and/or the editor(s) disclaim responsibility for any injury to people or property resulting from any ideas, methods, instructions or products referred to in the content.