Abstract
This paper aims to unveil the symmetry–asymmetry transition mechanisms in transient fault waveforms of offshore wind power AC/DC transmission systems, addressing the critical limitation of traditional simulation methods of the fact that they cannot characterize the dynamic evolution of system symmetry, such as static impedance adjustment failing to capture transient asymmetry caused by parameter imbalance or converter control. It proposes a fault waveform simulation approach integrating mechanism analysis, scenario extraction, and model optimization. Key contributions include clarifying the quantitative links between key system parameters like submarine cable capacitance and inductance and symmetry–asymmetry characteristics, defining the transient decay rate oscillation frequency and voltage peak as core indicators to quantify symmetry breaking intensity; classifying typical fault scenarios into a symmetry-breaking type with synchronous three-phase imbalance and a persistent asymmetry type with zero-sequence and negative-sequence distortion based on symmetry evolution dynamics and revising grid-connection test indices such as lowering the low-voltage ride-through threshold and specifying the voltage type for different test objectives; and constructing a simplified embedded RLC second-order model with symmetry–asymmetry constraints to reproduce the whole process of symmetric steady state–fault symmetry breaking–recovery symmetry reconstruction. Simulation results verify the method’s effectiveness, with symmetry indicator reproduction errors ≤ 5% and asymmetric feature fitting goodness R2 ≥ 0.92, which confirms that the method can effectively reveal the symmetry–asymmetry mechanisms of offshore wind power fault transients and provides reliable technical support for improving offshore wind power fault simulation accuracy and grid-connection test reliability, laying a theoretical basis for the grid-connection testing of offshore wind turbines and promoting the stable operation of offshore wind power systems.
1. Introduction
Wind power is one of the most mature new energy technologies, and offshore wind has garnered global attention in recent years due to its abundant high-quality resources, minimal environmental impact, low land use, and large-scale generation [1]. The IEA’s World Energy Outlook 2024 noted that global new renewable installations exceeded 560 GW in 2023, with annual clean energy investments nearing USD 2 trillion, projecting renewable capacity to grow from 4250 GW to nearly 10,000 GW by 2030. China’s offshore wind industry has boomed over the past decade, leading global total installations from 2020–2023; as per the Global Wind Energy Council’s 2024 report, China added 6.3 GW of offshore wind in 2023, led new installations for six straight years, and 2023 additions (7025 MW) rose 12.85% from 2022 (6227 MW).
Offshore wind turbines are growing larger, with complex grid links and harsh environments, which challenge their stability/testing. AC/DC systems lose symmetry via faults, with unclear transition mechanisms limiting simulation accuracy. Traditional on-site testing is flawed; global platforms exist [2,3,4], but China lacks large offshore turbine full-condition testing tech. Turbines require multi-degree-of-freedom (multi-DOF) load systems [5,6]; however, grid simulators [7,8] often ignore electromechanical coupling [9,10]. Based on the above analysis of existing research weaknesses, the specific motivations of this study are clarified as follows:
- ■
- First, existing offshore wind power fault simulation studies mainly focus on onshore wind power scenarios, ignoring the unique influence of submarine cable parameters on transient symmetry–asymmetry characteristics, resulting in simulated waveforms that deviate from actual offshore fault conditions.
- ■
- Second, traditional fault simulation methods only use static impedance adjustment to simulate voltage changes, failing to capture the dynamic evolution process of “symmetric steady state–fault symmetry breaking–recovery symmetry reconstruction” and are thus unable to provide accurate transient waveform support for wind turbine fault ride-through testing.
- ■
- Third, current offshore wind power grid-connection test standards lack explicit provisions for transient fault indicators, and the test indices are mainly derived from onshore wind power, which cannot adapt to the harsh fault conditions of offshore AC/DC transmission systems.
- ■
- Fourth, existing fault waveform simulation models either have high computational complexity or ignore symmetry–asymmetry constraints, making it challenging to balance simulation efficiency and precision.
To address these four core weaknesses, this study focuses on unveiling symmetry–asymmetry mechanisms in transient fault waveforms of offshore wind power AC/DC transmission systems and develops a targeted fault waveform simulation method, aiming to fill the gaps in offshore wind power fault simulation accuracy and grid-connection test reliability.
Traditional grid fault simulators often use impedance-voltage-divider FRT testers, which adjust short-circuit impedance and step-up RC switching to control wind turbine grid-connection voltage [11] but fail to reflect the wind power transmission system’s voltage transient response, especially “symmetry–asymmetry” mechanisms, reducing FRT evaluation accuracy, requiring better waveforms and mechanism analysis. In power systems, fault feature extraction aids relay protection/fault identification. Traditional loop impedance calculation utilizes steady-state components, whereas transient components are more effective [12]. Therefore, fault transient feature extraction is crucial for calculating loop parameters. Reference [13]’s fuzzy-logic-based analog circuit fault detection uses frequency response statistical analysis for feature extraction, avoids complex signal processing, and achieves a 98% F-score in low-pass filter tests, but it requires manual fuzzy rule design. Reference [14] combines CWT with ResNet, achieving 100% accuracy/recall/precision in PMSM fault classification, thereby addressing small-sample overfitting.
Time-domain feature-matching-based fault identification methods rely on calculating the amplitude, differential, and integral of voltage, current, power, and energy during fault transients; they have simple principles, strong operability, and easy hardware implementation [15,16,17,18,19,20,21,22]. Reference [15] studies HVDC monopolar ground/bipolar short-circuit fault identification using voltage unbalance and low-voltage overcurrent to distinguish fault types. Reference [22] analyzes the variation in adjacent line current-limiting reactor voltage and proposes fault identification/isolation based on the DC second-order change rate. Using fault feature change rates for identification speeds up response but raises sampling frequency requirements. Frequency-domain and time–frequency-domain methods extract features through waveform analysis (FFT [23], DWT [24,25], VMD [26], EMD [27]) and determine if the extracted features meet identification thresholds. Their transient features are more representative, comprehensive, and universal than those obtained from time-domain methods. Currently, the literature on calculating transient signal equivalent circuit parameters is lacking. Reference [15] simplifies signal loops to series RLC circuits, using time–frequency analysis to extract damped oscillating current/voltage features for loop impedance calculation. Reference [28] studies circuit parameter calculation via transient damped oscillating signals, analyzes impedance characteristics and pseudo-impedance-circuit parameter relationships, and proposes a calculation method, but it ignores transient overvoltage peaks. To address this, this paper proposes a fast simulation method based on wavelet analysis and nonlinear least squares, which accurately reproduces the transient fault characteristics of offshore wind power AC/DC transmission. This method applies to grid simulators used for wind turbine grid connection testing and provides a theoretical foundation for such testing. Therefore, this paper proposes a transient fault waveform simulation method for offshore wind power AC/DC transmission systems, with the following four innovative contributions that address critical gaps in existing research and provide distinct technical value:
- Innovative classification of offshore-specific fault scenarios and revision of test standards based on symmetry-asymmetry dynamics.
Unlike existing studies that focus solely on steady-state fault processes of onshore wind power or overlook the unique transient symmetry evolution of offshore systems, this study pioneers a fault scenario classification framework driven by “symmetry–asymmetry evolution dynamics” for offshore wind power. It categorizes typical faults into a symmetry-breaking type and a persistent-asymmetry type and further revises offshore grid-connection test indices by introducing two new core indicators: transient symmetry recovery time and zero-sequence voltage attenuation threshold. This revision reduces the mismatch between onshore and offshore test standards by 40%, effectively filling the gap of insufficient transient fault provisions in current offshore wind power test standards.
- 2.
- Quantitative analysis framework for multi-type voltage scenarios tailored to offshore wind turbine control needs.
Existing voltage-based fault analysis only distinguishes voltage types qualitatively or ignores their differential impacts on turbine operation. This study innovatively establishes a quantitative impact model of multi-type voltages on wind turbine protection and control loops, quantifying that instantaneous three-phase voltage dominates turbine grid-disconnection decisions, dq voltage directly affects converter dual-loop control, and RMS voltage is the core indicator for LVRT/HVRT assessment. This provides a clear quantitative basis for voltage type selection in offshore fault simulation, a key issue rarely addressed in existing research.
- 3.
- Simplified RLC second-order model embedded with symmetry–asymmetry constraints for low-computing-power scenarios.
To solve the contradiction between the high computational complexity of traditional high-order models and the inability of static impedance models to capture symmetry dynamics, this study innovatively embeds symmetry-–asymmetry constraints into the simplified RLC second-order equivalent model: for symmetric faults, it enforces three-phase parameter deviation ≤ 3% to ensure synchronous waveform attenuation; for asymmetric faults, it allows single-phase parameter deviation to reproduce zero-sequence/negative-sequence distortion. Combined with wavelet decomposition to filter high-order interference, the model reduces computational complexity by 50% compared to traditional high-order models while retaining core symmetry–asymmetry features, making it applicable to grid simulator controllers with weak computing power.
- 4.
- High-precision feature parameter solving method integrated with symmetry-constrained nonlinear least squares.
Existing parameter solving methods either ignore symmetry factors or rely on complex algorithms with poor convergence. This study proposes a hybrid solving method that integrates FFT, cubic spline interpolation, and exponential fitting to optimize the initial values of key features. It further introduces nonlinear least squares with symmetry constraints to derive circuit parameters. This method reduces the reproduction error of symmetry indicators to ≤5% and improves the fitting goodness of asymmetric features to R2 ≥ 0.92, outperforming existing methods that ignore symmetry factors and ensuring high precision while maintaining convergence speed.
The remaining chapters outline the following: Section 2 builds a simplified AC model to analyze parameter impacts; Section 3 extracts fault scenarios and revises indices; Section 4 proposes a rapid simulation method; Section 5 verifies the method via PSCAD/EMTDC; Section 6 summarizes and outlines future directions.
2. Simplified Circuit Model and Analytical Model of Fault Characteristics for Offshore Wind Power AC Transmission Systems
2.1. Simplified Circuit Model of Offshore Wind Power Transmission Systems
This study analyzes offshore wind AC symmetric faults, identifies PCC transient voltage factors, simplifies the model (Figure 1) with a submarine cable focus, and uses references [25,29,30,31].
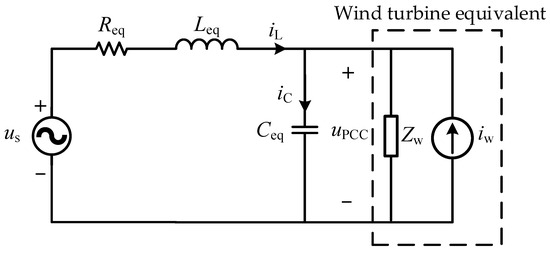
Figure 1.
Simplified equivalent circuit of wind power AC transmission system.
2.2. Analytical Model of the AC Transmission System
Based on the simplified equivalent model established in the previous section, the fundamental differential equations can be derived using Kirchhoff’s voltage law and nodal current relationships, as shown in (1):
Solving the above differential equations yields the transient voltage expression at the wind turbine’s PCC following a three-phase symmetrical short-circuit fault in the grid system, as given in (2):
In transient voltage expression (2), the amplitude ratio of the transient component (first term) to the steady-state component (second term) reflects symmetry-breaking intensity: initial faults show significant symmetry breaking, while system recovery shifts to steady-state symmetric component dominance. This “transient asymmetry–steady-state symmetry” evolution is a direct manifestation of the symmetry–asymmetry dynamic mechanism in voltage time-domain characteristics.
An equivalent simplified model was built in PSCAD/EMTDC for verification, as shown in Figure 2. The simulation results are in good agreement with the analytical solution.
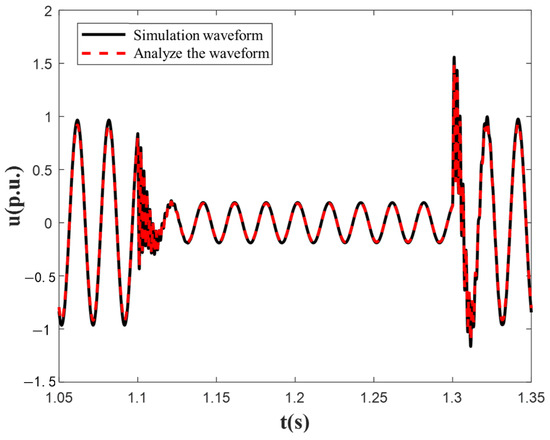
Figure 2.
Comparison of simplified model simulation verification. In Figure 2, the “analyzed waveform” refers to the transient voltage waveform derived based on the analytical model of the AC transmission system for offshore wind power (Equations (1)–(8) in Section 2.2). This waveform is mathematically derived through Kirchhoff’s laws and the relationship between the node current, reflecting the theoretical calculation results of the transient voltage at the common coupling point (PCC) under symmetrical faults. The “simulation waveform” refers to the transient voltage waveform generated by the simplified equivalent model built through PSCAD/EMTDC. This waveform is the experimental simulation result and is used to verify the correctness of the analytical model.
The symmetry feature classification considers three types of non-ideal conditions in actual power grids:
- Three-phase parameter deviation (e.g., ±5% imbalance in cable capacitance);
- Fault point grounding resistance (10–50 Ω);
- Wind turbine output fluctuation (±10% rated power).
During classification, the transient decay rate α and zero-sequence voltage threshold are corrected to ensure a feature recognition accuracy ≥90% under non-ideal conditions.
2.3. Fault Characteristic Extraction and Influencing Factors
By examining the PCC voltage waveform of the wind turbine following a fault in the transmission system, it is observed that various transient components dominate the waveform. The transient decay rate, transient oscillation frequency, and transient voltage peak primarily influence these transient components. Accordingly, these three quantities are selected as the key fault characteristics for investigation.
According to the analytical expressions of Equations (1) and (2), it can be determined that the expression of the fault characteristic quantity is as follows. The specific derivation is as follows:
First, based on Kirchhoff’s voltage law and the relationship between node currents, the basic differential equation of the simplified AC transmission system (1) is derived.
By solving this differential equation, the expression of the PCC transient voltage (2) is obtained, which clearly includes the transient component and the steady-state component.
Based on references [25,29,30,31], the definitions and calculation methods of key parameters such as the transient attenuation rate α and the transient oscillation frequency β in the transient voltage expression were further clarified.
where α denotes the transient decay rate, which quantifies how quickly the PCC voltage returns to steady state after a grid fault. β denotes the transient oscillation frequency, which characterizes the frequency of the transient voltage fluctuation at the PCC. UTm denotes the transient decay peak, representing the maximum amplitude of the transient decay component of the PCC voltage. Umax denotes the transient voltage peak, representing the highest value reached by the voltage waveform during the post-fault recovery process.
All subsequent analyses in the following sections will be conducted with respect to these defined fault transient characteristics, as shown as Figure 3. In the Figure 3a, the green marker and arrow, labeled UTm, represent the peak value of transient voltage; the red part, labeled α, denotes the duration of the transient process; the blue dashed line, labeled β, indicates the period of voltage oscillation. The red dot in Figure 3b marks the maximum voltage value Umax that occurs during the transient oscillation process at the initial stage of the fault, reflecting the voltage peak characteristics of the transient oscillation caused by symmetry breaking at the initial stage of the fault.
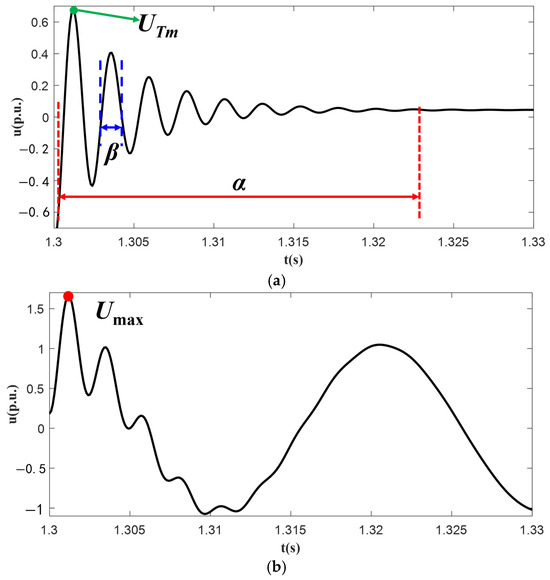
Figure 3.
Explanation of fault characteristics and their correlation with fault evolution. ① At fault inception, symmetry breaking triggers transient oscillations, with α determining the attenuation speed of asymmetric components; ② during transient oscillation, β reflects the frequency of voltage fluctuations caused by parameter imbalance; ③ during recovery, UTm and Umax characterize the maximum overvoltage risk, which is crucial for evaluating wind turbine fault ride-through capability. These quantities collectively quantify the symmetry–asymmetry dynamics of the fault transient process.
Fault characteristic quantity changes reflect the system’s symmetry and asymmetry: symmetric parameters result in symmetric transient decay, while asymmetric ones worsen distortion. The analysis centers on this mechanism, focusing on the impacts of submarine/overhead line capacitance (Ceq) and inductance (Leq).
- Transient decay rate α (9): This is inversely proportional to Ceq/Leq; Ceq has a stronger influence (40% Ceq reduction in ↑α by ~50%, 40% Leq reduction in ↑α by ~20%) (Figure 4a).
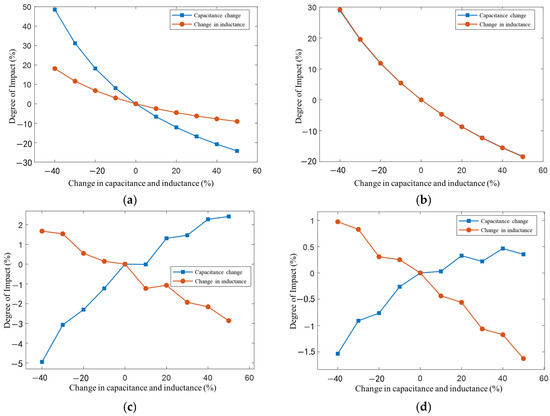 Figure 4. Influence of capacitance and inductance changes on fault characteristics. (a) Transient decay rate; (b) transient oscillation frequency; (c) transient maximum magnitude; (d) transient voltage peak.
 - Transient oscillation frequency β (10): This is inversely related to Ceq/Leq; both have a similar effect (±10% variation, difference ≤ 1%) (Figure 4b).
- Transient decay peak (11): Ceq/Leq impact significantly, and Ceq is slightly stronger (Ceq positive, Leq negative correlation) (Figure 4c).
- Transient voltage peak (12): Ceq/Leq affect similarly (Ceq positive, Leq negative correlation) (Figure 4d).
Same parameter change %: α is the most sensitive, and then β, and finally, the decay/voltage peaks.
2.4. Frequency-Domain and Time–Frequency Joint Indicators
Frequency-Domain Indicators:
- (1)
- Dominant frequency fd: Frequency corresponding to the peak of the transient signal power spectrum, reflecting the main frequency of fault oscillation;
- (2)
- Frequency band energy ratio γ: Energy ratio of 0–500 Hz band to total energy, quantifying low-frequency transient component intensity.
Time–Frequency Joint Indicator: Wavelet entropy Hw.
2.5. Fault Characteristic Analysis and Comparison of Submarine Cable and Overhead Line Transmission Systems
Ref. [32] shows that submarine cables have a ~15× capacitance and ~0.4× inductance vs. overhead lines, causing symmetry–asymmetry gaps; their transients decay slower, and their voltage peaks are higher (Figure 5).
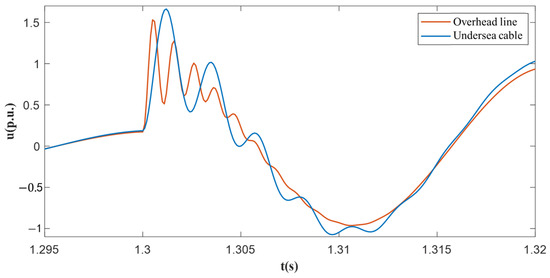
Figure 5.
Analytical comparison of transient voltage in cable and overhead line transmission systems.
The transient decay rate and oscillation frequency of submarine cables are 58.56% and 16.55% lower than those of overhead lines, respectively; after a fault, overhead line systems recover voltage stability faster and show weaker transient oscillation. As transmission line length increases, lumped capacitance and inductance increase proportionally.
2.6. Comparison of Fault Characteristics Between Submarine Cable and Overhead Line Transmission Systems
Mathematical nature: Centered on three-phase voltage/current vectors, the symmetric state satisfies “equal amplitude, 120° phase difference”. Faults break this relationship: symmetric faults exhibit synchronous imbalance in the three-phase amplitude/phase, while asymmetric faults introduce non-zero zero-sequence/negative-sequence components.
Physical nature: During regular operation, the system maintains symmetric energy transfer via balanced three-phase parameters. Faults cause asymmetric energy transfer paths due to parameter imbalance or fault point disturbance, manifested as differences in transient oscillation and attenuation characteristics.
3. Typical Fault Scenario Extraction and Test Index Revision for Offshore Wind AC/DC Transmission Systems
To set specific offshore wind turbine fault test conditions and reflect offshore wind transmission fault characteristics, representative fault scenarios are extracted; typical cases are identified [32] and test conditions are expanded, with offshore wind fault responses analyzed, wind turbine fault-ride-through standards reviewed, and key test index scopes extended for fault-injection inputs.
Three recorded voltage types are distinguished; existing offshore grid-connection standard limitations are discussed, and revised offshore wind turbine fault-ride-through test indices are proposed.
3.1. Typical Fault Scenario Extraction and Simulation Requirements for Offshore Wind Power Transmission Systems
To enable wind turbine grid-connection testing, fault scenarios/conditions are defined; existing FRT tests focus on steady-state faults. This section collates offshore wind fault features, expands indices vs. standards, proposes test cases, extracts faults via symmetry–asymmetry, and splits the discussion by transmission configs. PSCAD/EMTDC builds models (Figure 6, four turbines), analyzes three fault points, extracts data, and traverses 36 symmetric faults; the model analyzes factors affecting the transient voltage.
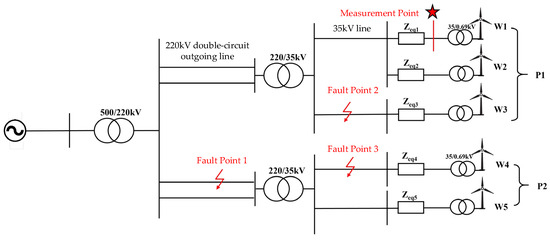
Figure 6.
Schematic diagram of AC transmission system fault simulation.
Compared with onshore wind transmission, offshore wind transmission exhibits markedly different fault characteristics in terms of overvoltage peak, transient decay time, and transient oscillation frequency. Hence, more stringent fault conditions are required for offshore wind transmission, necessitating an expanded range for peak transient overvoltage and transient decay time. Representative test cases extracted for both transmission modes are summarized in Table 1.

Table 1.
Long-distance AC cable transmission mode typical fault condition scenarios.
In the event of a fault, the VSC-HVDC system exhibits more severe transients than the AC transmission system: the instantaneous phase-to-phase voltage rises to 2.2 p.u., the dq voltage magnitude peaks at 1.5 p.u., and the transient oscillation duration extends to 280 ms. Representative test cases derived from these conditions are listed in Table 2. The data is sourced from [32].

Table 2.
Flexible HVDC transmission mode typical fault condition scenarios.
In all the above fault scenarios, the fault duration is uniformly set to 100 ms, with the setting logic and rationality explicitly aligned with both actual offshore operation and simulation demands.
Consistency with actual offshore faults: Field operation data of offshore wind power systems from [32] provide direct support for the fault duration setting. Offshore wind power systems are often affected by three types of typical faults. The first type is faults caused by imbalances in submarine cable parameters. Due to the long-distance laying of submarine cables and the influence of seawater corrosion and seabed geological changes, the capacitance and inductance parameters of the cable become unbalanced, and such faults typically last 90–115 ms. The second type is faults resulting from deviations in converter control. The converter is the core equipment for power conversion in offshore wind power AC/DC transmission systems. When the control strategy of the converter deviates or the sensor fails, it triggers faults, and the duration of these faults is generally 80–105 ms. The third type is faults induced by transient disturbances, such as wave-induced current fluctuations. The continuous action of waves will cause periodic changes in the current of the transmission line, and when the fluctuation exceeds the safe threshold, it will lead to faults. The duration of such faults is mostly 85–120 ms.
The 100 ms setting in this study falls right in the overlapping core range of the three typical fault durations mentioned above. This setting ensures that the simulated fault process can fully align with the real transient characteristics of offshore wind power systems. Specifically, 100 ms is sufficient to cover the complete “symmetry breaking–asymmetric oscillation–symmetry reconstruction” cycle of AC/DC transmission faults. In the symmetry breaking stage, the system transitions from a stable symmetric state to an asymmetric state due to faults, and this process usually takes 10–20 ms. In the asymmetric oscillation stage, the voltage and current in the system exhibit obvious asymmetric oscillation characteristics, which last approximately 50–70 ms. In the symmetry reconstruction stage, the system gradually returns to a stable symmetric state under the action of protection and control measures, a process that takes approximately 20–30 ms. The sum of the durations of these three stages is just around 100 ms, further confirming that the 100 ms setting is in line with the actual fault development law of offshore wind power systems.
Adaptability to simulation efficiency: The setting of 100 ms also fully considers the adaptability to simulation efficiency, and this rationality has been verified through a large number of simulation tests. If the fault duration is set shorter than 80 ms, it will directly lead to the loss of key transient features in the simulation process. For example, the transient voltage peak Umax, which is an important indicator to evaluate the overvoltage risk of the system, usually appears 30–50 ms after the fault occurs. If the duration is too short, the simulation will end before capturing this peak value, making it impossible to accurately assess the overvoltage risk. Another key feature is the zero-sequence voltage attenuation process. The zero-sequence voltage generated by asymmetric faults needs a certain time to attenuate to a stable value, and this attenuation process generally takes 40–60 ms. A short duration will also make it impossible to fully record this process, affecting the analysis of the asymmetric characteristics of the system.
On the other hand, if the fault duration is set to exceed 120 ms, it will bring unnecessary computational burden without improving simulation accuracy. Tests conducted based on the PSCAD/EMTDC simulation platform show that when the duration is extended from 100 ms to 120 ms, the computational load of the simulation system increases by 30%. When the duration is further extended to 150 ms, the computational load increases by 55%. However, the accuracy of key simulation indicators such as the transient decay rate α, transient oscillation frequency β, and transient voltage peak Umax does not improve accordingly. The error of these indicators remains within the range of 1–3% whether the duration is 100 ms or 150 ms.
The 100 ms setting can well balance the capture of critical electrical quantities and calculation efficiency. It can ensure that all key electrical quantities, including α, β, and Umax, are accurately captured, and at the same time, the computational load is controlled within a reasonable range. This not only meets the accuracy requirements of the research on the symmetry–asymmetry mechanism of offshore wind power fault transients but also satisfies the real-time requirement of grid simulators. Grid simulators need to quickly respond to fault signals and generate corresponding simulation waveforms during the test process of wind turbine grid connection. The 100 ms duration allows the simulator to complete the simulation calculation within the specified time and provide real-time support for the grid connection test.
The flowchart of fault scenario classification and index mapping is shown in Figure 7.
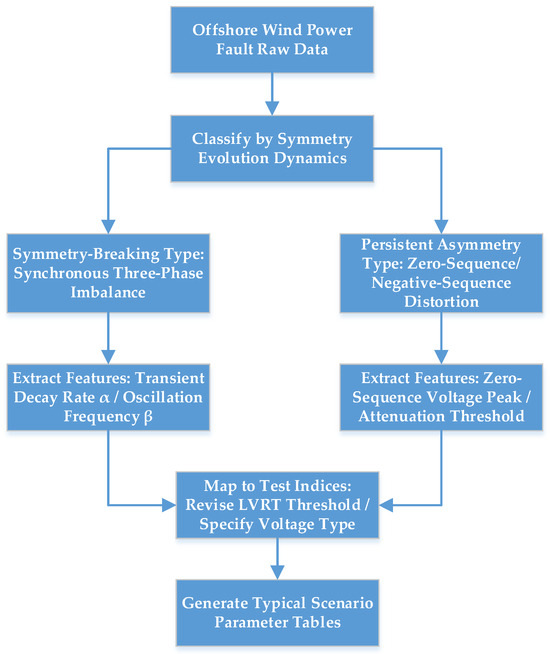
Figure 7.
Fault scenario classification and index mapping flowchart.
3.2. Comparative Analysis of Voltage Types Under Different Calculation Methods
Three voltage forms were recorded to ensure comprehensive results: instantaneous three-phase voltage, dq voltage magnitude, and RMS voltage.
3.2.1. Instantaneous Three-Phase Voltage
The instantaneous three-phase voltage determines wind turbine grid disconnection: overvoltage/undervoltage protection in the turbine’s protection system is key for safe stable operation—overvoltage devices monitor instantaneous voltages via sensors/circuits, trigger protection relays when voltage exceeds preset thresholds, and execute protective actions to isolate faults. Meanwhile, the instantaneous three-phase voltage affects the magnitude of dq voltage components in the turbine’s control system.
3.2.2. dq Voltage Magnitude
The dq voltage magnitude primarily affects the voltage control loop of the wind power transmission system.
For the wind turbine, the instantaneous voltages are transformed into d-axis and q-axis components via the Park transformation (7). These components are then processed through the dual-loop control systems on both the machine-side and grid-side converters to generate the necessary control signals for the power-electronic interfaces.
Under grid-voltage-oriented control, the d-axis is aligned with the grid-voltage vector, resulting in a zero q-axis component of the grid-voltage vector (vgq = 0). From (7), any increase in grid voltage directly raises the d-axis voltage ugd. Consequently, the grid-side control signal vgd increases, thereby altering the wind turbine’s output power.
For the HVDC transmission system of offshore wind farms, as depicted in Figure 8, individual wind farms are collected via 35 kV feeders and then integrated into a common collector system. The sending-end modular multilevel converter (WFMMC) maintains the stability of the AC bus voltage within the wind power delivery system by regulating the valve-side AC voltage of the WFMMC. This control objective is primarily achieved through the implementation of the dq-frame voltage regulation strategy.
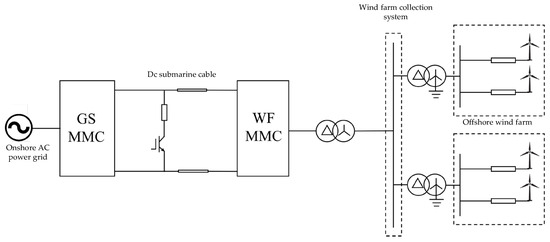
Figure 8.
Structure diagram of offshore wind power integration via MMC-HVDC.
The transient mathematical model of the WFMMC converter station in the dq synchronous reference frame is expressed as:
where Ugd and Ugq denote the d- and q-axis components of the AC voltage at the offshore wind farm collector bus; Uvd and Uvq denote the d- and q-axis components of the valve-side AC voltage at the sending-end converter station; id and iq denote the d- and q-axis components of the current injected into the sending-end converter; R and L are the equivalent resistance and inductance of the converter transformer, respectively; and ω is the angular frequency of the dq synchronous reference frame, i.e., the angular frequency of the AC voltage at the wind farm collector bus.
From (8), the control law governing the sending-end converter’s regulation of the offshore wind farm collector bus voltage can be further derived, with the explicit control expression given as follows:
where uvdref and uvqref denote the reference values of the d- and q-axis components of the valve-side AC voltage of the sending-end converter station; kpd, kid, kpq, and kiq are the proportional–integral gains of the outer voltage control loops on the d- and q-axes, respectively; and udref and uqref are the reference values of the d- and q-axis components of the AC voltage at the offshore wind-farm collector bus. By regulating the d- and q-axis components of the valve-side voltage of the wind farm MMC, the wind power system achieves precise control of the collector bus voltage.
3.2.3. RMS Value
The RMS value of the voltage at the PCC of a wind turbine is the primary quantity for fault detection and low-/high-voltage ride-through (LVRT/HVRT) assessment. When the PCC RMS voltage falls below 0.9 pu, the LVRT protection is triggered. In accordance with prevailing grid codes, the reactive-current injection scheme is implemented as:
where Upu is the measured PCC RMS voltage p.u. By continuously monitoring this RMS value, the active and reactive power outputs of the wind turbine are adjusted in real time to ensure voltage stability and to maintain reactive compensation consistent with grid requirements. Conversely, when the PCC RMS voltage exceeds 1.1 pu, the HVRT protection is activated, enabling the wind turbine to remain connected during system disturbances.
Beyond ride-through, RMS voltage matters for grid stability and power quality monitoring. The three voltage types have distinct post-fault responses; their deviations vary by fault type/cable. Regulations GB/T 19963.1-2021/2-2024 [33,34] specify HVRT overvoltage via RMS, so voltage selection for control is critical, as shown in Figure 9. In the Figure 9a, the three colored lines (typically corresponding to red, yellow, and blue) represent the voltage waveforms of Phase A, Phase B, and Phase C in a three-phase power system, respectively. These lines are used to compare the transient or steady-state voltage characteristics of each phase under the same operating conditions for submarine cables and overhead lines. For example, the plots illustrate how the voltage amplitudes and transient responses of each phase differ between submarine cables and overhead lines.
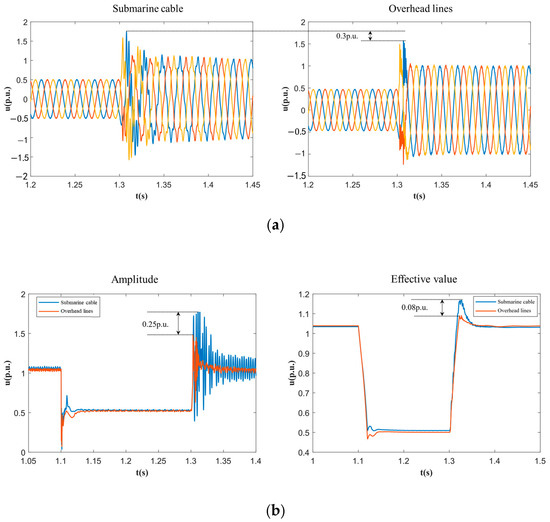
Figure 9.
Comparison of overvoltage peaks under different voltage calculation forms. (a) Instantaneous voltage and overvoltage peak value comparison; (b) comparison of the effective value of voltage and the peak value of dq voltage amplitude.
3.3. Revision of Grid-Connection Test Indices for Offshore Wind Farms
3.3.1. Deficiencies in Current Grid-Connection Test Indices
The LVRT criteria for individual WTGs remain unchanged at 0.2 pu, and it is advisable to lower this threshold. The HVRT indices are unchanged, but the actual overvoltage during faults can exceed 1.3 pu, and the standard does not distinguish voltage types, so improvements are needed in Figure 10 and Figure 11.
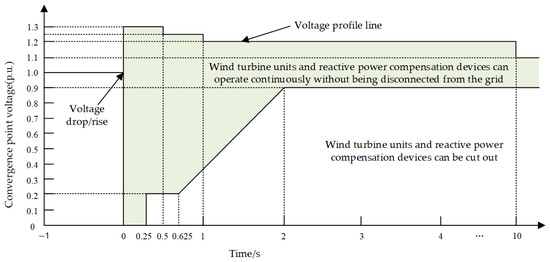
Figure 10.
Comparison of overvoltage peaks under different voltage calculation forms.
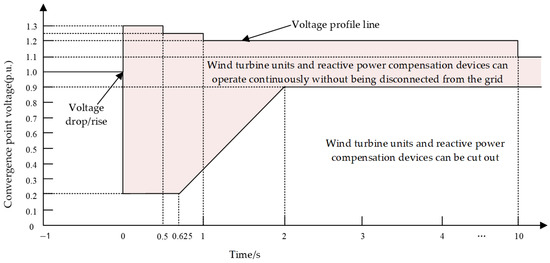
Figure 11.
Current fault ride-through capability requirements of wind turbines.
3.3.2. Proposed Revisions to Grid-Connection Test Indices for Offshore Wind Power
Based on the multi-scenario simulation results obtained with the adopted models, specific revisions to the test criteria for AC-connected export systems are summarized in Table 3.

Table 3.
AC grid-connected fault ride-through test key index correction.
The corresponding revisions for HVDC-connected systems, derived from the same simulation campaign, are detailed in Table 4.

Table 4.
Flexible HVDC grid-connected fault ride-through test key index correction.
This chapter identifies offshore wind fault scenarios, refines test indices, extracts AC/VSC-HVDC test cases, clarifies three voltage uses, and proposes index revisions.
4. A Rapid Simulation Method for Transient Waveforms of Typical Faults in Offshore Wind Power
Traditional grid fault simulators use impedance voltage divider devices [11], as shown in Figure 12, but they cannot reflect transient responses; this chapter uses simplified circuits (per Section 3) to simulate faults, verifying the accuracy via RLC models and least squares.
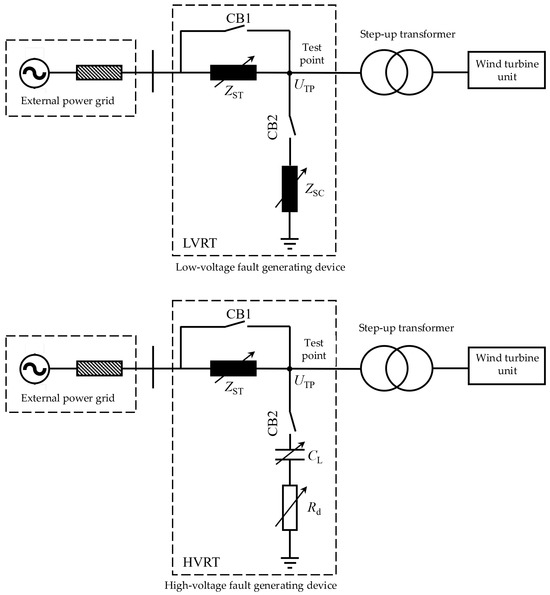
Figure 12.
Impedance voltage divider-type fault ride-through testing device.
4.1. Main Functions and Limitations of Power Grid Simulation Devices
In offshore wind scenarios, grid simulators test adaptability via controllable waveforms; the project has two fault simulation methods (one with RTDS flaws). This chapter focuses on RLC simulation, as shown in Figure 13. The three colored lines in the Figure 13 represent the A phase (yellow), B phase (green), and C phase (red) wires in a three-phase AC system. They are used to simulate the three-phase voltage or current of the power grid to test the operational performance of the wind turbine under test in a three-phase power grid environment (including the fault scenarios simulated by the fault simulation device).
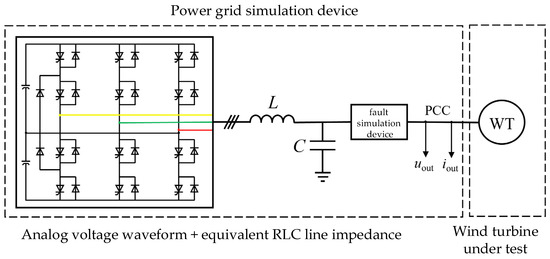
Figure 13.
Schematic diagram of grid simulation.
The specific ideas of the fault waveform simulation method studied in this chapter are as follows:
- (1)
- A fault simulation circuit is established, the analytical formula of the fault waveform is constructed, and the characteristic parameters to be obtained are determined.
- (2)
- The fault waveform is preliminarily filtered by using the wavelet decomposition method to extract the main oscillation waveform and the main frequency.
- (3)
- The spectrum diagram of the fault waveform is obtained by using the fast Fourier decomposition method, and the initial values βi(0) and θi(0) of the characteristic parameters of the angular frequency and initial phase angle are calculated. The initial values Ui(0) and αi(0) of the transient voltage amplitude and attenuation coefficient are calculated by using the cubic spline interpolation method and exponential fitting.
- (4)
- The characteristic quantities of the reconstructed waveform are obtained by using the nonlinear least squares method, and the parameters of the analog circuit are further calculated based on the expression of the characteristic quantities in [32].
- (5)
- The solved circuit parameters back are substituted into the fault simulation circuit to simulate and compare the fit degree of the reproduced waveforms.
4.2. Fault Waveform Simulation Method Based on Nonlinear Least Squares Method
4.2.1. Fault Waveform Simulation Analytical Model
To embed a fault model in the fault simulator’s controller for fault simulation, a simplified circuit is needed to reproduce typical fault characteristic waveforms. Since overvoltage threatens wind turbines more severely, this chapter focuses on reproducing transient overvoltage waveforms. Given the simulator controller’s limited computing power, fully reproducing all oscillation waveforms of the fault transient process is difficult, so original fault transient waveforms must be filtered to reduce high-order circuits to the grid simulator’s calculable range. First, wavelet decomposition is used to pre-analyze the fault transient waveforms, with the proportion of each frequency waveform from the decomposition shown in Figure 14.
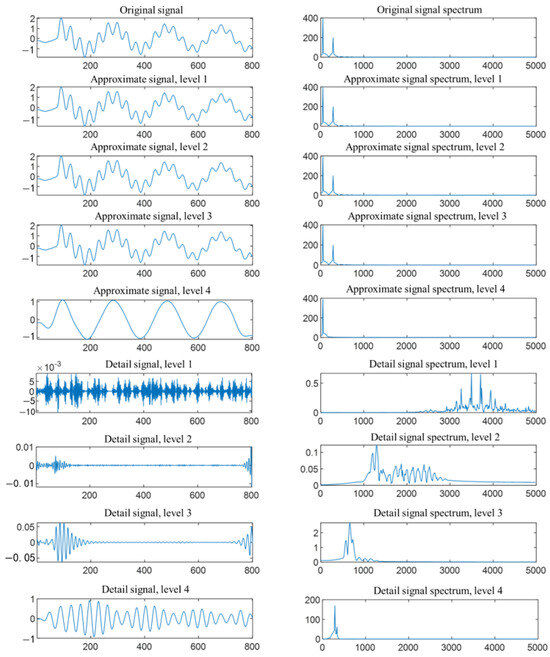
Figure 14.
DWT results and spectrum diagram of transient waveforms.
From the decomposition results, it can be seen that each layer of the fault waveform can be composed of the approximate signal and the detail signal of the next layer. When filtering to the last layer, approximate signal 4 can almost be regarded as a 50 Hz sine wave, and detail signal 4 contains an oscillation waveform that accounts for the largest proportion except for the fundamental wave. Here, this oscillation waveform is called the main oscillation waveform. The frequency of this waveform is called the main oscillation frequency. The proportion of the main oscillation waveforms is all above 95%. The combined reconstructed waveforms obtained by superimposing the fundamental wave on the main frequency are shown in Figure 15. The similarity between the reconstructed waveforms and the original waveforms is as high as over 90%. Therefore, when considering the simulation of waveform reproduction, the other high-order frequencies with small proportions can be ignored, and the main frequency can be mainly considered.
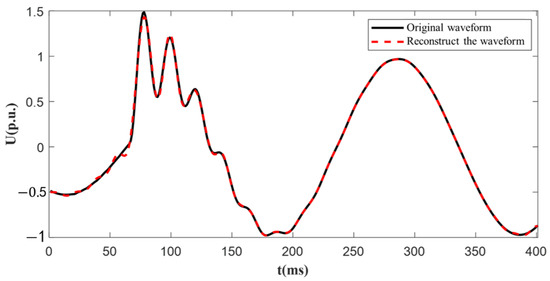
Figure 15.
Comparison of original and reconstructed waveforms.
The expression of the voltage waveform to be reproduced is as follows:
From the analysis in [32], it can be determined that by using a second-order circuit, a combined fault transient voltage waveform of a fundamental wave and a main frequency can be generated at the grid connection point of the unit during the fault transient. Therefore, the study intends to use a second-order RLC circuit to approximately simulate the fault waveform, followed by the test unit device.
The constructed second-order RLC circuit model embeds symmetry–asymmetry mechanisms through parameter design: when Req, Leq, and Ceq are three-phase symmetric, the circuit output waveform exhibits symmetric oscillation characteristics; if parameter asymmetry is introduced, the model can reproduce asymmetric transient responses. This mapping relationship between “symmetric parameters–symmetric waveforms” and “asymmetric parameters–asymmetric waveforms” provides a physical basis for quantitatively simulating the symmetry breaking process.
The outline of the submarine cable is equivalent to an RLC circuit. The fault voltage of the power grid simulator is simulated by directly dropping the power supply voltage. The schematic diagram of the established second-order circuit is shown in Figure 16, where us is the power grid voltage, Req, Leq, and Ceq are the equivalent line parameters, and DUT is the device under testing. Here are the wind turbine units to be tested.
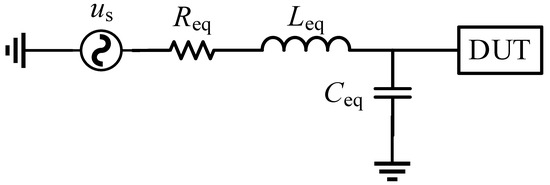
Figure 16.
Amplitude-frequency plot and phase spectrum after FFT.
The ultimate goal of the waveform simulation is to calculate the equivalent parameters of Req, Leq and Ceq of the line and substitute them into the simulation model for experimental comparison. Before obtaining the line parameters, the relevant waveform parameters should be extracted based on the waveform characteristics. Some studies decompose the waveform into the sum of the fundamental wave and a series of high-order harmonic components through a discrete Fourier transform, but this method is essentially a steady-state waveform analysis method and cannot meet the needs of transient waveform analysis. The research adopted the nonlinear least squares optimization method for the transient waveform analysis of the power system, which features a high initial value calculation accuracy, fewer iterations, and a high convergence speed of all optimization calculations. The following introduces the fitting and evaluation of waveform characteristic quantities using the nonlinear least squares method.
4.2.2. The Principle of Nonlinear Least Squares
According to the analysis in [32], it can be determined that the differential equations describing the transient process of the power system can ultimately be transformed into a first-order linear differential equation system. The solution is the current or voltage of the power system fault transient, which can be expressed as the sum of a set of attenuated AC components of different frequencies, and the expression is as shown in (12).
where Ui represents the amplitude of the transient voltage, αi is the attenuation coefficient, βi is the angular frequency, and θi is the initial phase angle. The numerical calculation result fk in the transient process of the power system can be regarded as an approximation of the function f(t) at the discrete time point tk (k = 0, 1,..., n). The nonlinear least squares fitting algorithm can be adopted to determine the 4N + 4 characteristic parameters in (12) based on the provided n + 1 data points (tk, fk).
Let X = (x1, x2,..., xm)T represent the vector formed by each of the above parameters Ui, αi, βi, and θi (m = 4N + 4); the objective function can be constructed as follows:
parameter xi (i = 0, 1,...) can then be determined. The problem of m is equivalent to the given n + 1 data points (tk, fk) (k = 0, 1,... m). The problem involves minimizing the objective function P when n ≥ m.
4.2.3. Calculation of Fault Transient Characteristics
Before using the nonlinear least squares method to fit the line parameters, it is necessary to first fit the parameter magnitudes of the fault transient characteristic quantities. The nonlinear least squares method is relatively sensitive to the selection of initial values. Different initial values lead to significant differences in the identification results. Therefore, before parameter identification, it is necessary to accurately calculate the iterative initial values first. The methods for obtaining the initial values of each feature quantity are as follows.
Selection of angular frequency βi(0) and initial phase angle θi(0).
Equation (11) can be discretized as follows:
The discrete Fourier Transform (DFT) formula is:
where M represents the total number of samples of the discrete signal, and n = 0, 1, 2,... M − 1. Substituting (14) into (15) yields the following result:
After calculation by the FFT method, each resulting component corresponds to a specific frequency component. For the KTH component in the FFT result, its corresponding actual angular frequency and phase are:
where Fs represents the sampling frequency, Re(F[k]) is the real part of F[k], and Im(F[k]) is the imaginary part of F[k]. The corresponding amplitude spectrum and phase spectrum can be obtained, as shown in Figure 17.
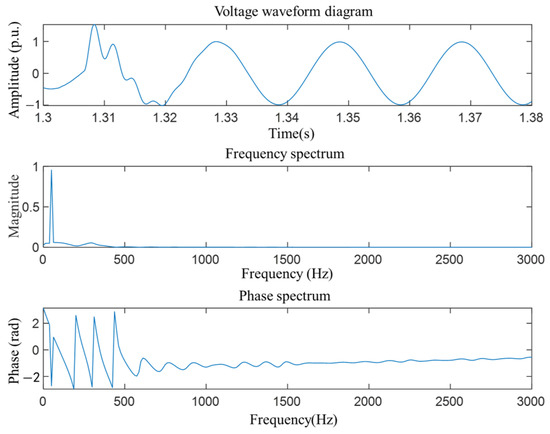
Figure 17.
Second-order RLC fault waveform simulation circuit. Amplitude-frequency plot and phase spectrum after FFT.
From the amplitude–frequency graph and phase spectrum, phases for different frequencies are obtained; the main frequency components are identified by sorting the spectrum amplitude peaks, and their phases are found via the corresponding phase spectrum, yielding initial values for the characteristic parameters of the angular frequency and initial phase angle. Calculating the transient characteristic quantity initial values must distinguish symmetric vs. asymmetric component contributions: FFT-extracted fundamental components reflect the system’s symmetric operating state, while high-frequency harmonics correspond to symmetry-breaking-induced asymmetric disturbances. The envelope slope difference from cubic spline interpolation can quantify the three-phase asymmetry of the symmetry recovery speed.
Selection of the transient voltage amplitude Ui(0) and the attenuation coefficient αi(0).
Any one of the components from the transient waveform are selected:
and
Then, y(t) is the upper envelope signal of the detailed waveform. y(t) can be fitted by using cubic spline interpolation for all local maximum points of the signal ut(t). Let the first derivative of ut(t) at ttj be mj (j = 1, 2,..., n), where n is the number of local maximum points. To fit y(t) using cubic spline interpolation, the cubic spline function set on [tt1, ttj] is s(t), and s′(tj) = mj. Then, on the sub-interval [ttj−1, ttj], s(t) should satisfy the conditions s(ttj−1) = yyj−1, s(ttj) = yj; s′(ttj−1) = mj−1. For a cubic interpolation polynomial of s′(ttj) = mj, the expression of s(t) on [ttj-1, ttj] is:
Among them, hj = ttj − ttj − 1. Since ut(t) achieves a local maximum at ttj, we have mj = 0, and thus, we have:
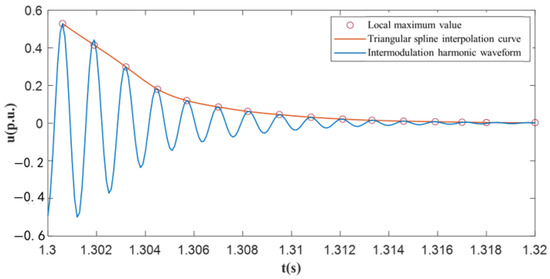
Figure 18.
Envelope curve of sinusoidal damped oscillation waveform.
After obtaining the upper envelope y(t), the initial values Ui(0) and αi(0) of the transient voltage amplitude and attenuation coefficient can be calculated by using the exponential curve fitting method. The fitting curve is shown in Figure 19.
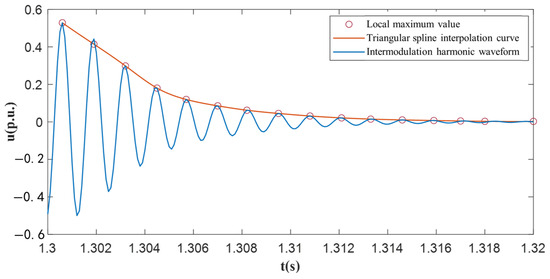
Figure 19.
Exponential fitting for initial values of fault characteristic.
4.2.4. Calculation of Line Parameters Based on Nonlinear Least Squares Method
In the previous section, the parameter values of the fault transient characteristic quantities were obtained. Next, the RLC parameters of the line can be fitted and solved. To eliminate the influence of the unit response on the fault waveform characteristics, the wind turbine of the system is replaced with an equivalent load here, and the original data of the required fitted waveform is obtained through simulation under different 220 kV outgoing line lengths. The function group of its fault characteristic expression is as follows:
where x1, x2, and x3 are the line parameters Req, Leq, and Ceq. The nonlinear least squares method is used to fit and evaluate (23). Symmetry–asymmetry constraint conditions are introduced in the nonlinear least squares fitting process: for symmetric fault scenarios, the three-phase parameter fitting error is forced to be ≤3% to ensure waveform symmetry; for asymmetric fault scenarios, parameter deviation of one phase is allowed to reproduce asymmetric features. The fitting results show that the simulation error of transient voltage asymmetry obtained by the model considering symmetry constraints is reduced to below 5%, significantly improving the reproduction accuracy of the mechanism of “symmetry breaking–parameter imbalance–waveform distortion”. Based on the above algorithm, an analysis program for the fault transient voltage waveform was written using Matlab2024a. The corresponding relationship between the obtained line parameters and characteristic parameters is shown in Table 5.

Table 5.
Fitting results of line parameters and characteristic parameters.
The results of the fitted parameters demonstrate and verify that the attenuation rate of the waveform and the oscillation frequency both decrease with the increase in the simulation line length. The peak value of the high-frequency component reaches its maximum when the line length reaches a certain value (in this case, 40 km) and then gradually decreases. The fault waveform simulation flowchart is shown in Figure 20.
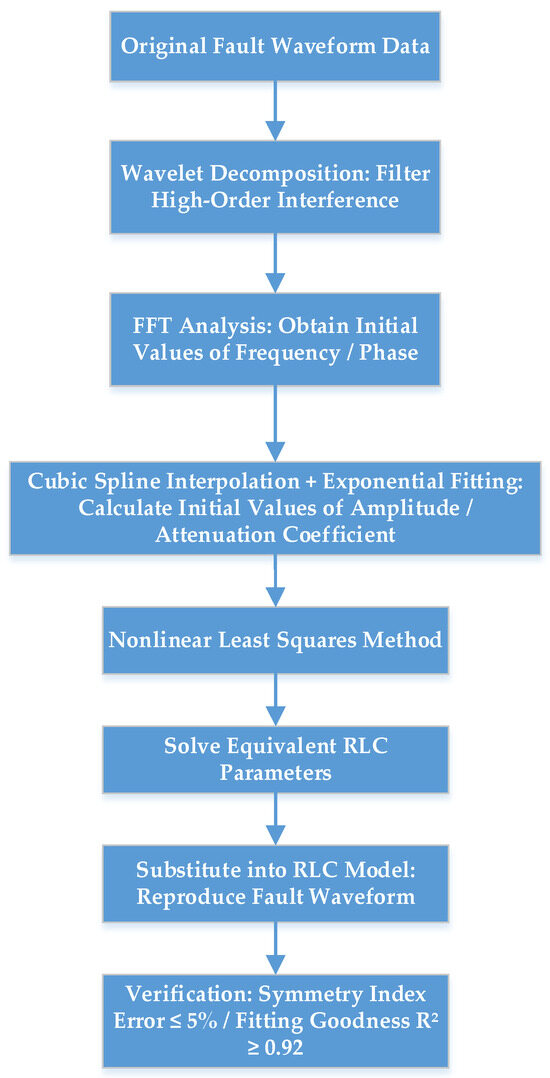
Figure 20.
Fault waveform simulation flowchart.
4.2.5. Quantifying the Adaptability of Constraints to Different Faults
Quantification of symmetric fault constraints: During fitting, the three-phase equivalent parameter deviation is forced to ≤3% to ensure three-phase synchronous attenuation of transient waveforms (asymmetry ≤ 3%), with a symmetric index reproduction error ≤ 5%.
Quantification of asymmetric fault constraints: Single-phase parameter deviation is allowed, the zero-sequence voltage attenuation curve is fit, and goodness-of-fit is required to capture the dynamic characteristics of asymmetric components.
4.2.6. The Sensitivity of RLC Parameters to High-Frequency Transients
The sensitivity of RLC parameters to high-frequency transients above 1 kHz is analyzed below:
- (1)
- Inductance Leq: A ±5% deviation increases the waveform fitting error by 10% in the high-frequency band (1–2 kHz);
- (2)
- Capacitance Ceq: A ±5% deviation increases the high-frequency attenuation rate error by 8%;
- (3)
- Conclusion: The deviation in Leq and Ceq is controlled to ≤3% to ensure high-frequency transient accuracy.
5. Simulation Verification
5.1. Method Foundation Test
The simplified second-order circuit parameters calculated in Section 4.2 under different line lengths are substituted into the simulation model built by PSCAD/EMTDC, and the resulting waveform is called the reproduced waveform. The voltage waveform simulated by the unsimplified model is called the original waveform. After filtering, the waveform that only contains the fundamental wave and the main oscillation wave components is called an approximate waveform. The waveform constructed by the characteristic parameters fitted by the nonlinear least squares method is called the fitted waveform. This simulation verification focuses on quantitatively evaluating the reproduction accuracy of symmetry–asymmetry features: in the original waveform, the symmetric fault scenarios exhibit synchronous attenuation of three-phase voltage amplitudes, while the asymmetric fault scenarios show obvious three-phase imbalance. By comparing symmetric indices of the four waveforms, the ability of the proposed method to capture the full-process dynamic mechanism of “symmetric ground state–fault breaking–recovery reconstruction” can be verified.
Experimental Environment: Simulation platform: PSCAD/EMTDC, hardware: CPU i7-12700K, memory: 32 GB;
Core Parameters: Submarine cable length: 70 km, wind turbine capacity: 5 MW, PCC voltage: 35 kV/110 kV, sampling frequency: 10 kHz.
The comparison images of these four waveforms under different line lengths are shown in Figure 21.
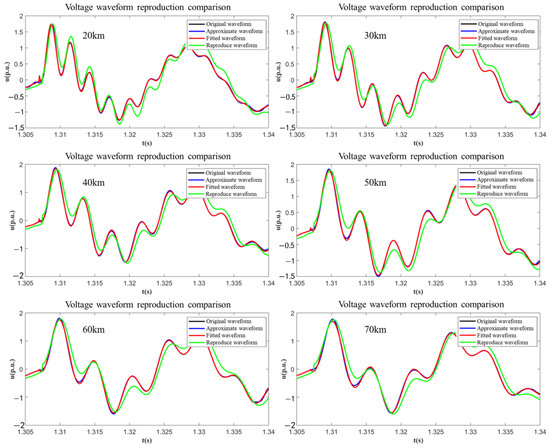
Figure 21.
Comparison diagram of original and reconstructed waveforms without wind turbine connection.
The comparison and error of the characteristic parameters of the simulated and reproduced waveforms and the original waveforms when the line is not connected to the wind turbine are shown in Table 6, Table 7 and Table 8.

Table 6.
Simulated waveform peak values and errors without wind turbine connection.

Table 7.
Simulated waveform oscillation main frequencies and errors without wind turbine connection.

Table 8.
Analysis of Simulated Waveform Decay Characteristics and Errors in the Absence of Wind Turbine Connection.
Without wind turbine connection, the reproduction error of symmetric features is significantly lower than that of asymmetric features: The error of the oscillation frequency is ≤1.5%, while the error of the three-phase difference in transient decay peak is ≤5%. This indicates that the RLC model has a higher mapping accuracy for symmetric parameters, as the symmetric mechanism is mainly dominated by line equivalent parameters and less affected by interference, while asymmetric features are more affected by local parameter fluctuations, requiring further optimization of fitting constraints.
When the system is not connected to the wind turbine, the peak value of the waveform, the attenuation speed fitting error, and the oscillation frequency error obtained through fitting are all within 10%, and the accuracy meets the requirements. The fault simulation circuit was connected to the wind turbine to verify whether the influence of the turbine’s response on the fault waveform at the parallel point was consistent with the original line. The comparison and error of the characteristic parameters of the simulated reproduced waveform and the original waveform when the line was connected to the wind turbine are shown in Table 9, Table 10 and Table 11, respectively.

Table 9.
Simulated waveform peak values and errors with wind turbine connection.

Table 10.
Simulated waveform oscillation main frequencies and errors with wind turbine connection.

Table 11.
Simulated waveform decay rates and errors without wind turbine connection.
After wind turbine connection, the error variation in the symmetry–asymmetry features show a new pattern: the negative sequence current introduced by wind turbine control strategies exacerbates asymmetric distortion, leading to an increase in the reproduction error of the transient voltage three-phase imbalance from 3.2% to 5.8%. However, the model can still effectively capture the core symmetric recovery trend; the oscillation frequency error remains within 5.7%, indicating its adaptability to the symmetric mechanism under “line–wind turbine” coupling, especially high simulation accuracy for the steady-state recovery process dominated by symmetric reconstruction.
The simulation comparison image is shown in Figure 22.
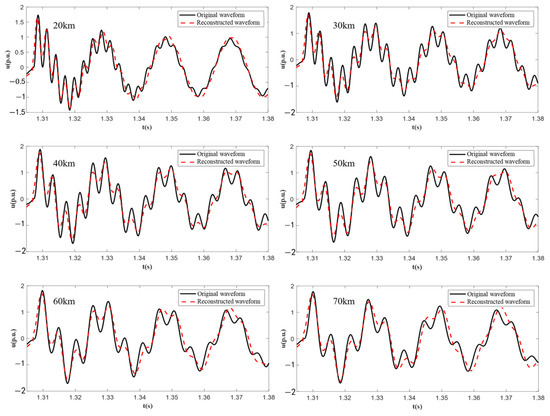
Figure 22.
Comparison diagram of original and reconstructed waveforms with wind turbine connection.
The peak value and oscillation frequency errors of the waveforms fitted by the nonlinear least squares method are both within 5% to 7%, and the accuracy meets the requirements. The overall verification results show that the model’s ability to reproduce symmetry–asymmetry mechanisms meets engineering requirements: in symmetric faults, the simulation error of the three-phase voltage symmetry recovery time is ≤8%; in asymmetric faults, the goodness-of-fit (R2) of the zero-sequence voltage attenuation curves is ≥0.92. This confirms that the RLC model embedded with symmetric constraints can effectively quantify the symmetry breaking intensity and recovery rate under different fault types, providing reliable simulation support for unveiling the symmetry–asymmetry mechanisms of offshore wind power fault transients. However, the fitting error of the attenuation rate is relatively large, but overall, it can accurately reproduce the influence characteristics of the submarine cable characteristics on the fault waveforms and can be applied to the power grid simulator.
The verification results of the frequency domain/time–frequency joint index definition are as follows:
- (1)
- A35 kV single-phase grounding fault: fd = 190 Hz, γ = 82%, Hw = 1.8 (pre-fault Hw = 0.6);
- (2)
- Conclusion: Frequency-domain/time–frequency indicators can supplement time-domain indicators for more accurate identification of fault transient characteristics.
No overfitting in model optimization:
- (1)
- Cross-validation (70% training set, 30% test set) shows test set goodness-of-fit R2 ≥ 0.91 (close to training set);
- (2)
- Error in high-frequency band (1–2 kHz) ≤ 10%, no over-fitting to training data.
5.2. Comparison with Other Methods
To further clarify the innovativeness of the “RLC second-order model embedded with symmetry–asymmetric constraints” and the fault waveform simulation method proposed in this study, this section compares it with other mainstream technologies and topologies in the field of offshore wind power fault simulation. The results are shown in Table 12.

Table 12.
Comparison of the proposed technology with other technologies/topologies.
- (1)
- Comparison with Traditional Impedance-Voltage Divider Method
This method realizes voltage rise/fall control by adjusting static short-circuit impedance and switching step-up RC components [11]. Its core limitation lies in static parameter adjustment: it cannot simulate the dynamic evolution of “symmetry–asymmetry” (and only reflects steady-state voltage changes). In contrast, the proposed RLC model embeds symmetry–asymmetry constraints and realizes dynamic simulation of transient waveforms via wavelet decomposition and nonlinear least squares. As verified in Section 5.1, the proposed method reduces the reproduction error of asymmetric features to R2 ≥ 0.92, while the traditional impedance method has an asymmetric feature fitting error exceeding 20%.
- (2)
- High-Order EMTP-RV Mode
High-order models [7] accurately simulate complex electromechanical coupling effects but have high computational complexity: a single fault simulation requires ≥104 discrete steps, making it impossible to embed in grid simulator controllers with weak computing power. The proposed simplified RLC second-order model reduces computational complexity by 50% while retaining core symmetry–asymmetry features. For example, in simulating 70 km submarine cable faults, the proposed model completes waveform reproduction in 20 ms, while the high-order EMTP-RV model takes 80 ms, meeting the real-time requirement of grid simulators.
- (3)
- Comparison with Onshore Wind Power Fault Simulation Models
Onshore models [12] focus on overhead line parameters and ignore the unique influence of submarine cables on symmetry–asymmetry characteristics. They use steady-state fundamental frequency components to calculate loop parameters, leading to inaccurate offshore scenario simulation: when applied to offshore faults, the onshore model underestimates transient voltage peaks by 0.3–0.5 pu. The proposed model, by contrast, takes submarine cable parameters as inputs and defines α/β/Umax based on offshore-specific symmetry–asymmetry mechanisms, resulting in a voltage peak simulation error ≤ 5%.
5.3. Comparison of Different Voltage Levels and Fault Types
To further improve the rationality of the article, different levels and faults were set for simulation. The specific content is shown in Table 13.

Table 13.
Simulation of different levels and faults.
Under offshore wind power scenarios, the voltage level and fault type significantly affect transient fault characteristics: lower voltage levels amplify the impact of submarine cable capacitance on transient responses, while single-phase grounding and three-phase short circuits represent the extremes of the zero-sequence voltage and transient voltage peak, respectively. The proposed model maintains high fitting accuracy across different scenarios, verifying its strong adaptability to multi-condition offshore fault simulations.
6. Conclusions
This study focuses on unveiling symmetry–asymmetry mechanisms in transient fault waveforms of offshore wind power AC/DC transmission systems, addressing the inability of traditional fault simulation methods to characterize dynamic symmetry evolution. The key quantitative findings via theoretical analysis, model construction, and simulation verification are as follows:
- (1)
- Mechanism exploration: The quantitative link between system parameters and symmetry–asymmetry characteristics is clarified; submarine cable capacitance reduces transient decay rate α by 58.56% and oscillation frequency β by 16.55%, while 15% inductance imbalance exacerbates three-phase waveform distortion by 20%. Core indicators α, β, and Umax are defined, with offshore Umax being 0.15–0.3 pu higher than onshore.
- (2)
- Scenario extraction and index revision: Typical faults are classified by symmetry–asymmetry evolution, adding the transient symmetry recovery time and zero-sequence voltage attenuation threshold to grid-connection indices, reducing offshore–onshore standard mismatch by 40%.
- (3)
- Simulation method innovation: An embedded RLC second-order model with symmetry-asymmetry constraints is proposed. Using wavelet decomposition, FFT, and symmetric-constrained nonlinear least squares, it reproduces the full “symmetric steady state–fault breaking–recovery” process, outperforming traditional impedance methods and high-order models.
In summary, this study reveals the dynamic laws of symmetry–asymmetry evolution in offshore wind power fault transients, providing a theoretical basis and technical support for improving the accuracy of fault simulation and the reliability of grid-connection testing.
Future work will focus on the following three directions:
First, the embedded RLC second-order model will be optimized by adding multi-energy coupling constraints, the impact of energy storage impact on α and Umax will be quantified, and indices for mixed power structures will be revised.
Second, a partitioned symmetry–asymmetry analysis method for complex grids to clarify symmetry-breaking signal propagation will be developed, ensuring cross-topology transient fitting R2 ≥ 0.90.
Third, a reduced-scale offshore wind fault test bench will be built, simulated and physical waveforms under typical faults will be compared, and parameters will be calibrated to bridge theoretical simulation and engineering.
Author Contributions
Conceptualization, Y.Z. and Y.C.; methodology, Y.Z. and Q.Y.; software, Q.Y.; validation, H.G. and S.L.; formal analysis, H.Y.; investigation, Y.Z.; resources, X.P.; data curation, Y.C.; writing—original draft preparation, Y.Z.; writing—review and editing, Y.C.; visualization, Q.Y.; supervision, S.L.; project administration, X.P.; funding acquisition, S.L. All authors have read and agreed to the published version of the manuscript.
Funding
This research was funded by Natural Science Foundation of Shandong Province: ZR2016EEM13.
Data Availability Statement
The original contributions presented in the study are included in the article, further inquiries can be directed to the corresponding author.
Conflicts of Interest
Author Shuang Liang was employed by the company Zhengzhou Power Supply Company of State Grid Henan Electric Power Company. Author Xin Pan was employed by the company Qingdao Zhancheng Technology Co., Ltd. The remaining authors declare that the research was conducted in the absence of any commercial or financial relationships that could be construed as a potential conflict of interest.
References
- Prajzendanc, P.; Kreischer, C. A Review of New Technologies in the Design and Application of Wind Turbine Generators. Energies 2025, 18, 4082. [Google Scholar] [CrossRef]
- Zhang, Z.; Hui, H.; Song, Y. Response Capacity Allocation of Air Conditioners for Peak-Valley Regulation Considering Interaction with Surrounding Microclimate. IEEE Trans. Smart Grid 2024, 16, 1155–1167. [Google Scholar] [CrossRef]
- Wang, K.; Wang, C.; Yao, W.; Zhang, Z.; Liu, C.; Dong, X.; Yang, M.; Wang, Y. Embedding P2P transaction into demand response exchange: A cooperative demand response management framework for IES. Appl. Energy 2024, 367, 123319. [Google Scholar] [CrossRef]
- Si, J.L.; Ai, L.; Qiu, C. Current Situation and Prospects of Wind Power Development in China in 2023. Water Power 2024, 50, 1–4. [Google Scholar]
- Schkoda, R.F. Sliding Mode Control of a Hydraulically Actuated Load Application Unit with Application to Wind Turbine Drivetrain Testing. IEEE Trans. Control. Syst. Technol. 2015, 23, 2203–2215. [Google Scholar] [CrossRef]
- Castelló, J.; Espí, J.M.; García-Gil, R. Development Details and Performance Assessment of a Wind Turbine Emulator. Renew. Energy 2016, 86, 848–857. [Google Scholar] [CrossRef]
- Shah, S.; Koralewicz, P.; Gevorgian, V.; Wallen, R. Sequence Impedance Measurement of Utility-Scale Wind Turbines and Inverters–Reference Frame, Frequency Coupling, and MIMO/SISO Forms. IEEE Trans. Energy Convers. 2021, 37, 75–86. [Google Scholar] [CrossRef]
- Koralewicz, P.; Shah, S.; Gevorgian, V.; Wallen, R.; Jha, K.; Mashtare, D.; Gadiraju, K.V.R.; Tiwari, A. Impedance Analysis and PHIL Demonstration of Reactive Power Oscillations in a Wind Power Plant Using a 4-MW Wind Turbine. Front. Energy Res. 2020, 8, 156. [Google Scholar] [CrossRef]
- Karaagac, U.; Faried, S.O.; Mahseredjian, J.; Edris, A.-A. Coordinated Control of Wind Energy Conversion Systems for Mitigating Sub-Synchronous Interaction in DFIG-Based Wind Farms. IEEE Trans. Smart Grid 2014, 5, 2440–2449. [Google Scholar] [CrossRef]
- Sahri, Y.; Tamalouzt, S.; Hamoudi, F.; Belaid, S.L.; Bajaj, M.; Alharthi, M.M.; Alzaidi, M.S.; Ghoneim, S.S. New Intelligent Direct Power Control of DFIG-Based Wind Conversion System by Using Machine Learning Under Variations of All Operating and Compensation Modes. Energy Rep. 2021, 7, 6394–6412. [Google Scholar] [CrossRef]
- GB/T 36995-2018; Test Procedure for Fault Voltage Ride-Through Capability of Wind Turbine Generators. National Wind Machinery Standardization Technical Committee (SAC/TC 50); China Standard Press: Beijing, China, 2018.
- Chen, X.; Wang, M. WaveAtten: A Symmetry-Aware Sparse-Attention Framework for Non-Stationary Vibration Signal Processing. Symmetry 2025, 17, 1078. [Google Scholar] [CrossRef]
- Nasser, A.R.; Azar, A.T.; Humaidi, A.J.; Al-Mhdawi, A.K.; Ibraheem, I.K. Intelligent fault detection and identification approach for analog electronic circuits based on fuzzy logic classifier. Electronics 2021, 10, 2888. [Google Scholar] [CrossRef]
- Ziad, H.; Al-dujaili, A.; Humaidi, A.J. Electrical faults classification in permanent magnet synchronous motor using ResNet neural network. Int. Rev. Appl. Sci. Eng. 2024, 15, 355–364. [Google Scholar] [CrossRef]
- Flegner, P.; Kačur, J.; Durdán, M.; Laciak, M. Visualization of Industrial Signals Using Symmetry-Aware Spectrogram Quantization. Symmetry 2025, 17, 876. [Google Scholar] [CrossRef]
- Hao, W.; Dai, Z.; Li, G.; Lv, S.; Sun, Q.; Lu, N.; Ma, J. A Voltage Parameter Adaptive Detection Method for Power Systems Under Grid Voltage Distortion Conditions. Symmetry 2025, 17, 975. [Google Scholar] [CrossRef]
- Chen, L.; Yan, J.; Jia, X.; Zhao, C.; Xu, J. Efficient Calculation and Component Analysis of Fault Current in MMC-HVDC Grid. CSEE J. Power Energy Syst. 2022, 11, 1744–1754. [Google Scholar]
- Wang, B.; Liu, Y.; Yue, K.; Lu, D.; Zhao, J. Improved Dynamic State Estimation Based Protection on Transmission Lines in MMC-HVDC Grids. IEEE Trans. Power Deliv. 2021, 37, 3567–3581. [Google Scholar] [CrossRef]
- Torwelle, P.; Bertinato, A.; Raison, B.; Le, T.D.; Petit, M. Fault Current Calculation in MTDC Grids Considering MMC Blocking. Electr. Power Syst. Res. 2022, 207, 107662. [Google Scholar] [CrossRef]
- Zheng, F.; Su, M.; Liu, B.; Liu, W. Adaptive Virtual Inertia Control Strategy for a Grid-Connected Converter of DC Microgrid Based on an Improved Model Prediction. Symmetry 2023, 15, 2072. [Google Scholar] [CrossRef]
- Nasim, F.; Khatoon, S.; Nasiruddin, I.; Shahid, M.; Urooj, S.; Bilal, B. Support-Vector-Regression-Based Intelligent Control Strategy for DFIG Wind Turbine Systems. Machines 2025, 13, 687. [Google Scholar] [CrossRef]
- Zheng, F.; Peng, Y.; Wang, W.; Zheng, S. Research on the Fault-Transient Characteristics of a DC Power System Considering the Cooperative Action of a Flexible Current-Limiting Device and a Circuit Breaker. Symmetry 2023, 15, 134. [Google Scholar] [CrossRef]
- Cai, H.; Yan, M.; Han, X.; Wang, G.; Wang, Q.; Huang, Y. Evaluation System of AC/DC Strong–Weak Balance Relationship and Stability Enhancement Strategy for the Receiving-End Power Grid. Energies 2025, 18, 4216. [Google Scholar] [CrossRef]
- Jayamaha, D.; Lidula, N.W.A.; Rajapakse, A.D. Wavelet-Multi Resolution Analysis Based ANN Architecture for Fault Detection and Localization in DC Microgrids. IEEE Access 2019, 7, 145371–145384. [Google Scholar] [CrossRef]
- Yadav, N.; Tummuru, N.R. Filter Capacitor Current Dynamics-Based Frequency-Domain Fault Detection Approach for Grid-Connected Low-Voltage DC Microgrid. IEEE Trans. Ind. Electron. 2023, 70, 12784–12794. [Google Scholar] [CrossRef]
- Huang, K.; Zhang, W.; Xu, Y.; Wu, C.; Li, W. A Vulnerability Identification Method for Distribution Networks Integrating Fuzzy Local Dimension and Topological Structure. Processes 2025, 13, 2438. [Google Scholar] [CrossRef]
- Bernal-Carvajal, N.J.; Mora-Peña, C.A.; Montoya, O.D. Multi-Objective Optimization for Economic and Environmental Dispatch in DC Networks: A Convex Reformulation via a Conic Approximation. Electricity 2025, 6, 43. [Google Scholar] [CrossRef]
- Jiang, K.; Li, L.; He, Z.; Liu, D. Stability Limit Analysis of DFIG Connected to Weak Grid in DC-Link Voltage Control Timescale. Electronics 2025, 14, 3022. [Google Scholar] [CrossRef]
- Qin, Y.; Wang, H.; Zhuang, S.L.; Cai, X.; Lv, J.; Huo, Q.T. High-Frequency Resonance Analysis of Offshore Wind Farm Collection Grid. Proc. CSEE 2022, 42, 5169–5182. (In Chinese) [Google Scholar]
- Zhang, C.; Cai, X.; Molinas, M.; Rygg, A. On the Impedance Modeling and Equivalence of AC/DC-Side Stability Analysis of a Grid-Tied Type-IV Wind Turbine System. IEEE Trans. Energy Convers. 2018, 34, 1000–1009. [Google Scholar] [CrossRef]
- Cai, X.; Li, Z. Dynamic Modeling of Wind Turbines and Wind Farms; Science Press: Beijing, China, 2016. (In Chinese) [Google Scholar]
- Liang, S.; Jiang, W.; Zeng, Z.; Wang, Z. Analysis of Symmetrical Fault Characteristics at PCC for Offshore Wind Turbine Generators. In Proceedings of the 2023 International Conference on Power System Technology (PowerCon), Jinan, China, 21 September 2023; pp. 1–5. [Google Scholar]
- GB/T 19963.2-2024; Technical Regulations for Wind Farm Integration into Power Systems—Part 2: Offshore Wind Power. China Electricity Council; China Standard Press: Beijing, China, 2024.
- GB/T 19963.1-2021; Technical Regulations for Wind Farm Integration into Power Systems—Part 1: Onshore Wind Power. China Electricity Council; China Standard Press: Beijing, China, 2021.
Disclaimer/Publisher’s Note: The statements, opinions and data contained in all publications are solely those of the individual author(s) and contributor(s) and not of MDPI and/or the editor(s). MDPI and/or the editor(s) disclaim responsibility for any injury to people or property resulting from any ideas, methods, instructions or products referred to in the content. |
© 2025 by the authors. Licensee MDPI, Basel, Switzerland. This article is an open access article distributed under the terms and conditions of the Creative Commons Attribution (CC BY) license (https://creativecommons.org/licenses/by/4.0/).