1. Introduction
Technological advancements in recent decades have rapidly impacted consumer habits and needs, leading to constant changes in the market. These ongoing market changes are seen as key drivers of economic development, particularly for companies, with small and medium-sized enterprises (SMEs) benefiting significantly. The importance of SMEs in developed countries is reflected in their role in promoting employment, generating new value, increasing gross domestic product, and more. Achieving strategic goals, such as long-term business stability and maintaining a market position in the production sector, can be supported, among other factors, by enhancing manufacturing reliability, which represents a key business process. Different definitions of business process reliability have influence on their assessment in real business organizations. The reliability of manufacturing processes is essential for ensuring stable system operation, improving product quality, and reducing production losses. The aforementioned issues have not allowed a presence of the scientific consensus on the unified elements of business process reliability, nor an appropriate methodology for its comprehensive assessment.
In the relevant literature, there are differing views regarding the aspects of business with which manufacturing process reliability is most closely associated. Naturally, this also depends on the perspective from which the problem is examined. Some authors [
1,
2] argue that manufacturing process reliability is best reflected through its connection with generated costs. An alternative approach links manufacturing process reliability to quality improvement, considering it from a quality management perspective [
3]. However, in a large number of analyzed studies, the issue has been observed through the perspective of failure analysis within the manufacturing process [
4,
5]. This approach is rooted in an engineering perspective and focuses on ensuring the conditions for uninterrupted execution of the manufacturing process.
All of these aspects align with the formal goal of lean manufacturing: achieving well-balanced production. The motivation for this research comes from the belief that manufacturing reliability is greatly affected by generating waste in production. The results of best practice indicate that each form of waste is generally caused by various types of failures. There are no established rules or guidelines, either in the literature or practice, for identifying failures specific to a lean waste type. In most cases, the identification of failures depends on the expertise of operational management, as is the case in this paper.
Reducing or eliminating the impact of identified failures that lead to waste generation can be achieved by applying different quality tools and methods. In practice, due to limited resources, it is realistic to assume that several quality methods cannot be conducted at the same time. Some authors [
6] recommend focusing efforts on reducing or eliminating the top three ranked wastes. Ranking can be performed through surveys and the weighted average method, where each waste type is assigned a specific weight. Furthermore, the identification and prioritization of the most significant wastes can be achieved using Multi-Attribute Decision-Making (MADM) methods [
7].
The goal of this research is to propose a model for analyzing and assessing the risk level arising from failures that generate waste, as described by the lean manufacturing approach, at the enterprise level. The assessment of identified failures is based on the Failure Mode and Effect Analysis (FMEA) framework. Considering the nature of human thinking, it can be argued that decision-makers (DMs) are more comfortable expressing their evaluations using natural language, rather than precise numerical values. In line with this, the development of different mathematical theories, such as the theory of intuitionistic fuzzy sets [
8], has enabled a more effective representation of uncertainty, imprecision, and vagueness. In this paper, all existing uncertainties describing the relative importance of risk factors (RFs) and their values are modeled using interval-valued intuitionistic fuzzy sets (IVIFSs) [
9].
The rank of failures under each lean waste is given in an exact way by using the proposed TOPSIS method with interval-valued intuitionistic fuzzy numbers (IVIFNs)—IF-TOPSIS. This approach reduces the influence of DMs’ biases on the obtained rankings. While many studies have proposed IF-TOPSIS methods [
10,
11,
12], the relevant literature lacks research that applies IF-TOPSIS specifically to prioritize failures within the manufacturing process. The main difference between the developed IF-TOPSIS model in this research and those found in the literature [
13,
14,
15] lies in the construction of the fuzzy decision matrix, and the method used to determine the closeness coefficient (a standard step of the TOPSIS method based on which the ranking of alternatives is performed). In this study, RFs are evaluated by the FMEA team based on their type, which eliminates the need for normalizing RF values and considerably reduces computational effort. The Euclidean distance between the fuzzy positive ideal solution (FPIS) and the fuzzy negative ideal solution (FNIS) is commonly used in the literature [
16]. However, in this paper, the Hamming distance is used. It should be noted that the choice of distance can be seen as a problem in itself.
Best practice results have shown that the selection of an appropriate quality method depends not only on the priority of failures but also on the overall risk level of the manufacturing process. Therefore, in this paper, the risk level of the manufacturing process is determined using the Mamdani fuzzy inference system with IVIFNs, based on min-compositional rules by analogy [
17]. In the literature, there are a few fuzzy production rules where uncertain data are described by IVIFNs [
18]. The mentioned can be seen as one of the main contributions of the work in the theoretical domain.
On the other hand, from a practical perspective, this study contributes to this by providing a guide for quality managers in SMEs, which is based on linking lean waste with the underlying causes that lead to the occurrence of failures in the manufacturing process. In this way, the research contributes to reducing lean waste, improving the reliability of the manufacturing process, and enhancing decision-making stability in a dynamic and uncertain environment.
For the purpose of conducting an objective and sufficiently reliable risk analysis in the manufacturing process, it is important that all considered criteria, in this case RFs, are treated in a balanced and consistent manner. In practice, this does not mean that the criteria should have the same weight, but rather that the weight of each criterion proportionally influences the final results, in accordance with its importance. In this way, a fairer and more objective risk assessment is ensured, thereby overcoming one of the key shortcomings of the FMEA related to the importance of RFs. For this reason, in this paper, the emphasis is placed on the property of symmetry, which ensures consistent application of decision-making rules and contributes to the stability of decisions. Particularly in SMEs, which operate in an uncertain and dynamic environment, the property of symmetry enables the decision-making process to be easily repeated under similar conditions, while the results remain stable.
The property of symmetry is also present in the production rules. In this specific case, symmetry in fuzzy inference means that the IF-THEN rules are arranged such that any change in the order of these rules or the sequence of input data does not alter the output, i.e., the result remains unchanged. The outcome is always consistent for any input value, regardless of the order in which it is processed.
The paper is organized in the following way:
Section 2 presents a literature review. The methodology and the proposed model are presented in
Section 3. The case study is presented in
Section 4. The conclusion is given in
Section 5.
2. Literature Review
In order to better review the literature, this section is divided into three subsections. In the first subsection, the basic considerations regarding the reliability of manufacturing process management are presented. In the second, studies in which the authors applied the IF-TOPSIS approach are shown. In the third subsection, papers in which production rules were used are discussed.
2.1. Basic Consideration About Reliability of Manufacturing Process Management
In addition to continuous improvement and maintaining the reliability of business processes, it is essential that these processes remain adaptable to unexpected situations and challenges. A significant number of studies have focused on evaluating and improving the reliability of manufacturing processes.
Well-maintained reliability of business processes can be considered a cost-effective approach to preventing process failures [
1]. Additionally, in the relevant literature, business process reliability has been analyzed from the perspectives of modeling and optimization [
19]. The method proposed in the research utilizes a communication network of probabilistic graphs and further analyzes and simulates the business process network model using system dynamics.
The analysis of process faults and determining the most effective methods for their elimination can be based on different methods, such as the extended FMEA approach and a fault classification system [
4]. In this research, a Bayesian Belief Network was utilized to analyze these faults. Additionally, a reliability analysis module was developed specifically for machinery manufacturing enterprises, aimed at increasing the reliability of selected production routes.
Improving the effectiveness of the manufacturing process in SMEs can be achieved by enhancing the quality of this business process. Some authors have proposed a model for improving quality management through the assessment and ranking of manufacturing subprocesses with respect to key performance indicators [
3].
In this paper, it is assumed that increasing the reliability of the manufacturing process can be achieved by reducing its risk level through lean waste reduction.
2.2. IF-TOPSIS
Although IVIFNs have been applied in the literature in combination with various MADM methods [
20,
21], it should be noted that the TOPSIS method is the most widely used. Furthermore, it should be emphasized that there are very few studies in which the failure ranking of the manufacturing process has been carried out based on IF-TOPSIS [
22]. A comparative analysis of existing models and the proposed research is presented in
Table 1 and constitutes an extension of the analysis conducted in [
23].
A comparative analysis (see
Table 1) reveals certain differences between them. First, the differences from the perspective of criteria analysis are as follows: (1) The selection of criteria is based on the assessment of DMs as well as the literature sources. In this research, the criteria (in this case RFs) are defined using the FMEA framework. (2) The assessment of the relative importance of criteria and their values is based on predefined linguistic expressions in this research. (3) In all analyzed papers, the determination of criteria weights is treated as a fuzzy group decision-making problem, where aggregated DM opinions are obtained using an intuitionistic fuzzy weighted averaging (IVIFWA) operator. In contrast, this research proposes an intuitionistic fuzzy weighted geometric (IVIFWG) operator.
The analysis of the relevant literature reveals that fuzzy decision matrices are defined in various ways: (1) determining matrix values—in several studies [
10,
11,
12,
13], as well as in this research, the values of the elements in the fuzzy decision matrix are determined based on the consensus of DMs; and (2) consideration of criteria type—many authors [
13,
14,
15,
16] emphasize that DMs should take into account the type of criteria when performing assessments. This approach eliminates the need for normalization procedures, thereby significantly reducing computational complexity. That approach is also adopted in this paper.
Almost all authors suggest that the definition of IF-PIS and IF-NIS should be based on combining the procedure proposed in conventional TOPSIS with fuzzy algebra rules using IVIFNs, as applied in this research. The closeness coefficient is determined based on the following: (i) the overall “identity degree” and the overall “contrary degree” [
11]; (ii) the intuitionistic fuzzy ordered weighted averaging distance (IFOWAWA) [
14] and the distance between two IVIFNs; and (iii) distance measures such as the normalized Euclidean distance [
5,
23], exponential distance measures [
12], and the Hamming distance, as considered in this research.
2.3. Production Rules
In many real-world problems, imperfect and imprecise information is an inherent aspect of the problem itself. Continuing the reasoning process without appropriate modeling tools can lead to inaccurate inferences [
29]. Key components of fuzzy/linguistic IF-THEN rules are evaluative linguistic expressions [
30]. These expressions, often drawn from natural language, are used when it is necessary to evaluate a decision-making situation, describe the development of a process, or address various other complex scenarios [
17].
Generally, there are two main types of fuzzy inference systems: Mamdani and TSK, which differ in their representation and output evaluation. In this research, we assume the use of a Mamdani fuzzy inference system. The input data are described by uncertain numbers [
31,
32], which are aggregated into a single precise value, referred to as the overall index. Based on the obtained overall index value, the uncertain output variable values are determined using the defined production rules. When uncertain numbers are modeled by type-1 fuzzy numbers, the max composition rule is applied. However, when fuzzy numbers with multiple membership functions are used, the production rules rely on the min composition rule [
18].
3. Methodology
This section provides: (1) basic definitions of IVIFNs to facilitate understanding of the proposed algorithm, (2) the problem statement, and (3) extended IF-TOPSIS.
3.1. Basic Definitions of Intuitionistic Fuzzy Sets
All the mentioned definitions and properties of intuitionistic fuzzy sets and IVIFSs were adopted and adapted from [
8]. The extensions related to basic mathematical operations with IVIFNs were adopted and adapted from [
9], while the procedure for determining the Hamming distance between two IVIFNs was adopted from [
33].
Definition 1. An intuitionistic fuzzy set in the universe of discourse X is defined with the form [
8]:
where The numbers and denote the membership degree and non-membership degree.
With the conditionfor each intuitionistic fuzzy set from set X, the following holds: The value of is called the degree of indeterminacy (or hesitation). The smaller , more certain .
Definition 2. Let a set be auniverse of discourse, an IVIFS in X is an object having the form:where Are intervals denoting the membership and the non-membership degrees of the element to with the condition: Similarity, the hesitancy degree of x to can be calculated as: An interval-valued intuitionistic fuzzy number (IVIFN) can be simply denoted as:where and and Definition 3. Let and be two positive IVIFNs. And λ is a real positive number. The operations of these IVIFNs are [
9]:
Definition 4. Let and be two IVIFNs. The Hamming distance is [
33]:
3.2. The Problem Statement
The types of waste observed in manufacturing enterprises, as defined by lean manufacturing, are formally represented by the set
. The total number of considered types of lean waste is denoted by
, and
is index of lean waste. The types of lean waste are as follows [
34]: Transportation (
), Inventory (
), Motion (
), Waiting (
), Overprocessing (
), Overproduction (
), Defects (
) and Unused employee creativity (
), which are defined by [
35].
The number and type of failures from the aspect of each considered type of lean waste are determined by DMs (production manager, FMEA leader, and quality manager). Identification lists of failures are based on the knowledge and experience of DMs. Formally identified failures from the aspect of each type of waste can be represented by a set of indices . The total number of identified failures is denoted as , and is the index of failure. The estimation of failures can be performed with respect to multiple RFs, which can be formally represented by a set of indices . The total number of RFs is denoted as . The index of RF is .
In this research, respecting the FMEA framework, identified failures are evaluated according to three RFs: severity of consequence
, frequency of failure
, and difficulty of detecting failure
, analogous to the FMEA method [
36].
The uncertain relative importance of criteria is assessed in a direct way by DMs originating from the group of considered SMEs that are formally represented by a set of indices . The total number of SMEs is denoted as E, and e, e = 1, …, E is index of SME.
At the level of one SME, DMs make a decision by consensus. They use three pre-defined linguistic terms which are modeled IVIFSs [
37]:
low importance
medium importance ()—
high importance (
)—
The importance of the considered SMEs is estimated according to the profit growth during the last 5 years of business, and it is denoted as
. RF weights are given by using IVIFWG operator [
25].
It is supposed that the RF values could be adequately described by using 5 linguistic expressions which are modeled by IVIFNs:
very low value (VL)—()
low value (L)—()
medium value (M)—()
high value (H)—()
very high value (VH)—()
Fuzzy rating of the RF values with respect to type is performed at the level of each lean waste , taking into account the type of RF. In this way, it can be considered that all considered RFs benefit the type, and it is not necessary to perform normalization.
The weighted fuzzy decision matrix is constructed. The elements of this matrix are calculated as the product of RF values and its weight, and they are described by IVIFNs too, according to fuzzy algebra rules. Intuitionistic fuzzy positive ideal solution (IF-PIS) and intuitionistic fuzzy negative ideal solution (IF-NIS) are determined by [
38]. The distance from IF-PIS and IF-NIS are determined by the Hamming distance [
33]. The closeness coefficient is given by using the procedure proposed in conventional TOPSIS [
39]. Its values are described by precise numbers and sorted in decreasing order. The rank of failures is determined according to closeness coefficient values. In this way, the failure at the level of each lean waste that has the greatest impact on the reliability of the manufacturing process in the considered SME is determined.
The overall risk index is determined as union IVIFSs, which describe the weighted values of failures that are ranked first in terms of each lean waste. According to fuzzy algebra rules [
9], the overall risk index is described by IVIFNs, too. The risk level can be described by three linguistic expressions and corresponding IVIFSs:
low risk level (R1)—
medium risk level (R2)—
high risk level (R3)—
The risk level of the manufacturing process is given by applying the fuzzy IF-THAN rules proposed in this research.
3.3. The Proposed Model Combining IF-TOPSIS and Fuzzy Logic Rules
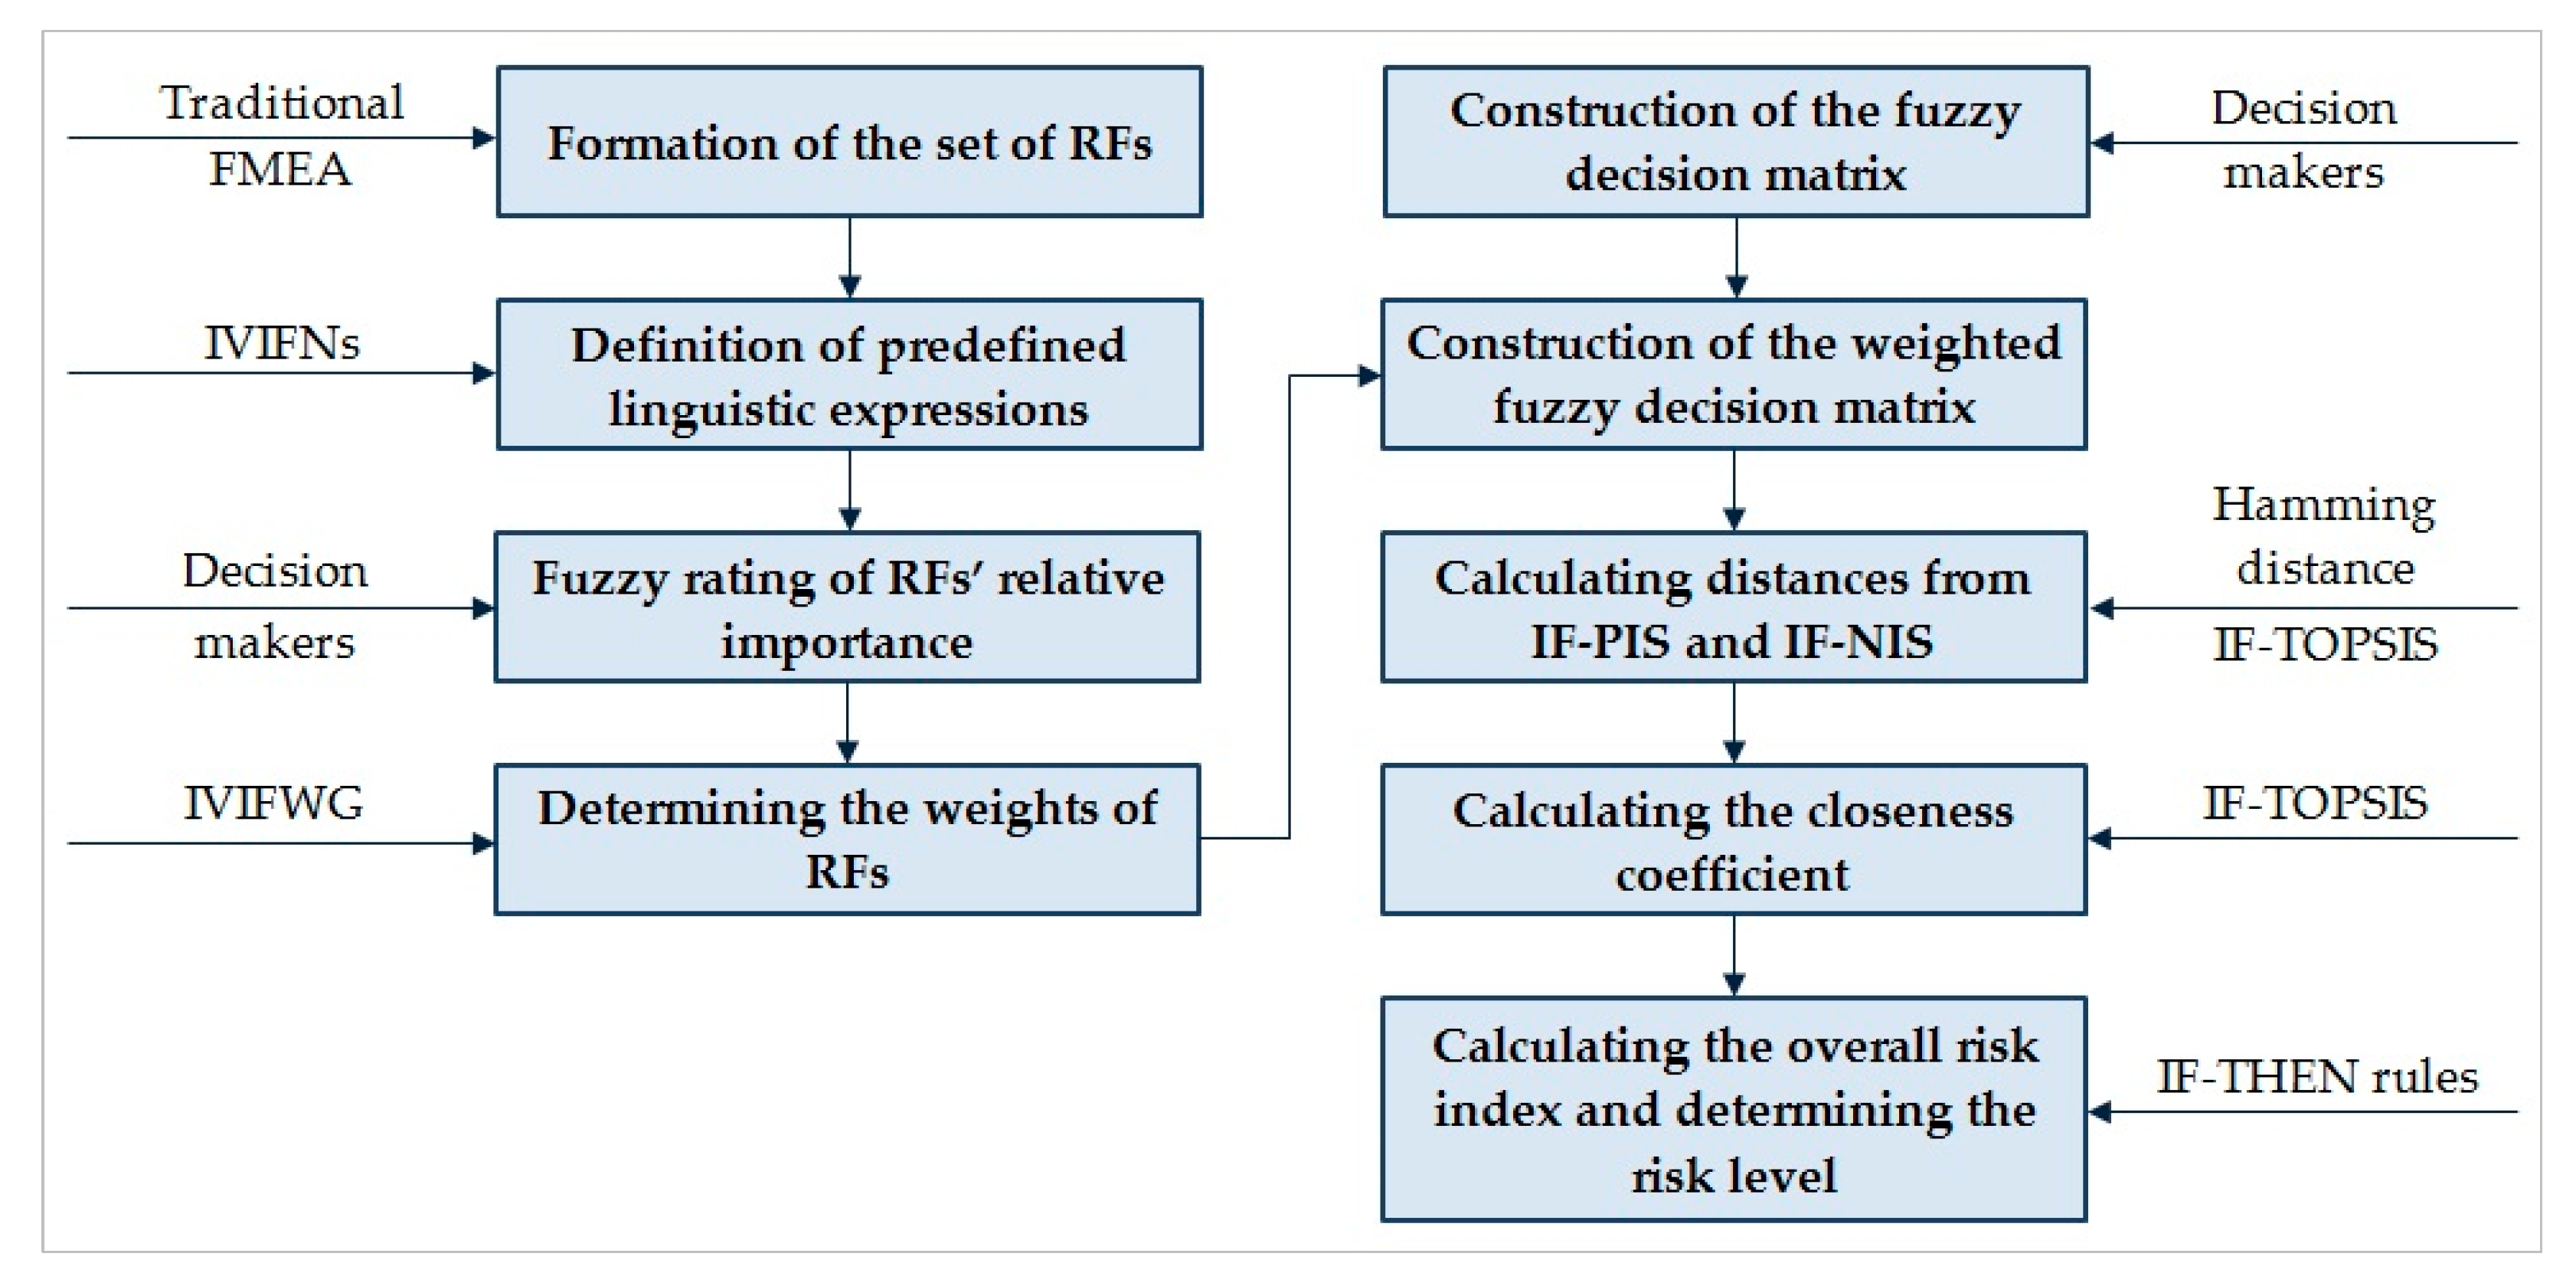
Before presenting the mathematical formulation of the proposed model, a simplified representation of the proposed methodology can be seen in
Figure 1.
Step 1. Fuzzy rating of the relative importance of RF
is performed by DMs at the level of enterprise
. They use pre-defined linguistic expressions which are modeled by IVIFSs:
Step 2. The RF weights,
are calculated by using IVIFWG:
Step 3. Construct the fuzzy decision matrix:
where
is IVIFS which describes the value RF for failure .
Step 4. Construct the weighted fuzzy decision matrix:
where
Step 5. Let them be IF-PIS,
, and the IF-NIS,
as follows:
Step 6. Calculate distances from IF-PIS, and distances from IF-NIS, by using the Hamming distance.
Step 7. The closeness coefficient for each failure I, at the level lean waste
is given:
Step 8. The crisp values are sorted in the decreasing order. The rank of the failures corresponds to the obtained rank.
In order to examine the robustness of the solution, the same numerical example was tested using three additional MADM methods. For the sensitivity analysis, the following methods were employed: complex proportional assessment (COPRAS) [
40], evaluation based on distance from average solution (EDAS) [
41], and ranking based on the distances and range (RADAR) [
42]. For the purposes of this analysis, the classical methods were extended using operations of IVIFNs.
Step 9. The total value of failure that is first in the rank at the level of each waste;
are obtained according to the expression:
Step 10. The overall risk level index is given:
Step 11. If it is overall risk index,
THEN the risk level is given according to rule:
where
N is the total number of linguistic expressions that describe risk levels
, n = 1, …, N are IVIFSs which are described risk levels.
Step 12. Respecting the risk level, determine the quality methods by which failure analysis is performed, in order to reduce and completely eliminate lean waste, and thus increase the reliability of the manufacturing process.
4. Case Study
The proposed methodology is tested on real-life data obtained from 20 manufacturing companies located in Serbia. A total of six companies are from the wood-processing and furniture industries, four companies are from the textile industry, four companies are from the automotive industry, and two companies are from the metal, construction, and chemical industries.
To determine the weights of the considered criteria, the production manager, FMEA leader, and quality manager (with certain variations in the job title/position) of each company evaluated the relative importance of the criteria by consensus. Afterwards (see the proposed model, Step 2), these assessments were aggregated into a single value. The DMs from each company submitted their assessments to the research team via email.
To test the proposed model, one company was randomly selected. Members of the FMEA team also played an important role in assessing the values of failures according to the considered criteria. During a panel discussion held at the premises of the selected company, DMs presented their evaluations through a constructive discussion. These evaluations were then submitted to the research team via email.
Based on best practice results and their own experience, the DMs of the selected company identified the failures occurring in the manufacturing process. The proposed IF-TOPSIS method is demonstrated through an example that ranks failures related to lean waste that is categorized as Unnecessary Transportation .
The identified failures that lead to lean waste, which is marked as transportation, include: not understanding the process flow (), inadequate layout of technological equipment (), large storage space (), communication failure (), and using old layouts ().
To better understand the identified failures, a brief description of each is provided below:
Not understanding the process flow refers to a situation where the operator does not fully understand the sequence of operations, and materials (parts) may be unnecessarily transported between workstations even though it is not planned.
Inadequate layout of technological equipment refers to a non-optimized arrangement of machines and workstations, which increases the distance materials’ need to travel, causing time losses that affect the execution of the production plan.
Large storage space refers to excessively large and poorly utilized storage areas. This requires unnecessary material handling, and materials are often transported for longer than necessary.
Communication failure can cause transportation to be duplicated, result in unnecessary transport, or lead to the transport of incorrect materials.
Using old layouts indicates the use of outdated arrangements of machines and workstations, despite potential changes in workforce size, transport means, automation, or product design and manufacturing.
4.1. An Application of the Proposed Model
The developed methodology is presented at a randomly selected SME (
). The fuzzy rating of the relative importance of DMs is presented in
Table 2. DMs originating from the first four companies have the highest importance,
, the next eleven companies have medium importance,
, and DMs originating from the last five companies have the lowest importance,
.
The aggregated weights of considered RFs are calculated by IVIFWG (Step 2 of the proposed algorithm). This procedure is illustrated by the following example:
so that:
The weights vector of the other two RFs were calculated in a similar way, so that:
The fuzzy decision matrix at the level transportation is constructed and presented in
Table 3 (Step 3 of the proposed algorithm).
According to the proposed algorithm (Step 4 to Step 5) the weighted fuzzy decision matrix and IF-PIS and IF-NIS are presented in
Table 4.
The distances from IF-PIS and IF-NIS, closeness coefficient values and rank of failures (Step 6 to Step 8 of the proposed algorithm) at the level of transportation waste are presented in
Table 5.
Respecting the obtained rank, it is clear that for the considered company, the greatest importance for the generation of transportation waste is failure. Using old layouts ().
In order to examine the robustness of the obtained solution, the results obtained using the TOPSIS method were compared with those obtained using the COPRAS, EDAS, and RADAR methods, as shown in
Table 6.
The application of all four methods showed that the top-ranked alternative is always (Using old layouts). There are only very minor variations in the ranking of alternatives among the considered methods. In particular, for the TOPSIS method, the last and penultimate alternatives have swapped positions compared to the other methods. This is because TOPSIS ranks alternatives based on their distance from the ideal solution, while the other methods use a slightly different mathematical logic. It is also observed that there is a slight deviation in the EDAS method, where the second and third alternatives swap positions compared to all other methods.
To quantify the comparison of these methods, the Pearson correlation coefficient was used. The correlation coefficient for the ranking coefficients between TOPSIS and COPRAS is 0.93, between TOPSIS and EDAS 0.83, and between TOPSIS and RADAR 0.96. This clearly indicates a very high positive correlation, confirming that the obtained solution is stable. Nevertheless, these methods are based on different mathematical principles, and under certain conditions, they may produce slightly different results. In this case, the TOPSIS method was recommended due to its characteristic of identifying the alternative that is closest to the ideal solution and furthest from the anti-ideal solution. This logic aligns well with the type of problem under consideration.
The total value of failures which are placed in first place in the rank at the level of each considered lean waste is given by using the procedure (Step 9 of the proposed Algorithm) and presented in
Table 7.
By applying the proposed procedure (Step 10 of the proposed algorithm), the overall risk index is as follows:
Using the modified fuzzy logic rules, the risk level of manufacturing process of the considered SME is determined (Step 11 of the proposed algorithm):
so that:
It follows that the level of risk of manufacturing process in considered SME can be described as medium.
The quality manager defines a set of quality methods based on their expertise and best practice results. The implementation of these methods facilitates failure analysis aimed at their elimination, which ultimately leads to the reduction or complete elimination of lean waste.
Considering the risk level of the manufacturing process in the analyzed SMEs, the failures ranked first for each type of lean waste can be analyzed using the following methods: contingency table, benchmarking, workflow diagram, check sheet (generic), cost-of-poor-quality analysis, design of experiments, flowchart (generic), mistake-proofing, operational definitions, storyboard, and survey. These methods are suitable for employees with basic engineering knowledge, and their application does not require significant time or financial resources. On the contrary, they can be implemented quickly and efficiently, thereby reducing the manufacturing process risk level, which is the main objective of operational management.
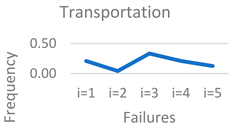
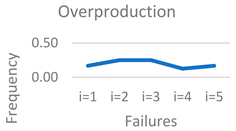
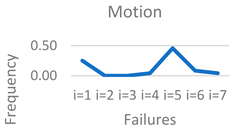
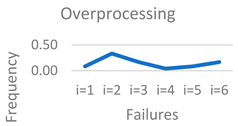
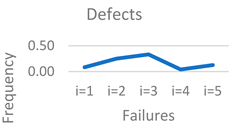
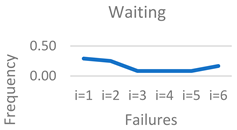
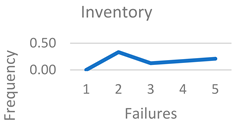
The rank of failures at the level of each lean waste for each considered SME is determined using the proposed IF-TOPSIS method. For both researchers and practitioners, it is important to identify which failure ranks first for each lean waste. The frequency with which each failure appears in the first rank, across all SMEs and for each lean waste, is presented in
Table 8.
Applying the proposed fuzzy production rules, the risk level of manufacturing process in each treated SME can be described as medium.
4.2. Discussion
Based on the obtained risk level of the manufacturing process and the results presented in
Table 8, a practical guide for quality managers in SMEs within the manufacturing sector can be developed. This guide should include a set of recommended preventive measures that quality managers can apply to avoid the occurrence of the most frequent failures. These measures should be tailored to the level of identified risk. This guide represents the main practical contribution of this research.
Lean waste types such as transportation, motion, overprocessing, waiting, and inventory are commonly caused by specific failures, namely: inadequate layout of technological equipment, employees having to move to receive information, inadequate processing modes, waiting for material between operations, and excessive supply of raw materials, respectively. Some of the methods that should be applied in these companies to analyze and eliminate the identified failures include the following: benchmarking, workflow diagrams, check sheets (generic), and cost-of-poor-quality analysis, among others. It is important to note that these quality methods can be effectively used to analyze all identified failures within the manufacturing process. The ultimate goal of this analysis is to prevent failure occurrence, and thereby reduce or eliminate lean waste.
Failures such as inadequate use of automation and poor assessment of market demands contribute to overproduction, which is considered the most critical type of lean waste in manufacturing enterprises. Methods like mistake-proofing and relations diagrams can effectively analyze and reduce overproduction.
The type of lean waste that is marked as defects is most frequently generated in SMEs due to two identified failures: inaccuracies in the documentation and insufficient process control. The issue of failure caused by inaccuracies in documentation can be effectively solved through the implementation of a quality management system. Additionally, process control in manufacturing can be successfully maintained by applying some statistical quality methods, such as control charts, Pareto charts, process capability studies, and regression analysis. For example, the application of regression models, with a particular focus on engineering and applied sciences data, is presented in [
43]. Readers can refer to this publication for more detailed information on this aspect, which goes beyond the scope of the present study.
All identified failures contribute almost equally to the generation of lean waste denoted as unused employee creativity. The effective elimination of this type of waste can be achieved through continuous employee education, either within SMEs or in collaboration with specialized training centers.
It is important to emphasize that even when the ranking of failures remains the same, the selection of appropriate quality methods should vary depending on whether the risk level of the manufacturing process is categorized as low or high.
5. Conclusions
In practice, the FMEA method is widely used in manufacturing companies to analyze failures and determine risk levels. Many authors have pointed out the disadvantages of this method, which can be addressed by combining FMEA with fuzzy set theory and MADM methods.
In this paper, the FMEA framework is applied to define RFs based on which manufacturing process failures in SMEs are evaluated. Failure identification is performed by DMs, relying on their knowledge, experience, and best practice insights.
In this research, it is assumed that it aligns more closely with human thinking to describe uncertainties in the relative importance of RFs and their values using pre-defined linguistic expressions. These linguistic terms are modeled by the IVIFNs.
The ranking of failures leading to lean waste is determined through a fuzzy multi-criteria optimization task. The failure ranking is based on the fuzzy TOPSIS method with IVIFNs, which is proposed in this research. The proposed fuzzy logic with rules using IVIFNs is employed to determine the risk level of the manufacturing process. Based on the obtained ranking of failures and the risk level of the manufacturing process, the quality manager can select the optimal number of quality methods. By applying these methods, lean waste can be reduced quickly and with minimal resource consumption, thereby increasing the reliability of the manufacturing process.
Additionally, quality managers in manufacturing SMEs across the region can use the proposed model to recommend quality methods to prevent failures, while ensuring the long-term reliability of the manufacturing process.
The main advantage of the presented model is that DMs can express their assessments using natural language words. By employing IVIFNs, these linguistic terms are quantitatively described in a sufficiently accurate manner. The model can be easily adapted to changes in the number of failures and their values. It also clearly identifies the weakest quality methods in the application, which should be the input when developing an enhanced business strategy.
The general limitations of the model include the need for a well-structured list of failures. Prioritization of measures may also be influenced by the subjective views of the quality manager, which could be seen as a disadvantage when defining the improvement strategy.
It is very important to emphasize that the data were collected in SMEs manufacturing companies located in Serbia. Therefore, the results cannot be generalized, as numerous factors may influence them, such as organizational culture, organizational behavior, hierarchical structure, level of automation, type of activity, and so on. Consequently, this fact can be highlighted as a key practical limitation of the study
The results obtained from 20 SMEs have demonstrated that to reduce waste, measures must be taken to reduce the failures that lead to them.
Future research will focus on applying the proposed model to rank failures for each type of lean waste, prescribing and selecting appropriate measures, and maximizing process effectiveness. Additionally, the sensitivity analysis of the obtained results could be performed by varying the weights of the criteria, that is, by examining the robustness of the proposed model through the application of other MADM methods.
As a specific area for future research, the application of artificial intelligence and similar optimization tools can be highlighted, which would enable real-time monitoring and predictive analysis.
