Abstract
We review recent heavy quarkonium measurements in , , and collisions at the LHC by the ALICE, ATLAS, CMS, and LHCb collaborations using Run-2 and early Run-3 data. Production studies include present differential cross-sections and polarization measurements of charmonium and bottomonium, providing precise tests of QCD theoretical calculations and unveiling symmetry relations among spin and orbital configurations. Notably, a quasi-bound-state has been observed at the LHC recently. Suppression analyses quantify the sequential melting of bottomonium states in collisions, serving as a probe of the deconfined quark–gluon plasma. Cold nuclear matter effects are constrained through comparisons of quarkonium yields in pPb and collisions. Furthermore, multi-quarkonium investigations observe di- and tri-quarkonium production processes and resonances, exploring multi-parton interactions and the symmetry structure underlying exotic hadron states.
Keywords:
quarkonium; LHC; cross-section; polarization; quark–gluon Plasma; multi-quarkonium; exotic hadron 1. Introduction
1.1. Theoretical Motivation
Heavy quarkonium is the bound state of a heavy quark () and its antiquark. While light-quark () mesons are inherently relativistic systems, heavy-quark pairs move at approximately non-relativistic velocities (typical squared velocities are for charm quark and for bottom quark) within the bound state. This separation of scales (specifically the hierarchy , corresponding to hard, soft, and ultrasoft scales) enables the effective field theories to describe non-perturbative effects in Quantum Chromodynamics (QCD) [1]. Therefore, heavy quarkonium serves as a unique probe for investigating the QCD-governed strong interaction within the Standard Model (SM) and uncovering potential new phenomena.
Experimental investigations of heavy quarkonium usually focus on charmonium (, especially , ) and bottomonium (, especially , , ). The top quark, being the heaviest of all quarks, was long believed to decay before it could hadronize into a bound state [2]. Nevertheless, recent analyses of the invariant-mass differential cross-section have uncovered an excess indicative of toponium () resonances [3,4], thereby opening promising avenues for experimental studies of the toponium family (details in Section 2.1.3).
Historically, quarkonium production has been challenging to describe from first principles. A variety of effective QCD frameworks have been developed to model the non-perturbative evolution of a heavy pair into a color-neutral bound state. Among these, the color-singlet model (CSM) [5] treats the as produced directly in the same quantum state as the physical quarkonium; the color-octet mechanism (COM) embedded in NRQCD [1,6] allows intermediate color-octet configurations whose transition to the bound state is encoded in universal long-distance matrix elements; and the color-evaporation model (CEM) [7,8] integrates the cross-section over the invariant-mass range below open-heavy-flavor threshold. In NRQCD, perturbative short-distance coefficients are factorized from non-perturbative long-distance matrix elements, which are assumed to be process independent. Various effective QCD models of quarkonium production yield distinct predictions for production cross-sections and spin alignments. Consequently, precise experimental determinations of these observables are essential for refining our theoretical comprehension of quarkonium production mechanisms.
Under extreme temperature and density, QCD predicts a phase transition from hadronic matter to a deconfined quark–gluon plasma (QGP) [9]. In such a medium, color screening weakens the binding potential between the heavy quark pair. Heavy quarkonium thus serves as a powerful probe of the deconfined QGP.
Heavy quarkonium also serves as “standard candles” for detector calibration and sensitive probes of exotics or physics beyond the SM. Precision measurements of quarkonium decay rates into leptonic or exclusive hadronic final states can reveal small departures from Standard Model couplings. For example, tests lepton-flavor universality, while searches for or probe weakly coupled dark states [10,11,12,13]. Exotic configurations (tetraquarks [14,15,16,17,18], glueballs) are also accessible because many quarkonium decays are gluon rich () or proceed via radiative transitions .
The first heavy quarkonium, , was discovered by the SLAC E598 and Brookhaven experiments in November 1974 almost simultaneously [19,20], which marked the “November Revolution”. Since then, charmonium spectroscopy has expanded rapidly: the SPEAR storage ring resolved the first radial excitation [21] and, through radiative transitions, the P-wave triplet [22,23,24,25]; subsequent experiments at DORIS and ADONE uncovered the vector state [26] and higher excitations [27], [27] and [25,28]. The known charmonium spectrum is summarized in Figure 1.
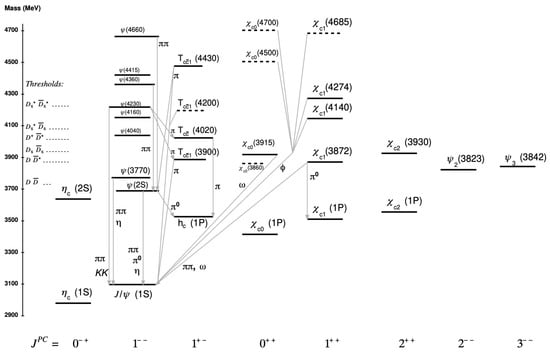
Figure 1.
Representation of the charmonium spectrum, adopted from the Particle Data Group 2024 Review [29]. Dashed lines denote states not yet experimentally established. Arrows denote the dominant hadronic transitions. For clarity, single-photon transitions such as have been omitted. The thresholds corresponding to a pair of ground-state open-charm mesons are marked in the figure. The quantum numbers of are still undetermined. Decays into open-flavor final states are not shown.
Shortly thereafter, in 1977 the Fermilab E288 experiment reported the bottomonium ground state in proton–nucleus collisions [30], followed by CLEO’s resolution of and at CESR [31], the identification of [32], and later the discovery of [33] and the vector states , at CESR and SLAC PEP [34]. The asymmetric-energy B factories (PEP-II, KEKB) and dedicated charm- and bottom-factory programs (CLEO-c, BES) in the 1990s and 2000s improved mass resolution and mapped numerous hadronic and radiative decay channels [35] as summarized in Figure 2.
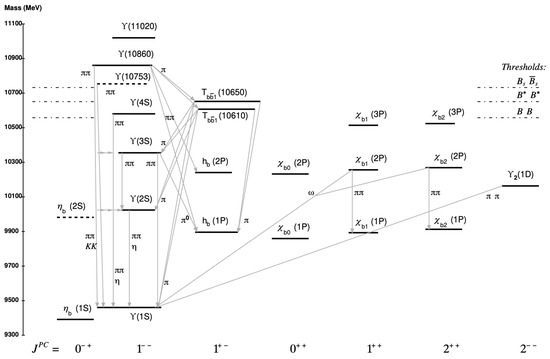
Figure 2.
Representation of the bottomonium spectrum, adopted from the Particle Data Group 2024 Review [29]. Dashed lines denote states not yet experimentally established. Arrows denote the dominant hadronic transitions. For clarity, single-photon transitions such as have been omitted. The thresholds corresponding to a pair of ground-state open-bottom mesons are indicated in the figure. Decays into open-flavor final states are not shown. Moreover, the transitions have also been reported.
With the advent of high-luminosity runs at the LHC, comprehensive measurements of quarkonium production cross-sections, polarizations, nuclear modification factors and rare transitions have been realized, completing the conventional charmonium and bottomonium spectra and opening a new era for the study of exotic quarkonium-like states.
1.2. Datasets and the LHC
The Large Hadron Collider (LHC) at CERN delivers unprecedented collision energies and luminosities for the study of heavy-quarkonium production and suppression. Four major experiments (ALICE, ATLAS, CMS, and LHCb) provide complementary coverage and measurement capabilities. CMS and ATLAS feature powerful central detectors with high-resolution silicon trackers, large-acceptance muon systems and strong solenoidal and toroid magnets, enabling precision dimuon spectroscopy over and , respectively [36,37] (Figure 3 and Figure 4). LHCb focuses on the forward region () as a spectrometer optimized for particle identification and vertex reconstruction [38] (Figure 5). ALICE combines a low-magnetic-field (around ) in the central barrel and specialized forward muon arm for heavy-ion physics, allowing measurements down to very low transverse momentum down to 0.1 GeV in proton–proton (), proton–lead (pPb) and lead–lead () collisions (Figure 6) [39].
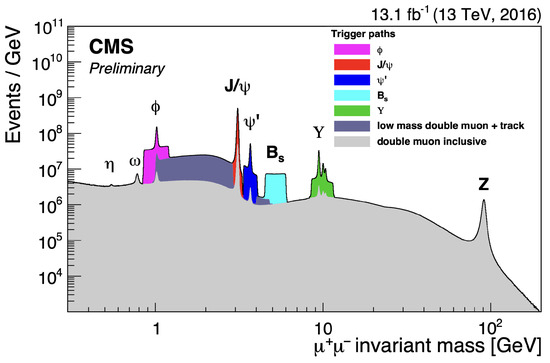
Figure 3.
Dimuon mass spectrum of CMS in 2016 collisions at 13 TeV, corresponding to an integrated luminosity of 13.1 fb−1. Colored shaded bands indicate the mass windows of dedicated trigger paths: (magenta), (red), (blue), (cyan), and (green). The dark and light gray bands show the acceptances of the low-mass dimuon+track triggers and inclusive dimuon triggers, respectively [40].
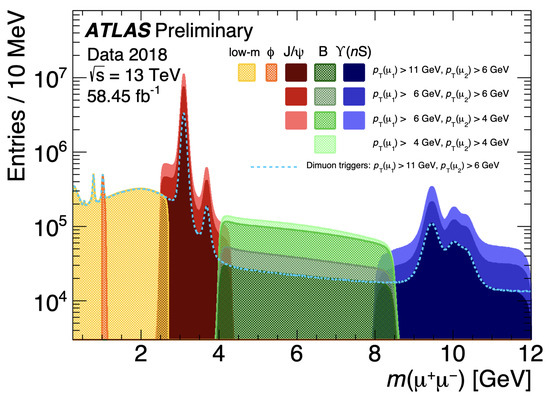
Figure 4.
Dimuon mass spectrum of ATLAS in 2018 collisions at 13 TeV, corresponding to an integrated luminosity of 58.45 fb−1. Shaded histograms show contributions from low-mass (yellow), (red) and (green and blue) resonances under different muon transverse-momentum selections. The cyan dashed curve indicates the dimuon trigger thresholds [41].
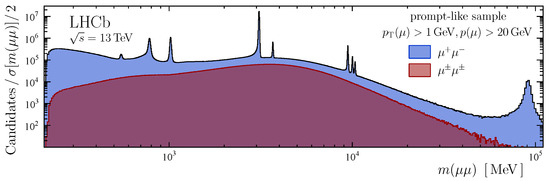
Figure 5.
Dimuon mass spectrum of LHCb at 13 TeV divided by opposite or same sign muon pair [42].
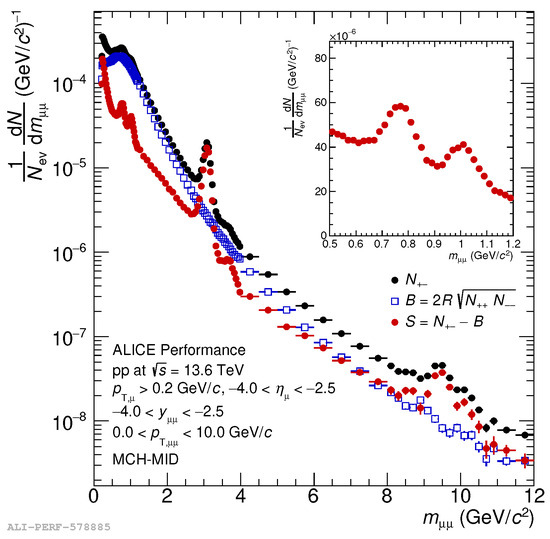
Figure 6.
Dimuon mass spectrum in collisions at 13.6 TeV recorded by ALICE. Black points show opposite-sign pairs . Blue open squares denote the like-sign combinatorial background . Red circles are the signal . The inset zooms the low-mass region () [43].
In this review, we concentrate on results from the most recent data-taking periods of Run-2 and Run-3. Section 2 is devoted to the production characteristics, including cross-sections and polarization observables of both individual charmonium and bottomonium states. Section 2.1.3 provides a brief overview of the latest theoretical and experimental studies on toponium production and its potential observability, highlighting prospects for future exploration. Section 3.1 and Section 3.2 address the suppression of quarkonium in heavy-ion collisions, examining how the quark–gluon plasma (QGP) modifies quarkonium yields and kinematic distributions. Section 3.3 and Section 3.4 focus on multiplicity dependent production and production in ultraperipheral collisions respectively. Section 4 addresses the associated production of multiple quarkonium, exploiting double and triple quarkonium final states as probes of parton correlations and double parton scattering in the high-energy regime.
The datasets surveyed in this review encompass , pPb and collisions at several center-of-mass energies. During Run-2 (2015–2018), the LHC delivered collisions at , collisions at and , and collisions at and . In Run-3 (2022–2026), the collision energy has been increased to , while operations have continued at . The integrated luminosity recorded by CMS is shown in Figure 7.
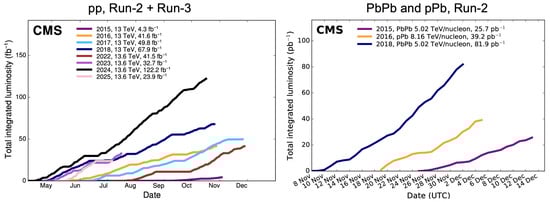
Figure 7.
Integrated luminosity recorded by the CMS experiment in , pPb and collisions during LHC Run-2 and Run-3. Left: the integrated luminosity delivered by the LHC and recorded by CMS during collisions in Run-2 and Run-3. Right: the integrated luminosity for and pPb collisions recorded by CMS in Run-2 [44,45].
2. Production Properties Measurements
Theoretical frameworks, such as NRQCD, yield distinct predictions for observables like differential cross-sections and spin-alignment [1,6,7,8]. Discriminating among these theoretical models requires precise experimental measurements of quarkonium production properties.
Recent experimental campaigns at the Tevatron and the LHC have provided a wealth of quarkonium data over a broad range of center-of-mass energies. CDF and D0 first reported measurements of , and cross-sections and polarizations in collisions at –1.96 TeV [46,47,48]. At the LHC, ALICE, ATLAS, CMS, and LHCb have extended these studies in collisions at , 8, 13, and 13.6 TeV, reconstructing quarkonium via dilepton decays () with branching fractions of a few percent. Despite these high-precision data, no single theoretical model simultaneously describes both the production cross-section and polarization patterns observed, underscoring the need for comprehensive reviews [49,50,51,52,53,54,55]. In this section, we summarize the current status of quarkonium production in collisions, organizing the discussion into measurements of differential cross-sections (Section 2.1) and polarization observables (Section 2.2), with emphasis on the most recent LHC Run-2 and Run-3 results.
2.1. Production Cross-Section
The production cross-section of a given quarkonium state in collisions is defined as the probability per unit luminosity for producing and is most often expressed differentially in transverse momentum and rapidity y. Experimentally, the double-differential cross-section times the di-lepton branching fraction is measured as
where is the signal yield in the fiducial region extracted from fits to the di-lepton invariant mass spectrum, the integrated luminosity, and the bin widths, A the geometrical acceptance, and the combined trigger and reconstruction efficiency. Corrections for feed-down from higher mass states are included when quoting prompt production. Precise measurements of these cross-sections over a wide kinematic range at –13.6 TeV have provided stringent tests of NRQCD factorization and alternative models (COM, CEM), which predict distinct and y dependencies [1,6,7,8].
2.1.1. Charmonium Production Cross-Section
The inclusive production cross-sections of the quarkonium states and in collisions were determined by several LHC experiments over a wide kinematic range.
All analyses reconstructed charmonium through its dilepton () or hadronic () decay channels, extracted raw yields through unbinned maximum-likelihood fits to invariant mass (and pseudo-proper time) distributions, and corrected for detector acceptance and efficiency using detailed Monte Carlo (MC) simulations or data-driven tag-and-probe methods. Backgrounds from incorrect combination of final state particles and feed-down decays were modeled and subtracted, and systematic uncertainties were evaluated by varying fit models, efficiency corrections, luminosity determinations, and branching fraction inputs [52,53]. The exclusive measurement further requires the final-state particles to be sufficiently isolated to suppress inelastic contamination, whereas the cross-section ratio analysis benefits from cancellation of correlated uncertainties.
In collisions at , ATLAS, CMS, and LHCb have measured differential cross-sections of and , which were reconstructed via their dimuon decays [52,53,56]. In ATLAS and CMS measurements, the differential production cross-sections are measured as functions of rapidity y and transverse momentum and compared to theoretical predictions. In contrast, the LHCb analysis provides the cross-section as a function of y only.
Among those analyses, ATLAS measures prompt and non-prompt contributions separately (Figure 8) by fitting the pseudo-proper decay length , where is the transverse displacement between the primary vertex and the dimuon vertex, to distinguish directly produced quarkonium from those originating in b-hadron decays. CMS (Figure 9) only measures the prompt production cross-section, while LHCb (Figure 10) focuses on the inclusive production. This difference largely reflects detector vertexing and trigger capabilities: CMS and ATLAS can separate prompt and non-prompt using lifetime information. In terms of observables, ATLAS () and CMS () report double-differential cross-sections , LHCb reports , and ALICE reports the -dependent cross-section ratio.
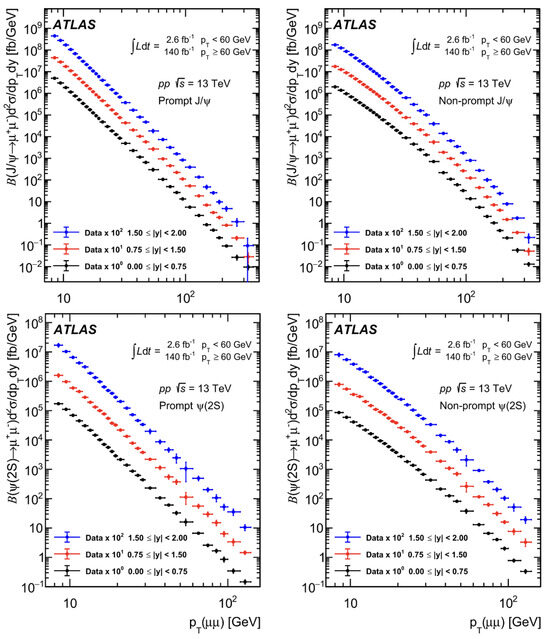
Figure 8.
Prompt and non-prompt (top) and (bottom) double-differential cross-sections measured by ATLAS in collisions at [53].
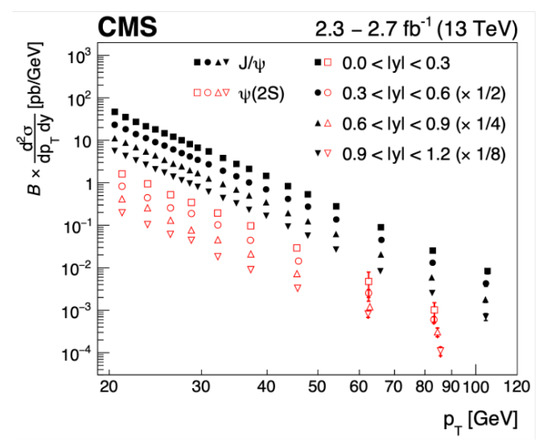
Figure 9.
Prompt and double-differential cross-sections measured by CMS in collisions at [52].
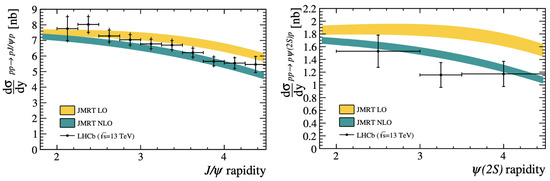
Figure 10.
Inclusive (left) and (right) differential cross-sections measured by LHCb in collisions at [56].
In collisions at and , ALICE measured the inclusive cross-section ratio at midrapidity () in the channel and forward rapidity () in the channel [57]. The results are shown in Figure 11.
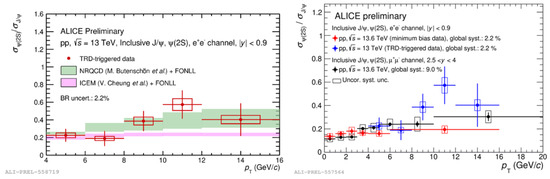
Figure 11.
Left: Inclusive cross-section ratio as a function of transverse momentum in collisions at , compared with NRQCD [58] and ICEM [59] predictions. Right: -dependent measurements of at midrapidity () and forward rapidity () in collisions at and , shown alongside the Run 2 midrapidity results at [57].
In collisions at and , ALICE measured the inclusive cross-section ratio as a function of at midrapidity () in the channel and forward rapidity () in the channel [57]. The results are shown in Figure 11.
Overall, the measurements are mutually consistent across their respective phase-space regions and broadly compatible with theoretical calculations within the quoted uncertainties. Further improvements in precision and extended kinematic coverage will sharpen global data constraints, e.g., those entering NRQCD extractions.
2.1.2. Bottomonium Production Cross-Section
A series of precise measurements of bottomonium production cross-sections in collisions has been carried out by CMS, ALICE and LHCb. These studies span center-of-mass energies from to , and include ground and excited states , and [60,61,62]. Collectively, these measurements provide stringent tests of non-relativistic QCD factorization and alternative quarkonium production models across a wide kinematic range.
All analyses reconstruct decays and extract signal yields by performing maximum-likelihood fits to the dimuon invariant-mass distributions. The experiments complement each other in their kinematic coverages. CMS extends up to in the central () region, while ALICE and LHCb focus on low at forward region ( for ALICE and for LHCb). All the measurements only consider the prompt contribution.
CMS measurements (Figure 12) focus on the double-differential quarkonium production cross-sections , whereas ALICE (Figure 13) reports single-differential cross-sections and separately. LHCb (Figure 14) investigates the excited-to-ground yield ratios as a function of event multiplicity. Here the multiplicity is defined by the self-normalized primary-vertex counts and to characterize the forward and backward charged-particle activity.
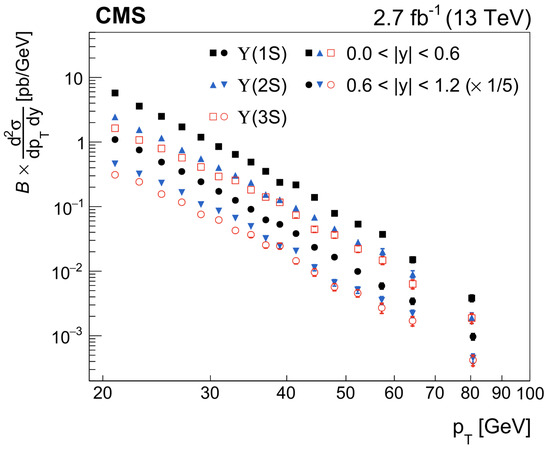
Figure 12.
double-differential cross-sections measured by CMS at [60].
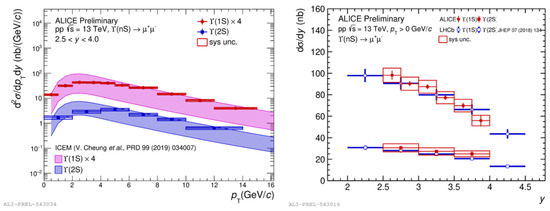
Figure 13.
Left: inclusive and production cross-sections at forward rapidity as a function of in collisions at , compared to ICEM+FONLL calculations [63,64]. Right: rapidity dependence of the inclusive and cross-sections at forward y in collisions at shown alongside LHCb measurements at the same energy [61].
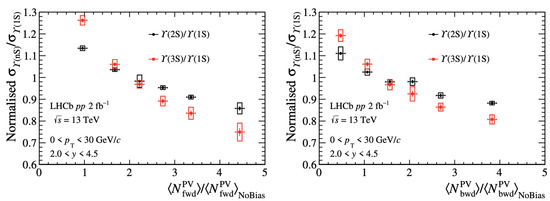
Figure 14.
Normalized ratios and as functions of the self-normalised multiplicity (left) and (right) for and [62].
Those measurements exhibit coherent dependencies on , y, and event variables, with cross-experiment agreement within uncertainties. Increased statistics and reduced systematics, especially at a very high region, will strengthen the data inputs used by theory frameworks such as NRQCD while remaining agnostic to any particular model in this summary.
2.1.3. Search for Quasi-Bound-State
While charmonium and bottomonium have been thoroughly studied during the LHC Run-2 period, searches for toponium states have continued in parallel. According to traditional views, top quarks would decay through weak interactions before forming bound states due to their excessively large mass [2]. However, owing to the unprecedented luminosity, studies of top quark pairs () have received widespread interest, especially regarding the possible quasi-bound-states (). Exciting evidence has been reported by the CMS [3] and ATLAS [4] collaborations in analyses of the invariant mass spectrum (), as a significant event excess has been observed near the production threshold.
The CMS and ATLAS collaborations followed a similar analysis strategy. In their analyses, candidates were reconstructed by the channel using the collision dataset collected at 13 TeV, and the distribution was examined. Several background sources were considered, including non-resonant production, misidentified candidates, and other processes. All background component distributions were modeled by MC simulations. The possible state was also simulated to estimate its production cross-section. To measure the spin of possible quasi-bound-states, candidates were separated into nine categories according to two angular observables and , which characterize the angle between two charged leptons in the final state [4]. Fits were applied across all nine categories incorporating contributions from both backgrounds and the hypothetical state. The fits conducted by the ATLAS collaboration are illustrated in Figure 15.
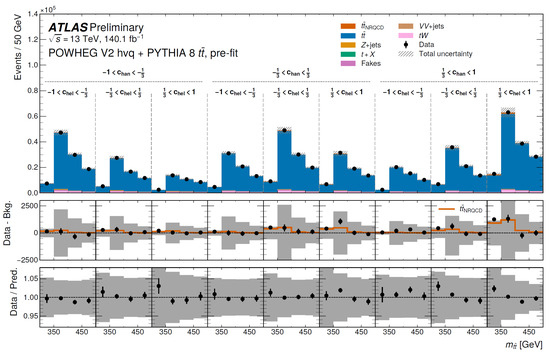
Figure 15.
Fits on the dimension with the ATLAS search. Top panel: event distributions (black dots) and fits (filled area) in nine categories. Middle panel: event distributions with the background contributions subtracted (distributions of the excess) and the simulated distributions of possible state (orange solid line) in nine categories. Bottom panel: the ratio of the data and the extended model including contributions [4].
A similar phenomenon has been observed by the CMS and ATLAS collaborations: a significant event excess above the background expectation has been identified near the pair production threshold. Both collaborations announced a significance exceeding 5 standard deviations and the production cross-sections of the state as
The production cross-section results from both collaborations were consistent and comparable to the theory calculation of [65]. Regarding the spin of the state, a more significant excess has been observed by both collaborations in larger and categories, supporting the pseudo-scalar configuration hypothesis.
The CMS and ATLAS collaborations have obtained remarkably consistent results, announcing the first observation of the quasi-bound-state. It provides an explanation for the previously observed differences between MC and data at the mass threshold, as observed by the CMS [66] and ATLAS [67,68] collaborations. As a groundbreaking discovery, it provides a new insight into the study of NRQCD and the top quark. This is the first time that an unstable bound state formed by the QCD Coulomb potential, predicted by NRQCD, has been observed experimentally [69]. Both its existence and its property indicate that the QCD Coulomb potential is strong enough to form a broad enhancement structure. This state also provides a great verification of the Sommerfeld effect [70].
Furthermore, it adds valuable information for the top Yukawa coupling [71]. In addition, it is worth noting that this state is also of great significance in the research of quantum entanglement. A system exhibits the maximum entanglement near the threshold [72,73,74]. And the pseudo-scalar nature of the state is a classic example of the maximum entanglement between two particles in theory [75]. It provides us with an extremely high energy entanglement source generated by strong interaction. It also indicates that quantum entanglement can be generated and maintained until it is detected, even in extremely high-energy environments.
However, it cannot be ignored that the simulation near the top pair production threshold remains challenging, necessitating additional theoretical calculations and experimental verification. The precise measurement of the properties of the state would also be a priority during the LHC Run-3 period.
2.2. Polarization
Quarkonium polarization probes the spin alignment of the produced bound state. The polarization of quarkonium states decaying to can be extracted from the angular distribution
where and are the polar and azimuthal angles of the decay lepton in a chosen polarization frame, and the parameters , , and characterize the degree of longitudinal versus transverse alignment [1,76,77,78,79,80,81].
The most common reference frames are the helicity (HX) frame, in which the z-axis is aligned with the quarkonium momentum in the collision center-of-mass frame; the Collins–Soper (CS) frame, where the z-axis bisects the angle between the two beam directions in the quarkonium rest frame; and the perpendicular helicity (PX) frame, defined orthogonal to the CS frame. In each case, the y-axis is taken along the direction of the vector product of the two-beam momenta in the quarkonium rest frame, ensuring a right-handed coordinate system [82].
Different quarkonium production mechanisms predict markedly different values of , especially at high , making polarization a sensitive discriminator among models. Measurements by CMS, ATLAS and LHCb at have so far revealed small or transverse-longitudinal mix polarizations in apparent tension with leading-order NRQCD expectations [83,84]. However, due to the lack of statistics, further studies are needed to confirm such discrepancy and provide guidance for theoretical improvements.
For quarkonium states reconstructed through decay channel, the angular distribution
in the quarkonium rest frame can be integrated over the azimuthal angle in the helicity frame where acceptance effects factorize. Fits to the distributions yield in each bin after subtraction of continuum background and, for prompt samples, feed-down from higher states or B-hadron decays.
In collisions at , CMS analyzed 2017–2018 data corresponding to an integrated luminosity of 103.3 fb−1 to extract the polar anisotropy parameter for prompt and non-prompt and mesons in the helicity frame from dimuon decay angular distributions (Figure 16 and Figure 17) [85]. The prompt and non-prompt components were separated by fitting the pseudo-proper decay length.
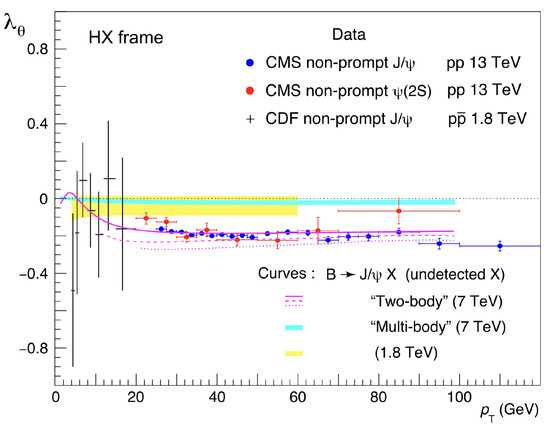
Figure 16.
Non-prompt polarization parameter as a function of in collisions at measured by CMS [85]. Vertical bars indicate total uncertainties. Predictions for polarization from decays are shown for three theoretical calculations [86,87], and the low- CDF measurement [47] is also included.
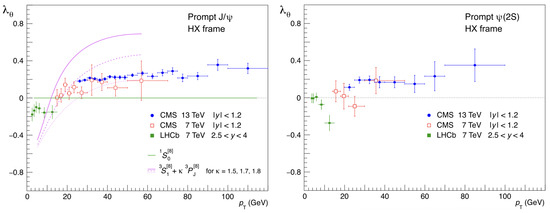
Figure 17.
Prompt (left) and (right) polarization parameter as a function of in collisions at measured by CMS [85]. Compared with CMS [76] and LHCb [78] results at . Vertical bars indicate total uncertainties.
The dependence of was measured for in the range 25–120 GeV/c and for in 20–100 GeV/c. Non-prompt polarizations agree with the two-body B-hadron decay hypothesis for , where approaches an asymptotic value of ≈0.3. When combined with previous CMS and LHCb measurements at , the prompt displays a significant dependence at low transverse momentum.
In heavy-ion collisions, polarization can also probe the properties of the quark–gluon plasma, and it has been hypothesized that the strong magnetic field in the early stages may align quarkonium spins. In ALICE, the polarization of and mesons is extracted from the anisotropies in the angular distribution of their decay muons (Figure 18 and Figure 19) [88]. This contribution reports the -differential polarization in collisions at at forward rapidity (), presented in two reference frames and compared with earlier measurements.
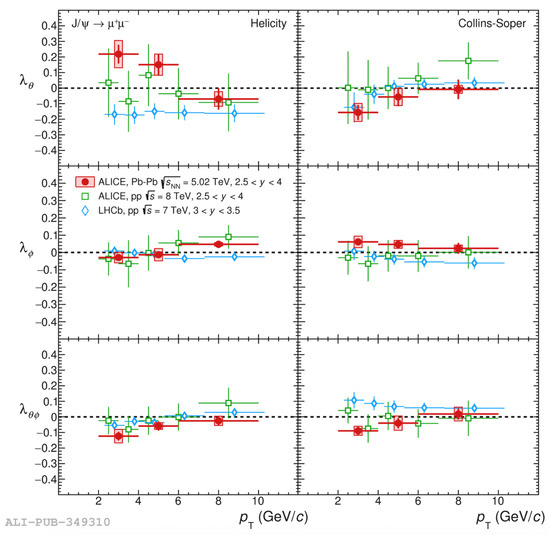
Figure 18.
polarization parameters as functions in collisions at measured by ALICE [88], compared with the ALICE inclusive measurement at [80] and the LHCb prompt result in at [78].
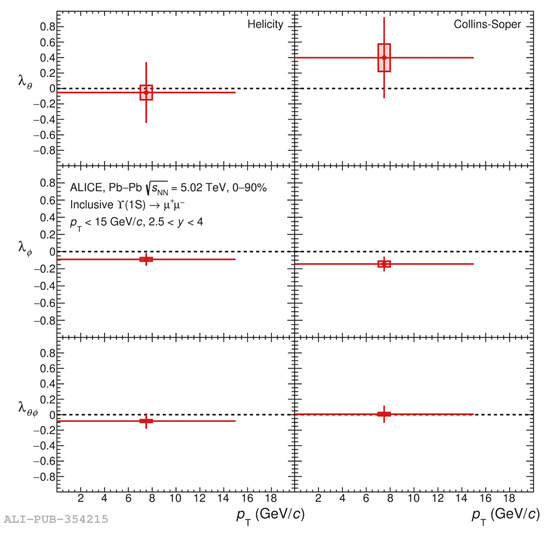
Figure 19.
polarization parameters as functions in collisions at measured by ALICE [88].
3. Production in Heavy Ion Collisions
3.1. Suppression in Collisions
In ultra-relativistic collisions, the formation of a deconfined QGP modifies the binding potential of heavy pairs via Debye screening, leading to a sequential “melting” of quarkonium states in order of decreasing binding energy [9]. This phenomenon manifests a reduction in observed yields relative to expectations from incoherent superposition of interactions, with more loosely bound excitations suppressed at lower medium temperatures than the ground states.
The degree of suppression is commonly quantified by the nuclear modification factor
where is the average nuclear overlap function for a given centrality class, the differential yield in , and the corresponding cross-section in collisions [89]. The double ratios of excited-to-ground yields,
were also employed, providing the cancellation of common systematic uncertainties and feed-down fractions [90].
Experimentally, suppression measurements proceed by reconstructing quarkonium decays (e.g., ) in heavy-ion and reference datasets under identical kinematic selections and center-mass-energy. Yields are extracted via fits to invariant-mass spectra in bins of transverse momentum, rapidity, and collision centrality. Detector acceptance and efficiency corrections, derived from detailed MC simulations and validated with data-driven tag-and-probe methods, are applied to obtain corrected yields. Systematic uncertainties from background modeling, yield extraction, luminosity, and nuclear geometry are evaluated by varying fit models and overlap-function determinations.
In and collisions at , CMS measured the yields of via decays with integrated luminosities of 166 μb−1 and 5.4 pb−1, respectively (Figure 20) [91]. The differential cross-sections were obtained for and .
A centrality-dependent suppression was observed in collisions relative to collisions, which showed no significant dependence on y or . The is not observed in , implying at least a 7 fold suppression at 95% confidence. The results are consistent with sequential melting scenarios in a QGP:
In and collisions at , ATLAS measured production via decays using 1.38 nb−1 (2018) and 0.44 nb−1 (2015) of data and 0.26 fb−1 of data, for , and 0–80% centrality, extracting as functions of centrality, and , and studying excited-to-ground suppression ratios [92] (Figure 21).
In the same collisions, ALICE recorded 1.38 nb−1 of data with its muon spectrometer at forward rapidity , measuring the nuclear modification factor as functions of rapidity, and centrality [93] (Figure 22).
Both experiments observe sequential melting consistent with theoretical models, with ATLAS covering midrapidity and a broad kinematic range and ALICE extending sensitivity into the forward region.

Figure 20.
Nuclear modification factors of as functions of measured by CMS at [91]. Statistical (systematic) uncertainties are drawn as vertical bars (boxes), while global normalization uncertainties from the measurement (3.2%) and the reference (6.3% for , 6.9% for ) are indicated at unity by open, red-filled, and black-filled boxes, respectively.


Figure 21.
Nuclear modification factors for , and as a function of (left), (middle) and (right) in at [92] compared to the theoretical calculation [94,95]. Dark bands indicate uncertainties from the nPDF choice, while light bands show model uncertainties from parameter variations.
Figure 21.
Nuclear modification factors for , and as a function of (left), (middle) and (right) in at [92] compared to the theoretical calculation [94,95]. Dark bands indicate uncertainties from the nPDF choice, while light bands show model uncertainties from parameter variations.


Figure 22.
Right: Nuclear modification factor ratio versus the average number of participants in and collisions at , shown atop statistical hadronization model values [96] with the red-filled box at unity indicating the reference uncertainty. Left: Measured as a function of in collisions, where the red box at unity denotes the global uncertainty correlated with , compared to hydrodynamic [97] and transport [94] model predictions [93].

3.2. Suppression in Collisions
In pPb collisions, quarkonium production is modified predominantly by cold-nuclear-matter (CNM) effects, including the shadowing of nuclear parton distribution functions, initial-state parton energy loss, and nuclear absorption of pre-resonant pairs [98,99]. These effects lead to a modification of yields relative to a simple scaling of cross-sections, and must be disentangled from genuine QGP-induced suppression.
The nuclear modification factor in collisions is defined analogously as
where is the mass number of the nucleus and the differential cross-section in collisions [100]. Since is essentially governed by CNM effects, the double ratio can be used to cancel out the CNM contributions in .
In addition, another key observable is the forward-to-backward ratios, which is defined as
The ratio isolates rapidity-dependent CNM effects without reliance on an external reference.
Methodologically, CNM studies compare yields in and interpolated or directly measured data at matched . Quarkonium states are reconstructed via dilepton channels, with raw yields obtained through invariant-mass fits in bins of transverse momentum and rapidity. Efficiency and acceptance corrections are applied as for measurements. Systematic uncertainties from interpolation of the baseline, luminosity, and model input for nuclear PDFs are assessed by varying proton reference data and shadowing parametrizations. Such studies establish the baseline modifications to be accounted for when interpreting suppression in nucleus–nucleus collisions.
In pPb and collisions at , CMS measured prompt and non-prompt for in () and (pPb) with 28 pb−1 and 35 nb−1, finding RpPb consistent with 1 (Figure 23) but a forward-to-backward ratio that decreases with transverse-energy deposition (Figure 24) [101]. Under the same collision conditions, CMS also measured sequential suppression of states. The results show as being the least suppressed, followed by , and exhibiting the strongest suppression (Figure 25) [102].
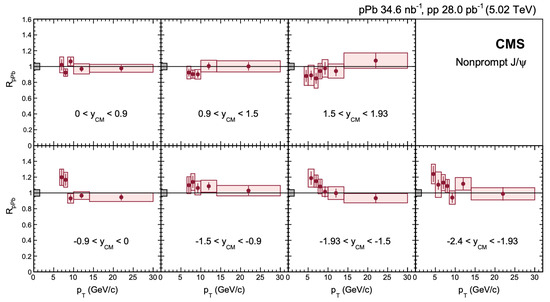
Figure 23.
for non-prompt as a function of in seven intervals, where vertical bars show statistical uncertainties, shaded boxes denote systematic uncertainties, and the fully correlated global uncertainty of 4.2% is indicated by a grey box at RpPb = 1 next to the left axis [101].
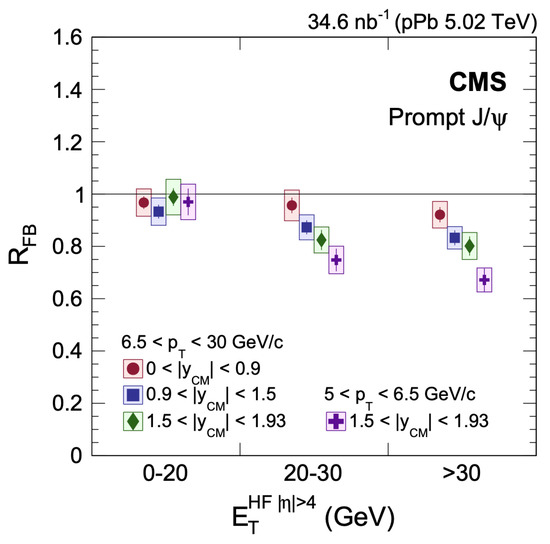
Figure 24.
Dependence of the for prompt on hadronic activity, quantified by the transverse energy deposited at large pseudorapidity . Data points are slightly shifted horizontally to avoid overlap, vertical bars denote statistical uncertainties, and shaded boxes indicate systematic uncertainties [101].
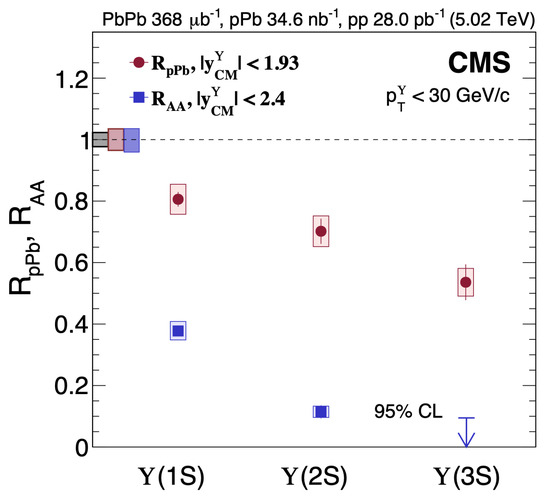
Figure 25.
RpPb of , , and (red circles) for the integrated kinematic range and . The RpPb results are compared to CMS results on (blue squares for and ) and the blue arrow for the upper limit at 95% confidence level (CL) on for and at the same energy [102,103]. Vertical bars represent statistical and fit uncertainties, and the filled boxes around points depict systematic uncertainties. The gray and red boxes around the unity line represent the uncertainty in the luminosity normalization for pp and pPb collisions. The blue box around unity represents the global uncertainty related to data.
ATLAS, using 28 nb−1 of and 25 pb−1 of data, reconstructed , and () for and , separated prompt and non-prompt components, and observed no significant suppression of ground-state (Figure 26) [104], which is consistent with the CMS results. However, a stronger low- suppression of excited charmonium and bottomonium in central pPb collisions (Figure 27) was observed.
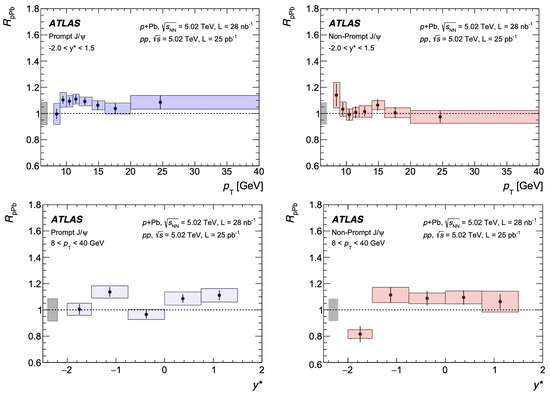
Figure 26.
Nuclear modification factor RpPb versus (top) and y (bottom) for prompt (left) and non-prompt (right). The horizontal position of each point is the mean of the weighted distribution and the box width is the corresponding bin size. Vertical error bars show statistical uncertainties, box heights denote uncorrelated systematic uncertainties, and the leftmost grey boxes at RpPb = 1 indicate the correlated systematic uncertainty [104].
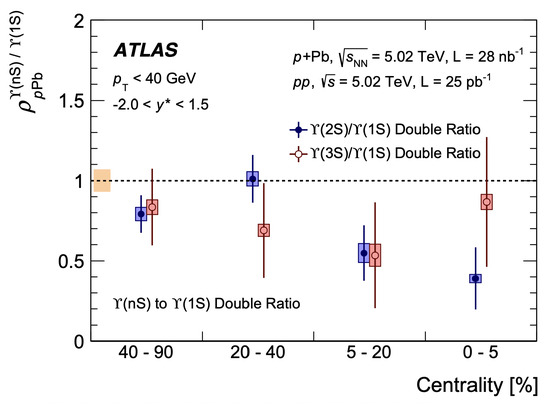
Figure 27.
The bottomonium double-ratio as a function of event centrality in collisions. Vertical error bars show statistical uncertainties, colored box heights indicate uncorrelated systematic uncertainties, and the leftmost yellow box at represents the total uncertainty of the reference [104].
By using 292 μb−1 of collision data collected in 2016, ALICE measured inclusive, prompt and non-prompt of at midrapidity in the dielectron channel, and from the non-prompt yield extracted the production cross-section at midrapidity [105]. While CMS delivers a broad kinematic survey of cold-nuclear-matter effects, ATLAS extends to excited and bottomonium states with centrality dependence, and ALICE uniquely probes down to zero with precision dielectron measurements. (Figure 28)
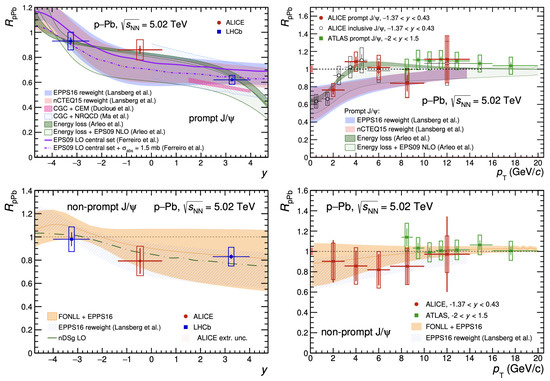
Figure 28.
Nuclear modification factor of prompt as a function of rapidity (top left) and versus transverse momentum at midrapidity alongside inclusive (top right) in collisions at , measured by ALICE [105], compared with LHCb measurements at backward and forward rapidity in the left panel and ATLAS data up to in the right. Vertical error bars denote statistical uncertainties and the open boxes systematic uncertainties; the top-left panel also includes the extrapolation uncertainty to for ALICE dielectron data, and the filled box at in the top-right panel indicates the global relative uncertainty of the ALICE measurement. The bottom-left (bottom-right) panel shows of non-prompt as a function of rapidity (transverse momentum) at midrapidity, again compared to LHCb and ATLAS, with vertical bars and open boxes for statistical and systematic uncertainties, the shaded box in the bottom-left panel for the extrapolation to , and the filled box at in the bottom-right panel marking the global normalization uncertainty. Predictions from the nDSg and EPPS16 nuclear-PDF parametrizations (including a reweighted calculation) are superimposed on both bottom panels.
Complementing these, LHCb has measured quarkonium production in collisions at using the 2016 data sample in the forward (, ) and backward (, ) configurations [106]. By disentangling prompt and non-prompt and via fits to the dimuon pseudo-proper decay length, LHCb extracted for each state separately (Figure 29), achieving marked precision gains over the analysis. The collaboration also reports the bottomonium nuclear modification factor ratio as a function of rapidity and event activity (Figure 30), thus providing comprehensive constraints on CNM effects across charmonium and bottomonium states.
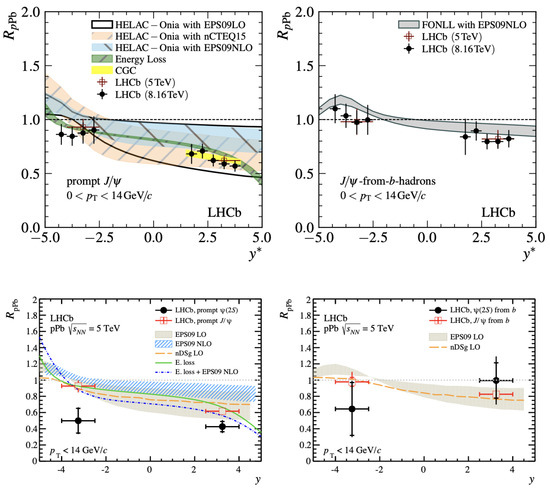
Figure 29.
Top: Nuclear modification factor for prompt (left) and non-prompt (right) mesons at (black points), displayed together with the measurements and various theoretical predictions. Bottom: for prompt (left) and non-prompt (right) at , with the corresponding results and model curves overlaid [106].
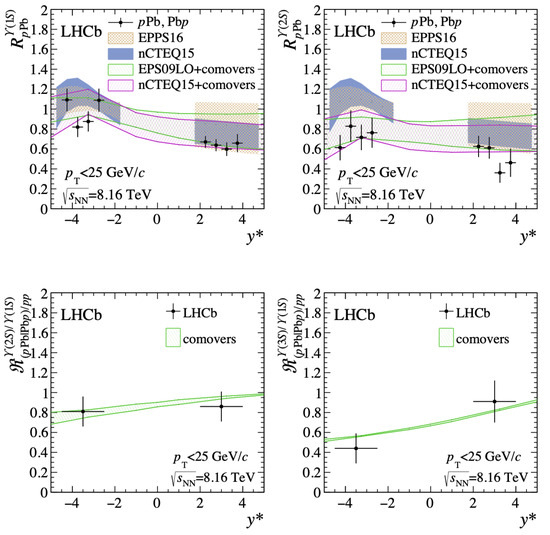
Figure 30.
Top: Nuclear modification factor for (left) and (right) as a function of rapidity in and collisions at . Bottom: Nuclear modification factor ratio for (left) and (right) versus rapidity [106].
3.3. Multiplicity Dependence
Multiplicity, defined as the charged-particle yield within a specified rapidity or pseudorapidity window, quantifies event activity and the soft environment accompanying hard production. In and collisions it correlates strongly with geometry and centrality proxies (e.g., ), whereas in there is no geometric centrality, yet multiplicity remains a powerful classifier of underlying–event intensity. Consequently, multiplicity has become a key for testing quarkonium formation and dissociation.
The observable provides a clean probe of activity-dependent quarkonium dynamics because luminosity, efficiency, and most initial-state effects largely cancel, making the ratio directly sensitive to final–state interactions across , , and . In at , CMS performs a multiplicity scan with prompt and non-prompt separation and observes a statistically significant multiplicity dependence only for the prompt ratio, with the non-prompt ratio remaining flat (Figure 31) [107]. In at , LHCb measures the ratio versus overlapping and nonoverlapping multiplicity estimators. A clear dependence appears solely for the prompt ratio with the local estimator, while nonoverlapping estimators and the non-prompt ratio are nearly flat (Figure 32) [108]. In a centrality-differential study at , ALICE found an enhanced suppression of relative to via the double ratio and , most pronounced at backward (Pb–going) rapidity (Figure 33) [109].
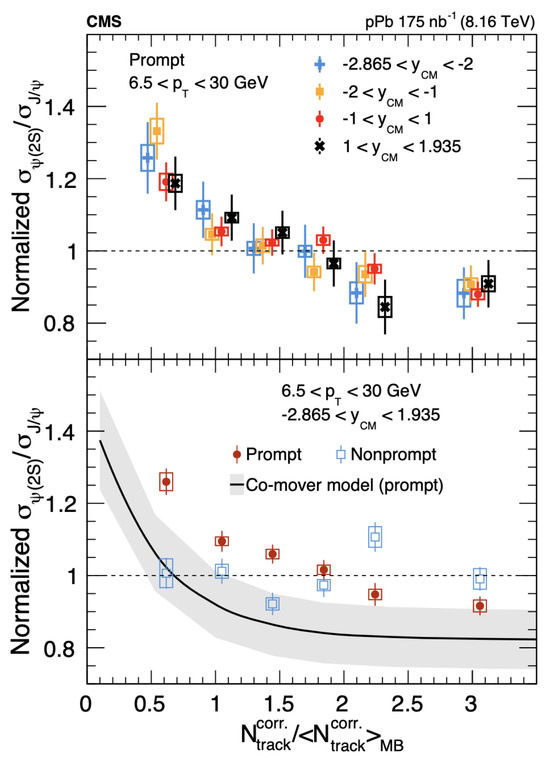
Figure 31.
Upper: the prompt normalized cross-section ratio versus normalized event charged-particle multiplicity for four different rapidity selections. The different sets of colored data points have a slight horizontal offset applied for visual clarity. Lower: the same observable for prompt (red circular points) and non-prompt (blue square points) mesons when combining all four rapidity selections into a single measurement. The black line with a gray band shows a model incorporating co-mover effects [110] for prompt charmonia. Error bars represent statistical uncertainties, while boxes display systematic uncertainties [107].
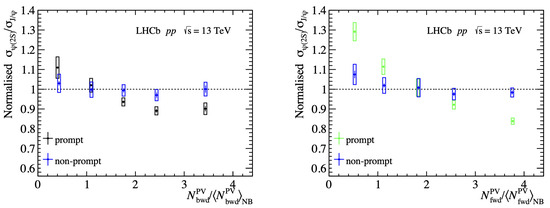
Figure 32.
Normalized production ratio as a function of (left) , with , and (right) , with , integrated over the full -y range of and [108].
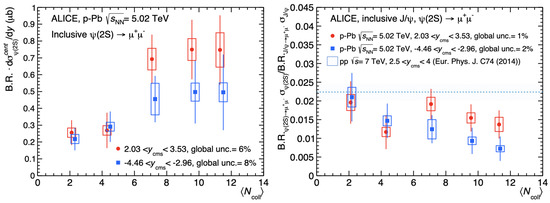
Figure 33.
Left: production cross-sections shown as a function of centrality of the collision for and collisions. Right: shown as a function of and compared to the value (line), with a band representing its uncertainty. In both figures, vertical error bars correspond to statistical uncertainties, while the open boxes represent the systematic uncertainties. The points are slightly shifted in to improve visibility [109].
ALICE also measures the multiplicity dependence of inclusive at and finds a steeper-than-linear rise in the relative yield as a function of multiplicity [111] (Figure 34).
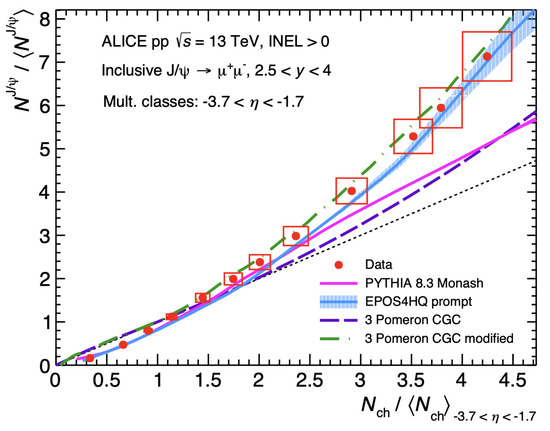
Figure 34.
relative yield as a function of the relative multiplicity in the V0C acceptance , compared with PYTHIA 8.3 [112], EPOS4HQ [113] and two 3-Pomeron CGC model predictions [114,115]. The dotted line represents the diagonal [111].
3.4. Production in Ultraperipheral Collisions
Ultraperipheral collisions (UPCs) occur at impact parameters exceeding the sum of the nuclear radius, where intense quasireal photon fields from fast ions drive photonuclear and two-photon interactions. In and UPCs, exclusive vector-meson photoproduction is coherent when the photon couples to the full nucleus (small ) and incoherent when it couples to a single nucleon (large ). These measurements probe nuclear gluons at under clean, low-multiplicity conditions.
For coherent photoproduction, CMS studies the coherent cross-section that disfavors impulse-approximation expectations in collisions at using forward-rapidity dimuons (Figure 35) [116]. LHCb performs the same class of measurement in collisions at at forward rapidity with better acceptance at low transverse momentum, obtaining rapidity-differential coherent cross-sections that indicate sizable nuclear effects and extend the x reach (Figure 36) [117].
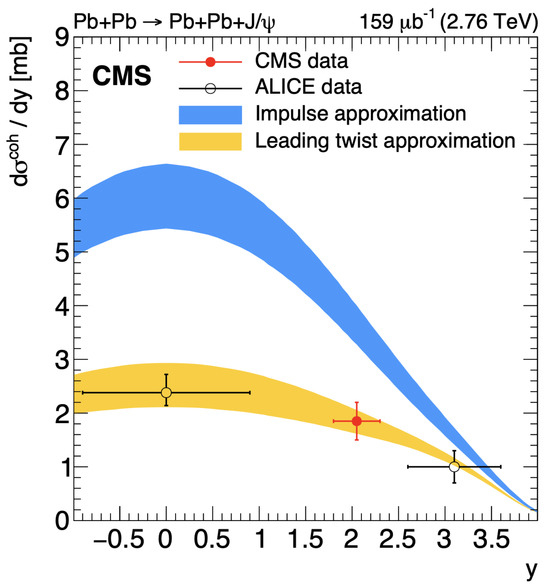
Figure 35.
Differential cross-section versus rapidity for coherent production in ultraperipheral collisions at , measured by ALICE [118,119] and CMS [116]. The vertical error bars include the statistical and systematic uncertainties added in quadrature, and the horizontal bars represent the range of the measurements in y. Also the impulse approximation and the leading twist approximation calculations are shown.
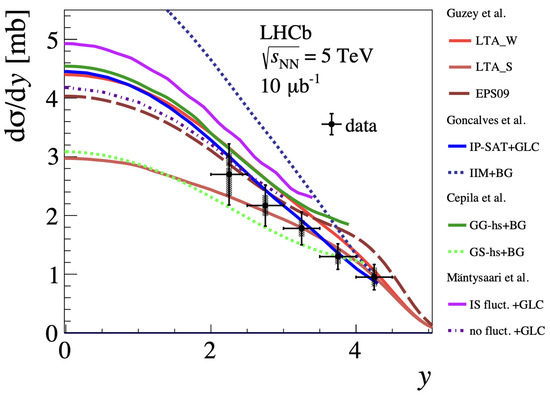
Figure 36.
Differential cross-section as a function of rapidity for coherent production compared to different phenomenological predictions [120,121,122,123,124]. The measurements are shown as points, where the inner and outer error bars represent the statistical and the total uncertainties, respectively. This includes the uncertainty on the luminosity and is therefore highly correlated [117].
Incoherent photoproduction and the spectrum are determined by ALICE at midrapidity using collisions at . The measured requires nucleon- and subnucleon-scale fluctuations to describe the observed shape (Figure 37) [125].
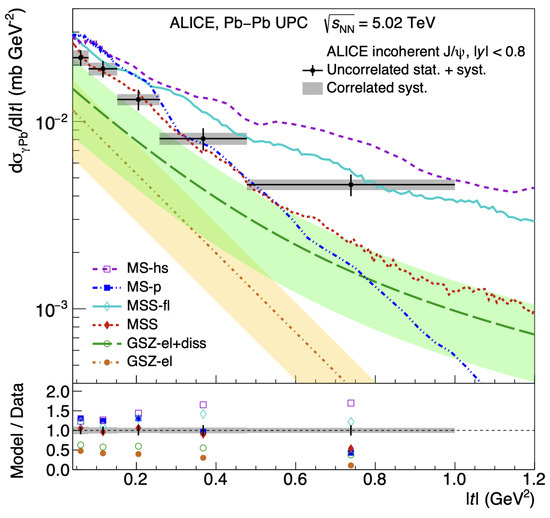
Figure 37.
Cross-section for the incoherent photoproduction of vector mesons in ultraperipheral collisions at measured at midrapidity [125]. The uncorrelated uncertainty (statistical and systematic added in quadrature) is indicated with the vertical bar, while the correlated uncertainty by the grey band. The width of each range is given by the horizontal bars. The lines show the predictions of the different models described in the text. The bottom panel presents the ratio of the integral of the predicted to that of the measured cross-section in each range. The relative uncertainties on the ratios calculated from GSZ are 45%.
Exclusive and dissociative photoproduction are measured by ALICE in UPCs at using forward detectors to enforce exclusivity and to separate , , and (Figure 38) [126].
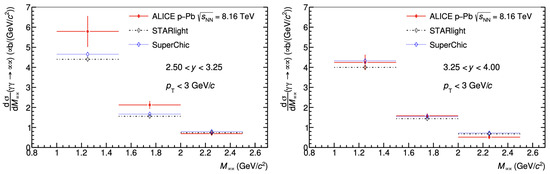
Figure 38.
Differential cross-sections for exclusive production measured by ALICE in UPCs at as a function of , for (left) and (right) [126]. The vertical error bars represent the statistical and systematic uncertainties summed in quadrature. The results are compared with the predictions from STARlight [127,128] and from SuperChic [129].
4. Multi-Quarkonium Production
When single-quarkonium studies encounter challenges, investigation into multi-quarkonium production may shed new light on QCD and parton structure research. Compared to single-quarkonium research, the double quarkonium study provides a broader framework for theory–experiment comparison by providing additional measurable parameters like the separation in rapidity between the quarkonia , the invariant mass of two quarkonia , etc.
Additionally, research on multi-quarkonium production may provide valuable insights into multi-body dynamics. The multi-quarkonium candidates produced in collisions can originate not only from single parton scattering (SPS), but also from double parton scattering (DPS) or even triple parton scattering (TPS) if three quarkonia are involved. A crucial parameter in multi-body dynamics within particle physics is the effective cross-section (), which relates the composite process to its constituent subprocesses:
where is the DPS cross-section of production and () is the SPS cross-section of () production. Factor m is set to 1 for identical final-state particles and 2 for non-identical particles . The effective cross-section is assumed to be universal across different processes and energy scales [130]. The effective cross-section plays a crucial role in multi-parton scattering (MPI) description [131] and MC sample generation [132,133].
New physics opportunities also emerge in multi-quarkonium study. Tetraquark states with fully heavy constituents which have not yet been observed experimentally [134], such as , , are anticipated to be found in multi-quarkonium decay channels [135,136,137]. Such discoveries would provide novel insights into heavy flavor physics.
Several investigations into multi-quarkonium production during LHC Run-2 will be reviewed in this section, including cross-section measurement and the search for tetraquark states. In all studies discussed in this section, quarkonia are reconstructed via decay channel for its advantage of clearer signal and considerable branching ratio.
4.1. Cross-Section Measurement
4.1.1. Di-Quarkonium Production Cross-Section Measurement in Collisions
Several di-quarkonium production processes have been observed in collisions at during the LHC Run-2 period, encompassing both well-studied channels and previously unexplored ones. The production cross-section, which had been extensively measured before at lower energies [138,139,140], has now been remeasured by the LHCb [141] and ALICE collaborations [142]. Particular attention has also been given to the cross-section measurement of previously scarce channels, like measured by the CMS collaboration [18] and measured by the LHCb collaboration [143].
The strategies for variant studies followed similar approaches. Combinatorial background was considered the main background and was excluded through a 2D fit to the invariant mass distributions of opposite-sign (OS) muon pairs. The non-prompt background was also taken into account for production. A 2D fit to the lifetime (ℓ) distributions of OS muon pairs has been applied to the combinatorial background subtracted data (using method [144]) to determine the non-prompt fraction in the study of the LHCb collaboration as illustrated by Figure 39. However, the non-prompt fraction was only roughly estimated with the single-quarkonium measurement result in the study of the ALICE collaboration and study of the LHCb collaboration.
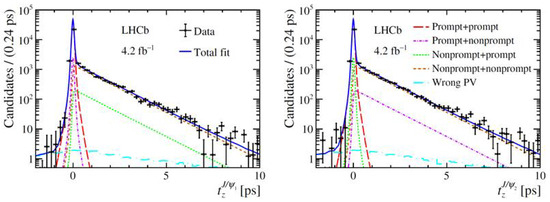
Figure 39.
Projection of fit on the lifetime of OS muon pair dimensions with the LHCb measurement. The black solid line represents the dataset, and the blue solid line represents the total fit [141].
The production cross-section was calculated after the signal yield was extracted from fits to the data:
where is the production cross-section of di-quarkonium , is the acceptance efficiency corrected signal yield, is the integrated luminosity, and is the branching ratio of the process. The total cross-sections of different channels and corresponding fiducial regions are summarized in Table 1. The differential cross-section was also measured in various kinematic intervals in a similar way (not available in the study of the ALICE collaboration).
SPS and DPS contributions can be separated through their distinct kinematic distributions, although different approaches were employed across various studies. For the study of the LHCb collaboration, the DPS contribution was extracted in the DPS dominant region () and then extrapolated to the full region using the DPS distribution acquired from a data-driven event-mixing DPS sample. The DPS contributions of other dimensions were obtained with the DPS weight acquired in the dimension. A similar strategy was adopted by the CMS collaboration in their study but utilizing MC samples instead of the data driven method. Both SPS and DPS distributions can be acquired from MC samples, and fits were applied in the full phase space. The DPS fraction was estimated separately from two dimensions as when using and when using as illustrated by Figure 40. The DPS contribution was estimated by subtracting the theoretically calculated SPS cross-section from the total cross-section in the study of the LHCb collaboration. Meanwhile, the ALICE collaboration assumed that the DPS process has 100% contribution in their study, given the limited statistics that prevented differential cross-section measurements in their study.
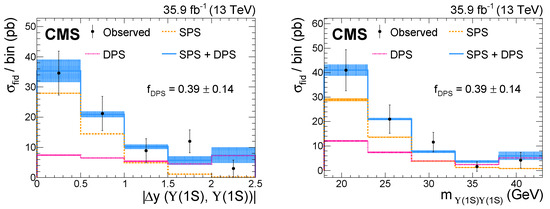
Figure 40.
Differential cross-section distribution of (left) and (right) dimensions (black dots) with the CMS measurement. SPS and DPS distributions are also represented by the orange and magenta dashed lines. Fits were applied on these two dimensions separately to extract the DPS contribution [18].
The effective cross-sections can be calculated from the DPS cross-section according to Equation (10), and the results are summarized in Table 1. Unfortunately, no suitable production cross-section measurement is currently available for the study of the CMS collaboration. A rough estimation can be obtained by extrapolating the measurement results of either the CMS collaboration [52] or LHCb collaboration [56,145] as or .

Table 1.
Summary of total production cross-section () and effective cross-section () measurement results of various di-quarkonium studies. y and (in ) represent rapidity and transverse momentum of quarkonium. The uncertainties are statistical followed by systematic. The third uncertainty of the total cross-section is from the branching ratio, and the third uncertainty of the effective cross-section is from the theory calculation. The di-quarkonium measurement results from the LHC at lower energy are also listed for reference. The estimation of using the result of LHCb at can be difficult [146].
| Collaboration | Channel() | Fiducial Region | [mb] | |
|---|---|---|---|---|
| LHCb (13 TeV) | [141] | , | ||
| [143] | , | |||
| [143] | ||||
| ALICE | [142] | |||
| (13 TeV) | ||||
| CMS | [18] | ∼3–4 | ||
| (13 TeV) | [52,56,145] | |||
| LHCb | [139] | , | - | |
| (7 TeV) | ||||
| CMS | [138] | , , , | ||
| (7 TeV) | [145] | |||
| ATLAS | [140] | , | ||
| (8 TeV) | , |
In the study by the LHCb collaboration, the kinematic distributions of the SPS process were obtained after the DPS contribution was subtracted. These data were then compared to predictions from the next-to-leading-order color-singlet (NLO* CS) model. Two representative examples are illustrated here in the dimension and dimension (separation in the azimuthal angle between two s) as shown in Figure 41. From the comparison, the estimated SPS cross-section distributions are generally consistent with the theory predictions, given the sizable theoretical uncertainties. However, a discrepancy in the trend is observed for some kinematic variables, such as .
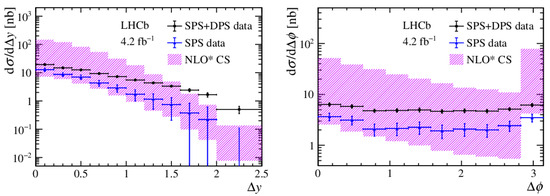
Figure 41.
Differential cross-section (black dots), SPS cross-section (blue dots) with the LHCb measurement, and NLO* CS prediction (purple bands) in (left) and (right) dimensions [141].
A comprehensive methodology has been established by the LHCb’s study of production, incorporating background subtraction, SPS/DPS separation, and cross-section calculation. This approach demonstrated significant improvements over previous measurements [138,139,140]. Although the general framework was similar to the measurement made by the ATLAS collaboration at [140], the LHCb study benefited from substantially greater statistics, enabling more differential cross-section measurements and smaller uncertainties. A general consistency with theory prediction in differential cross-section distribution can be noticed. However, two key limitations should not be ignored. First, all the production cross-section measurements at were restricted to the forward fiducial region. Complementary measurement in the central fiducial region is urgently needed since the differential cross-section distribution at the high region is expected to be particularly discriminating for testing QCD models [60]. Second, neither cross-section measurement accounts for potential contributions from resonant states. This is a significant omission because several resonances that decay into the final state and could therefore contribute considerably to the production cross-section have recently been discovered [14,15,17,147].
The substantial increase in statistics during the LHC Run-2 period has made precise measurements of production cross-sections for di-quarkonium states involving bottomonia feasible. Bottomonium production measurements are of particular importance for NRQCD study, as the b quark is much heavier than the c quark, and a system composed of b quarks adheres closely to the non-relativistic approximation. Another advantage of bottomonium production study is that non-prompt background is absent in this case. Breakthroughs include the LHCb’s observation of production in collisions, achieving a significance of 7.9 standard deviations, alongside the first measurement of production cross-section conducted by the CMS collaboration. Nevertheless, accumulating additional data remains imperative to enable more precise calculation, as well as the measurement of pair production of heavier states.
Another critical area requiring advancement lies in improving the precision of theoretical calculations. Theory calculations are of great significance for experiment measurements, particularly for SPS/DPS separation [18], theory–experiment comparison [141], effective cross-section calculation [143], etc. Currently, the limited accuracy of theoretical predictions represents a significant bottleneck across these applications, particularly notable in the studies discussed in this review.
4.1.2. Production Cross-Section Measurement in Collisions
Another investigation into production during the LHC Run-2 period was performed by the CMS collaboration, focusing on collisions [148] at a center-of-mass energy of with an integrated luminosity of 174.6. The measurement was conducted within the fiducial region defined by and .
Sixteen candidates were identified after event selection. All candidates exhibited vertices close to the primary vertex, implying their promptly produced origin. A 2D fit to the invariant mass of OS muon pairs was applied to exclude the combinatorial background as illustrated by Figure 42. In total, signal events were extracted from the fit, from which the total production cross-section was calculated to be
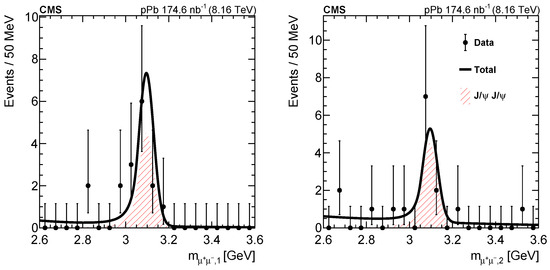
Figure 42.
Projection of fit on the invariant mass of OS muon pair dimensions with the CMS measurement. The black solid line represents the total fit, and the red area represents the signal yield [148].
Despite the quite limited statistics, DPS and SPS contributions were managed to be separated. Event distribution on the dimension was investigated, and the DPS contribution was extracted with a fit procedure, where the DPS fit template was acquired using a data-driven method (similar to the measurement of the LHCb collaboration [141]). The fit is presented in Figure 43. The effective cross-section for collisions was calculated according to Equation (10) as
where was estimated through a theory calculation. The effective cross-section for collisions is available with a relationship:
where is the mass number and factor [148]. was estimated to be
and this estimation could be translated into a lower limit with 95% confidence level as
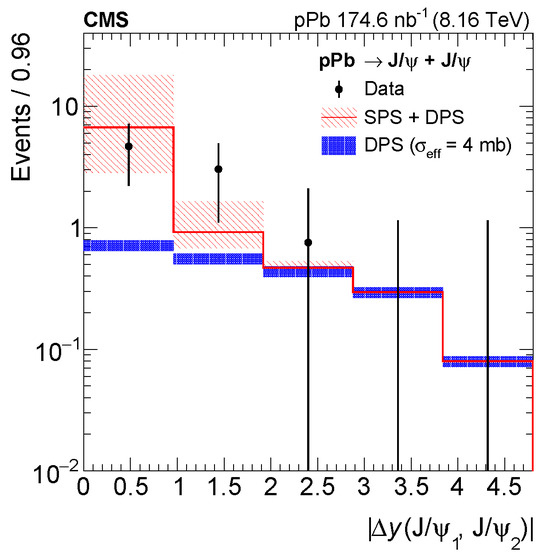
Figure 43.
Event distribution of (black dots), fitted DPS distribution (blue bands) and fitted total distribution (red bands) with the CMS measurement [148].
The significance of the signal reaches 5.3 standard deviations, representing the first observation of the candidate in collisions. Increased statistics are expected to significantly improve both the signal extraction and effective cross-section calculation. A comparison between this study and a measurement at a similar collision energy (which is absent for now) may provide valuable information about nuclear structure and quarkonium production.
4.2. Tetraquark States Search
Investigation into potential tetraquark states decaying to multi-quarkonium final states during the LHC Run-2 and Run-3 periods focused on the channel (). The LHCb [14], CMS [15,147,149], and ATLAS [17] collaborations successively pursued this investigation using the similar strategy. The ATLAS and CMS collaborations also extended their searches to include the channel [16,17] for possible resonances.
All collaborations employed a similar strategy: identifying and candidates and examining their invariant mass distributions. Clear excesses were observed by all three experiments, though features varied due to differences in detector resolution, trigger, and integrated luminosity. In the channel, both LHCb and ATLAS observed the resonance alongside a threshold enhancement (Figure 44 for LHCb; Figure 45, left, for ATLAS). CMS, however, reported a more complex structure featuring a threshold enhancement and three distinct resonances, , , and , as shown in Figure 46). For the channel, ATLAS and CMS both detected two excesses (Figure 45, right, for ATLAS; Figure 47 for CMS), with CMS establishing at the discovery level.
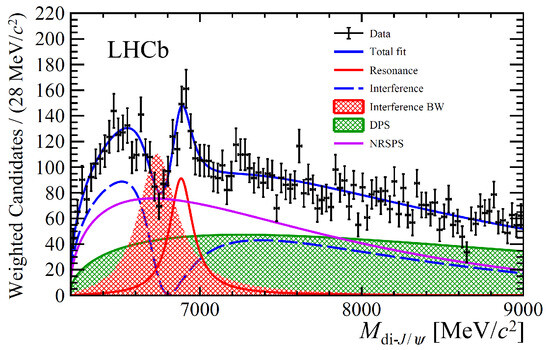
Figure 44.
Event distribution of of the LHCb collaboration and fit with interference [14].
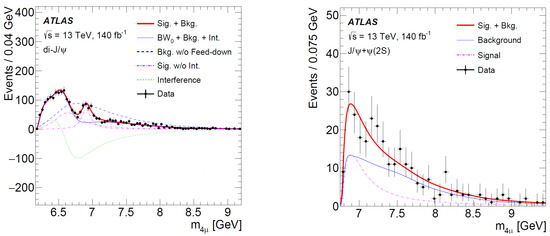
Figure 45.
Event distribution of (left) and fit with interference (between the first resonance and SPS) and (right) and fit with one resonance assumption of the ATLAS collaboration [17].
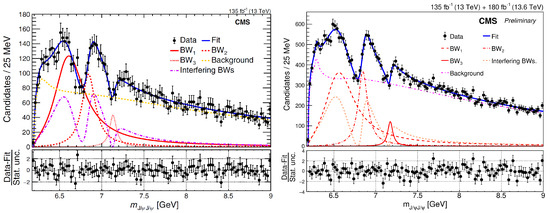
Figure 46.
Event distribution of of the CMS collaboration and fit with interference. Left: CMS Run-2 data [147]; Right: CMS Run-2 and Run-3 data [15].
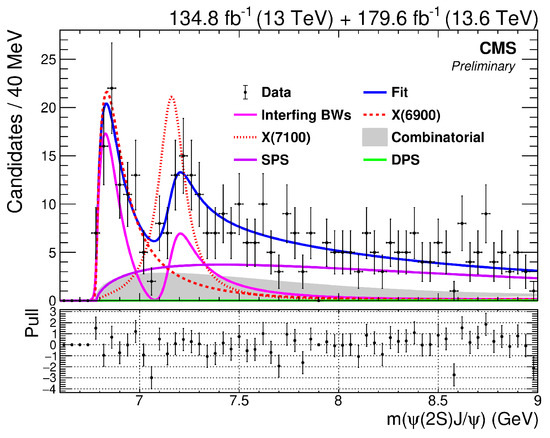
Figure 47.
Event distribution of of the CMS collaboration and fit with interference [16].
The mass and width of the resonances were determined through fits to the dimension. SPS, DPS, combinatorial backgrounds, and feed-down from heavier charmonium states were considered the principal backgrounds, and interference was considered by all three collaborations. Discrepancies in interference strategy can be noticed among different collaborations. The LHCb collaboration incorporated interference between the threshold enhancement and SPS, while the CMS collaboration assumed the interference happened among three candidate resonances. The ATLAS collaboration has explored multiple interference scenarios. For the channel, interference among the threshold and two resonances as well as between the first resonance and SPS was attempted, while no interference was considered for the channel.
Three collaborations reported results using different fitting strategies. Table 2 summarizes the masses, widths, and significances of the , , and resonances from these studies. The consistency in the reported properties across all collaborations provides robust evidence for these potential resonances.
Table 2.
Summary of the masses, widths, and significances for s reported by the LHCb [14], CMS [15,16] and ATLAS collaborations [17]. The uncertainties are statistical followed by systematic.
These observed resonances in the decay channels represent the first experimental discovery of a family of all-charm tetraquarks [150,151,152,153,154]. Increased statistics will be essential to improve the description of the data and the characterization of these states [155,156].
Additionally, the measurement of the quantum numbers of these newly discovered all-charm tetraquarks is particularly crucial to testify the current interference assumptions and help constrain theoretical models of the tetraquark structure. The quantum numbers measured by the CMS Collaboration confirm positive parity () and positive charge conjugation () for these states. The spin J is determined to be , while values of and are excluded at the 95% and 99% confidence levels, respectively, as shown in Figure 48. This assignment implies the possible internal configurations of these tetraquarks and favors the tightly bound scenario [149].
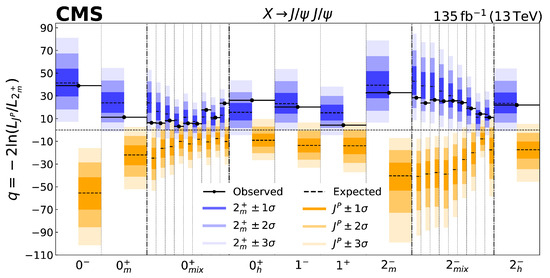
Figure 48.
Statistical tests of various hypotheses against the model from the CMS experiment [149].
4.3. Triple Candidate Search
Another experimental effort focused on searching for triple produced candidates in collisions at . This final state offers a unique opportunity to observe the TPS process. This research is also of particular value for the measurement of the effective cross-section since the SPS contribution to this final state is expected to be highly suppressed [157,158,159,160], allowing the DPS contribution to be more clearly isolated.
The first search for the triple production was conducted by the CMS collaboration utilizing a dataset of 133 at a center-of-mass energy of 13 TeV [161]. Six triple candidates were found after event selection. A 3D fit was performed to the invariant mass of OS muon pairs to extract the signal yield from the combinatorial background as illustrated by Figure 49.
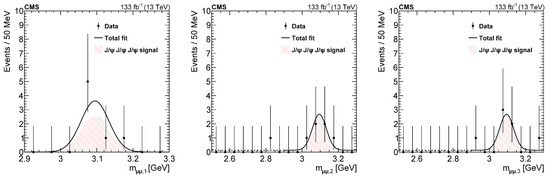
Figure 49.
Projection of fit on the mass of OS muon pair dimensions with the CMS triple measurement. The black solid line represents the total fit, and the red area represents the signal yield [161].
The total production cross-section was calculated to be
The cross-section included the non-prompt production since the non-prompt component was not excluded in this study. The sparation of SPS, DPS and TPS processes was conducted through a theory study. The production cross-section of SPS () was theoretically estimated, and the contributions from the DPS and TPS were computed as
where () represents promptly (non-promptly) SPS produced , is the DPS effective cross-section, and [160] is the TPS effective cross-section. By summing , and , the total production cross-section can be expressed as a function of , and the effective cross-section is determined to be
where the first uncertainty originated from the uncertainty in the production cross-section measurement, and the second one represented the uncertainty of theoretical calculation. The effective cross-section measurement results summarized in this review alongside previous studies [148] can be found in Figure 50. Despite the assumption that the process and energy scale universality for the effective cross-section, experimental evidence has demonstrated a strong dependence on the nature of the final state in previous studies. Quarkonium final state measurements systematically yielded values around (blue dots in Figure 50), contrasting sharply with the approximately values characteristic of jets and electroweak bosons final state measurements (black dots in Figure 50).
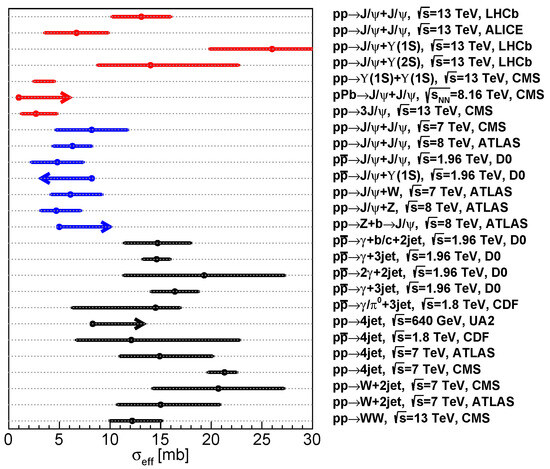
Figure 50.
Effective cross-section measurement results of this review (red) and previous studies [145,148] (blue and black).
Nevertheless, quarkonium studies during the LHC Run-2 period (red dots in Figure 50) apparently presented a trend to resolve this longstanding discrepancy. The studies of of the ALICE collaboration, , , and 3 of the CMS collaboration had a customarily small value. In contrast, studies about and of the LHCb collaboration reported relatively large values, approaching those results extracted from jets and electroweak bosons. However, these higher LHCb measurements require careful evaluation given their significant tension with established results. For example, the effective cross-section extracted from process by previous studies concentrated around (CMS at [146] and ATLAS at [140]). It cannot be explained by the energy difference since ALICE’s study at also maintains a relatively small value. And obvious difference can also be noticed by comparing the channel between the LHCb’s study at and the D0’s study at [162]. These systematic variations underscore the critical need for both the enhancement of experimental precision and deeper theoretical understanding of effective cross-section dynamics.
The CMS collaboration’s pioneering search for triple production represented the first observation of this process in collisions, with a significance of 5.8 standard deviations. A new prospect for TPS dynamics study has been presented, and an excellent precision of the effective cross-section measurement has been provided due to the strongly suppressed SPS process characteristic of this final state. Nevertheless, the measurement precision is expected to improve substantially with future data accumulation.
5. Summary and Prospects
Extensive measurements of charmonium and bottomonium production in proton–proton collisions at center-of-mass energies from 7 TeV to 13.6 TeV have provided precise differential cross-sections and polarization parameters. These results reveal limited polarization effects, challenging leading-order NRQCD predictions and motivating higher-order calculations and refined long-distance matrix elements. The LHC Run-3 and the future HL-LHC upgrades will allow not only tighter constraints on conventional quarkonium but also a detailed study of top-quark pair quasi-bound states. Building on the initial observations of near threshold by CMS and ATLAS [3,4], Run-3 will employ higher-precision differential angular analyses to extract the spin–parity and production dynamics of toponium resonance. Theoretical efforts in threshold resummation, potential non-relativistic QCD, and lattice inputs will also be critical to predict level splittings, decay widths and Yukawa-coupling modifications. Achieving percent-level precision on the toponium mass, width, and production cross-section will test QCD in the extreme non-perturbative regime, constrain the top-quark Yukawa interaction, and probe for deviations signaling new physics at the highest mass scales.
In and collisions, the sequential suppression of states and constraints on cold nuclear-matter effects have been established, offering insights into coor screening and medium properties in heavy-ion environments. In LHC Run-3, oxygen–oxygen () and neon–neon () collisions data will enable detailed studies of quarkonium suppression across intermediate system sizes.
With unprecedented luminosity and significant advances in analysis techniques, investigations into multi-quarkonium final states have been massively conducted during the LHC Run-2 period. Some production cross-sections that have not been measured before are measured, like study of the LHCb collaboration [143] and study of the CMS collaboration [18]; some resonances that have not been found before are found, like study of the LHCb [14], CMS [15,16,147,149] and ATLAS [17] collaborations; some processes that have not been observed before are observed, like study [148] and triple study [161] of the CMS collaboration; even some production cross-sections that have been measured before are remeasured with more advanced methodology, like study of the LHCb collaboration [141].
While these studies have significantly advanced our understanding, they have also revealed numerous outstanding questions, such as the properties of states, the discrepancy in the effective cross-section measurement results and the associated production of heavier states of . Considerable opportunities remain for further progress for both experiment and theory. For example, increased statistics are necessary to enable more accurate studies of rare processes, such as triple , , , and productions; a more careful treatment is also crucial for improving measurement precision, for instance, contributions from the resonances should be considered in future production cross-section measurement. Theoretical improvements, especially in calculation precision, are equally crucial, particularly for MC production, SPS/DPS process separation, cross-section estimation, and theory–experiment comparison. The anticipated luminosity upgrade during the HL-LHC period promises to deliver the statistical precision needed for transformative advances in multi-quarkonium studies.
The study of quarkonium production in , , and PbPb collisions at the LHC has entered an era of NRQCD physics, where both conventional spectroscopic measurements and searches for exotic states provide stringent tests of NRQCD in various conditions. The interplay between experimental advancements and theoretical developments continues to deepen our understanding of strong interactions. As the community enter the Run-3 and future HL-LHC era, the field stands poised to address fundamental questions about hadron formation, quark–gluon plasma properties, and the potential emergence of new physics through precision studies of quarkonium systems. These developments will not only illuminate NRQCD study but may also reveal unexpected connections to other frontiers of physics.
Author Contributions
Conceptualization, Z.H.; methodology, Z.H.; investigation, J.L., Y.Z. and Z.H.; writing—original draft preparation, J.L. and Y.Z.; writing—review and editing, J.L., Y.Z., X.C., C.W. and Z.H. All authors have read and agreed to the published version of the manuscript.
Funding
This work is partially supported by Tsinghua University Initiative Scientific Research Program, Natural Science Foundation of China under Grants No. 11975011, No. 12061141002, Ministry of Science and Technology of China under Grant No. 2024YFA1610501. Y. Z. is supported by the Beijing Natural Science Foundation under Grant No. QY24227. X. C. and C. W. are supported by the Beijing Natural Science Foundation under Grant No. QY25010.
Data Availability Statement
The data will be available on request.
Conflicts of Interest
The authors declare no conflicts of interest.
References
- Bodwin, G.T.; Braaten, E.; Lepage, G.P. Rigorous QCD analysis of inclusive annihilation and production of heavy quarkonium. Phys. Rev. D 1995, 51, 1125–1171, Erratum in Phys. Rev. D 1997, 55, 5853. [Google Scholar] [CrossRef]
- Bernreuther, W. Top quark physics at the LHC. J. Phys. G 2008, 35, 083001. [Google Scholar] [CrossRef]
- CMS Collaboration. Observation of a pseudoscalar excess at the top quark pair production threshold. arXiv 2025, arXiv:2503.22382. [Google Scholar] [CrossRef]
- ATLAS Collaboration. Observation of a Cross-Section Enhancement near the Production Threshold in = 13 TeV pp Collisions with the ATLAS Detector; CERN: Geneva, Switzerland, 2025. [Google Scholar]
- Cho, P.L.; Wise, M.B. Spin symmetry predictions for heavy quarkonia alignment. Phys. Lett. B 1995, 346, 129–133. [Google Scholar] [CrossRef]
- Petrelli, A.; Cacciari, M.; Greco, M.; Maltoni, F.; Mangano, M.L. NLO production and decay of quarkonium. Nucl. Phys. B 1998, 514, 245–309. [Google Scholar] [CrossRef]
- Fritzsch, H. Producing heavy quark flavors in hadronic collisions: A test of quantum chromodynamics. Phys. Lett. B 1977, 67, 217–221. [Google Scholar] [CrossRef]
- Amundson, J.F.; Eboli, O.J.P.; Gregores, E.M.; Halzen, F. Quantitative tests of color evaporation: Charmonium production. Phys. Rev. D 1996, 53, 2686–2693. [Google Scholar] [CrossRef]
- Matsui, T.; Satz, H. J/ψ suppression by quark-gluon plasma formation. Phys. Lett. B 1986, 178, 416–422. [Google Scholar] [CrossRef]
- Brambilla, N.; Eidelman, S.; Heltsley, B.K.; Vogt, R.; Bodwin, G.T.; Eichten, E.; Frawley, A.D.; Meyer, A.B.; Mitchell, R.E.; Papadimitriou, V. Heavy quarkonium: Progress, puzzles, and opportunities. Eur. Phys. J. C 2011, 71, 1534. [Google Scholar] [CrossRef]
- BABAR Collaboration. Test of lepton universality in Υ(1S) decays at BABAR. Phys. Rev. Lett. 2010, 104, 191801. [Google Scholar] [CrossRef]
- Essig, R.; Jaros, J.A.; Wester, W.; Hansson Adrian, P.; Andreas, S.; Averett, T.; Baker, O.; Batell, B.; Battaglieri, M.; Beacham, J. Dark Sectors and New, Light, Weakly-Coupled Particles. arXiv 2013, arXiv:1311.0029. [Google Scholar] [CrossRef]
- BABAR Collaboration. A Search for Invisible Decays of the Υ(1S). Phys. Rev. Lett. 2009, 103, 251801. [Google Scholar] [CrossRef]
- LHCb Collaboration. Observation of structure in the J/ψ -pair mass spectrum. Sci. Bull. 2020, 65, 1983–1993. [Google Scholar] [CrossRef]
- CMS Collaboration. Observation of a family of all-charm tetraquark candidates at the LHC. Sci. Adv. 2025, submitted. [Google Scholar]
- CMS Collaboration. Observation of X(6900) and evidence of X(7100) in the psi(2S)Jpsi to 4mu mass spectrum in pp collisions at CMS. Sci. Adv. 2025; submitted. [Google Scholar]
- ATLAS Collaboration. Observation of an Excess of Dicharmonium Events in the Four-Muon Final State with the ATLAS Detector. Phys. Rev. Lett. 2023, 131, 151902. [Google Scholar] [CrossRef]
- CMS Collaboration. Measurement of the Υ(1S) pair production cross section and search for resonances decaying to Υ(1S)μ+μ− in proton-proton collisions at = 13 TeV. Phys. Lett. B 2020, 808, 135578. [Google Scholar] [CrossRef]
- Aubert, J.J.; Becker, U.; Biggs, P.J.; Burger, J.; Chen, M.; Everhart, G.; Goldhagen, P.; Leong, J.; McCorriston, T.; Rhoades, T.G.; et al. Experimental Observation of a Heavy Particle J. Phys. Rev. Lett. 1974, 33, 1404–1406. [Google Scholar] [CrossRef]
- Augustin, J.E.; Boyarski, A.M.; Breidenbach, M.; Bulos, F.; Dakin, J.T.; Feldman, G.J.; Fischer, G.E.; Fryberger, D.; Hanson, G.; Jean-Marie, B.; et al. Discovery of a Narrow Resonance in e+e− Annihilation. Phys. Rev. Lett. 1974, 33, 1406–1408. [Google Scholar] [CrossRef]
- Feldman, G.J.; Jean-Marie, B.; Sadoulet, B.; Vannucci, F.; Abrams, G.S.; Boyarski, A.M.; Breidenbach, M.; Bulos, F.; Chinowsky, W.; Friedberg, C.E.; et al. ψ(3684) Radiative decays to high-mass states. Phys. Rev. Lett. 1975, 35, 821–824. [Google Scholar] [CrossRef]
- Biddick, C.J.; Burnett, T.H.; Masek, G.E.; Miller, E.S.; Smith, J.G.; Stronski, J.P.; Sullivan, M.K.; Vernon, W.; Badtke, D.H.; Barnett, B.A. Inclusive gamma-Ray Spectra from psi (3095) and psi-prime (3684). Phys. Rev. Lett. 1977, 38, 1324. [Google Scholar] [CrossRef]
- Tanenbaum, W.M.; Whitaker, J.S.; Abrams, G.S.; Boyarski, A.M.; Breidenbach, M.; Chinowsky, W.; DeVoe, R.G.; Feldman, G.J.; Fryberger, D.; Goldhaber, G. Observation of an Intermediate State in psi-prime (3684) Radiative Cascade Decay. Phys. Rev. Lett. 1975, 35, 1323. [Google Scholar] [CrossRef]
- Whitaker, J.S.; Tanenbaum, W.M.; Abrams, G.S.; Alam, M.S.; Boyarski, A.M.; Breidenbach, M.; Chinowsky, W.; DeVoe, R.G.; Feldman, G.J.; Friedberg, C.E. Radiative Decays of psi (3095) and psi-prime (3684). Phys. Rev. Lett. 1976, 37, 1596. [Google Scholar] [CrossRef]
- Eichten, E.; Gottfried, K.; Kinoshita, T.; Lane, K.D.; Yan, T.M. Charmonium: Comparison with experiment. Phys. Rev. D 1978, 17, 3090–3117. [Google Scholar] [CrossRef]
- Rapidis, P.A.; Gobbi, B.; Lüke, D.; Barbaro-Galtieri, A.; Dorfan, J.M.; Ely, R.; Feldman, G.J.; Feller, J.M.; Fong, A.; Hanson, G.; et al. Observation of a Resonance in e+ e- Annihilation Just Above Charm Threshold. Phys. Rev. Lett. 1977, 39, 526, Erratum in Phys. Rev. Lett. 1997, 39, 974. [Google Scholar] [CrossRef]
- DASP Collaboration. Total Cross-section for Hadron Production by e+e− Annihilation at Center-of-mass Energies Between 3.6-GeV and 5.2-GeV. Phys. Lett. B 1978, 76, 361. [Google Scholar] [CrossRef]
- Siegrist, J.; Abrams, G.S.; Boyarski, A.M.; Breidenbach, M.; Bulos, F.; Chinowsky, W.; Feldman, G.J.; Friedberg, C.E.; Fryberger, D.; Goldhaber, G.; et al. Observation of a Resonance at 4.4-GeV and Additional Structure Near 4.1-GeV in e+ e- Annihilation. Phys. Rev. Lett. 1976, 36, 700. [Google Scholar] [CrossRef]
- Navas, S.; Amsler, C.; Gutsche, T.; Hanhart, C.; Hernández-Rey, J.J.; Lourenço, C.; Masoni, A.; Mikhasenko, M.; Mitchell, R.E.; Patrignani, C. Review of Particle Physics. Prog. Theor. Exp. Phys. 2024, 2024, 083C01. [Google Scholar] [CrossRef]
- Herb, S.W.; Hom, D.C.; Lederman, L.M.; Sens, J.; Snyder, H. Observation of a Dimuon Resonance at 9.5 GeV in 400-GeV Proton–Nucleus Collisions. Phys. Rev. Lett. 1977, 39, 252–255. [Google Scholar] [CrossRef]
- Andrews, D.; Berkelman, K.; Billing, M.; Cabenda, R.; Cassel, D.G.; DeWire, J.W.; Ehrlich, R.; Ferguson, T.; Gentile, T.; Gibbard, B.G. Observation of Three Upsilon States. Phys. Rev. Lett. 1980, 44, 1108–1111. [Google Scholar] [CrossRef]
- Haas, A.L.; Kirby, H.; Wiedemann, C.; Weissenberg, P.; Brandelik, R.; Schubert, K.; Söhngen, G.; Unterdorfer, G.; Wegener, D.; Wenzel, K.D. Observation of Radiative Decays of the Υ(2S). Phys. Rev. Lett. 1984, 52, 799–802. [Google Scholar] [CrossRef]
- CUSB Collaboration. Observation of a Fourth Upsilon State in e+e− Annihilations. Phys. Rev. Lett. 1980, 45, 219–222. [Google Scholar] [CrossRef]
- Besson, D.; Green, J.; Namjoshi, R.; Sannes, F.; Skubic, P.; Snyder, A.; Stone, R.; Chen, A.; Goldberg, M.; Horwitz, N.; et al. Observation of New Structure in the e+e− Cross Section Above the Υ(4S). Phys. Rev. Lett. 1985, 54, 381–385. [Google Scholar] [CrossRef]
- Bevan, A.J.; Golob, B.; Mannel, T.; Prell, S.; Yabsley, B.D.; Aihara, H.; Anulli, A.; Browder, T.E.; Camilleri, L.; Charpentier, P.; et al. The Physics of the B Factories. Eur. Phys. J. C 2014, 74, 3026. [Google Scholar] [CrossRef]
- CMS Collaboration. The CMS experiment at the CERN LHC. J. Instrum. 2008, 3, S08004. [Google Scholar] [CrossRef]
- ATLAS Collaboration. The ATLAS Experiment at the CERN Large Hadron Collider. J. Instrum. 2008, 3, S08003. [Google Scholar] [CrossRef]
- LHCb Collaboration. The LHCb Detector at the LHC. J. Instrum. 2008, 3, S08005. [Google Scholar] [CrossRef]
- ALICE Collaboration. The ALICE experiment at the CERN LHC. J. Instrum. 2008, 3, S08002. [Google Scholar] [CrossRef]
- CMS Collaboration. Dimuon Spectrum 2016; Technical Report; CERN: Geneva, Switzerland, 2016. [Google Scholar]
- Reznicek, P. ATLAS Measurements of CP-Violation and Rare Decays Processes with Beauty Mesons; Technical Report; Charles University: Prague, Czech Republic, 2021. [Google Scholar]
- LHCb Collaboration. Search for Dark Photons Produced in 13 TeV pp Collisions. Phys. Rev. Lett. 2018, 120, 061801–061812. [Google Scholar] [CrossRef]
- ALICE Collaboration. Proceedings of Direct photon measurement in small systems and thermal radiation from QGP with ALICE, Hard Probes conference 2024. arXiv 2025, arXiv:2505.03669. [Google Scholar] [CrossRef]
- CMS Collaboration. Precision luminosity measurement in proton–proton collisions at = 13 TeV in 2015 and 2016 at CMS. Eur. Phys. J. C 2021, 81, 800. [Google Scholar] [CrossRef]
- CMS Collaboration. Luminosity Measurement in Proton–Proton Collisions at =13.6 TeV in 2022 at CMS; Technical Report CMS-PAS-LUM-22-001, CMS Physics Analysis Summary; CERN: Geneva, Switzerland, 2024. [Google Scholar]
- CDF Collaboration. Υ Production and Polarization in Collisions at = 1.8 TeV. Phys. Rev. Lett. 2002, 88, 161802. [Google Scholar] [CrossRef]
- CDF Collaboration. Polarization of J/ψ and ψ(2S) mesons produced in collisions at = 1.96 TeV. Phys. Rev. Lett. 2007, 99, 132001. [Google Scholar] [CrossRef] [PubMed]
- CDF Collaboration. Production of Υ(1S) Mesons from χb Decays in Collisions at == 1.8 TeV. Phys. Rev. Lett. 2000, 84, 2094–2099. [Google Scholar] [CrossRef] [PubMed]
- CMS Collaboration. Prompt and non-prompt J/ψ production in pp collisions at = 7 TeV. Eur. Phys. J. C 2011, 71, 1575. [Google Scholar] [CrossRef]
- ATLAS Collaboration. Measurement of the differential cross-sections of prompt and non-prompt production of J/ψ and ψ(2S) in pp collisions at = 7 TeV with the ATLAS detector. Nucl. Phys. B 2011, 850, 387–444. [Google Scholar] [CrossRef]
- LHCb Collaboration. Measurement of J/ψ production in pp collisions at = 7 TeV. Eur. Phys. J. C 2011, 71, 1645. [Google Scholar] [CrossRef]
- CMS Collaboration. Measurement of quarkonium production cross sections in pp collisions at = 13 TeV. Phys. Lett. B 2018, 780, 251–272. [Google Scholar] [CrossRef]
- ATLAS Collaboration. Measurement of the production cross-section of J/ψ and ψ(2S) mesons in pp collisions at = 13 TeV with the ATLAS detector. Eur. Phys. J. C 2024, 84, 169. [Google Scholar] [CrossRef]
- LHCb Collaboration. Measurement of forward J/ψ production cross-section in pp collisions at = 13 TeV. J. High Energy Phys. 2015, 10, 172. [Google Scholar] [CrossRef]
- ALICE Collaboration. Multiplicity dependence of inclusive J/ψ production at midrapidity in pp collisions at = 13 TeV. Phys. Lett. B 2020, 810, 135758. [Google Scholar] [CrossRef]
- LHCb Collaboration. Central exclusive production of J/ψ and ψ(2S) mesons in pp collisions at = 13 TeV. J. High Energy Phys. 2018, 10, 167. [Google Scholar] [CrossRef]
- ALICE Collaboration. Quarkonia as probes of initial and final states in small systems with ALICE. EPJ Web Conf. 2024, 274, 09007. [Google Scholar] [CrossRef]
- Butenschön, M.; Kniehl, B.A. Reconciling J/ψ Production at HERA, RHIC, Tevatron, and LHC with Nonrelativistic QCD Factorization at Next-to-Leading Order. Phys. Rev. Lett. 2011, 106, 022003. [Google Scholar] [CrossRef]
- Cheung, V.; Vogt, R. Production and polarization of prompt J/ψ in the improved color evaporation model using the kT-factorization approach. Phys. Rev. D 2018, 98, 114029. [Google Scholar] [CrossRef]
- Hu, Z.; Leonardo, N.T.; Liu, T.; Haytmyradov, M. Review of bottomonium measurements from CMS. Int. J. Mod. Phys. A 2017, 32, 1730015. [Google Scholar] [CrossRef]
- ALICE Collaboration. Inclusive quarkonium production in pp collisions at = 5.02 TeV. Eur. Phys. J. C 2023, 83, 61. [Google Scholar] [CrossRef]
- LHCb Collaboration. Measurement of the multiplicity dependence of Υ production ratios in pp collisions at = 13 TeV. J. High Energy Phys. 2025, 05, 011. [Google Scholar] [CrossRef]
- Cheung, V.; Vogt, R. Production and polarization of prompt Υ(nS) in the improved color evaporation model using the kT-factorization approach. Phys. Rev. D 2019, 99, 034007. [Google Scholar] [CrossRef]
- Cacciari, M.; Greco, M.; Nason, P. The pT spectrum in heavy-flavour hadroproduction. J. High Energy Phys. 1998, 9805, 007. [Google Scholar] [CrossRef]
- Fuks, B.; Hagiwara, K.; Ma, K.; Zheng, Y.J. Signatures of toponium formation in LHC run 2 data. Phys. Rev. D 2021, 104, 034023. [Google Scholar] [CrossRef]
- CMS Collaboration. Differential cross section measurements for the production of top quark pairs and of additional jets using dilepton events from pp collisions at = 13 TeV. J. High Energy Phys. 2025, 02, 064. [Google Scholar] [CrossRef]
- ATLAS Collaboration. Measurement of the production cross-section and lepton differential distributions in eμ dilepton events from pp collisions at = 13 TeV with the ATLAS detector. Eur. Phys. J. C 2020, 80, 528. [Google Scholar] [CrossRef]
- ATLAS Collaboration. Inclusive and differential cross-sections for dilepton production measured in = 13 TeV pp collisions with the ATLAS detector. J. High Energy Phys. 2023, 07, 141. [Google Scholar] [CrossRef]
- Fadin, V.S.; Khoze, V.A.; Sjostrand, T. On the Threshold Behavior of Heavy Top Production. Z. Phys. C 1990, 48, 613–622. [Google Scholar] [CrossRef]
- Kiyo, Y.; Kuhn, J.H.; Moch, S.; Steinhauser, M.; Uwer, P. Top-quark pair production near threshold at LHC. Eur. Phys. J. C 2009, 60, 375–386. [Google Scholar] [CrossRef]
- CMS Collaboration. Measurement of the top quark Yukawa coupling from kinematic distributions in the dilepton final state in proton-proton collisions at = 13 TeV. Phys. Rev. D 2020, 102, 092013. [Google Scholar] [CrossRef]
- Afik, Y.; de Nova, J.R.M. Entanglement and quantum tomography with top quarks at the LHC. Eur. Phys. J. Plus 2021, 136, 907. [Google Scholar] [CrossRef]
- ATLAS Collaboration. Observation of quantum entanglement with top quarks at the ATLAS detector. Nature 2024, 633, 542–547. [Google Scholar] [CrossRef] [PubMed]
- CMS Collaboration. Observation of quantum entanglement in top quark pair production in proton–proton collisions at = 13 TeV. Rept. Prog. Phys. 2024, 87, 117801. [Google Scholar] [CrossRef]
- D0 Collaboration. Observation of the top quark. Phys. Rev. Lett. 1995, 74, 2632–2637. [Google Scholar] [CrossRef]
- CMS Collaboration. Measurement of the prompt J/ψ and ψ(2S) polarizations in pp collisions at = 7 TeV. Phys. Lett. B 2013, 727, 381–402. [Google Scholar] [CrossRef]
- CMS Collaboration. Measurement of the Υ(1S), Υ(2S), and Υ(3S) polarizations in pp collisions at = 7 TeV. Phys. Rev. Lett. 2013, 110, 081802. [Google Scholar] [CrossRef]
- LHCb Collaboration. Measurement of J/ψ polarization in pp collisions at = 7 TeV. Eur. Phys. J. C 2013, 73, 2631. [Google Scholar] [CrossRef]
- LHCb Collaboration. Measurement of ψ(2S) polarisation in pp collisions at = 7 TeV. Eur. Phys. J. C 2014, 74, 2872. [Google Scholar] [CrossRef]
- ALICE Collaboration. J/ψ polarization in pp collisions at = 7 TeV. Phys. Rev. Lett. 2012, 108, 082001. [Google Scholar] [CrossRef]
- Brambilla, N.; Pineda, A.; Soto, J.; Vairo, A. Effective Field Theories for Heavy Quarkonium. Rev. Mod. Phys. 2005, 77, 1423–1496. [Google Scholar] [CrossRef]
- Faccioli, P.; Lourenço, C.; Seixas, J.; Wohri, H.K. Towards the Experimental Clarification of Quarkonium Polarization. Eur. Phys. J. C 2010, 69, 657–673. [Google Scholar] [CrossRef]
- Braaten, E. Quarkonium Polarization in the NRQCD Factorization Framework. Int. J. Mod. Phys. A 1997, 12, 3941–3950. [Google Scholar] [CrossRef]
- Butenschoen, M.; Kniehl, B.A. Next-to-leading-order tests of nonrelativistic-QCD factorization with J/ψ yield and polarization. Mod. Phys. Lett. A 2013, 28, 1350027. [Google Scholar] [CrossRef]
- CMS Collaboration. Measurement of the polarizations of prompt and non-prompt J/ψ and ψ(2S) mesons produced in pp collisions at = 13 TeV. Phys. Lett. B 2024, 858, 139044. [Google Scholar] [CrossRef]
- Faccioli, P.; Lourenço, C. On the polarization of the non-prompt contribution to inclusive J/ψ production in pp collisions. J. High Energy Phys. 2022, 10, 005. [Google Scholar] [CrossRef]
- Krey, V.; Balaji, K.R.S. Polarized J/ψ production from B mesons at the Fermilab Tevatron. Phys. Rev. D 2003, 67, 054011. [Google Scholar] [CrossRef]
- ALICE Collaboration. Measurement of quarkonium polarization in Pb–Pb collisions at the LHC with ALICE. In Proceedings of the Hard Probes 2020, Austin, TX, USA, 1–6 June 2020. [Google Scholar]
- PHENIX Collaboration. J/ψ Production vs Centrality, Transverse Momentum, and Rapidity in Au+Au Collisions at = 200 GeV. Phys. Rev. Lett. 2007, 98, 232301. [Google Scholar] [CrossRef]
- CMS Collaboration. Observation of Sequential Upsilon Suppression in PbPb Collisions. Phys. Rev. Lett. 2012, 109, 222301. [Google Scholar] [CrossRef]
- CMS Collaboration. Suppression of Upsilon(1S), Upsilon(2S), and Upsilon(3S) quarkonium states in PbPb collisions at = 2.76 TeV. Phys. Lett. B 2017, 770, 357–379. [Google Scholar] [CrossRef]
- ATLAS Collaboration. Production of Υ(nS) mesons in Pb+Pb and pp collisions at = 5.02 TeV. Phys. Rev. C 2023, 107, 054912. [Google Scholar] [CrossRef]
- ALICE Collaboration. Υ production and nuclear modification at forward rapidity in Pb–Pb collisions at = 5.02 TeV. J. High Energy Phys. 2021, 11, 194. [Google Scholar] [CrossRef]
- Du, X.; He, M.; Rapp, R. Color Screening and Regeneration of Bottomonia in High-Energy Heavy-Ion Collisions. Phys. Rev. C 2017, 96, 054901. [Google Scholar] [CrossRef]
- Brambilla, N.; Escobedo, M.A.; Strickland, M.; Vairo, A.; Vander Griend, P.; Weber, J.H. Bottomonium production in heavy-ion collisions using quantum trajectories: Differential observables and momentum anisotropy. Phys. Rev. D 2021, 104, 094049. [Google Scholar] [CrossRef]
- Andronic, A.; Braun-Munzinger, P.; Redlich, K.; Stachel, J. Decoding the phase structure of QCD via particle production at high energy. Nature 2018, 561, 321–330. [Google Scholar] [CrossRef]
- Krouppa, B.; Strickland, M. Predictions for bottomonia suppression in 5.023 TeV Pb–Pb collisions. Universe 2016, 2, 16. [Google Scholar] [CrossRef]
- Vogt, R. Cold Nuclear Matter Effects on J/ψ and Υ Production at the LHC. Phys. Rev. C 2010, 81, 044903. [Google Scholar] [CrossRef]
- Arleo, F.; Peigné, S. J/ψ suppression in p–A collisions from parton energy loss in cold QCD matter. Phys. Rev. Lett. 2012, 109, 122301. [Google Scholar] [CrossRef]
- Ferreiro, E.G.; Lansberg, J.P. Is bottomonium suppression in proton-nucleus and nucleus-nucleus collisions at LHC energies due to the same effects? J. High Energy Phys. 2018, 10, 094. [Google Scholar] [CrossRef]
- CMS Collaboration. Measurement of prompt and nonprompt J/ψ production in pp and pPb collisions at = 5.02 TeV. Eur. Phys. J. C 2017, 77, 269. [Google Scholar] [CrossRef]
- CMS Collaboration. Nuclear modification of Υ states in pPb collisions at = 5.02 TeV. Phys. Lett. B 2022, 835, 137397. [Google Scholar] [CrossRef]
- CMS Collaboration. Measurement of nuclear modification factors of Υ(1S), Υ(2S), and Υ(3S) mesons in PbPb collisions at = 5.02 TeV. Phys. Lett. B 2019, 790, 270–293. [Google Scholar] [CrossRef]
- ATLAS Collaboration. Measurement of quarkonium production in proton–lead and proton–proton collisions at = 5.02 TeV with the ATLAS detector. Eur. Phys. J. C 2018, 78, 171. [Google Scholar] [CrossRef]
- ALICE Collaboration. Inclusive, prompt and non-prompt J/ψ production at midrapidity in p–Pb collisions at = 5.02 TeV. J. High Energy Phys. 2022, 06, 011. [Google Scholar] [CrossRef]
- Boente Garcia, O. Quarkonia production in pPb collisions. In Proceedings of the Hard Probes 2020, Austin, TX, USA, 1–6 June 2020. [Google Scholar]
- CMS Collaboration. Observation of the charged-particle multiplicity dependence of σψ(2S)/σJ/ψ in pPb collisions at = 8.16 TeV. arXiv 2025, arXiv:2503.02139. [Google Scholar]
- LHCb Collaboration. Multiplicity dependence of σψ(2S)/σJ/ψ in pp collisions at = 13 TeV. J. High Energy Phys. 2024, 5, 243. [Google Scholar] [CrossRef]
- ALICE Collaboration. Centrality dependence of ψ(2S) suppression in pPb collisions at = 5.02 TeV. J. High Energy Phys. 2016, 6, 50. [Google Scholar] [CrossRef]
- Ferreiro, E.G. Excited charmonium suppression in proton–nucleus collisions as a consequence of comovers. Phys. Lett. B 2015, 749, 98–103. [Google Scholar] [CrossRef]
- ALICE Collaboration. Multiplicity dependent inclusive J/ψ production at forward rapidity in pp collisions at = 13 TeV. arXiv 2025, arXiv:2504.00686. [Google Scholar]
- Bierlich, C.; Chakraborty, S.; Desai, N.; Gellersen, L.; Helenius, I.; Ilten, P.; Lönnblad, L.; Mrenna, S.; Prestel, S.; Preuss, C.T.; et al. A comprehensive guide to the physics and usage of PYTHIA 8.3. SciPost Phys. Codeb. 2022, 2022, 8. [Google Scholar] [CrossRef]
- Zhao, J.; Aichelin, J.; Gossiaux, P.B.; Werner, K. Heavy flavor as a probe of hot QCD matter produced in proton-proton collisions. Phys. Rev. D 2024, 109, 054011. [Google Scholar] [CrossRef]
- Levin, E.; Schmidt, I.; Siddikov, M. Multiplicity dependence of quarkonia production in the CGC approach. Eur. Phys. J. C 2020, 80, 560. [Google Scholar] [CrossRef]
- Conesa del Valle, Z. Multiplicity Dependence of Quarkonium Production. Universe 2024, 10, 59. [Google Scholar] [CrossRef]
- CMS Collaboration. Coherent J/ψ photoproduction in ultra-peripheral PbPb collisions at = 2.76 TeV with the CMS experiment. Phys. Lett. B 2017, 772, 489. [Google Scholar] [CrossRef]
- LHCb Collaboration. Study of coherent J/ψ production in lead–lead collisions at = 5 TeV. J. High Energy Phys. 2022, 7, 117. [Google Scholar] [CrossRef]
- ALICE Collaboration. Charmonium and e+e− pair photoproduction at mid-rapidity in ultra-peripheral Pb-Pb collisions at = 2.76 TeV. Eur. Phys. J. C 2013, 73, 2617. [Google Scholar] [CrossRef]
- ALICE Collaboration. Coherent J/ψ photoproduction in ultra-peripheral Pb-Pb collisions at = 2.76 TeV. Phys. Lett. B 2013, 718, 1273–1283. [Google Scholar] [CrossRef]
- Guzey, V.; Kryshen, E.; Zhalov, M. Coherent photoproduction of vector mesons in ultraperipheral heavy ion collisions: Update for run 2 at the CERN Large Hadron Collider. Phys. Rev. C 2016, 93, 055206. [Google Scholar] [CrossRef]
- Gon, V.P.; Machado, M.V.T. Vector meson production in coherent hadronic interactions: Update on predictions for energies available at the BNL Relativistic Heavy Ion Collider and the CERN Large Hadron Collider. Phys. Rev. C 2011, 84, 011902. [Google Scholar] [CrossRef]
- Gon, V.P.; Machado, M.V.T.; Moreira, B.D.; Navarra, F.S.; Santos, G.S.d. Color dipole predictions for the exclusive vector meson photoproduction in pp, pPb, and PbPb collisions at run 2 LHC energies. Phys. Rev. D 2017, 96, 094027. [Google Scholar] [CrossRef]
- Cepila, J.; Contreras, J.G.; Krelina, M. Coherent and incoherent J/ψ photonuclear production in an energy-dependent hot-spot model. Phys. Rev. C 2018, 97, 024901. [Google Scholar] [CrossRef]
- Mantysaari, H.; Schenke, B. Probing subnucleon scale fluctuations in ultraperipheral heavy ion collisions. Phys. Lett. B 2017, 772, 832–838. [Google Scholar] [CrossRef]
- ALICE Collaboration. First Measurement of the |t| Dependence of Incoherent J/ψ Photonuclear Production. Phys. Rev. Lett. 2024, 132, 162302. [Google Scholar] [CrossRef]
- ALICE Collaboration. Exclusive and dissociative J/ψ photoproduction, and exclusive dimuon production, in p-Pb collisions at = 8.16 TeV. Phys. Rev. D 2023, 108, 112004. [Google Scholar] [CrossRef]
- Klein, S.R.; Nystrand, J.; Seger, J.; Gorbunov, Y.; Butterworth, J. STARlight: A Monte Carlo simulation program for ultra-peripheral collisions of relativistic ions. Comput. Phys. Commun. 2017, 212, 258–268. [Google Scholar] [CrossRef]
- Klein, S.R.; Nystrand, J. Exclusive vector meson production in relativistic heavy ion collisions. Phys. Rev. C 1999, 60, 014903. [Google Scholar] [CrossRef]
- Harland-Lang, L.A.; Tasevsky, M.; Khoze, V.A.; Ryskin, M.G. A new approach to modelling elastic and inelastic photon-initiated production at the LHC: SuperChic 4. Eur. Phys. J. C 2020, 80, 925. [Google Scholar] [CrossRef]
- d’Enterria, D.; Snigirev, A. Double, triple, and n-parton scatterings in high-energy proton and nuclear collisions. Adv. Ser. Direct. High Energy Phys. 2018, 29, 159–187. [Google Scholar] [CrossRef]
- Belitsky, A.V.; Radyushkin, A.V. Unraveling hadron structure with generalized parton distributions. Phys. Rep. 2005, 418, 1–387. [Google Scholar] [CrossRef]
- Skands, P.; Carrazza, S.; Rojo, J. Tuning PYTHIA 8.1: The Monash 2013 Tune. Eur. Phys. J. C 2014, 74, 3024. [Google Scholar] [CrossRef]
- Alwall, J.; Demin, P.; de Visscher, S.; Frederix, R.; Herquet, M.; Maltoni, F.; Plehn, T.; Rainwater, D.L.; Stelzer, T. MadGraph/MadEvent v4: The New Web Generation. J. High Energy Phys. 2007, 9, 28. [Google Scholar] [CrossRef]
- Yuan, C.Z. The XYZ states revisited. Int. J. Mod. Phys. A 2018, 33, 1830018. [Google Scholar] [CrossRef]
- Wu, J.; Liu, Y.R.; Chen, K.; Liu, X.; Zhu, S.L. Heavy-flavored tetraquark states with the configuration. Phys. Rev. D 2018, 97, 094015. [Google Scholar] [CrossRef]
- Wang, G.J.; Meng, L.; Zhu, S.L. Spectrum of the fully-heavy tetraquark state . In Proceedings of the 18th International Conference on Hadron Spectroscopy and Structure, Trieste, Italy, 16–18 November 2020; pp. 308–312. [Google Scholar] [CrossRef]
- Celiberto, F.G.; Gatto, G. Bottomoniumlike states in proton collisions: Fragmentation and resummation. Phys. Rev. D 2025, 111, 034037. [Google Scholar] [CrossRef]
- CMS Collaboration. Measurement of Prompt J/ψ Pair Production in pp Collisions at = 7 TeV. J. High Energy Phys. 2014, 9, 94. [Google Scholar] [CrossRef]
- LHCb Collaboration. Observation of J/ψ pair production in pp collisions at = 7 TeV. Phys. Lett. B 2012, 707, 52–59. [Google Scholar] [CrossRef]
- ATLAS Collaboration. Measurement of the prompt J/ψ pair production cross-section in pp collisions at = 8 TeV with the ATLAS detector. Eur. Phys. J. C 2017, 77, 76. [Google Scholar] [CrossRef]
- LHCb Collaboration. Measurement of J/ψ-pair production in pp collisions at = 13 TeV and study of gluon transverse-momentum dependent PDFs. J. High Energy Phys. 2024, 3, 88. [Google Scholar] [CrossRef]
- ALICE Collaboration. Measurement of inclusive J/ψ pair production cross section in pp collisions at = 13 TeV. Phys. Rev. C 2023, 108, 045203. [Google Scholar] [CrossRef]
- LHCb Collaboration. Associated production of prompt J/ψ and Υ mesons in pp collisions at = 13 TeV. J. High Energy Phys. 2023, 8, 93. [Google Scholar] [CrossRef]
- Pivk, M.; Le Diberder, F.R. SPlot: A Statistical tool to unfold data distributions. Nucl. Instrum. Methods A 2005, 555, 356–369. [Google Scholar] [CrossRef]
- Lansberg, J.P. New Observables in Inclusive Production of Quarkonia. Phys. Rep. 2020, 889, 1–106. [Google Scholar] [CrossRef]
- Lansberg, J.P.; Shao, H.S. J/ψ -pair production at large momenta: Indications for double parton scatterings and large contributions. Phys. Lett. B 2015, 751, 479–486. [Google Scholar] [CrossRef]
- CMS Collaboration. New Structures in the J/ψJ/ψ Mass Spectrum in Proton-Proton Collisions at = 13 TeV. Phys. Rev. Lett. 2024, 132, 111901. [Google Scholar] [CrossRef]
- CMS Collaboration. Observation of double J/ψ meson production in pPb collisions at = 8.16 TeV. Phys. Rev. D 2024, 110, 092002. [Google Scholar] [CrossRef]
- CMS Collaboration. Determination of the spin and parity of all-charm tetraquarks. arXiv 2025, arXiv:2506.07944. [Google Scholar] [CrossRef]
- Wu, W.L.; Chen, Y.K.; Meng, L.; Zhu, S.L. Benchmark calculations of fully heavy compact and molecular tetraquark states. Phys. Rev. D 2024, 109, 054034. [Google Scholar] [CrossRef]
- Yang, G.; Ping, J.; Segovia, J. Tetra- and Penta-Quark Structures in the Constituent Quark Model. Symmetry 2020, 12, 1869. [Google Scholar] [CrossRef]
- Zhu, R. Fully-heavy tetraquark spectra and production at hadron colliders. Nucl. Phys. B 2021, 966, 115393. [Google Scholar] [CrossRef]
- Dong, X.K.; Baru, V.; Guo, F.K.; Hanhart, C.; Nefediev, A. Coupled-Channel Interpretation of the LHCb Double-J/ψ Spectrum and Hints of a New State Near the J/ψJ/ψ Threshold. Phys. Rev. Lett. 2021, 126, 132001. [Google Scholar] [CrossRef]
- Guo, F.K.; Hanhart, C.; Meißner, U.G.; Wang, Q.; Zhao, Q.; Zou, B.S. Hadronic molecules. Rev. Mod. Phys. 2018, 90, 015004. [Google Scholar] [CrossRef]
- Liu, X. Four-charm-quark matter from the CMS collaboration as a witness of the development of high-precision Hadron spectroscopy. Sci. Bull. 2024, 69, 2802–2803. [Google Scholar] [CrossRef]
- Zhu, F.; Bauer, G.; Yi, K. Experimental Road to a Charming Family of Tetraquarks …and Beyond. Chin. Phys. Lett. 2024, 41, 111201. [Google Scholar] [CrossRef]
- Shao, H.S. HELAC-Onia: An automatic matrix element generator for heavy quarkonium physics. Comput. Phys. Commun. 2013, 184, 2562–2570. [Google Scholar] [CrossRef]
- Shao, H.S. HELAC-Onia 2.0: An upgraded matrix-element and event generator for heavy quarkonium physics. Comput. Phys. Commun. 2016, 198, 238–259. [Google Scholar] [CrossRef]
- Shao, H.S.; Zhang, Y.J. Triple Prompt J/ψ Hadroproduction as a Hard Probe of Multiple-Parton Scatterings. Phys. Rev. Lett. 2019, 122, 192002. [Google Scholar] [CrossRef]
- d’Enterria, D.; Snigirev, A.M. Triple parton scatterings in high-energy proton-proton collisions. Phys. Rev. Lett. 2017, 118, 122001. [Google Scholar] [CrossRef] [PubMed]
- CMS Collaboration. Observation of triple J/ψ meson production in proton-proton collisions. Nat. Phys. 2023, 19, 338–350. [Google Scholar] [CrossRef]
- Shao, H.S.; Zhang, Y.J. Complete study of hadroproduction of a Υ meson associated with a prompt J/ψ. Phys. Rev. Lett. 2016, 117, 062001. [Google Scholar] [CrossRef] [PubMed]


Disclaimer/Publisher’s Note: The statements, opinions and data contained in all publications are solely those of the individual author(s) and contributor(s) and not of MDPI and/or the editor(s). MDPI and/or the editor(s) disclaim responsibility for any injury to people or property resulting from any ideas, methods, instructions or products referred to in the content. |
© 2025 by the authors. Licensee MDPI, Basel, Switzerland. This article is an open access article distributed under the terms and conditions of the Creative Commons Attribution (CC BY) license (https://creativecommons.org/licenses/by/4.0/).