Abstract
The asymmetry of seismic rupture significantly dictates the intensity and spatial distribution of the radiated stress waves during mining-induced tremors, exerting a pivotal influence on the dynamic instability of roadways triggered by mining-induced tremors. In this study, a method for simulating arbitrary rupture patterns based on the theory of moment tensors is proposed. Based on the engineering context of strong seismicity-induced roadway dynamic instability at the Xinjulong coal mine, the entire process, from the excitation and propagation of seismic stress waves to the subsequent destabilization and destruction of the roadway, is reproduced. The effects of seismic source, including rupture patterns, seismic energy, fault plane angles, and the dominant frequency of stress waves, on the stability of a roadway are analyzed. Research indicates that a strong mining-induced tremor is characterized by tensile failure, with the radiated P-waves playing a predominant role in the destabilization and collapse of the roadway compared to S-waves. The P-waves exert a repetitive tensile and compressive effect on the perturbed medium, whereas S-waves contribute through compressive shear actions. The stability of a roadway is influenced by various characteristics of the seismic source. The rupture pattern of the seismic source affects the spatial distribution of stress waves. The seismic energy influences the kinetic energy transmitted to the roadway, with an increase in energy leading to a greater contribution of S-waves to roadway destruction. The fault plane angle similarly affects the propagation pattern of stress waves, particularly at 45° and 60° angles, where the maximum radiation of P-waves is directed towards the roadway, causing the most severe damage. The dominant frequency affects the attenuation of stress waves, with lower frequencies resulting in less attenuation and a higher likelihood of roadway damage.
1. Introduction
Mining-induced tremor is a phenomenon precipitated by the abrupt release of energy from the rupture of coal–rock mass, which is triggered by mining activities that cause stress redistribution and lead to localized stress concentration in the rock mass. Mining-induced tremor releases energy in the form of elastic waves, causing complex dynamic disturbances such as tension, compression, and shearing in the propagation medium. Particularly when the surrounding rock is already under high accumulated static load, it is easy for the accumulated static load to be violently released under the disturbance of mining-induced tremors, resulting in serious dynamic disasters [1,2,3,4].
In light of the significant threat posed by mining-induced tremor to the safe production in mines, numerous domestic and international scholars have conducted extensive research on the mechanisms of roadway damage induced by mining-induced tremors. The instability and failure of roadways triggered by mining-induced tremors mainly involve three processes: the stress wave triggered by the rupture of the source rock mass, the propagation and attenuation of the stress wave in the rock medium, and the disturbance of the roadway by the stress wave. Scholars have delved into the static and dynamic load conditions satisfied during roadway destabilization and damage. Dou et al. proposed a theory of the superposition static and dynamic loading, suggesting that rockbursts are triggered when the stress induced by seismic waves, in conjunction with static loads, surpasses the ultimate strength threshold of the rock mass [5]. He et al. studied the impacts of dynamic loads generated by roof fractures on roadway stability, indicating that stress waves reflect off roadway surfaces, leading to concentrated tensile stresses [6]. Based on similar simulation experiments, Wang et al. investigated the process of rockburst under the superposition of static and dynamic loads, concluding that the seismic energy and the distance from the seismic source to the mining area are key factors affecting the intensity of dynamic load perturbation [7]. Wang et al. further posited that the intensity of dynamic load perturbation is most significantly influenced by the location of the seismic source, followed by propagation distance, and lastly, the properties of the rock strata medium [8]. Through numerical simulation, Li et al. differentiated the proportion of energy released and dissipated during rockbursts, and suggested that a portion of the energy released in disasters is due to blasting kinetic energy [9]. Additionally, the static load conditions inherent to the surrounding rock are equally crucial for the outbreak of rockbursts. Lee et al. found that higher horizontal stresses exist in the axial parts of anticlines, making rockbursts more likely [10]. Through theoretical calculations and indoor experimental simulations, Chen et al. determined the critical stress required for the occurrence of rockburst, considering the maximum horizontal stress as the dominant factor [11]. In summary, it is widely accepted that the dynamic load waves radiated by mining-induced tremor, when superimposed with the static loads in the roadway surrounding rock, can induce rockburst.
Furthermore, stress waves undergo substantial attenuation as they propagate from the seismic source to the roadway due to spatial geometric expansion, damping decay within the rock strata, and reflective and refractive phenomena at various interfaces, prompting extensive scholarly investigation into the attenuation patterns of stress waves within rock formations. Wu et al. utilized a pendulum impact testing device and MS monitoring system to investigate the attenuation patterns of microseismic waves, revealing that both the energy and peak velocity of microseismic waves decrease exponentially with increasing propagation distance, with the energy attenuation coefficient being greater than that of the peak velocity [12]. Through numerical simulation and theoretical analysis, Yang et al. studied the impact of in situ stress levels on explosive waves, indicating that the attenuation coefficient of explosive waves first decreases and then increases with increasing in situ stress [13]. Madenova et al. employed laboratory experiments to simulate the propagation of vibration waves in complex mining environments that include voids, varying scales of cavities, and rock masses with different water contents, observing that the arrival time of stress waves at the sensor increases with the diameter of rock blocks and cavities [14]. Zhu et al. conducted numerical simulations to study the propagation patterns of vibration waves in rock masses containing joints, discovering that the compressive strength of the joints is a primary factor affecting the efficiency of stress wave transmission [15].
However, the basis of these studies is the general belief that the seismic source is simplified as a point source, and that the stress wave intensity radiated by the seismic source in different spaces is consistent. Due to the complexity involved, there is a lack of attention that has been paid to the impact of the rupture process of the seismic source and the spatial orientation characteristics of the fault plane on the propagation and extension of stress waves and the stability of the disturbed roadway. Vidale et al. observed that the rupture mode of the seismic source is closely related to the peak acceleration of the disturbed area, and this correlation does not disappear with the attenuation of seismic waves [16]. Dubi ń ski et al. also pointed out that the focal mechanism of strong mining-induced tremor has a significant impact on the intensity of ground disturbances [17]. Therefore, the characteristics of seismic source properties are an important factor that cannot be ignored when studying the influence of radiation stress waves on external disturbance mechanisms. However, since the seismic source often occurs inside the rock, its rupture characteristics cannot be directly monitored. At the same time, it is also difficult to use experimental reproduction methods to selectively generate seismic sources with specific attribute characteristics and induce dynamic disasters. Therefore, numerical simulation has become the main means of studying this topic. Lv et al., Xu et al., Yuan et al., and Li et al. have employed sinusoidal waveforms to simulate the stress waves excited by the seismic source, investigating the impact of source energy and frequency characteristics on seismic activity by adjusting the amplitude and frequency of the function [18,19,20,21]. However, these simulations commonly utilize simplified seismic source functions, neglecting the variation in radiation intensity of the seismic source in different spatial directions, and failing to consider the differences in the disturbance mechanisms of shear and compressional waves in the medium.
Considering the current limitations in simulating the effects of mining-induced tremors when investigating the influence of seismic source rupture characteristics on stress wave propagation and roadway stability, this study proposes a numerical simulation method that accurately reflects the arbitrary rupture characteristics and radiation patterns of field-mining-induced tremors. Initially, a two-dimensional finite element numerical model was constructed, grounded in an engineering context of a dynamic disaster incident involving roadway damage induced by a mining-induced tremor at the Xinjulong coal mine. The seismic source wavefield characteristics were simulated by applying initial forces in the normal and tangential directions to the seismic source, and these simulations were validated against theoretical expressions for P-wave and S-wave displacement fields derived from the mechanisms of a strong mining-induced tremor, ensuring the rationality of the spatial feature simulation. Subsequently, the temporal evolution of the seismic source stress waves was characterized using the Ricker wavelet function, and the velocity vectors were decomposed into tangential and normal components to ascertain the propagation characteristics of P-waves and S-waves. Ultimately, the study investigated the impacts of rupture patterns, seismic energy, fault plane angles, and the dominant frequency of radiated stress waves on roadway stability. The outcomes of this research are significantly valuable for elucidating the mechanisms of mining-induced tremor disturbances, and for the mitigation of dynamic disasters.
2. Engineering Background
The Xinjulong coal mine located in Shandong Province, China, primarily extracts the No. 3 coal seam, with a thickness ranging from 5.66 to 11.36 m and an average thickness of 8.82 m. The uniaxial compressive strength and elastic energy index of the No. 3 coal seam are 13.41 MPa and 12.23, respectively. The burial depth of the coal seam is between 966 and 995.7 m, with an average depth of 980.85 m. The coal seam is under high stress conditions. According to in situ stress measurements, the maximum horizontal principal stress (σ1), intermediate vertical principal stress (σ2), and minimum horizontal principal stress (σ3) are 42.18 MPa, 24.15 MPa, and 22.25 MPa, respectively. As shown in Figure 1, there are several relatively stable thick and hard strata above the coal seam, primarily consisting of mudstone and siltstone.
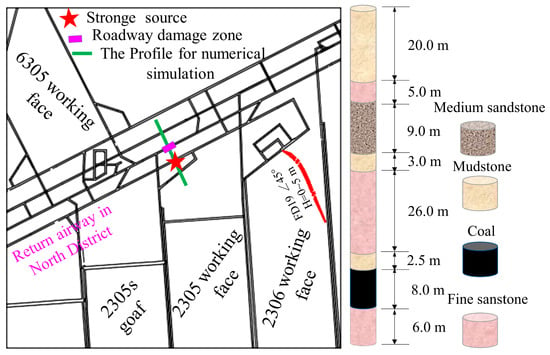
Figure 1.
Division of working faces in the No. 6 mining area and lithology of rock strata.
The ARAMIS M/E regional microseismic (MS) monitoring system developed and manufactured by EMAG Mining Electrification and Automation R&D Center (Katowice, Poland) is installed within the coal mine, which is capable of locating and recording events with energy greater than 100 J within a frequency range of 0.1 to 150 Hz, thereby analyzing the fracture information of the coal and rock mass. The system comprises a real-time monitoring recorder, analyzer, geophones, and a digital transmission system. The geophones feature a maximum data transmission rate of 1 Mb/s, utilizing a 16-bit A/D converter with a sampling rate of 500 Hz. The frequency range of the geophones spans from 0.1 to 600 Hz, with a resonant frequency of 4.5 ± 0.75 Hz. To mitigate cable noise, a control switch with a 50 Hz band-pass filter is employed. The geophones are single vertical component sensors, each with a sampling frequency of 500 Hz. The detection depth range of the geophones is broad (680 to 1040 m), and the coverage direction ensures positioning accuracy.
At 6:17 AM on 22 February 2020, a mining-induced tremor with energy of 4.25 × 10⁷ J occurred. Specifically, as depicted in Figure 1, the event was located approximately 48 m above the No. 3 coal seam, adjacent to the northern extraction roadway and the auxiliary roadway of the 2305 working face. According to on-site investigations, parts of the main roadway experienced deformation and partial damage, with no casualties but noticeable ground vibrations. The total length of damage to the main roadway was 360 m, with the destruction area as shown in Figure 1. The damage primarily manifested as roof subsidence, floor heaving, and lateral displacement. Clearly, this disaster was an instance of roadway damage triggered by mining-induced tremor disturbances. Against this engineering background, we conducted numerical simulations to study the processes of roadway damage induced by mining-induced tremor, focusing on the impact of seismic source characteristics on roadway stability.
3. Numerical Model Establishment and Seismic Source Representation
3.1. Model Establishment and Mechanical Parameters
In order to investigate the dynamic response characteristics and failure mechanisms of a roadway under the influence of mining-induced tremors, the area containing the seismic source and the roadway is segmented for individual numerical modeling (as depicted in Figure 1). The FLAC2D 6.0 is employed to simulate the radiation and propagation of stress waves resulting from mining-induced tremors, as well as the deformation and destruction processes of the roadway. Based on the propagation patterns of seismic waves, the Pressure–Shear Vertical (P-SV) system exhibits significantly greater observable seismic energy compared to the Pressure–Shear Horizontal (P-SH) system [22]. Consequently, a two-dimensional approximation of the P-SV system is utilized to analyze the propagation of mining-induced tremor waves within a deeply buried roadway. The model dimensions are 300 × 150 m. The seismic source is configured as a circle with a radius of 2 m to apply normal and shear stresses for stress wave generation. The source region is refined with a 0.2 m grid, while the remaining areas are meshed with a 1 m grid. The roadway has a width and height of 5 m, as illustrated in Figure 2. Based on the borehole columnar section, the model is stratified into eight rock strata. The eight sets of rock strata were configured based on the borehole columnar section, with the rock-failure conditions determined using the Mohr–Coulomb strength criterion, and the mechanical parameters of different rock strata are shown in Table 1 [23].
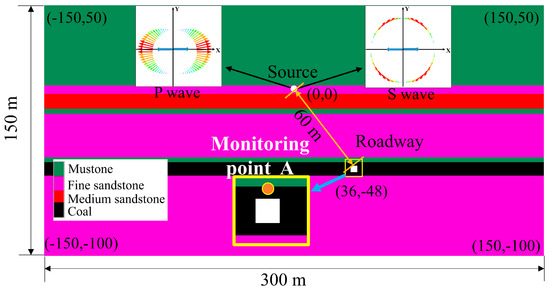

Table 1.
The mechanical parameters of different rock strata.
3.2. Representation of the Spatial Radiation Characteristics of Source
It is evident from the field condition analysis that strong mining-induced tremors are a significant factor inducing roadway failure. Therefore, ensuring the consistency of simulated seismic source characteristics with actual field conditions is a crucial prerequisite for the rationality of simulation results. In seismology, it is widely accepted that a microseismic event can be simplified to a point source. The distinct seismic source mechanisms of this point source can characterize the rupture pattern of the seismic source, thereby further controlling the pattern of radiation of the microseismic waves from the source. The relationship between the stress waves radiated by the seismic source and the moment tensor can be expressed as
where , , and represent the displacements of the P waves, SV waves, and SH wave, respectively; denotes any force couple; represents the density of the medium; and correspond to the velocities of P- and S-waves, respectively; and r signifies the propagation distance. are defined as follows:
Meanwhile, , and (i = 1, 2, and 3) represent the components of vectors , , and , respectively, as expressed in the following equations:
Based on the seismic MT composition, the corresponding source-displacement field can be derived using Equations (1)–(4).
Regarding the composition of the moment tensor for this strong mining-induced tremor, Song et al. conducted a detailed inversion of the seismic source mechanism results [24]. The proportions of DC, CLVD, and ISO for the mining-induced tremor are 23.8%, 1.4%, and 74.8%, respectively. The rupture patterns of the seismic source are predominantly pure tensile failure. We directly employ the research findings, with the normalized composition being as follows:
The φ is set to 0 when the seismic event is simplified into a two-dimensional plane. The displacement wavefield of this strong mining tremor is as follows:
The P-wave velocity within the rock strata is 5000 m/s, approximately 1.7 times that of the S-wave. The density of the rock at the seismic source is 2600 kg/m3. By substituting these values into Equation (5), the displacement field of the seismic waves is calculated for a seismic source radius of 2 m, as illustrated in Figure 3a,b. In the numerical model, P-waves and S-waves are generated by applying normal and tangential stresses to a circular seismic source, and stress magnitudes in different regions of the circle are determined by Equation (5). These stresses can be adjusted by multiplying the equation by a scalar to ensure consistency with the field-inferred stress wave intensities. Figure 3c,d display the numerically simulated wavefields, which reveal a close correspondence with the spatial distribution and intensity of the seismic stress waves from field results, thereby validating the rationality of the seismic source simulation.
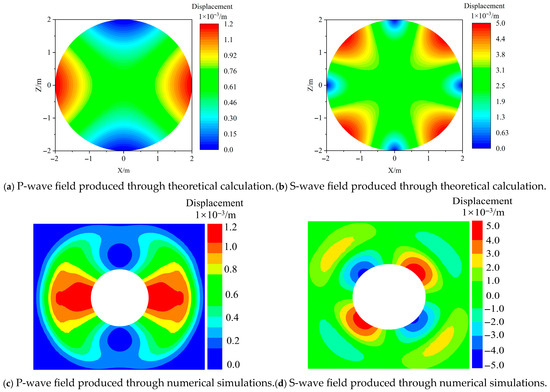
Figure 3.
Seismic wave radiation patterns of theoretical calculations and numerical simulations for a strong source (m).
3.3. Representation of Temporal Propagation Characteristics of Source
Beyond the spatial variability in the radiation characteristics of the wavefield, the stress at the seismic source and the radiated stress wavefield are also subject to dynamic temporal changes. To encapsulate the temporal dynamics, we have multiplied Equations (1)–(5) by a Ricker wavelet function with a dominant frequency of 10 Hz, which is expressed as
where ω denotes the dominant frequency of the seismic source time function, and represents the time constant. In this study, ω and are, respectively, set to 30 Hz and 0.15 s, as depicted in Figure 4.
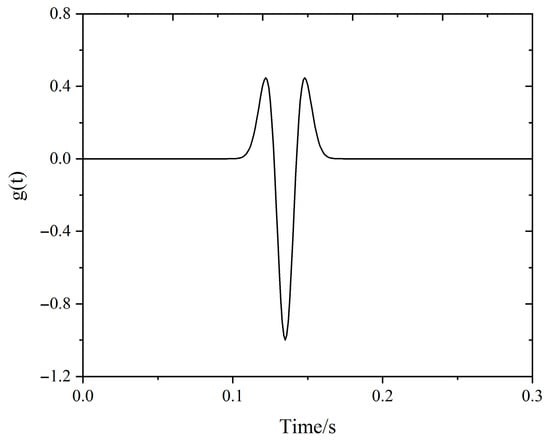
Figure 4.
Ricker wavelet source time function with ω = 30 Hz and t0 = 0.15 s.
3.4. Simulation Scheme
During the static computation phase, the bottom of the model is constrained against vertical displacement and its perimeter against horizontal displacement, with the top being free. A vertical stress of 17.5 MPa is applied to the top to represent the gravitational load experienced by a coal seam buried at a depth of 700 m. According to the measurement results of in situ stress, vertical and horizontal stresses of 22.25 MPa and 42.18 MPa are imposed, respectively. In the static calculation phase, the model firstly reaches equilibrium under the influence of gravity, followed by the simulation of stress redistribution in the surrounding rock after roadway excavation by removing elements. Subsequently, dynamic calculations are initiated, and the corresponding normal and tangential initial stresses are applied on the circular seismic source to generate stress waves based on the field seismic source inversion stress wave expression formula. The 5% local damping ratio is applied to the model to emulate material damping, this being the technique widely applied in numerous dynamic simulations [25,26]. To mitigate the reflection and refraction of seismic waves, a viscous boundary is utilized to absorb incident waves reaching the boundary [27,28]. This method offsets the incident waves by applying damping forces at the boundary, correlated with both normal and tangential velocities, with the computational formula being
and represent the normal and tangential velocities at the boundary, respectively.
4. Numerical Simulation Results
4.1. Distribution and Propagation Characteristics of Seismic Waves
To investigate the radiation characteristics of the stress waves generated by the strong mining-induced tremor, the total velocity within the model was vectorially decomposed using the fish function into two components; one parallel to the propagation direction, representing P-waves, and the other perpendicular, representing S-waves. The P-waves are defined with positive values for vibrations directed away from the seismic source and negative values for those towards it. S-waves are assigned positive values for counterclockwise vibrations and negative values for clockwise ones. The propagation characteristics of P-waves and S-waves, along with velocity vector diagrams, are depicted in Figure 5.
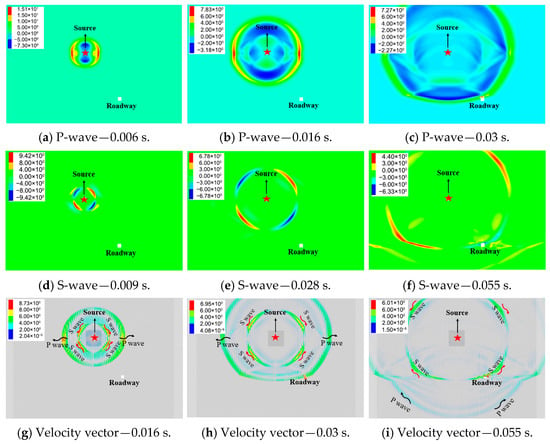
Figure 5.
Velocity propagation nephogram and vectorgraph of P-waves and S-waves.
As depicted in Figure 5, the peak velocity of the stress waves diminishes with the increase in propagation time and distance, while the range of disturbance progressively expands. The strong mining-induced tremor originates from a tensile failure at the seismic source, with the fault plane oriented vertically and subjected to horizontal tensile forces. Consequently, the P-waves exhibit maximum intensity in the horizontal direction, diminishing to zero as they transition towards the vertical direction. At 0.03 s, the P-waves first reach the roadway, with the velocity at the roof peaking due to the superposition of incident and reflected waves. The S-waves reach their peak at the four corners of the seismic source, with negligible intensity in both horizontal and vertical directions, and their propagation velocity is lower than that of the P-waves. The S-waves arrive at the roadway at 0.055 s. It is evident that the propagation characteristics and intensity of stress waves vary significantly across different spatial orientations. The roadway is initially subjected to the initial tensile and compressive effects of the P-waves, followed by the shearing action of the S-waves, leading to ultimate failure under the repeated influence of stress waves.
4.2. Variation of Principal Stress Caused by Seismic Waves
Figure 6 illustrates the vector diagrams of stress wave propagation during the mining-induced tremor and the resultant changes in principal stress. The stress waves reach the area above the roadway at 0.012 s, with P-waves preceding S-waves. The direction of the velocity vectors indicates that the leading edge of the P-waves moves away from the seismic source, exerting a compressive effect on the medium ahead, leading to a pronounced increase in compressive stress in the disturbed area since the initial principal stress in the rock medium is compressive. Tensile waves are subsequent to the compressional waves and directed towards the seismic source, which cause a reduction in principal stress in the disturbed region. The stress distribution induced by S-waves exhibits a distinct pattern. The velocity vectors within the velocity peak areas and on either side of the S-waves reveal that the peak area velocities develop in a clockwise direction, while the velocities on both sides move counterclockwise for the upper half of the S-waves. The opposing motion imparts a shearing effect on the central area, resulting in increased stress.
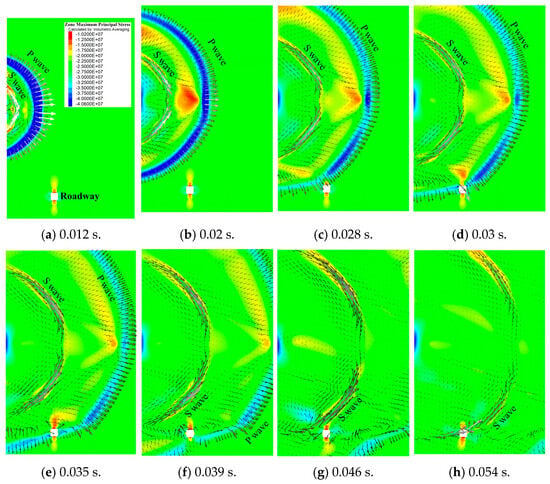
Figure 6.
Variations of the maximum principal stress induced by mining-induced tremor.
The stress changes induced by the lower half of the S-waves are similar, but the direction of the velocity vectors is opposite to that of the upper half. In summary, P-waves primarily disturb the rock medium through tensile and compressive actions, leading to increases and decreases in stress in the disturbed area. However, S-waves exert shearing effects on the disturbed region through opposing velocity dislocation directions, resulting in stress variations.
4.3. Variations in Stress, Plastic Area, and Displacement During Roadway Failure
Figure 7 and Figure 8 illustrate the failure process of the roadway induced by stress waves before and after their incidence, along with the associated changes in stress and velocity vectors. At 0 s (Figure 7 and Figure 8a), before the arrival of the stress waves, velocity vectors in various regions predominantly move downward under the influence of gravity, with small magnitudes. The roof is subjected to tensile stress concentration due to the initial unloading. At 0.028 s (Figure 7 and Figure 8b), the compressed P-wave arrives first, and the tensile stress area on the roof decreases under compression. As the time increases to 0.034 s (Figure 7 and Figure 8c), the compressive stress wave is followed by a tensile wave pointing towards the seismic source. The velocity vector direction of the roof changes to point towards the seismic source, causing tensile stress on the roof. The corresponding tensile stress concentration area on the roof increases sharply, and the number of roof failure elements increases sharply at this time, indicating that the tensile stress wave causes failure of roof. As time progresses to 0.046 s (Figure 7 and Figure 8d), the S-waves arrive at the roadway, with velocity vectors following a counterclockwise direction, inducing tensile stress on the roof and causing a corresponding sharp increase in the region of tensile stress concentration. At 0.052 s (Figure 7 and Figure 8e), the S-waves transfer to the left side of the roadway, exerting a compressive effect and concentrating compressive stress. By the time the dynamic perturbation concludes at 0.069 s (Figure 7 and Figure 8f), there is a noticeable expansion of the tensile stress region in the roof and a deepening shift of the compressive stress peaks on the sides compared to the state prior to the disturbance, leading to a further expansion of the damage area. In summary, it is evident that the disturbance of stress waves on the roadway is primarily decided by their intensity and the direction of action. The directional action of these vectors exerts alternating tensile and compressive effects on various regions of the roadway, leading to shifts in the areas of stress concentration and ultimately inducing roadway destruction.

Figure 7.
Evolution of failure elements around the roadway during mining-induced tremor disturbance.
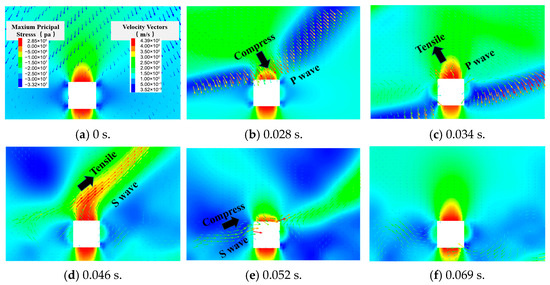
Figure 8.
Evolution of maximum principal stress and velocity vector around the roadway during mining-induced tremor disturbance.
To conduct a detailed investigation into the process of roadway damage, a monitoring point A was established at the center of the roof, as depicted in Figure 2. The stress wave, stress, and displacement variation curves for point A are presented in Figure 9. At 0.025 s, the stress wave is incident on the roadway, and the P-wave is the first to arrive with velocity towards the roadway, exerting a compressive effect on the roof. As a result, both the vertical and horizontal stresses on the roof increase towards the negative half axis, indicating an increase in compressive stress. At the same time, the stress wave vector exerts horizontal a force to the right and vertical downward velocity components at point A, respectively (Figure 8b). Correspondingly, the horizontal displacement of the roof increases towards the positive half axis (to the right), and the vertical displacement increases downward. However, at this time, the concentrated stress has not yet reached the rock failure strength, so there is no significant increase in the number of failure elements. After reaching peak, the compressive stress wave begins to drop and transform into a tensile stress wave, exerting a tensile effect on the roof (Figure 8c). Conversely, velocity components are generated horizontally to the left and vertically upwards at point A, causing an increase in the horizontal displacement of the roof towards the positive and negative axes (to the left) and an increase in the vertical displacement. Due to the tensile strength of the roof being inferior to its compressive strength, there is a marked increase in the number of failure elements. After 0.03 s, the disturbance intensity of the P-waves diminishes, resulting in only minor fluctuations in stress, displacement, and the number of failure elements. During the interval from 0.045 to 0.060 s, S-waves reach the roadway, producing a disturbance akin to that of the P-waves, albeit with reduced intensity. Consequently, there is only a marginal escalation in the count of failure elements. After 0.09 s, the stress disturbance essentially concludes, with no further increase in the number of failure elements. Compared to the initial state prior to the disturbance, the horizontal stress is nearly identical, whereas the vertical compressive stress has decreased to a level approaching tensile stress, indicating a significant tensile failure of the roof. Correspondingly, there is a marked increase in the vertical downward displacement of the roof, resulting in irreversible deformation. From the above, it is apparent that the incidence of stress waves characterized by their velocity vector directions and intensity variations correlates with the stress and deformation alterations in the roadway surrounding rock. The disturbance induced by these stress waves results in localized stress fluctuations within the rock mass, culminating in the destabilization and destruction of the roadway.
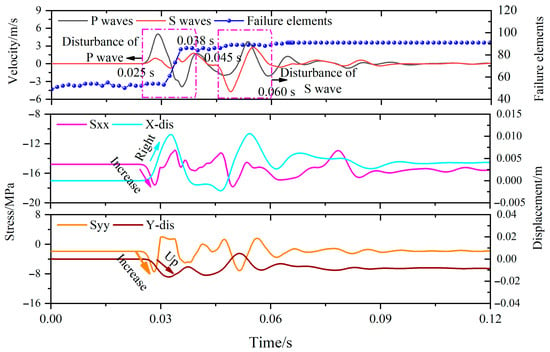
Figure 9.
Variation curves of stress, velocity, failure elements and displacement around the roadway.
5. Discussion
It is evident that the propagation characteristics of stress waves are influenced by the temporal and spatial characteristic of the seismic source. The angle of the fault plane and the rupture patterns dictate the radiation pattern of the seismic source, while the temporal function of the seismic source governs the temporal characteristics of the stress waves. Consequently, the subsequent discussion will delve into a detailed examination of the factors characterizing the seismic source, encompassing the rupture mode of the seismic source, the angle of the fault plane, the energy of the seismic source and the dominant frequency of the seismic stress waves.
5.1. Seismic Source Rupture Patterns
Seismic ruptures can generally be categorized into explosions, tensile failures, and shear failures, with any complex seismic source being a combination of these three fundamental types. The radiation pattern of stress waves from different rupture forms varies in relation to the fault plane, leading to distinct disturbance patterns on the roadway. To investigate the impact of rupture modes on stability of roadway, pure shear and explosive models were introduced and we applied an equivalent energy of 0.5 × 10⁸ J based on field monitoring results; the propagation characteristics of stress waves and the dynamic response of the roadway were studied.
Figure 10 and Figure 11 elucidate the propagation characteristics of stress waves emanating from various seismic rupture patterns. As depicted in the figures, when pure tensile failure occurs in the left and right directions along the vertical direction, the strength of the P-wave is highest in the horizontal tensile direction vertical to the fault plane, while it is lowest in the vertical direction parallel to the fault plane. In the opposite direction, the S-wave has the highest intensity in the diagonal direction and the lowest intensity in the horizontal and vertical directions (Figure 10 and Figure 11a–c). The explosion source only excites P-waves without S-waves, where P-waves have similar intensities in different spatial directions and propagate in a circular shape, and positive values represent compressive stress wave. When pure shear failure occurs vertically, the generated P-wave has the highest intensity in the diagonal direction at the 45° angle to the fault plane, while the intensity is the lowest in the horizontal and vertical directions parallel and vertical to the fault plane. At the same time, the occurrence of positive and negative intervals of P-waves along a certain diagonal direction indicates the reciprocating tensile and compressive effects on the medium. The spatial distribution and intensity characteristics of the S-wave are exactly opposite to those of the P-wave, the maximum intensity of which is in the horizontal and vertical directions on the parallel and vertical fault plane, and the minimum intensity is in the diagonal direction (Figure 10 and Figure 11d–f). At the same time, the positive and negative values of S-waves in adjacent areas are opposite, indicating that the direction of shear motion is the opposite. Obviously, the rupture mode has a significant impact on the radiation propagation characteristics of the source stress wave, and the difference in radiation will affect the stability of the roadway due to the relative spatial position characteristics between the seismic source and the roadway.
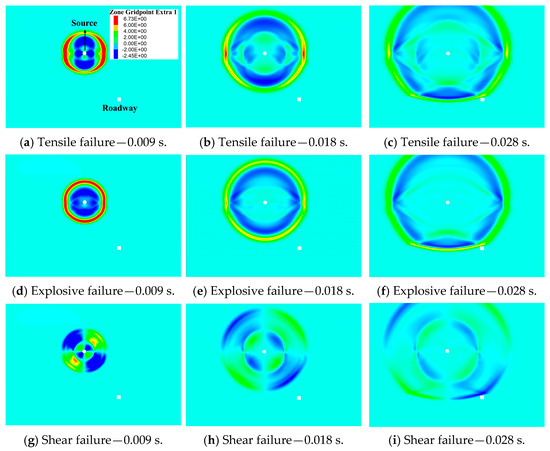
Figure 10.
Velocity propagation nephogram of P-waves with different forms of rupture.


Figure 11.
Velocity propagation nephogram of S-waves with different forms of rupture.
Figure 12 indicates that the most severe damage to the roadway occurs when the seismic source is characterized by tensile rupture, followed by explosive rupture, and then by shear rupture as the least damaging. Correspondingly, Figure 13 reveals that the maximum peak velocity of the roof is observed with tensile rupture, followed by explosive rupture, and shear rupture exhibits the minimum velocity. Comparing the stress wave disturbances on the roadway under different rupture forms, it is observed that the roadway experiences two velocity peaks during tensile rupture, which are attributed to the P-waves and S-waves, measuring 5.18 m/s and 4.98 m/s, respectively. Prior to 0.04 s, the velocity peaks for explosive and tensile rupture sources nearly coincide. After 0.04 s, the disturbance caused to point A from the explosive source diminishes due to the absence of S-waves, resulting in slightly less damage to the roadway compared to tensile rupture. As for shear rupture, the energy released is predominantly contained within the S-waves, which exhibit minimal intensity along the 45° diagonal from the corner points. Although the P-waves have maximum intensity along the 45° direction, their overall intensity is significantly less than that of the S-waves, hence resulting in the least roadway damage when the seismic source is a shear rupture.

Figure 12.
Failure elements with different forms of rupture.
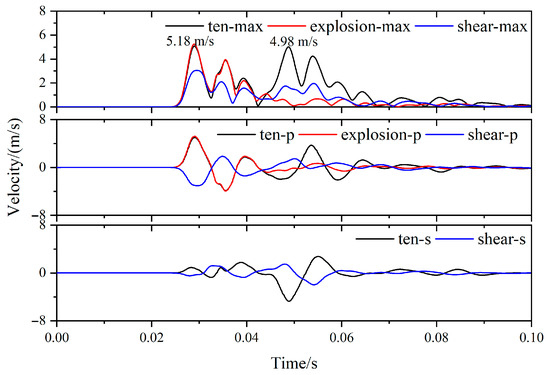
Figure 13.
Variation curves of velocity, P-waves and S-waves in point A with different forms of rupture.
5.2. Energy of Seismic Source
The energy released by the mining-induced tremor is the total energy radiated outward as stress waves, which is proportional to the square of the displacement of the disturbed medium. Given the uneven spatial distribution of stress radiated by the rupture, variations in energy can significantly affect the intensity disparities in different regions of the wavefield. Consequently, under the initial condition of a seismic source energy of 0.5 × 10⁸ J, numerical models with source energy of 1 × 10⁸, 2 × 10⁸, 4 × 10⁸ and 8 × 10⁸ J were introduced to investigate the impact of seismic energy on the propagation characteristics of stress waves and the stability of the roadway.
As illustrated in Figure 14, there is a gradual increase in the peak propagation velocity of mining-induced tremor from 2 m/s to 8.42 m/s as the energy released by the seismic rupture increases from 0.5 × 10⁸ to 8 × 10⁸ J. Under the influence of a strong mining-induced tremor, the extent of plastic damage in the surrounding rock progressively expands, particularly when the energy exceeds 2 × 10⁸ J. The roof of the roadway and the left side are directly incident with stress waves, resulting in a significant increase in plastic failure elements. At the same time, the failure type of the roof gradually changes from tensile failure to shear failure. However, due to the barrier effect of the roadway on stress waves, the plastic failure elements of the bottom and right side show less growth. The displacement deformation of the corresponding roadway gradually increases from 0.3 cm at low energy 1 × 10⁸ J to 1.59 cm at 8 × 10⁸ J. By examining the spatial distribution of the deformation concentration area, it is evident that the roof initially exhibits a displacement concentration (indicated in red) with source energy of 2 × 10⁸ J. As the energy escalates to 4 × 10⁸ J, the concentration area emerges in the middle section of the roadway left side. When the energy further escalates to 4 × 10⁸ J, the deformation of the roof and left side is essentially contiguous, signifying that the entire upper left region of the roadway undergoes destruction. Concurrently, the principal stress in the surrounding rock undergoes significant changes. Under the low-energy disturbance of 0.5 × 10⁸ J, compressive stress is concentrated on both sides, while tensile stress is concentrated on the roof and floor. As the energy released by the mining-induced tremor gradually increases to 1 × 10⁸ J, 2 × 10⁸ J, 4 × 10⁸ J, and 8 × 10⁸ J, the destruction range of the roof continues to expand, with the corresponding tensile stress concentration area increasing. The shallow parts of the sides rapidly lose their load-bearing capacity due to the increased degree of destruction, leading to a swift decrease in stress as they can no longer bear higher stress levels, causing the compressive stress peaks to shift further into the depths of the surrounding rock.

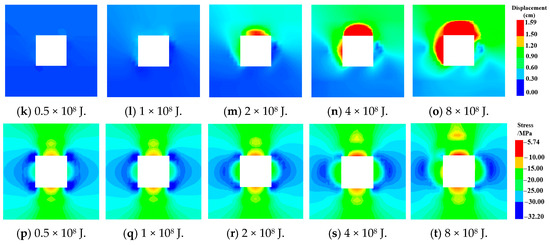
Figure 14.
Evolution of velocity, failure elements, displacement and stress around roadway with different seismic energy.
As shown in Figure 15, with the increase of energy released by the seismic source, the intensity of P-waves and S-waves received by the roadway roof gradually increases, and the corresponding number of failure elements increases sharply. Comparing the curves of failure elements curves with different seismic sources, it can be seen that when the energy is lower at 0.5 × 10⁸ J, 1 × 10⁸ J, and 2 × 10⁸ J, respectively, the failure elements increase sharply during the period of 0.03~0.036 s, and then hardly change thereafter. When the energy increases to 4 × 10⁸ and 8 × 10⁸ J, the failure elements still show a continuous increasing trend from 0.036 to 0.06 s. Observing the stress wave trend during the corresponding time period, it can be found that the roadway is mainly disturbed by P-waves from 0.03 to 0.036 s with a maximum value of 10 m/s when energy of seismic source is 8 × 10⁸ J. While the intensity of S-wave is relatively small with a maximum of only 3.3 m/s. During the period from 0.036 to 0.06 s, the roadway is disturbed by both P-waves and S-waves. When the disturbance energy of the seismic source is lower than 2 × 10⁸ J, the overall intensity of both P-waves and S-waves is relatively small, so the changes in the failure elements during this stage are not significant. When the energy increases to 4 × 10⁸ J and 8 × 10⁸ J, the overall intensity of both P-waves and S-waves increases, especially the peak of S-waves increases to 7 m/s, while the intensity of P wave is relatively small at 5.4 m/s, resulting in a sharp increase in the number of failure elements. In summary, as the energy released by the seismic source increases, the damage of the roadway shifts from being dominated by initial P-waves disturbance to being jointly dominated by disturbance of P-waves and S-waves.
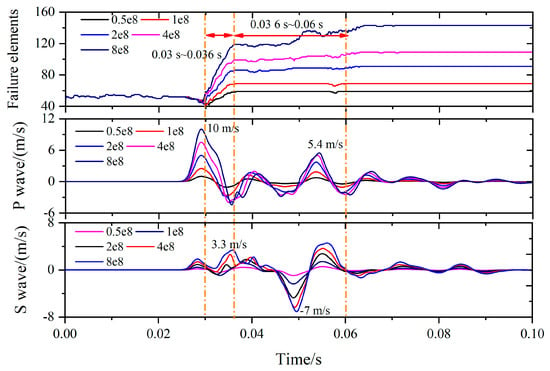
Figure 15.
Variation curves of velocity, P-waves and S-waves in point A with different seismic energy.
5.3. The Fault Angle of Seismic Source
The fault angle of the seismic source governs the radiation pattern of seismic waves, thereby exerting a significant impact on the stability of the disturbed roadway. Consequently, based on a purely tensile seismic source, five scenarios were established wherein the angle between the fault plane angle and the vertical direction ranges from 0° to 90° in increments of 30°, representing a gradual transition of the fault plane from the vertical to the horizontal direction. The propagation patterns of stress waves from the seismic source and the response characteristics of the roadway were investigated.
Figure 16, Figure 17 and Figure 18, respectively, illustrate the radiation patterns of stress waves, the deformation and destruction of the roadway, and the stress wave response curves of the roof for different angles of the fault plane. It is observed that for tensile seismic sources, P-waves envelop the outer region, while S-waves are internal. The peak intensity of P-waves exceeds that of S-waves, thus the stability of the roadway is predominantly affected by the perturbation of P-waves. The peak intensity of P-waves is located on either side of the fault plane, and S-waves are positioned at a 45° angle to the fault plane. Consequently, as the angle between the fault plane and the Y-axis increases incrementally from 0° increases to 90°, the spatial orientation of the peak intensity area of P-waves relative to the roadway undergoes continuous deflection. Further monitoring was conducted on the stress wave variation curve of the roof, as shown in Figure 18. When the angle between the fault plane and the vertical direction (Y-axis) is 0°, the peak value of the S-wave points exactly towards the roadway, while the peak value of the P-wave propagates to the left and right sides. Therefore, the disturbance intensity of the S-wave received by the roof is greater than that of the P-wave. However, the overall plastic area and displacement of the roadway are relatively small, so the deformation and damage of roadway are not severe. As the angle between the fault plane and the vertical direction increases to 30°, 45°, and 60°, the peak value of the P-wave gradually deviates from the horizontal direction in a clockwise direction towards the lower left and upper right corners, and points towards the roadway. Therefore, the peak intensity received by the roof gradually increases and reaches its maximum. Especially when the deflection angle is 45° and 60°, the peak propagation direction of the P-wave is exactly from the source to the roadway. So the corresponding plastic area around the roadway is the largest, the displacement and deformation of roof is the largest, and the degree of damage is the most severe (in Figure 17). When the angle between the fault plane and vertical direction increases to 90°, the peak value of the P-wave propagates vertically up and down and begins to deviate from the position of the roadway. Therefore, the disturbance intensity received by the roadway begins to decrease, and the corresponding displacement and plastic area are also reduced, resulting in the smaller degree of damage. Observing each curve simultaneously, a corresponding peak of the S-wave (or P-wave) will be generated when the P-wave (or S-wave) reaches its peak. This is because the P-wave and S-wave will reflect and convert into each other after entering the roadway. In summary, it is evident that the orientation of the fault plane dictates the radiation pattern of the seismic source, which is also related to the relative spatial position between the roadway and the seismic source. For a purely tensile seismic source, the intensity of the radiated P-waves exceeds that of the S-waves, with the P-wave peaks occurring on either side of the fault plane, perpendicular to it. The roadway is situated at an approximately 45° angle from the lower right corner of the seismic source. Hence, when the fault plane is oriented at a 45° deflection angle, the line connecting the roadway and the seismic source is perpendicular to the fault plane. Consequently, the roadway experiences the maximum disturbance intensity from the P-waves, making it most susceptible to destruction and instability.
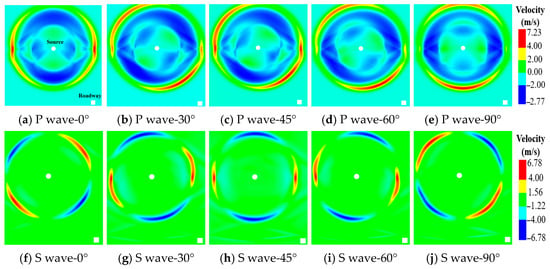
Figure 16.
Velocity propagation nephogram of P-waves and S-waves with different angles of rupture.


Figure 17.
Evolution of failure elements, displacement and stress around roadway with different angles of rupture.
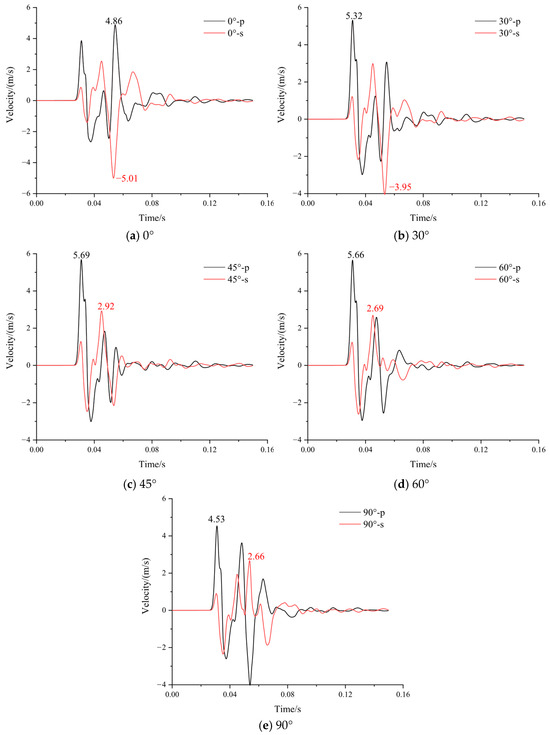
Figure 18.
Variation curves of P-waves and S-waves at point A with different angles of rupture.
5.4. The Dominant Frequency of the Source Stress Waves
The magnitude of the seismic source’s rupture influences the dominant frequency of the radiated stress waves. Generally, as the scale of the seismic fault plane increase, the dominant frequency of the source gradually diminishes. To investigate the influence of the frequency of seismically radiated stress waves on their propagation and the stability of the roadway, stress waves with different dominant frequencies were simulated by altering the stress application period of the seismic source, with periods set at 10, 20, 30, 40, and 50 Hz, respectively, as depicted in Figure 19.
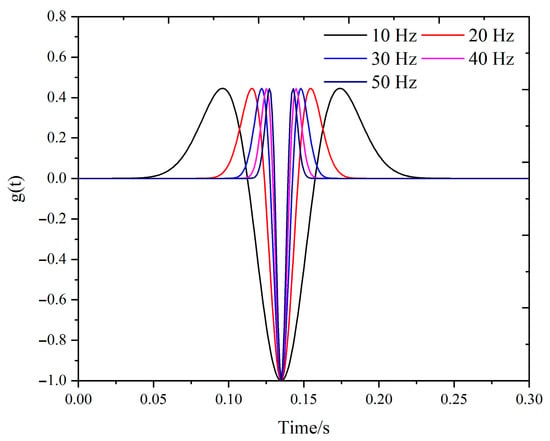
Figure 19.
Ricker wavelet source time function with different frequencies and t0 = 0.15 s.
As Figure 20 shows, as the frequency increases, the propagation patterns and spatial distribution characteristics of P-waves and S-waves remain unchanged. However, the region of peak velocity concentration noticeably diminishes. This is attributed to the fact that within the same period, stress waves of lower frequency have greater momentum, thereby inducing a larger perturbation range in the medium. Consequently, the extent of roadway damage progressively expands as the frequency decreases. As the frequency decreases from 50 Hz to 40 Hz and 30 Hz, there is a noticeable increase in the number of failure elements in the roof and both sides of roadway, while the floor shows no significant changes. As the frequency is further reduced to 20 Hz and 10 Hz, the increase in failure elements is most pronounced in the roof and left side, with only a slight increase on the right side, and almost no change in the floor. Given that the initial stress applied to generate stress waves of varying frequencies from the seismic source is identical, it can be inferred that the attenuation of the excited stress waves decreases progressively with the reduction in frequency.


Figure 20.
Evolution of P-waves, S-waves and failure elements around roadway with different frequencies.
Upon examining the number of failure elements during various stages of stress wave disturbance, as Figure 21 shows, when incident waves with higher frequencies (30–50 Hz) are applied, the increase in failure elements predominantly occurs during the P-wave peak duration, with minimal changes during the S-wave peak duration. This indicates that the failure is almost entirely induced by P-wave perturbations during this period. On the contrary, as the frequency decreases to 20 and 10 Hz, there is a significant increase in the number of failure elements during the peak duration of the S-wave, indicating an increase in the contribution of S-waves to roadway damage. In summary, low-frequency stress waves are characteristic by high energy input and low attenuation within the same period, and the contribution of S-waves is significant, making it more likely to induce failure and instability in the roadway.
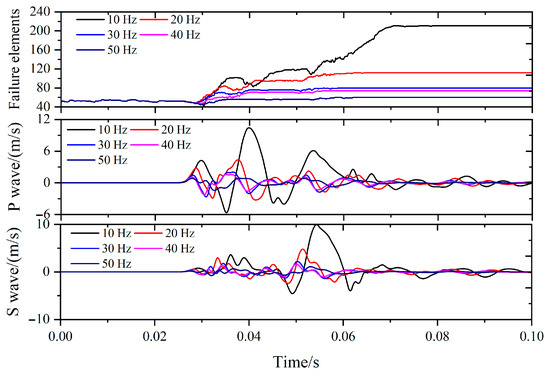
Figure 21.
Variation curves of failure elements, P-waves and S-waves in point A with different frequencies.
6. Conclusions
Based on the engineering background of the roadway rockburst induced by mining-induced tremors in the Xinjulong coal mine, the spatial wavefield radiation mode of mining-induced tremor and the dynamic response process of a roadway were studied using Flac2D 6.0 numerical simulation software. The focus was on discussing the influence of seismic source characteristics on roadway stability. The research findings demonstrate that the strategic optimization of roadway orientation (to maintain non-orthogonal alignment with potential fault planes), combined with the installation of low-frequency damping systems in surrounding rock formations, can effectively mitigate mining-induced seismic risks to underground roadways. The main conclusions are as follows:
Based on the theory of seismology, the formula for the displacement field of seismic source radiation stress waves composed of moment tensors with different rupture forms has been derived. A simulation method that can truly reflect the characteristics of the seismic source radiation wavefield is proposed. In the method, the seismic source is approximated as a circle and then corresponding normal and tangential stresses are applied on the circular surface based on the actual inversion wavefield expression to generate P-waves and S-waves. The simulated wavefield distribution of the seismic source is consistent with theoretical calculations, indicating the rationality of this method;
The simulation results indicate that the strong mining-induced tremor was a tensile failure, with the P-wave having the highest intensity in the horizontal direction and the lowest intensity in the vertical direction, and repeatedly exerting tensile and compressive effects on the medium along the propagation direction, causing changes in the principal stress. The S-wave has the highest intensity at the four corner points and the lowest intensity in the horizontal and vertical directions, which exerts compressive shear effects on the disturbance area by moving in opposite directions at opposite velocities, resulting in changes in the principal stress. The arrival of P-waves in the roadway is earlier than that of S-waves, and the damage to the roadway mainly occurs during the peak period of P-waves. Following the arrival of the S-wave’s peak, the stability of the roadway remains essentially unchanged;
The effects of seismic source characteristics, encompassing rupture patterns, seismic energy, fault plane angles, and dominant frequencies of stress wave, on the radiation characteristics of stress waves and roadway stability are individually probed. The results indicate that the radiation wavefield characteristics of different rupture modes vary greatly, with significant differences in the intensities of P-waves and S-waves reaching the roadway. As the energy released by the seismic source increases, the extent of roadway damage intensifies, shifting from the initial P-wave dominance to a joint influence of both P-waves and S-waves. The fault plane angle predominantly influences the wavefield radiation characteristics, particularly at 45° and 60° angles, where the maximum radiation of P-waves is directed towards the roadway, causing the most severe damage. Furthermore, with an increase in the dominant frequency of stress waves, the stress waves radiated by the source are more susceptible to energy dissipation during propagation, resulting in less kinetic energy reaching the roadway, and reduced disturbance and damage.
This study employs two-dimensional plane strain simulations with the Mohr–Coulomb failure criterion, subject to certain theoretical limitations. The 2D framework cannot fully capture three-dimensional source rupture directivity and stress wave radiation patterns, thus potentially underestimating wavefield anisotropy. The constitutive model neglects dynamic damage accumulation, rate dependence, and nonlinear softening behaviors, limiting its accuracy in high-stress dynamic failure predictions. Future work will employ 3D numerical modeling to characterize source–tunnel spatial effects, perform dynamic rock testing for nonlinear constitutive model calibration, and validate mechanisms through field monitoring, ultimately enhancing both theoretical understanding and engineering practice.
Author Contributions
Methodology, Z.H.; validation, Z.H.; formal analysis, X.X.; investigation, X.X.; data curation, H.Z.; writing—original draft, X.X.; writing—review and editing, X.X., Z.H. and H.Z.; visualization, X.X.; supervision, H.Z.; project administration, Z.H. and H.Z. All authors have read and agreed to the published version of the manuscript.
Funding
This research work is supported by the Natural Science Foundation of Hebei province (E2025209168), the Scientific Re-search Project of Colleges and Universities in Hebei Province (BJ2025184) and Sponsored by Natural Science Foundation of Henan (242300420353). All the support is gratefully acknowledged. The APC was funded by Xinke Xiao.
Data Availability Statement
The datasets used and analyzed during the current study are available from the corresponding author on reasonable request.
Conflicts of Interest
The authors declare no conflicts of interest.
References
- Cielik, J.; Burtan, Z.; Chlebowski, D.; Zorychta, A. Geomechanical analysis of location and conditions for mining-induced tremors in LGOM copper mines. J. Sustain. Mining. 2017, 16, 94–103. [Google Scholar] [CrossRef]
- Lu, C.P.; Liu, Y.; Liu, G.J.; Zhao, T.B. Stress evolution caused by hard roof fracturing and associated multi-parameter precursors. Tunn. Undergr. Space Technol. 2019, 84, 295–305. [Google Scholar] [CrossRef]
- He, Z.L.; Lu, C.P.; Zhang, X.F.; Guo, Y.; Meng, Z.H.; Xia, L. Numerical and field investigations of rockburst mechanisms triggered by thick-hard roof fracturing. Rock Mech. Rock Eng. 2022, 55, 6863–6886. [Google Scholar] [CrossRef]
- Zhu, X.J.; Qi, Q.X.; Xiao, Y.H. Theoretical study and application of energy extreme value discrimination method of softening zone for bursting hazard. Sci. Prog. 2022, 105, 00368504221145865. [Google Scholar] [CrossRef] [PubMed]
- Hou, Z.; Dou, L.; Li, D.; Zhang, R. The Research of Rock Burst Damage of Roadway Surrounding Rock Under the Static and Dynamic Load. Phys. Numer. Simul. Geotech. Eng. 2015, 19, 17–25. [Google Scholar]
- He, J.; Dou, L.M.; Mu, Z.L.; Cao, A.Y.; Gong, S.Y. Numerical simulation study on hard-thick roof inducing rock burst in coal mine. J. Cent. South Univ. 2016, 23, 2314–2320. [Google Scholar] [CrossRef]
- Wang, Z.Y.; Dou, L.M.; He, J.; Cao, A.Y.; Li, X.W.; Li, P.B.; Wu, C. Experimental investigation for dynamic instability of coal-rock masses in horizontal section mining of steeply inclined coal seams. Arab. J. Geosci. 2020, 13, 737. [Google Scholar] [CrossRef]
- Wang, L.H.; Cao, A.Y.; Dou, L.M.; Guo, W.H.; Zhang, Z.Y.; Zhi, S.; Zhao, Y.X. Numerical simulation on failure effect of mining-induced dynamic loading and its influential factors. Saf. Sci. 2019, 113, 372–381. [Google Scholar] [CrossRef]
- Li, C.C.; Zhao, T.; Zhang, Y.; Wan, W. A study on the energy sources and the role of the surrounding rock mass in strain burst. Int. J. Rock Mech. Min. Sci. 2022, 154, 105–114. [Google Scholar] [CrossRef]
- Lee, S.M.; Park, B.S.; Lee, S.W. Analysis of rockbursts that have occurred in a waterway tunnel in Korea. Int. J. Rock Mech. Min. Sci. 2004, 41, 911–916. [Google Scholar] [CrossRef]
- Chen, G. Mechanism Research of the Maximum Horizontal Stress on Rockburst and Its Application. Master’s Thesis, China University of Mining and Technology, Xuzhou, China, 2009. [Google Scholar]
- Wu, J.; Liu, Q.; Zhang, X.; Zhou, C.; Yin, X.; Xie, W.; Liang, X.; Huang, J. Attenuation characteristics of impact-induced seismic wave in deep tunnels: An in situ investigation based on pendulum impact test. J. Rock Mech. Geotech. Eng. 2022, 14, 494–504. [Google Scholar] [CrossRef]
- Yang, J.H.; Sun, J.S.; Jia, Y.S.; Yao, Y.K. Energy Generation and Attenuation of Blast-Induced Seismic Waves under In Situ Stress Conditions. Appl. Sci. 2022, 12, 9146. [Google Scholar] [CrossRef]
- Madenova, Y.; Suorineni, F.; Mukhamedyarova, Z. Seismic Source Wave Propagation Analysis Using Laboratory AE Monitoring System. In Proceedings of the 57th U.S. Rock Mechanics/Geomechanics Symposium, Atlanta, Georgia, 25–28 June 2023. [Google Scholar]
- Zhu, J.B.; Li, Y.S.; Qi, P.; Deng, X.F.; Gao, M.Z.; Zhang, J.G. Stress wave propagation across jointed rock mass under dynamic extension and its effect on dynamic response and supporting of underground opening. Tunn. Undergr. Space Technol. 2021, 108, 103648. [Google Scholar] [CrossRef]
- Vidale, J.E. Influence of focal mechanism on peak accelerations of strong motions of the Whittier Narrows, California, earthquake and an aftershock. J. Geophys. Res. Solid Earth 1989, 94, 9607–9613. [Google Scholar] [CrossRef]
- Dubiński, J.; Stec, K.; Mutke, G. Relationship between the focal mechanism of magnitude ML 3.3 seismic event induced by mining and distribution of peak ground velocity. E3S Web Conf. 2017, 24, 01003. [Google Scholar] [CrossRef]
- Lv, J.K.; Wan, Z.J.; Zhang, Y.; Wang, J.H.; Yan, W.Z.; Xiong, L.C. Effect of multi-factor dynamic loading on gob-side entry driving during longwall face extraction: A case study. Bull. Eng. Geol. Environ. 2022, 81, 409. [Google Scholar] [CrossRef]
- Xu, J.K.; Zhou, R.; Song, D.Z.; Li, N.; Zhang, K.; Xi, D. Deformation and damage dynamic characteristics of coal-rock materials in deep coal mines. Int. J. Damage Mech. 2019, 28, 58–78. [Google Scholar] [CrossRef]
- Yuan, Z.H.; Cao, Z.G.; Cai, Y.Q.; Geng, X.Y.; Wang, X.Q. An analytical solution to investigate the dynamic impact of a moving surface load on a shallowly buried tunnel. Soil Dynam. Earthq. Eng. 2019, 126, 10581. [Google Scholar] [CrossRef]
- Li, D.Y.; Xiao, P.; Han, Z.Y.; Zhu, Q.Q. Mechanical and failure properties of rocks with a cavity under coupled static and dynamic loads. Eng. Fract. Mechan. 2020, 225, 106195. [Google Scholar] [CrossRef]
- Hashash, Y.; Hook, J.J.; Schmidt, B.; Yao, J. Seismic design and analysis of underground structures. Tunn. Undergr. Space Technol. 2001, 16, 247–293. [Google Scholar] [CrossRef]
- Zhang, Q.; Zou, J.; Wang, J.; Jiao, Y.Y.; Xu, H. Mechanism of coal bump induced by joint slipping under static and dynamic stresses in graben structural area. Acta Geotech. 2024, 19, 347–361. [Google Scholar] [CrossRef]
- Song, J.F.; Lu, C.P.; Zhang, X.F.; Song, C.H.; Zhou, J.; Zhang, Z.G. Application of Bayesian method for mining-induced tremors: A case study of the Xinjulong coal mine in China. Int. J. Rock Mech. Min. Sci. 2024, 174, 105635. [Google Scholar] [CrossRef]
- Sainoki, A.; Mitri, H.S. Dynamic modelling of fault slip induced by stress waves due to stope production blasts. Rock Mech. Rock Eng. 2016, 49, 165–181. [Google Scholar] [CrossRef]
- Mu, Z.L.; Liu, G.J.; Yang, J.; Zhao, Q.; Javed, A.; Gong, S.K.; Cao, J.L. Theoretical and numerical investigations of floor dynamic rupture: A case study in Zhaolou Coal Mine, China. Saf. Sci. 2019, 114, 1–11. [Google Scholar] [CrossRef]
- Lysmer, J.; Kuhlemeyer, R.L. Finite dynamic model for infinite media. J. Eng. Mech. Div. 1969, 95, 859–878. [Google Scholar] [CrossRef]
- Raffaldi, M.J.; Loken, M.C. Rock mass modeling approach for simulating wave propagation, rock fracture, and rock ejection. In Proceedings of the 50th US Rock Mechanics Symposium, Houston, TX, USA, 26–29 June 2016; American Rock Mechanics Association: Alexandria, VA, USA, 2016. [Google Scholar]
Disclaimer/Publisher’s Note: The statements, opinions and data contained in all publications are solely those of the individual author(s) and contributor(s) and not of MDPI and/or the editor(s). MDPI and/or the editor(s) disclaim responsibility for any injury to people or property resulting from any ideas, methods, instructions or products referred to in the content. |
© 2025 by the authors. Licensee MDPI, Basel, Switzerland. This article is an open access article distributed under the terms and conditions of the Creative Commons Attribution (CC BY) license (https://creativecommons.org/licenses/by/4.0/).