1. Introduction
When atoms, molecules, or solid targets interact with intense laser fields, they exhibit a variety of strong-field phenomena such as tunneling ionization [
1], above-threshold ionization [
2], and high-order harmonic generation (HHG) [
3,
4]. Among these phenomena, HHG significantly enhances the frequency of the driving laser by factors of several hundred to several thousand. It has been widely applied in studying ultrafast molecular dynamics [
5,
6], imaging molecular orbitals [
7], and generating attosecond pulses [
8,
9,
10]. By manipulating the polarization state of the driving laser, it is possible to generate elliptically and circularly polarized harmonics and ultrashort pulses [
11,
12], which has significantly advanced research in X-ray magnetic circular dichroism, ultrafast spin dynamics, and chiral-sensitive molecular spectroscopy [
13,
14]. As a result, the pursuit of circularly polarized harmonics and attosecond pulses remains an active and evolving frontier in strong-field physics.
The mechanism of HHG is well described by the semiclassical three-step model [
15]. In this model, valence electrons first undergo tunnel ionization under a strong laser field. The liberated electrons are then accelerated by the field, and may subsequently recollide with the parent ion, emitting high-energy photons. This process naturally leads to strong linearly polarized harmonics when driven by a linearly polarized field. In contrast, circularly polarized fields significantly reduce the likelihood of electron recollision due to the lateral drift of ionized electrons, thus suppressing HHG efficiency. To overcome this limitation, counter-rotating bicircular fields have been proposed, where a circularly polarized fundamental field at frequency
is combined with a second-harmonic field at
that rotates in the opposite direction [
16,
17]. This scheme enables the generation of circularly polarized harmonics with moderate efficiency [
18,
19], though challenges remain in achieving uniform polarization and broad spectral bandwidths for attosecond pulse synthesis.
To address these limitations, various strategies have been developed. Advances have demonstrated the generation of elliptically or circularly polarized attosecond pulses using different bicircular field schemes. Dorney et al. enhanced the intensity of a single-helicity harmonic component by adjusting the intensity ratio of the bicircular fields, producing pulses with an ellipticity of 0.44 [
20]. Huang et al. achieved polarization control of isolated extreme ultraviolet pulses by tuning the ellipticity of two counter-rotating circularly polarized drivers, enabling a linear mapping from the laser to harmonic ellipticity and synthesizing a 190 as pulse with 33 eV photon energy [
21]. Li et al. showed that applying same-helicity bicircular fields to helium atoms suppressed Coriolis forces, enhancing recollision and enabling the generation of a 645 as pulse with 0.88 ellipticity [
22]. Madhani et al. simulated HHG from Cl
2 molecules under a two-color polarization gating scheme, optimizing laser parameters to generate a 648 as pulse with an ellipticity of 0.92 near the cutoff region [
23].
When the target is a molecule or solid rather than an atom, the HHG spectra typically exhibit richer structures due to higher electron density and multi-center characteristics [
24]. Wu et al. solved the time-dependent Schrödinger equation under a periodic potential and identified a two-plateau structure in solid-state HHG [
25]. Liu et al. showed that HHG efficiency in solids strongly depends on laser ellipticity, with the normalized plateau intensity following a Gaussian decay [
26]. You et al. experimentally demonstrated that interatomic potentials significantly influence harmonic yields in MgO crystals [
27]. Benzene, a typical aromatic hydrocarbon, exhibits harmonic spectra in circularly polarized fields that follow the selection rule of orders
(
). At low intensities, a single plateau appears, consistent with the recollision model, while higher intensities induce bound-state transitions and generate multiple plateaus [
28,
29]. Our previous work demonstrated circularly polarized isolated attosecond pulses of 108 as from benzene [
30]. Extending this to larger ring molecules, cyclo[18]carbon (C
18) was found to generate stronger circularly polarized high-order harmonics and produce isolated attosecond pulses [
31].
In this work, we investigate ethylbenzene (C
8H
10) and toluene (C
7H
8) to explore how ethyl and methyl substituents on the benzene (C
6H
6) ring influence high-harmonic generation. Ethylbenzene and toluene can be regarded as benzene derivatives in which a hydrogen atom is replaced by an ethyl or a methyl group, respectively. In toluene, the methyl group is coplanar with the benzene ring, whereas in ethylbenzene, the sp
3-hybridized carbon atom of the ethyl group lies out of the molecular plane. While both molecules retain the characteristic aromatic ring, the substituents markedly alter their physical and electronic properties. Using time-dependent density functional theory (TDDFT) [
32,
33], we simulate the HHG spectra of ethylbenzene in circularly polarized laser fields and compare them with those of toluene and benzene, focusing on the effects of laser intensity and wavelength.
2. Materials and Methods
The open-source code
octopus (version 9.2) was employed for all simulations, offering real-space and time-dependent modeling of strong-field dynamics [
34]. The time-dependent density functional theory has been extensively employed to investigate HHG in molecules subjected to intense laser fields [
32,
33]. It has demonstrated strong agreement with experimental results when applied to the C
6H
6 molecule [
35], as well as more complex solid-state systems.
According to the Runge–Gross theorem [
36], there exists a unique one-to-one correspondence between the time-dependent external potential and the single-particle density for a many-electron system evolving from a given initial condition. Under the dipole approximation and using the length gauge, the evolution of the Kohn–Sham (KS) orbitals
driven by circularly polarized laser fields is governed by the time-dependent Kohn–Sham equations (atomic units are used throughout):
Here, i denotes the orbital index, N is the number of occupied Kohn–Sham orbitals, and the electron density is defined as .
The Kohn–Sham potential
, which is a functional of
, consists of four terms:
The exchange-correlation potential
, accounting for many-body effects beyond mean field, is modeled using the generalized gradient approximation (GGA) with the Perdew–Burke–Ernzerhof (PBE) formulation [
37]. The Hartree potential
describes the classical electron–electron repulsion, while
represents the interaction between electrons and ions, approximated by Troullier–Martins norm-conserving pseudopotentials [
38] in the Kleinman-Bylander scheme [
39]. The term
arises from the interaction with the external circularly polarized laser field, given by
, where
Here, is a Gaussian envelope that shapes the laser pulse in time. is the electric field amplitude, is the frequency, and is the carrier-envelope phase (CEP).
The time-dependent Kohn–Sham orbitals are propagated on a real-space grid using a real-time evolution scheme. To preserve time-reversal symmetry, we adopt the approximated enforced time-reversal symmetry (AETRS) approach [
40], with a time step of 0.00192 fs.
To avoid spurious reflections of the electronic wave packet from the simulation box boundaries, a complex absorbing potential (CAP) is applied [
41]:
where
Å is the width and
Å is the strength of the absorbing region. The parameter
denotes the distance from the origin (the center of the simulation box) to the absorbing boundary, representing the maximum extent to which the electron can propagate during the simulation.
The harmonic spectra [
30] are obtained by Fourier transforming the time-dependent dipole acceleration
:
In the above equation, T represents the pulse duration.
The acceleration
is computed as
The dipole acceleration components along the
x and
z directions are expressed as
By applying Fourier transformation to
, we obtain
The harmonic ellipticity is then calculated as follows [
42]:
with
.
Based on the time-dependent wavefunction obtained from TDDFT, the probability current density is evaluated as
Equation (
10) expresses the probability flow in the two-dimensional
plane.
The components of the probability current are given by
Equation (
11) shows that the current density originates from the interference between the wavefunction and its spatial derivative.
In practice, the spatial derivatives are evaluated using the central finite-difference approximation,
Equations (
12) and (
13) provide the numerical scheme applied in our calculation.
From these components, we further obtain the magnitude of the probability current density,
and its direction angle,
Equations (
14) and (
15) are used to characterize both the strength and the orientation of the probability current at each spatial grid point in the
plane. This provides the basis for analyzing electron dynamics and emission properties in high-order harmonic generation.
3. Results and Discussion
We employed the time-dependent density functional theory to simulate the HHG processes of ethylbenzene, toluene, and benzene molecules under intense laser fields. Prior to the time-dependent simulations, we calculated the ground-state electronic structures of the three molecules using density functional theory (DFT). The simulation box was set as a parallelepiped in Cartesian coordinates, with extents of ±52.9 Å (1 a.u. = 0.529 Å), ±15.87 Å, and ±52.9 Å along the
x,
y, and
z axes, respectively. The spatial grid spacing was set to 0.2116 Å. The center of the benzene ring in each molecule was placed at the origin, and the molecular ring structures were all aligned within the
x-
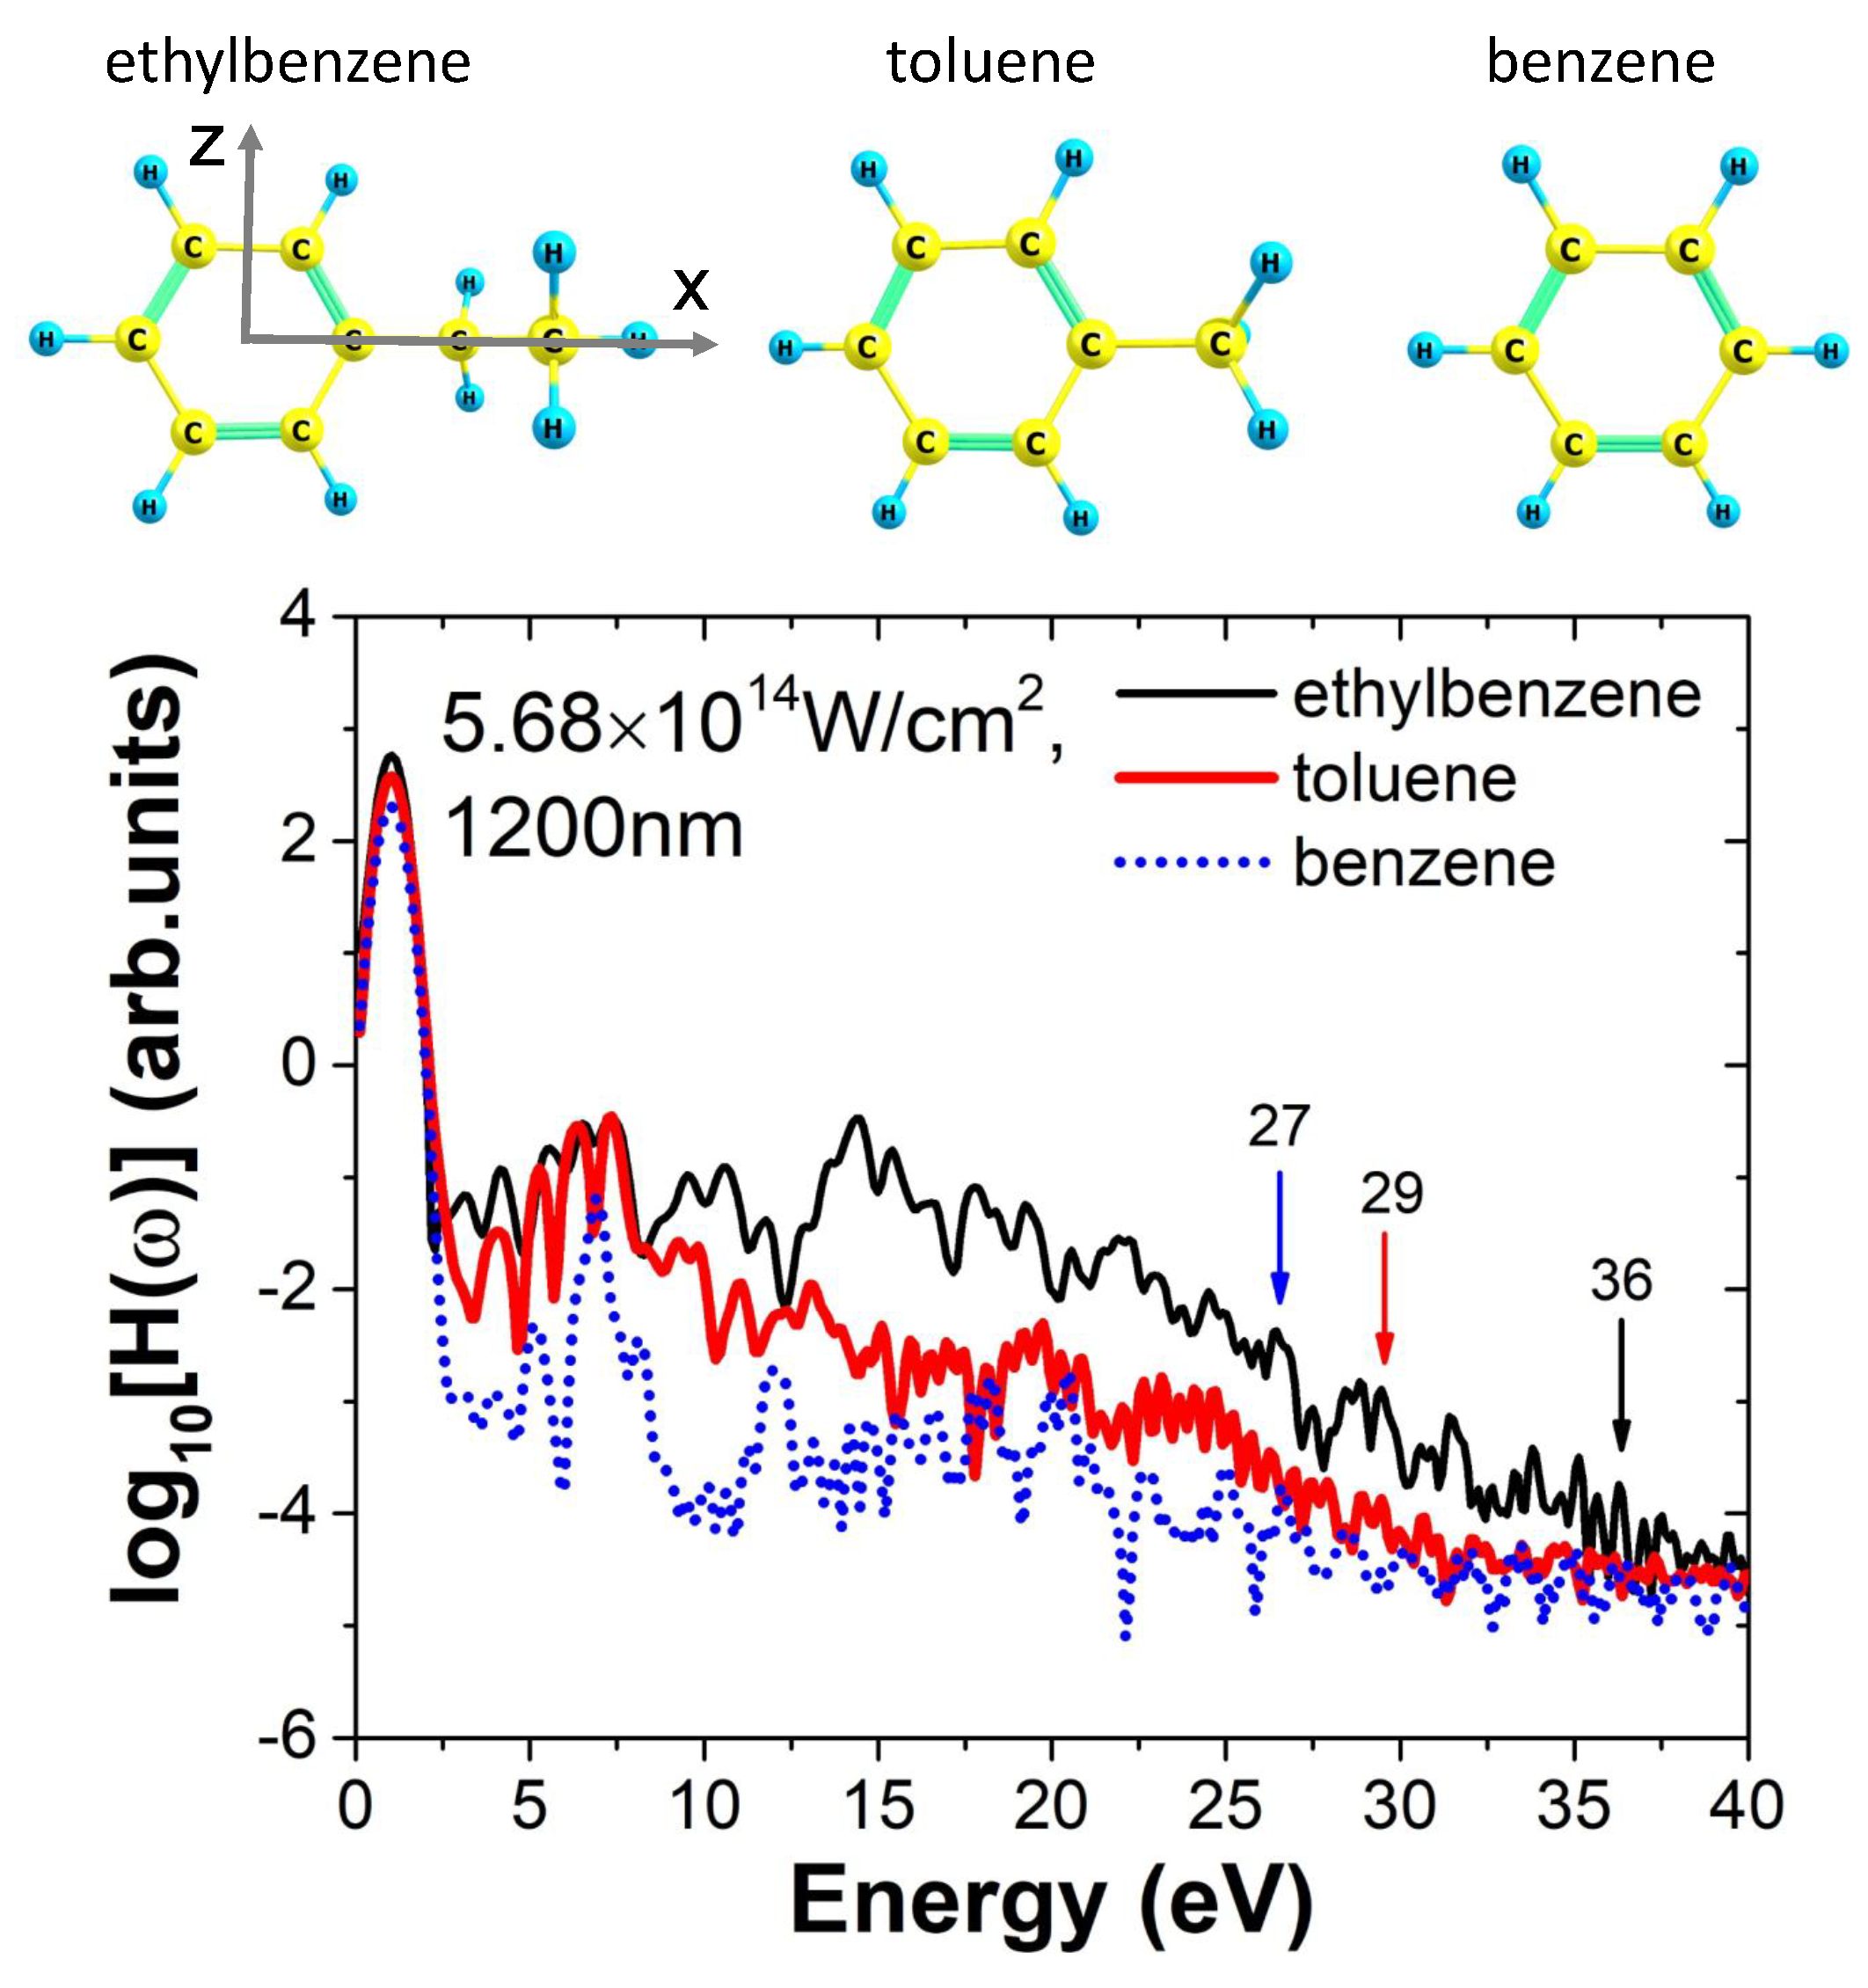
z plane. The ball-and-stick models of the three molecules are shown in the top row of
Figure 1. The molecular lengths along the
x direction were found to be 7.17 Å, 6.56 Å, and 4.29 Å for ethylbenzene, toluene, and benzene, respectively. The calculated ionization potentials of the molecules are 8.654 eV, 8.976 eV, and 9.656 eV, respectively, indicating that they have very similar ionization energies.
The time-dependent simulations were carried out using a circularly polarized laser pulse with a Gaussian envelope. The laser wavelength was 1200 nm, the peak intensity was
W/cm
2, the total pulse duration was 13.2 fs, and the full width at half maximum (FWHM) was 7.92 fs. The time step for propagation was 0.00192 fs. The polarization plane of the laser field was set in the
x-
z plane, coplanar with the molecular benzene ring. The resulting high-order harmonic spectra for ethylbenzene (black solid line), toluene (red dashed line), and benzene (blue dotted line) are presented in
Figure 1. By examining the three harmonic spectra, it is evident that only the spectra of toluene and benzene exhibit a clear and typical plateau–cutoff structure, while the spectrum of ethylbenzene tends to continuously decay in intensity, making it difficult to determine a precise cutoff energy. The selection rules [
43] for harmonic generation are determined by the symmetry relationship between the incident circularly polarized field and the molecular systems. For the circularly polarized laser field, which exhibits
symmetry in its
x-
z plane Lissajous projection (
), the allowed harmonics follow the
selection rule, where
N represents the greatest common divisor (GCD) between the field symmetry (
) and the molecular Lissajous symmetry (
). Specifically, ethylbenzene and toluene, both possessing
molecular symmetry (
), generate harmonics that obey the
rule (since
). In contrast, benzene, with its higher
molecular symmetry (
), produces harmonics following the
selection rule (
). These symmetry-derived selection rules provide a fundamental framework for understanding the characteristic harmonic orders observed in our study. However, the harmonic orders of all three molecules are not isolated; rather, they display many scattered minor peaks. This contradicts our previous findings, where benzene under circularly polarized fields showed a well-defined cutoff [
44,
45,
46] and harmonic orders consistent with selection rules. The main reason lies in the current study’s use of a relatively long incident laser wavelength of 1200 nm. It is well known that with increasing wavelength, electron recollision becomes more difficult under circular polarization, making the generation of high-frequency harmonics more challenging, and consequently, the harmonic intensity drops significantly. This effect is further enhanced by the relatively high laser intensity used in this study. Since the electron’s quiver radius (
) in the laser field is much larger than the spatial extent of the molecule’s ground-state electron density (≈5.29
), the resulting harmonic spectra deviate from the conventional cutoff laws and selection rules. However, when the laser intensity is reduced, a clear cutoff energy for ethylbenzene can be observed, as shown in the following figure for a laser wavelength of 1200 nm and intensity of
. Similarly, shortening the wavelength leads to harmonics that partially satisfy the selection rules, as illustrated in the following figures for benzene with a laser intensity of
at wavelengths of 800 nm, 400 nm, and 200 nm. In contrast, our previous work involved conditions where the quiver radius was smaller than the spatial region of the ground-state electron density, thus the harmonic spectra conformed to the selection rules (see
Figure 1 in Ref. [
30] for details). Moreover, unlike model atoms or small molecules in circularly polarized fields, harmonic generation in large cyclic molecules necessarily involves multi-orbital effects, which may also account for the discrepancy with earlier results. In this work, our focus is primarily on the harmonic intensity under long-wavelength and high-intensity conditions, and we therefore emphasize the mechanisms behind the generation of strong harmonics in such regimes. From the observation of the three curves in
Figure 1, it is evident that the cutoff positions of the high-order harmonic spectra for ethylbenzene, toluene, and benzene are approximately located at 36 eV, 29 eV, and 27 eV, respectively. Across the entire spectral range, ethylbenzene exhibits the highest harmonic intensity, followed by toluene, while benzene shows the weakest emission. The maximum intensity difference occurs around 15 eV, where the harmonic yield of ethylbenzene exceeds that of benzene by nearly two orders of magnitude. This observation reveals an interesting trend: along the
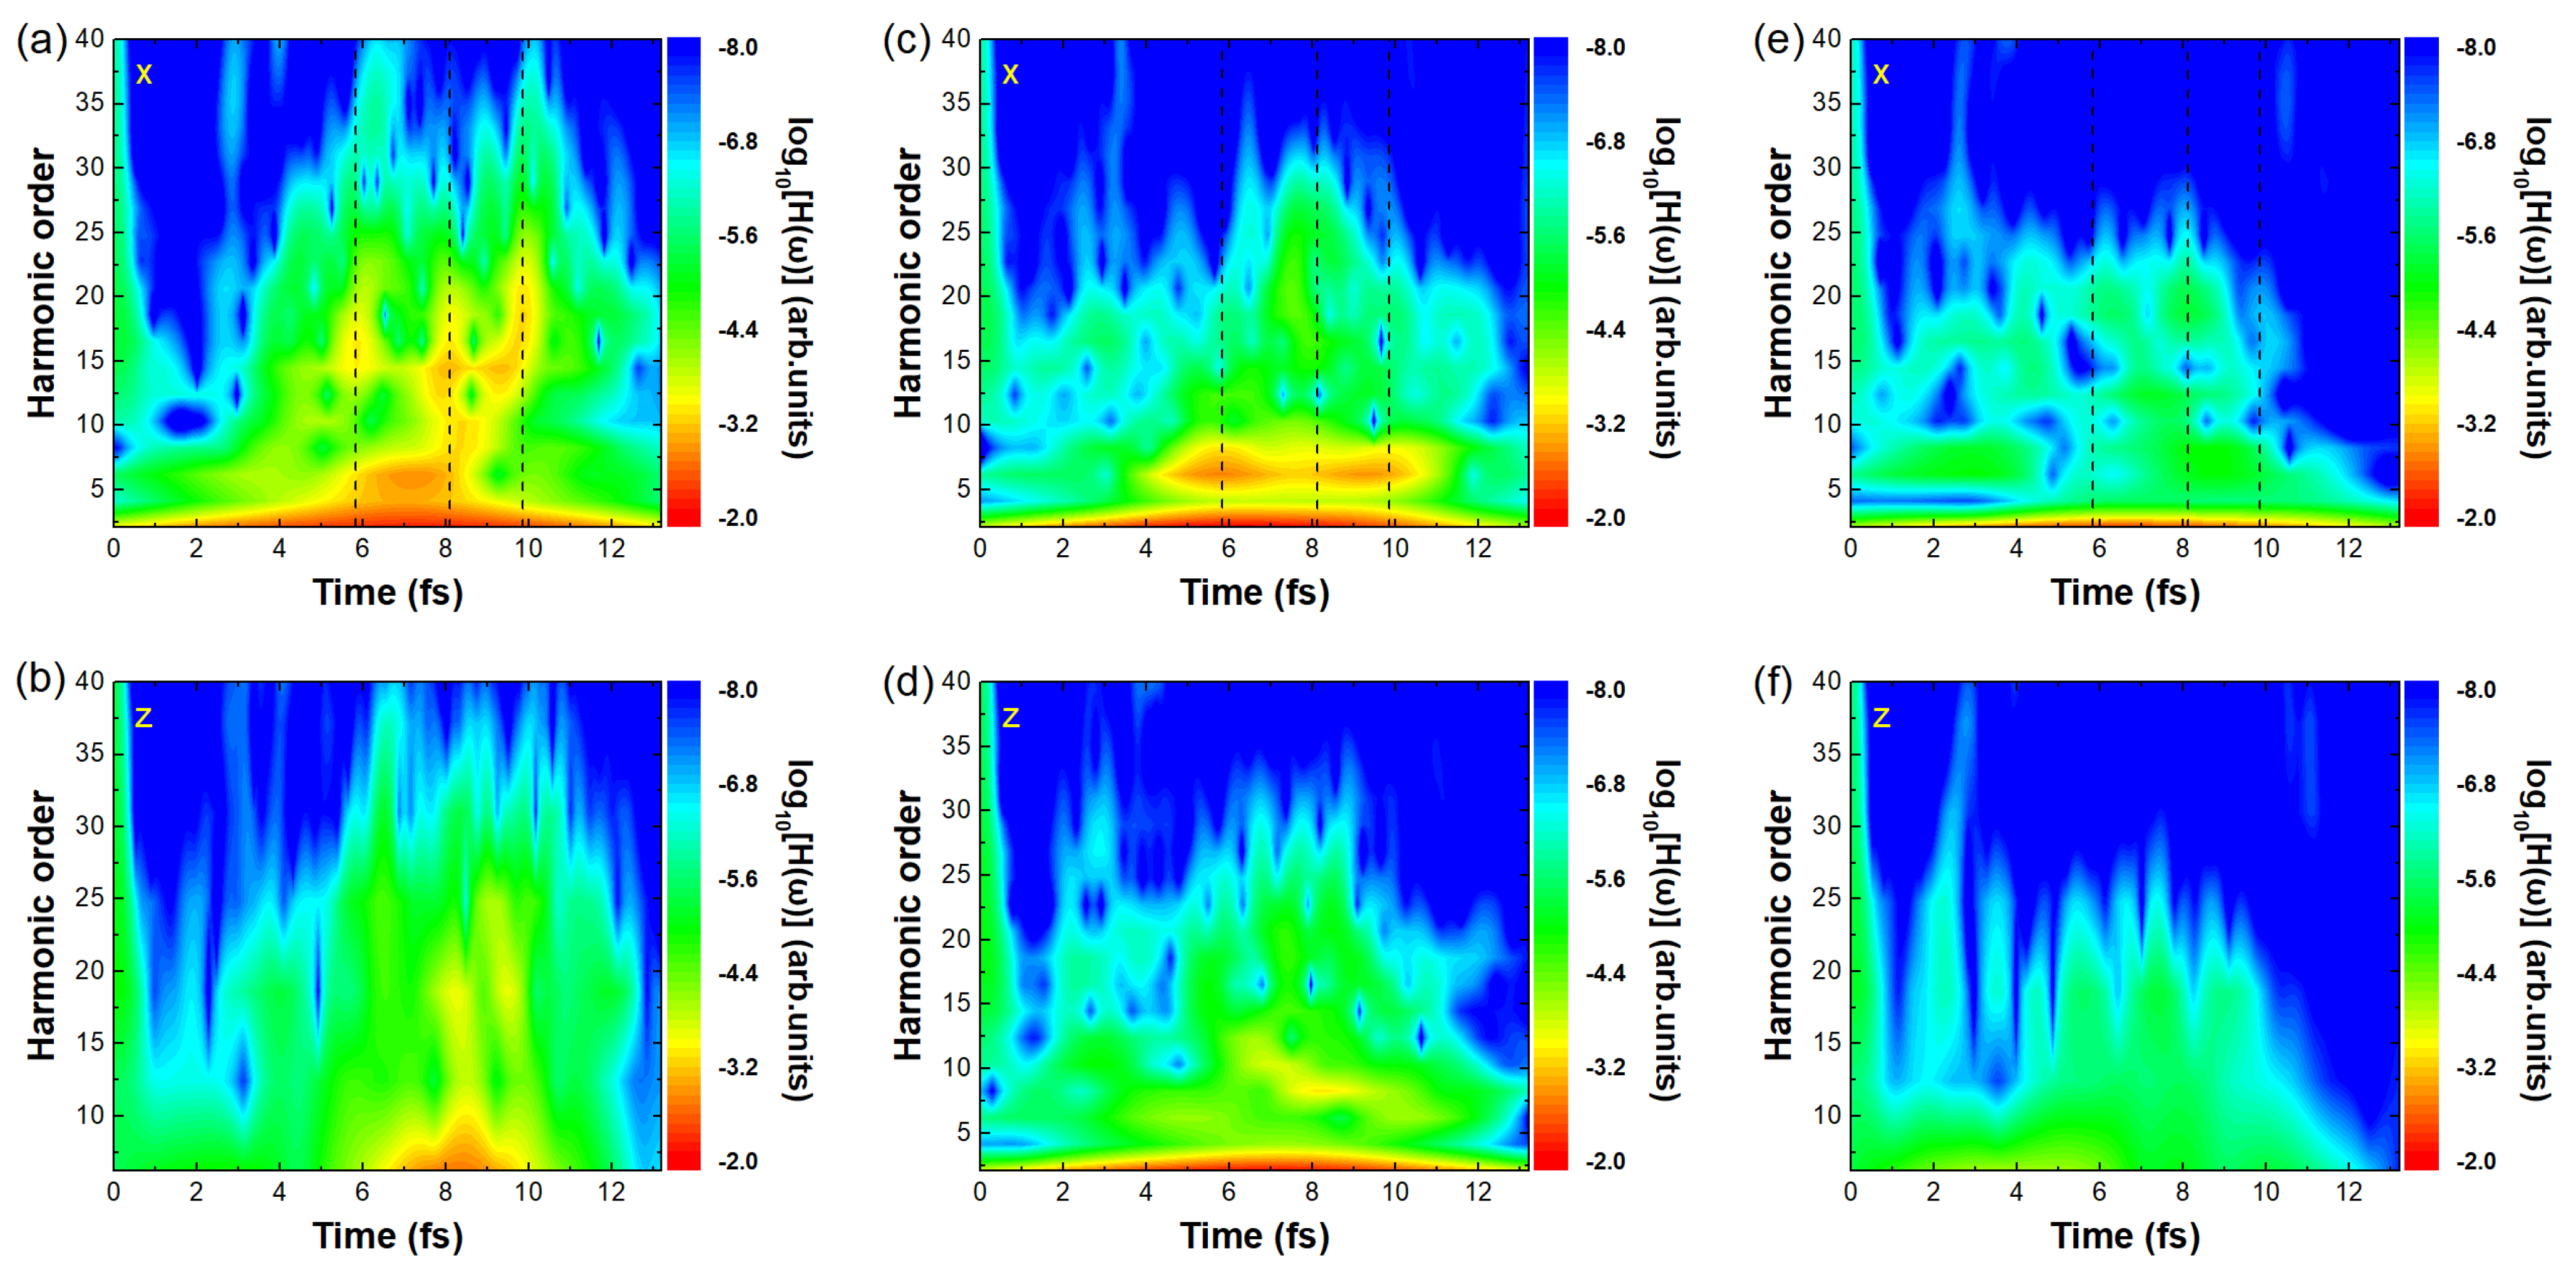
x-axis direction, the molecule with a larger spatial extent (such as ethylbenzene) tends to exhibit both a higher cutoff energy and stronger harmonic intensity. To better understand the physical origin of this phenomenon, we analyzed the time-dependent evolution of the electron wave packets in the three molecules under the influence of the laser field. In order to closely examine the electron density distributions of the wave packets at the moment of harmonic emission, it is first necessary to perform a time-frequency analysis to select a representative emission time. The results of the time-frequency analysis are shown in
Figure 2.
Figure 2a,c,e and b,d,f show the time-frequency analysis of ethylbenzene, toluene, and benzene in the
x and
z directions, respectively. The horizontal axis denotes the laser pulse duration, the vertical axis the harmonic energy, and the color scale the harmonic intensity. In all three molecules, the
x direction exhibits stronger signals than the
z direction, indicating that harmonic emission is mainly governed by the
x component. For ethylbenzene [
Figure 2a], three bright stripes are observed at 4.81 fs, 8.16 fs, and 9.88 fs, corresponding to the principal emission times and marked with black dashed lines. Among these, 8.16 fs is chosen as a representative moment for analyzing the evolution of the ionized electron density [
Figure 3d]. For toluene and benzene [
Figure 2c,e], the same three moments can also be regarded as the main emission times, and 8.16 fs is likewise selected as the representative time, with the corresponding results shown in
Figure 3h,l.
As shown in
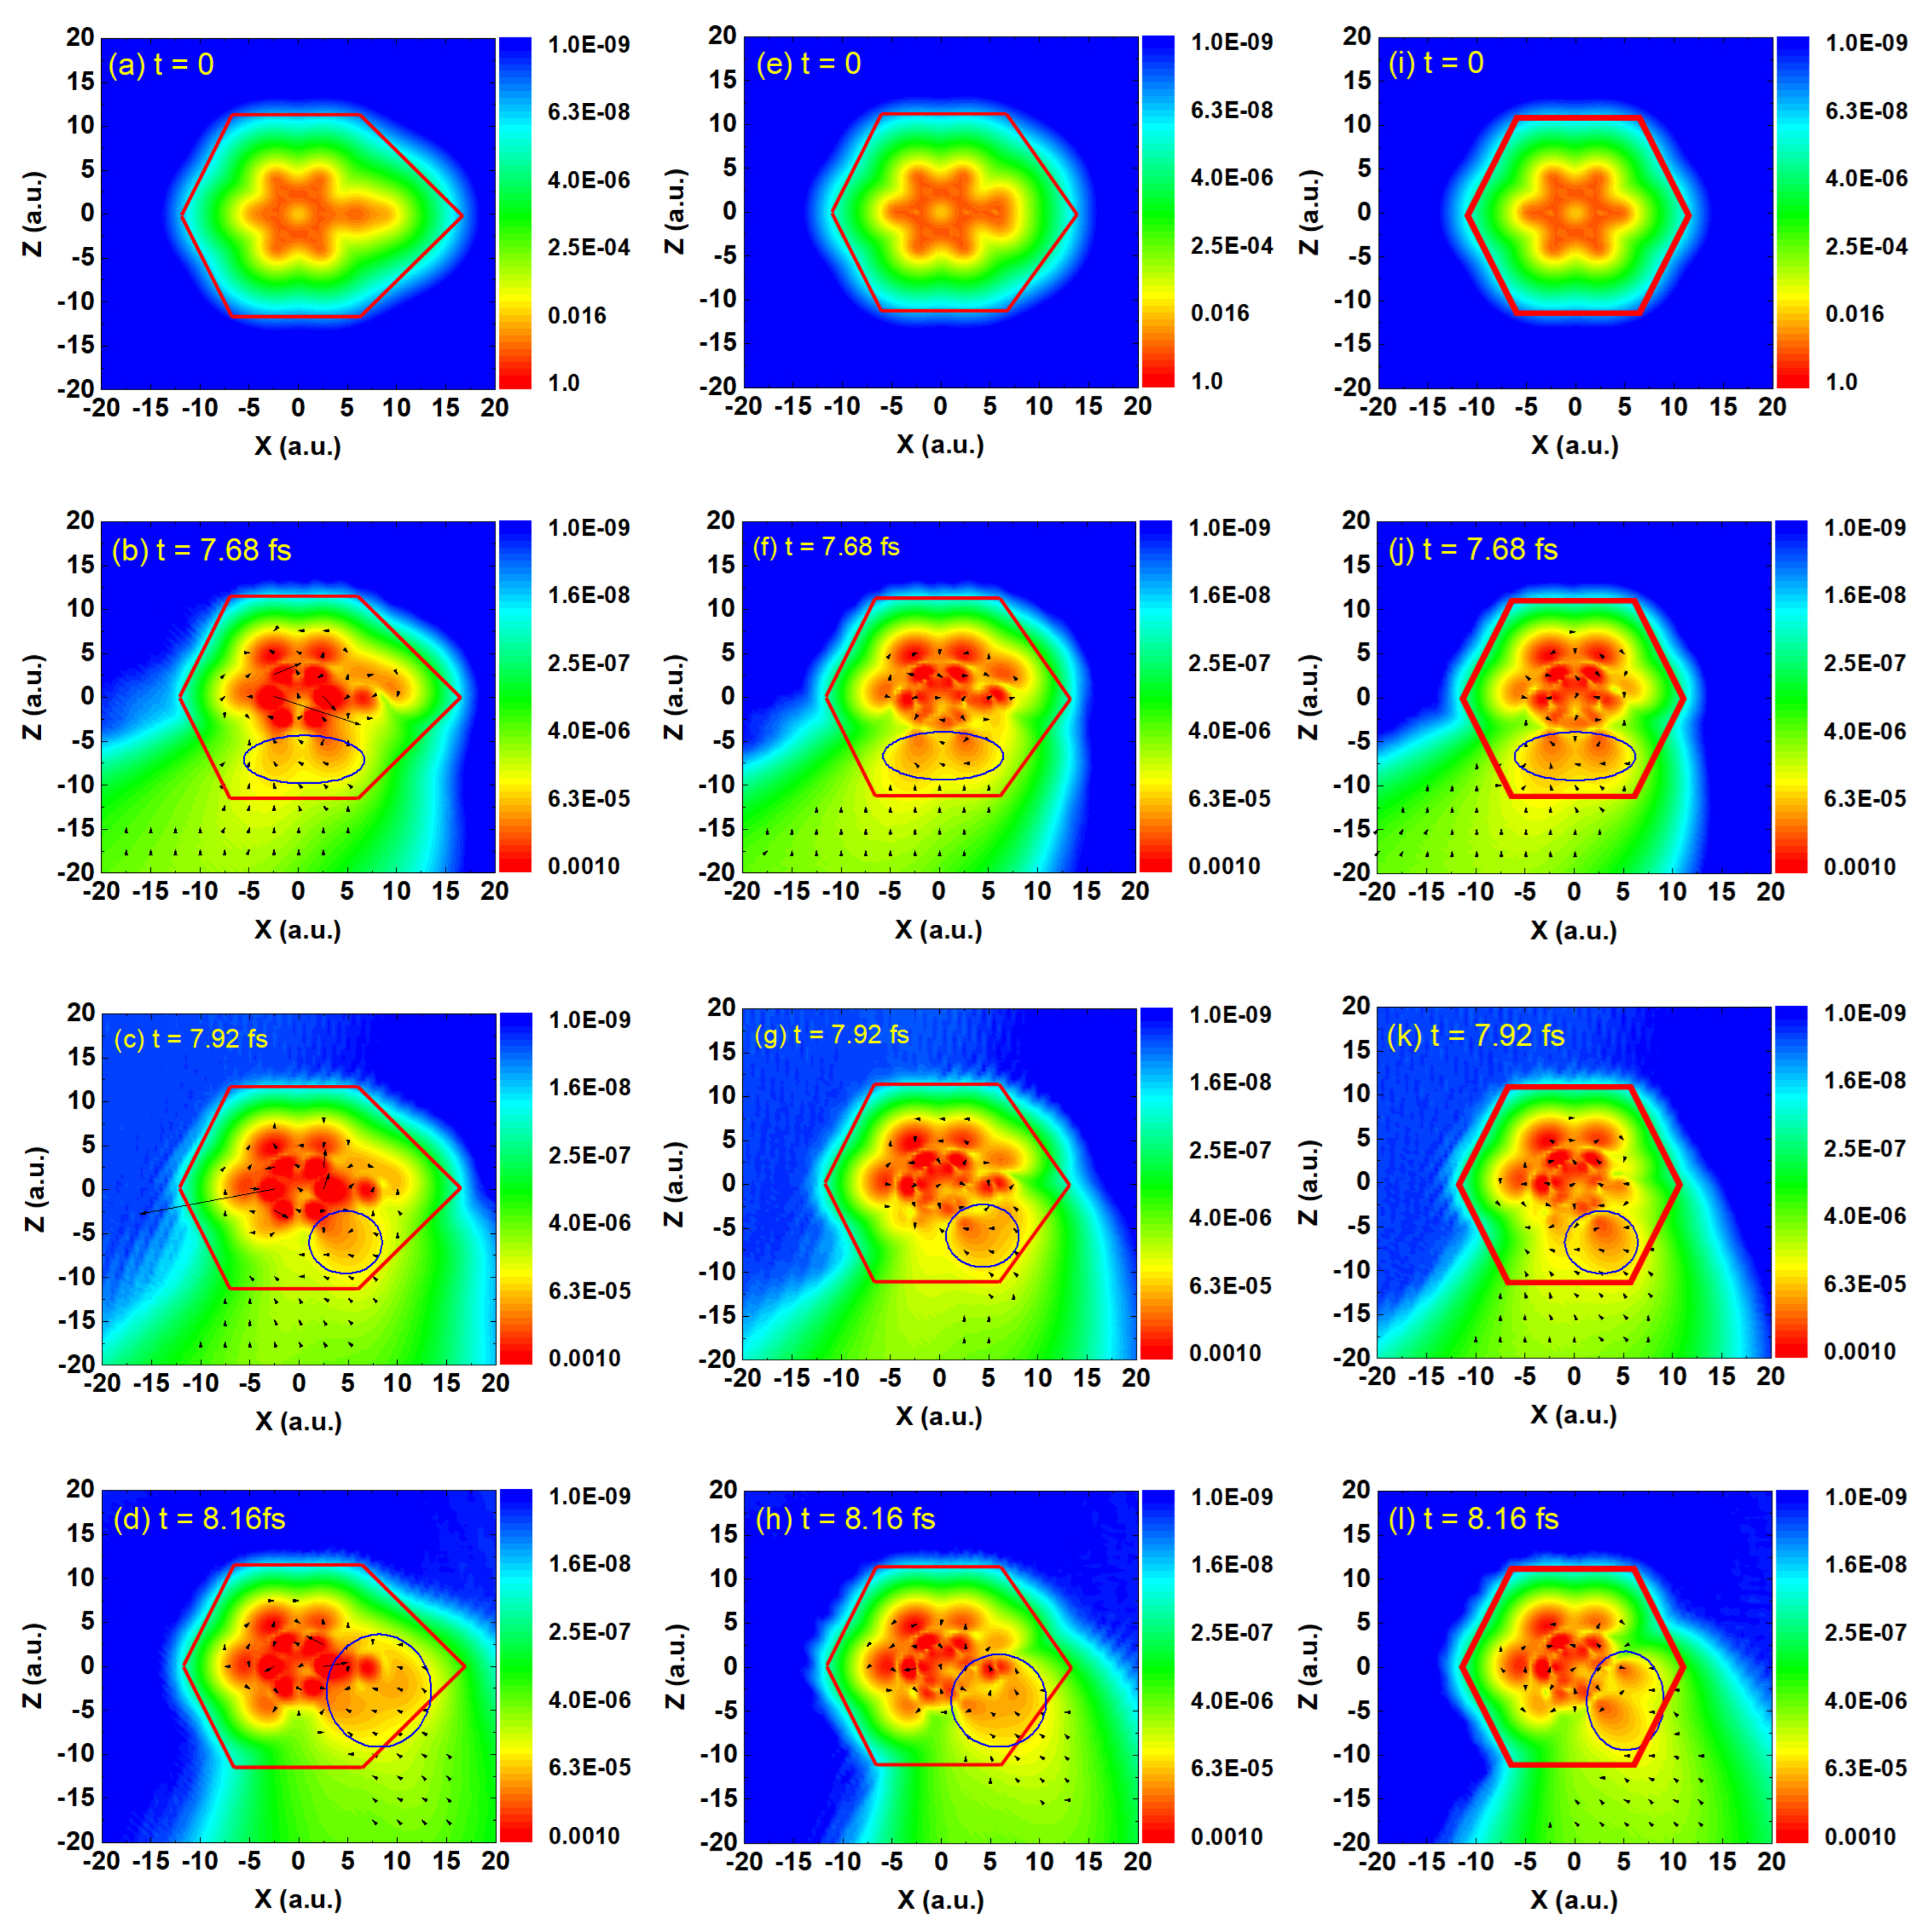
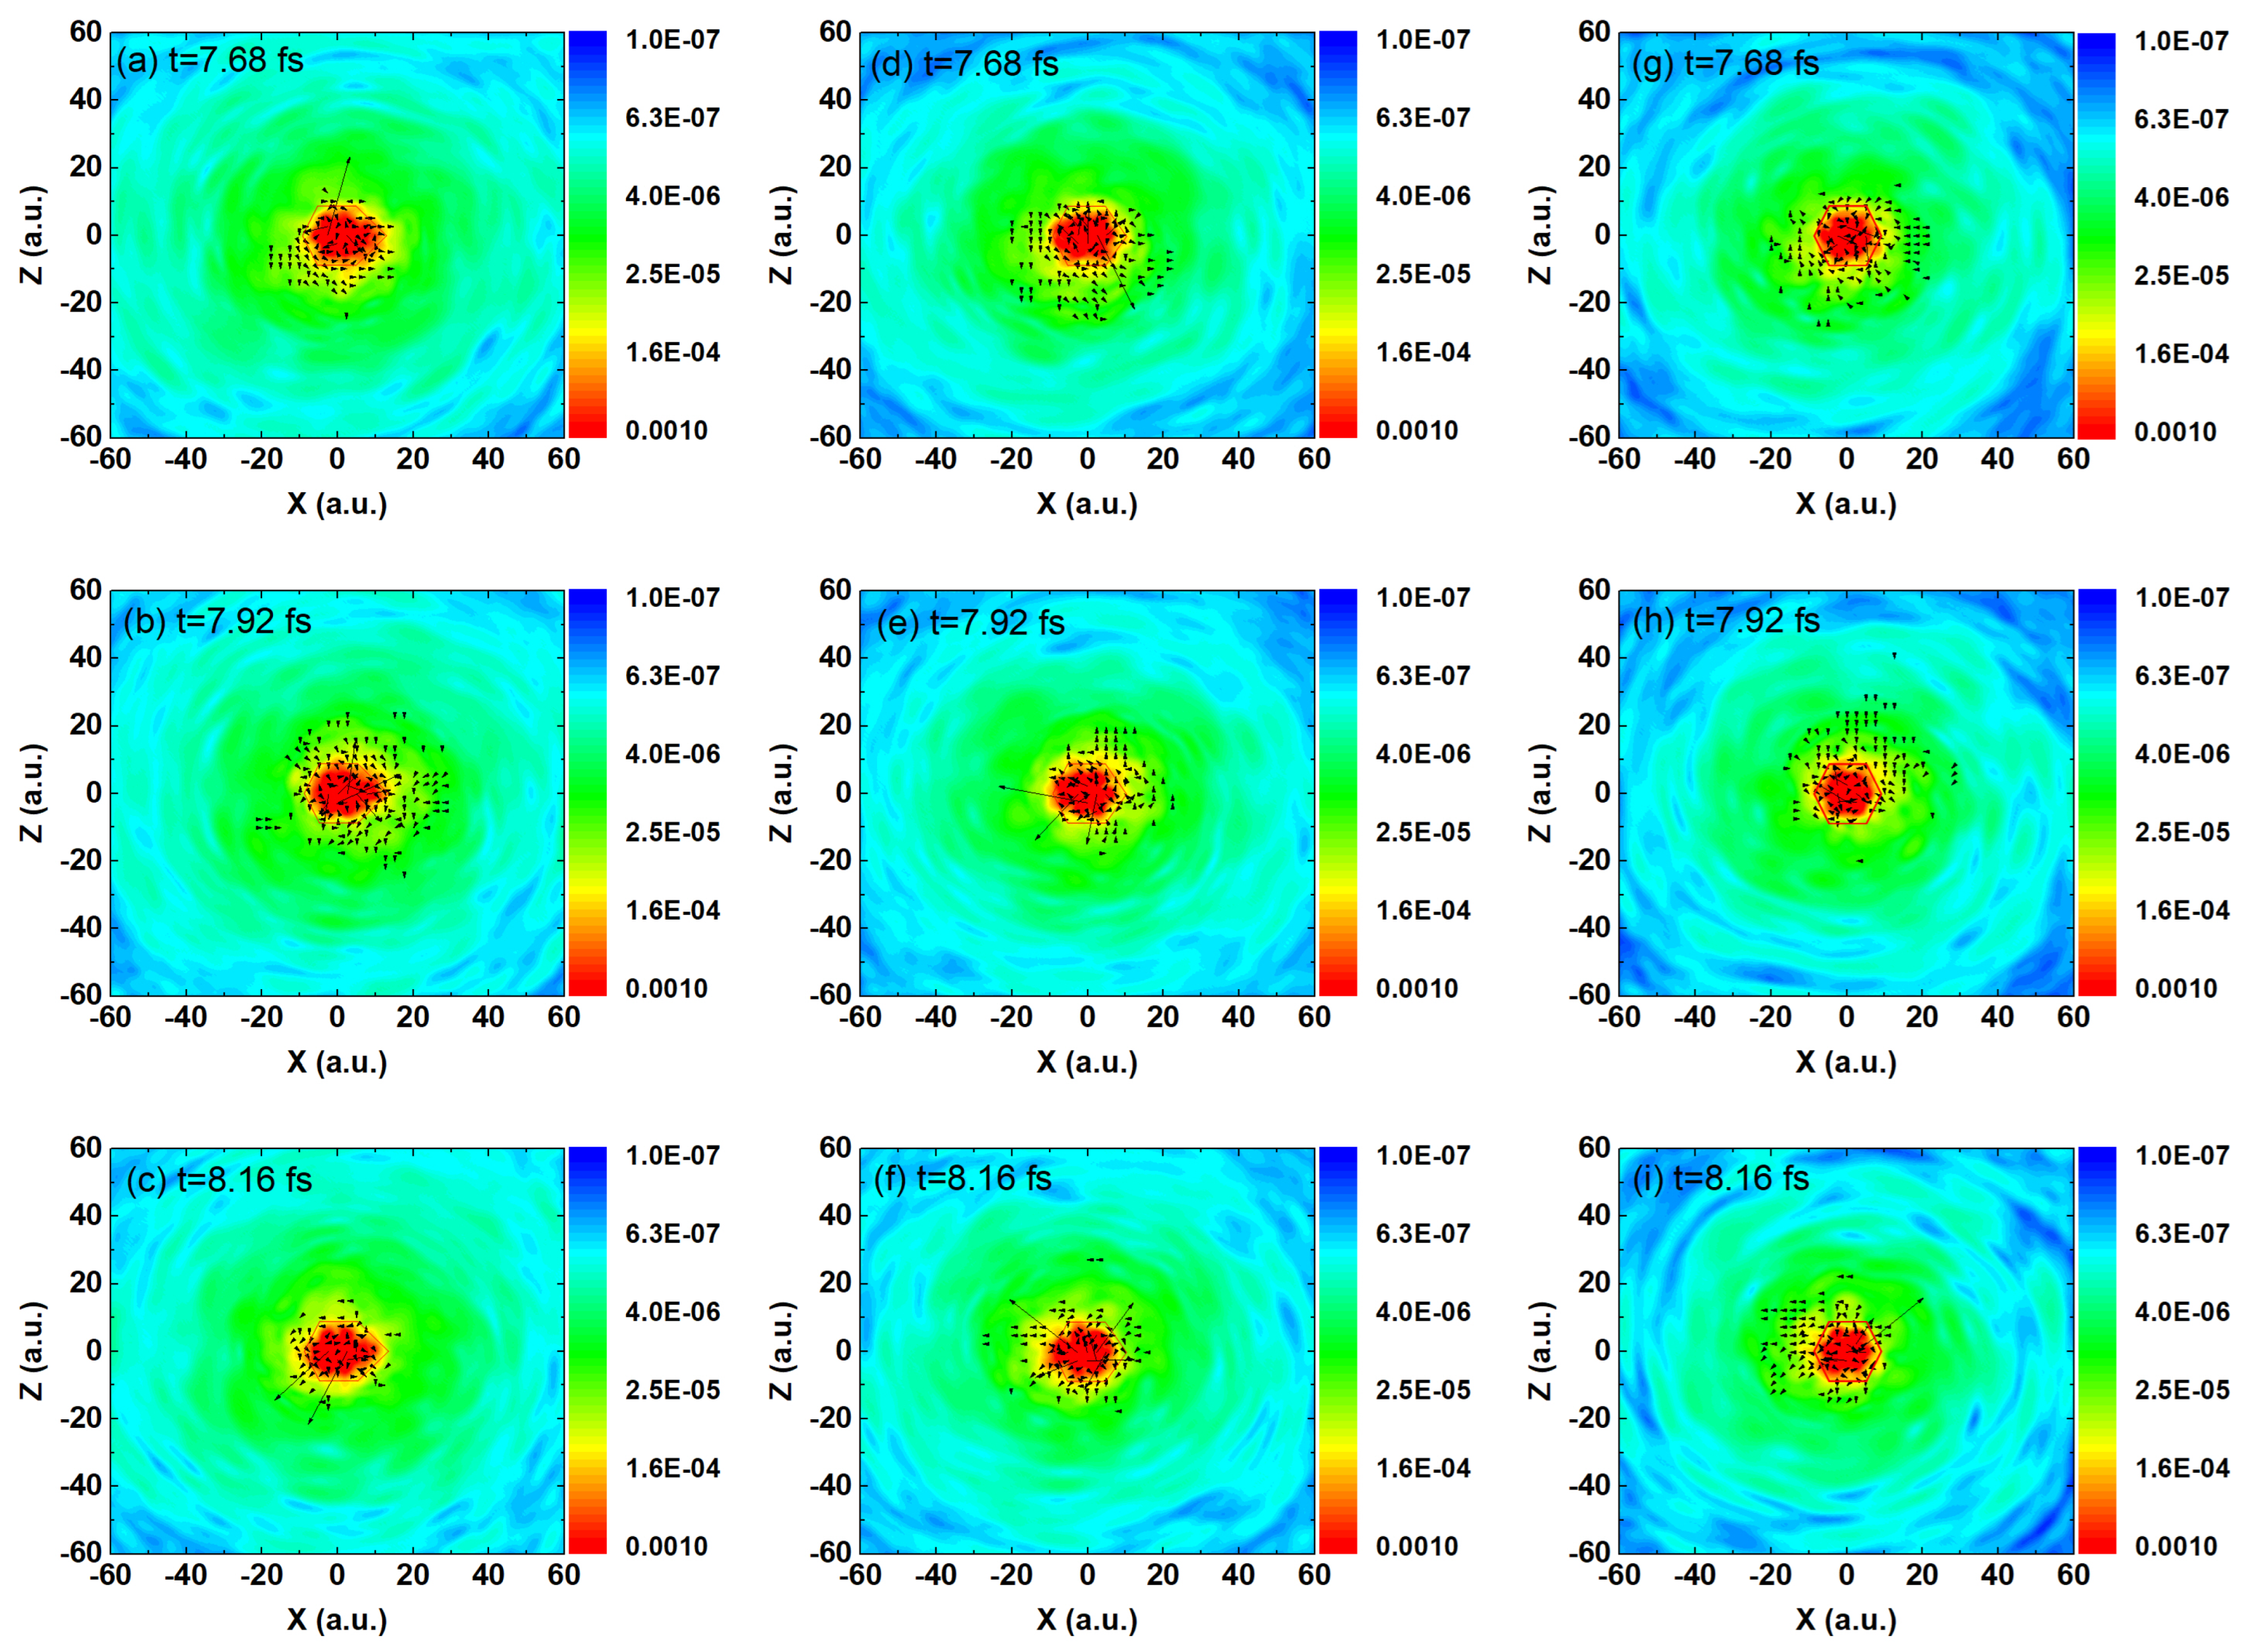
Figure 3, figures (a), (e), and (i) illustrate the ground-state electron density distributions of ethylbenzene, toluene, and benzene, respectively. The red frames indicate the approximate spatial extent of each molecule. It is evident that the electron density of ethylbenzene shows a significant bulge near the ethyl group, which is more pronounced than the electron density near the methyl group in toluene. In contrast, benzene, lacking substituents such as methyl or ethyl groups, exhibits the most compact distribution, primarily localized around the benzene ring. Figures (b–d), (f–h), and (j–l) show the instantaneous electron density distributions at the first three equally spaced moments during harmonic emission (
to
,
) for each molecule. The blue frames indicate the main spatial distribution of the ionized electrons at different moments. In strong-field physics, HHG occurs on extremely short timescales, typically in the attosecond to sub-femtosecond regime [
47], which is significantly shorter than the timescale associated with heat diffusion or lattice vibrations. The primary thermal effects in solids and molecules are mediated by phonons, whose timescales usually range from several femtoseconds to picoseconds [
48]. As such, during the ultrafast laser pulse (e.g., 10–30 fs), thermal transport or substantial vibrational motion of the lattice has not yet developed [
49], and thus can be reasonably neglected during the HHG process. Additionally, in our study, the dynamics of the electron are governed by the time-dependent Kohn–Sham equations under the action of the external field. These models focus on ultrafast electronic motion and do not include explicit phonon or nuclear dynamics. It is also worth noting that in the early phase of interaction (on the attosecond–few-femtosecond scale), vertical ionization dominates, and the molecular structure remains almost unchanged due to the inertia of the nuclei. Three consecutive moments, including one of the main harmonic emission times at 8.16 fs and two preceding equally spaced times at 7.68 fs and 7.92 fs, were selected to examine the motion of the electron wave packets. In the figure, the size (length) of the arrows represents the magnitude of the probability current density, i.e., the strength of the electron flow, while the direction of the arrows indicates the local direction of electron motion. In strong-field physics, this reflects the local strength of electron motion driven by the laser field or the contribution to HHG. For HHG, the arrow directions help to analyze the paths of electrons accelerated by the field and returning to the nuclei. By observing the electron density distributions together with the arrow directions, it is found that the ionized electrons in all three molecules exhibit the same motion trend at the same instant, consistently following a counterclockwise spiral trajectory. The changes in the positions of the high-density regions of the ionized electrons within the blue contour frames in Figures (b–d) also illustrate this point. As time evolves, under the driving of the incident laser field, electrons at different positions within the molecules are ionized and move around the molecule under the influence of the field, colliding with other nuclei. This process leads to the emission of a large number of photons. Unlike the recollision picture described by the classical three-step model, here the photon emission arises from heteronuclear collisions of the ionized electrons. Consequently, under long-wavelength (1200 nm) conditions, the typical interference pattern characteristic of the three-step model is not observed in Figures (b–l). However, the differences in the collision dynamics of the ionized electrons among the three molecules are also evident. In ethylbenzene, the presence of the ethyl group leads to a higher probability of electron-nucleus collisions (as indicated by the blue contour frame in
Figure 3d), resulting in more efficient HHG. In toluene, the smaller spatial extent of the ground-state electron density reduces the likelihood of such collisions (blue contour frame in
Figure 3h). Benzene exhibits the weakest behavior, with the lowest probability of electron–nucleus collisions (blue contour frame in
Figure 3l), leading to the lowest HHG efficiency.
To further investigate and confirm the enhancement effect of the ethyl group in ethylbenzene on HHG, we systematically simulated the HHG behavior of the three molecules under different laser intensities and wavelengths.
Figure 4 compares the harmonic spectra of ethylbenzene, toluene, and benzene under the same field parameters but with varying laser intensities. The laser intensities in figures (a–c) gradually decrease, corresponding to (a)
, (b)
, and (c)
, respectively. In combination with the results shown in
Figure 1, where the intensity was
, we observe that the cutoff energy of ethylbenzene increases with increasing laser intensity and consistently remains higher than those of toluene and benzene. Conversely, benzene always exhibits the lowest cutoff energy. For example, as indicated by the black arrows, the cutoff energy of ethylbenzene gradually decreases from 36 eV in
Figure 1 to 21 eV in
Figure 4c. Furthermore, the harmonic intensity of ethylbenzene also increases with laser intensity and remains higher than that of the other two molecules, with benzene consistently showing the weakest signal. Taking ethylbenzene as another example, the harmonic intensity in the 6–15 eV range shows a reduction from greater than −1 in
Figure 1 to approximately −2 in
Figure 4c, representing an intensity drop of more than one order of magnitude. These results confirm that the phenomenon observed in
Figure 1 is not an isolated case. All three molecules demonstrate consistent trends in both harmonic cutoff energies and intensity variations.
Figure 5 compares the high-order harmonic spectra of the three molecules at a laser intensity of
under different wavelengths. Figures (a–c) correspond to wavelengths of 800 nm, 400 nm, and 200 nm, respectively. Combined with the 1200 nm spectrum shown in
Figure 1, we find that as the wavelength decreases, the harmonic cutoff energy of ethylbenzene gradually increases and consistently remains higher than that of toluene and benzene. Benzene exhibits the lowest cutoff energy across all wavelengths. For instance, the cutoff energy of ethylbenzene increases progressively from 36 eV at 1200 nm to 77 eV at 200 nm as the wavelength decreases. The other two molecules exhibit similar wavelength-dependent enhancement of cutoff energies. Notably, the cutoff energies follow a consistent trend where larger ground-state electron density distributions correspond to higher cutoff energies. Regarding harmonic intensity, the spectrum of ethylbenzene also increases as the wavelength shortens, and both toluene and benzene show a similar enhancement trend. For instance, ethylbenzene demonstrates a remarkable enhancement in harmonic intensity increasing from sub-zero values (below cutoff at 1200 nm) to values consistently above 0 (approaching 2) in the plateau region (10-60 eV) at 200 nm, representing an intensity boost of approximately two orders of magnitude. However, with decreasing wavelength, the differences in harmonic intensity between the three molecules gradually diminish. At 200 nm, the harmonic spectra of all three molecules are nearly identical in intensity.
A similar procedure as for the 1200 nm case was applied: a representative harmonic emission time was first determined through time-frequency analysis, followed by an examination of the time evolution of the electron wave packet around that moment.
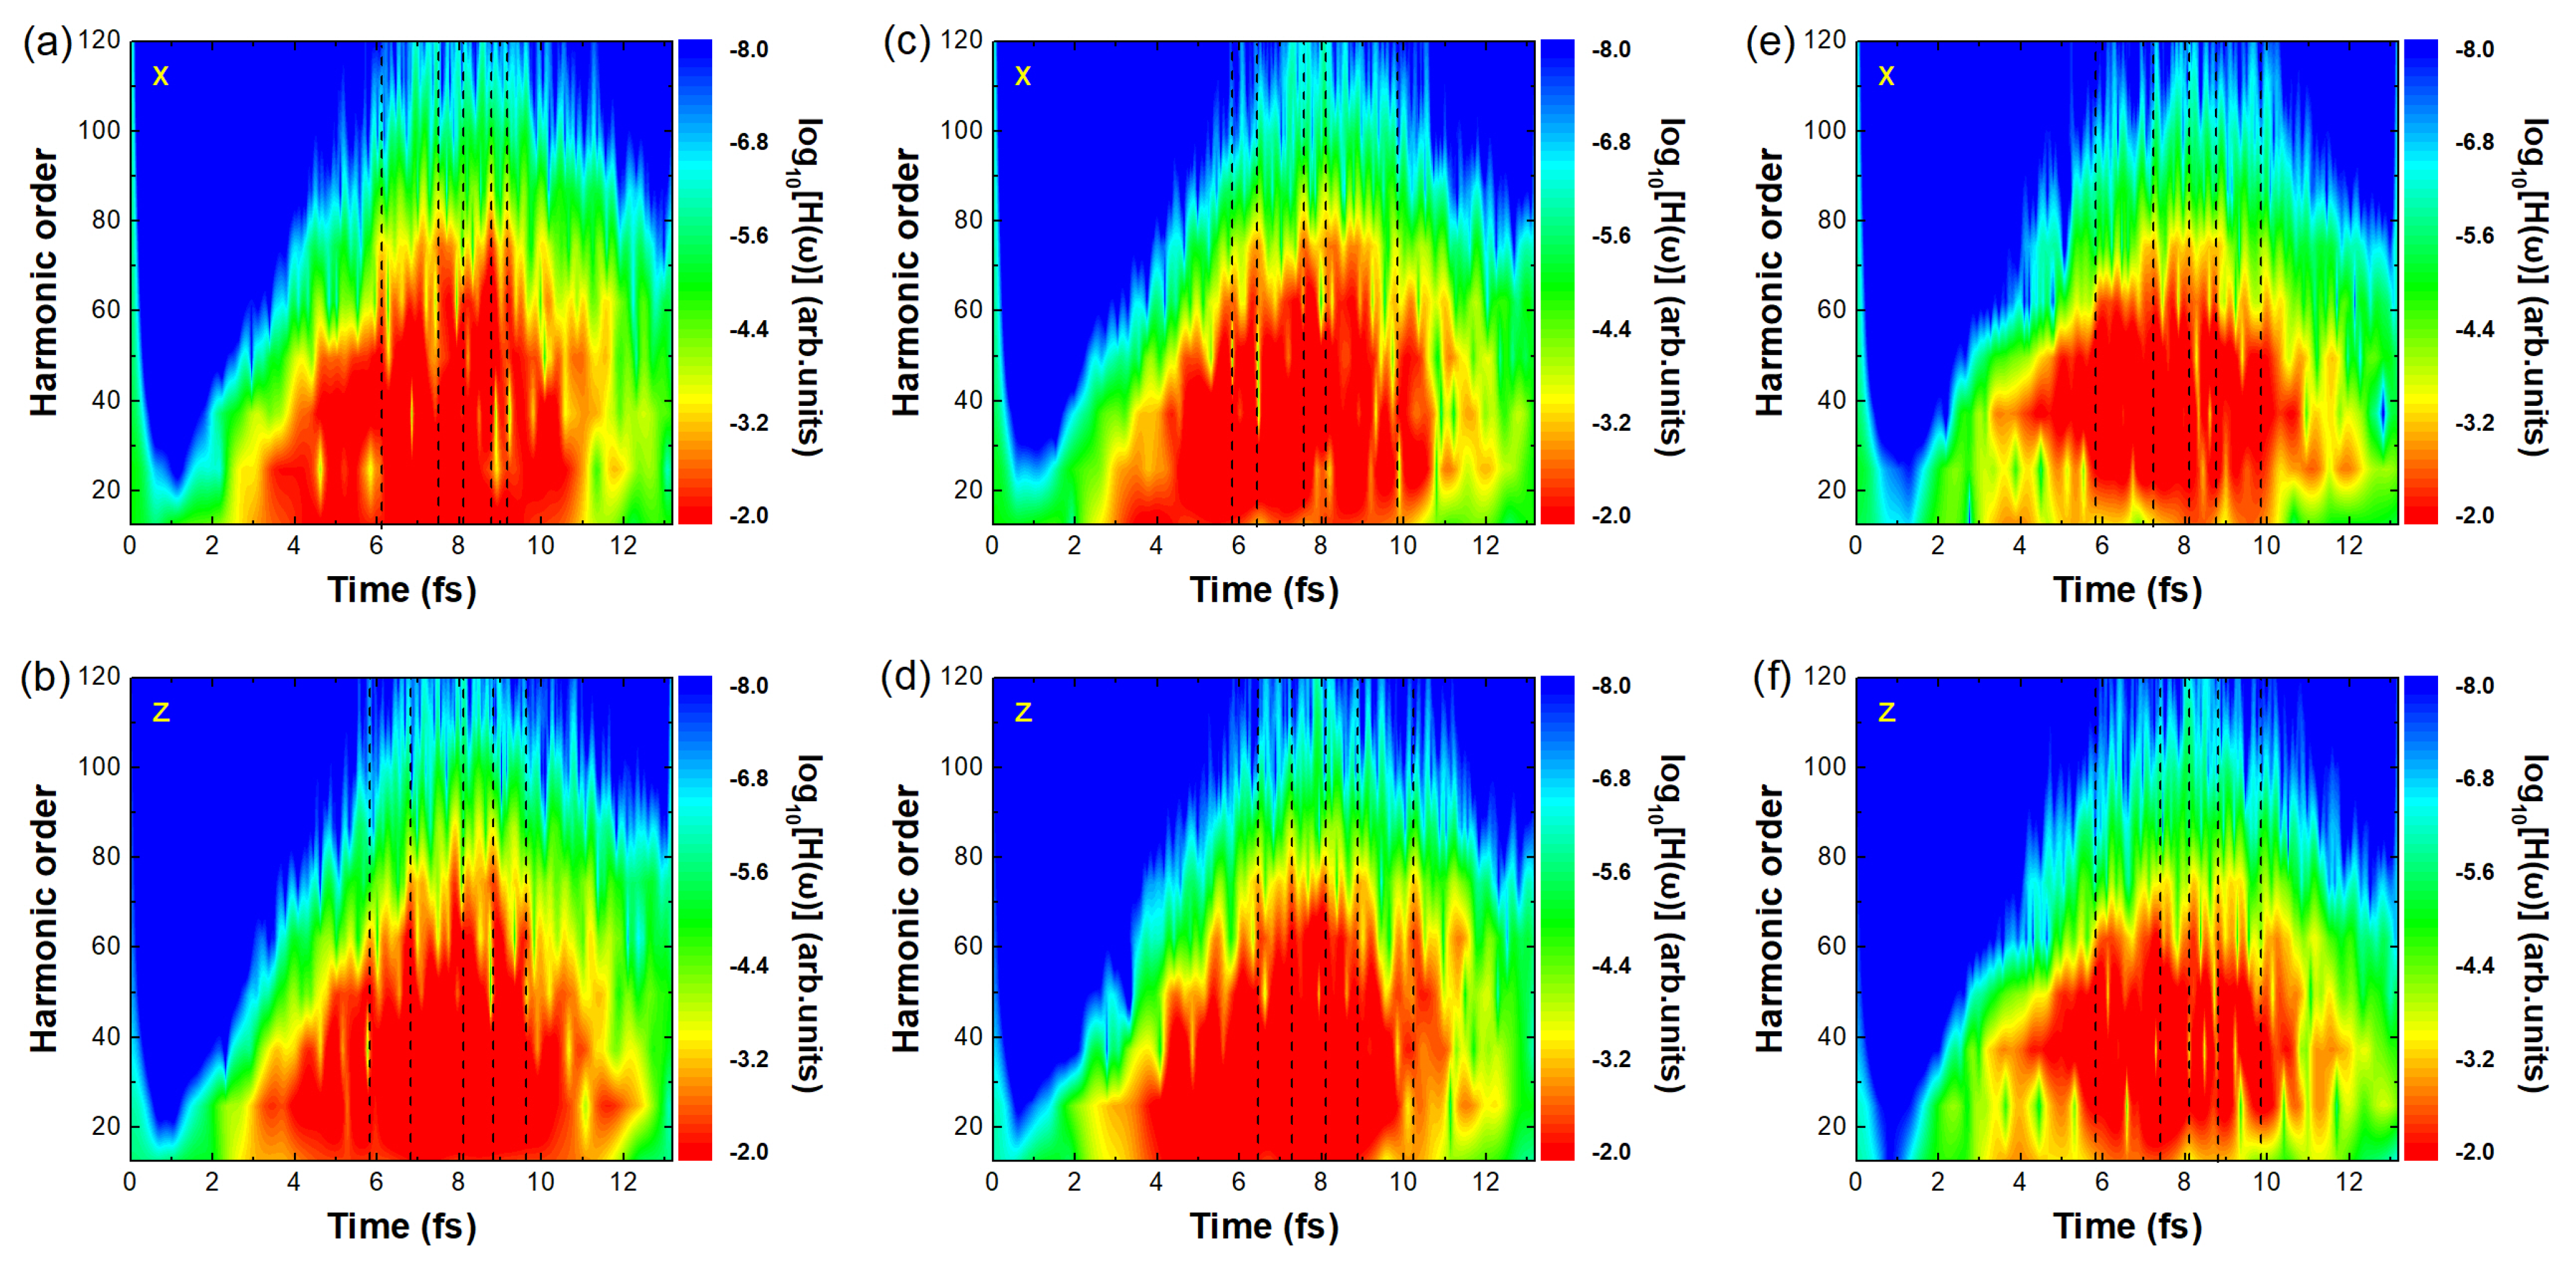
Figure 6 presents the time-frequency analysis results for the three molecules at 200 nm. Figures (a,c,e) and (b,d,f) correspond to the time-frequency spectra of harmonic emission in the
x and
z directions, respectively. In contrast to the 1200 nm case (
Figure 2), the brightness representing the harmonic intensity at the same energy in the
x and
z directions is comparable for all three molecules, indicating similar harmonic strengths, and multiple main emission times are observed (only five representative times are marked with dashed lines in each figure). Accordingly, 8.16 fs was selected as a representative harmonic emission time for further analysis, as shown in
Figure 7c,f,i.
As shown in
Figure 7, under the condition of 200 nm, throughout the entire time evolution (ethylbenzene in
Figure 7a–c, toluene in
Figure 7d–f, and benzene in
Figure 7g–i), a large number of ionized electrons continuously move around the three molecules under the driving of the laser field, and a considerable electron distribution remains within the ground-state density region of the molecules (red regions in the figure). By observing the directions indicated by the arrows, these ionized electrons exhibit a high probability of recolliding with their parent ions, which is in stark contrast to the case at 1200 nm. In other words, under short-wavelength conditions, all three molecules are able to undergo the classical three-step process of ionization–acceleration–recollision, thereby emitting a large number of high-energy photons, i.e., generating high-order harmonics. This explains why, in this case, clear interference patterns can be observed in
Figure 7 for all three molecules. In other words, at shorter wavelengths, the contributions of the ethyl group in ethylbenzene and the methyl group in toluene to harmonic emission are diminished and no longer dominant. In contrast, at 1200 nm, the roles of these side groups become much more significant, which explains why ethylbenzene exhibits much stronger harmonic intensity than toluene and benzene at that wavelength.
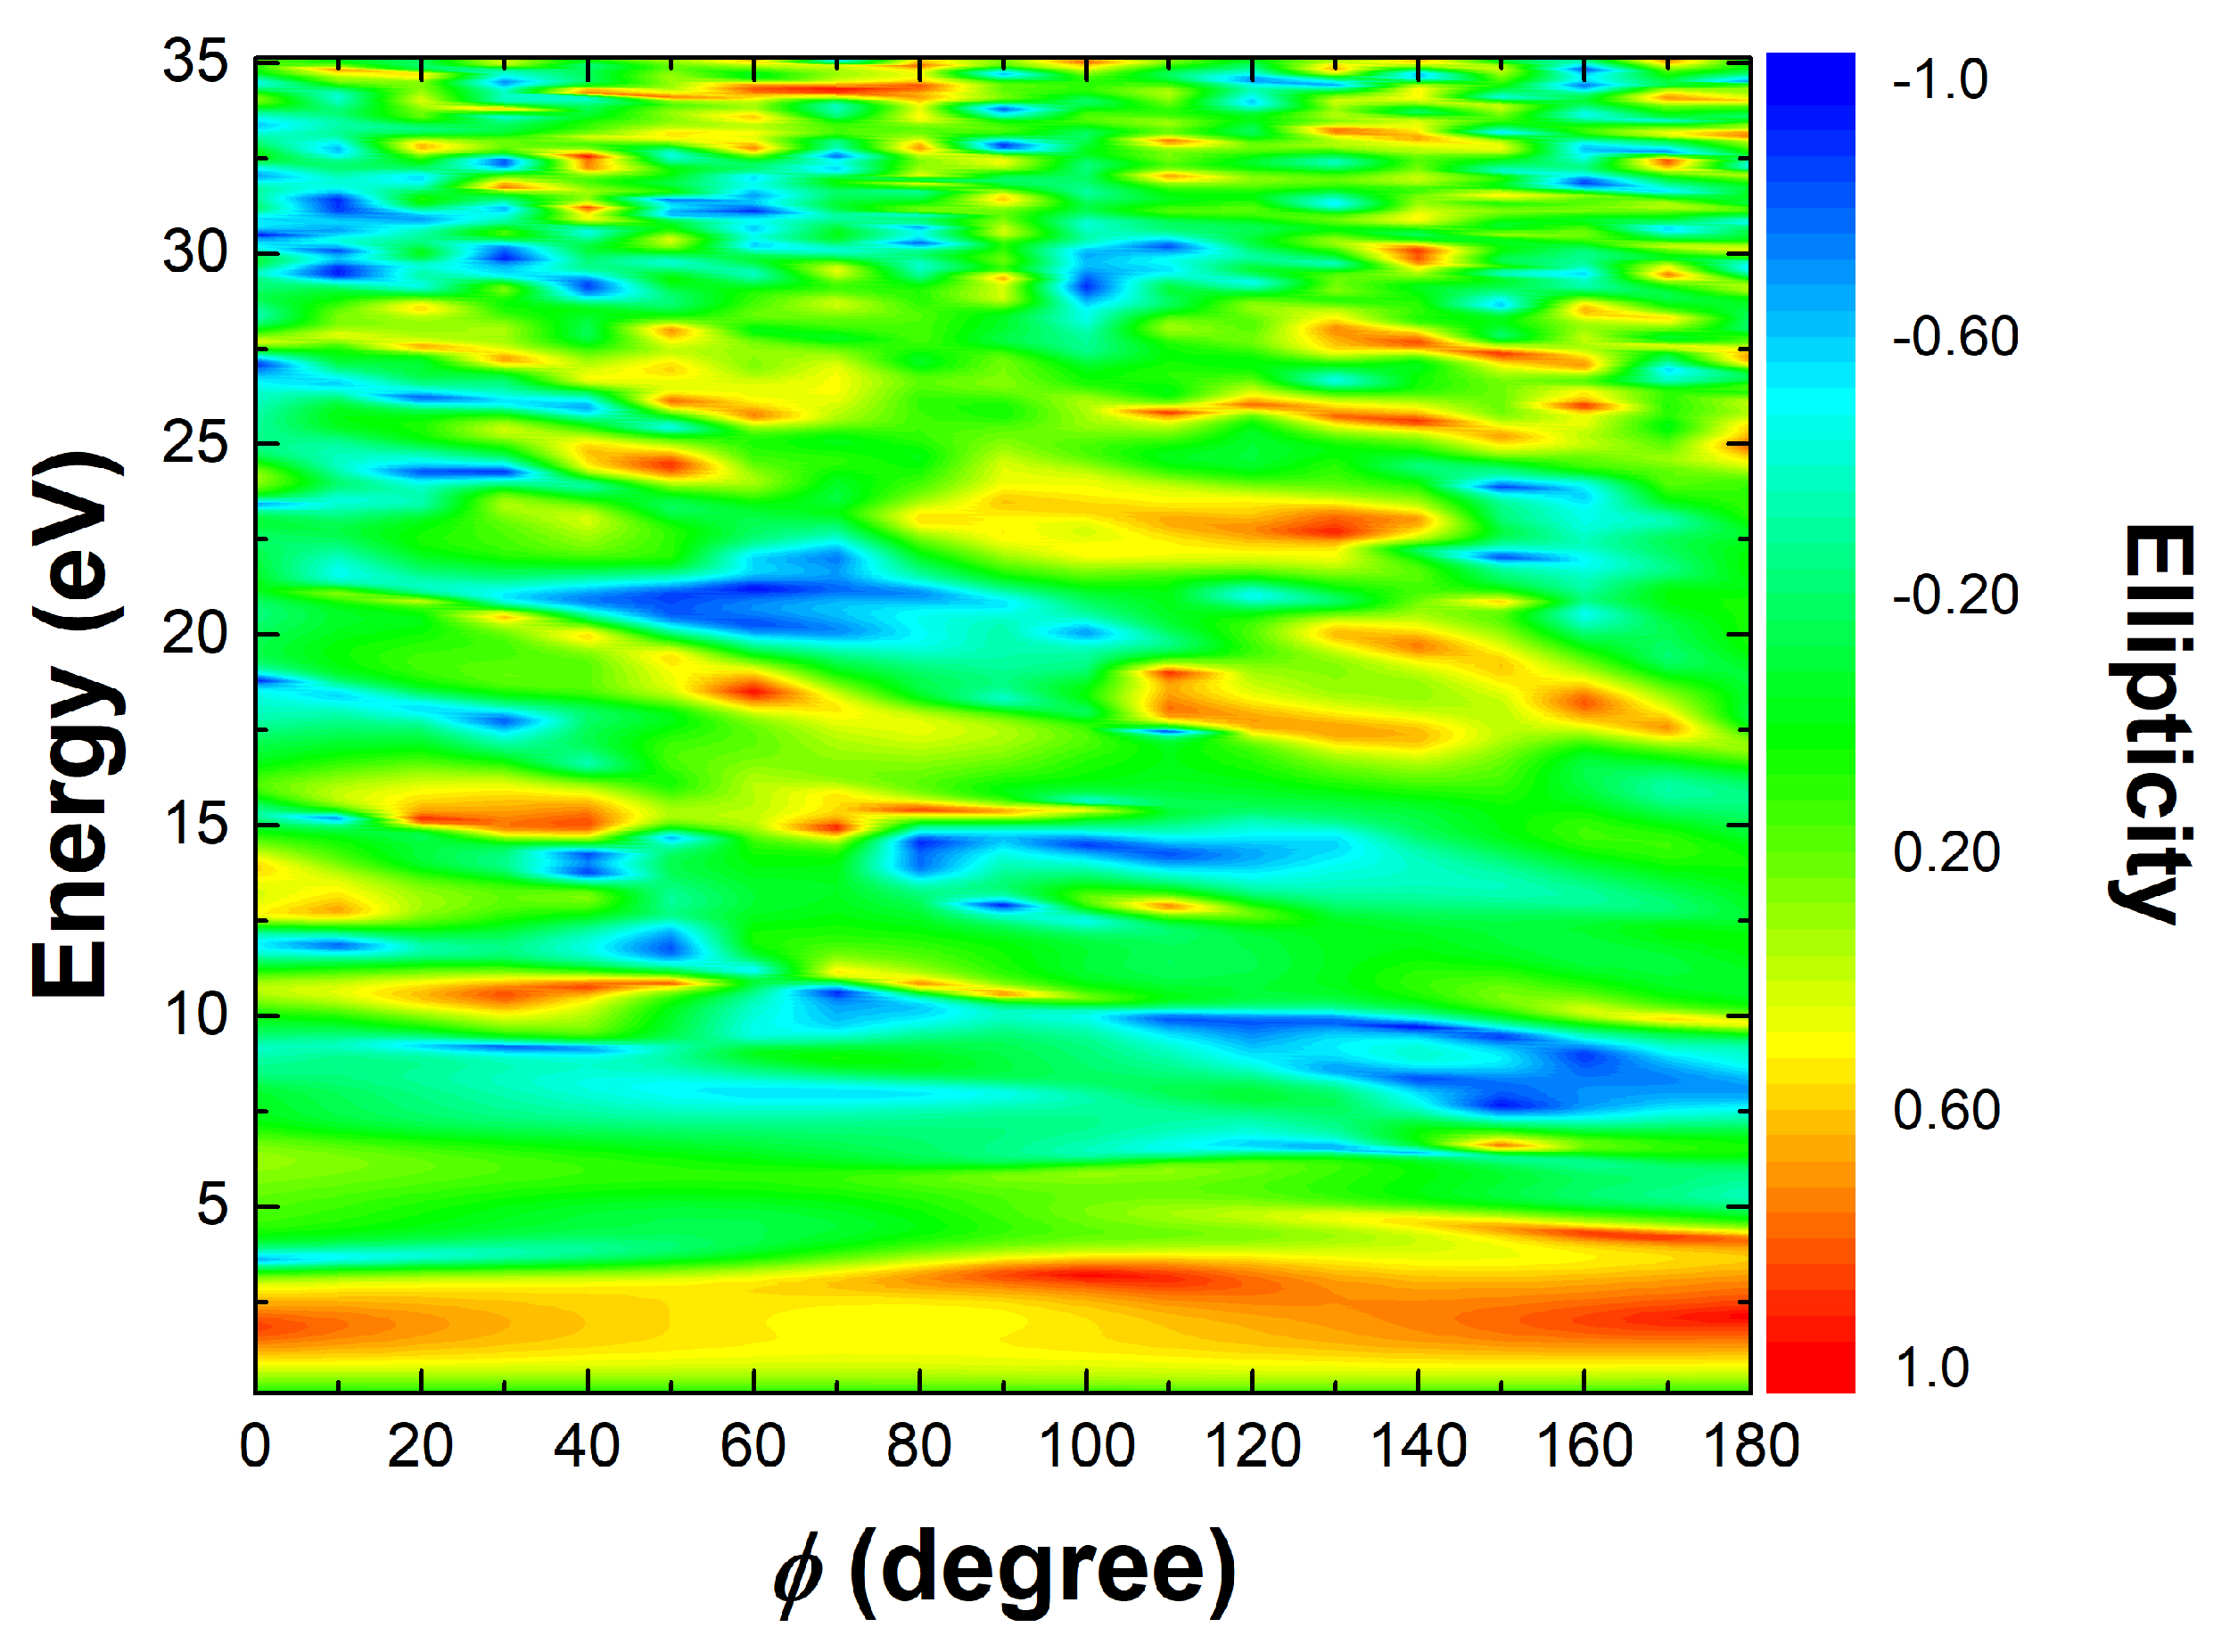
Through the above analysis, it can be concluded that ethylbenzene exhibits a significant advantage in harmonic intensity over toluene and benzene under long-wavelength laser fields, due to its unique ethyl group structure. Although there are so many advantages, the presence of the ethyl group disrupts the original ring structure of the benzene ring, and under the driving of a long-wavelength circularly polarized field, the generated harmonics are likely to be insufficiently circular. To this end, we numerically simulated the harmonic ellipticity of ethylbenzene under a laser field with a wavelength of 1200 nm and an intensity of
for various CEP. As shown in
Figure 8, the CEP ranges from 0° to 180° with an interval of 10°. In
Figure 8, the horizontal axis represents different CEP values, the vertical axis corresponds to the harmonic photon energy, and the color scale indicates the harmonic ellipticity. The ellipticity values range from
(blue) to
(red). The figure shows that there are many harmonics with ellipticity close to
or
, indicating that circularly polarized high harmonics can indeed be generated under these laser conditions. However, the regions corresponding to these high ellipticity values are relatively narrow, suggesting that there is no long, continuous spectral region of nearly circular polarization. As a result, it is difficult to synthesize circularly polarized isolated attosecond pulses. This limitation is primarily due to the ethyl group in ethylbenzene disrupting the molecular ring symmetry.
