Abstract
Calibration of power equipment has become an essential task in modern power systems. This paper proposes a distributed remote calibration prototype based on a cloud–edge–end architecture by integrating intelligent sensing, Internet of Things (IoT) communication, and edge computing technologies. The prototype employs a high-precision frequency-to-voltage conversion module leveraging satellite signals to address traceability and value transmission challenges in remote calibration, thereby ensuring reliability and stability throughout the process. Additionally, an environmental monitoring module tracks parameters such as temperature, humidity, and electromagnetic interference. Combined with video surveillance and optical character recognition (OCR), this enables intelligent, end-to-end recording and automated data extraction during calibration. Furthermore, a cloud-edge task scheduling algorithm is implemented to offload computational tasks to edge nodes, maximizing resource utilization within the cloud–edge collaborative system and enhancing service quality. The proposed prototype extends existing cloud–edge collaboration frameworks by incorporating calibration instruments and sensing devices into the network, thereby improving the intelligence and accuracy of remote calibration across multiple layers. Furthermore, this approach facilitates synchronized communication and calibration operations across symmetrically deployed remote facilities and reference devices, providing solid technical support to ensure that measurement equipment meets the required precision and performance criteria.
1. Introduction
The implementation of precise calibration techniques is essential for ensuring measurement accuracy, maintaining operational stability, and complying with regulatory standards [1,2,3]. However, traditional calibration methods typically rely on manual on-site operations, which are not only costly and time-consuming but also inadequate in addressing the challenges posed by remote or complex environments. In contrast, remote calibration enables specialists to perform calibration tasks remotely, allowing field instruments at industrial sites to be adjusted via centralized laboratory platforms [4,5,6]. This approach enables accurate adjustments to be made remotely, thereby reducing costs and overcoming logistical and geographic barriers. Thus, remote calibration is a practical and effective solution for modern instrument calibration [7,8].
Several international research institutions, including the National Research Council (NRC) of Canada, the Electric Power Research Institute’s Metrology Department in China, the National Physical Laboratory (NPL) in the UK, and the National Institute of Standards and Technology (NIST) in the USA [9,10,11,12], are investigating remote calibration technologies that leverage satellite signals. Wang et al. [4] employed optical character recognition (OCR) technology alongside IoT to identify and transmit data from remote industrial meters for calibration. Yuan-Long Jeang et al. [13] achieved remote calibration of servo motors employing FPGA and IoT for transmitting control commands and operational parameters. However, in the context of remote calibration, mismatches between calibration requirements and existing technologies result in significant limitations concerning efficiency, security, reliability, and multi-device collaborative work within current remote calibration systems.
On the one hand, during the remote calibration process, standard equipment may be susceptible to environmental influences such as temperature, humidity, and vibration during transportation or operation, which may induce variations in performance. To ensure the accuracy of value transmission, high-precision reference standards and corresponding detection methods must be configured locally. However, existing remote calibration systems rely on physical references and perform value transfer through on-site measurements, which are prone to errors [4]. In high-precision AC signal scenarios, a paucity of viable non-physical reference [9,10,11,12] solutions persists, thereby undermining the authority and credibility of traceability and value transfer. On the other hand, a large number of traditional instruments in current power systems lack data communication interfaces. Their mechanical pointer-based dials and non-standard signal outputs make it difficult to directly integrate them into digital networks. Replacing all these devices with smart terminals would incur significant transformation costs. Existing remote calibration systems [14,15] typically rely on manual readings, which not only suffer from low efficiency but also fail to guarantee calibration accuracy. Furthermore, power system equipment today exhibits several characteristics: wide geographical distribution (covering regions nationwide), complex device types (spanning generation, transmission, and substation phases), and diverse calibration parameters (involving multi-dimensional indicators such as voltage, current, and frequency). However, current remote calibration systems [14,15,16,17] adopt a single-machine, single-task mode, unable to meet the demands of multi-device collaboration. Moreover, their architectures do not support concurrent user operations, significantly limiting system scalability and the feasibility of large-scale deployment.
To address the shortcomings of traditional remote calibration systems regarding security, reliability, and multi-device collaborative calibration, this paper proposes a cloud–edge–end holistic solution tailored for power equipment calibration. The objective of this solution is to ensure traceability in electrical metrology, to enable automated data acquisition from legacy instruments, and to facilitate scalable multi-device, multi-user concurrency—ultimately enhancing the reliability, intelligence, and efficiency of the remote calibration process. The proposed approach integrates FVC modules, OCR, and scheduling into a comprehensive integrated framework and develops a system prototype. To our knowledge, this represents the first system that combines these components, enabling a novel and practical solution for remote electrical quantity calibration. The primary contributions of this work are summarized as follows:
- A high-precision frequency-to-voltage (F-V) conversion-based measurement value transmission system is proposed, enabling traceability and value transfer from satellite-derived signals to calibrated AC voltage outputs. This substantially improves the system’s accuracy and metrological authority.
- An intelligent data acquisition and on-site monitoring system is developed, enabling 24/7 visual monitoring of operational workflows, instrument statuses, and environmental conditions during calibration. It also achieves real-time image capture and automated parsing of semi-structured/unstructured data from traditional meters, enhancing the accuracy and reliability of the calibration process.
- An information, permission, and task management system is constructed within a cloud–edge–end collaborative architecture. It ensures standardized, proceduralized data processing and safeguards data security and operational integrity during multi-user collaboration. The system supports integration of multi-source, heterogeneous devices and ensures protocol compatibility. An intelligent task scheduling module optimizes resource allocation between cloud and edge nodes, effectively balancing high-precision calibration requirements with real-time response demands.
The remainder of this paper is organized as follows. Section 2 presents related works; Section 3 introduces the overall framework of the system; Section 4 details the materials and methods, including the measurement value transmission system based on the high-precision frequency-to-voltage conversion module, the calibration experiment data acquisition and on-site monitoring system based on deep learning, and the information, permission, and task management system based on the cloud–edge–end collaborative architecture. Section 5 presents the test results of the platform. Finally, Section 6 concludes the paper with a summary and future perspectives.
2. Related Work
The remote calibration system in an open network environment completes calibration tasks through several steps [6]: transportation and connection of instruments, data acquisition and command transmission, execution of calibration operations, and feedback of results. Specifically, the metrology institution transports standard instruments to the calibration site by some means. After the calibration site receives the standard instruments, they are connected to the instruments under test according to specified requirements. During the calibration operation, the metrology institution sends control commands and receives results via the Internet, while the calibration site performs corresponding operations based on the received commands and transmits the results back to the metrology institution.
2.1. Traceability and Transmission of Measurement Values
During the transportation and connection phase of instruments, standard equipment is susceptible to environmental factors such as temperature, humidity, and vibration, which may cause performance variations. The lack of on-site detection methods and high-precision reference standards affects the accuracy of measurement value transmission.
To address the issue of traceability and transmission in remote calibration, Yuan-Long Jeang et al. [13] constructed a remote calibration system for servo motors using an FPGA. In this system, control commands are transmitted to the FPGA via IoT technology, while the FPGA sends operational parameters of the servo motor back to the remote control terminal for calibration purposes. Jebroni et al. [18] proposed a remote calibration method for smart meters. They designed a voltage converter at the meter end that provides a stable voltage independent of the power grid in terms of frequency and amplitude, serving as a reference signal for calibration or accuracy testing. Regarding non-physical reference transmission, several research institutions, including the National Research Council (NRC) of Canada, the Metrology Department of China Electric Power Research Institute, the National Institute of Metrology of China (NIM), the National Physical Laboratory (NPL) of the UK, and the National Institute of Standards and Technology (NIST) of the USA, are conducting studies on remote calibration using satellite signals [9,10,11,12]. Among these efforts, Han et al. [19] conducted remote calibration of NTP and rubidium atomic frequency standards based on the remotely time-traceable device developed by the National Institute of Metrology of China. This approach addressed the issue of time traceability in the transportation sector. Fang et al. [20] designed a remote calibration method using the common-view method and GPS satellite signals. They converted voltage into frequency through a voltage-to-frequency module and used a frequency counter to calculate the difference between the generated frequency and the frequency derived from GPS satellite signals, thereby calibrating DC voltage sources.
The traceability and transmission issues in remote calibration systems involve two forms: physical and non-physical references. The transmission of physical references [13,18] relies on direct or indirect on-site measurement methods. However, due to the lack of traceability to international standards, such methods are prone to introducing systematic errors, thus affecting the accuracy and reliability of calibration results. In contrast, non-physical references [9,10,11,12] are transmitted via satellite time and frequency technology, which effectively avoids some of the aforementioned problems. However, in application scenarios involving high-precision AC signals, there is still a lack of practical solutions. Therefore, current remote calibration systems exhibit insufficient authority and credibility in terms of measurement value traceability and transmission methods.
2.2. Data Acquisition and Collection
During the process of data acquisition and command transmission, the lack of metrology technicians at the calibration site and the absence of network interfaces in some verification instruments hinder direct data transmission to the central laboratory, increasing the difficulty of data collection and acquisition [4,5]. Currently, in most production scenarios both domestically and internationally, data acquisition from calibration equipment still relies heavily on manual reading and recording. Manual reading is not only inefficient but also lacks accuracy, despite the critical importance of these data. To fundamentally address this issue, equipment should be digitally upgraded to enable data transmission through wired or wireless means [21]. However, a significant number of traditional instruments in current power systems lack data communication interfaces. Their mechanical pointer dials and non-standard signal outputs make it challenging to integrate them directly into digital networks. Fully replacing these devices with smart terminals would incur substantial renovation costs. In response to this challenge, artificial intelligence-based visual recognition technology offers an innovative path for low-cost data acquisition. Comprehensive reviews and detailed analyses of scene text detection and recognition applications can be found in survey papers [22,23,24]. Traditional methods for text detection and recognition typically involve several steps: first, preprocessing images using techniques such as binarization, skew correction, and character segmentation. Next, handcrafted features like histogram of oriented gradients (HOG) features and convolutional neural network (CNN) feature maps are extracted to recognize segmented characters. However, these methods lag behind deep learning-based approaches in terms of accuracy and adaptability, especially when dealing with challenging or complex scenes (e.g., low resolution and geometric distortion). For instance, Baoguang Shi et al. [25] proposed a convolutional recurrent neural network (CRNN) architecture that combines deep convolutional neural networks (DCNNs) with recurrent neural networks (RNNs). This approach transforms image recognition into sequence recognition and achieves excellent recognition performance. Nevertheless, whether traditional scene text detection and recognition technologies or deep learning-based ones, their application in remote calibration systems remains underutilized.
Most existing remote calibration systems still rely heavily on manual readings, which are not only inefficient but also fail to ensure the accuracy of calibration results [4]. Moreover, these systems have yet to integrate AI-based visual recognition technologies, making it difficult to effectively address the issue of lacking data communication interfaces in traditional instruments within current power systems. Therefore, there is a significant deficiency in the reliability and precision of data acquisition and information retrieval in existing remote calibration systems, necessitating improvements to meet the demands of modern power systems.
2.3. System Application Construction
In the calibration operation and result feedback phase, addressing the diversity and complexity of data brought by heterogeneous network nodes (such as environmental sensors and video data nodes), Xiu Ming Xu from Northwestern Polytechnical University studied remote calibration of instruments based on virtual instrumentation (VI). He designed the specific framework and access strategies for the calibration database at the laboratory end and implemented remote control technology for the calibration VI at the calibration end. This system was realized in both web and LabVIEW environments to interconnect with the database [14]. Guo Hong Ouyang from National University of Defense Technology implemented a remote management system based on LabVIEW. Utilizing Keithley 2000 digital multimeters and programmable DC electronic loads FT6301A, he remotely calibrated Maynuo M8831 programmable regulated power supplies. Metrology personnel controlled these three programmable devices remotely from the server side to calibrate the Maynuo M8831 and automatically generated calibration result files indicating the measurement errors of the device under test. The system primarily uses the TCP/IP protocol for communication between computers. On the client-side design, standard instruments, devices under calibration, and electronic loads need to be connected to the computer through a unified interface and controlled uniformly via LabVIEW programs [15].
Mihaela M. Albu [16] discussed how mobile multi-agent technology could address most security issues after presenting a simple remote calibration client-server architecture. Since remote calibration requires installing client virtual laboratories (executed in the LabVIEW environment) in the calibration laboratory, which is not controlled by the laboratory staff, the client software might be illegally modified. Mobile multi-agent technology enables self-recognition of available interfaces and instruments to be calibrated, implementing security features to prevent illegal modifications of the software running on the client [16]. Yong En Haur [17] proposed an internet-client-based remote calibration method, advocating that national laboratories provide server systems containing calibration information awaiting connection from remote area client computers. After connecting the device under calibration to the server, the client computer automatically calibrates through instrument communication interfaces. The author detailed the requirements for internet-based remote calibration from both hardware (communication interface standards, client/server applications, reference devices, calibration engines) and software design perspectives, and accordingly designed graphical user interfaces (GUIs) for client/server applications [17].
However, such remote calibration systems [14,15,16,17] mainly focus on interactions between a single calibration point and the central laboratory. Their design frameworks do not fully consider the stringent multitasking demands of large-scale deployments. Therefore, when faced with massive concurrent calibration tasks across multiple points, whether these systems’ concurrency processing capabilities are sufficient to support uninterrupted calibration operations remains unverified, raising questions about their practical effectiveness.
2.4. Summary
In summary, existing remote calibration systems are not effective. First, existing remote calibration systems that rely on physical references perform value transfer through on-site measurements, which are prone to errors. Additionally, systems that rely on non-physical references involve high-precision AC signals and still lack practical solutions. Second, existing remote calibration systems typically rely on manual readings, which not only result in low efficiency but also fail to guarantee calibration accuracy. Moreover, current remote calibration systems adopt a single-machine, single-task mode and are unable to meet the demands of multi-device collaboration.
3. Overall Functional Structure
The cloud–edge–end collaborative remote calibration system architecture constructed in this paper is shown in Figure 1. This architecture achieves efficient data transmission, intelligent processing, and precise calibration through hierarchical collaboration among cloud, edge, and terminal layers, forming an efficient, flexible, and secure remote calibration solution aimed at meeting the calibration needs of power equipment across multiple devices and scenarios. The proposed system is primarily designed for calibration scenarios involving electrical measuring devices such as instrument transformers and calibrators. It supports wide-area networking spanning thousands of kilometers and has the potential to support a global-scale calibration infrastructure. The system is primarily intended for use in the metrology field within the power industry.
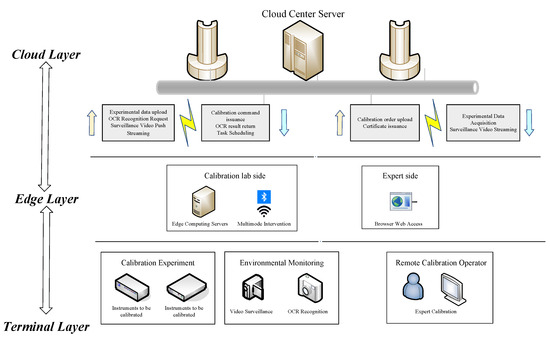
Figure 1.
Block Diagram of the Overall System Architecture.
3.1. Basic Tasks
The platform aims to utilize edge nodes for real-time data acquisition, initial calibration, and anomaly detection of on-site devices, reducing the load and latency on cloud transmission. Simultaneously, relying on the cloud’s powerful computing capabilities, it performs in-depth analysis and model optimization of complex calibration tasks through machine learning and deep learning algorithms, forming dynamic calibration strategies. The system must support multi-source heterogeneous device access and protocol compatibility, dynamically allocating resources between the cloud and edge layers through intelligent task scheduling modules to balance high-precision calibration requirements with real-time response capabilities. The basic tasks for each layer are as follows.
3.1.1. Cloud Layer
Deployed with central server clusters, the cloud layer serves as the core computing and management node of the entire architecture. It handles uploading and analyzing experimental data, processing OCR recognition requests, streaming monitoring videos, and scheduling calibration tasks. With its powerful computing capabilities and flexible microservice architecture, the cloud layer supports deep learning algorithms for complex calibration tasks, generates calibration results, and returns them to the edge layer. Additionally, the cloud layer issues certificates to ensure the authority and traceability of calibration results.
3.1.2. Edge Layer
The edge layer deploys edge computing modules that act as bridges connecting terminal devices with the cloud. These modules support multi-modal access, including Bluetooth, Wi-Fi, and other communication protocols, adapting to diverse device connection requirements. Key functions of the edge layer include preliminary processing of experimental data, local execution of simple calibration tasks, and uploading and distributing complex tasks. By leveraging real-time response capabilities of edge computing, the edge layer can quickly process calibration data on-site, reducing bandwidth required for data upload to the cloud. It also distributes complex tasks through a task scheduling module to ensure optimal resource utilization. Furthermore, the edge layer receives calibration commands from the cloud and passes them to terminal devices, completing the closed-loop of calibration tasks.
3.1.3. Terminal Layer
The terminal layer includes both the calibration laboratory side and the expert side. On the calibration laboratory side, it consists of instruments under calibration, calibration tools, environmental monitoring devices, and OCR recognition modules. Terminal devices connect with the edge layer to establish real-time monitoring of device status and remote execution of calibration tasks. During the calibration process, environmental parameters such as temperature, humidity, and electromagnetic interference are monitored via environmental monitoring modules, and the calibration process is recorded and data extracted using video monitoring devices and OCR recognition modules. After calibration, devices adjust their measurement parameters based on the calibration results to ensure compliance with measurement accuracy.
Additionally, the system designs an expert interface module, enabling experts to remotely participate in calibration tasks and monitoring through browser-based web interfaces. The expert interface not only provides real-time data viewing but also supports intervention and optimization of the calibration process, enhancing the flexibility and intelligence of the system. Through cloud–edge collaboration, the system fully leverages the powerful computing capabilities of the cloud layer and the rapid response capabilities of the edge layer, meeting the demands of large-scale, multi-user scenarios that traditional calibration methods struggle to cover. Moreover, by deploying edge nodes in a distributed manner, the system reduces dependence on the cloud, improving reliability and real-time performance.
4. Materials and Methods
Our system is designed with a value transmission system based on high-precision frequency-voltage conversion modules, a calibration experimental data acquisition and on-site monitoring system based on deep learning, and an information permission task management system based on a cloud–edge–end collaborative architecture. This aims to overcome the limitations of existing remote calibration systems, ensuring reliability, intelligence, and efficiency throughout the entire remote calibration process.
4.1. Value Transmission System Based on Satellite Signals
During the stage of instrument transportation and connection, standard devices are susceptible to environmental factors (such as temperature, humidity, vibration), leading to performance changes. However, the lack of detection methods and high-precision reference standards at the site impacts the accuracy of value transmission. To ensure the authority and credibility of remote calibration results, it is imperative that measurement outcomes from a remote calibration platform are traceable to international or national standards. By leveraging precise time and frequency signals transmitted via satellite, this study proposes a novel value transmission framework based on high-precision frequency-to-voltage conversion modules. The system employs an network time protocol (NTP) time server to convert the received satellite signal into a stable reference frequency.
Value Transfer System Architecture
Value transfer denotes the systematic transmission of standardized reference values between locations to ensure measurement consistency across diverse environments. Traceability ensures that these measurements can be unequivocally linked to internationally or nationally recognized standards, thereby enhancing their metrological credibility. In remote calibration, standard equipment employed for value transfer is susceptible to environmental perturbations—such as temperature fluctuations, humidity variations, and mechanical vibrations—during transportation or operation. These disturbances can compromise the accuracy of value transfer, particularly since on-site validation of such changes is often impractical. Furthermore, the absence of high-precision reference standards at remote sites hinders the detection and quantification of errors introduced during the transfer process, directly undermining traceability. Conventional internet-based value transfer methods face critical challenges in ensuring data security and reliability, especially over long-distance networks. In contrast, satellite-based transmission of precise time-frequency signals provides a robust alternative for achieving secure and accurate value transfer in remote calibration applications. To address these challenges, this study proposes a satellite-signal-driven value transfer system tailored for remote calibration scenarios. The system focuses on instrument calibration using auxiliary components such as an NTP network time server, a high-precision frequency-to-voltage conversion module, field-programmable gate arrays, wireless communication modules, and power supply units. A schematic overview of the experimental setup is presented in Figure 2.

Figure 2.
Modular Design Architecture of the System.
The execution flow of the system is as follows:
- Satellite Signal Reception and Square Wave Conversion: The system uses the TF-1006-Pro (Beijing Qianxing Time & Frequency Technology Co., Ltd., Beijing, China) model NTP network time server, capable of receiving satellite signals and converting them into a 10 MHz square wave signal. This square wave has a frequency accuracy better than over 24 h and adheres to TTL level standards.
- FPGA Generation of Frequency Control Signals: A frequency-to-voltage conversion circuit is constructed using high-speed MOS switches and precision capacitors. Specifically, ADG712 high-speed MOS switches from Analog Devices (Analog Devices, Inc. (ADI)Norwood, MA, USA) and mica capacitors are utilized.
- Power Supply Current Source Output: The current source supplying necessary current for the circuit is designed around the OPA227 operational amplifier. The voltage input to this current source employs a highly precise 7.0196356 V voltage reference.
- Transmission of Calibrated Voltage Amplitude and Phase Information: The FPGA chip used is the XC7A200T-2FBG484I ( AMD (Advanced Micro Devices Inc.), Santa Clara, CA, USA), while the core of the wireless communication module is the ESP32-DOWDR2-V3 (Espressif Systems (Shanghai) Co., Ltd., Shanghai, China) main control chip.
4.2. Key Modules
4.2.1. NTP Network Time Server
Modern NTP network time servers can receive signals from GPS, BeiDou, GLONASS, and QZSS satellites. These servers discipline internal oven-controlled crystal oscillators (OCXOs) using received satellite timing signals to provide UTC-based, self-monitoring, and highly stable primary clock synchronization signals. Using closed-loop control technology, the system learns and compensates for aging drift characteristics of the OCXOs, allowing it to maintain accurate time synchronization even after satellite signal interruptions or disturbances. Most NTP network time servers can generate high-precision 10 MHz clock signals closely aligned with satellite signals. This paper utilizes the TF-1006-Pro NTP network time server, shown in Figure 3, which receives satellite signals and converts them into a 10 MHz square wave signal with a frequency accuracy better than (averaged over 24 h).

Figure 3.
NTP Network Time Server.
4.2.2. High-Precision Frequency-to-Voltage Conversion Module
Djemouai et al. proposed a classic frequency-to-voltage converter (FVC) circuit [26,27], as illustrated in Figure 4. Based on Djemouai’s research from 1998, to address these issues, we have enhanced the schematic proposed by Djemouai et al. [26,27,28,29,30], making improvements to the FVC design. Specifically, a voltage follower was added between capacitors C1 and C2, and another voltage follower along with an RC filter was added at the output of capacitor C2. Additionally, a diode was placed between switch SW1 and capacitor C1, and a discharge resistor was added to the discharge path of capacitor C1. The improved FVC schematic is shown in Figure 5.
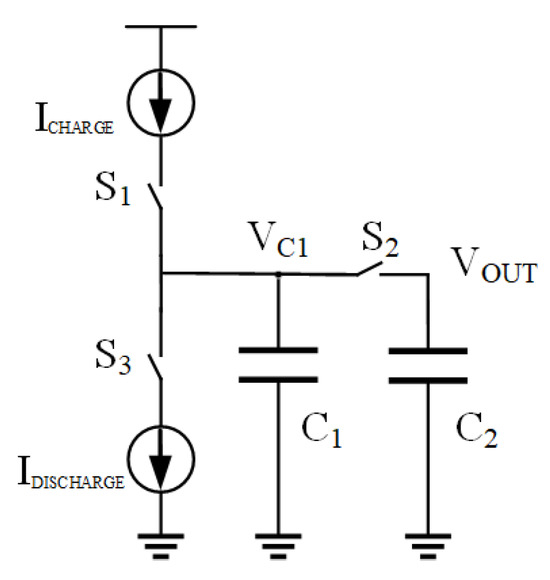
Figure 4.
Frequency-to-Voltage Conversion Schematic [26,27].
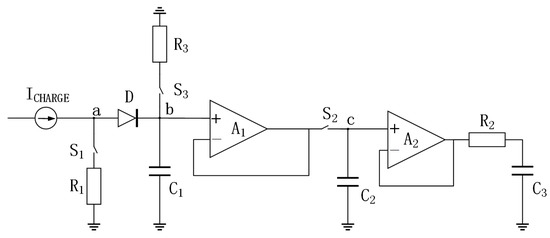
Figure 5.
Improved Frequency-to-Voltage Conversion Schematic.
4.2.3. Power Supply Module
The power supply module for the frequency-to-voltage conversion module is designed as shown in Figure 6. All resistors R1-R5 in the circuit are precision metal foil resistors. The 7 V power supply employs a voltage reference as shown in Figure 7.
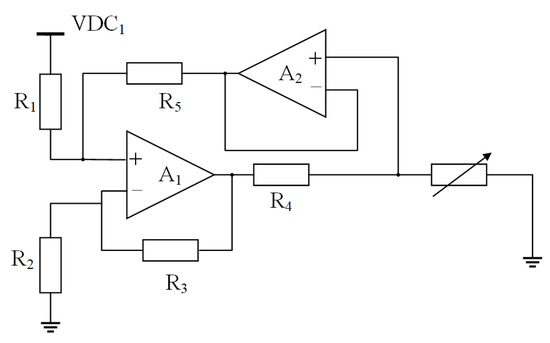
Figure 6.
Current Source Module.
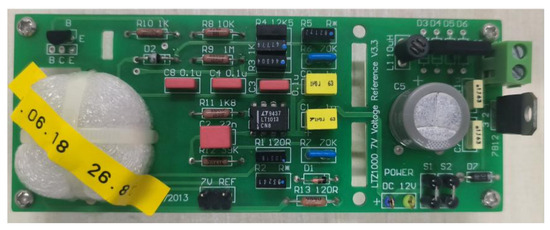
Figure 7.
7 V Voltage Reference.
4.2.4. FPGA and Wireless Communication Module
The main control chip for the FPGA is the XC7A200T-2FBG484I, used to receive the 10 MHz square wave signal from the NTP network time server and generate variable frequency control signals for the frequency-to-voltage conversion module. The wireless communication module’s main control chip is the ESP32-DOWDR2-V3, responsible for remotely controlling the FPGA to enable the system to output amplitude and phase-controllable DC/AC voltages.
4.3. Calibration Experiment Data Acquisition and On-Site Monitoring
In the process of data acquisition and command transmission, the lack of metrology technicians at the calibration site hinders direct data transmission to the central laboratory, while the absence of network interfaces on some verification instruments further increases the complexity of data collection and acquisition. A primary objective in the intelligent development of a remote calibration platform is to enable real-time data acquisition, preliminary calibration, and anomaly detection for automated on-site equipment. Utilizing artificial intelligence-based visual recognition technology, this paper introduces an intelligent approach for the acquisition of calibration experiment data and on-site monitoring.
4.3.1. Video Stream Transmission
The primary requirement for video stream transmission is to enable experts to grasp the experimental situation at the calibration site in real-time without being physically present. Video captured by cameras on-site is transmitted to the expert side, facilitating comprehensive monitoring and detailed observation of critical experimental processes. Through real-time video stream transmission, experts can remotely guide experimental operations, analyze experimental data, and adjust experimental protocols when necessary, thereby significantly enhancing experimental efficiency and resource utilization.
To achieve real-time video transmission at the field site while meeting the requirements of multi-camera acquisition and simultaneous viewing by multiple experts, this paper adopts a push–pull streaming architecture. In this architecture, the push end is responsible for encoding the captured video data and uploading it to the server, whereas the pull end allows multiple expert clients to retrieve the video stream from the server for real-time viewing. This mode not only supports synchronized transmission of multiple video channels but also enables dynamic adjustment of video resolution and smoothness based on network conditions, ensuring a high-quality viewing experience across different network environments. The overall framework is illustrated in Figure 8.

Figure 8.
Framework for Video Streaming Feature Implementation.
The design of the video streaming system comprises three main components: the streaming publisher, the streaming player, and the video server. Central to this architecture is the video server, which receives video data from the publisher and distributes it to the players. An open-source server known as the Simple Realtime Server (SRS) is employed due to its support of multiple protocols such as RTMP and HTTP-FLV, providing advantages including low latency and high scalability. Within a remote calibration framework for transformers, the streaming publisher captures live video footage from on-site cameras and transmits the data to the SRS video server (Version 6). FFmpeg (Version 6.1.1) or OBS (Version 30.1.2) software tools are utilized to push the video stream via the RTMP protocol. Remote experts can access the live video feed through devices that support HTTP-FLV protocol-based streaming, which is compatible with browser-based playback, enabling efficient monitoring and remote assistance during on-site calibration tasks. This architecture ensures stable and reliable video transmission from the source to remote viewers.
4.3.2. Instrument Data Recognition Design
The requirement for instrument data recognition functionality is to utilize cameras to capture clear images of instrument displays in real-time, extract key frames to reduce data processing loads, and employ OCR technology to convert critical data such as voltage, current, power, etc., into digital format. The system should automatically perform frame capturing, data recognition, and store the results in a database or cloud for subsequent analysis and retrieval. The overall design framework is illustrated in Figure 9.
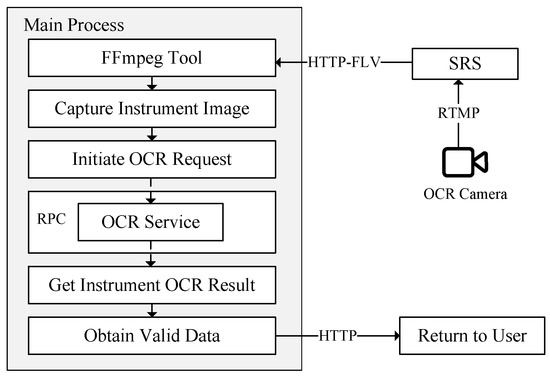
Figure 9.
Architectural Overview of the Instrument Data Recognition Module.
The system captures live images of on-site instrument displays using cameras to ensure high-resolution and high-quality image acquisition. The system subsequently utilizes FFmpeg tools to extract key frames from the video stream, thereby minimizing the data volume for downstream processing. Subsequently, the system initiates an OCR request and transmits the captured images to the OCR service module through a remote procedure call (RPC) for further processing. The OCR service performs optical character recognition on the instrument readings within the images, extracting critical parameters such as voltage and current, and returns the recognition results to the main processing thread. Upon receiving the OCR results, the main processing thread applies filtering mechanisms to retain only valid data, thereby enhancing accuracy and reliability. Ultimately, the processed data is transmitted to users via the HTTP protocol, enabling real-time access, viewing, and expert analysis by remote personnel.
4.4. Cloud–Edge–End Management System Based on Edge Intelligence
During the calibration and result feedback phase, due to the data diversity and complexity introduced by heterogeneous network nodes (e.g., environmental sensors and video data sources), traditional single-machine, single-task architectures face challenges in supporting multi-device coordination and concurrent user access, thereby limiting the efficiency and accuracy of calibration processes. The primary design objective of the cloud–edge–end collaborative remote calibration platform is to integrate cloud and edge computing technologies to construct a high-performance, secure, and scalable distributed architecture. By leveraging the computational and management capabilities of the cloud, this study develops an integrated system for managing information, permissions, and tasks.
4.4.1. Cloud-Based Information Management
The information management module serves as the core component for achieving standardized and process-driven data management within the system. It employs a modular architecture to manage key business entities throughout their lifecycle, including three main submodules: user management, calibration experiment management, and standard instrument management. This design is based on the Spring Boot framework and Java Persistence API (JPA) persistence layer technology, where entity classes are mapped to database tables.
User Management
This provides all users with functions such as login, registration, password reset, and forgotten password recovery. For system administrators, additional capabilities include creating, deleting, and editing user accounts. The corresponding user table structure is shown in Table 1.

Table 1.
User Table Structure.
The login function prompts users to input their registered username and password via the web interface. Upon selecting the login button, the system authenticates the provided credentials. Should either the username or password be incorrect, an error message is presented. During the registration process, users must supply a username, password (including confirmation), and email address. In the event that the selected username or email address is already registered, the system prompts the user to select an alternative. To guarantee data security, passwords are not stored in plaintext; instead, they undergo one-way encryption prior to storage in the database. The password authentication process during login is depicted in Figure 10.
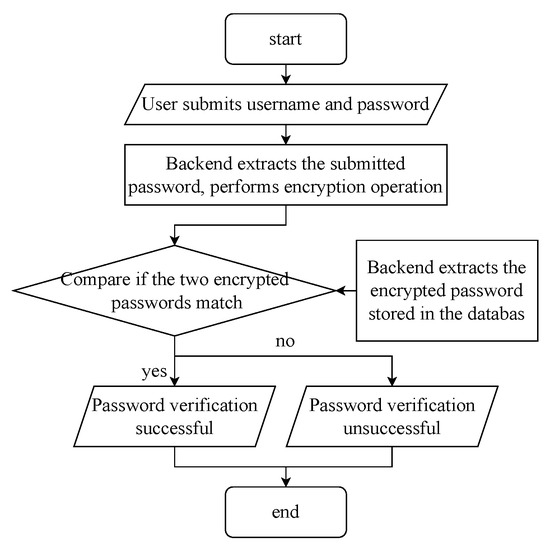
Figure 10.
Flowchart of Password Verification Process.
During the password verification process, the user submits their username and password. Upon receiving the password, the back-end performs an encryption operation on it. At the same time, the encrypted password (ciphertext) stored in the database is retrieved. The system then compares the encrypted password submitted by the user with the stored ciphertext to determine whether they match. If the ciphertexts match, the password verification is successful, and the user is granted access to the system. If the ciphertexts do not match, the verification fails, and the user is denied login access. This process ensures the security of user passwords, avoids the risks associated with storing or transmitting plaintext passwords, and enhances the overall security and reliability of the system through encryption and verification mechanisms.
Calibration Experiment Management
This is a critical component of the remote calibration system for instrument transformers. It provides comprehensive control and oversight of the calibration experiments, ensuring both procedural standardization and result accuracy. The system dynamically manages the entire lifecycle of each calibration experiment, as illustrated in Figure 11.
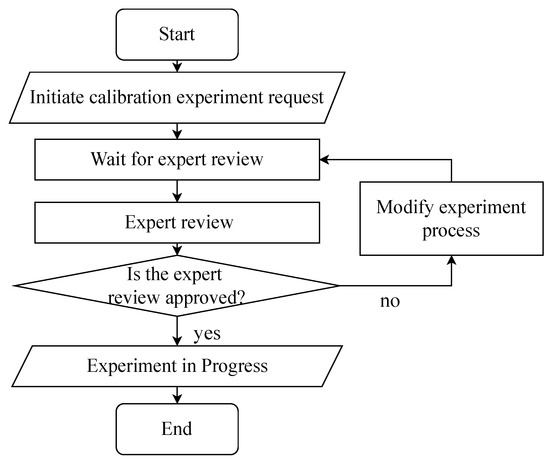
Figure 11.
State Diagram of Calibration Experiments.
The process begins when the requesting party initiates a calibration experiment request. The request then enters a waiting state for expert review. Based on the experimental requirements and actual conditions, the operator evaluates the request. If approved, the experiment status transitions to “In Progress”. After completion, it moves to the “Completed” state, marking the end of the experimental workflow. If the review is not passed, the experiment is returned to the “Revise Experiment Procedure” stage, where adjustments can be made before resubmitting the request. Table 2 shows the structure of the calibration experiment database table, which supports the comprehensive management and control of calibration experiments.

Table 2.
Calibration Experiment Table.
Standard Instrument Management
This is a crucial functional module for systematically managing standard instruments involved in remote calibration experiments of instrument transformers. This module ensures that the standard instruments used in calibration experiments are accurate, reliable, and traceable, thereby ensuring the scientific validity and standardization of experimental results. Specifically, standard instrument management includes the following functions:
- Cloud Digital Twin Library: Maintains digital records of instruments (models, metrological properties, usage status) synchronized with edge laboratories. Allows adding, deleting, or modifying instrument entries.
- Pre-calibration Self-inspection: Uses the IoT to verify instrument status before experiments begin.
- Add Instruments: Users can register new instruments by providing details like name, model, manufacturer, calibration certificate number, and validity period.
- Delete Instruments: Retired or expired instruments can be removed after permission verification, with records kept for historical purposes.
- Reference Instruments: Enables selecting suitable instruments from the library during experiment setup, ensuring compliance with standards and supporting data traceability.
Through the standard instrument management module, users can achieve full lifecycle management of standard instruments during experiments, including addition, deletion, referencing, and status monitoring. This not only improves the efficiency of instrument management but also provides strong support for the standardization and scientific nature of calibration experiments.
4.4.2. Permission Management Design
In the remote calibration software system for instrument transformers, permission management is a crucial module that ensures system security, standardization, and efficient operation. Given the involvement of multiple user roles in collaborative operations and the management and allocation of operational permissions for critical data, permission management effectively prevents unauthorized access or operations, ensuring normal system operation and data security.
As shown in Figure 12, the user roles are primarily divided into three categories: administrators, experts, and field operators. Administrators are responsible for overall system management and maintenance, including user management, permission assignment, experiment task approval, and system configuration. They have the highest level of permissions, allowing access to all functional modules and data resources, making them the core managers of the system. Experts are responsible for reviewing, guiding, and evaluating the content of calibration experiments to ensure their scientific validity and standardization. They possess partial management permissions, such as experiment approval, data analysis, and report generation. Field operators mainly handle specific experiment execution and data collection tasks, with their permissions strictly limited to functions related to experiment execution, such as instrument operation, data entry, and status monitoring. They cannot access sensitive data or perform system configurations. This role division and permission management allow the system to achieve fine-grained control over functional modules, ensuring each user focuses on their responsibilities and avoiding security issues or operational errors due to permission confusion.
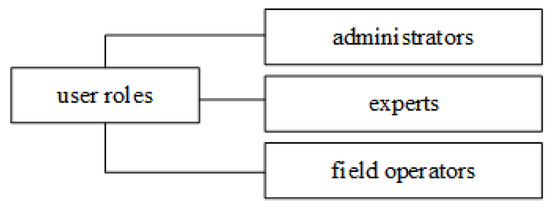
Figure 12.
User Role Hierarchy and Access Control in the System.
The permission management function is divided into two parts, namely front-end permission verification and back-end permission verification, controlling user permissions from both the user interface and server sides to implement a dual verification mechanism, enhancing system security.
Front-End Permission Management Scheme
The overall route guard flow for our project is illustrated in Figure 13. The logic of front-end route guards first checks if the requested page is public (e.g., login, registration pages). If it is a public page, the transition occurs directly; otherwise, it further checks whether the user is logged in. If the user is not logged in, they are redirected to the login page; if logged in, it continues to check whether the user has permission to access the specific page. If no permission exists, the user is denied access with a prompt; if permission exists, the page transition proceeds. This process ensures the legality and security of user page access.
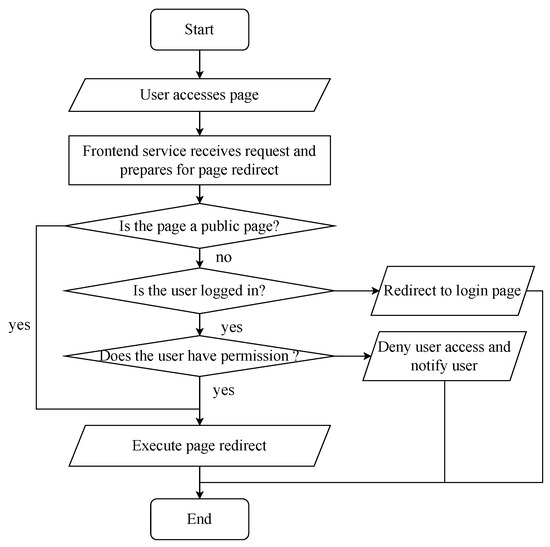
Figure 13.
Route Guard Flow for Front-End Page Access.
Back-End Permission Management Design
The logic of back-end permission management first determines whether the request is for a public page. If so, it performs a normal transition; if not, it verifies the login token. Users who are not logged in are intercepted and prompted to log in. Logged-in users are then checked for permission to access the target page. If permission exists, the transition proceeds normally; if not, they are intercepted and informed of lack of access rights. As shown in Figure 14, this entire process ensures controlled user access permissions and enhances security.
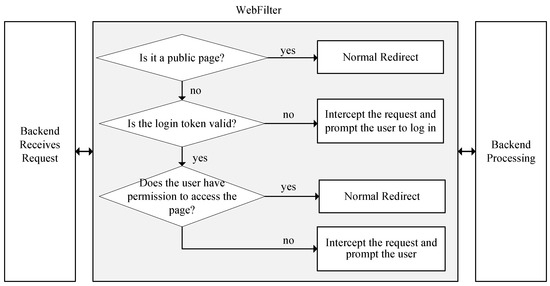
Figure 14.
Workflow of Back-End Permission Management and Authorization.
4.4.3. Cloud–Edge Collaboration Mechanism
Within the cloud–edge collaborative environment of the remote calibration system, tasks are generated by various sensor terminal devices. These tasks are managed by a task scheduling algorithm and can be processed either at the edge server nodes or offloaded to the central cloud computing node for execution. Designing an appropriate task scheduling scheme to minimize task completion latency is crucial for ensuring the efficient operation of the remote calibration system.
The main steps of the task scheduling algorithm designed for the remote calibration system are as follows:
- Terminal devices directly offload tasks to their associated edge server nodes via wireless channels.
- All task information from the terminals is sent to the cloud, where it is coordinated by a centralized scheduler. During this process, the scheduler determines whether a task should be executed at the edge node or in the cloud, based on factors such as task attributes and available computing resources.
- For tasks designated for cloud execution, the scheduler forwards them to the cloud node. The cloud node, equipped with powerful computational capabilities, handles complex computing requirements.
- For tasks retained at the edge server, the scheduling algorithm assigns them to the most suitable computing node for processing.
- Finally, the computation results are returned to the terminal devices through the edge node.
In this study, it is assumed that the number and size of tasks offloaded to the edge nodes are predetermined, and the transmission process from the terminal devices to the edge nodes is not analyzed. The focus is on the task scheduling problem within the cloud-edge collaborative environment.
Overall Modeling of Distributed Remote Calibration System
To achieve optimal network performance optimization solutions, the distributed remote calibration system is modeled as shown in the figure. The notation represents the distributed remote calibration network, where denotes the set of edge servers and cloud server nodes. Here, represents the cloud server, while represents edge servers. J indicates the set of edge servers, and represents the number of CPU cores on the corresponding edge server . The notation represents the distances between edge network nodes; if they belong to the same edge server, the distance is zero, i.e., . The set of edge terminal devices at various locations is denoted by . In the edge region , the task set represents tasks generated in that area. denotes the workload of a task on an edge server, indicates the edge server processing the task (decision variable), denotes the edge server initiating the task, and represents the number of CPU cores on the edge server processing the task.
When is executed on an edge server, the scheduling program is responsible for assigning an appropriate computing node, meaning the task set must be mapped to the corresponding computing nodes, as illustrated in Figure 15. Let denote that is executed on node ; otherwise, . If and , it means is executed locally on the edge node; otherwise, it is transmitted to another computing node for execution. If is scheduled to be executed in the cloud, it must first pass through the backhaul link between the edge node and the cloud. For simplicity, each task’s bandwidth from the edge-cloud to the cloud is set as a constant value, denoted by , measured in bit/s. Similarly, the computational power assigned by the cloud to each task is also set as a constant, represented by .
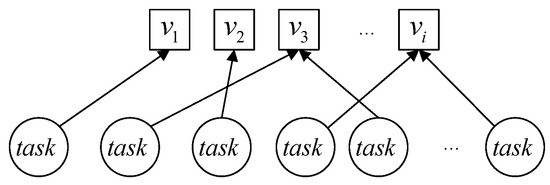
Figure 15.
Task Assignment Strategy Across Distributed Computing Nodes.
For ease of understanding, this paper uses to represent the scheduling result of . If the program schedules to be executed on , then . Specifically, indicates that is offloaded to the cloud for execution, thus . It is assumed that the computing resources of the computing nodes are allocated proportionally based on the computational requirements of each task. Let represent the total computational load assigned to . The computation delay can be calculated using Formula (3).
If is scheduled to be executed in the cloud, the total delay consists of transmission delay and computation delay . These delays are calculated using Formulas (4) and (5):
Thus, the total computation delay when is executed in the cloud is given by Formula (6), and the total computation delay when is executed on another edge node is given by:
Different tasks have varying degrees of sensitivity to delay. To more effectively account for this, different delay weight values can be assigned based on task priority, denoted by for task . The constraint formula is as follows:
The delay optimization problem is formulated mathematically as Formula (10). The constraints are defined by Formulas (11) and (12), ensuring that all tasks are scheduled and each task is assigned to exactly one unique computing node.
The optimization process is based on an iterative ant colony heuristic algorithm, which simulates the behavior of ants searching for the shortest path by dynamically updating pheromone levels. The algorithm begins by initializing pheromone values across all possible paths between nodes, providing a fair starting point for exploration. Next, ants probabilistically select paths based on both pheromone intensity and heuristic information—such as task workload and network distance. This pseudo-random selection balances exploration of new solutions with exploitation of known high-quality ones. Once an initial assignment of tasks to central and edge nodes is completed, the pheromone levels are locally updated to reinforce better matches and diminish less effective ones. After each full iteration, the system evaluates the best matching scheme found so far and compares it with previous results. If the current solution is superior, global pheromone levels are updated accordingly to reflect this improvement. The algorithm continues iterating until it reaches the maximum number of iterations or converges to a stable solution. Through this mechanism, the algorithm effectively balances exploration and exploitation, gradually refining task scheduling and resource allocation strategies. The result is an adaptive and efficient framework tailored for distributed remote calibration systems with complex constraints.
5. System Implementation and Testing
During the system testing phase, a thorough evaluation was conducted on key functional modules, calibration experiment management, expert-side interface, and field-side interface. Initially, through simulation of diverse scenarios, the stability and security of the user authentication mechanism were validated, ensuring seamless operation while mitigating the risk of unauthorized access. Subsequently, the calibration experiment management module underwent rigorous testing of functionalities—including experiment planning, execution, and result analysis—to validate its usability and functional comprehensiveness. Additionally, testing of the expert- and field-side interfaces emphasized user interaction experience and data processing performance, confirming that both experts and field personnel can perform experiments and analyze data with efficiency and precision.
The experiments were conducted using instrument transformer calibrators commonly employed in power systems, such as voltage and current transformer test sets. The system incorporates the TF-1006-Pro model NTP network time server. ADG712 high-speed MOS switches from Analog Devices and mica capacitors are used in the system. The operational amplifier employed in the signal conditioning circuit is the OPA227, and the FPGA chip integrated into the system is the XC7A200T-2FBG484I, while the central component of the wireless communication module is the ESP32-DOWDR2-V3 main control chip. The calibration tests were performed under controlled laboratory conditions, with an ambient temperature ranging from 10 °C to 35 °C and relative humidity maintained below 80%.
5.1. DC Voltage Test Results and Analysis
This subsection characterizes the linearity, accuracy, and stability of the DC voltage generated by the frequency-to-voltage conversion (FVC) module. Comparative measurements were performed against the GPD_4303S reference signal source utilizing a DAQ970A precision multimeter.
Table 3 and Table 4 quantify the linearity performance across discrete frequency intervals: 3–4 MHz, 4–5 MHz, 39–40 MHz, and 49–50 MHz. The 4–5 MHz interval exhibits the maximum linearity deviation of 0.1474%, establishing the baseline linearity for this operational regime. As shown in Table 3 and Table 4, a reduction in the linearity error is observed with an increase in the input frequency. The average linearity error across the 3.0–4.9 MHz frequency band is measured at 0.05461%, whereas it decreases to 0.02627% within the 39.0–49.9 MHz band. This result suggests that the system exhibits improved linearity performance at higher operating frequencies. Moreover, the GPD_4303S reference demonstrates voltage-dependent linearity degradation, with 0.4615% nonlinearity in the 1.5–1.9 V operational window compared to 0.0514% in the 1.99–2.39 V range. These empirical measurements substantiate the FVC module’s superior linearity relative to the reference system’s optimal performance.

Table 3.
DC Voltage Linearity Measurement-1.

Table 4.
DC Voltage Linearity Measurement-2.
Excitation frequencies below 2 MHz generate output potentials approaching 5 V, exceeding the threshold voltage of high-speed MOSFET switches and inducing nonlinear distortion mechanisms. Conversely, output voltages below 0.1 V (corresponding to input frequencies greater than 50 MHz) suffer from insufficient capacitive charge integration intervals, where MOSFET switching transients dominate the system response, resulting in amplitude attenuation and nonlinearity amplification. Consequently, the validated operational domain is confined to the range of 0.1 V to 4.5 V, as illustrated in Figure 16, which provides a systematic comparison of linearity characteristics within the operational range of 0.5 V to 4.5 V.
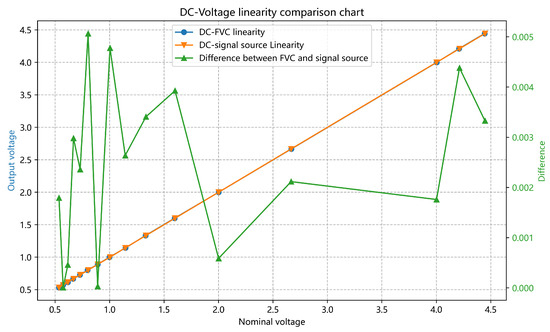
Figure 16.
DC Voltage Linearity Comparison.
To quantitatively evaluate the calibration accuracy, this study conducted comparative analysis of the FVC module and reference signal source using first-order linear calibration functions () across the 0.5–4.44 V range, as illustrated in Figure 17. Following calibration, the DC-FVC module exhibits a maximum absolute error of 0.0034 V compared to 0.0019 V for the reference system, yielding an inter-system deviation of 0.00319 V. The maximum accuracy error of the DC FVC is 0.1214%, whereas the reference signal has a maximum accuracy error of 0.1545%. Consequently, the output voltage accuracy of the DC FVC is superior to that of the DC voltage provided by the reference signal.
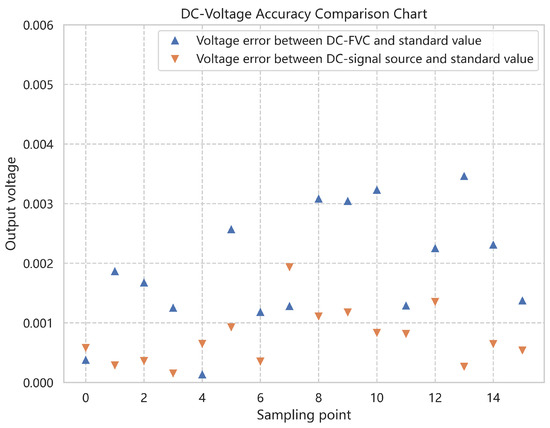
Figure 17.
DC Voltage Accuracy Comparison.
For the assessment of voltage stability between the FVC module and a reference signal source, Figure 18 illustrates the performance under stabilized output voltages of 0.83 V and 1.53 V. Experimental data were collected using 600 samples obtained over a 15 min interval following stabilization. Analysis of these data reveals that the DC-FVC module exhibits a maximum output variation of 0.004 V over the 15 min period, compared to a 0.002 V variation observed in the reference signal source. Therefore, the output voltage stability of traditional signal sources is slightly better than that of DC FVC, but the difference between the two is not significant.
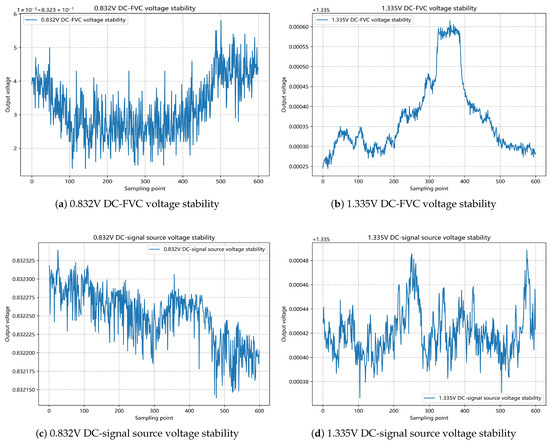
Figure 18.
DC Voltage Stability Comparison.
5.2. High-Concurrency Performance Test
To meet the growing demands of users, concurrent performance has become a critical metric for our system. As more features and user interactions are added to the remote calibration software for mutual inductors, it is essential that the back-end can handle high volumes of simultaneous requests without significant degradation in response time or reliability. In order to avoid introducing performance bottlenecks during testing, we adopted a distributed setup with the server and client machines separated. This ensured that test results were not influenced by local resource constraints or network proximity. The hardware and software configurations of the test machines are summarized in Table 5. We simulated two different network environments: public WAN and internal LAN. These settings allowed us to assess how network latency and bandwidth limitations affect API performance.

Table 5.
Test Machine Configurations.
A set of representative back-end API endpoints were selected for stress testing. These APIs correspond to core functionalities within the system and are listed in Table 6. The system was tested under increasing concurrency levels, from 100 to 10,000 simultaneous users, over both WAN and LAN connections. The key performance metrics from the WAN tests are summarized in Table 7. Under moderate loads, the system performs well. With up to 5000 concurrent users, most requests complete within one second. Moreover, to assess the system’s performance without network constraints, we conducted additional tests in a LAN environment, where latency was minimal and bandwidth was not limited. This allowed us to evaluate the back-end’s intrinsic performance. The results from the LAN tests are shown in Table 8. These results show that, without network limitations, the system can handle very high traffic volumes. At 10,000 concurrent users, the average response time is only 329 ms, with over 12,000 requests processed per second. This is significantly better than the WAN case, which achieves just over 1000 requests per second at similar load levels. The comparison between WAN and LAN results highlights the impact of network conditions on system performance. In a low-latency environment, the system delivers higher throughput and lower latency. Therefore, deploying the system in optimized network environments could greatly improve user experience.

Table 6.
Tested Back-End API Endpoints.

Table 7.
Back-End WAN Performance.

Table 8.
Back-End LAN Performance.
The front-end was tested under increasing concurrency levels, ranging from 100 to 10,000 users, in both wide area network (WAN) and local area network (LAN) environments. The simplified performance metrics are summarized in Table 9 and Table 10, respectively. As shown in Table 9, the front-end performs well even under WAN conditions, despite higher network latency and limited bandwidth. While response times increase at higher concurrency levels, the system maintains acceptable throughput and stability, demonstrating robustness under real-world network constraints. In contrast, under LAN conditions, the front-end achieves excellent performance with consistently low average and maximum response times across all concurrency levels. This indicates strong scalability and efficient handling of high request volumes when network limitations are minimized. Overall, the results show that the front-end delivers solid performance in both network environments, with particularly strong results under LAN conditions.

Table 9.
Front-End WAN Performance.

Table 10.
Front-End LAN Performance.
The experiment involved sending requests to the aforementioned front-end and back-end interfaces in both LAN and WAN environments. Under high concurrency testing in a LAN environment, the system was subjected to 10,000 concurrent requests on both the front-end and back-end. Under this pressure, the system performed excellently, with front-end average response times stabilized within 200 ms and back-end responses kept under 400 ms. This outcome demonstrates the system’s robust capability to handle high concurrency efficiently, ensuring smooth business continuity and user experience under ideal network conditions. Furthermore, during tests involving 5000 concurrent requests, except for certain interfaces experiencing slightly increased delays due to specific business logic or complex data processing, most interfaces maintained response times within several hundred milliseconds. This indicates that the overall system architecture design is sound, with efficient resource allocation and scheduling mechanisms capable of supporting large-scale concurrent user access.
5.3. Cloud–Edge Collaboration Evaluation
To evaluate the effectiveness of the cloud-edge collaboration approach, we conducted experiments using several algorithms: first-come-first-served (FCFS), traditional greedy algorithm, network-optimized greedy algorithm, and the proposed improved ant colony algorithm based on cloud-edge collaboration. The evaluation focused on total weighted execution time as the key performance metric. Experiments were conducted from two perspectives: algorithm effectiveness under varying task scales and under varying numbers of servers.
In Experiment 1, we compared the proposed improved ant colony algorithm against FCFS, traditional greedy, and network-optimized greedy algorithms under different task scales. The experimental setup assumed limited bandwidth between regions, with a total of eight nodes (cloud + edge). Tasks originated solely from the edge side, and the number of tasks varied from 10 to 45. Experimental results demonstrated that the proposed algorithm significantly reduced total weighted execution time across all task scales. Figure 19a shows the detailed comparison.
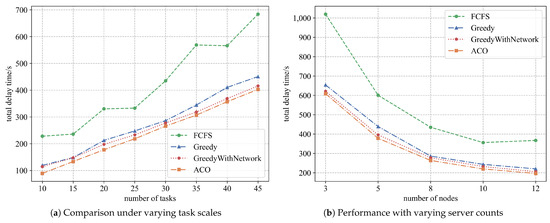
Figure 19.
Algorithm Performance Comparison under Different Experimental Settings.
In Experiment 2, we evaluated the algorithm’s performance under varying numbers of servers. With 30 tasks generated from the edge side and fixed bandwidth conditions, server counts were varied between 3, 5, 8, 10, and 12. Results showed that the proposed method outperformed the other algorithms consistently across all server configurations, further validating its robustness and scalability. Figure 19b illustrates the findings.
5.4. Discussion
Systematic testing confirms that the proposed FVC module demonstrates linearity comparable to that of conventional methods, with an average nonlinearity of 0.05437 within the 3.0–4.9 MHz frequency range. In the 39.0–49.9 MHz range, the linearity error is reduced by 67.39%, indicating enhanced high-frequency accuracy. Measurement accuracy is improved by 0.0331% within the 0.5–4.44 V range, which confirms its superior precision. Under conditions of high concurrency, the system successfully handled 10,000 simultaneous requests, maintaining front-end response times below 200 ms and back-end response times under 400 ms, thereby demonstrating robust stability. This system supports multi-point, multi-device concurrency, which contrasts with traditional single-node architectures and enables effective mitigation of performance bottlenecks in high-load environments.
It should be noted that the current experimental evaluation did not include specific tests on the speed and accuracy of OCR processing. Potential challenges in real-world deployment may include GPU resource limitations under high volumes of OCR requests, as well as the technical difficulties associated with cross-site networking in large-scale distributed environments. Regulatory constraints and compliance standards pertaining to data security in remote calibration must also be considered, particularly regarding the integrity, confidentiality, and traceability of calibration data within distributed system architectures.
6. Conclusions
This paper presented a distributed remote calibration strategy based on a cloud–edge–terminal architecture, addressing the limitations of traditional remote calibration systems in terms of security, reliability, and multi-device collaboration in modern power systems. The strategy integrated intelligent sensing, IoT communication technologies, and edge computing. It employed a high-precision frequency-to-voltage conversion module based on satellite signals to solve traceability issues, and combined environmental monitoring with OCR-based video recognition to achieve intelligent recording and data extraction during calibration. Furthermore, by optimizing resource allocation through cloud–edge task scheduling algorithms, the system achieved enhanced response speed and service quality. We constructed a measurement traceability framework from satellite signals to AC voltage calibration signals, as well as an intelligent data acquisition and monitoring system for calibration experiments. This enabled round-the-clock visual monitoring of operational processes, instrument statuses, and environmental parameters. Additionally, the integrated cloud–edge information, permission, and task management system ensured standardized data processing and secure multi-user collaboration. This solution not only enhanced the intelligence and accuracy of remote calibration but also provided strong technical support for ensuring measurement precision and operational performance compliance, meeting the demands of distributed multi-terminal applications and demonstrating significant innovation and practical value.
Future research should focus on improving the system’s adaptability and robustness, especially in complex and dynamic environments, to maintain high accuracy and reliability. Emphasis should also be placed on secure data transmission and privacy protection, including the development of advanced encryption and access control mechanisms to safeguard data integrity across the entire cloud-edge-terminal architecture. Moreover, future work could also explore standardized protocols for interoperability among heterogeneous devices and robust uncertainty modeling [31] to improve system reliability. These efforts could support the development of open, collaborative calibration ecosystems with broad applications in precision measurement and intelligent monitoring.
Author Contributions
Conceptualization, Q.W. and J.F.; Methodology, Q.W.; Software, X.H.; Validation, X.H. and X.Z.; Formal Analysis, X.Y. and J.Z.; Investigation, X.Y.; Data Curation, X.Q. and J.Z.; Writing—Original Draft Preparation, J.F.; Writing—Review and Editing, Q.W. and J.F.; Visualization, X.H. and X.Q.; Supervision, Q.W.; Project Administration, Q.W. and X.Z.; Funding Acquisition, Q.W. Resources were provided by the China Electric Power Research Institute and the State Grid Shanxi Marketing Service Center. All authors have read and agreed to the published version of the manuscript.
Funding
This work was supported by the State Grid Science and Technology Project: 5700-202315274A-1-1-ZN “Research on Key Technologies for Remote Calibration of Transformer Calibration Instrument Based on Beidou Time Frequency Synchronization”.
Data Availability Statement
Data available on request from the authors due to (privacy restrictions).
Conflicts of Interest
Authors Quan Wang, Jiliang Fu, Xiaodong Yin, Jun Zhang, and Xin Qi were employed by the China Electric Power Research Institute; the National Center for High Voltage Measurement; and the Key Laboratory of Measurement and Test of High Voltage and Heavy Current, State Administration for Market Regulation. Authors Xia Han and Xuerui Zhang were employed by the State Grid Shanxi Marketing Service Center. All authors declare that the research was conducted in the absence of any commercial or financial relationships that could be construed as a potential conflict of interest.
Abbreviations
The following abbreviations are used in this manuscript:
| IoT | Internet of Things |
| OCR | Optical Character Recognition |
| NRC | National Research Council |
| NPL | National Physical Laboratory |
| NIST | National Institute of Standards and Technology |
| NIM | National Institute of Metrology of China |
| HOG | Histogram of Oriented Gradients |
| CNN | Convolutional Neural Network |
| CRNN | Convolutional Recurrent Neural Network |
| DCNN | Deep Convolutional Neural Networks |
| RNN | Recurrent Neural Networks |
| VI | Virtual Instrumentation |
| GUIs | Graphical User Interfaces |
| NTP | Network Time Protocol |
| OCXOs | Oven-Controlled Crystal Oscillators |
| FVC | Frequency-to-Voltage Converter |
| SRS | Simple Realtime Server |
| RPC | Remote Procedure Call |
| FCFS | First-Come-First-Served |
References
- Zhang, F.; Li, X.; Li, Y.; Zhou, Z. Research on calibration method for measurement error of multiple rate carrier energy meter. J. Phys. Conf. Ser. 2024, 2815, 012032. [Google Scholar] [CrossRef]
- Qu, Z.; Jiao, Y.; Li, H.; Chen, Q.; Zhu, Y.; Wei, W. An Online Accuracy Evaluation Method for Smart Electricity Meter Calibration Devices Based on Mutual Correlations of Calibration Data. IEEE Trans. Instrum. Meas. 2024, 73, 1–13. [Google Scholar] [CrossRef]
- Carstens, H.; Xia, X.; Yadavalli, S. Low-cost energy meter calibration method for measurement and verification. Appl. Energy 2017, 188, 563–575. [Google Scholar] [CrossRef]
- Wang, Q.; Li, H.; Wang, H.; Zhang, J.; Fu, J. A Remote Calibration Device Using Edge Intelligence. Sensors 2022, 22, 322. [Google Scholar] [CrossRef] [PubMed]
- Wang, Q.; Zhang, J.; Lei, M.; Li, H.; Peng, K.; Hu, M. Toward Wide Area Remote Sensor Calibrations: Applications and Approaches. IEEE Sens. J. 2024, 24, 8991–9001. [Google Scholar] [CrossRef]
- Zha, Z.; Ge, H.; Zou, C.; Long, F.; He, X.; Wu, G.; Dong, C.; Deng, T.; Xu, J. Synchronous Remote Calibration for Electricity Meters: Application and Optimization. Appl. Sci. 2025, 15, 1259. [Google Scholar] [CrossRef]
- Fang, L.; Ma, Y.; Duan, S.; Li, Y.; Lan, K.; Faraj, Y.; Wei, Z. Research on Remote Calibration System of Voltage Source Based on Common-View Method. SSRN Electron. J. 2022. [Google Scholar] [CrossRef]
- Fang, L.; Li, Y.; Duan, S.; Lan, K. Remote value transmission and traceability technology of measuring instruments based on wireless communication. Rev. Sci. Instrum. 2023, 94, 021501. [Google Scholar] [CrossRef] [PubMed]
- Davis, J.; Stevens, M.; Whibberley, P.; Stacey, P.; Hlavac, R. Commissioning and validation of a GPS common-view time transfer service at NPL. In Proceedings of the IEEE International Frequency Control Symposium and PDA Exhibition Jointly with the 17th European Frequency and Time Forum, Flagship Tampa, FL, USA, 4–8 May 2003; pp. 1025–1031. [Google Scholar] [CrossRef]
- Baca, L.; Duda, L.; Walker, R.; Oldham, N.; Parker, M. Internet-Based Calibration of a Multifunction Calibrator. In Proceedings of the 2000 National Conference of Standards Laboratories Workshop and Symposium (NCSL), Toronto, ON, Canada, 16–20 July 2000; pp. 1–7. [Google Scholar]
- Rovera, G.D.; Chupin, B.; Abgrall, M.; Uhrich, P. A simple computation technique for improving the short term stability and the robustness of GPS TAIP3 common-views. In Proceedings of the 2013 Joint European Frequency and Time Forum & International Frequency Control Symposium (EFTF/IFC), Flagship Prague, Czech Republic, 21–25 July 2013; pp. 827–830. [Google Scholar] [CrossRef]
- Wouters, M.J.; Marais, E.L.; Gupta, A.S.; bin Omar, A.S.; Phoonthong, P. The Open Traceable Time Platform: Open Source Software and Hardware for Dissemination of Traceable Time and Frequency. In Proceedings of the 2019 Joint Conference of the IEEE International Frequency Control Symposium and European Frequency and Time Forum (EFTF/IFC), Orlando, FL, USA, 14–18 April 2019; pp. 1–2. [Google Scholar] [CrossRef]
- Jeang, Y.L.; Chen, L.B.; Huang, C.P.; Hsu, Y.H.; Yeh, M.Y.; Yang, K.M. Design of FPGA-based adaptive remote calibration control system. In Proceedings of the 2003 IEEE International Conference on Field-Programmable Technology (FPT) (IEEE Cat. No. 03EX798), Tokyo, Japan, 17 December 2003; pp. 299–302. [Google Scholar] [CrossRef]
- Xu, X. Research on Remote Calibration Technology Based on Virtual Instruments. Ph.D. Thesis, Northwestern Polytechnical University, Xi’an, China, 2006. [Google Scholar]
- Ouyang, H.; Ding, D.; Li, Y.; Wang, X. Research on Remote Calibration System Based on LabVIEW. J. Astronaut. Metrol. Meas. 2020, 40, 32–37. [Google Scholar]
- Albu, M.; Ferrero, A.; Mihai, F.; Salicone, S. Remote calibration using mobile, multiagent technology. IEEE Trans. Instrum. Meas. 2005, 54, 24–30. [Google Scholar] [CrossRef]
- Haur, Y.E.; Roziati, Z.; Rashid, Z.A.A. Internet-based calibration of measurement instruments. In Proceedings of the 2006 International Conference on Computing & Informatics, Kuala Lumpur, Malaysia, 6–8 June 2006; pp. 1–6. [Google Scholar] [CrossRef]
- Jebroni, Z.; Chadli, H.; Chadli, E.; Tidhaf, B. Remote calibration system of a smart electrical energy meter. J. Electr. Syst. 2017, 13, 806–823. [Google Scholar]
- Han, K.; Ding, C.; Yu, L.; Chen, Q. Application Study of NIMDO-Based Time and Frequency Remote Calibration. Metrol. Sci. Technol. 2021, 65, 9–12. [Google Scholar] [CrossRef]
- Fang, L.; Duan, S.; Li, Y.; Ma, X.; Lan, K. A New Model for Remote Calibration of Voltage Source Based on GPS Common-View Method. IEEE Trans. Instrum. Meas. 2023, 72, 1–9. [Google Scholar] [CrossRef]
- Zhao, N. Design and Implementation of a Field Virtual Instrument Control System for Remote Data Acquisition. Foreign Electron. Meas. Technol. 2018, 37, 130–134. [Google Scholar] [CrossRef]
- Uchida, S. Text Localization and Recognition in Images and Video. In Handbook of Document Image Processing and Recognition; Doermann, D., Tombre, K., Eds.; Springer: London, UK, 2014; pp. 843–883. [Google Scholar] [CrossRef]
- Ye, Q.; Doermann, D. Text Detection and Recognition in Imagery: A Survey. IEEE Trans. Pattern Anal. Mach. Intell. 2015, 37, 1480–1500. [Google Scholar] [CrossRef] [PubMed]
- Zhu, Y.; Yao, C.; Bai, X. Scene text detection and recognition: Recent advances and future trends. Front. Comput. Sci. 2016, 10, 19–36. [Google Scholar] [CrossRef]
- Shi, B.; Bai, X.; Yao, C. An End-to-End Trainable Neural Network for Image-Based Sequence Recognition and Its Application to Scene Text Recognition. IEEE Trans. Pattern Anal. Mach. Intell. 2017, 39, 2298–2304. [Google Scholar] [CrossRef] [PubMed]
- Djemouai, A.; Sawan, M.; Slamani, M. High performance integrated CMOS frequency-to-voltage converter. In Proceedings of the Tenth International Conference on Microelectronics (Cat. No.98EX186), Monastir, Tunisia, 16–16 December 1998; pp. 63–66. [Google Scholar] [CrossRef]
- Djemouai, A.; Sawan, M.; Slamani, M. New frequency-locked loop based on CMOS frequency-to-voltage converter: Design and implementation. IEEE Trans. Circuits Syst. II Analog Digital Signal Process. 2001, 48, 441–449. [Google Scholar] [CrossRef]
- Bui, H.T.; Savaria, Y. High-speed differential frequency-to-voltage converter. In Proceedings of the 3rd International IEEE-NEWCAS Conference, Quebec, QC, Canada, 22–22 June 2005; pp. 373–376. [Google Scholar] [CrossRef]
- Bui, H.T.; Savaria, Y. Design of a High-Speed Differential Frequency-to-Voltage Converter and Its Application in a 5-GHz Frequency-Locked Loop. IEEE Trans. Circuits Syst. I Regul. Pap. 2008, 55, 766–774. [Google Scholar] [CrossRef]
- Ding, X.; Wu, J.; Chen, C. A Fast Settling Frequency-to-Voltage Converter with Separate Voltage Tracing Technique for FLLs. In Proceedings of the 2021 18th International Conference on Electrical Engineering/Electronics, Computer, Telecommunications and Information Technology (ECTI-CON), Chiang Mai, Thailand, 19–22 May 2021; pp. 700–703. [Google Scholar] [CrossRef]
- Dong, Z.; Zhang, X.; Zhang, L.; Giannelos, S.; Strbac, G. Flexibility enhancement of urban energy systems through coordinated space heating aggregation of numerous buildings. Appl. Energy 2024, 374, 123971. [Google Scholar] [CrossRef]
Disclaimer/Publisher’s Note: The statements, opinions and data contained in all publications are solely those of the individual author(s) and contributor(s) and not of MDPI and/or the editor(s). MDPI and/or the editor(s) disclaim responsibility for any injury to people or property resulting from any ideas, methods, instructions or products referred to in the content. |
© 2025 by the authors. Licensee MDPI, Basel, Switzerland. This article is an open access article distributed under the terms and conditions of the Creative Commons Attribution (CC BY) license (https://creativecommons.org/licenses/by/4.0/).