Application of the GM(1,1) Model in Predicting the Cohesion of Laterite Soil Under Dry–Wet Cycles with Temporal Translational Symmetry
Abstract
1. Introduction
2. Sample Preparation and Testing Program
2.1. Sample Preparation
| Specimen | Liquid Limit | Plastic Limit | Optimum Moisture Content | Maximum Dry Density |
|---|---|---|---|---|
| laterite soil | 55.22% | 30.24% | 26.70% | 1.50 g/cm3 |
2.2. Testing Procedure
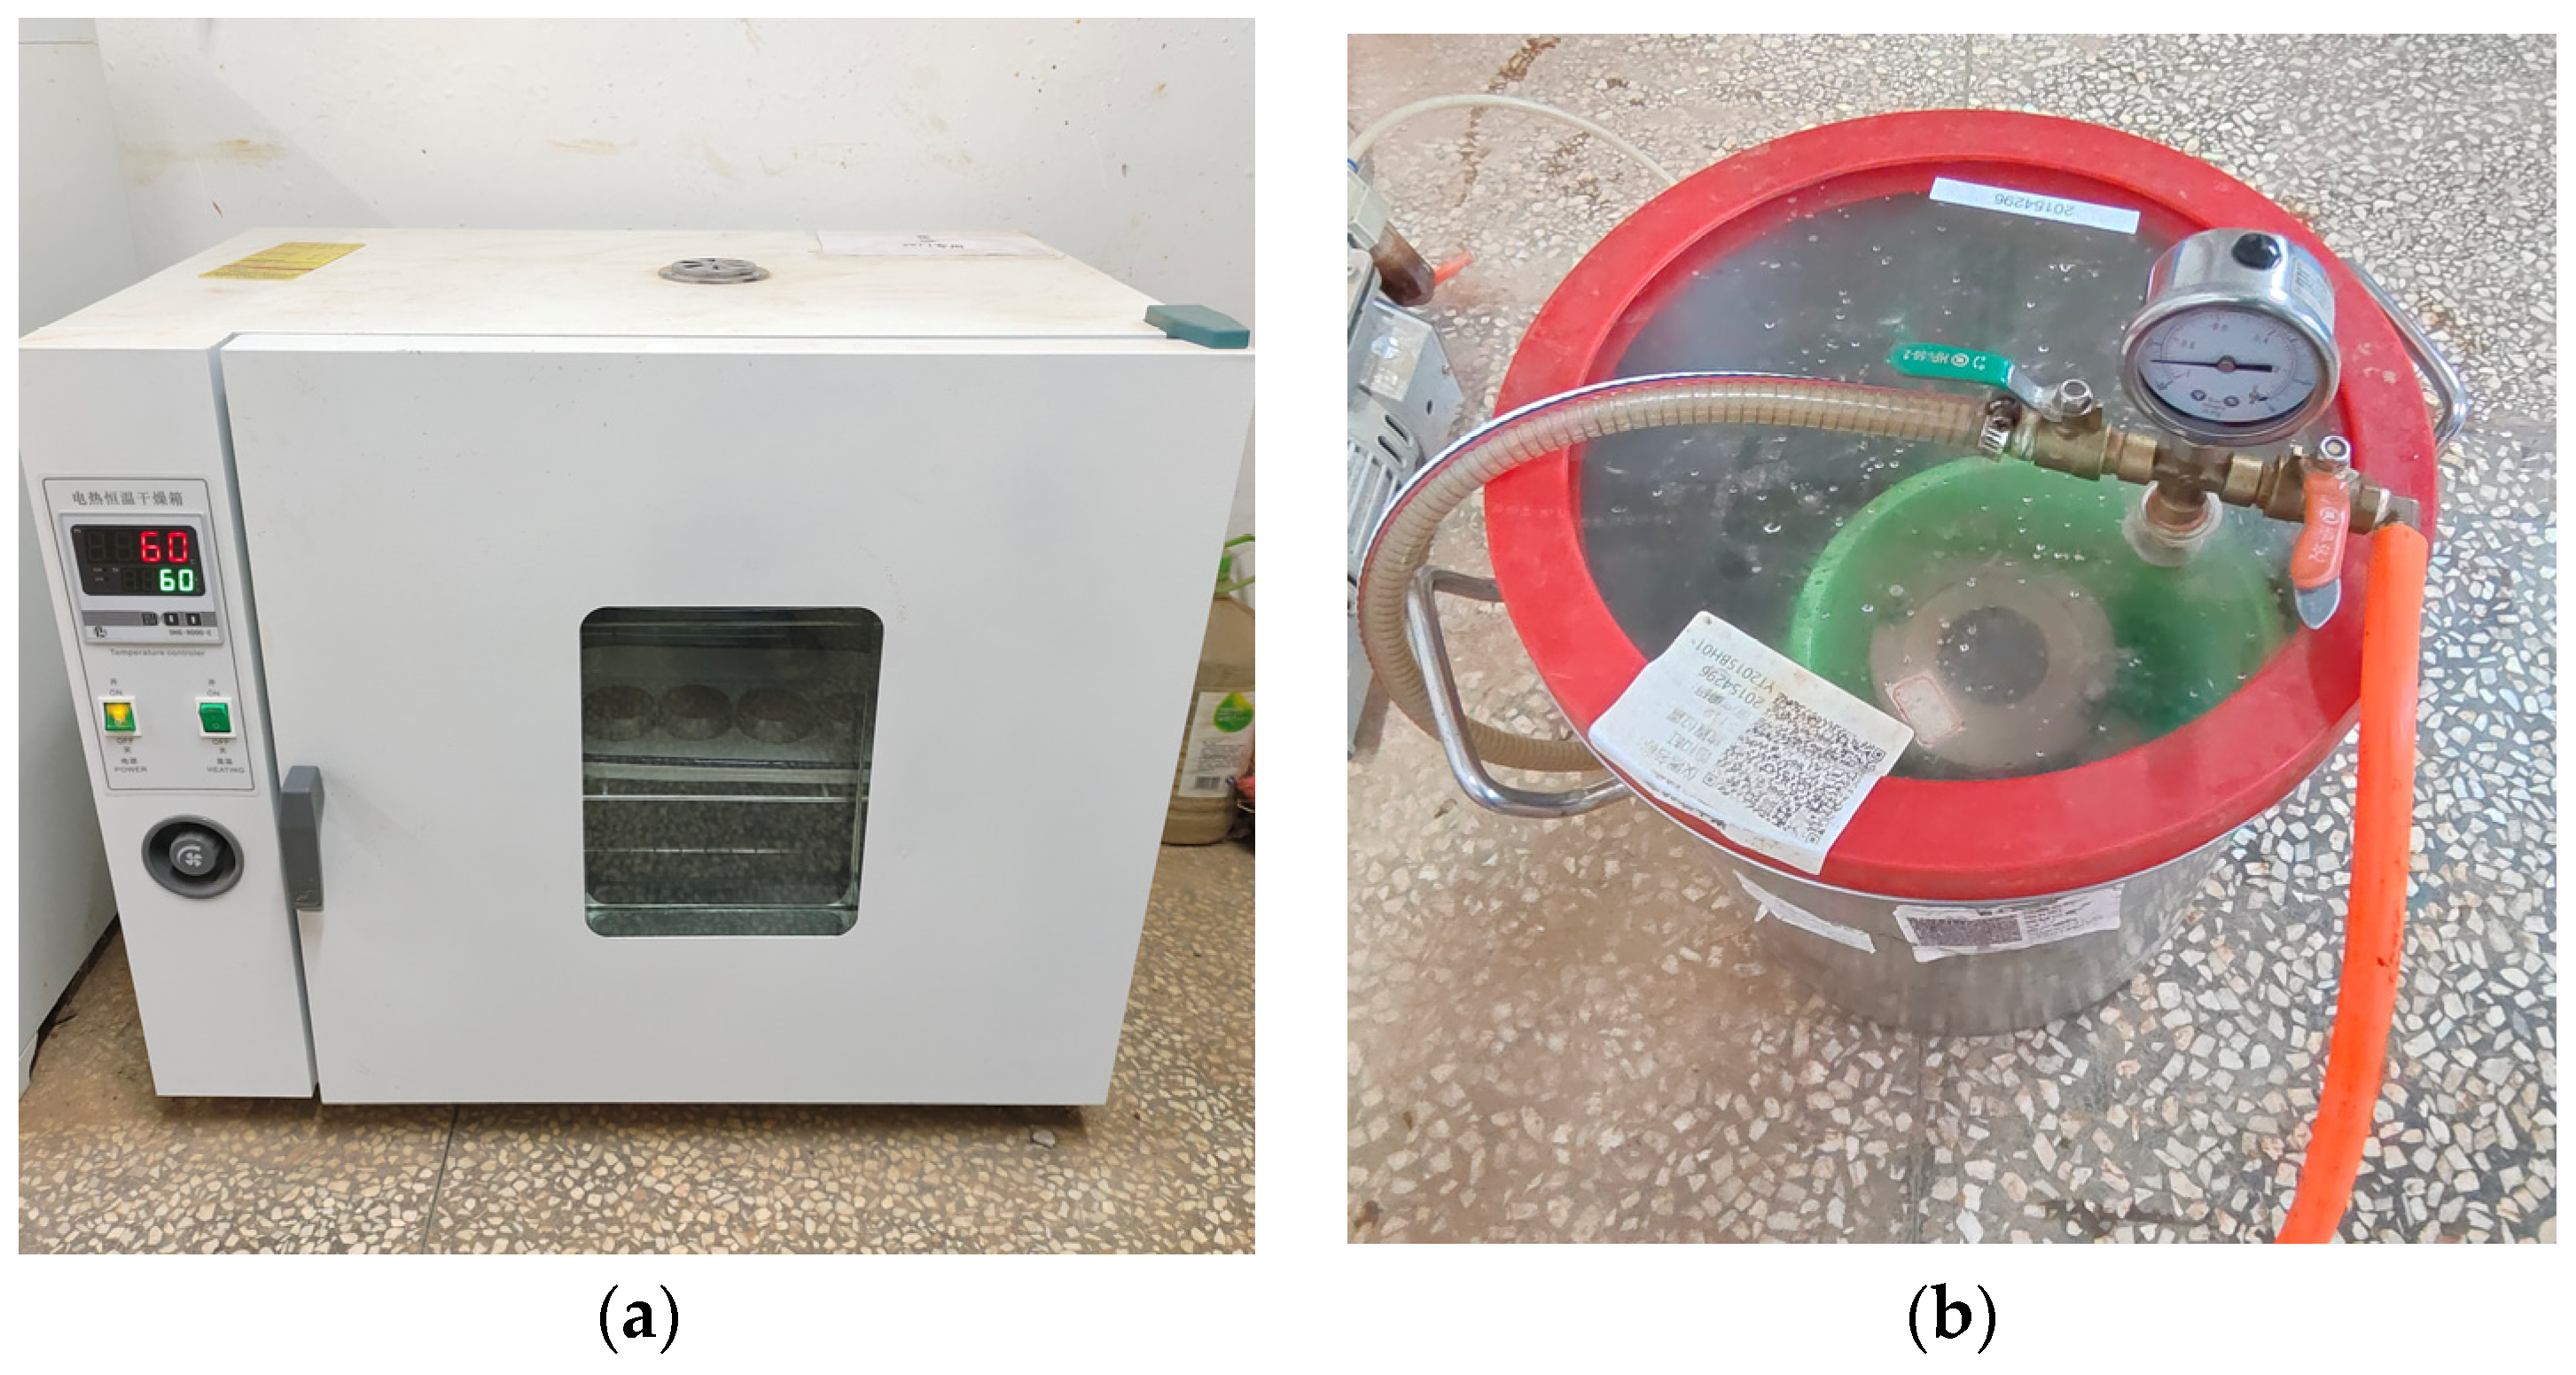
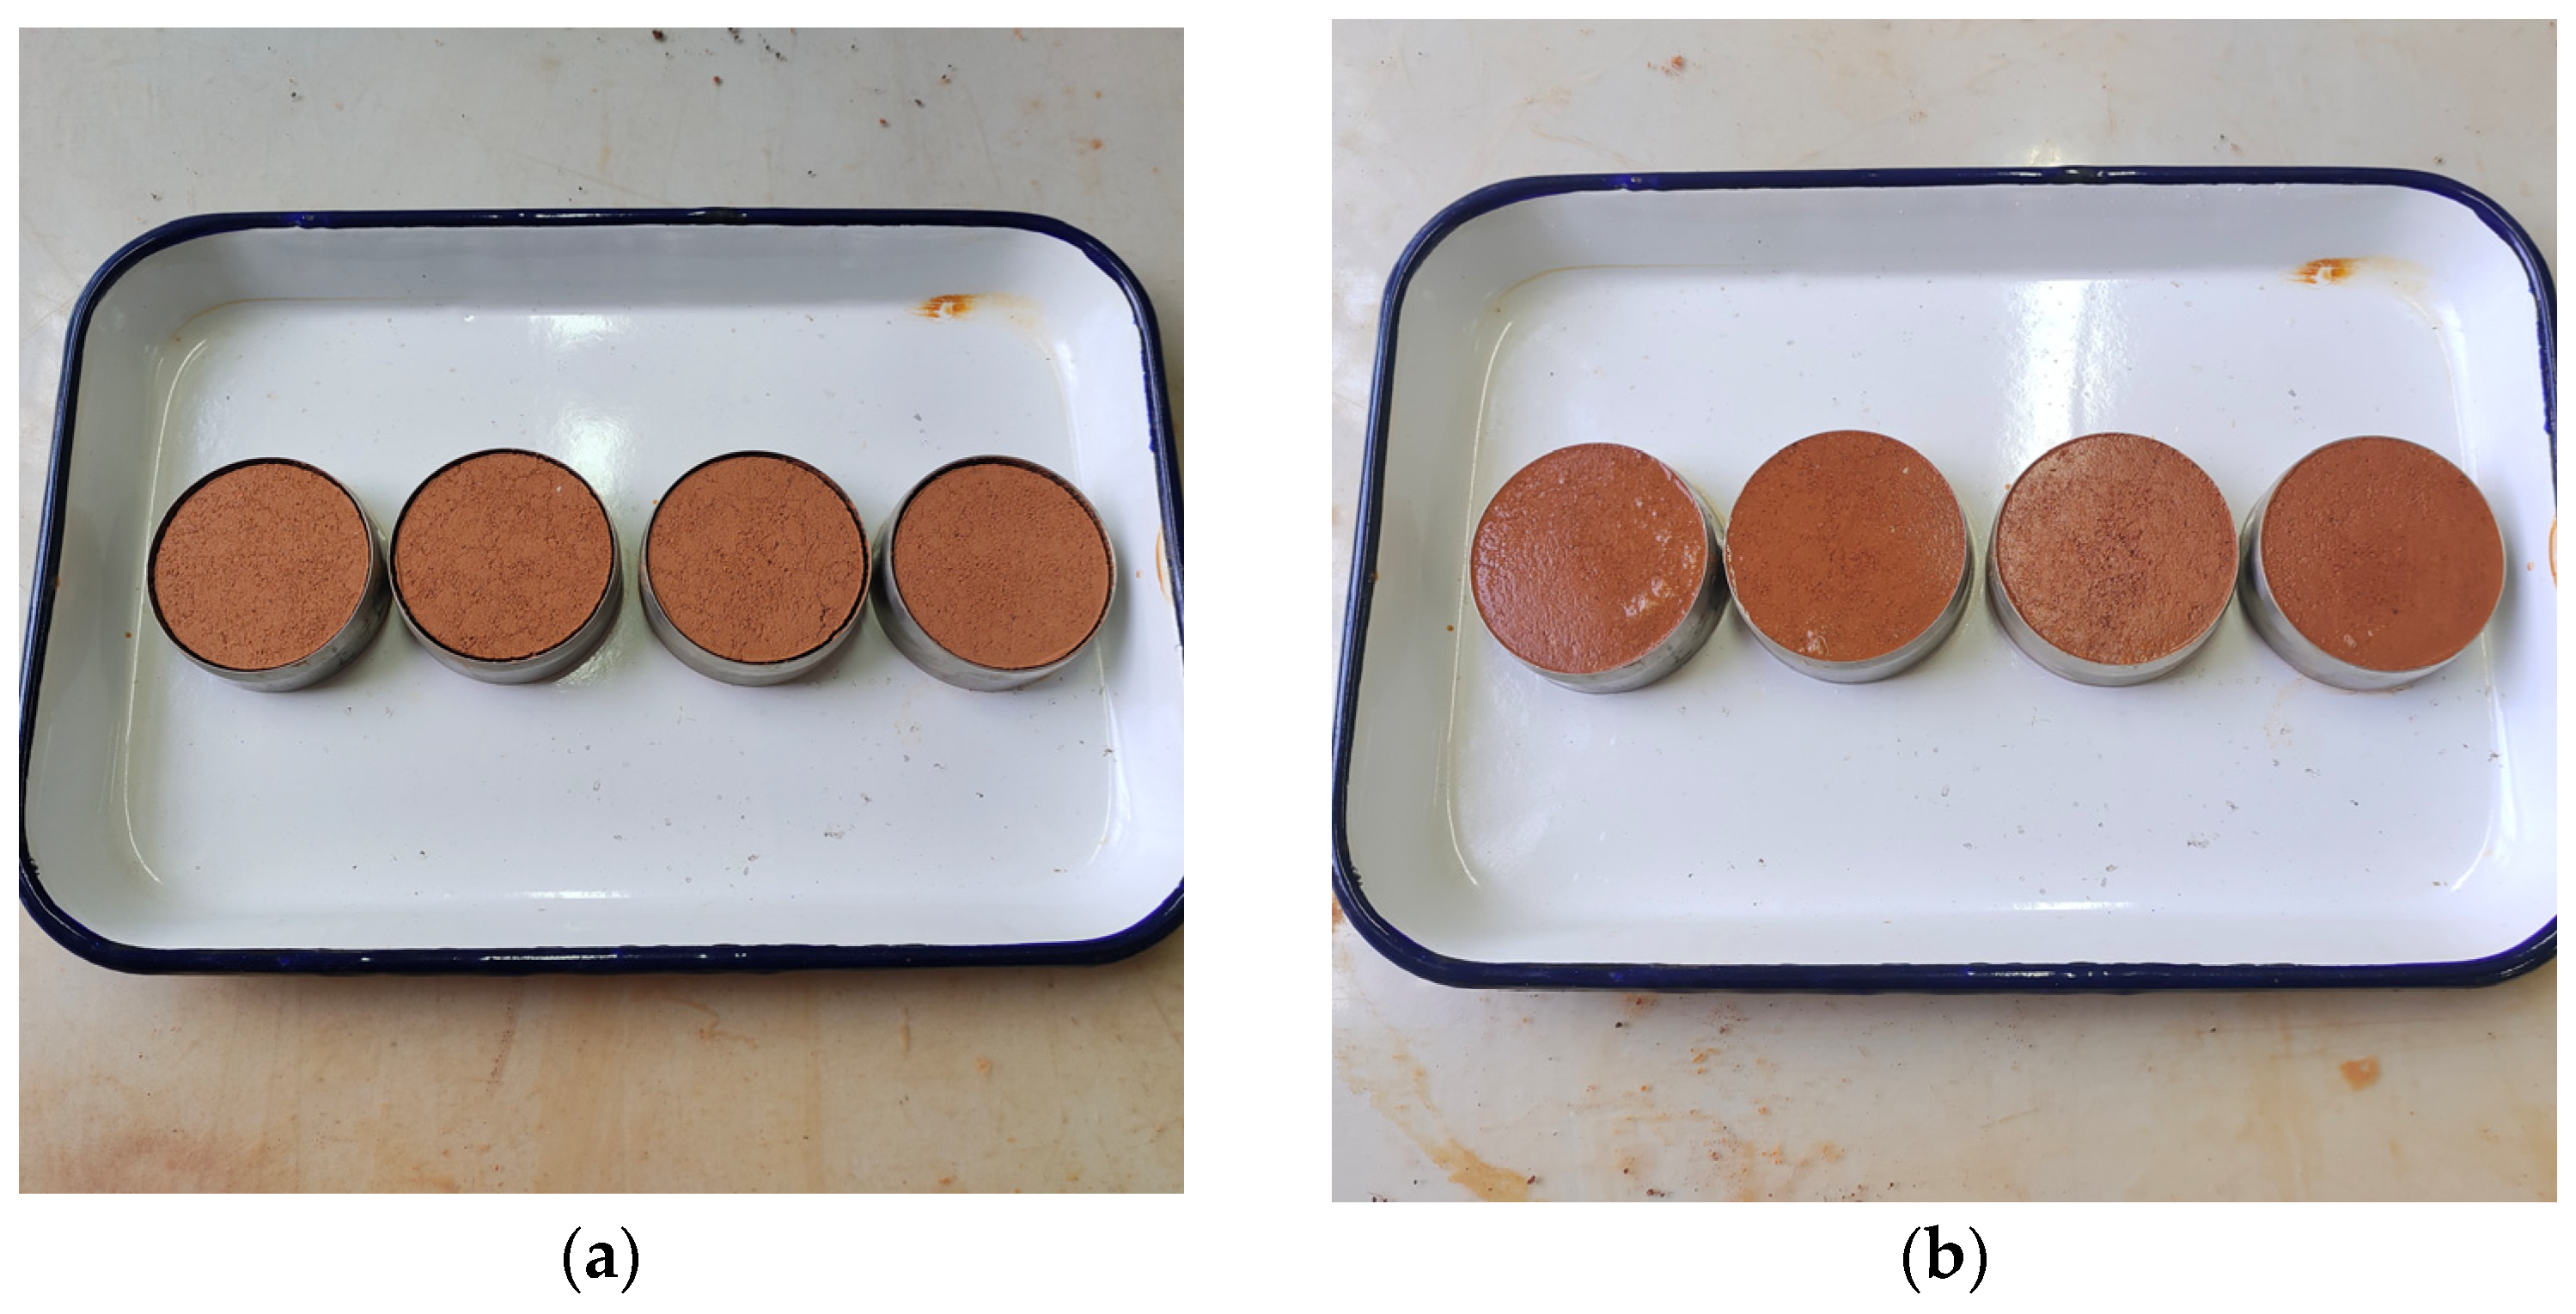
2.2.1. Dry–Wet Cycling Test
2.2.2. Direct Shear Test
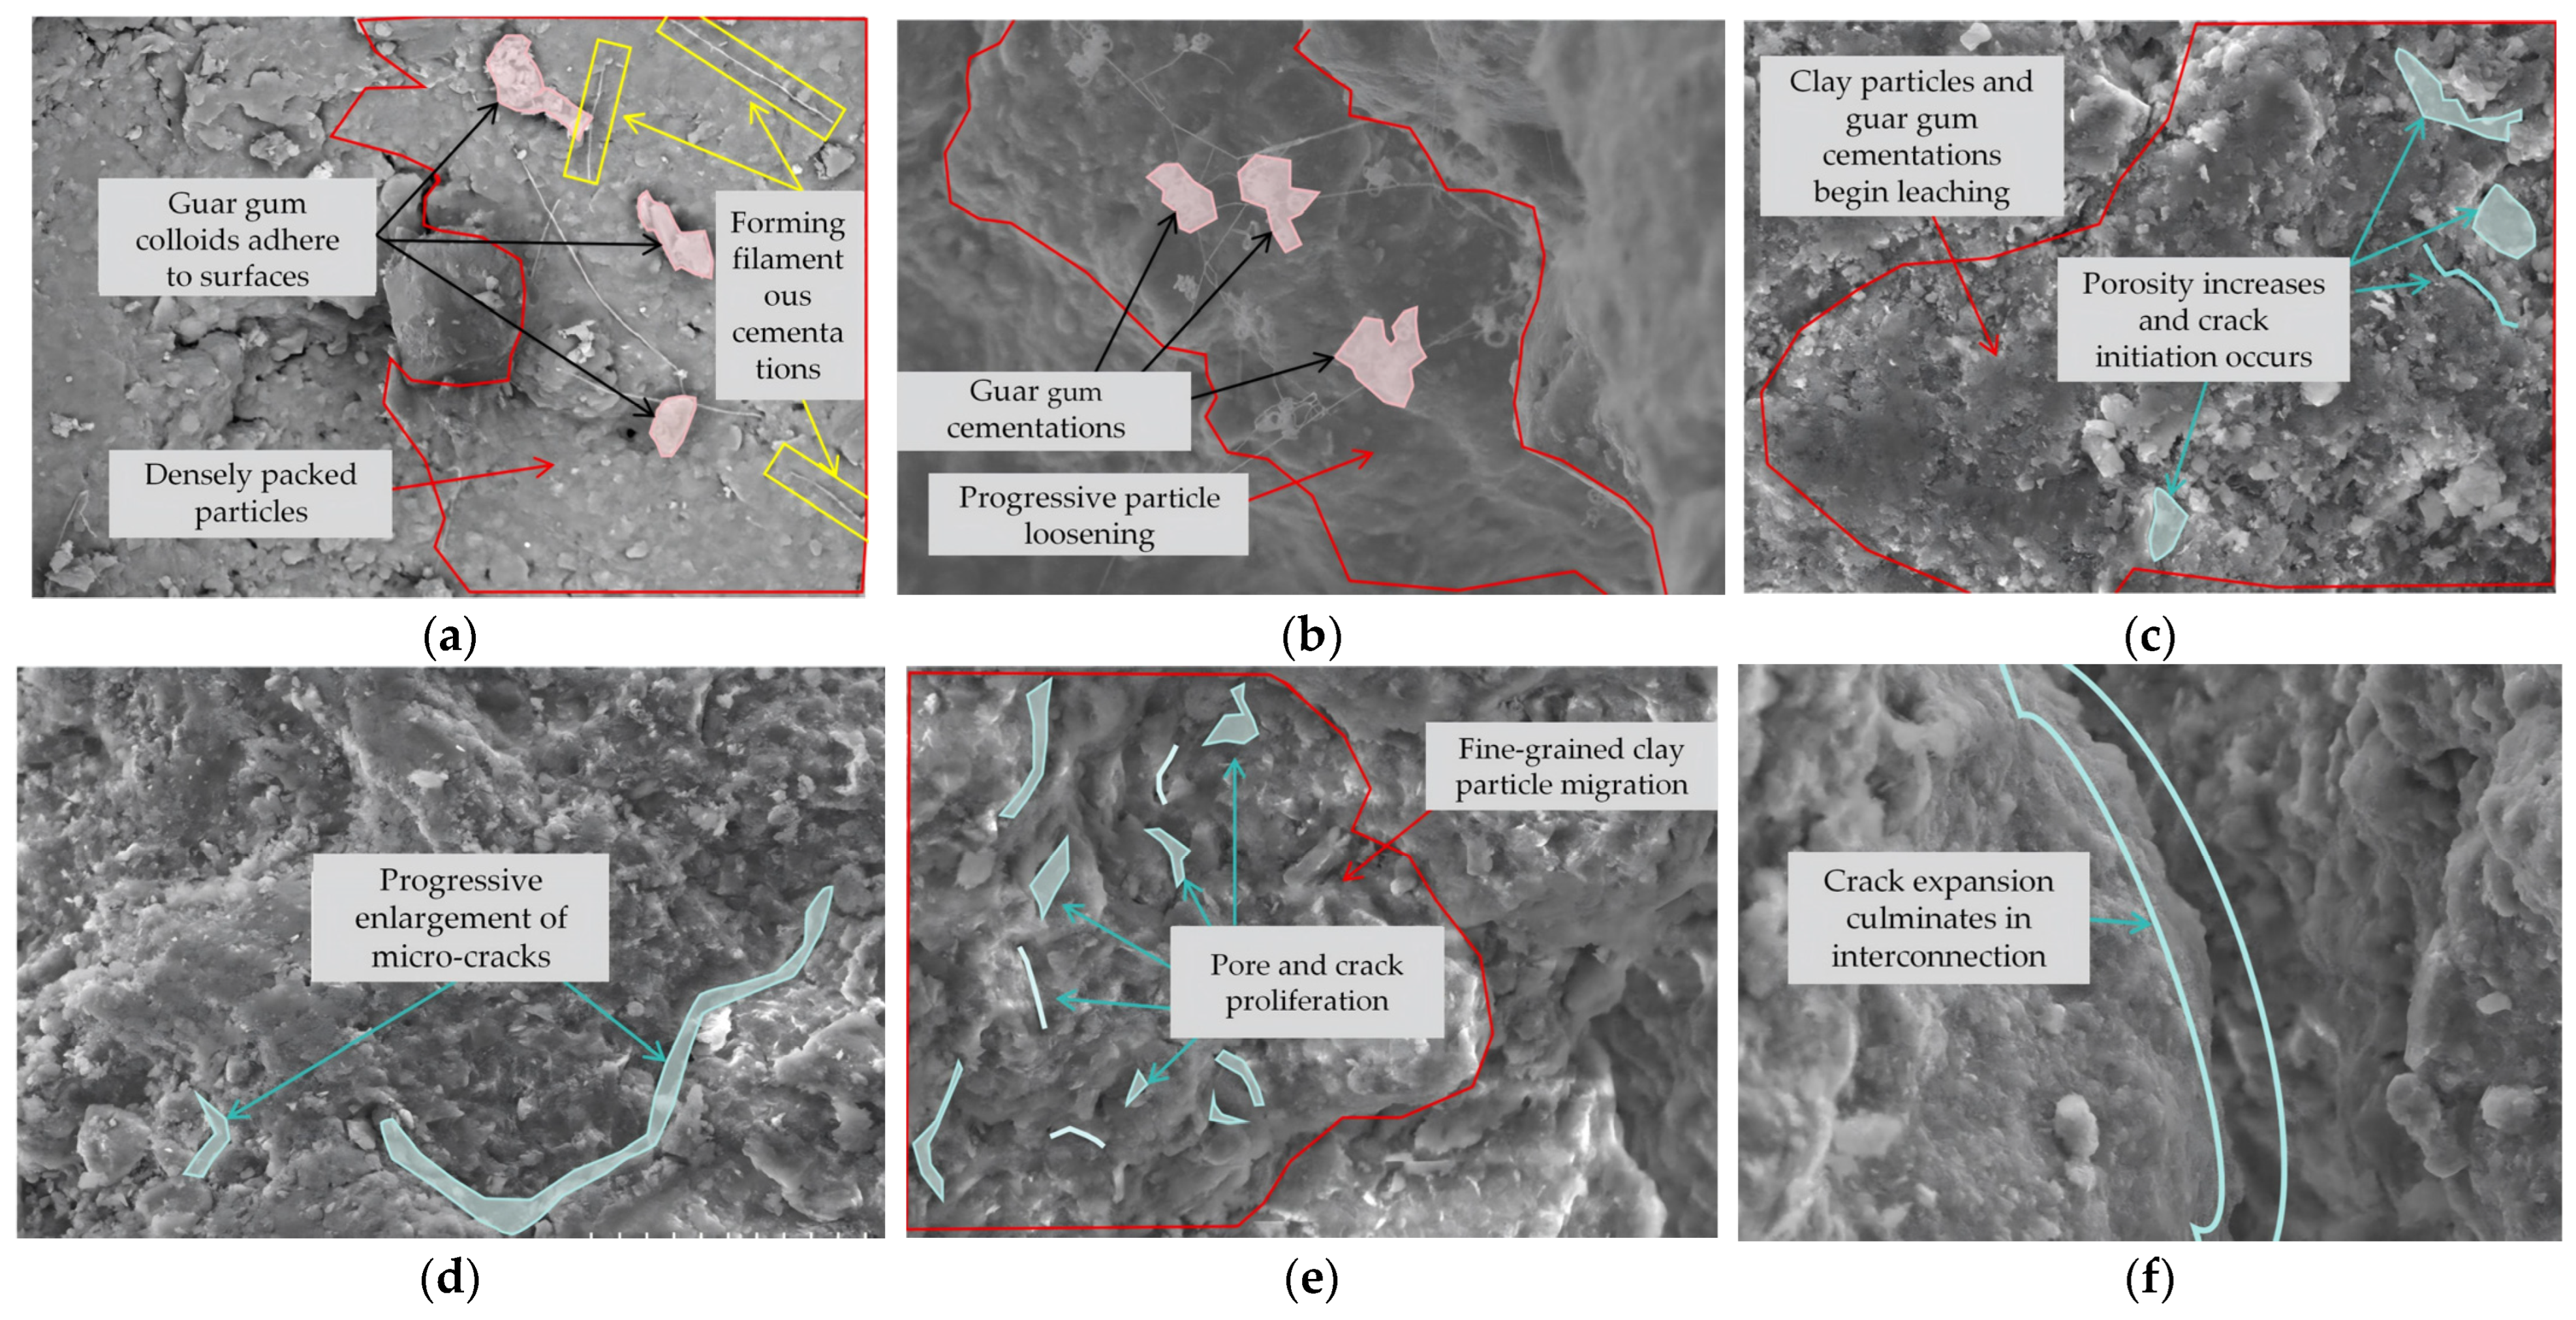
2.2.3. Microscopic Observation Test
3. Results and Analysis of Direct Shear Tests Under Dry–Wet Cycles
4. Construction of Gray Theory-Based GM(1,1) Cohesion Model for Laterite Soil Under Dry–Wet Cycles
4.1. Applicability Arguments of the Gray System Theory GM(1,1) Model
- Small-sample applicability: Given the long monitoring cycles and heavy workloads in geotechnical engineering, data samples are limited. This model uses Accumulating Generation Operation (AGO) to process raw discrete data, excavating underlying patterns to effectively overcome small-sample constraints. This study conducted only five cyclic tests, with the data volume (n = 5) satisfying the minimum requirement (n > 4) [20].
- Uncertainty handling mechanism: Addressing the uncertainty of laterite soil cohesion under multi-factor coupling, gray theory dynamically incorporates these influences through gray parameters and residual modification. The modeling process relies solely on inherent data patterns, avoiding interference from extraneous complex factors [21].
- Geotechnical data compatibility: GM(1,1) modeling requires no specific data distribution, only non-negative values whose accumulated sequence follows an exponential pattern (confirmed by level ratio tests) [22]. Soil degradation is intrinsically a gray system—partially known (e.g., cohesion attenuation) and partially unknown (e.g., cementation evolution, fiber distribution, crack propagation)—with experimental data fully aligning with model prerequisites.
4.2. GM(1,1) Model of Gray System Theory
4.3. Construction of GM(1,1)-Based Cohesion Model for Laterite Soil Under Dry–Wet Cycles
5. Accuracy and Analysis of GM(1,1) Cohesion Model for Laterite Soil Under Dry–Wet Cycles
5.1. Goodness-of-Fit Validation for Prediction Model
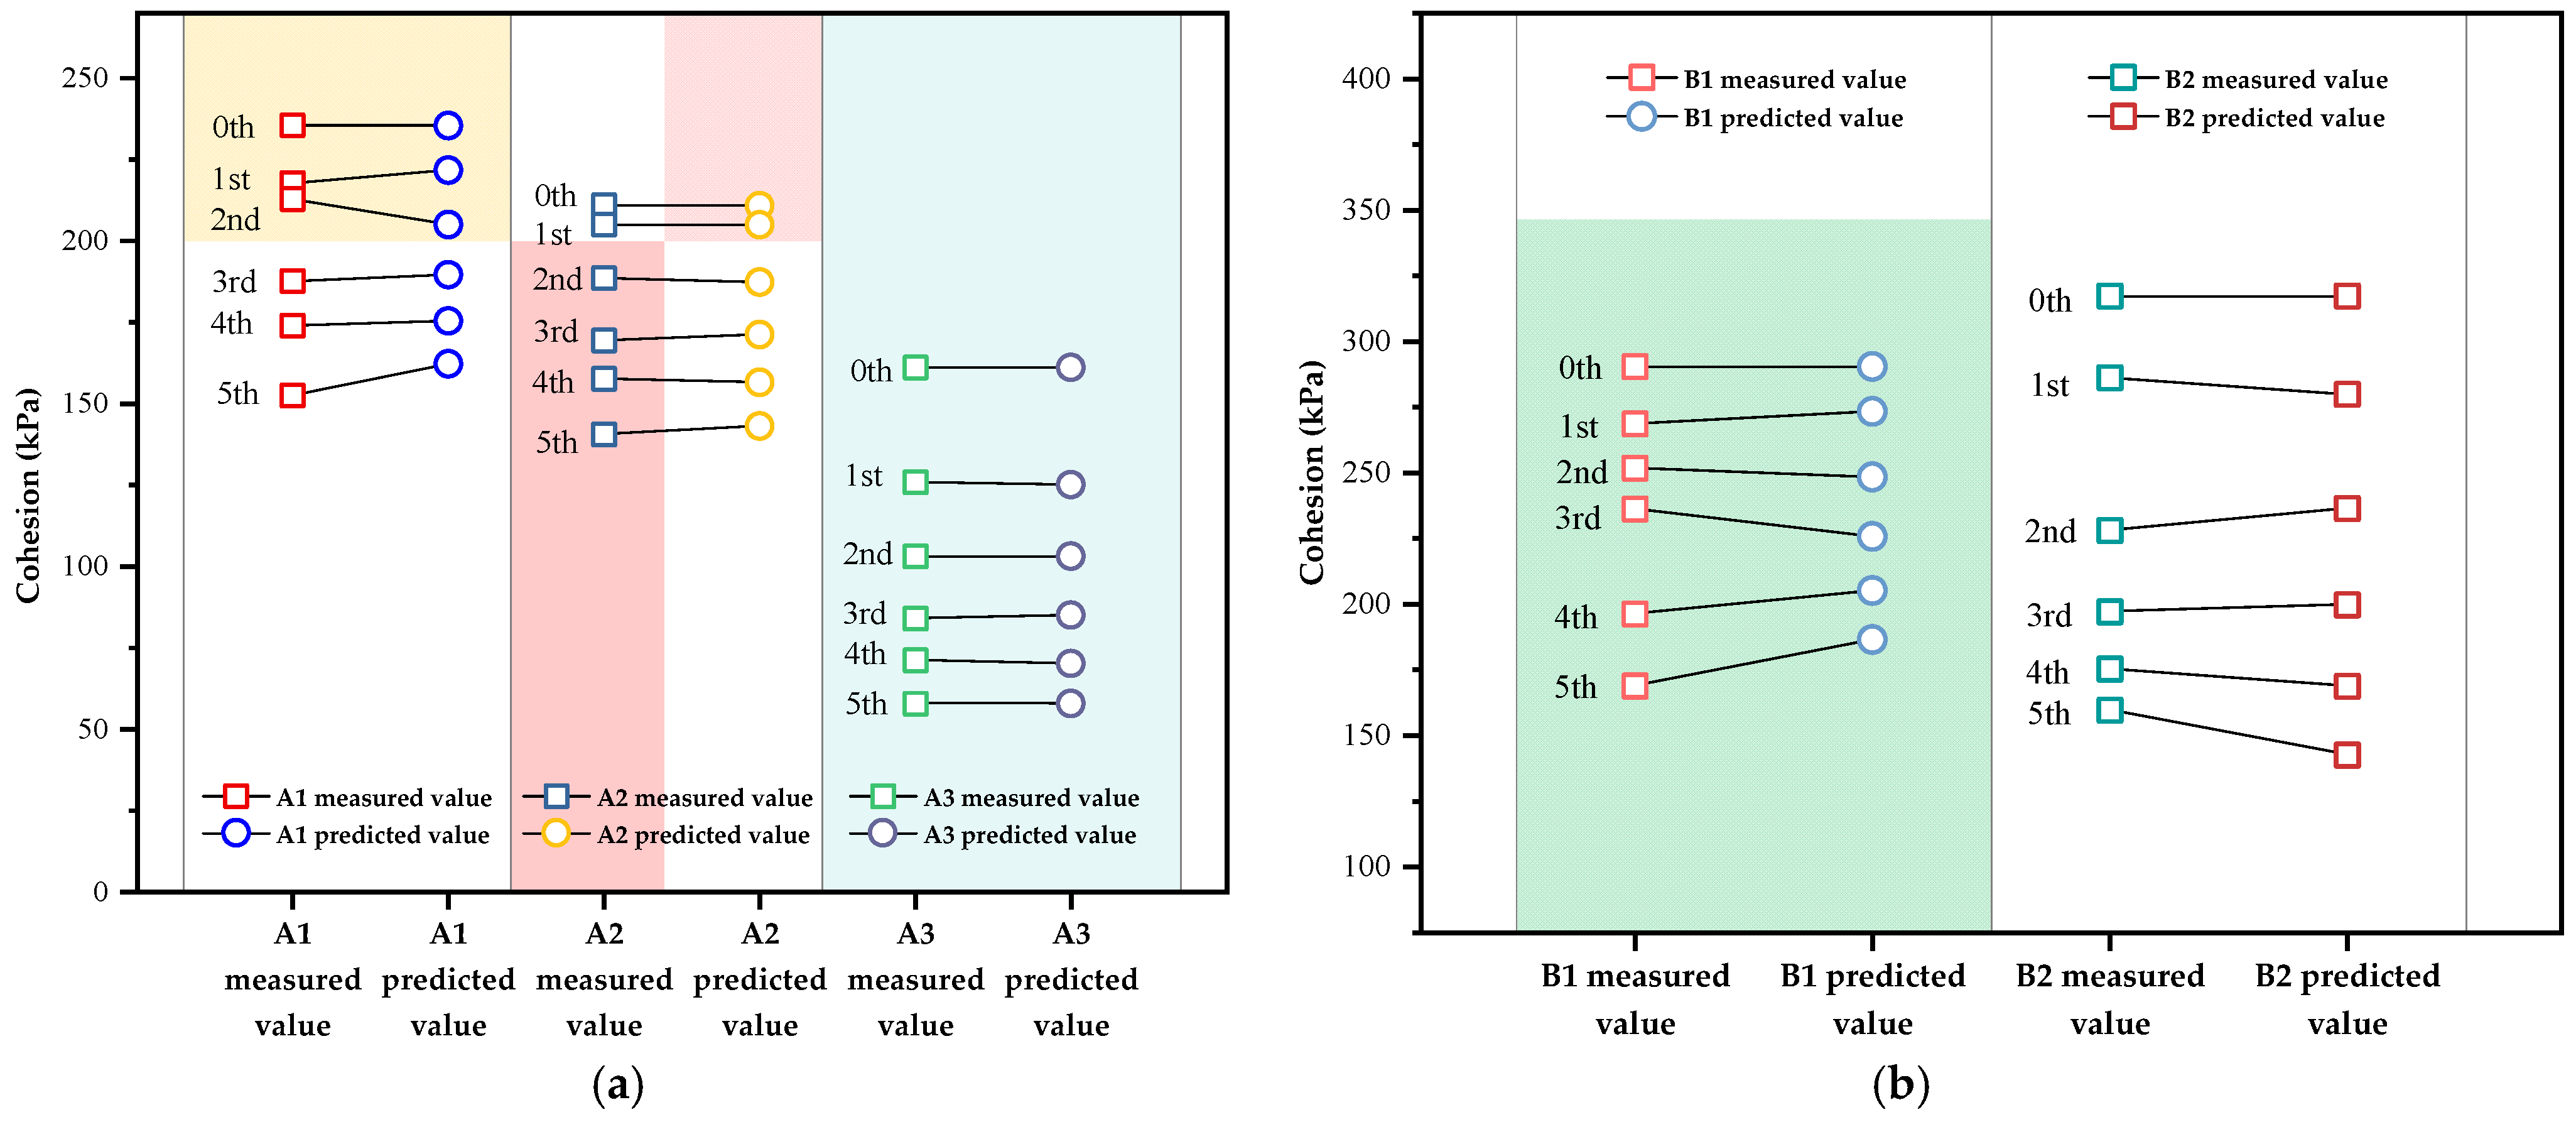
5.2. Predictive Accuracy Verification of Forecasting Model
5.3. Analysis of Generalizability and Limitations of the GM(1,1) Model Based on This Study
6. Conclusions
- (1)
- The cohesion (shear strength indicator) of laterite soil decreases with increasing drying–wetting cycles; cementation products from guar gum–laterite reactions and reinforcement effects of coconut fibers significantly enhance soil cohesion.
- (2)
- The GM(1,1) model for predicting cohesion under drying–wetting cycles, constructed based on gray theory, demonstrates small deviation rates and Grade I accuracy. It reliably predicts cohesion for both stabilized and natural specimens with wide applicability.
- (3)
- Gray system models enable precise predictions with minimal data in complex environments, demonstrating significant advantages for short-to-medium-term forecasting. However, their long-term predictive capability requires dynamic updating and correction mechanisms to ensure stability. Given that the monitoring of mechanical properties in laterite soil-related engineering often involves low sampling frequency and large sampling ranges, gray theory models hold substantial application potential in geotechnical engineering.
Author Contributions
Funding
Data Availability Statement
Conflicts of Interest
References
- Peng, M.; Zuo, S.; Yang, G.; Zhang, Q. Experimental study on damage characteristics of Guiyang red clay under cyclic loading and unloading. J. Eng. Geol. 2022, 30, 1466–1476. [Google Scholar] [CrossRef]
- Xie, Y.; Zhang, B.; Liu, B.; Zeng, Z.; Zhang, Y.; Zheng, Y. Shrinkage cracking and strength deterioration of red clay under cyclic drying and wetting. Alex. Eng. J. 2022, 61, 2574–2588. [Google Scholar] [CrossRef]
- Tang, C.S.; Cui, Y.J.; Tang, A.M.; Shi, B. Experimental evidence on the temperature dependence of desiccation cracking behavior of clayey soils. Eng. Geol. 2010, 114, 261–266. [Google Scholar] [CrossRef]
- Long, A.F.; Chen, K.S.; Ji, Y.X. Experimental study on wetting-drying cycles of red clay slopes under different rainfall intensities. Chin. J. Geotech. Eng. 2019, 41, 193–196. [Google Scholar] [CrossRef]
- Jiang, H.; Jiang, H.; Chen, K.S.; Ji, Y.X. Investigation of Red Clay Highway’s Slope Damages in Jiangxi Province. J. Guizhou Univ. (Nat. Sci.) 2019, 36, 109–113. [Google Scholar] [CrossRef]
- Zhang, Z.L.; Liang, J.J.; Huang, Y.; Qiu, G.G.; Yuan, Q. On the Relationship between Characteristics of Yunnan Laterite and Stability of the Bank Slope under Wetting-Drying Cycles. J. Mt. Sci. 2018, 36, 280–288. [Google Scholar] [CrossRef]
- Chen, A.J.; Chen, J.H.; Cheng, F.; Wu, D. Quantitative analysis of desiccation crack evolution in high liquid limit laterite from Shaoyang, Hunan. Trans. Chin. Soc. Agric. Eng. 2021, 37, 146–153. [Google Scholar] [CrossRef]
- Xiao, G.Y.; An, R.; Zhu, J.R.; Pei, X.C.; Liu, W.J. Influence of different concentrations of NaCl solution on fracture development of red clay. Yangtze River 2022, 53, 163–170. [Google Scholar] [CrossRef]
- Mu, K.; Kong, L.W.; Zhang, X.W.; Yin, S. Experimental investigation on engineering behaviors of red clay under effect of wetting-drying cycles. Rock Soil Mech. 2016, 37, 2247–2253. [Google Scholar] [CrossRef]
- Gao, Q.F.; Wu, X.Y.; Zeng, L.; Yu, H.C.; Yu, H. Cracking and saturation healing behavior of red clay and its influence mechanism on strength. China J. Highw. Transp. 2024, 37, 157–168. [Google Scholar] [CrossRef]
- Hu, Y.Q.; Tang, L.S.; Lin, P.Y. Analysis of dynamic characteristics of subgrade red clays in Southern China using dynamic triaxial tests. J. Nat. Disasters 2018, 27, 34–41. [Google Scholar] [CrossRef]
- Chang, L.C.; Wang, H.Y.; Xue, K.X. Change rules of cracks and shear strength in unsaturated red clay under different drying temperatures. J. Eng. Geol. 2023, 31, 368–378. [Google Scholar] [CrossRef]
- Jia, D.H.; Zeng, J.C. Application of GM (1, 1) Prediction Model Based on Grey System Theory. J. Kunming Univ. Sci. Technol. (Nat. Sci.) 2013, 38, 115–120. [Google Scholar] [CrossRef]
- Li, G.X. Advanced Soil Mechanics; Tsinghua University Press: Beijing, China, 2006; pp. 116–122. [Google Scholar]
- GB/T 50123-2019; Standard for Geotechnical Testing Method. China Planning Press: Beijing, China, 2019.
- Wang, E.L.; Du, S.L.; Jiang, H.Q.; Zou, Y.Y.; Liu, X.C.; Zhou, T.F. Experimental study on performance changes of expansive soil under different improvement methods. J. Northeast Agric. Univ. 2023, 54, 72–87. [Google Scholar] [CrossRef]
- Li, L.H.; Liu, W.; Li, Y.T.; Wang, C.Y.; Yue, Z. Experimental study on mechanical properties of coconut fiber reinforced lime-modified soil. J. Sichuan Univ. Eng. Sci. Ed. 2025, 57, 1–14. [Google Scholar] [CrossRef]
- Liu, Y.X. Experimental Study on Crack Evolution and Ecological Improvement of Red Clay Under Dry-Wet Cycle. Master’s Thesis, Guilin University of Technology, Guilin, China, 2024. [Google Scholar] [CrossRef]
- Deng, J.L. Three properties of Grey Forecasting Model GM(1,1): The issue on the optimization structure and optimization information volume of grey predictive control. J. Huazhong Univ. Sci. Technol. 1987, 5, 1–6. [Google Scholar]
- Deng, J.L. Introduction to grey system theory. J. Grey Syst. 1989, 1, 1–24. [Google Scholar]
- Deng, J.L. Control problems of grey systems. Syst. Control Lett. 1982, 1, 288–294. [Google Scholar] [CrossRef]
- Liu, S.F.; Forrest, J.Y.L. Grey Systems: Theory and Applications; Springer: Berlin/Heidelberg, Germany, 2010; Volume 1, pp. 30–75. [Google Scholar]
- Zhou, Y.; Wang, Y.Q.; Dai, G.X.; Shi, Y.J.; Liu, X.Y. Prediction of Structural Steel Strength at Low Temperature Based on Grey Theory. Build. Sci. 2014, 30, 7–11. [Google Scholar] [CrossRef]


| Specimen Type | Key Parameters | Specimen ID | Dimensions | Quantity | ||
|---|---|---|---|---|---|---|
| natural specimens |  | Moisture content | 18.7% | A1 | Standard ring-knife specimens (Φ61.8 × 20 mm) | Tested in groups of 24 specimens per group, totaling 120 specimens |
| 26.7% | A2 | |||||
| 34.7% | A3 | |||||
| stabilized specimens (modified from A3) |  | Guar gum dosage | 0.3% | B1 | ||
 | Coconut fiber dosage | 0.3% | B2 | |||
| Specimen ID | Parameters | Cycles | |||||
|---|---|---|---|---|---|---|---|
| 0 | 1 | 2 | 3 | 4 | 5 | ||
| A1 (18.7%) | c (kPa) | 235.45 | 217.76 | 212.83 | 187.61 | 173.99 | 152.46 |
| ϕ (°) | 30.83 | 30.28 | 29.10 | 29.80 | 30.05 | 30.70 | |
| A2 (26.7%) | c (kPa) | 210.90 | 204.98 | 188.54 | 169.35 | 157.64 | 140.59 |
| ϕ (°) | 29.18 | 26.05 | 26.68 | 26.40 | 25.85 | 26.42 | |
| A3 (34.7%) | c (kPa) | 161.14 | 125.83 | 103.04 | 84.00 | 71.15 | 57.82 |
| ϕ (°) | 28.93 | 30.57 | 31.04 | 31.71 | 32.26 | 31.48 | |
| B1 (guar gum-stabilized) | c (kPa) | 290.41 | 268.59 | 251.68 | 236.17 | 196.18 | 168.81 |
| ϕ (°) | 29.02 | 29.92 | 29.55 | 27.74 | 29.12 | 29.00 | |
| B2 (coconut fiber-stabilized) | c (kPa) | 317.28 | 286.16 | 228.04 | 197.15 | 175.24 | 159.58 |
| ϕ (°) | 30.44 | 29.38 | 27.63 | 29.11 | 29.95 | 29.40 | |
| Methods | Sample Requirements | Geotechnical Engineering Applicability Validation | Case Study Compatibility in This Research |
|---|---|---|---|
| GM(1,1) Model | ≥4 | Exhibits strong applicability for small-sample prediction | ✓ |
| Machine Learning (ANN) | large sample size | Requires substantial training data | ✗ |
| Random Forest | ≥50 | Suitable for multi-feature datasets | ✗ |
| Neural Networks (LSTM) | large sample size | Demands extensive training data | ✗ |
| Multiple Regression | ≥tenfold variables | Needs quantification of multiple influencing parameters | ✗ |
| Time Series (ARIMA) | ≥30 | Requires strictly equally spaced data collection | ✗ |
| Bayesian Networks | ≥tenfold variables | Precise conditional probability distributions of variables must be provided as prior inputs | ✗ |
| Parameters | Specimen ID | ||||
|---|---|---|---|---|---|
| A1 | A2 | A3 | B1 | B2 | |
| −2947.2819 | |||||
| 7.8230 × 10⁻² | 8.9815 × 10⁻² | 1.9326 × 10⁻¹ | 9.5697 × 10⁻² | 1.6866 × 10⁻¹ | |
| Grade | I (Excellent) | II (Qualified) | III (Marginal) | IV (Invalid) |
|---|---|---|---|---|
| Grade | I (Excellent) | II (Qualified) | III (Marginal) | IV (Invalid) |
|---|---|---|---|---|
| -value | ||||
| -value |
| Specimen | Cycles | Measured Value (kPa) | Fitted Value (kPa) | Error (kPa) | Absolute Percentage Error | -Value | -Value | Grade |
|---|---|---|---|---|---|---|---|---|
| A1 | 0 | 235.45 | 235.45 | 0.00 | 0.00% | 0.185 | 1.00 | I |
| 1 | 217.76 | 221.78 | 4.02 | 1.84% | ||||
| 2 | 212.83 | 205.09 | −7.74 | 3.64% | ||||
| 3 | 187.61 | 189.66 | 2.05 | 1.09% | ||||
| 4 | 173.99 | 175.38 | 1.39 | 0.80% | ||||
| A2 | 0 | 210.9 | 210.90 | 0.00 | 0.00% | 0.055 | 1.00 | I |
| 1 | 204.98 | 204.95 | −0.03 | 0.01% | ||||
| 2 | 188.54 | 187.35 | −1.19 | 0.63% | ||||
| 3 | 169.35 | 171.25 | 1.90 | 1.12% | ||||
| 4 | 157.64 | 156.54 | −1.10 | 0.70% | ||||
| A3 | 0 | 161.14 | 161.14 | 0.00 | 0.00% | 0.023 | 1.00 | I |
| 1 | 125.83 | 125.06 | −0.77 | 0.61% | ||||
| 2 | 103.04 | 103.08 | 0.04 | 0.04% | ||||
| 3 | 84.00 | 84.97 | 0.97 | 1.16% | ||||
| 4 | 71.15 | 70.04 | −1.11 | 1.56% | ||||
| B1 | 0 | 290.41 | 290.41 | 0.00 | 0.00% | 0.209 | 1.00 | I |
| 1 | 268.59 | 273.24 | 4.65 | 1.73% | ||||
| 2 | 251.68 | 248.3 | −3.38 | 1.34% | ||||
| 3 | 236.17 | 225.64 | −10.53 | 4.46% | ||||
| 4 | 196.18 | 205.05 | 8.87 | 4.52% | ||||
| B2 | 0 | 317.28 | 317.28 | 0.00 | 0.00% | 0.105 | 1.00 | I |
| 1 | 286.16 | 279.82 | −6.34 | 2.22% | ||||
| 2 | 228.04 | 236.39 | 8.35 | 3.66% | ||||
| 3 | 197.15 | 199.7 | 2.55 | 1.29% | ||||
| 4 | 175.24 | 168.71 | −6.53 | 3.73% |
| Specimen | Cohesion c After the 5th Drying–Wetting Cycle | |||
|---|---|---|---|---|
| Measured Value (kPa) | Predicted Value (kPa) | Error (kPa) | Absolute Percentage Error | |
| A1 | 152.46 | 162.19 | 9.73 | 6.38% |
| A2 | 140.59 | 143.10 | 2.51 | 1.78% |
| A3 | 57.82 | 57.73 | −0.09 | −0.16% |
| B1 | 168.81 | 186.34 | 17.53 | 10.38% |
| B2 | 159.58 | 142.52 | −17.06 | −10.69% |
Disclaimer/Publisher’s Note: The statements, opinions and data contained in all publications are solely those of the individual author(s) and contributor(s) and not of MDPI and/or the editor(s). MDPI and/or the editor(s) disclaim responsibility for any injury to people or property resulting from any ideas, methods, instructions or products referred to in the content. |
© 2025 by the authors. Licensee MDPI, Basel, Switzerland. This article is an open access article distributed under the terms and conditions of the Creative Commons Attribution (CC BY) license (https://creativecommons.org/licenses/by/4.0/).
Share and Cite
Zhang, B.; Jiang, N.; Hu, J.; Xie, Y.; Xu, J.; Han, D.; Liu, Y. Application of the GM(1,1) Model in Predicting the Cohesion of Laterite Soil Under Dry–Wet Cycles with Temporal Translational Symmetry. Symmetry 2025, 17, 1427. https://doi.org/10.3390/sym17091427
Zhang B, Jiang N, Hu J, Xie Y, Xu J, Han D, Liu Y. Application of the GM(1,1) Model in Predicting the Cohesion of Laterite Soil Under Dry–Wet Cycles with Temporal Translational Symmetry. Symmetry. 2025; 17(9):1427. https://doi.org/10.3390/sym17091427
Chicago/Turabian StyleZhang, Binghui, Ningshuan Jiang, Jiankun Hu, Yanhua Xie, Jicheng Xu, Donghua Han, and Yuxin Liu. 2025. "Application of the GM(1,1) Model in Predicting the Cohesion of Laterite Soil Under Dry–Wet Cycles with Temporal Translational Symmetry" Symmetry 17, no. 9: 1427. https://doi.org/10.3390/sym17091427
APA StyleZhang, B., Jiang, N., Hu, J., Xie, Y., Xu, J., Han, D., & Liu, Y. (2025). Application of the GM(1,1) Model in Predicting the Cohesion of Laterite Soil Under Dry–Wet Cycles with Temporal Translational Symmetry. Symmetry, 17(9), 1427. https://doi.org/10.3390/sym17091427


