Article

A Novel Evolutionary Structural Topology Optimization Method Based on Load Path Theory and Element Bearing Capacity

1
Department of Mechanical Engineering, Yanshan University, Qinhuangdao 066004, China
2
China Telecom Co., Ltd. Hainan Branch, Haikou 570000, China
3
Engineering Training Center, Yanshan University, Qinhuangdao 066004, China
*
Author to whom correspondence should be addressed.
Symmetry 2025, 17(9), 1424; https://doi.org/10.3390/sym17091424
Submission received: 18 June 2025 / Revised: 30 July 2025 / Accepted: 4 August 2025 / Published: 2 September 2025

Abstract

Structural topology optimization is a crucial approach for achieving lightweight design. An effective topology optimization algorithm must strike a balance between the objective functions, constraints, and design variables, which essentially reflects the symmetry and tradeoff between the objective and constraints. In this study, a topology optimization method grounded in load path theory is proposed. Element bearing capacity is quantified using the element birth and death method, with an explicit formulation derived via finite element theory. The effectiveness in evaluating structural performance is assessed through comparisons with stress distributions and topology optimization density maps. In addition, a novel evaluation index for element bearing capacity is proposed as the objective function in the topology optimization model, which is validated through thin plate optimization. Subsequently, sensitivity redistribution mitigates checkerboard patterns, while mesh filtering suppresses multi-branch structures and prevents local optima. The method is applied for the lightweight design of a triangular arm, with results benchmarked against the variable density method, demonstrating the feasibility and effectiveness of the proposed method. The element bearing capacity seeks to homogenize the load distribution of each element; the technique in this study can be extended to the optimization of symmetric structures.

1. Introduction

Topology optimization is a design methodology employed to ascertain the optimal distribution of material within a structure, thereby enabling designers to explore and identify the most effective material layout and structural configuration to achieve specific performance objectives, such as minimizing weight or maximizing stiffness. Extensive research has been carried out in this field, leading to a variety of topology optimization methods. These include the homogenization method [1,2], the Solid Isotropic Material with Penalization (SIMP) method [3,4], the evolutionary structural optimization (ESO) method [5,6], the Level Set Method (LSM) [7], the Moving Deformable Components Method (MDCM) [8], the Floating Projection method [9,10], and the Smooth-Edged Material Distribution method [11,12]. The ESO method stands out due to the simple fundamental principles and ease of implementation. It does not generate intermediate densities during the optimization process, resulting in explicitly optimized topological geometries. Furthermore, ESO can account for the problems of structural topology optimization, shape, and size optimization [13,14]. It has been widely utilized to optimize stress [15], displacement [16], stiffness [17], natural frequencies [18,19], and structural buckling [20].
In recent years, through improvements and integration with other methods, the ESO method has seen significant development. Zhang and Chen et al. [21] proposed an improved ESO method based on a modified evolutionary rate for the topology optimization design of constrained layer damping treatments in aircraft panels. Compared to traditional ESO, this approach not only enhances computational efficiency but also yields more reasonable, optimized topological geometries. Hélio et al. [22] introduced a topology optimization method that combines the Boundary Element Method (BEM) with ESO for plane elasticity problems. This method avoids the need to introduce elements within the structural domain or employ other cumbersome strategies to account for void regions in the boundary element formulation. The advantages include eliminating the need for remeshing and recalculating boundary equations at each iteration, as well as significantly reducing computational costs. The robustness and effectiveness of the proposed algorithm were demonstrated through numerical examples.
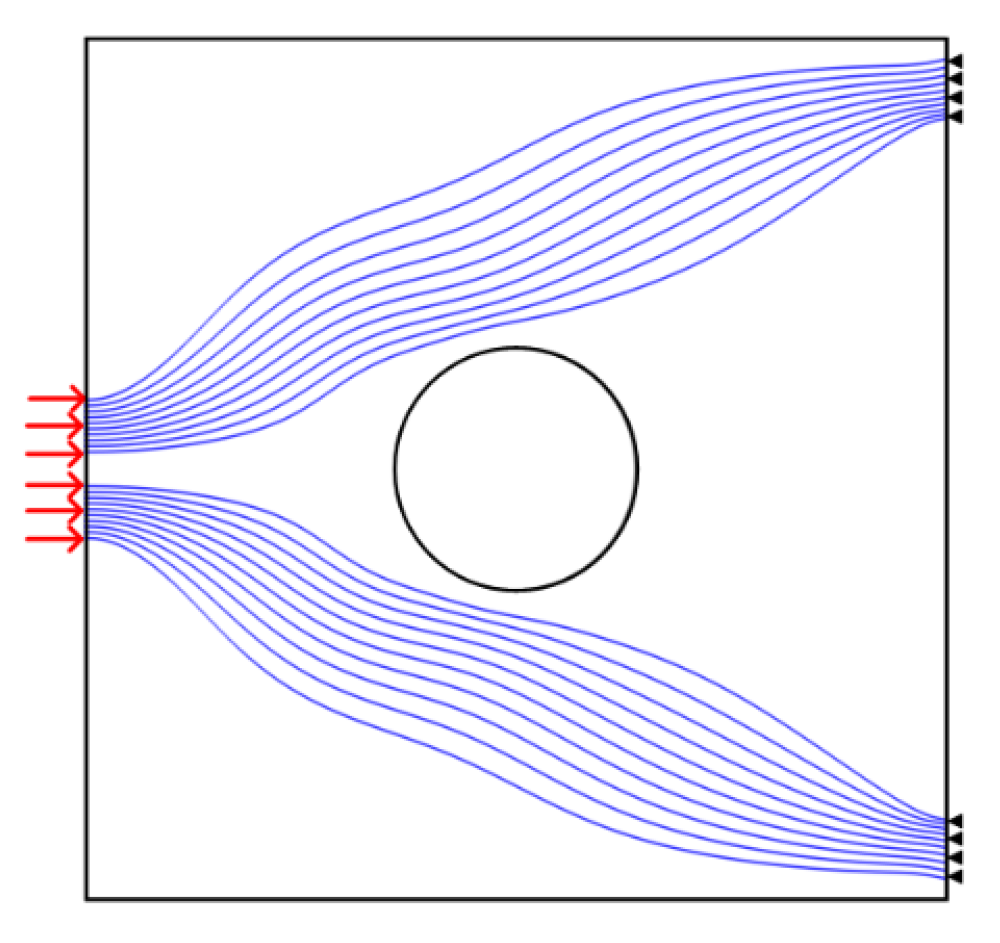
These pathways constitute the load paths. Figure 1 illustrates a schematic diagram of two load paths in a cantilever slab. The transmission paths represent the concentrated manifestation of load transfer mechanisms within a structure; their explicit expression can provide an intuitive understanding of the force transfer performance in local regions of the structure and offer valuable mechanical guidance for designers during structural design and optimization. As a novel structural design concept, TPA has garnered significant attention from structural engineers in recent years [23,24].
In the past few decades, several quantifiable force flow analysis methods have been proposed to visualize the transfer mechanism of internal forces within structures. Initially, principal stress trajectories [25] were used to represent the load paths within a structure. However, the stress only reflects the local force distribution. The stress concentration at complex features may distort the accurate representation of the force flow direction, which limits the further application of this method. In 1995, Kelly and Elsley [26] introduced a new definition of force flow, as illustrated in Figure 2. The load path is defined as the constant load path from the application point through the internal structure to the support point. Based on the principles of continuity and equilibrium, this method ensures that the load value carried by the load path remains constant in the specified direction. It reflects the load transfer process inside the structure and can capture the distribution of bending moment and shear force, thereby providing suggestions for structural optimization. This approach is considered a relatively ideal representation of force flow. Since 1995, Kelly’s load path theory has been continuously refined and applied to structural optimization [27,28]. However, the intrinsic relationship between the transmission paths established by this theory and the evaluation criteria for structural force transfer performance has not yet been thoroughly investigated.
In recent years, with the continuous progress of stress theory and the development of advanced finite methods [9,29], international scholars have made new attempts in the field of load path analysis. Komarov et al. [30] developed a visualization model for structural load-bearing skeletons based on load-bearing factors. However, the calculation process of this model is a typical functional problem; there exist significant challenges in obtaining solutions. Takahashi et al. [31] introduced the concept of relative stiffness, which captures the influence of different regions on the overall strain energy of the structure, thereby deriving the load transfer law within the structure and ultimately fitting the force transmission paths. However, the above force transmission path methods are mostly used for shape optimization, or the accuracy of the force transmission path is largely influenced by subjective factors. They have not been combined with the existing traditional optimization methods from a theoretical perspective; thus, they are unable to form a complete set of general optimization mathematical models and are also unable to specifically elaborate and express the bearing performance of the overall structure from the perspective of a single component or element.
In summary, topology optimization aims to identify the best load-bearing framework of a structure based on its topological layout. However, existing methods still have room for improvement in making the evaluation of structural performance more intuitive and in analyzing the force transmission path more thoroughly. Most studies focus on the topological shape of the optimization results, while paying less attention to the relationship between the bearing capacity of components and the force transmission mechanism, as well as how performance is evaluated. This results in weak mechanical interpretability of the optimization outcomes and makes it difficult to clearly explain the force transmission mechanism within the structure. To address this, this study proposes a new mathematical optimization model that directly uses mechanical mechanism indicators as the objective function and combines it with the ESO algorithm. By defining the bearing capacity of components, deriving their calculation formulas, and constructing the force transmission path model, the key issues of matching the demand for bearing capacity and force transmission of components or units within the overall layout are identified.
Therefore, this paper proposes an evolutionary structural topology optimization method based on component bearing capacity analysis. To eliminate numerical instability phenomena such as checkerboard patterns and grid dependence, sensitivity control and grid filtering techniques are introduced, thereby obtaining clear and well-defined topological optimization results.
The main contributions of this study can be summarized as follows:
(1)
The calculation formula for element bearing capacity was derived, and the effectiveness in evaluating structural load-bearing performance was validated.
(2)
Innovation in the proposal of a new objective function based on element bearing capacity.
(3)
Practical implementation on a widely used platform (ANSYS APDL 2024 R1).
(4)
The existing filtering strategy was applied to the new topology optimization model in this paper, resulting in better topology optimization configurations and outcomes.
The remaining part of the article is organized as follows. Section 2 provides the problem statement. Section 3 introduces the topology optimization method based on element bearing capacity and solution strategy. In Section 4, the proposed methods are validated using a numerical case and an engineering application. Finally, Section 5 summarizes this paper.

2. Statement of the Problem

The ESO method was proposed by Xie Yimin and Steven [32]. The fundamental principle is to iteratively remove inefficient or ineffective elements from a structure during the optimization process, thereby gradually achieving the optimal structural configuration [33]. Compared to traditional topology optimization methods, the primary advantage of the ESO method lies in its simplification of constraints, which significantly streamlines the optimization process. In contrast to the variable density method in topology optimization, the ESO method avoids intermediate states between 0 and 1 for elements, thereby enhancing the quality of the optimization. Additionally, the ESO method is straightforward to implement computationally, with optimal program versatility. As a result, it has been widely applied in engineering practice.
The mathematical model of structural optimization inherently involves three essential components: the objective function, design variables, and constraints. An effective topology optimization algorithm must strike a balance between the objective function, constraints, and design variables, which essentially reflects the symmetry and tradeoff between the objective and constraints. The general mathematical formulation of the ESO method can be expressed as shown in Equation (1).
min f x s . t . g i x 0 ,   i = 1 , 2 , 3 , , m h j x = 0 ,   j = 1 , 2 , 3 , , l a k x k b k ,   k = 1 , 2 , 3 , , n
where f x represents the objective function; g i x denotes the inequality constraints; h j x represents the equality constraints; x indicates the design variable; and a k and b k represent the boundary values for each variable x k .

2.1. Model Description Based on Stress Criteria

The ESO method assumes that removing material from low-stress regions will not excessively impact the performance of the remaining structure. This principle forms the foundation of the stress-based topology optimization process. Specifically, any structure can be discretized into a series of finite elements. By defining a threshold stress value, elements with stresses below this threshold are removed in each iteration. This iterative process is repeated until the structure evolves into a configuration with a more uniform stress distribution, where the stress values approach the allowable limits. At this stage, the material in every region of the structure is utilized with maximum efficiency. The mathematical representation of this process is expressed in Equation (2).
find β = β 1 , β 2 , β 3 , , β n min max σ e v m s . t . V = i = 1 N β i V i V β i = 0 , 1 e = 1 , 2 , 3 , , N
where σ e v m represents the Von Mises stress of the element e ; V i expresses the upper limit of material usage for the structure; β i denotes the existence state of the element i (where β i = 1 if the element exists and β i = 0 if it is removed); V i indicates the volume of the element i ; and N represents the total number of elements.
For a two-dimensional planar element, the stress vector of the element e is denoted as σ = σ x , σ y , τ x y T , and its Von Mises stress σ e v m is expressed as shown in Equation (3).
σ e v m = σ x 2 + σ y 2 σ x σ y + 3 τ x y 2
For a three-dimensional solid element, the stress vector of the element e is denoted as σ = σ x , σ y , σ z , τ x y , τ y z , τ z x e T , and its Von Mises stress σ e v m is expressed as shown in Equation (4).
σ e v m = 1 2 σ x σ y 2 + σ y σ z 2 + σ z σ x 2 + 6 τ x y 2 + τ y z 2 + τ z x 2
During the stress optimization process, an element removal ratio is defined to control the iterative steps of optimization. Typically, σ max v m is taken as the maximum Von Mises stress among all elements in the structure. In the iterative stress optimization process, the Von Mises stress σ e v m of an element satisfies Equation (5).
σ e v m σ max v m R R j
where R R j represents the current removal ratio j = 0 , 1 , , N , with R R 0 being the initial removal ratio, typically set at 1% [5].
It is concluded that the element is in a low-stress state and is relatively ineffective or inefficient compared to other elements in the structure. Such elements should be removed from the structure using the element birth and death method. If the process of finite element analysis, element removal, and element sensitivity analysis is repeated, the objective function may fall below the corresponding removal ratio R R j , making it difficult to satisfy the constraints. This indicates that the current removal ratio R R j is no longer capable of filtering out inefficient elements. To address this issue, a step size value (parameter evolution rate E R , set at 1% [5]) must be introduced to update the existing removal ratio, as expressed in Equation (6).
R R j + 1 = R R j + E R
By using Equation (6), the removal ratio can be adjusted, and the calculated R R j + 1 value can replace the original removal ratio. Repeating the analysis process allows the structure to iteratively evolve until the volume constraint condition is satisfied, at which point the optimization process terminates.
The stress-based ESO method evaluates whether material in a specific region of the structure can be removed by comparing the ratio of the minimum to maximum stress values during the iterative process. However, the optimization results obtained by this method are not unique. This is because the topological structure changes after each computational iteration, and different initial values and filtering rates can steer the optimization results in different directions. Moreover, if the removal ratio is too large, it may cause the stress distribution to change too rapidly, leading to non-convergence after only a few iterations. Conversely, if the removal ratio is too small, the optimization process may become excessively slow. Therefore, the stress-based ESO method requires researchers to conduct extensive trial calculations to select appropriate initial values and evolution rates.

2.2. Model Description Based on Maximizing Overall Stiffness

Structural compliance C is a widely used optimization metric in topology optimization. Its evaluation effect is equivalent to assessing the overall stiffness of the structure. The unified mathematical formulation for topology optimization based on structural compliance is expressed in Equation (7).
find β = β 1 , β 2 , β 3 , , β n min C = F T u s . t . V = i = 1 N β i V i V β i = 0 , 1 i = 1 , 2 , 3 , , N
where F represents the nodal load vector, u represents the nodal displacement vector, and the other variables are analogous to those used in the stress-based ESO method.
The nodal load vector F and the nodal displacement vector u satisfy the equilibrium equation, as shown in Equation (8).
Ku = F
where K represents the global stiffness.
If the load F is a fixed load, meaning its value remains unchanged even when the structural configuration is altered, the change in the overall structural compliance when the element i is removed can be expressed as shown in Equation (9).
Δ C i = F T Δ u
where Δ u represents the change in the nodal displacement vector.
When an element i is removed, the equilibrium equation yields K + Δ K u + Δ u , where Δ K represents the change in the global stiffness matrix caused by the removal of the element i . By neglecting higher-order terms Δ K Δ u and combining Equation (9), the change in the nodal displacement vector can be expressed as shown in Equation (10).
Δ u = K 1 Δ K u
From the above equation, the change in structural compliance caused by the removal of an element i can be derived as shown in Equation (11).
Δ C i = F T Δ u = F T K 1 Δ K u = Ku T K 1 Δ K u = u T K K 1 Δ K u = u T Δ K u = u i T K i u i
where u i represents the nodal displacement vector of the element i , and K i represents the stiffness matrix of the element i .
Therefore, the sensitivity of the element i can be calculated as shown in Equation (12). When the element sizes are unequal, normalization is required.
α i s = u i T K i u i Equal-sized   elements u i T K i u i / V i Unequal-sized   elements
where α i s represents the sensitivity of the element, and V i denotes the volume of the element i .
Unlike the stress-based removal criterion in the stress criterion, the topology optimization design based on element compliance change focuses on the impact of each element’s existence or removal on the structural deformation. As shown in Equation (12), the change in element compliance corresponds to the state of the element (present or removed), which is reflected in the overall strain energy of the structure. By using α i s / α max s R R j (the ratio of the sensitivity of each element to the maximum sensitivity in the structure), elements whose removal has little effect on the overall strain energy change are filtered out. Like the stress-based removal criterion, the topology optimization design based on compliance change gradually iterates until the total strain energy approaches a constant value, and the compliance of each element tends to equilibrate. However, selecting appropriate initial values and evolution rates still requires extensive trial calculations.
When using stress as the optimization criterion or the maximum stiffness criterion as the removal condition, the ESO method is primarily applied to continuum structures and is rarely used for discrete structures. Furthermore, the stress-based ESO method does not guarantee that the optimization results are globally optimal. On the other hand, the maximum-stiffness-based ESO method neglects higher-order terms during calculations. However, when many elements are involved, this simplification can lead to significant issues such as checkerboard patterns or mesh dependency, which cannot be ignored. Thus, while the ESO method provides a practical approach to structural optimization, its limitations in handling discrete structures, ensuring global optimality, and addressing numerical artifacts must be carefully considered in its application.

3. Topology Optimization Method Based on Element Bearing Capacity and Solution Strategy

3.1. Definition of Element Bearing Capacity

As shown in Figure 3, the loading condition applied to the continuum structure is denoted as Γ 1 , the boundary constraints are represented by Γ 2 , Γ 3 specifies the boundary conditions of the control region, and Γ 4 corresponds to the free boundaries of the structure.
When the selected control region is not removed, the following condition, as expressed in Equation (13), is satisfied.
σ i j , j + b i = 0 for   Ω   and   Ω 3 σ i j n j = f 1 i on   Γ 1 δ i = 0 on   Γ 2 σ i j n j = f 2 i on   Γ 2 σ i j n j = 0 on   Γ 4
where σ i j represents stress; b i represents body forces; n i represents the normal direction of the surface; f 1 i represents external forces; f 2 i represents reaction forces; and δ i represents displacement.
Assume that all forces applied to the structure are transmitted from the loading surface to the support surface. The force applied to the loading surface can be divided into two parts: one part passes through the control region Ω 3 (the load-bearing capacity of the region), and the other part does not pass through the control region Ω 3 . A force f 1 is applied to the surface Γ 3 , and the displacement δ 1 generated on the surface Γ 1 is obtained through finite element calculation.
The control region Ω 3 is removed, a force f 1 is applied to the loading surface Γ 1 to produce the same displacement, and the reaction force f ¯ 2 i is calculated (or the force that needs to be applied Γ 1 ). Based on the principle of static equilibrium, the structure at this point satisfies Equation (14).
σ ¯ i j , j + b i = 0 for   Ω σ ¯ i j = 0 on   Ω 3 δ i = δ 1 i on   Γ 1 δ i = 0 on   Γ 2 σ ¯ i j n j = f ¯ 2 i on   Γ 2 σ ¯ i j n j = 0 on   Γ 3   and   Γ 4  
where σ ¯ i j represents stress; b i represents body forces; and f ¯ 2 i represents the reaction forces on the support surface Γ 2 that do not pass through the region of interest Ω 3 .
Therefore, the difference in the reaction forces on the support surface Γ 2 before and after removing the region of interest Ω 3 is defined as the force transmitted by the region Ω 3 , i.e., the load-bearing capacity of the region Ω 3 , as shown in Equation (15):
F Ω 3 = f ¯ 2 i f 2 i = σ ¯ i j n j σ i j n j on   Γ 2
By continuously changing the position of the region Ω 3 , the load-bearing capacity of any region in the structure can be determined. When using the finite element method for calculation, the region Ω 3 described here corresponds to the elements in the finite element model. Therefore, the key to this method lies in how to remove and restore region Ω 3 .

3.2. Element Birth and Death Method

Based on the above analysis, it is evident that when calculating the load-bearing capacity of each region, it is necessary to remove and restore the control region. The element birth and death method [34] is an advanced analysis skill in ANSYS APDL 2024 R1 that allows certain elements to automatically disappear or reappear as needed during the analysis. This technique ensures that mechanical information is not lost when other elements are removed.
According to finite element theory, the relationship between the nodal force f i e and the nodal displacement δ i e for any element i can be expressed as shown in Equation (16).
f i e = k i e δ i e
where k i e is the stiffness matrix of the element i .
To control the “birth and death” properties of elements, Equation (16) is locally modified by multiplying the stiffness matrix k i e by an activation factor λ i . At this point, the relationship between the nodal force and nodal displacement for the element i becomes:
f i e = λ i k i e δ i e
The value of λ i is given by Equation (18).
λ i = 1 1 × 10 6 Element   i   is   in   the   active   state   Element   i   is   in   the   deactivated   state
Therefore, by controlling the activation factor λ i , any element in the structure can be “activated” or “killed”. To achieve the “killed” effect for an element i , it is not necessary to physically delete the element. Instead, the stiffness matrix of the element i can be multiplied by a very small number, while the loads, mass, damping, and other properties associated with the element i are set to minimal values. Similarly, when an element i needs to be “activated”, the stiffness matrix of the element i is simply multiplied by 1, and all its loads and other properties are fully activated.

3.3. Element Bearing Capacity Theory Based on Element Birth and Death Method

The current research method is only applicable under the following assumptions:
  • The structural material is linearly elastic, homogeneous, and isotropic;
  • The load is a static load, and the dynamic effect of the load is not considered.
As shown in Figure 4, a finite element model of a rectangular cantilever structure is established. Assume that the node n is subjected to a force f (which can be decomposed into two components), and nodes 1 and 2 are support points. Element j is the region of interest. Expanding and transforming Equation (17) yields Equation (19).
c 11 c 1 i c 1 i + 1 c 1 n c i 1 c i i c i i + 1 c i n c i + 11 c i + 1 i c i + 1 i + 1 c i + 1 n c n 1 c n i c n i + 1 c n n ] [ f 1 f x f y f n ] = [ δ 1 δ x δ y δ n
As shown in Figure 5, the displacements applied to the structural boundaries can be regarded as unidirectional forces at the nodes, corresponding to f x and f y in the matrix. Expanding the matrix by rows and columns yields Equation (20).
j = 1 n c i j f j = δ j
Since the forces are applied to individual nodes, Equation (20) can be transformed into Equation (21).
c i i f x + c i i + 1 f y = δ x c i + 1 i f x + c i + 1 i + 1 f y = δ y
where f x and f y denote the force vector in the x-direction and y-direction, respectively; δ x and δ y represent the displacements of the constraint node.
When only unidirectional forces are applied, the above formula has general significance and can be expressed as shown in Equation (22).
A f x + B f y = u x C f x + D f y = u y
where A , B , C , and D represent the relative stiffness of the nodes; and u x and u y represent the displacements of the nodes.
As shown in Equation (22), to solve for arbitrary u x and u y , the values of A, B, C, and D need to be determined. According to linear algebra theory, solving these four unknowns requires four equations. Therefore, when killing each element, horizontal force f x and vertical force f y can be applied to the same node, as shown in Figure 5. This implies that when applying a horizontal force, the vertical force is zero, and vice versa. Based on this, the relevant coefficient values can be derived, as shown in Equation (23).
A = u 1 x f x , B = u 2 x f y , C = u 1 y f x , D = u 2 y f y .
Based on the concept of element force transmission, the displacement vector U x , U y is obtained by solving the original structure before any elements are removed. To ensure that the nodal displacements remain unchanged after removing elements and applying loads, a force vector F x , F y can be assumed. This leads to Equation (24).
A F x + B F y = U x C F x + D F y = U y
By solving the system of equations, Equation (25) can be obtained.
F x = D U x B U y A D B C = f x u 2 y U x u 2 x U y u 1 x u 2 y u 2 x u 1 y F y = C U x A U y B C A D = f y u 1 y U x u 1 x U y u 2 x u 1 y u 1 x u 2 y
From the definition of element load-bearing capacity, it follows that the magnitude of the element load-bearing capacity can be expressed as the difference in reaction forces under different states of the control region. Based on the above equation, the external force under constant displacement conditions can be solved. From the force equilibrium, it is known that this value equals the reaction force. Therefore, the force transmitted by each element can be expressed as shown in Equation (26).
T x = F x F x i n i t i a l = f x u 2 y U x u 2 x U y u 1 x u 2 y u 2 x u 1 y F x i n i t i a l T y = F y F y i n i t i a l = f y u 1 y U x u 1 x U y u 2 x u 1 y u 1 x u 2 y F y i n i t i a l
where T x and T y represent the x- and y-direction bearing capacity.
As shown in Equation (26), when an element’s unidirectional force is applied in the y-direction, the resulting displacement in the x-direction is minimal. Similarly, when an element’s unidirectional force is applied in the x-direction, the resulting displacement in the y-direction is minimal. Therefore, for element unidirectional forces applied in the x- and y-directions, the resulting displacements can be defined as follows:
u 1 y = 0 u 2 x = 0
Therefore, the calculation of the load-bearing capacity for any element can be simplified to Equation (28):
T x = f x U x u 1 x F x i n i t i a l T y = f y U y u 2 y F y i n i t i a l
As shown in Equation (28), the change in element load-bearing capacity can be calculated using forces applied in horizontal and vertical directions.

3.4. Evolutionary Structural Optimization Method Based on Element Bearing Capacity

3.4.1. Topology Optimization Model Based on Element Bearing Capacity

The existing progressive structural optimization methods consider either stress criteria or sensitivity criteria. Among them, the main idea of the stress criterion is that for each part of the structure, the part that bears the greater stress is retained, and the part that bears the smaller stress is deleted; similarly, the unit bearing capacity is used as an evaluation index. When the part with a larger unit bearing capacity is retained, the part with a smaller unit bearing capacity is deleted. The corresponding criteria for the objective proposed in this paper have certain similarities with the stress criteria, both reflecting a mechanical property of the unit in the overall structure.
From the above element load-bearing capacity formula, it can be concluded that the load-bearing capacity of an element depends on the applied element force. When the applied element force remains constant, the load-bearing capacity of the element is inversely proportional to the corresponding displacement. This inverse relationship can be used to evaluate the contribution of each element to the overall structural load-bearing performance. Therefore, this method can be applied not only to continuous structures but also to discrete mechanisms (truss structures). Assuming each component in the discrete structure (truss structure) is a force-bearing unit, by killing and reviving each element in sequence while keeping the displacement of the load-bearing point unchanged, the contribution degree of each component to the displacement of its load-bearing point can be determined. It is determined based on the degree of contribution, and then the discrete structure optimization design is carried out. The following rule can be established, as shown in Equation (29).
T F C = i = 1 n F i n F a p p
where F a p p represents the initial load; F i represents the element bearing capacity; and n represents the number of elements.
The metric is analogous to the fully stressed design criterion, where the dimensionless element load is used as a convergence indicator to determine whether the topology optimization results have reached convergence. Therefore, this metric can be utilized to establish a topology optimization function model, as shown in Equation (30).
find β = β 1 , β 2 , β 3 , , β e max T F C s . t . V = i = 1 N β i V i V β i = 0 , 1 i = 1 , 2 , 3 , , N
where β i represents the existence state of the element i ; V * represents the upper limit of the amount of material used in the structure; and V i represents the volume of the element i .
According to the topology optimization formula, it is necessary to define a material removal criterion to filter out inefficient material. Therefore, the following rule is established as per Equation (31).
α i S = F i F max e R R
where F i represents the element bearing capacity. F max e represents the maximum element bearing capacity.
In the equation, the material removal rate can be determined through trial calculations. In this study, a removal rate of 0.1 is selected.

3.4.2. Checkerboard Elimination Based on Higher-Order Sensitivity Allocation

To address the checkerboard phenomenon that arises during the finite element solution process, this study adopts the element sensitivity distribution method [35] proposed by Li to eliminate checkerboard patterns, as expressed in Equation (32).
α e = i = 1 m w i V i α i i = 1 m w i V i
where m represents all elements, and w i represents the weight filtering coefficient of the elements from the previous iteration.
The weight distribution coefficient generally satisfies the condition shown in Equation (33).
i = 1 m w i = 1
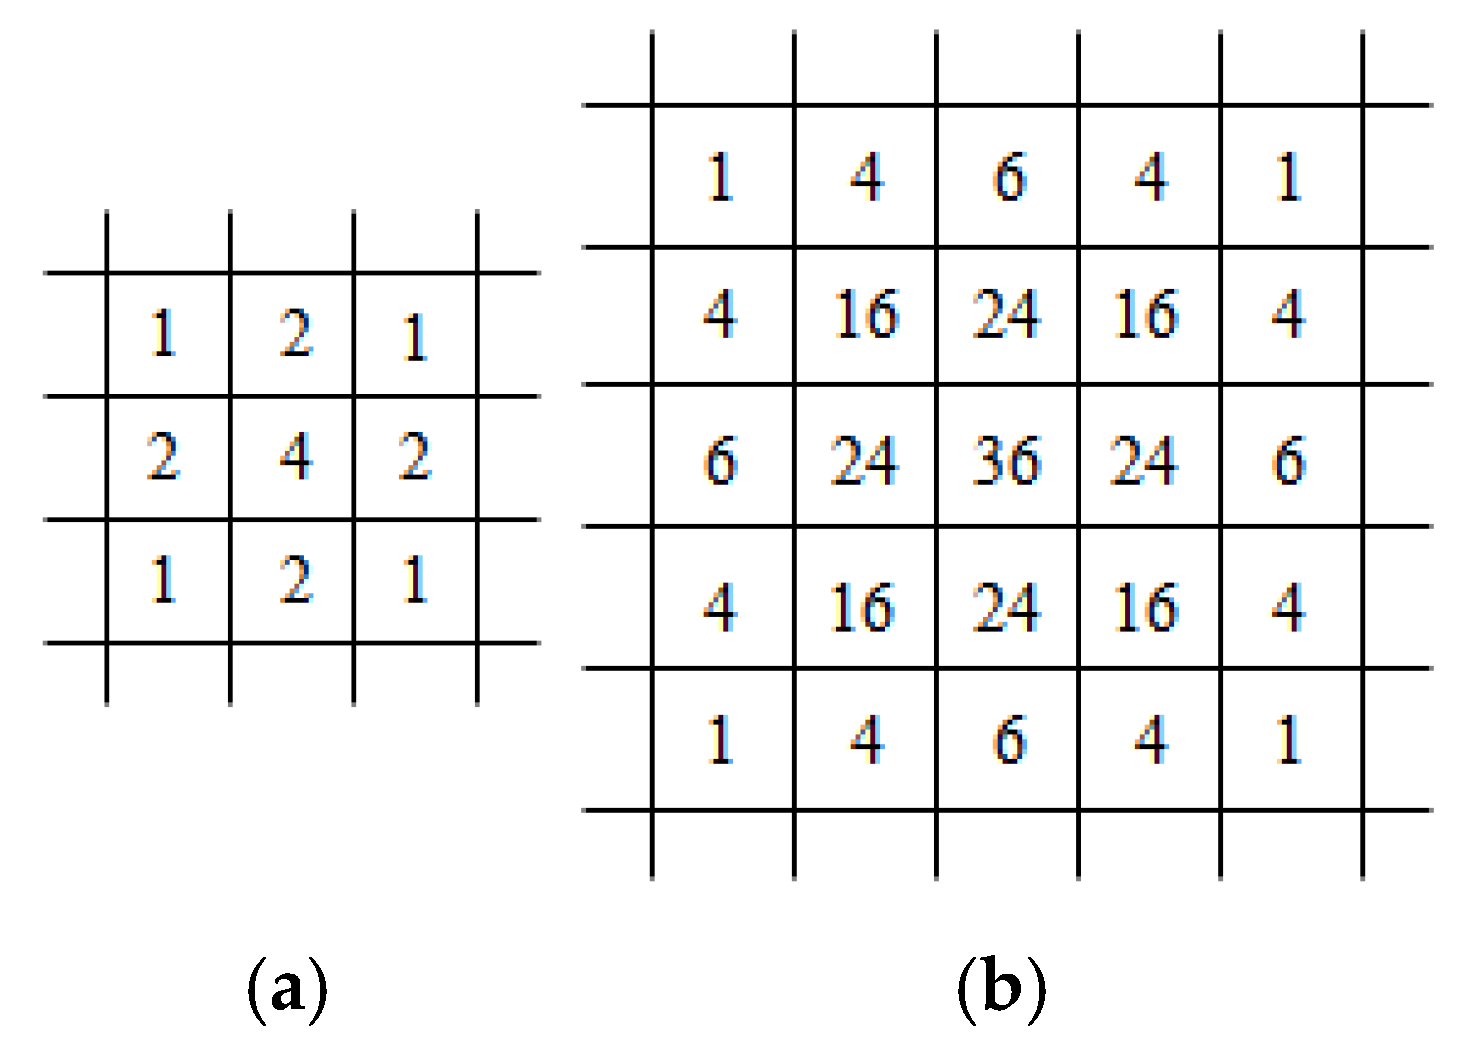
The element sensitivity distribution coefficient method proposed by Li primarily considers the influence of adjacent elements on the central element. Depending on the number of related elements selected, it can be categorized into different levels of sensitivity distribution. As shown in Figure 6a,b, these represent the first-order (where the central element has a value of 4) and second-order (where the central element has a value of 36) sensitivity distribution coefficients, respectively. The distribution values for the grid elements in the figures are selected based on experience and trial calculations. In this study, the values used are primarily referenced from those provided by Li. While Li’s method accounts for the influence of adjacent elements on the central element, it overlooks the impact of nodes on the elements.
Therefore, this study first distributes the sensitivity of elements to nodes and then calculates the overall sensitivity of each element by weighing the nodal sensitivities. The specific process is as follows:
(1)
Distribute the load-bearing capacity of the element to the relevant nodes. The resulting “load-bearing capacity” of the nodes is expressed as shown in Equation (34).
α n d = 1 N d = 1 N α e d = 1 M V d
where α n d represents the sensitivity of the node; M represents the total number of elements adjacent to the node d ; V d represents the volume of the element d ; and α e represents the sensitivity of the element d connected to the node d .
(2)
Reapply the distributed nodal load-bearing capacity to the elements. The resulting “new” element load-bearing capacity is expressed as shown in Equation (35).
α e = 1 N d = 1 N α n d
where N represents the total number of elements adjacent to element e ; and α e represents the average nodal sensitivity of element e .
In addition, the objective function and topology may not be convergent due to the inaccurate assessment of sensitivity values, especially for disconnected elements. To avoid this problem, Huang and Xie [36] proposed a further improvement of the sensitivity values by considering the sensitivity historical information for each element to achieve more accurate sensitivity assessment in the optimization iterations, as shown in Equation (36).
α ˜ e = α e k + α e k 1 2
where k represents the current iteration number; and α ˜ e represents the average sensitivity of the element e .

3.4.3. Grid Dependency Suppression Based on Mesh Filtering

The mesh filtering method proposed by Sigmund is primarily applicable to topology optimization methods with continuous variables, such as the homogenization method and the variable density method. The filtering equation is expressed as shown in Equation (37).
J ¯ x e = 1 x e i N H i i N H i x i J x i H i = r min r i , e
where r min and r i , e represent the screening and filtering radius, respectively, with the screening radius being necessarily larger than the filtering radius; J / x i and J ¯ / x e represent the initial and recalculated sensitivities, respectively; x i and x e represent the design variables, taking values of 0 , 1 ; and H i represents the convolution factor in the convolution-like transformation.
In the ESO method based on element load-bearing capacity, the state of an element can only be either “killed” or “alive”, corresponding to two numerical values: “1” indicates that the element is alive, and “0” indicates that the element is killed. Therefore, the sensitivity derived from the partial derivative of the objective function in the above equation does not apply to discrete elements divided by finite element meshing. It is necessary to convert the continuous variables into discrete variables, transforming the partial differential approach into a different form. This is expressed as shown in Equation (38).
Δ J ¯ e Δ x e = 1 x e i N H i i N H i x i Δ J i Δ x i
where Δ x i and Δ x e represent the state changes of the elements; Δ J ¯ e represents the recalculated sensitivity of the central element e ; and Δ J i represents the initially calculated sensitivity of the element.
In the ESO method based on element load-bearing capacity, the design variable for a killed element is assigned a value of 0, while the design variable for an active element is assigned a value of 1. Therefore, the state change in each element can be expressed as shown in Equation (39).
Δ x i = x i n e w x i o l d = 1
For elements in the active state, the following condition is expressed in Equation (40).
x i Δ x i = x e Δ x e = 1
Substituting the equation yields:
Δ J ¯ e = 1 i N H i i H H i Δ J i
As shown in Figure 7, the formula derived from the continuous mesh filtering equation indicates that all active elements within the screening radius r min influence the sensitivity of the central element. The magnitude of this influence is inversely correlated with the distance between the active elements and the central element within the radius. The farther the distance, the smaller the influence; the closer the distance, the greater the influence. However, elements outside the radius do not affect the central element.
Therefore, after calculating the element load-bearing capacity in each iteration, the first step is to redistribute the sensitivity of the original data using sensitivity reallocation. Then, the sensitivity of the filtered elements is recalculated using mesh filtering. This approach effectively suppresses both checkerboard patterns and mesh dependency.

3.4.4. Solution Strategy

From the above derivation, it is evident that the key to calculating the load-bearing capacity of elements lies in the reasonable control of changes in the load-bearing regions. Using the mesh generation technique in the finite element method, any structure can be discretized into a collection of elements. By mapping these element collections to the load-bearing regions of the structure, the load-bearing capacity of the elements can reflect the influence of any region on the overall structural load-bearing performance. The implementation of the ESO method based on element load-bearing capacity involves critical steps such as calculating the load-bearing capacity of each element based on its removal or retention and updating the structure according to the removal rate. This process is illustrated in Figure 8.

4. Numerical Cases and Engineering Application

In this section, two function examples and a lightweight design optimization of a dump truck lifting machine’s triangular arm are used to validate the high efficiency and robustness of the proposed topology optimization method based on element bearing capacity. In the implementation of optimization algorithms using ANSYS APDL (ANSYS Parametric Design Language), the process begins with defining the design domain, loads, boundary conditions, and mesh generation. The element deletion rate, evolution rate, and element bearing capacity optimization objectives are determined to guide the optimization process. The initial displacement of the force point is calculated, followed by the deletion of elements based on the element bearing capacity deletion criteria. The evolution of the element deletion rate is monitored, and independent mesh filtering technology is employed to ensure accurate results. Sensitivity calculations, including node sensitivity weighted calculations, and element sensitivity calculations, are performed to assess the impact of design changes. The process iterates until the optimization objectives are met, ensuring that the final design meets the specified volume constraints and performance criteria. The algorithm was tested on a computer with the following configuration: CPU i7-14700K, 64 GB RAM running at 6400 MHz.

4.1. Numerical Examples

4.1.1. Instance Verification and Visualization of Element Bearing Capacity

As shown in Figure 9a, a one-bay five-bar truss is used as an example to visualize the load-bearing capacity of elements in a discrete structure. Young’s modulus is set to 200 GPa. The initial area is 0.0314 m2. The total volume of the members is 0.1831 m3. The left node is subjected to simple support, and the node at the lower right corner is subjected to a load of 1 KN.
As shown in Figure 10a, a cantilever plate is used as an example to visualize the load-bearing capacity of elements in a continuum structure. The top and bottom left ends are fixed, and a force of −50 N in the y-direction is applied to the node at the right end. As shown in Figure 11a, fixed constraints are applied to the two points on the left side of a rectangular thin plate with a central hole, and forces of 50 N in the x-direction are applied to nodes along the same horizontal line. The length, width, and height of the plate are 0.2 m, 0.10 m, and 0.002 m, respectively, with a central hole radius of 0.02 m. Detailed material parameters and geometric models are provided in Table 1.
In ANSYS, the model is established, and boundary conditions as well as loading conditions are applied. Using APDL, a loop program is written to control the birth and death of each element iteratively, calculating the load-bearing capacity of each element. The results are visualized using vector arrows and contour plots, as shown in Figure 10b and Figure 11b.
To demonstrate that the element load-bearing capacity can evaluate the relative importance of any region of the structure, the element load-bearing capacity distribution maps (Figure 9b, Figure 10b and Figure 11b) are compared with the axial contour map or the stress distribution maps (Figure 9c, Figure 10C and Figure 11c) and the topology optimization maps (Figure 10d and Figure 11d). It is observed that the contour trends of the element load-bearing capacity maps align with those of the stress maps, and the vector arrow trends of the element load-bearing capacity maps correspond to the density trends of the topology optimization maps. Therefore, it can be concluded that the element load-bearing capacity effectively reflects the relative importance of the material in local regions to the overall load-bearing performance of the structure.

4.1.2. Example Verification of Evolutionary Structural Optimization Method Based on Element Bearing Capacity

(1)
Discrete Structure: Two-bay Ten-bar truss
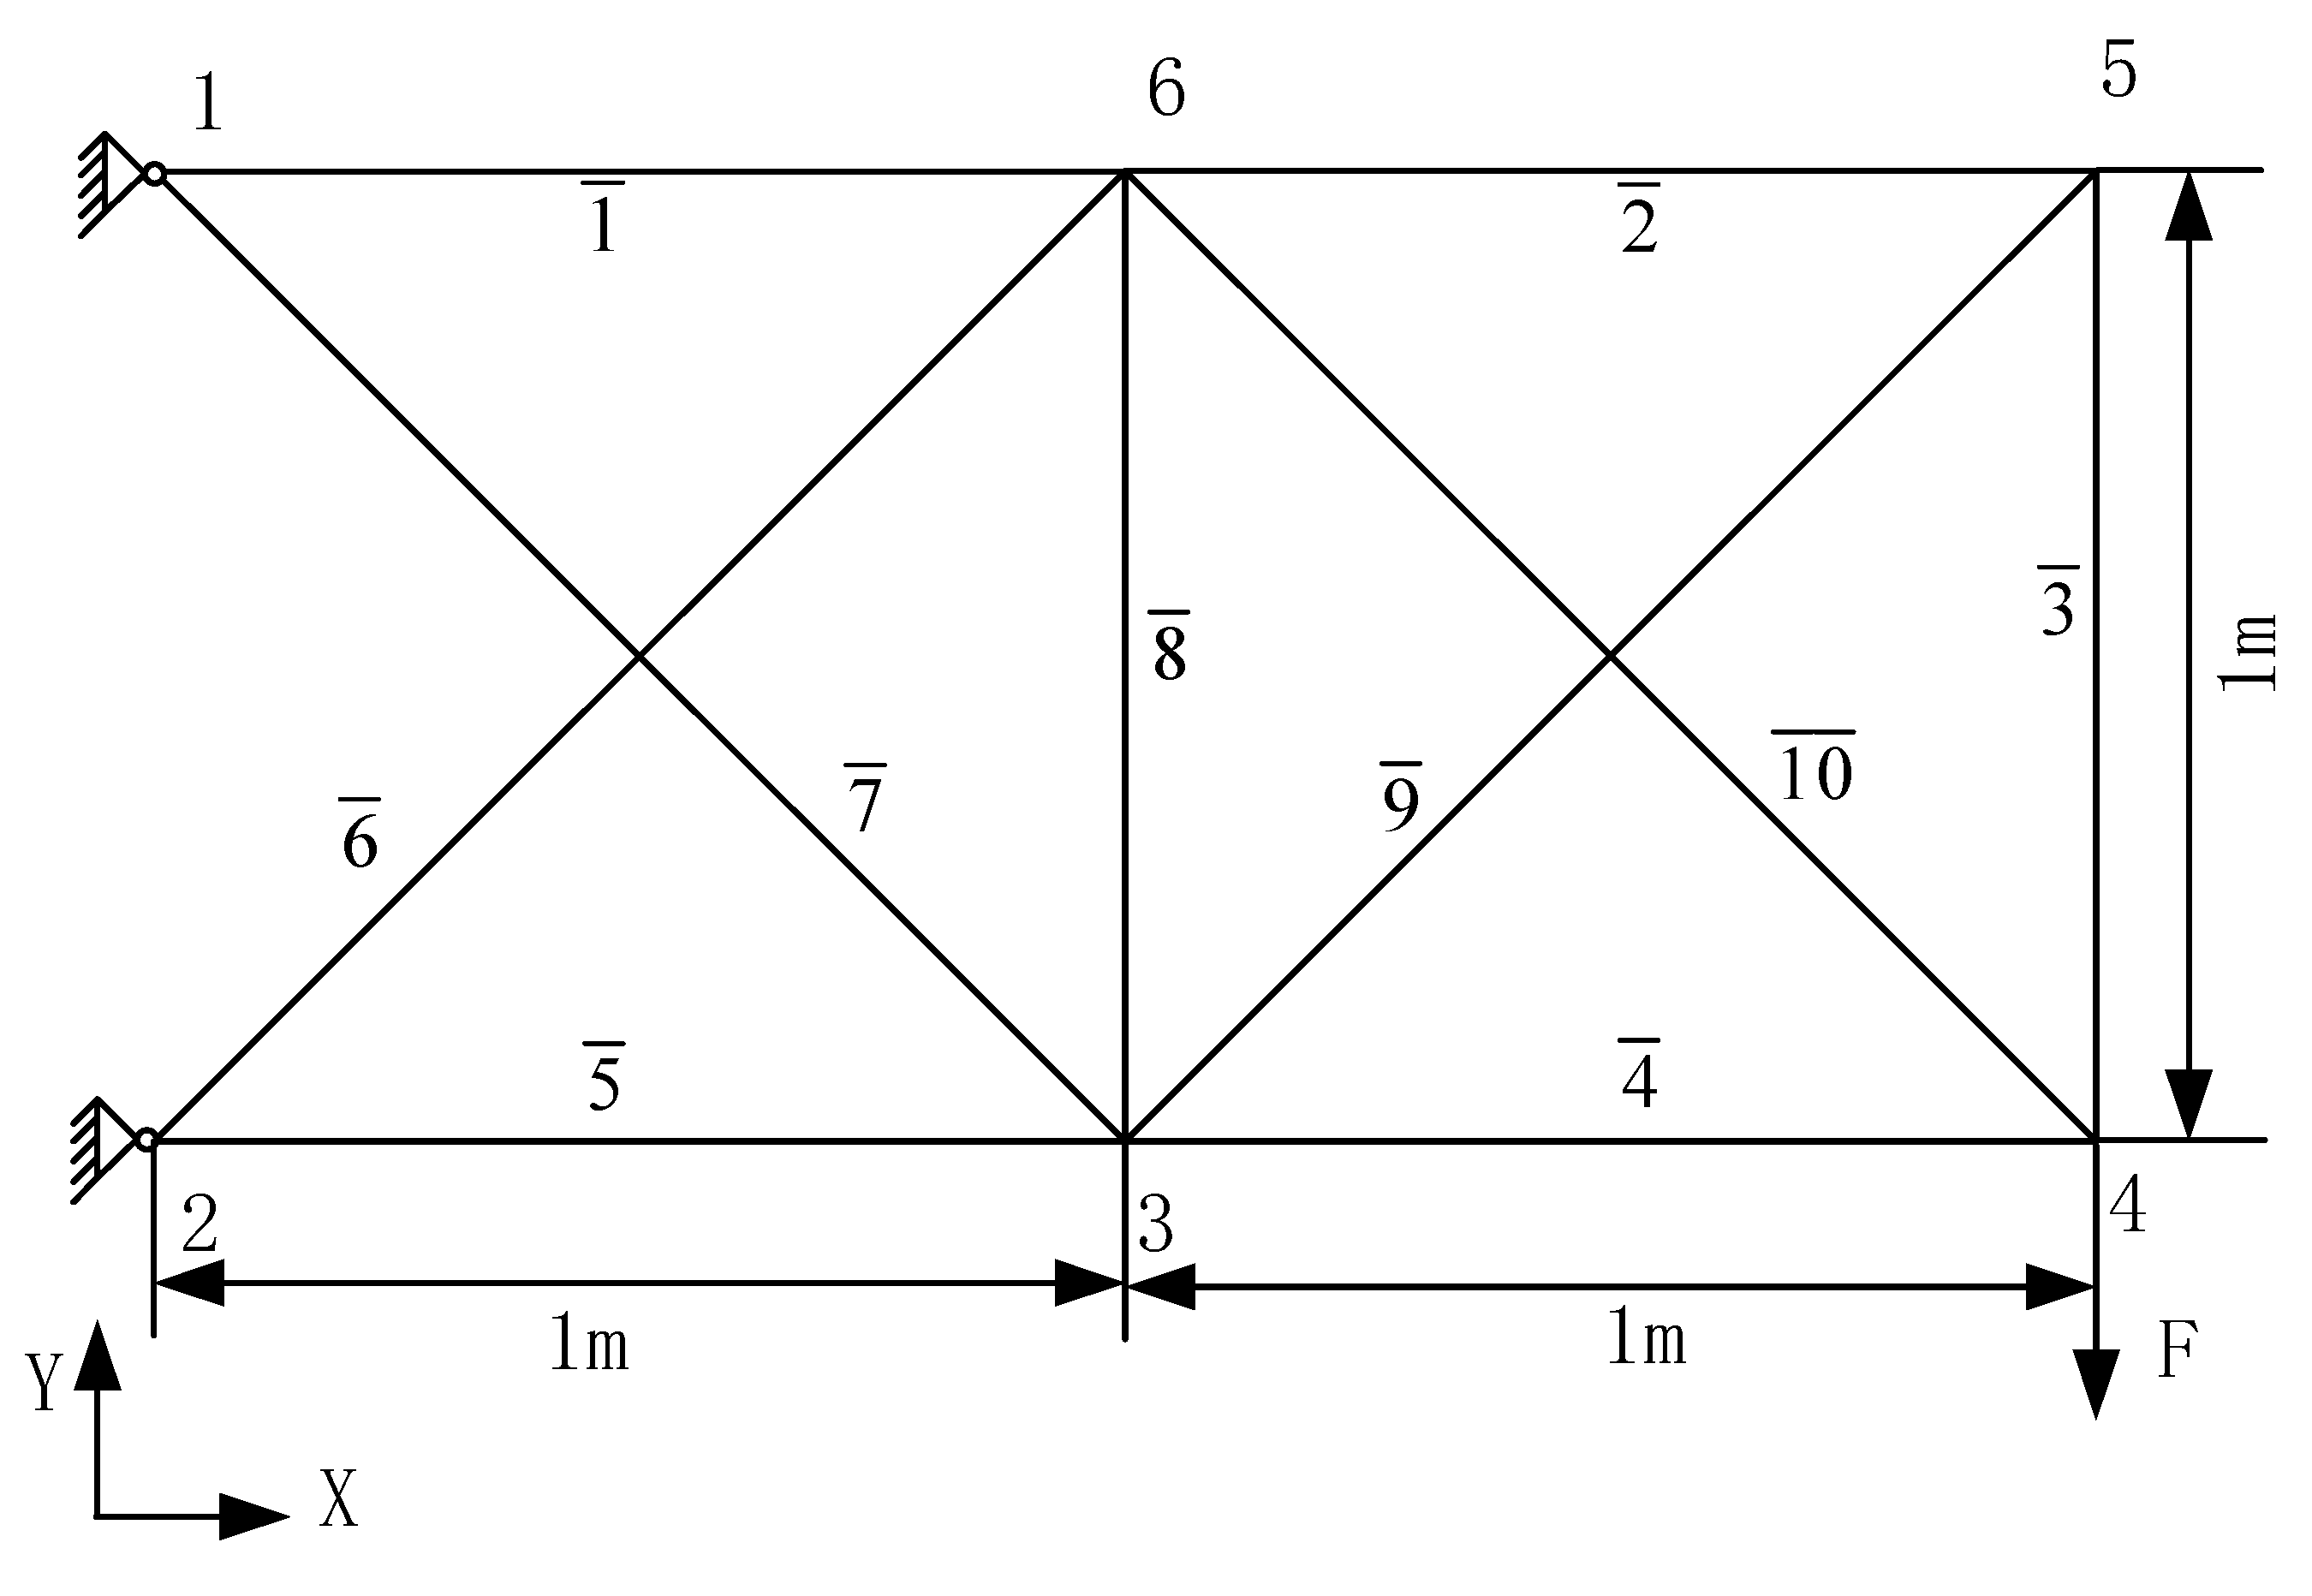
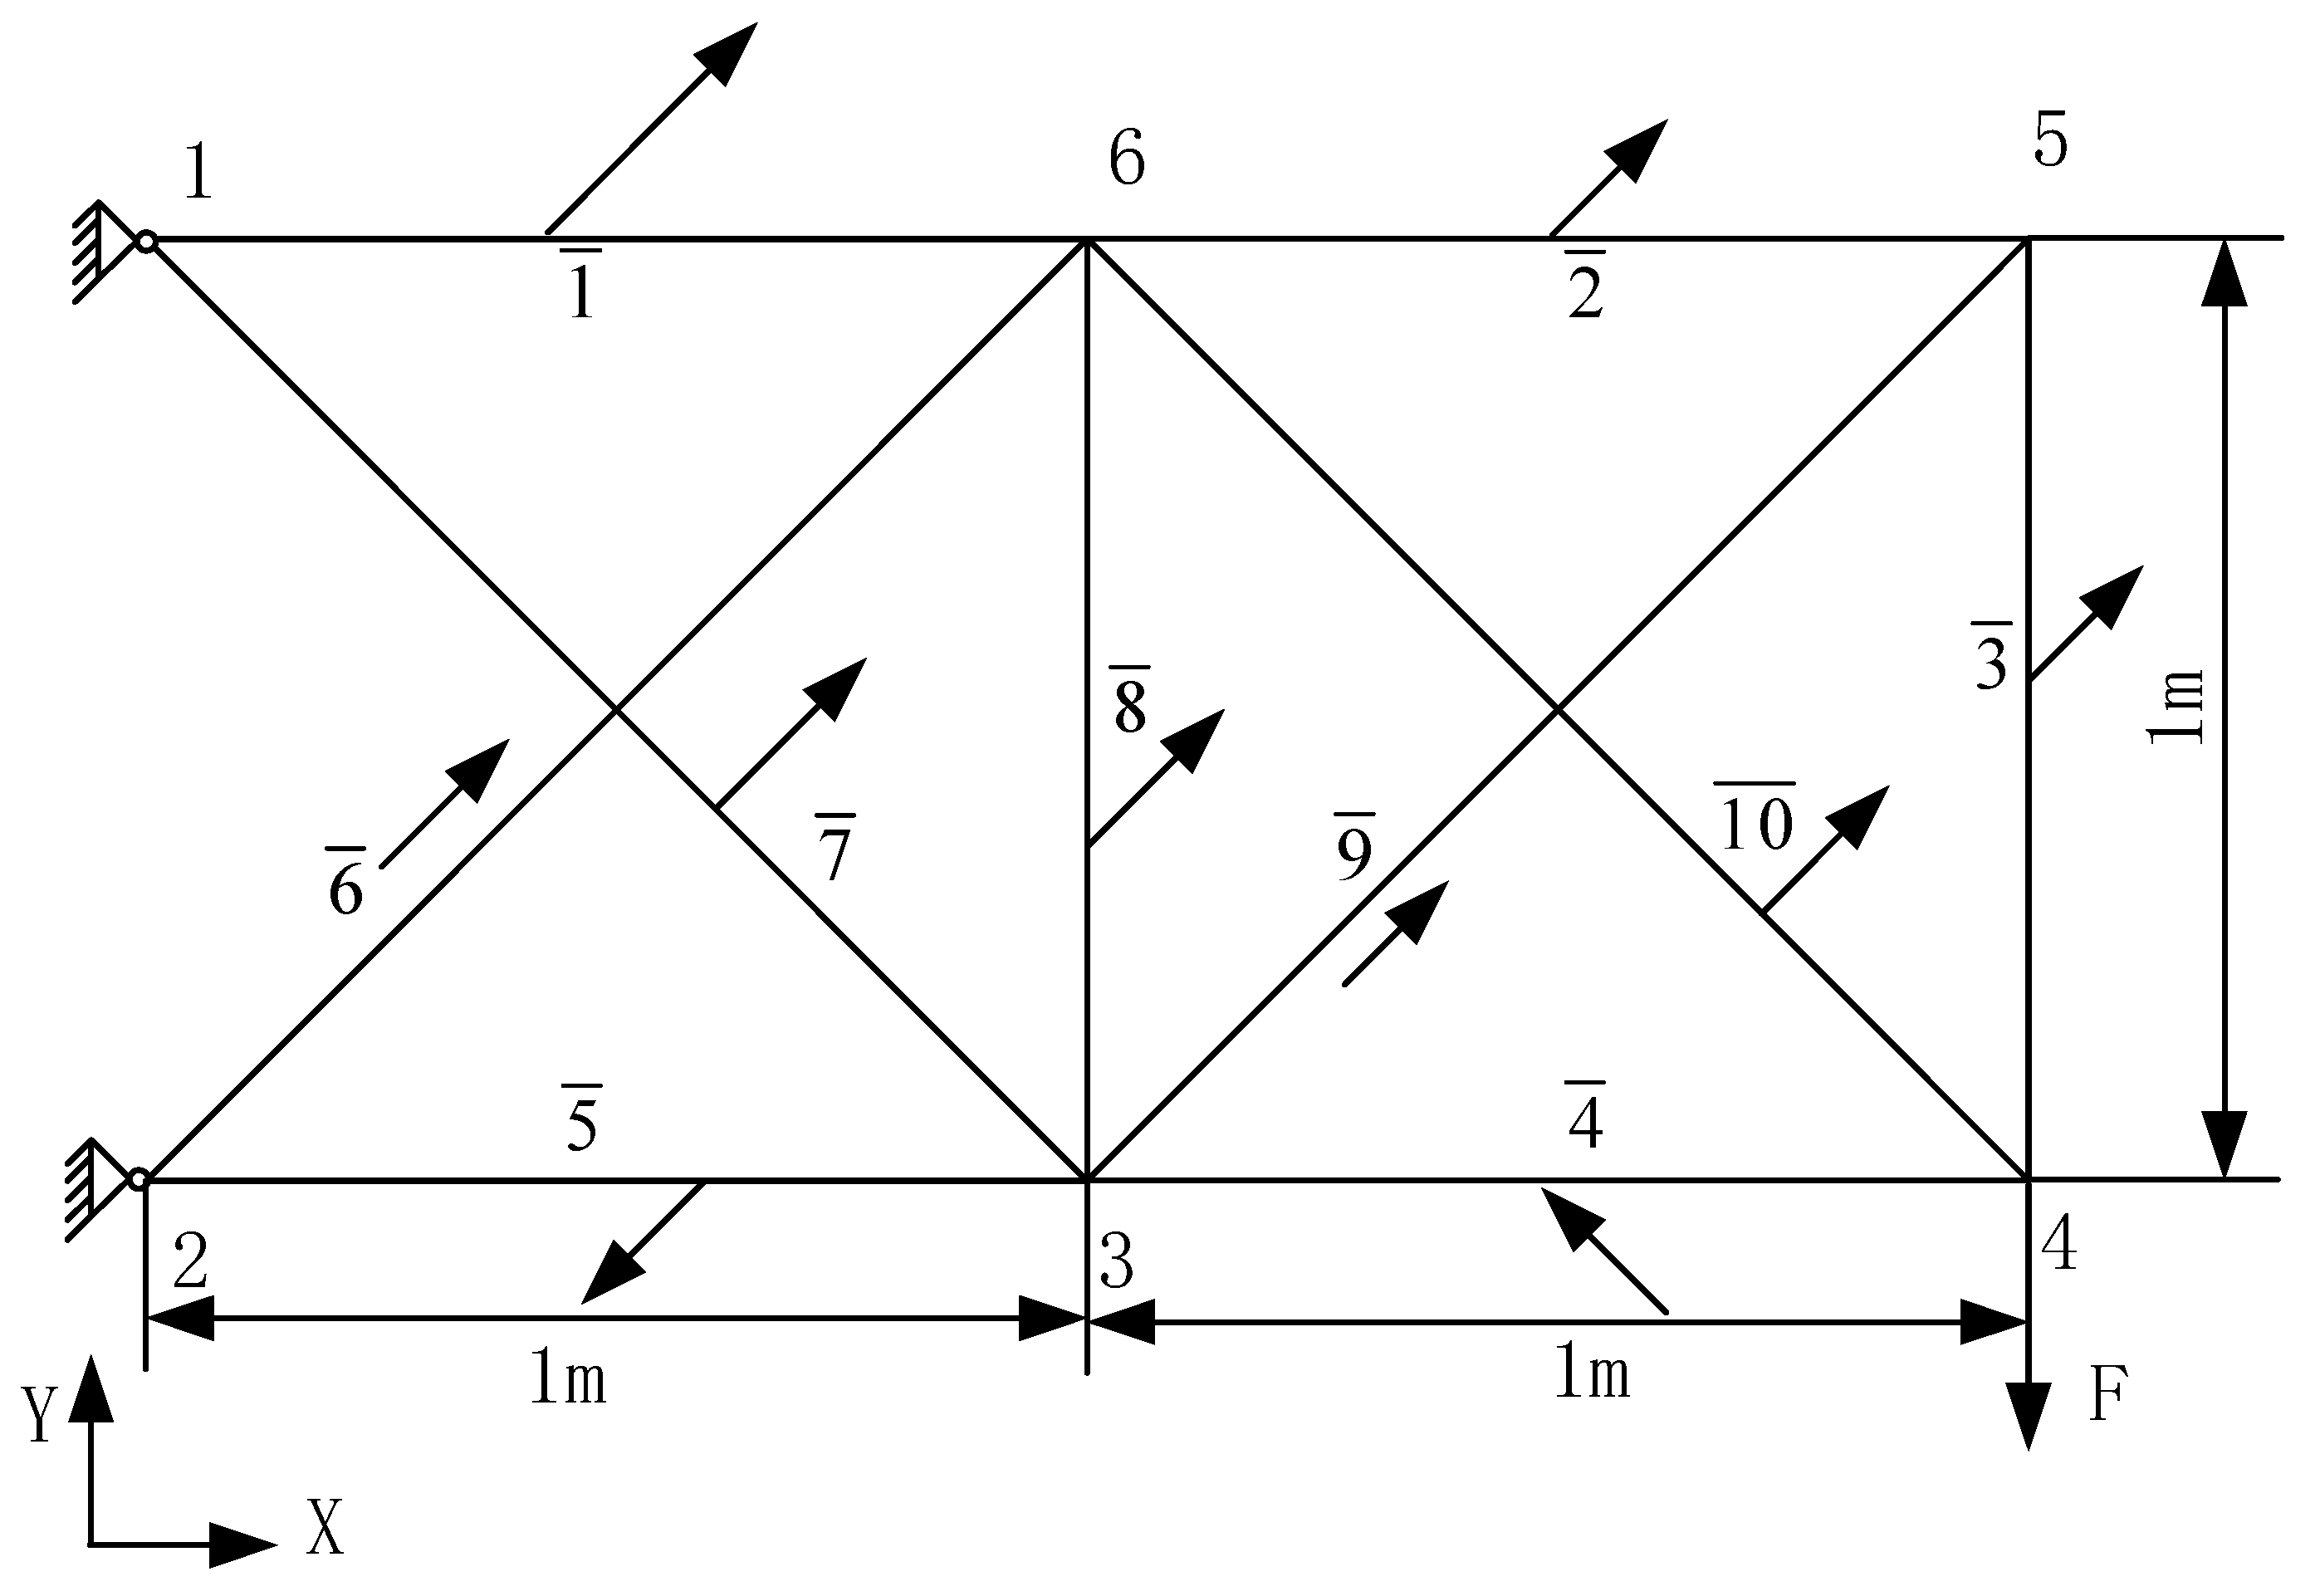
Consider the two-bay ten-bar truss shown in Figure 12. Young’s modulus is set to 200 GPa. The initial area is 0.0314 m2. The nodes of the truss structure are interconnected. Each rod is divided into an element, so the total number of elements is 10. Simple supports are applied at nodes 1 and 2, and a vertical downward force of −10 KN is applied at node 3. First, the normalized element bearing capacity vectors per unit area for each support node are calculated as shown in Table 2. Also, subjected forces in the members are shown. From these, the resultant normalized element bearing capacities to the support are obtained as shown in Table 3.
Based on the normalized element bearing capacity vector and norm in Table 3, a visualization diagram of the two-bay ten-bar truss element’s bearing capacity was drawn. The direction was determined by the normalized element bearing capacity vector, and the size was determined by the normalized element bearing capacity norm. The design is shown in Figure 13.
The progressive structural optimization method based on element bearing capacity directly deletes the elements with small contribution based on their bearing capacity. It is found that the normalized transferred force is the same in members 2, 3, 8, and 9, and it has the smallest value. Thus, members 2, 3, 8, and 9 are removed. The above steps are repeated. The final design is shown in Figure 14. The normalized element bearing capacity and subjected force for the final design are shown in Table 4. It is observed from Table 4 that the members in final design have larger normalized element bearing capacity values compared to the initial design. Thus, the members contribute sufficiently to the structure.
This case demonstrates that the progressive structural optimization method proposed in this paper, which aims to optimize based on the element bearing capacity, can be applied to discrete structures.
(2)
Continuous Structure: The cantilever plate
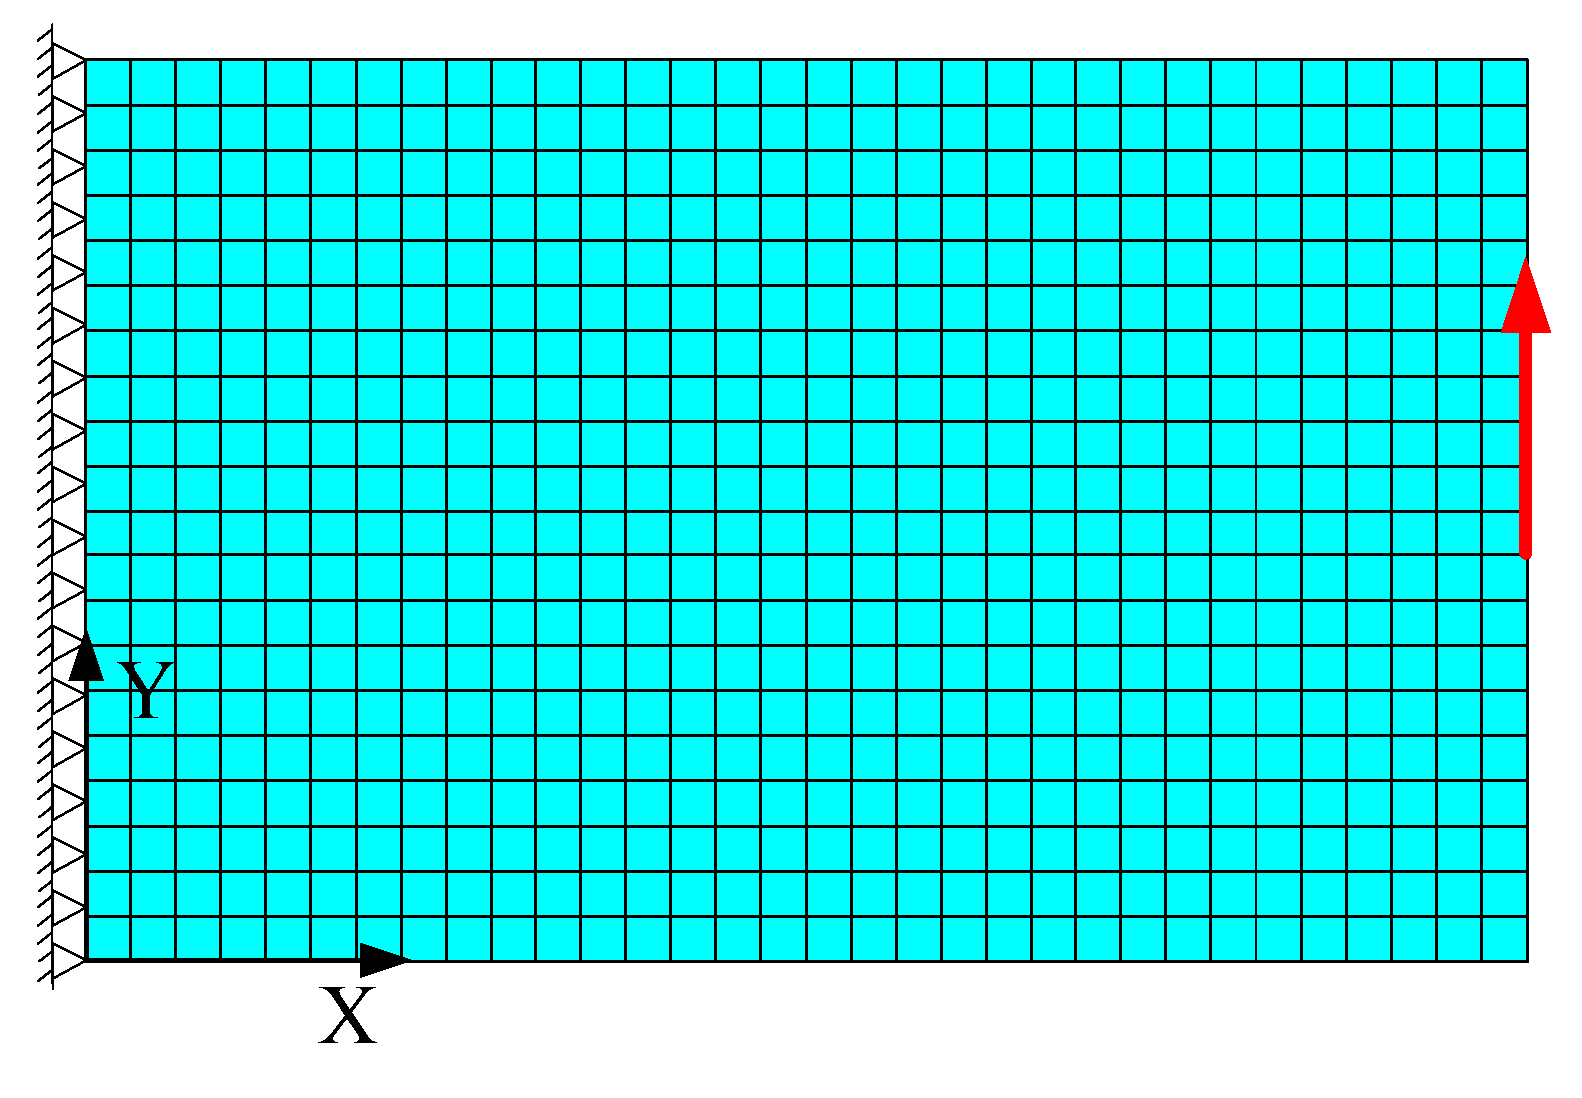
As shown in Figure 15, a cantilever plate is given, with the left side fully fixed and a vertical upward load applied at the center node on the right side. According to Equation (28), since the structure is only subjected to a force in the y-direction at the right node, the force in the x-direction can be neglected. Therefore, during the optimization process, only the load-bearing capacity in the y-direction needs to be considered. The model is constructed and solved in ANSYS, with the mesh divided into 32 × 20, totaling 640 elements. To avoid solver convergence issues after element removal, the element birth and death method is employed during the calculation, assigning a very small value to the “killed” elements. The material parameters and geometric model size of the cantilever plate are detailed in Table 5.
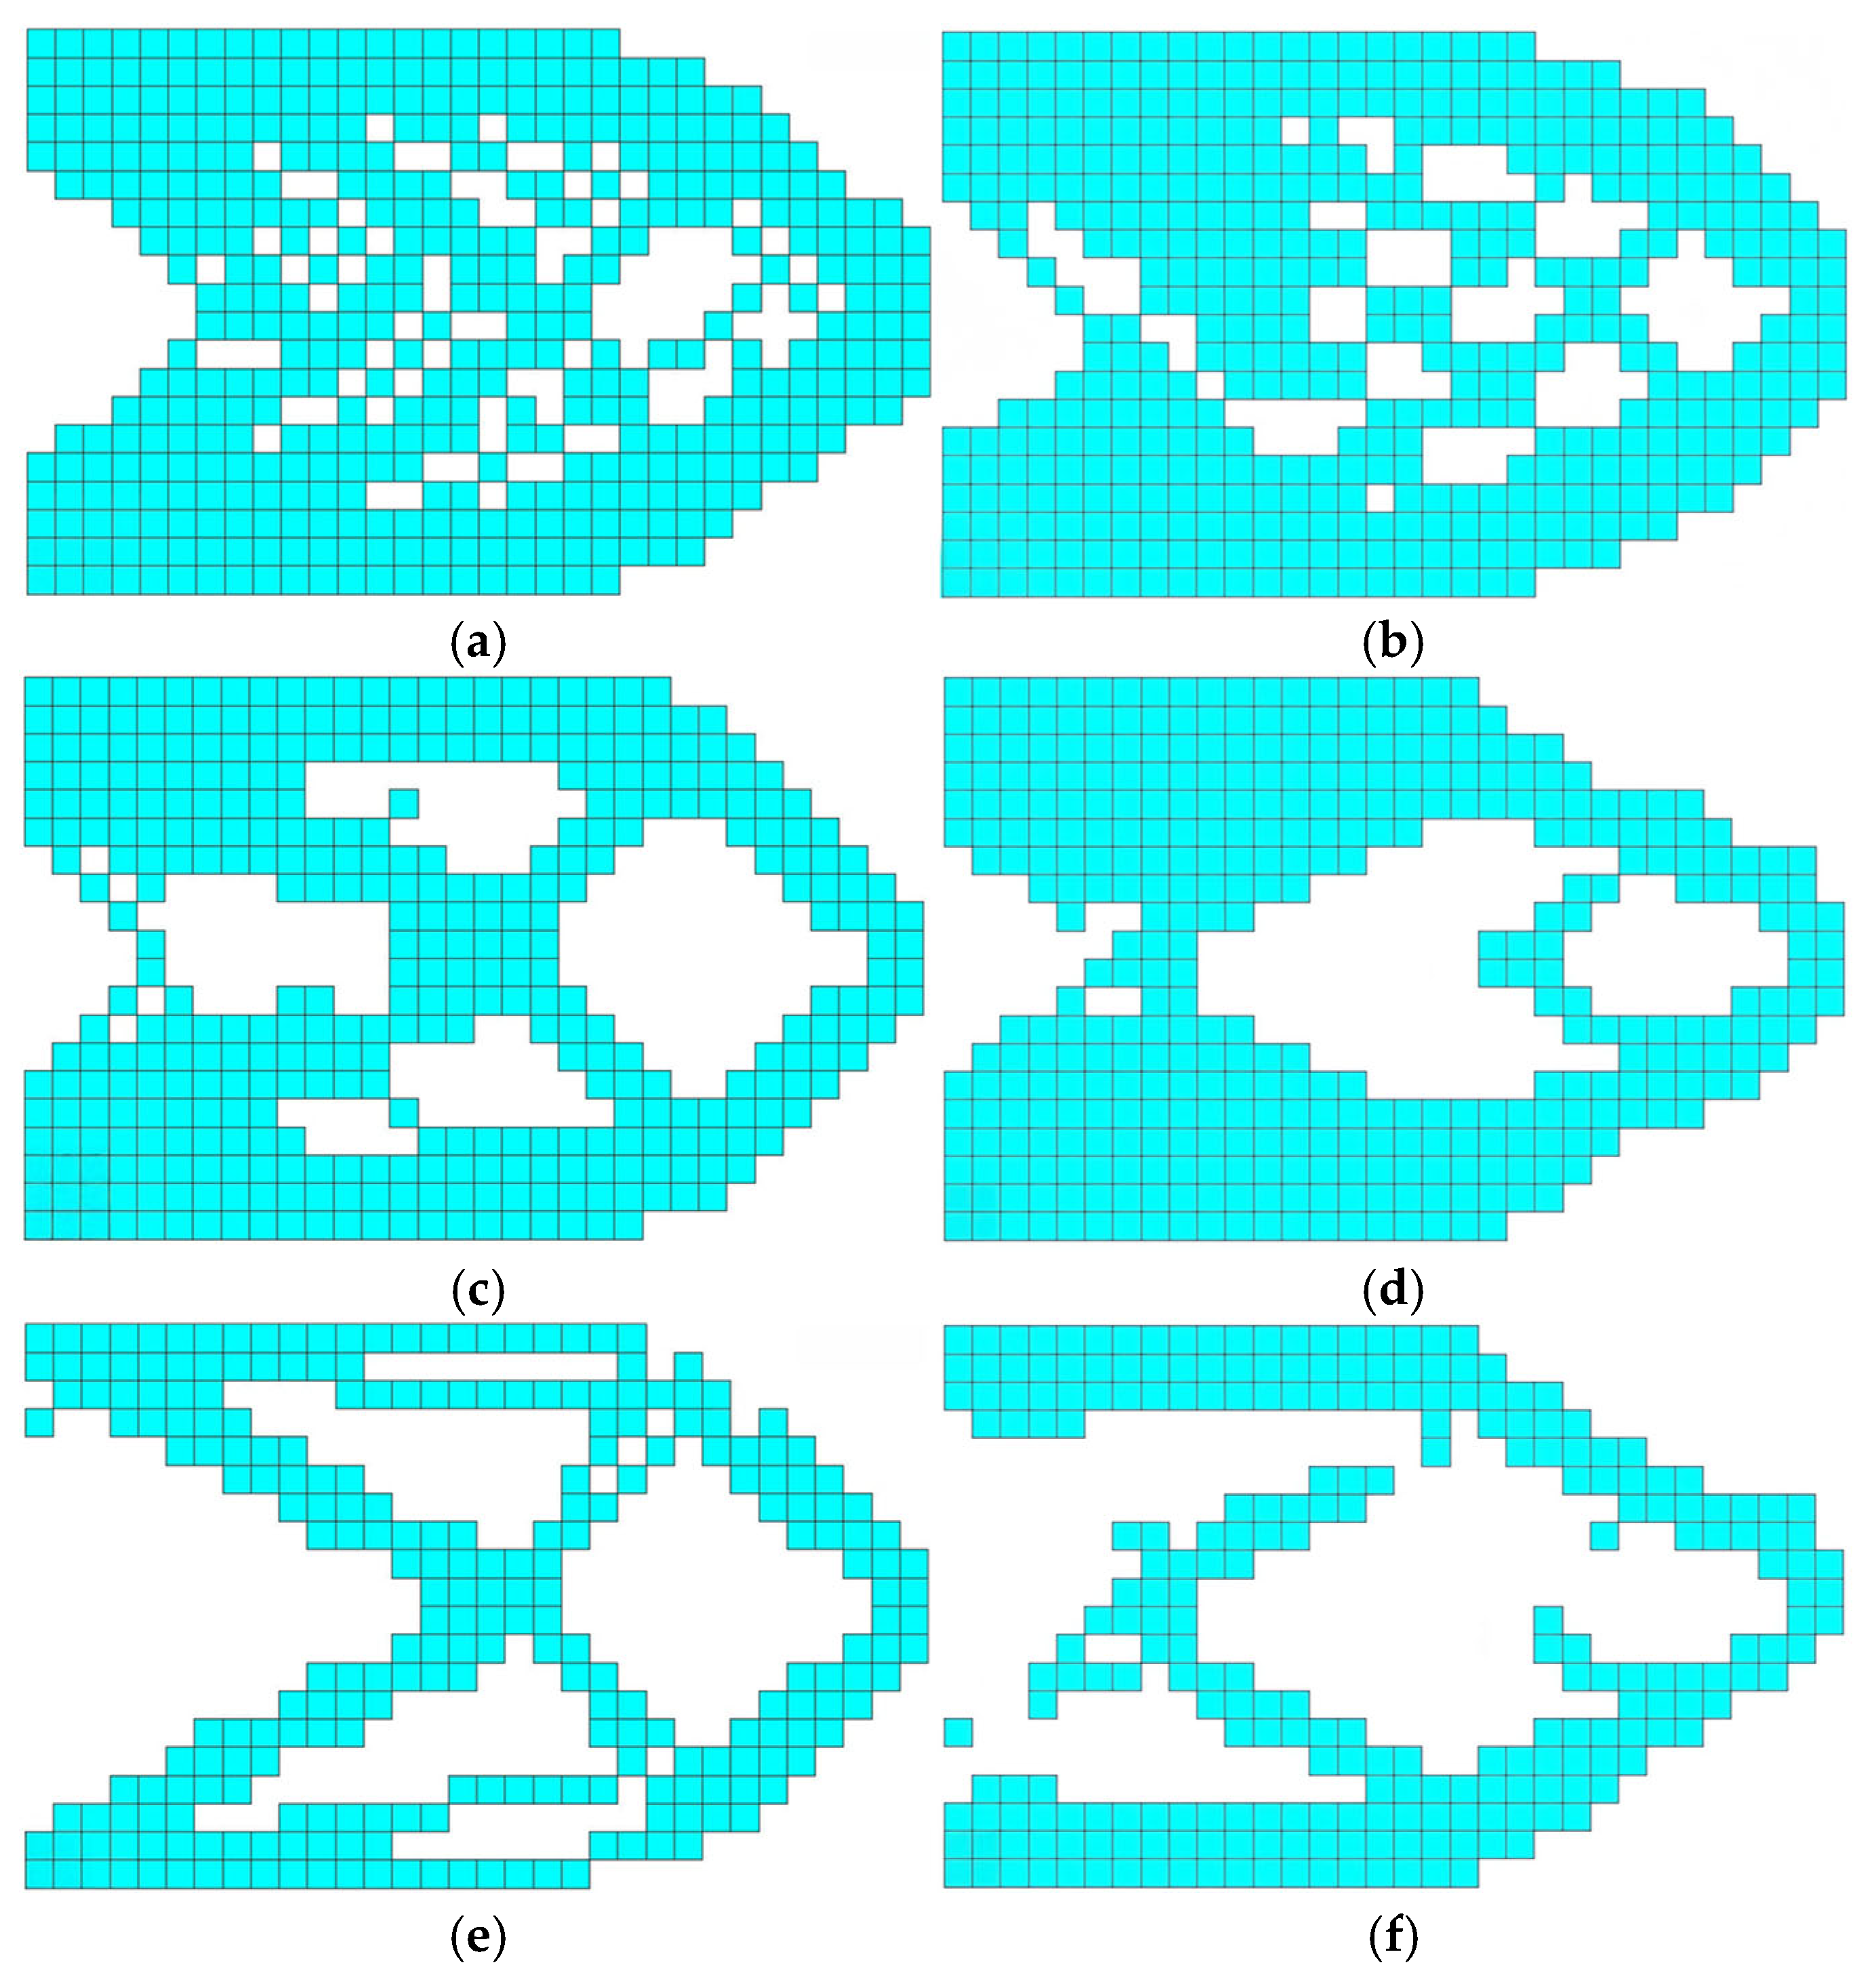
Since the removal rate is not predetermined and must be selected based on experience, a removal rate of 0.1 and a volume removal rate of 70% were chosen after experimentation. The results are shown in Figure 16. The ESO method, based on element load-bearing capacity, can alter the topological configuration of the structure, indicating that this optimization method is effective. However, the appearance of disconnected elements (Figure 16e), checkerboard patterns (Figure 16d), and the loss of symmetry (Figure 16f,g) during the optimization process, as well as the non-closed state of the final converged topological configuration, suggest that the volume removal rate is too high. This also highlights that the algorithm requires further refinement.
Table 6 records the time consumed for each iteration, indicating that the volume removal rate is positively correlated with optimization time. During the optimization process, it is essential to balance the volume removal rate and computational cost. Therefore, it is stipulated that the volume removal rate should not exceed 70%. As shown in Table 7, the element load-bearing capacity metric continuously increases and tends to converge during the optimization process, demonstrating the feasibility of the proposed method.
As shown in Figure 17, the results of checkerboard patterns, disconnected elements, and a loss of symmetry are directly related to the selected element removal rate, as the load-bearing capacity of each element follows a specific order. If the removal rate is too high, elements that play a connecting role in the structure but have relatively low load-bearing capacity may be removed. This may lead to structural discontinuities in the optimized topology, causing convergence issues during the optimization process. Conversely, if the removal rate is too low, unnecessary iterative steps may occur, increasing the likelihood of checkerboard patterns and resulting in suboptimal optimization outcomes.
As shown in Table 8, the more elements removed in each iteration, the shorter the time consumed. However, in subsequent iterations, the use of the element birth and death method may lead to a rapid increase in stiffness residuals, significantly raising the likelihood of checkerboard patterns. Therefore, the removal rate must be chosen appropriately to balance efficiency and optimization quality.
  • Example verification of checkerboard elimination based on higher-order sensitivity allocation.
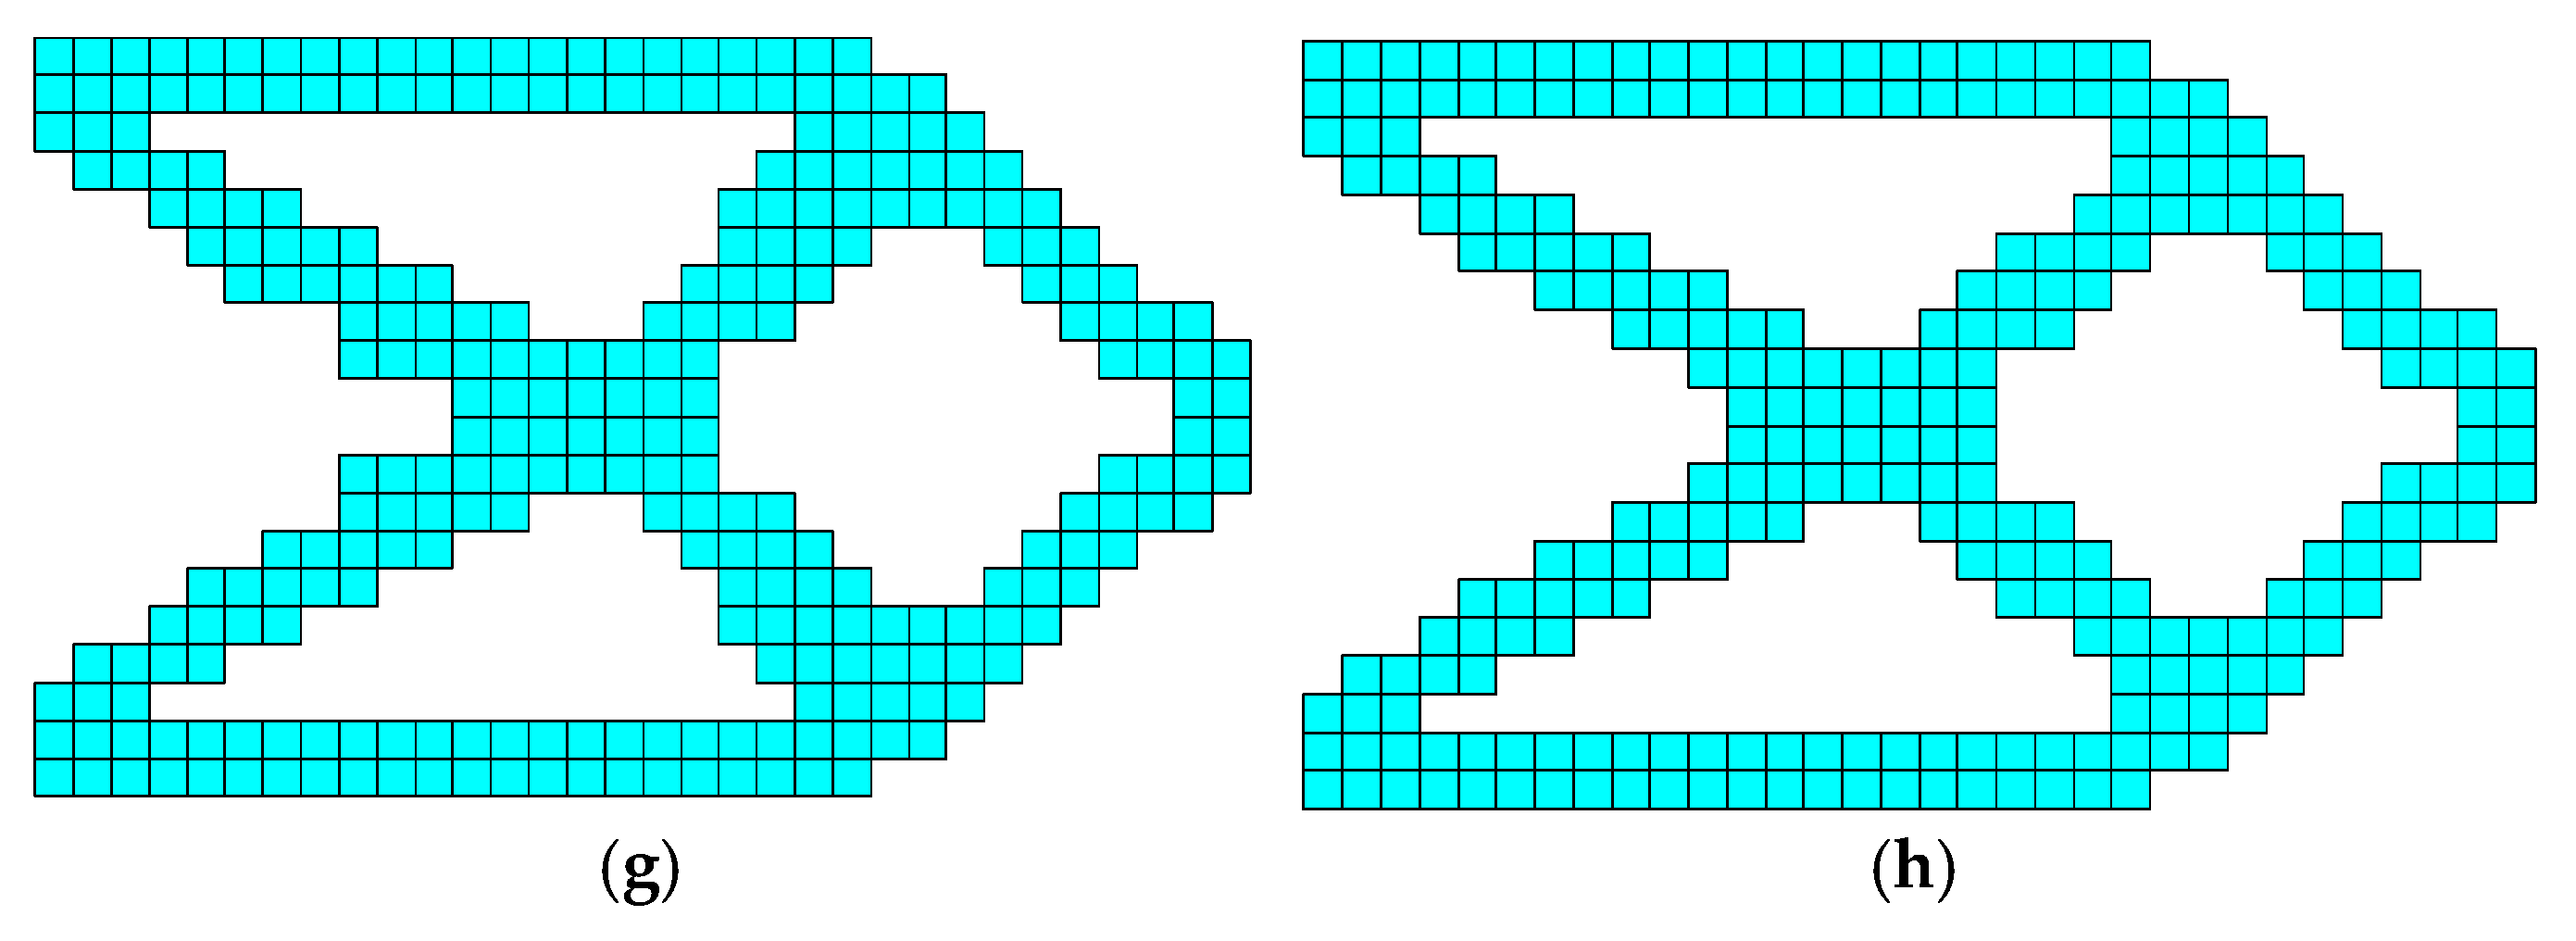
In this section, the cantilever thin plate is still used, with all other conditions remaining unchanged. The checkerboard elimination method proposed in this study is applied to optimize the initial element load-bearing capacity metric values. The results are shown in Figure 18.
Compared to the topology optimization results without the checkerboard elimination method, the intermediate iterations involving isolated elements and checkerboard patterns are significantly reduced. The final optimization results are notably superior to those without checkerboard elimination, and the results automatically tend to converge without the non-closed topological configurations observed in the unoptimized case. However, due to the additional step of checkerboard elimination, the number of iterations increases, and computational efficiency decreases slightly. Considering the high computational efficiency of modern computers, the additional time required for checkerboard elimination does not significantly impact the overall computational cost. Therefore, this method effectively addresses the checkerboard issues in the ESO method based on element load-bearing capacity.
2.
Example verification of grid dependency suppression based on mesh filtering.
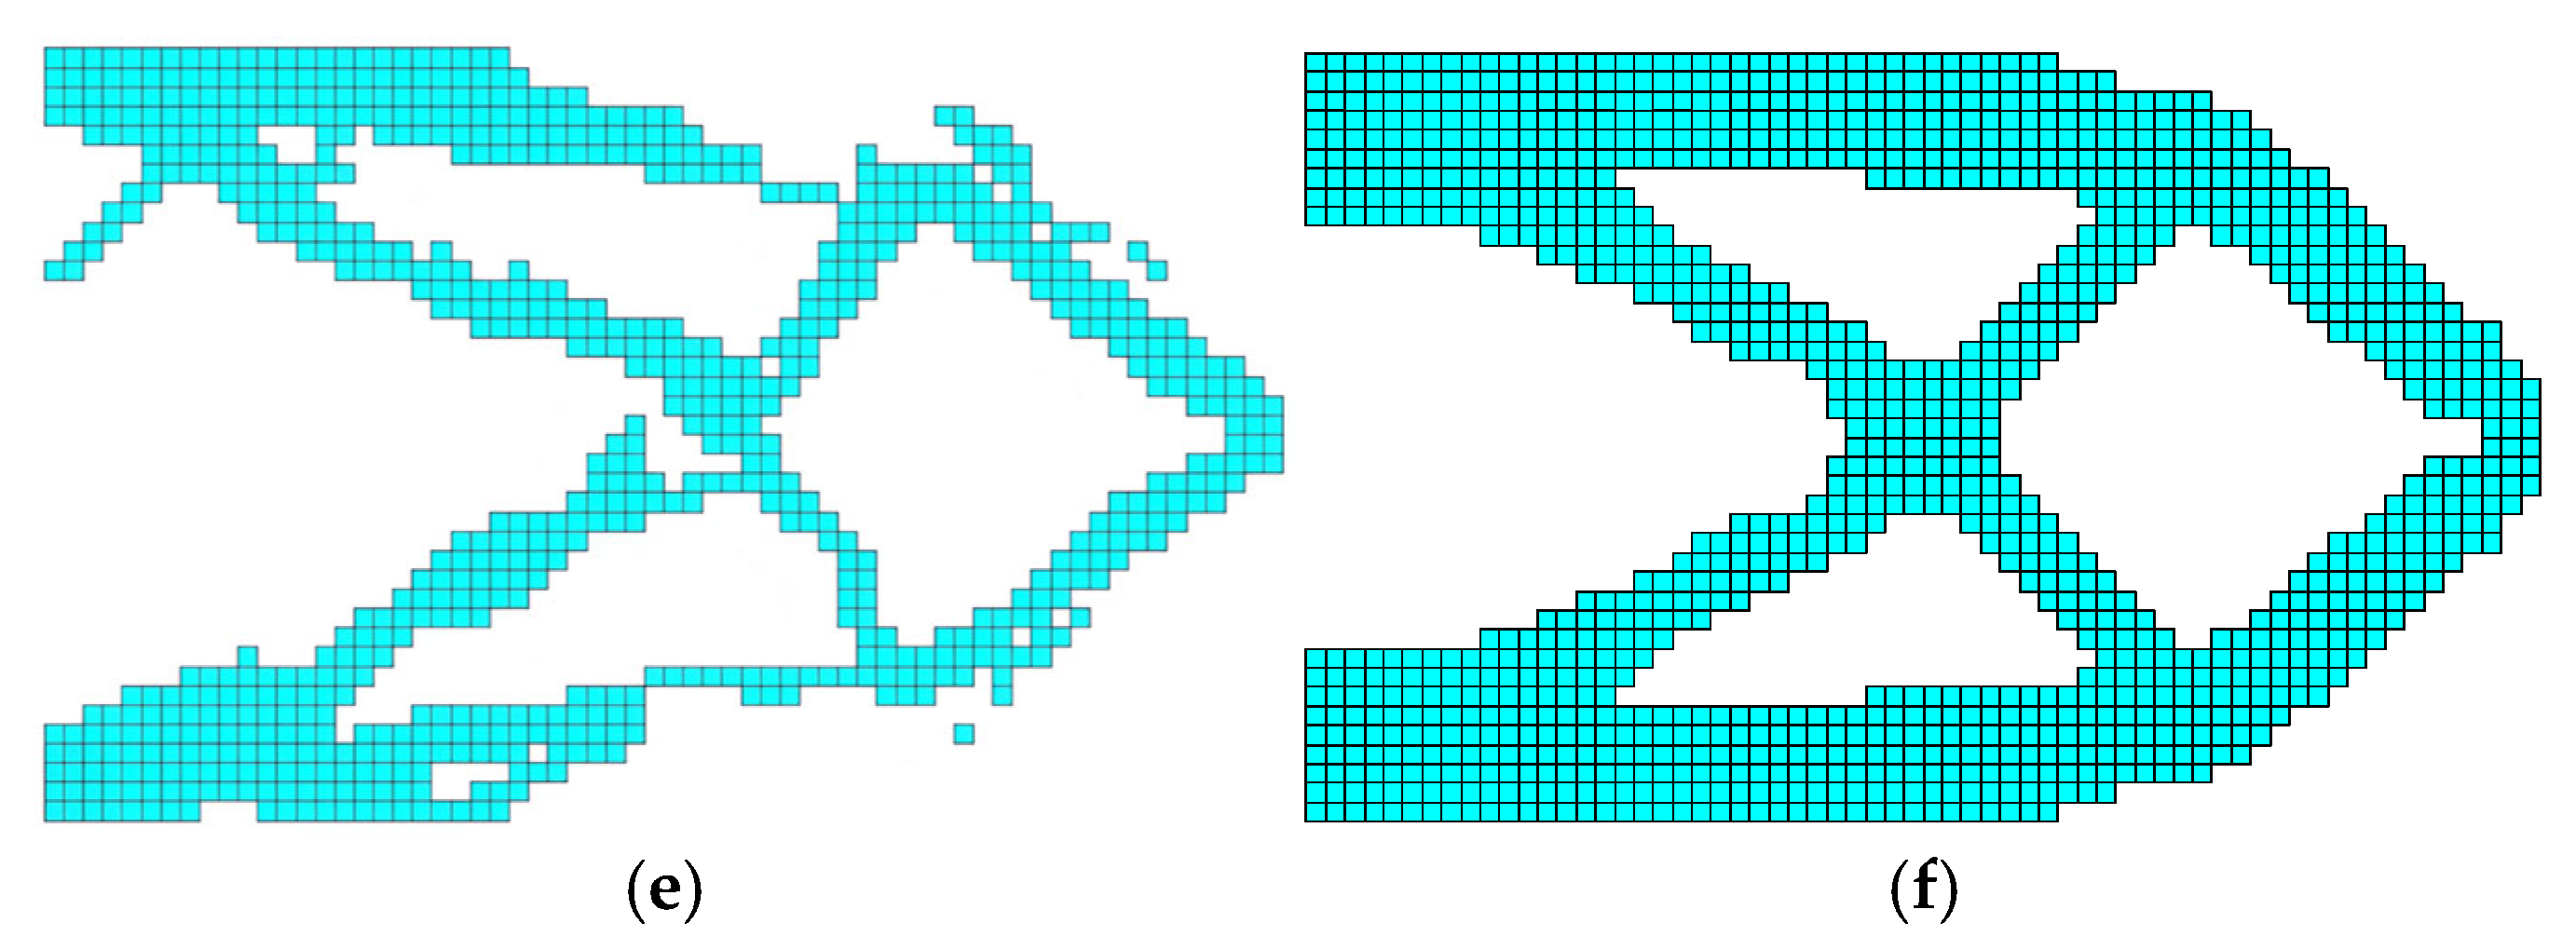
To validate the effectiveness of the mesh filtering method, this study divides the same model into three different mesh sizes: 160, 640, and 2560 elements. The results before and after optimization are shown in Figure 19.
Figure 19 shows the influence of whether to add grid filtering on the topology optimization results under different mesh settings. Figure 19a,c,e show the optimization results without using mesh filtering, where the sensitivity of each element varies significantly. During the iterative process, this difference may lead to the removal of those units with lower sensitivity, thereby forming finer branches. Additionally, when the mesh is coarsely divided, the resulting topological configurations tend to be rough. In contrast, Figure 19b,d,f show the effects after applying mesh filtering. The sensitivity distribution of each element becomes more uniform, thereby effectively reducing the finer branch structure in the topological optimization results. Moreover, the topological shape of the structure tends to stabilize with increasing iterations. Furthermore, when the mesh is divided into 160 elements, the use of the mesh filtering method causes the structural topology to automatically converge to the configuration shown in Figure 19b. This demonstrates that mesh filtering is closely related to the size of the finite element mesh divisions. Furthermore, mesh filtering can effectively reduce the unreasonable configuration of the structural topology optimization results.
(3)
Comparative analysis.
To demonstrate the superiority of the proposed methodology, a comparative study was conducted using the BESO topology optimization algorithm on the cantilever beam and MBB beam cases. Figure 20 illustrates the boundary conditions and load application schematic ( F = 10 N), with element sizes of 0.25 mm and 1 mm implemented for finite element analysis.
As shown in Figure 21a,c, the topological structures obtained by the proposed method and the BESO method have significant differences. As shown in Figure 21b,d, the topological structures obtained by the proposed method and the BESO method have differences, but they are not obvious. This is related to the structural size and boundary conditions. According to Table 9, the topological results obtained by the method in this paper have a certain improvement in stiffness compared with those obtained by the BESO method, but the calculation time is slightly longer than that of the BESO method.
In conclusion, while both methods achieve the goal of minimizing compliance, the proposed topology optimization method demonstrates a significant advantage over the BESO method. This advantage arises from the fact that the proposed method optimizes each element’s load-bearing capacity, ensuring a more uniform distribution of element strength. Consequently, the topology achieved through this approach exhibits a more rational element distribution, resulting in improved stress performance.

4.2. Lightweight Design of a Dump Truck Lifting Machine’s Triangular Arm

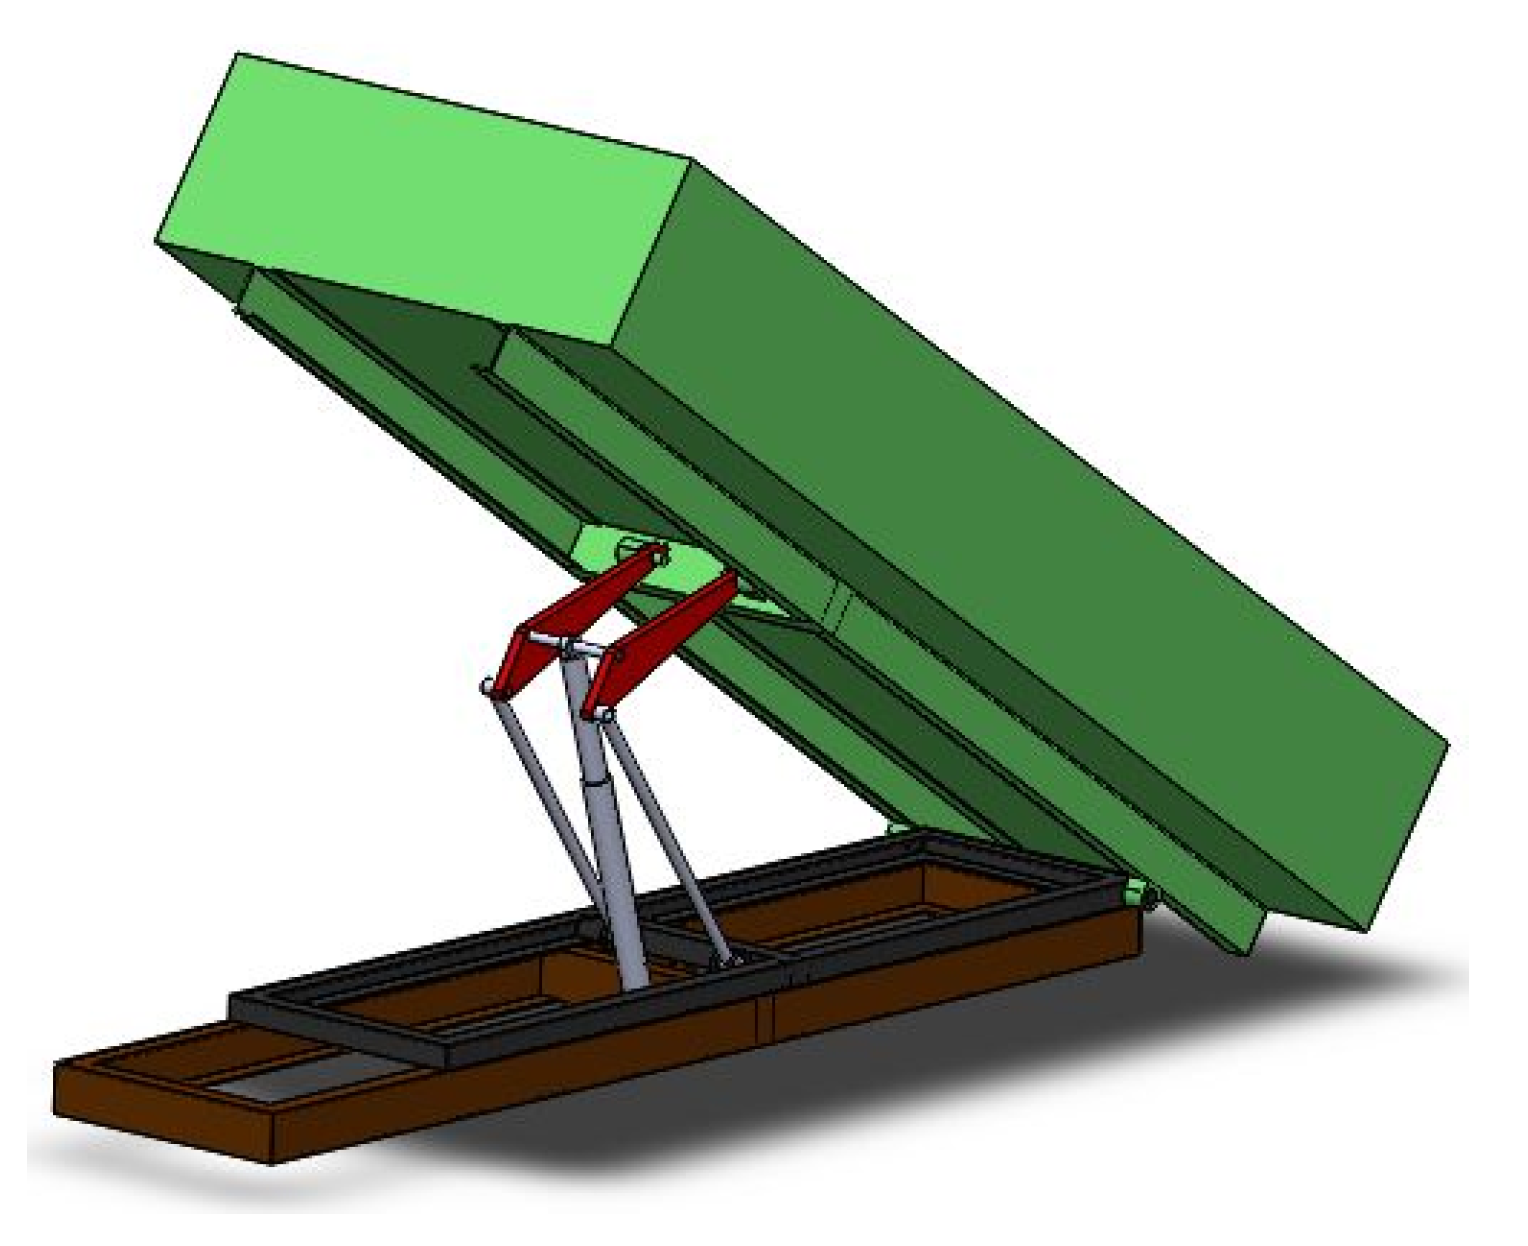
As engineering vehicles, dump trucks are widely used for transportation tasks in various environments. Their operation involves the engine driving the hydraulic mechanism, which, in turn, activates the lifting mechanism to achieve the tilting motion for unloading. The triangular arm ABC is a critical component of a dump truck’s lifting mechanism, connecting the cargo compartment to the vehicle chassis and playing a key role in converting the hydraulic cylinder’s thrust into the lifting force for the compartment, as shown in Figure 22. However, due to the conservatism of traditional design methods, the triangular arm of a dump truck’s lifting mechanism often suffers from excessive mass and material redundancy, necessitating lightweight improvements.

4.2.1. Finite Element Analysis of the Triangular Arm

  • Model Establishment
Taking the triangular arm of the EQ3093 dump truck’s lifting mechanism as an example, the engineering dimensions are shown in Figure 23a, with a thickness of 30 mm. Based on these dimensional parameters, the model is shown in Figure 23b. The triangular arm is made of low-carbon steel, grade Q235 (like ASTM A283 [37]), with detailed material parameters listed in Table 10.
2.
Analysis of working conditions and simulation constraints.
As shown in Figure 24, the dynamic simulation primarily aims to replicate the motion of the dump truck’s lifting mechanism and extract the force conditions of various components during critical periods and under extreme conditions. The finite element analysis, on the other hand, uses the data collected from the dynamic simulation as boundary conditions to perform structural optimization.
As shown in Figure 22, during the unloading process, the forces acting on the triangular arm continuously change as the unloading height varies, making it challenging to calculate the force state and motion of the triangular arm. However, the lifting mechanism undergoes planar motion throughout the unloading process, and the triangular arm maintains dynamic equilibrium under the push and pull forces from the hydraulic cylinder, cargo compartment, and pull rods. Therefore, when conducting strength checks on the triangular arm, it can be treated as being in force equilibrium, allowing the dynamic analysis of the triangular arm to be simplified to the analysis of typical working conditions. For strength verification and topology optimization analysis of the triangular arm, only these typical working conditions need to be considered.
Reference [38] provides the entire motion process of the lifting mechanism. In finite element analysis, it is not necessary to perform topology optimization analysis for the entire working period. Instead, critical moments of the dump truck’s lifting mechanism are selected: the start, the lifting process, the unloading process, and the retraction process. The force data for each moment is listed in Table 11. It should be noted that the data provided in the table are derived from the dynamic equilibrium process, where the sum of the forces acting on the three components is zero.
During the finite element analysis, it is necessary to apply constraints to one of the nodes to proceed with structural optimization. As shown in Figure 25, the constraint conditions are based on the reference literature. The circular hole centered at point B is fully constrained, while the circular holes centered at points A and C are subjected to the loads corresponding to those listed in Table 10. The specific directions of these loads are provided in the table.
As shown in Figure 26, this illustrates the specific implementation of the loads and constraints on the triangular arm in ANSYS APDL 2024 R1.
3.
Element selection.
Based on the dimensional parameters of the triangular arm, it is evident that the thickness of the triangular arm is significantly smaller than its other primary dimensions. As shown in Figure 27, the three-dimensional solid element SOLID185 and the planar element PLANE42 are selected. Finite element analysis is performed using these two different types of elements, and the results are shown in Figure 28 and Figure 29.
The results indicate that under the same loading conditions and material selection, the stress and displacement distributions obtained using the two types of elements for finite element mesh division are approximately the same. The maximum stress and maximum displacement obtained using the three-dimensional solid element mesh division are 144.802 MPa and 2.13423 mm, respectively. In contrast, the maximum stress and maximum displacement obtained using the two-dimensional planar element mesh division are 156.839 MPa and 2.16886 mm, respectively. The differences in stress and displacement between the two methods are 8.13% and 1.59%, respectively. This level of error does not significantly impact the topology optimization results. Considering computational efficiency and convenience, this study opts for the planar element, which incurs lower computational costs. Further details on this choice will not be repeated in the subsequent discussion.
4.
Finite element stress analysis of various working conditions.
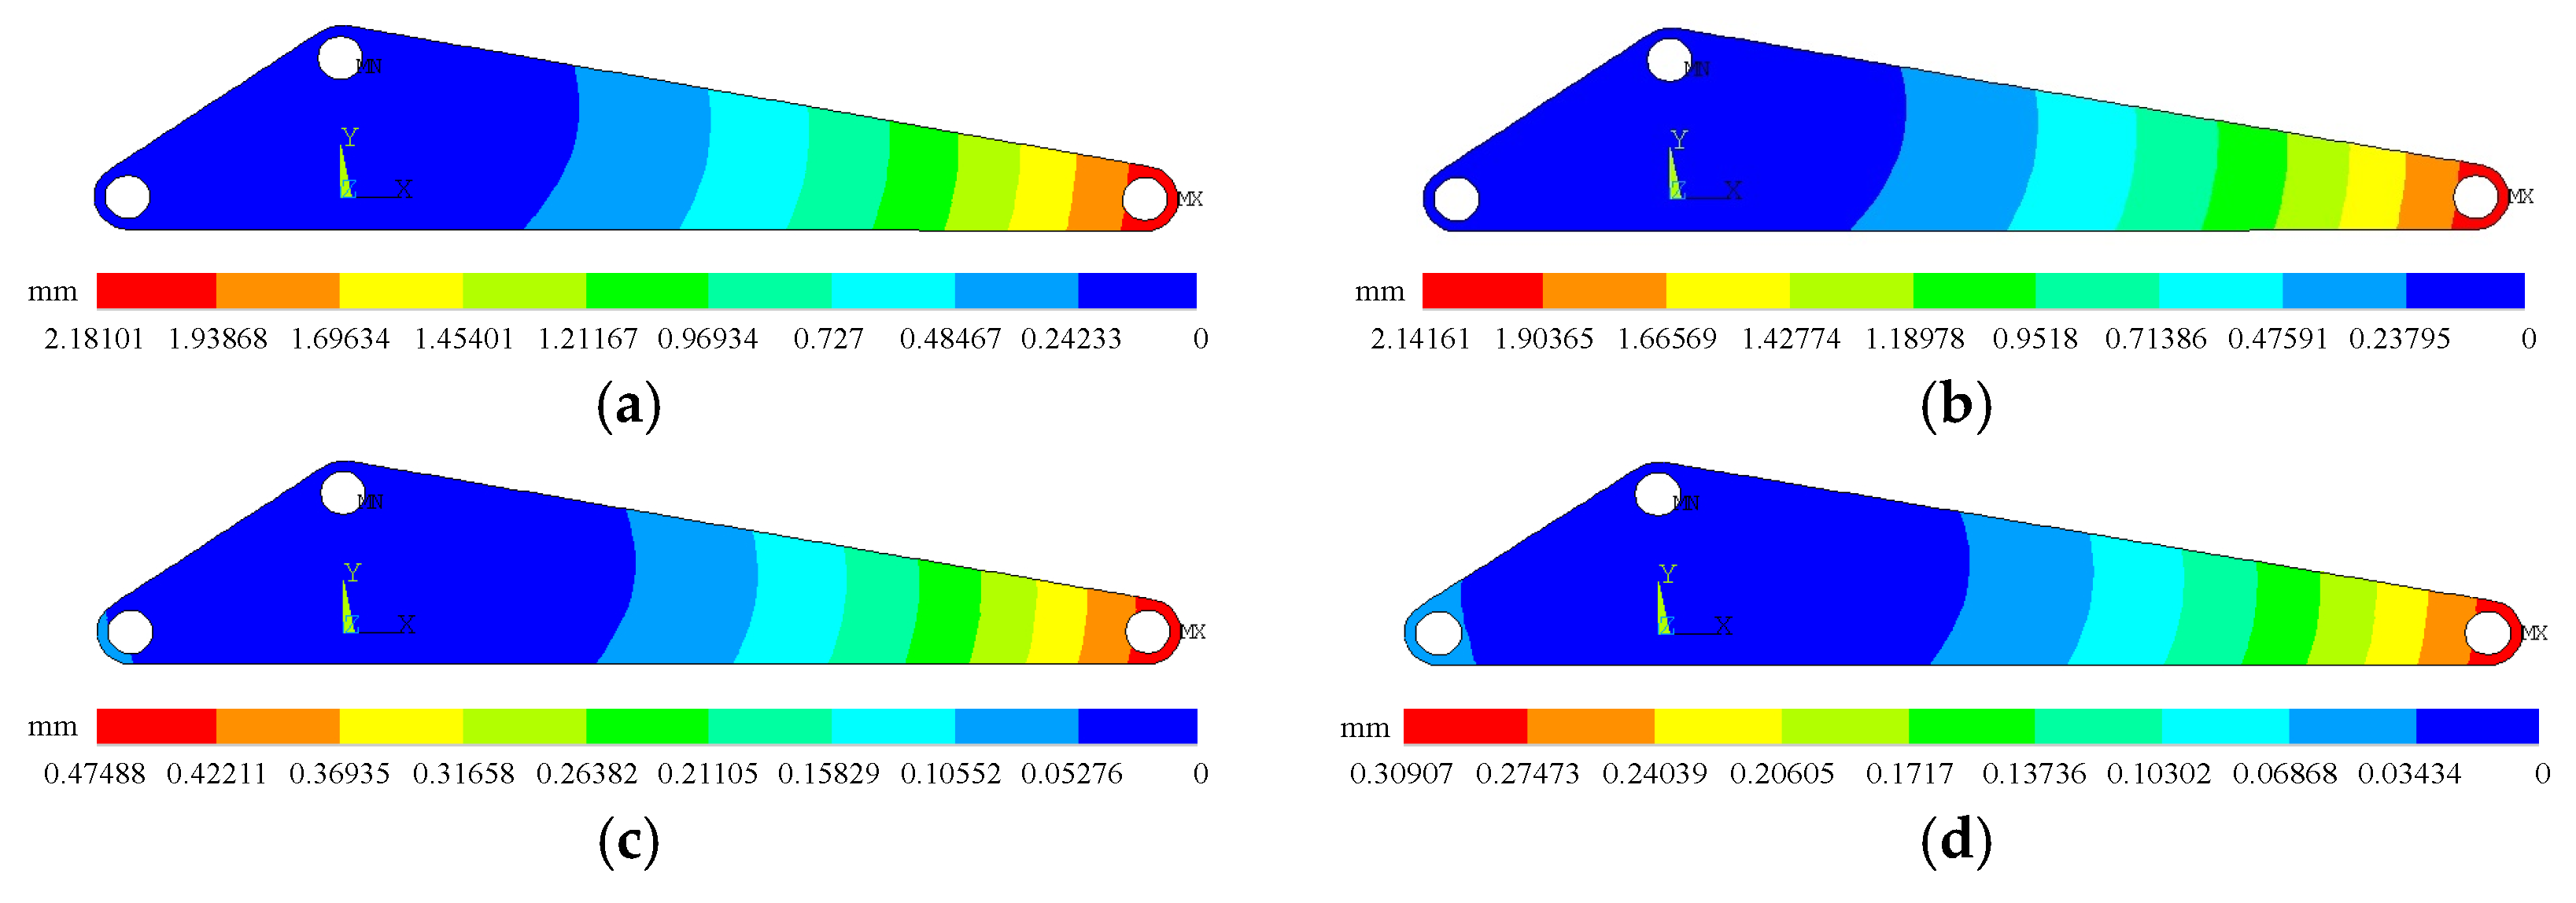
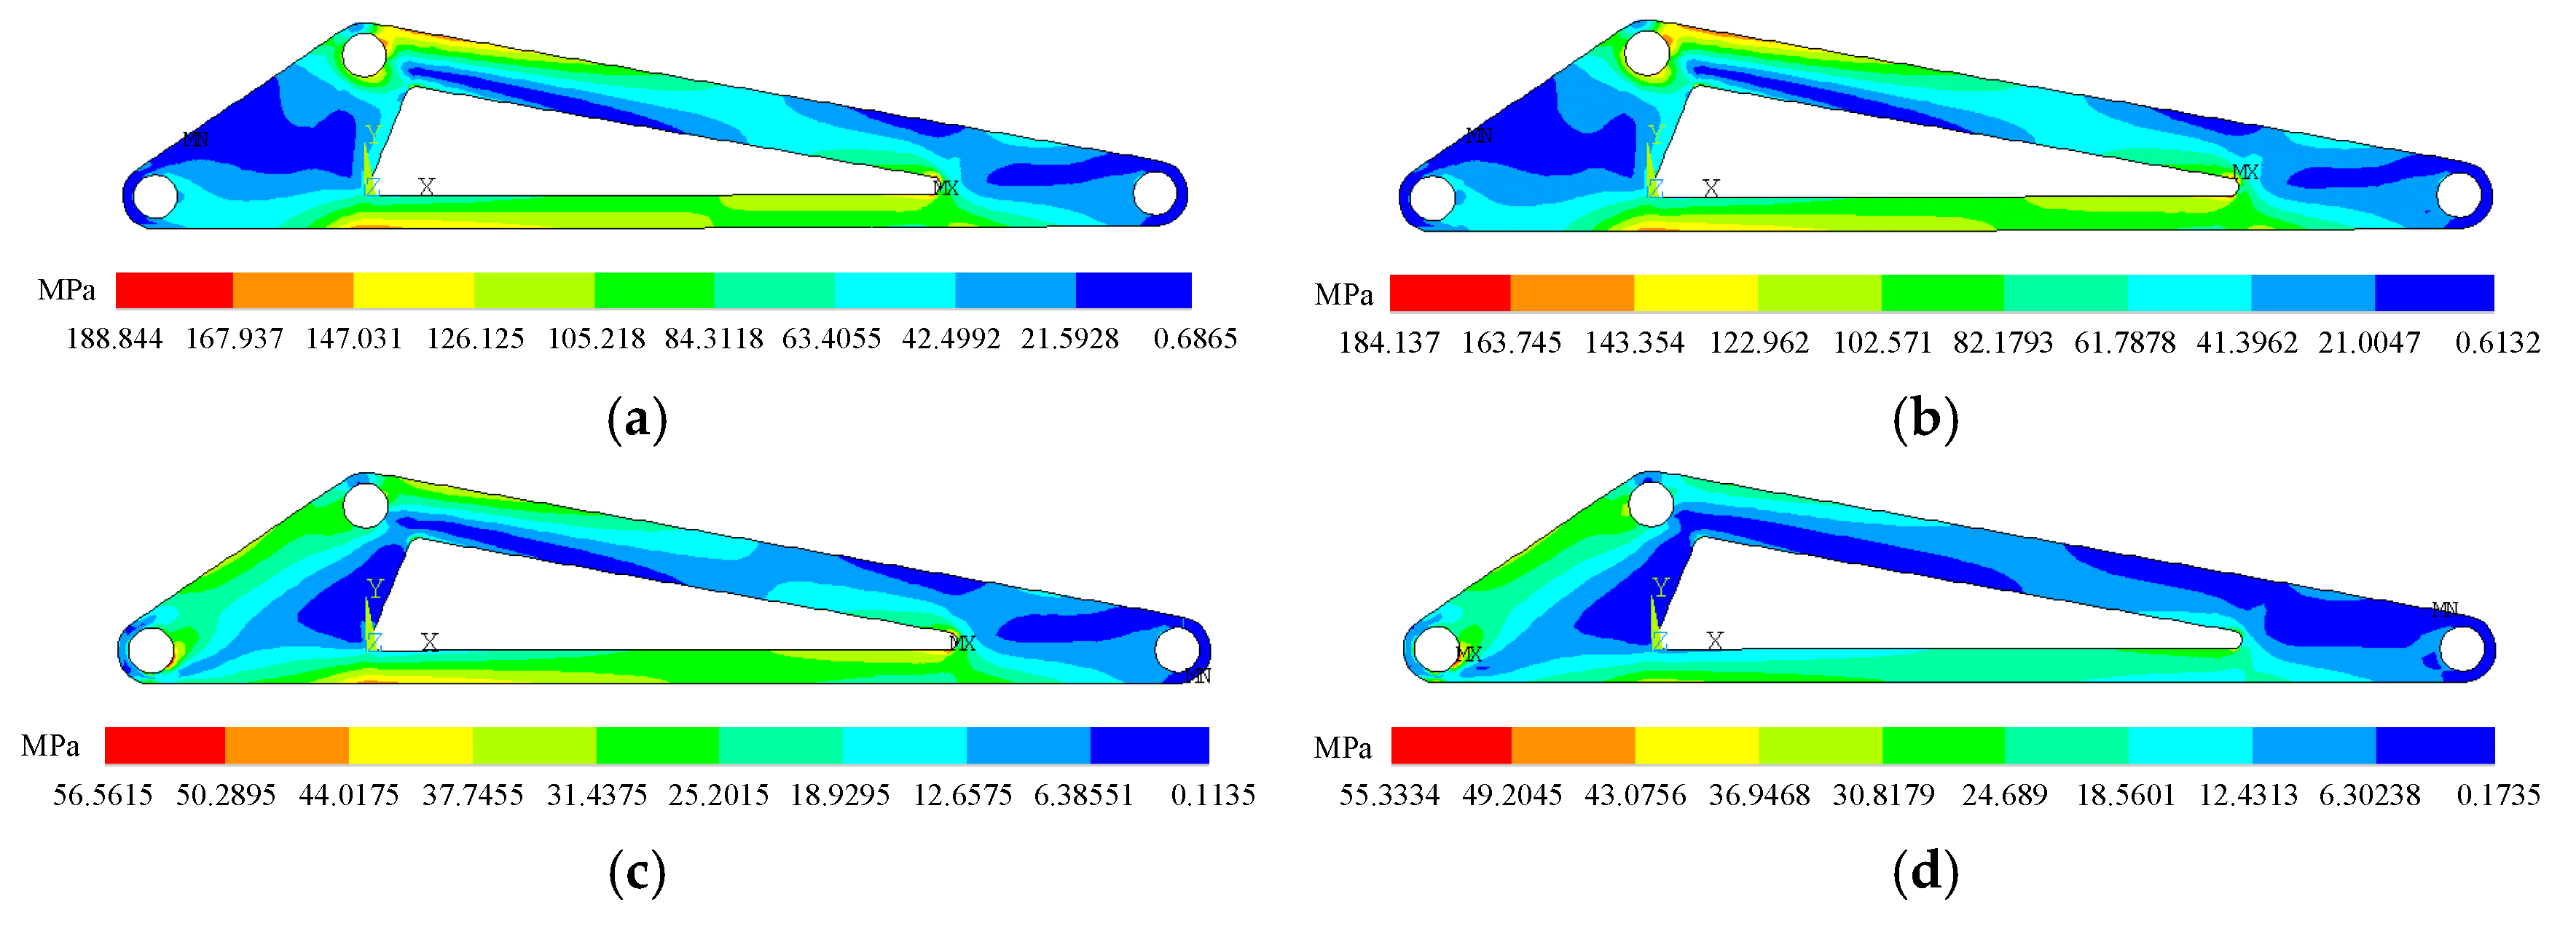
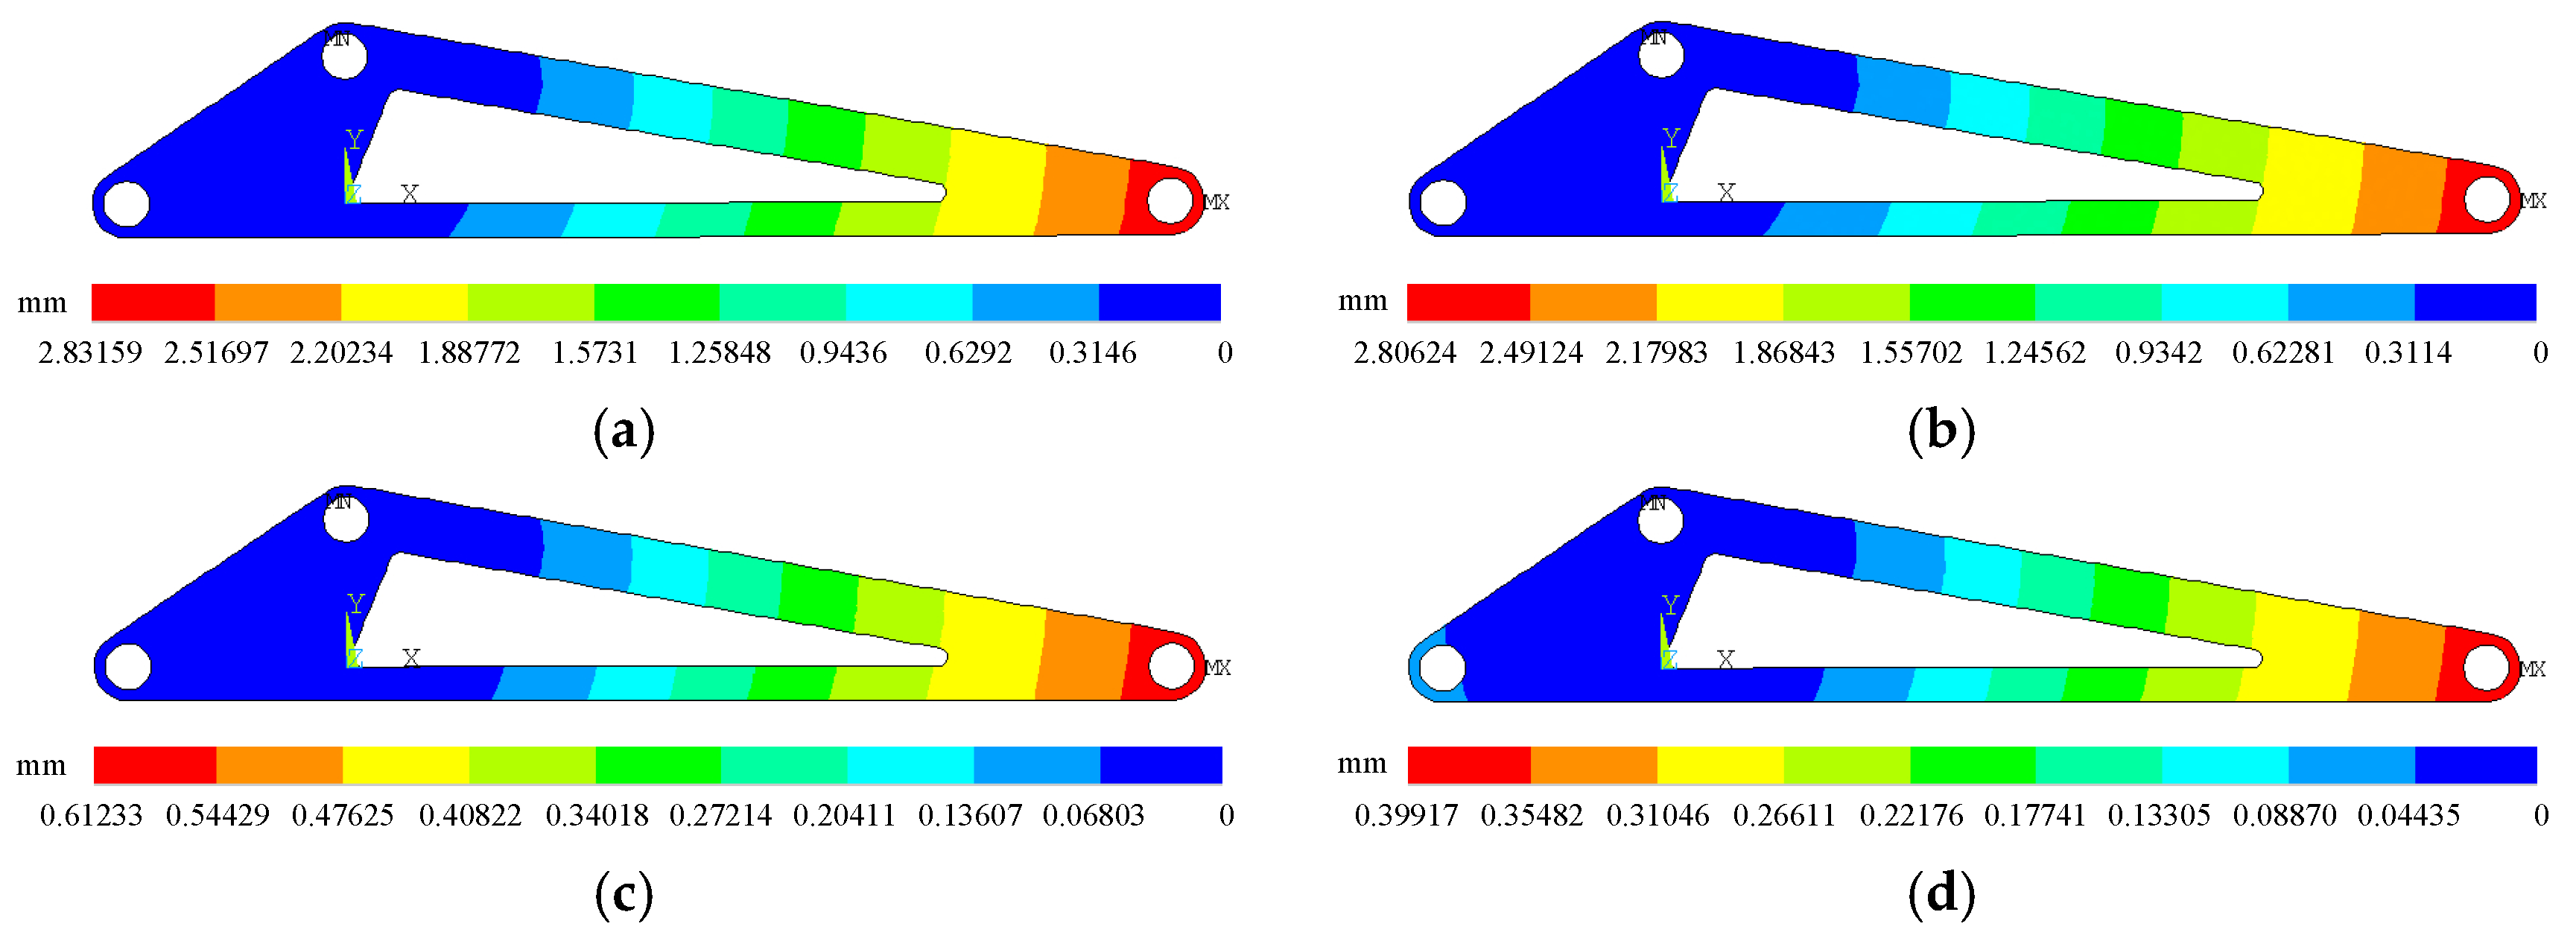
The displacement diagrams and stress contour plots under different working conditions are obtained in ANSYS, as shown in Figure 30 and Figure 31.
As shown in Figure 30 and Figure 31, the maximum stress and maximum displacement values at each moment are primarily concentrated at the nodes of the triangular arm. Since this study focuses on the comparison between element load-bearing capacity and stress in topology optimization, the evaluation is mainly based on the stress under various working conditions, as summarized in Table 12.
The results indicate that under the conditions of fully constraining point B (the interaction point between the hydraulic cylinder and the triangular arm) and applying distributed loads on the cylindrical surfaces of points A and C, the displacement distribution of the triangular arm is consistent across the four working conditions, while the stress distribution varies significantly. However, the stress distribution under different working conditions exhibits large areas of low stress. According to the principles of the ESO method, large low-stress areas indicate that the stress distribution of the triangular arm is not reasonable, and that the material distribution is not optimal. Therefore, a lightweight design for the triangular arm is necessary.

4.2.2. Topology Optimization of Triangle Arm

Based on the displacement and stress distribution diagrams obtained from the static analysis in ANSYS under typical working conditions, topology optimization is performed on the triangular arm. Additionally, it should be noted that the ESO method based on element load-bearing capacity does not include specific post-processing techniques. Therefore, after topology optimization, the shape and dimensions of the triangular arm must be redesigned according to actual manufacturing requirements. Only then can a triangular arm that meets the stiffness, strength, and process requirements be designed.
  • Topology optimization of the triangular arm structure based on the topology optimization method of element bearing capacity.
Topology optimization aims to identify the optimal load-bearing skeleton. The topology optimization of the triangular arm can be divided into three steps: defining design variables, specifying the design region, and performing optimization. The relevant optimization steps for the ESO method based on element load-bearing capacity are provided in Section 3, and the optimization function model is expressed as shown in Equation (42).
find β = β 1 , , β e max T F C s . t . V = i = 1 N β i V i V β i = 0 , 1 σ e max σ e = 1 , 2 , 3 , , N
where T F C represents the structural load transfer index; σ e max represents the maximum stress of each element in the triangular arm, which should be less than the allowable stress σ = 235 MPa; β i represents the existence state of element i ; N represents the total number of elements; V i is the volume of element i ; and V represents the topology optimization element removal rate, set at 60% in this study.
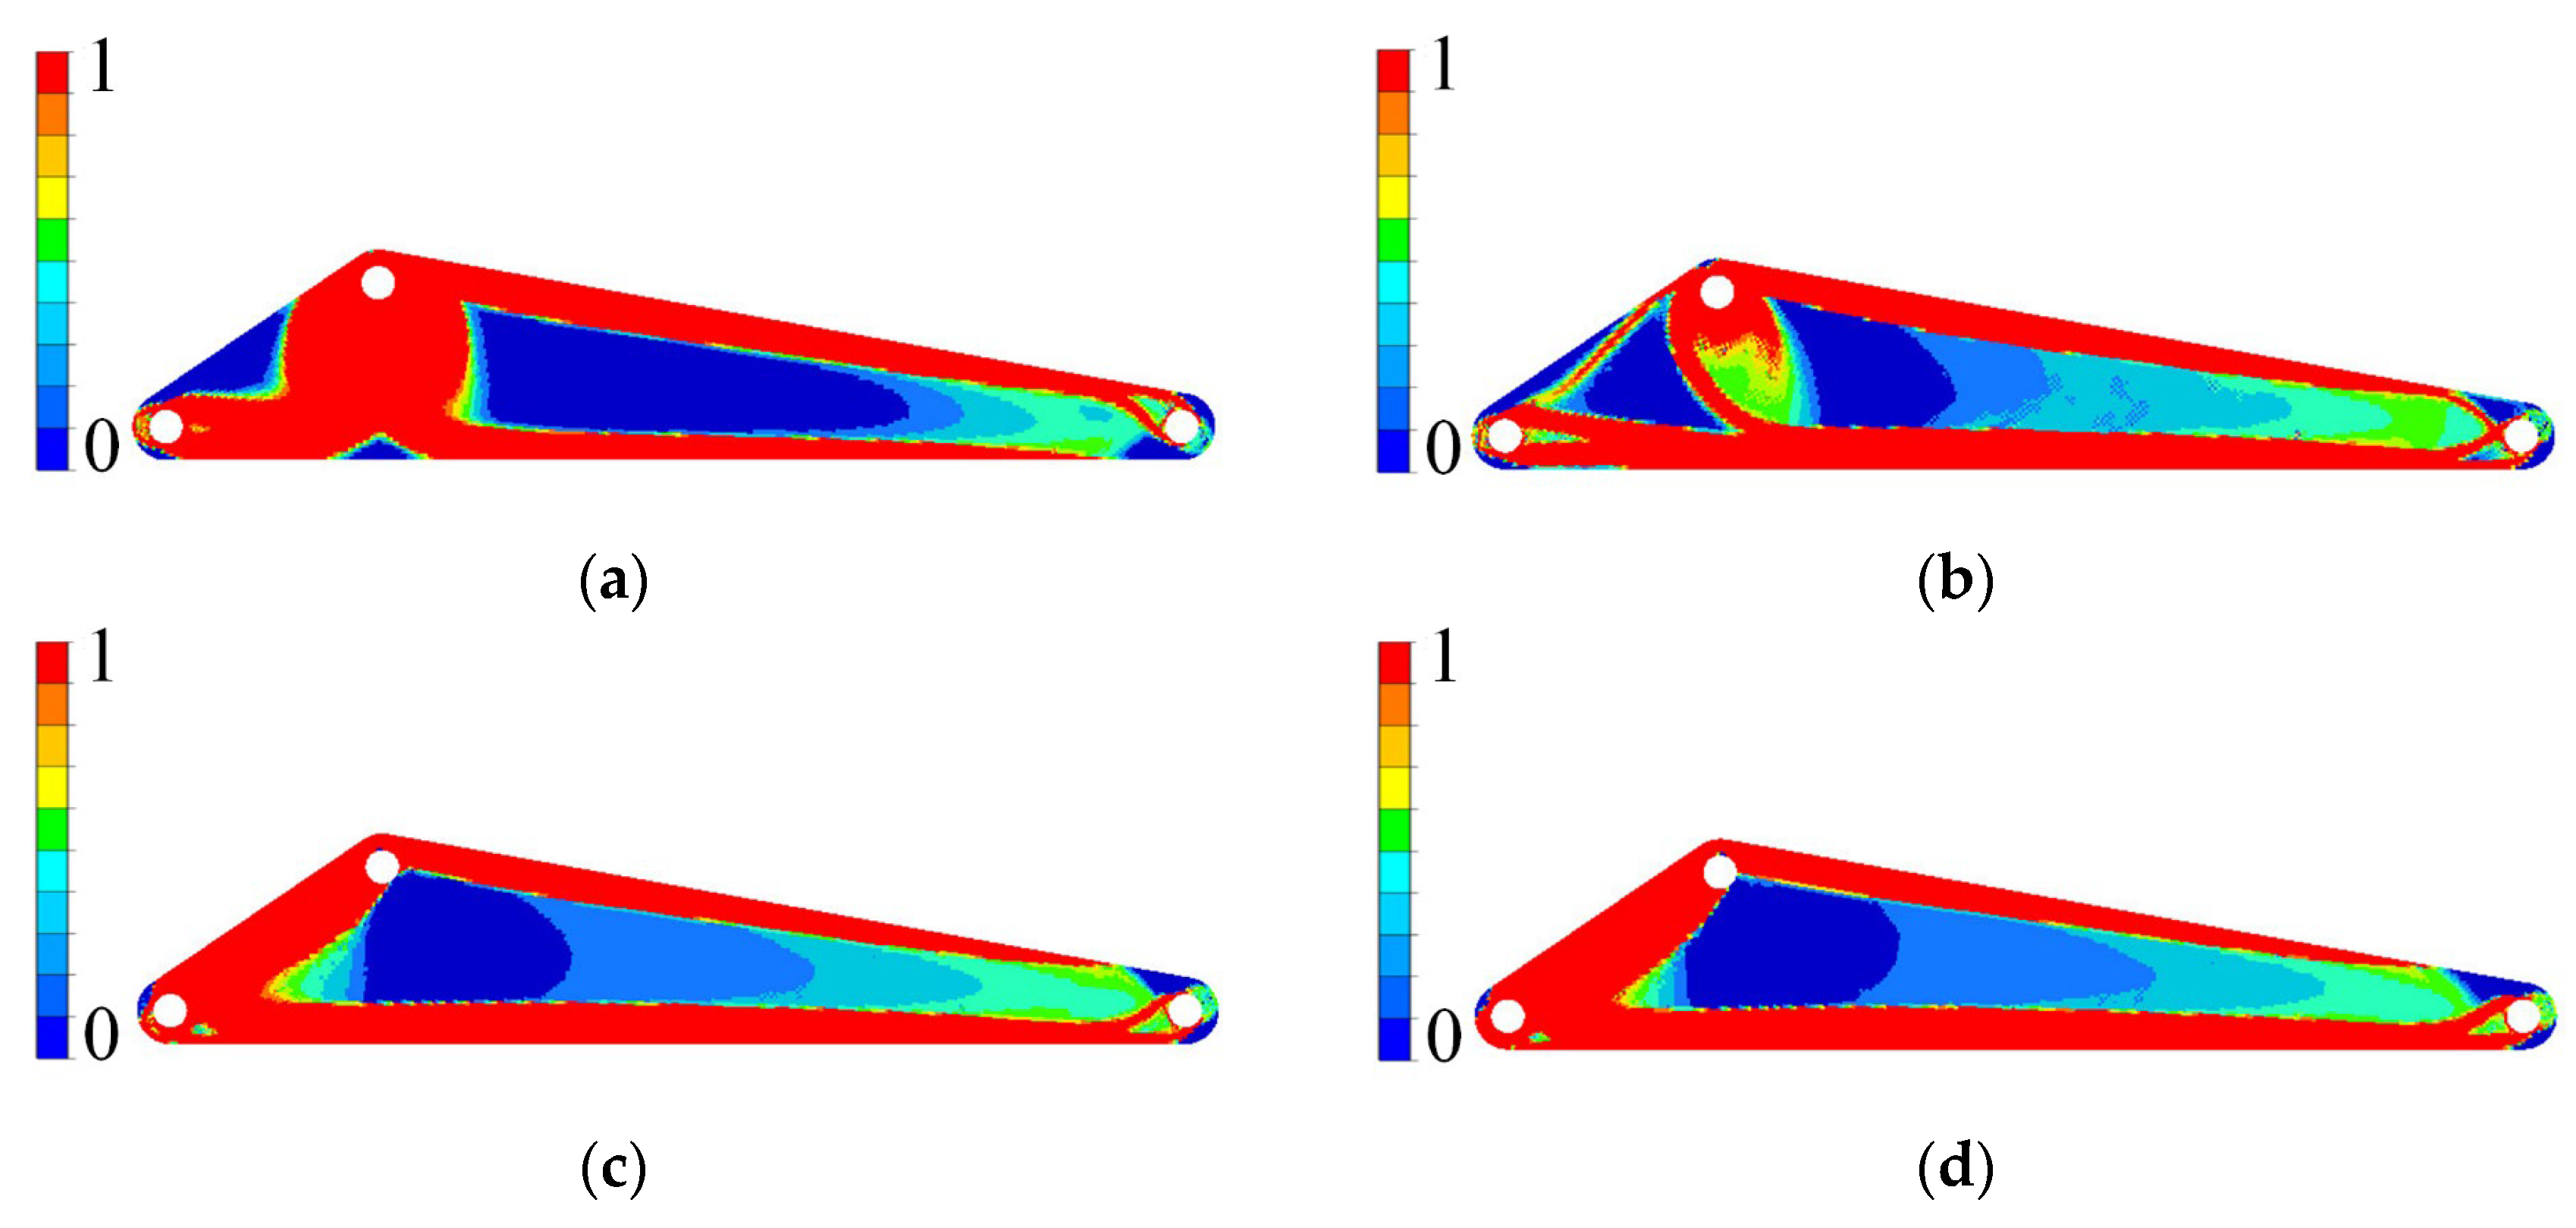
The program continuously removes inefficient elements from the triangular arm and recalculates the load-bearing capacity of the elements in the updated topology after each removal. Additionally, the maximum stress of each element is computed. If the maximum stress of any element exceeds 235 MPa during the optimization iterations, the program terminates prematurely. Otherwise, the program continues until the material removal rate is satisfied or the convergence criterion (no change in element load-bearing capacity) is met. Figure 32 shows the topological results of the triangular arm based on the element load-bearing capacity under four working conditions.
2.
Topology optimization of the triangular arm structure based on the variable density topology optimization method.
As shown in Figure 32, the topological configurations under the four working conditions are different, but their topological regions overlap. This overlapping region represents the area where material can be removed. To compare the results of the ESO method based on element load-bearing capacity with those obtained from other topology optimization methods, the triangular arm is also optimized using the topology optimization method (typically the variable density method) in HyperWorks. Figure 33 shows the triangular arm density color maps under four working conditions.
By comparing Figure 32 and Figure 33, it is evident that the results of the ESO method based on element load-bearing capacity are consistent with those obtained from the topology optimization in the Hyperworks 2022 commercial software. This consistency validates the effectiveness of the proposed method.
3.
Performance verification of the optimized triangular arm structure.
Based on the topology optimization results presented above, further shape and size design of the triangular arm is necessary to meet actual production requirements. As shown in Figure 34, a redesigned three-dimensional model of the triangular arm is provided, where the material in low-efficiency regions is entirely removed to ensure optimal utilization of the remaining material. Finite element analysis is then performed on the redesigned triangular arm, with the stress distribution shown in Figure 35.
Using three-dimensional Solidworks 2020 software, the mass of the triangular arm model before and after optimization is calculated. The mass of the optimized triangular arm is reduced by nearly 50% compared to the original design. Comparing the stress contour plots before and after optimization, it is evident that the regions with lower stress (blue areas) are significantly reduced in the optimized design, indicating improved material utilization. The relevant data are summarized in Table 13.
As shown in Figure 36, after updating the design of the triangular arm, the displacements have changed. As indicated in Table 14, comparing the displacement contour plots before and after optimization reveals that the displacements of the triangular arm have changed, but the changes are relatively minor.
As shown in Table 13 and Table 14, the stress on the optimized triangular arm increased by 31 MPa compared to the original design. The displacement of the optimized triangular arm also increased by 0.6 mm, which is acceptable relative to the overall dimensions and total deformation. Furthermore, as shown in Figure 31, the stress distribution in the optimized triangular arm is more uniform compared to the original design, and the low-stress regions are significantly reduced. This demonstrates that the ESO method based on element load-bearing capacity has successfully achieved lightweight design for the triangular arm and validates the effectiveness of the topology optimization method based on element load-bearing capacity.

5. Conclusions

The specific contributions of this work are as follows:
  • The calculation equation for element bearing capacity was derived, and its effectiveness in evaluating structural performance was demonstrated.
  • A progressive structural topology optimization method based on element bearing capacity was proposed. Case studies have shown that this method yields a different topological configuration from the results obtained by the BESO method. The optimized structural stiffness is higher than that of the BESO method, but the computational efficiency is slightly higher than that of the BESO method.
  • A platform for implementing the progressive structural topology optimization algorithm based on element bearing capacity was developed, validating its practical feasibility.

Author Contributions

J.H.: Writing—original draft, Methodology. Z.J.: Methodology, Writing—review and editing. X.H.: Validation, Conceptualization. H.L.: Validation, Visualization. Z.L.: Formal analysis, Validation. Y.S.: Funding acquisition, Visualization. F.W.: Funding acquisition, Resources. All authors have read and agreed to the published version of the manuscript.

Funding

This study is funded by the National nature science foundation of China (92266203), Science and technology plan project of Inner Mongolia Autonomous Region (2025YFDZ0045), Key projects of Shijiazhuang basic research program (241791077A), Central guide local science and technology development fund project of Hebei province (246Z1022G), and Yantai science and technology planning project (2023ZDCX012).

Data Availability Statement

The original contributions presented in the study are included in the article, further inquiries can be directed to the corresponding author.

Conflicts of Interest

On behalf of all authors, the corresponding author states that there is no conflict of interest. Author Xiaolu Huang was employed by the company China Telecom Co., Ltd. The remaining authors declare that the research was conducted in the absence of any commercial or financial relationships that could be construed as a potential conflict of interest.

References

  1. Bendsøe, M.P.; Kikuchi, N. Generating Optimal Topologies in Structural Design Using a Homogenization Method. Comput. Methods Appl. Mech. Eng. 1988, 71, 197–224. [Google Scholar] [CrossRef]
  2. Wang, W.; Hou, Y.; Su, R.; Wang, W.; Wang, C.C.L. Simultaneous Topology Optimization of Differentiable and Non-Differentiable Objectives via Morphology Learning: Stiffness and Cell Growth on Scaffold. Adv. Intell. Discov. 2025, 1, 2400015. [Google Scholar] [CrossRef]
  3. Bendsøe, M.P. Optimal Shape Design as a Material Distribution Problem. Struct. Optim. 1989, 1, 193–202. [Google Scholar] [CrossRef]
  4. Zhou, M.; Rozvany, G.I.N. The COC Algorithm, Part II: Topological, Geometrical and Generalized Shape Optimization. Comput. Methods Appl. Mech. Eng. 1991, 89, 309–336. [Google Scholar] [CrossRef]
  5. Xie, Y.M.; Steven, G.P. A Simple Evolutionary Procedure for Structural Optimization. Comput. Struct. 1993, 49, 885–896. [Google Scholar] [CrossRef]
  6. Xie, Y.M.; Steven, G.P. Evolutionary Structural Optimization for Dynamic Problems. Comput. Struct. 1996, 58, 1067–1073. [Google Scholar] [CrossRef]
  7. Wang, M.Y.; Wang, X.; Guo, D. A Level Set Method for Structural Topology Optimization. Comput. Methods Appl. Mech. Eng. 2003, 192, 227–246. [Google Scholar] [CrossRef]
  8. Guo, X.; Zhang, W.; Zhong, W. Doing Topology Optimization Explicitly and Geometrically—A New Moving Morphable Components Based Framework. J. Appl. Mech. 2014, 81, 081009. [Google Scholar] [CrossRef]
  9. Huang, X. Smooth Topological Design of Structures Using the Floating Projection. Eng. Struct. 2020, 208, 110330. [Google Scholar] [CrossRef]
  10. Huang, X.; Li, W. Three-Field Floating Projection Topology Optimization of Continuum Structures. Comput. Methods Appl. Mech. Eng. 2022, 399, 115444. [Google Scholar] [CrossRef]
  11. Fu, Y.-F.; Rolfe, B.; Chiu, L.N.S.; Wang, Y.; Huang, X.; Ghabraie, K. SEMDOT: Smooth-Edged Material Distribution for Optimizing Topology Algorithm. Adv. Eng. Softw. 2020, 150, 102921. [Google Scholar] [CrossRef]
  12. Fu, Y.-F.; Long, K.; Zolfagharian, A.; Bodaghi, M.; Rolfe, B. Topological Design of Cellular Structures for Maximum Shear Modulus Using Homogenization SEMDOT. Mater. Today Proc. 2024, 101, 38–42. [Google Scholar] [CrossRef]
  13. Wang, W.; Munro, D.; Wang, C.C.L.; van Keulen, F.; Wu, J. Space-Time Topology Optimization for Additive Manufacturing. Struct. Multidisc. Optim. 2020, 61, 1–18. [Google Scholar] [CrossRef]
  14. Wang, W.; Wu, K.; van Keulen, F.; Wu, J. Regularization in Space–Time Topology Optimization for Additive Manufacturing. Comput. Methods Appl. Mech. Eng. 2024, 431, 117202. [Google Scholar] [CrossRef]
  15. Li, Q.; Steven, G.P.; Xie, Y.M. Evolutionary Structural Optimization for Stress Minimization Problems by Discrete Thickness Design. Comput. Struct. 2000, 78, 769–780. [Google Scholar] [CrossRef]
  16. Guan, H.; Chen, Y.-J.; Loo, Y.-C.; Xie, Y.-M.; Steven, G.P. Bridge Topology Optimisation with Stress, Displacement and Frequency Constraints. Comput. Struct. 2003, 81, 131–145. [Google Scholar] [CrossRef]
  17. Das, R.; Jones, R.; Xie, Y.M. Design of Structures for Optimal Static Strength Using ESO. Eng. Fail. Anal. 2005, 12, 61–80. [Google Scholar] [CrossRef]
  18. Rong, J.H.; Xie, Y.M.; Yang, X.Y.; Liang, Q.Q. Topology Optimization of Structures Under Dynamic Response Constraints. J. Sound Vib. 2000, 234, 177–189. [Google Scholar] [CrossRef]
  19. Xie, Y.M.; Felicetti, P.; Tang, J.W.; Burry, M.C. Form Finding for Complex Structures Using Evolutionary Structural Optimization Method. Des. Stud. 2005, 26, 55–72. [Google Scholar] [CrossRef]
  20. Rong, J.H.; Xie, Y.M.; Yang, X.Y. An Improved Method for Evolutionary Structural Optimisation against Buckling. Comput. Struct. 2001, 79, 253–263. [Google Scholar] [CrossRef]
  21. Zhang, J.; Chen, Y.; Zhai, J.; Hou, Z.; Han, Q. Topological Optimization Design on Constrained Layer Damping Treatment for Vibration Suppression of Aircraft Panel via Improved Evolutionary Structural Optimization. Aerosp. Sci. Technol. 2021, 112, 106619. [Google Scholar] [CrossRef]
  22. Simonetti, H.L.; Almeida, V.S.; Leitão, V.M.A.; de Assis das Neves, F. Application of Evolutionary Structural Optimization Based on the Boundary Element Method Using Initial Stress Fields. Structures 2019, 20, 550–559. [Google Scholar] [CrossRef]
  23. Zhao, J.; Li, B.; Gao, X.; Zhen, Y.; Yang, H. Research on the Load-Bearing Characteristics of Complex Structural Components Based on the Representation of Load Paths. In Proceedings of the 2013 IEEE International Symposium on Assembly and Manufacturing (ISAM), Xi’an, China, 30 July–2 August 2013; pp. 176–179. [Google Scholar]
  24. Kwok, T.-H.; Li, Y.; Chen, Y. A Structural Topology Design Method Based on Principal Stress Line. Comput. Aided Des. 2016, 80, 19–31. [Google Scholar] [CrossRef]
  25. Tamijani, A.Y.; Gharibi, K.; Kobayashi, M.H.; Kolonay, R.M. Load Paths Visualization in Plane Elasticity Using Load Function Method. Int. J. Solids Struct. 2018, 135, 99–109. [Google Scholar] [CrossRef]
  26. Kelly, D.W.; Elsley, M. A Procedure for Determining Load Paths in Elastic Continua. Eng. Comput. 1995, 12, 415–424. [Google Scholar] [CrossRef]
  27. Kelly, D.W.; Reidsema, C.A.; Lee, M.C.W. An Algorithm for Defining Load Paths and a Load Bearing Topology in Finite Element Analysis. Eng. Comput. 2011, 28, 196–214. [Google Scholar] [CrossRef]
  28. Kelly, D.; Reidsema, C.; Bassandeh, A.; Pearce, G.; Lee, M. On Interpreting Load Paths and Identifying a Load Bearing Topology from Finite Element Analysis. Finite Elem. Anal. Des. 2011, 47, 867–876. [Google Scholar] [CrossRef]
  29. Bao, B.; Lallart, M.; Zhou, S. Piezoelectric Thin-Walled Meta-Plates via Nonlinear Semi-Active Electrical Interface for Low-Frequency Distributed Broadband Vibration Control. J. Sound Vib. 2025, 602, 118948. [Google Scholar] [CrossRef]
  30. Komarov, V.A.; Weisshaar, T.A. New Approach to Improving the Aircraft Structural Design Process. J. Aircr. 2002, 39, 227–233. [Google Scholar] [CrossRef]
  31. Takahashi, K.; Omiya, M.; Iso, T.; Zaiki, Y.; Sakurai, T.; Maki, T.; Urushiyama, Y.; Naito, T. Load Transfer Ustar (U*) Calculation in Structures under Dynamic Loading. Trans. JSME Ser. A 2013, 79, 1657–1668. [Google Scholar] [CrossRef]
  32. Chu, D.N.; Xie, Y.M.; Hira, A.; Steven, G.P. Evolutionary Structural Optimization for Problems with Stiffness Constraints. Finite Elem. Anal. Des. 1996, 21, 239–251. [Google Scholar] [CrossRef]
  33. Nha Chu, D.; Xie, Y.M.; Hira, A.; Steven, G.P. On Various Aspects of Evolutionary Structural Optimization for Problems with Stiffness Constraints. Finite Elem. Anal. Des. 1997, 24, 197–212. [Google Scholar] [CrossRef]
  34. Xu, Z.; Ke, Q.; Ge, X.; Wang, H.; Dai, Z. Failure Mechanism Investigation of Die-Attach Solder Based on the Birth and Death Technology. In Proceedings of the 2022 International Power Electronics Conference (IPEC-Himeji 2022-ECCE Asia), Himeji, Japan, 15–19 May 2022; pp. 139–144. [Google Scholar]
  35. Li, Q.; Steven, G.P.; Xie, Y.M. A Simple Checkerboard Suppression Algorithm for Evolutionary Structural Optimization. Struct. Multidisc. Optim. 2001, 22, 230–239. [Google Scholar] [CrossRef]
  36. Huang, X.; Xie, Y.M. Convergent and Mesh-Independent Solutions for the Bi-Directional Evolutionary Structural Optimization Method. Finite Elem. Anal. Des. 2007, 43, 1039–1049. [Google Scholar] [CrossRef]
  37. ASTM A283/A283M-18; Standard Specification for Low and Intermediate Tensile Strength Carbon Steel Plates. A01 Committee ASTM International: West Conshohocken, PA, USA, 2018.
  38. Yan, T. Design of 3201Z-Type Dump Truck’s Lifting Mechanism. In Proceedings of the 2011 Second International Conference on Mechanic Automation and Control Engineering, Inner Mongolia, China, 15–17 July 2011; pp. 1165–1168. [Google Scholar]
Figure 1. Cantilever slab force transfer path. (a) Cantilever slab structure; (b) visualization of force transfer path.
Symmetry 17 01424 g001
Figure 2. Schematic diagram of the structural force transfer path.
Symmetry 17 01424 g002
Figure 3. Schematic diagram of a continuum structure.
Symmetry 17 01424 g003
Figure 4. Finite element model of a rectangular cantilever structure.
Symmetry 17 01424 g004
Figure 5. Cantilever plate subjected to a unidirectional force.
Symmetry 17 01424 g005
Figure 6. Sensitivity allocation coefficient. (a) First-order sensitivity allocation ratio, w i = a / 16 ; (b) second-order sensitivity allocation ratio, w i = a / 256 .
Symmetry 17 01424 g006
Figure 7. Schematic diagram of sensitivity allocation.
Symmetry 17 01424 g007
Figure 8. Flow chart of the topology optimization model based on element bearing capacity.
Symmetry 17 01424 g008
Figure 9. Visualization results of the load-bearing capacity of one-bay five-bar truss. (a) Structural schematic; (b) element load-bearing force diagram; (c) axial contour map.
Symmetry 17 01424 g009
Figure 10. Visualization results of the load-bearing capacity of a rectangular thin plate. (a) Structural schematic; (b) element load-bearing force diagram; (c) stress contour map; (d) topology optimization density contour map.
Symmetry 17 01424 g010
Figure 11. Visualization results of the load-bearing capacity of a rectangular cantilever structure with a central circular hole. (a) Structural schematic; (b) element load-bearing force diagram; (c) stress contour map; (d) topology optimization density contour map.
Symmetry 17 01424 g011
Figure 12. Two-bay ten-bar truss. Number i denotes node number, number i ¯ denotes member number.
Symmetry 17 01424 g012
Figure 13. Element load-bearing force diagram for two-bay ten-bar truss.
Symmetry 17 01424 g013
Figure 14. Optimum design for two-bay ten-bar truss.
Symmetry 17 01424 g014
Figure 15. Cantilever plate model.
Symmetry 17 01424 g015
Figure 16. The checkerboard patterns, disconnected elements, and loss of symmetry are iterative diagrams based on element load-bearing capacity. (a) V t o t a l / V i n i t i a l = 90%; (b) V t o t a l / V i n i t i a l = 80%; (c) V t o t a l / V i n i t i a l = 70%; (d) V t o t a l / V i n i t i a l = 60%; (e) V t o t a l / V i n i t i a l = 50%; (f) V t o t a l / V i n i t i a l = 40%; (g) V t o t a l / V i n i t i a l = 30%.
Symmetry 17 01424 g016
Figure 17. The checkerboard patterns, disconnected elements, and loss of symmetry in the final iterative diagram are based on element load-bearing capacity. (a) R R = 16, V t o t a l / V i n i t i a l = 70%; (b) R R = 32, V t o t a l / V i n i t i a l = 70%; (c) R R = 64, V t o t a l / V i n i t i a l = 50%; (d) R R = 128, V t o t a l / V i n i t i a l = 60%; (e) R R = 64, V t o t a l / V i n i t i a l = 40%; (f) R R = 128, V t o t a l / V i n i t i a l = 40%.
Symmetry 17 01424 g017
Figure 18. Topology iteration diagrams with the checkerboard suppression algorithm applied: (a) 1st iteration; (b) 2nd iteration; (c) 3rd iteration; (d) 4th iteration; (e) 5th iteration; (f) 6th iteration; (g) 7th iteration; (h) 8th iteration.
Symmetry 17 01424 g018aSymmetry 17 01424 g018b
Figure 19. Topology optimization diagrams before and after mesh dependency elimination: (a) 160 elements, unoptimized; (b) 160 elements, optimized; (c) 640 elements, unoptimized; (d) 640 elements, optimized; (e) 2560 elements, unoptimized; (f) 2560 elements, optimized.
Symmetry 17 01424 g019aSymmetry 17 01424 g019b
Figure 20. The dimensions and boundary conditions of the cantilever beam and MBB beam structure.
Symmetry 17 01424 g020
Figure 21. The finite element analysis results of the cantilever beam and MBB beam using the BESO method and the proposed topology optimization method. (a) Topology element density of the cantilever beam obtained with the BESO method (element threshold = 0.5); (b) topology element density of the MBB beam obtained with the BESO method (element threshold = 0.5); (c) topology element density of the cantilever beam obtained with the proposed method (element threshold = 0.5); (d) topology element density of the MBB beam obtained with the proposed method (element threshold = 0.5).
Symmetry 17 01424 g021
Figure 22. The triangular arm of a dump truck before optimization. (a) Dump truck lifting mechanism diagram; (b) dump truck.
Symmetry 17 01424 g022
Figure 23. The triangular arm of a dump truck before optimization. (a) Dimensional schematic; (b) 3D model.
Symmetry 17 01424 g023
Figure 24. Dump truck lifting mechanism assembly [38].
Symmetry 17 01424 g024
Figure 25. Schematic diagram of loads and constraints on the triangular arm.
Symmetry 17 01424 g025
Figure 26. Implementation of loads and constraints on the triangular arm in ANSYS APDL 2024 R1.
Symmetry 17 01424 g026
Figure 27. Two types of finite elements for the triangular arm. (a) Three-dimensional solid element SOLID185; (b) plane element PLANE42.
Symmetry 17 01424 g027
Figure 28. Analysis results of 3D solid elements. (a) Stress diagram; (b) displacement diagram.
Symmetry 17 01424 g028
Figure 29. Analysis results of 2D plane elements. (a) Stress diagram; (b) displacement diagram.
Symmetry 17 01424 g029
Figure 30. Stress contour maps of the triangular arm under various working conditions. (a) T = 1; (b) T = 2; (c) T = 3; (d) T = 4.
Symmetry 17 01424 g030
Figure 31. Displacement diagrams of the triangular arm under various working conditions. (a) T = 1; (b) T = 2; (c) T = 3; (d) T = 4.
Symmetry 17 01424 g031
Figure 32. The topological results of the triangular arm based on the element load-bearing capacity under four working conditions. (a) T = 1; (b) T = 2; (c) T = 3; (d) T = 4.
Symmetry 17 01424 g032
Figure 33. The triangular arm density color maps under four working conditions. (a) T = 1; (b) T = 2; (c) T = 3; (d) T = 4.
Symmetry 17 01424 g033
Figure 34. Optimized triangular arm. (a) Dimensional schematic; (b) 3D model.
Symmetry 17 01424 g034
Figure 35. Stress contour map of the optimized triangular arm. (a) T = 1; (b) T = 2; (c) T = 3; (d) T = 4.
Symmetry 17 01424 g035
Figure 36. Displacement contour map of the optimized triangular arm. (a) T = 1; (b) T = 2; (c) T = 3; (d) T = 4.
Symmetry 17 01424 g036
Table 1. Thin plate model and associated parameters.
PropertyYoung’s Modulus/MPaPoisson’s RatioElement TypeThickness/mWidth/mHeight/mLoad/N
Value2.1 × 1050.3Quadrilateral elements0.0020.20.1−50
Table 2. Normalized element bearing capacity and subjected forces for the two-bay ten-bar truss.
Member
No.
Normalized Element Bearing Capacity (N/m2)Subjected Force (N)
Node 1Node 2
1 5.06178 × 10 5 , 2.6544 × 10 4 2.79618 × 10 5 , 2.26545 × 10 5 1.5061 × 10 4
2 1.31019 × 10 5 , 4.7519 × 10 4 1.13025 × 10 5 , 1.7993 × 10 4 4.476 × 10 3
3 1.31019 × 10 5 , 4.7519 × 10 4 1.13025 × 10 5 , 1.7993 × 10 4 4.476 × 10 3
4 4.8789 × 10 4 , 3.3923 × 10 4 1.26178 × 10 5 , 9.535 × 10 3 5.524 × 10 3
5 1.31942 × 10 5 , 9.1758 × 10 4 4.49994 × 10 5 , 2.5786 × 10 4 1.4939 × 10 4
6 1.46019 × 10 5 , 8.8159 × 10 4 1.25955 × 10 5 , 1.61162 × 10 5 7.156 × 10 3
7 1.78503 × 10 5 , 1.57309 × 10 5 2.8662 × 10 4 , 6.8063 × 10 4 6.985 × 10 3
8 6.019 × 10 3 , 9.245 × 10 3 4.363 × 10 3 , 6.235 × 10 3 4.63 × 10 2
9 1.31019 × 10 5 , 4.7519 × 10 4 1.13025 × 10 5 , 1.7993 × 10 4 6.33 × 10 3
10 2.18248 × 10 5 , 6.0503 × 10 4 4.5477 × 10 4 , 4.8621 × 10 4 7.812 × 10 3
Table 3. Normalized element bearing capacity to the support for two bay ten-bar truss.
Member
No.
Normalized Element Bearing Capacity (N/m2)Subjected Force (N)
VectorNorm
1 2.26560 × 10 5 , 2.53089 × 10 5 3.39681 × 10 5 1.5061 × 10 4
2 1.7993 × 10 4 , 6.5512 × 10 4 6.7938 × 10 4 4.476 × 10 3
3 1.7993 × 10 4 , 6.5512 × 10 4 6.7938 × 10 4 4.476 × 10 3
4 1.74968 × 10 5 , 2.4388 × 10 4 1.76659 × 10 5 5.524 × 10 3
5 3.18051 × 10 5 , 6.5971 × 10 4 3.24820 × 10 5 1.4939 × 10 4
6 2.0063 × 10 4 , 7.3003 × 10 4 7.5710 × 10 4 7.156 × 10 3
7 1.49840 × 10 5 , 8.9245 × 10 4 1.74404 × 10 5 6.985 × 10 3
8 1.0382 × 10 4 , 3.009 × 10 3 1.0809 × 10 4 4.63 × 10 2
9 1.7993 × 10 4 , 6.5512 × 10 4 6.7938 × 10 4 6.33 × 10 3
10 1.72770 × 10 5 , 1.09124 × 10 5 2.04347 × 10 5 7.812 × 10 3
Table 4. Normalized element bearing capacity and subjected forces for redesigned two-bay ten-bar truss.
Member
No.
Normalized Element Bearing Capacity (N/m2)Difference in Norm (%)Subjected Force (N)
VectorNorm
1 3.1847 × 10 5 , 3.1847 × 10 5 4.50386 × 10 5 34.3 2 × 10 4
4 3.1847 × 10 5 , 0 3.18471 × 10 5 80.3 1 × 10 4
5 3.1847 × 10 5 , 3.1847 × 10 5 4.50386 × 10 5 38.7 1 × 10 4
6 3.1847 × 10 5 , 3.1847 × 10 5 4.50386 × 10 5 495 1.4142 × 10 4
10 3.1847 × 10 5 , 3.1847 × 10 5 4.50386 × 10 5 120 1.4142 × 10 4
Table 5. Cantilever plate model and associated parameters.
PropertyYoung’s Modulus/MPaPoisson’s RatioElement Type Thickness / mm Width/mmHeight/mmLoad/N
Value2.07 × 1050.3Quadrilateral elements1.016.010.0300
Table 6. Time record of structural optimization.
Volume Removal Rate/%90807060504030
CPU time/s573109015451948229125812817
Table 7. Variation in volume removal rate and element load-bearing capacity.
Volume Constraint V t o t a l /%Element Load-Bearing Capacity TFDifference Rate/%
Initial4.2440 × 10−30
904.7415 × 10−311.7
805.7526 × 10−335.5
707.1891 × 10−369.4
609.5599 × 10−3125.3
501.3532 × 10−2218.8
404.1118 × 10−3868.9
300.882720,698.77
Table 8. Time consumption for the number of different elements deleted.
Number of Different Elements Deleted/RR163264128
CPU time/s9803499819481377
Table 9. Comparison table of strain energy and computational efficiency.
MethodCaseStrain Energy (mJ)Time/s
BESOThe cantilever beam1.18117.35
MBB beam4041164
Element Bearing CapacityThe cantilever beam0.956139.21
MBB beam3915198
Table 10. Material parameter information for the triangular arm of a dump truck.
PropertyTypeDensity/kg/m3Young’s Modulus/MPaPoisson’s RatioAllowable Stress/MPa
ValueQ2357.8 × 1032.1 × 10−50.3235
Table 11. Force magnitudes under four typical working conditions.
Working ConditionsA (Tie Rod and Triangular Arm)B (Hydraulic Cylinder and Triangular Arm)C (Truck Bed and Triangular Arm)
Fx/NFy/NFx/NFy/NFx/NFy/N
T = 1−81,091.21−1597.2954,770.8316,239.50126,320.3817,703.81
T = 2−76,817.49−2652.9455,955.9416,592.8622,161.5717,678.02
T = 37945.8228,150.84−35,377.21−10,544.158881.454556.58
T = 415,082.7427,489.86−36,914.45−11,015.708463.932831.41
Table 12. Maximum and minimum stress under four working conditions.
Working ConditionsT = 1T = 2T = 3T = 4
Stress distributionMinimum stress/MPa1.043720.8594710.3530.303
Maximum stress/MPa157.912158.26459.79159.703
Stress in the intermediate region/MPa70.76370.816926.769726.703
Table 13. Minimum and maximum stresses under four working conditions before and after optimization.
Working ConditionsT = 1T = 2T = 3T = 4
Minimum stresses/MPaBefore optimization1.043720.8594710.3530.303
After optimization0.686490.6131860.1135120.173505
Maximum stresses/MPaBefore optimization157.912158.26459.79159.703
After optimization188.844184.13756.561555.334
Table 14. Maximum and minimum displacements before and after optimization.
Working ConditionsT = 1T = 2T = 3T = 4
Minimum displacements/mmBefore optimization0.2423350.2379560.527650.034342
After optimization0.3146210.3114050.0680370.044353
Maximum displacements/mmBefore optimization2.181012.141610.4748820.309076
After optimization2.831592.802640.6123320.399173
Disclaimer/Publisher’s Note: The statements, opinions and data contained in all publications are solely those of the individual author(s) and contributor(s) and not of MDPI and/or the editor(s). MDPI and/or the editor(s) disclaim responsibility for any injury to people or property resulting from any ideas, methods, instructions or products referred to in the content.